
the Creative Commons Attribution 4.0 License.
the Creative Commons Attribution 4.0 License.
 | 26 May 2026
A real time reference system for wavelength locking in laser induced fluorescence with gas expansion (LIF-FAGE) measurement of atmospheric hydroxyl (OH) radicals
Shiyi Chen
Cuihong Zhang
Yihui Wang
Xuefei Ma
Zhaofeng Tan
Limin Zeng
Yuanhang Zhang
The hydroxyl radical (OH) plays a central role in atmospheric chemistry, however, its accurate measurement by laser induced fluorescence with gas expansion (LIF-FAGE) is unavoidably compromised by wavelength drift of the excitation laser. To overcome this limitation, a real time reference system for active wavelength locking has been developed and systematically characterized in this work. Stable, and high concentration OH radicals were generated through thermolysis of ambient air on a heated filament within a low pressure cell. The excitation source was a 308 nm laser produced by frequency doubling the output of a DCM-ethanol dye laser pumped by an Nd:YAG laser. The induced fluorescence was monitored in real time using a non-gated photomultiplier tube (PMT). The wavelength locking program, implemented with a closed loop feedback mechanism, dynamically adjusted the laser wavelength to the optimal OH excitation line. Through comprehensive characterization of key parameters, including laser power, filament operating conditions (current, voltage), and cell environment (pressure/inlet flow rate, inlet gas relative humidity), an optimal operational window of the reference system has been identified. A 12 h continuous measurement demonstrated high system stability in OH generation and detection, the observed fluorescence intensity showed a low drift rate of 0.2 % h−1 during the first nine hours. The good robustness of the reference system, and its integrated wavelength locking program, enable long-term and accurate ambient OH radical quantification in LIF-FAGE measurements.
- Article
(2723 KB) - Full-text XML
- BibTeX
- EndNote


The hydroxyl radical (OH) is the pivotal oxidant in the atmosphere, governing its self-cleaning capacity by determining the lifetime of most trace gases and driving the formations of secondary pollutants, such as ozone and particulate matter (Ehhalt, 1999; Levy, 1973; Lelieveld et al., 2008). Accurate quantification of ambient OH concentration is fundamental for constraining atmospheric models and determining oxidative processing rates (Lu et al., 2019; Tan et al., 2019; Tan et al., 2025). However, the extreme high reactivity and low atmospheric abundance of OH present a significant challenge for its direct and accurate measurements (Heard and Pilling, 2003; Lu and Zhang, 2010; Li et al., 2014). This necessity for precise, in-situ detection has driven the development of the laser induced fluorescence (LIF) method to reliably quantify atmospheric OH radicals and elucidate their critical role in global climate change and regional air quality (Heard, 2006).
The fundamental principles of the LIF technique and its development has been detailed reviewed in literatures (Heard and Pilling, 2003; Heard, 2006), accordingly, only a concise overview is presented here. The LIF technique was first proposed for atmospheric OH measurement in 1972 (Baardsen and Terhune, 1972). In this approach, OH radicals were excited by a 282 nm laser, resulting in electronic transitions and inducing fluorescence emission at 308 nm, which was subsequently detected using a photomultiplier tube (PMT) (Wang et al., 1976; Stimpfle. and Anderson, 1988; Wennberg et al., 1994). While excitation at 282 nm offered better spectral separation of the weak fluorescence from laser light, subsequent research revealed that this wavelength triggered O3 photolysis, generating singlet oxygen atoms (O1D) that reacted with atmospheric water vapor to produce significant amounts of artifactual OH radical, thereby interfering with the ambient signal measurement (Hanabusa et al., 1977; Davis et al., 1981; Ren et al., 2004). To overcome this interference, the excitation scheme was shifted to the 308 nm band, where O3 photolysis was substantially reduced. This shift introduced the new challenge of discriminating the 308 nm fluorescence from the 308 nm laser light. A critical solution was achieved with the pioneering work of Hard et al., who developed the Fluorescence Assay by Gas Expansion (FAGE) technique (Hard et al., 1979). FAGE operates at low pressure, which kinetically suppresses the interference and, crucially, extends the OH fluorescence lifetime. This extended lifetime enables time gated detection to effectively separate the long-lived fluorescence signal from the short-lived laser light, thereby facilitating highly sensitive and specific quantification of ambient OH radicals.
The measurement accuracy of the LIF-FAGE technique is critically dependent on the stability of the laser output wavelength, which should be maintained at the center of OH excitation line. However, due to the thermal instabilities of the diffraction grating and the frequency-doubling crystal, the output wavelength of the laser system is unavoidable to drift. Such a wavelength deviation can lead to significant reduction in OH excitation efficiency, thereby introducing substantial measurement error. Therefore, developing a reliable feedback system capable of automatically locking the laser wavelength to the OH resonance line is essential for achieving long-term unmanned operation with sustained good data quality. This critical need has driven the development of various reference systems, typically, this system should integrate four key components: a real time OH generation source, an excitation laser, a fluorescence signal detector, and a dynamic wavelength adjustment program.
OH radicals can be produced within a cell by the dissociation of ambient air (humidified via a bubbler, Creasey et al., 1997, or directly, Amédro, 2012; Hofzumahaus et al., 1996) or a defined gas mixture (Xing et al., 2017; Wennberg et al., 1994; Wang et al., 2019) through heated filament thermolysis (Dusanter et al., 2009; Faloona et al., 2004; Xing et al., 2017; Wennberg et al., 1994), microwave discharge dissociation (Creasey et al., 1997) or 185 nm mercury lamp photolysis (Hofzumahaus et al., 1996). The OH generation mechanism involves synergistic contributions from both O2 and H2O (Xing et al., 2017; Wennberg et al., 1994): the dissociation of H2O directly yields OH, while O2 first dissociates into two oxygen atoms, which subsequently react with H2O to produce two OH radicals. Research by the Harvard group has confirmed that the role of O2 is non-negligible, as evidenced by the complete disappearance of the OH signal upon O2 depletion in their reference cell (Wennberg et al., 1994). The reported reference cells operate typically at a low pressure, ranging from 2 to 9 Torr (Xing et al., 2017; Creasey et al., 1997; Wennberg et al., 1994). A relatively high sample flow rate of 1000 mL min−1 was used in the AIOFM reference cell (Xing et al., 2017), whereas this parameter for other systems is seldom reported. For fluorescence signal collection, both gated (Creasey et al., 1997) and non-gated PMTs (Amédro, 2012) have been applied. The last critical part is the dynamic wavelength adjustment program (Xing et al., 2017; Amédro, 2012; Wang et al., 2019), upon detecting an OH fluorescence signal attenuation, it rapidly initiates a corrective action, such as re-scanning the OH excitation spectrum to re-locate and re-lock onto the wavelength with maximum signal intensity, thereby, actively stabilizes the laser wavelength at the optimal OH excitation line.
Given its critical role in ensuring measurement accuracy of OH radicals in LIF-FAGE instrument, reference system has been widely employed for wavelength locking. However, detailed characterization of experimental parameters and the performance of such system are rarely reported, with most studies providing only descriptive introductions. The AIOFM group has provided initial characterization data for their earlier version reference cell, however, a 282 nm laser was employed (Xing et al., 2017). In their upgraded system, a 308 nm excitation laser was used, and good stability was reported: a fluorescence fluctuation of approximately 1.2 % over 15 min at the resonance wavelength (Wang et al., 2019). In this work, we present a comprehensively characterized real time reference system that features compact design, simplified operation, integrated wavelength locking program, and enhanced performance. The configuration of the reference cell and its feedback control mechanism for wavelength locking are described in detail. Key operational parameters, including laser power, cell pressure, filament power, and inlet gas relative humidity are systematically characterized to define an optimal window for stable OH generation and detection. Finally, the stability and robustness of the reference system have been verified through a 12 h continuous operation.
A schematic diagram of our LIF-FAGE system for ambient OH measurement is presented in Fig. 1, where the reference system is highlighted within a red frame. The instrument integrates several key subsystems, including laser source, optical train module, reference system and centralized computer control and signal acquisition system. The laser source begins with an Nd:YAG pump laser, which generates 532 nm laser pulses at a repetition rate of 8 kHz. These pulses optically pump a dye laser utilizing a DCM dye (4-(Dicyanomethylene)-2-methyl-6-(4-dimethylaminostyryl)-4H-pyran) dissolved in ethanol as the gain medium, producing red light within the 602–660 nm range. Wavelength selection within the dye laser is accomplished by a diffraction grating. Subsequently, the output is frequency-doubled by using a β-barium borate (BBO) crystal to generate the ultraviolet laser beam at 308 nm range. The output UV beam is then split, with 90 % reflecting into the ambient OH measurement system and the remained 10 % transmitting into the reference system. The computer control and signal acquisition system functions as the central unit, executing precise synchronization of laser triggering, timing sequences control, instrument status monitoring, and fluorescence signal acquisition.
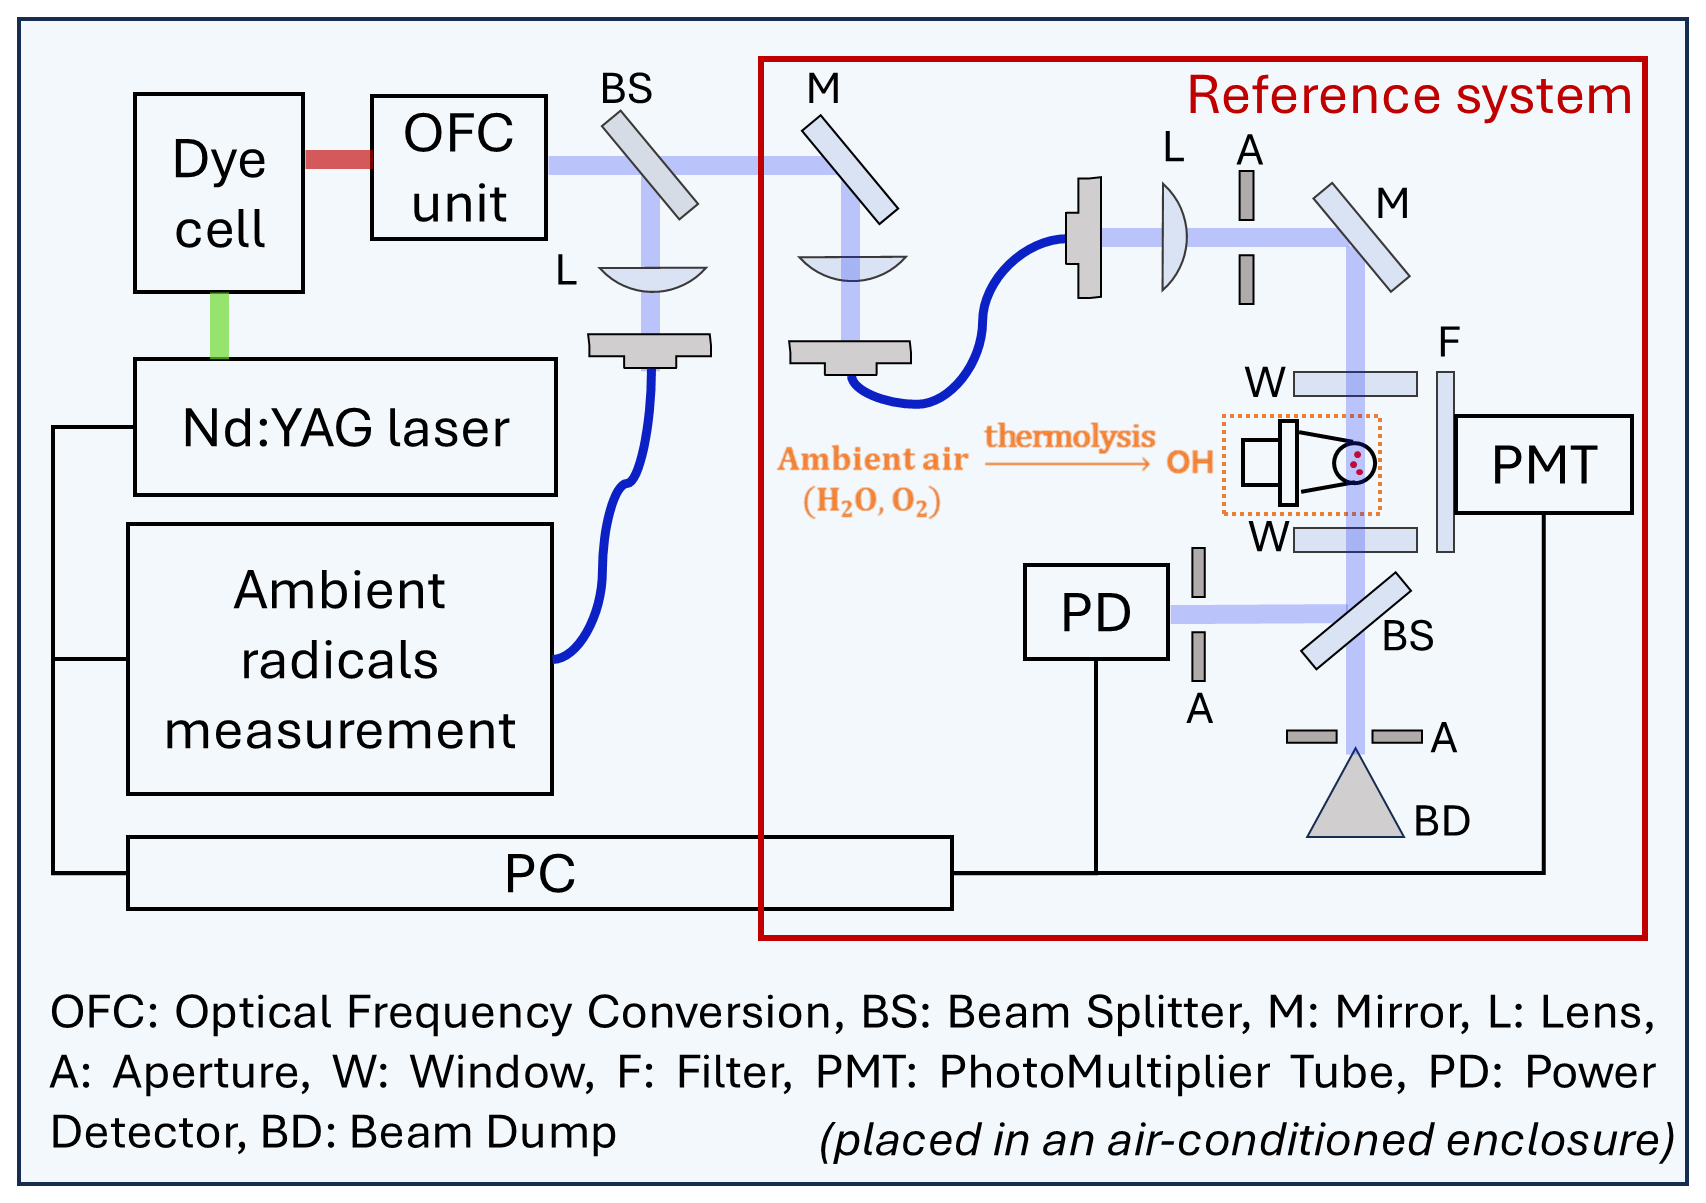
Figure 1Schematic diagram of the LIF-FAGE system, where the reference system is highlighted within a red frame.
2.1 Reference system
2.1.1 Overall configuration
The reference system consists of four integrated modules, including a beam collimation and shaping unit, an OH radical generation unit, a fluorescence detection unit, and a laser power monitoring module, as shown in Fig. 1. The beam collimation and shaping module includes a UV-coated plano-convex lens (GLH21-025-030-UV) and an adjustable aperture (GT-5701), which shape the laser beam into a collimated spot with a diameter of around 2 mm. This beam is then deflected 90° by a reflective mirror (GCCH-101322, reflectance >99.5 % at 308 nm) and enters the reference cell horizontally along its central axis. The reference cell is a compact aluminum cube with internal dimensions of , and its internal surfaces are black-anodized to suppress stray light. The cell features three orthogonal channels: the laser inlet/outlet channel is equipped at both ends with UV-fused silica windows coated with anti-reflection films (WG40530-UV) to ensure high transmission at 308 nm and maintain vacuum sealing; the vertical channel connects to the ambient air sampling system and a vacuum pump (2FY-2C-N), maintaining a stable low-pressure environment inside the cell; the two opposing lateral ports house the OH radical generation unit and the fluorescence detection unit, respectively. OH radicals are produced in situ by the thermal dissociation of ambient air with certain humidity on a customized electrically heated filament. The induced fluorescence detection assembly consists of a narrowband interference filter (BP308–10 nm, central wavelength at 308 nm, bandwidth of 10 nm) and a single-photon-counting PMT (Hamamatsu H10721P-110). After passing through the second window, the transmitted laser beam encounters a UV-fused silica beamsplitter, which divides the light in a ratio. The reflected portion (∼10 %) is directed onto an optical power meter (Thorlab, S120VC, 50 nw–50 mw) for real time laser power monitoring, while the transmitted majority (∼90 %) is absorbed by a beam dump (GZF-SM1-20) to eliminate back-reflection interference. The fluorescence signal, laser power, and key operational parameters of the reference cell are monitored in real time and synchronously recorded by the central signal acquisition system.
2.1.2 OH radical generation unit
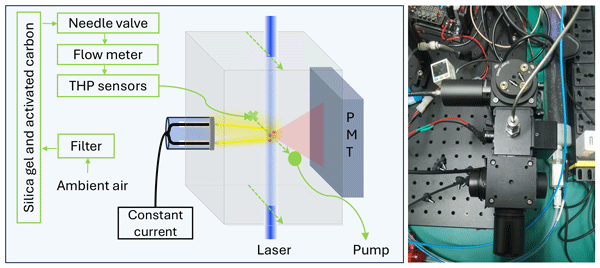
The OH radical generation unit is designed to produce a stable, high-concentration source of OH radicals in real time via thermal decomposition of ambient air on a heated filament, the schematic diagram and photograph of the reference cell are shown in Fig. 2. The filament is constructed from a 48 mm segment of iron-chromium-aluminum-nickel alloy wire (Fe Cr Al Ni: 67 % 25 % 5 % 0.8 %; diameter: 0.35 mm), wound into a coil with a diameter of 2.0 mm, a height of 1.3 mm, and 3 turns. This spring is assembled and secured using high-temperature wires, a ceramic sleeve, and an aluminum alloy base. Its spatial position is carefully aligned to ensure the spring is positioned directly beneath and in close proximity to the excitation laser beam, thereby maximizing the fluorescence signal from the generated OH radicals. The assembled unit is mounted via screws onto a side channel of the cell and sealed with an O-ring. A constant current power supply is used to heat the filament, establishing a stable operating voltage and, consequently, a stable spring surface temperature. At this elevated temperature, the inlet ambient air, mainly H2O and O2 (Xing et al., 2017; Wennberg et al., 1994), undergo a series of reactions and produce high concentration of OH radicals in the laser excitation region.
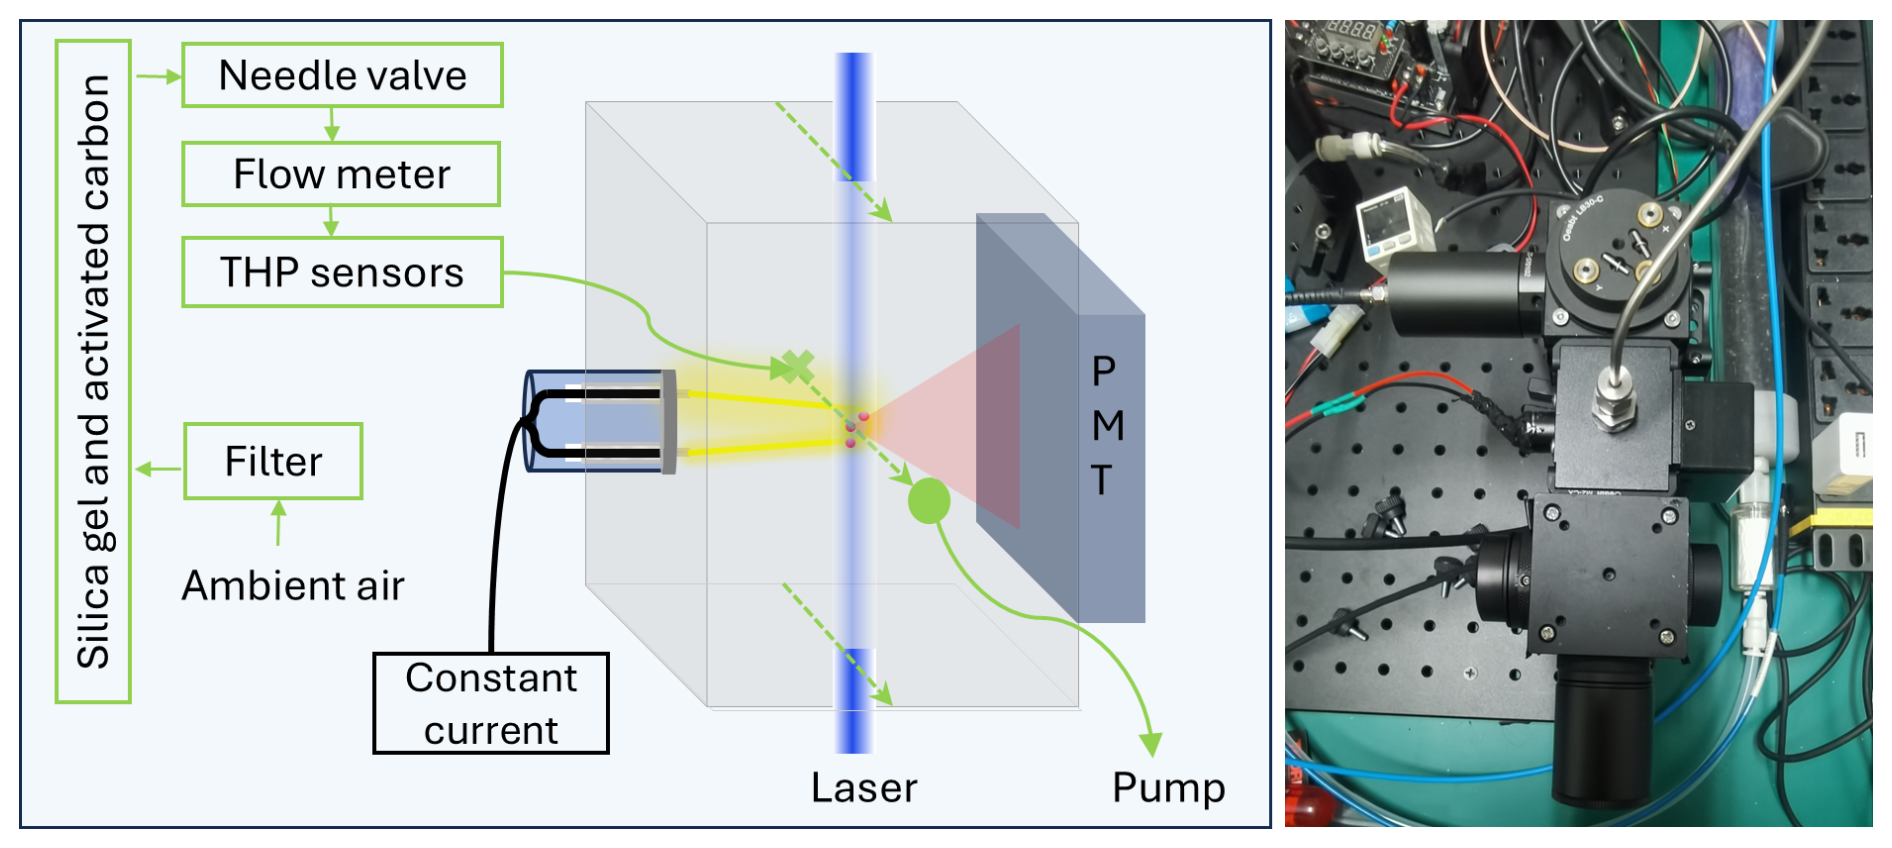
Figure 2Schematic diagram of reference cell and photograph of the reference system, where green arrows indicate the flow direction of the ambient air, where THP represents temperature, relative humidity and pressure.
Ambient air, before entering the reference cell, undergoes sequential purification through an ultra-fine particle filter, followed by a combined silica gel and activated carbon column for humidity control and removal of potential fluorescent interferents, respectively. The inlet gas flowrate is precisely regulated by a needle valve and measured by a flowmeter and the outlet is connected to a backflow-proof vacuum pump to maintain the cell at a low pressure. THP sensors are employed to monitor the temperature and relative humidity of the inlet gas flow, and the internal cell pressure. In order to prevent the introduction of ambient light, two gas pathways connected to the cube cell are constructed with in. stainless steel tube. All critical operational parameters, such as gas flow rate, temperature, relative humidity, cell pressure, and filament electrical parameters (voltage and current), are synchronously monitored and recorded by an analog data acquisition card (ART DAM3971).
2.1.3 Wavelength locking program
Wavelength modulation methodology
The accurate measurement of ambient OH radicals using LIF-FAGE presents a fundamental challenge: the raw signal collected by the PMT comprises not only the target extremely weak OH fluorescence but also significant contributions from background noises, such as stray light, Rayleigh and Mie scattering, and detector dark counts. To address this, wavelength modulation methodology has been established, where the laser output is periodically alternated between OH on-resonance wavelength (λ_on) and off-resonance wavelength (λ_off). Then, net OH signal can be extracted by subtracting the off-resonance background from the on-resonance measurement. A standard data acquisition cycle in our LIF-FAGE system implements wavelength modulation through a sequence of multiple wavelength settings, typically involving four on-resonance points and two off-resonance points.
Laser output wavelength, particularly in dye laser systems, is susceptible to drift due to temperature fluctuations and mechanical vibrations. This drift causes the excitation laser wavelength to gradually deviate from the center (λ_on) of the OH absorption line, leading to reduced excitation efficiency, attenuation of the fluorescence signal, and consequently significant measurement inaccuracy. A real time closed loop feedback mechanism for wavelength locking, referenced to a stable OH source generated in the reference cell, is essential to achieve long-term measurement accuracy and stability. The operational logic of the wavelength locking is defined by the selected strategy for allocating the on-resonance measurement points.
Feedback mechanism for wavelength locking
The first feedback mechanism is implemented when the four on-resonance points are set at specific feature locations on the OH excitation spectrum. In this configuration, the OH resonance fluorescence signals are acquired at wavelengths of λ_on − δ, λ_on, λ_on + δ, and λ_on + 2δ (where δ is a small wavelength offset, e.g., 0.0004 nm). The optimal excitation wavelength λ_on is predetermined via a spectral scan by the reference system. The wavelength feedback mechanism employs a dual-criterion approach. On one hand, the system performs real-time monitoring of the signal amplitude at λ_on, any reading below the preset threshold confirms a wavelength drift and initiates an automatic wavelength relocking program. On the other hand, and more critically, it diagnostically compares the signal intensities at flanking wavelengths (e.g., S(λ_on + δ) versus S(λ_on − δ)). Specifically, the relative signal intensity changes at (λ_on + δ) nm and (λ_on − δ) nm exhibit an opposite pattern (one increases while the other decreases) when laser drift occurs. By comparing the signal intensity changes at these two flanking wavelengths in real time, the wavelength drifting direction (towards longer or shorter wavelengths) can be identified, thereby enables targeted laser output wavelength correction. The second feedback mechanism implements an only amplitude-based logic where all four on-resonance measurement points are set at wavelength λ_on.
Although the first mechanism theoretically provides richer spectral and diagnostic information, a significant drawback in practice is that it requires frequent and fine wavelength adjustment within a single measurement cycle, which imposes continuous disturbance on the output laser and, as a result, introduce a source of instability and even exacerbate laser wavelength drift. Accordingly, in our system, all four on-resonance points are set to λ_on wavelength to minimize the mechanical load on the laser, and the second feedback mechanism is applied for wavelength locking.
Measurement procedure
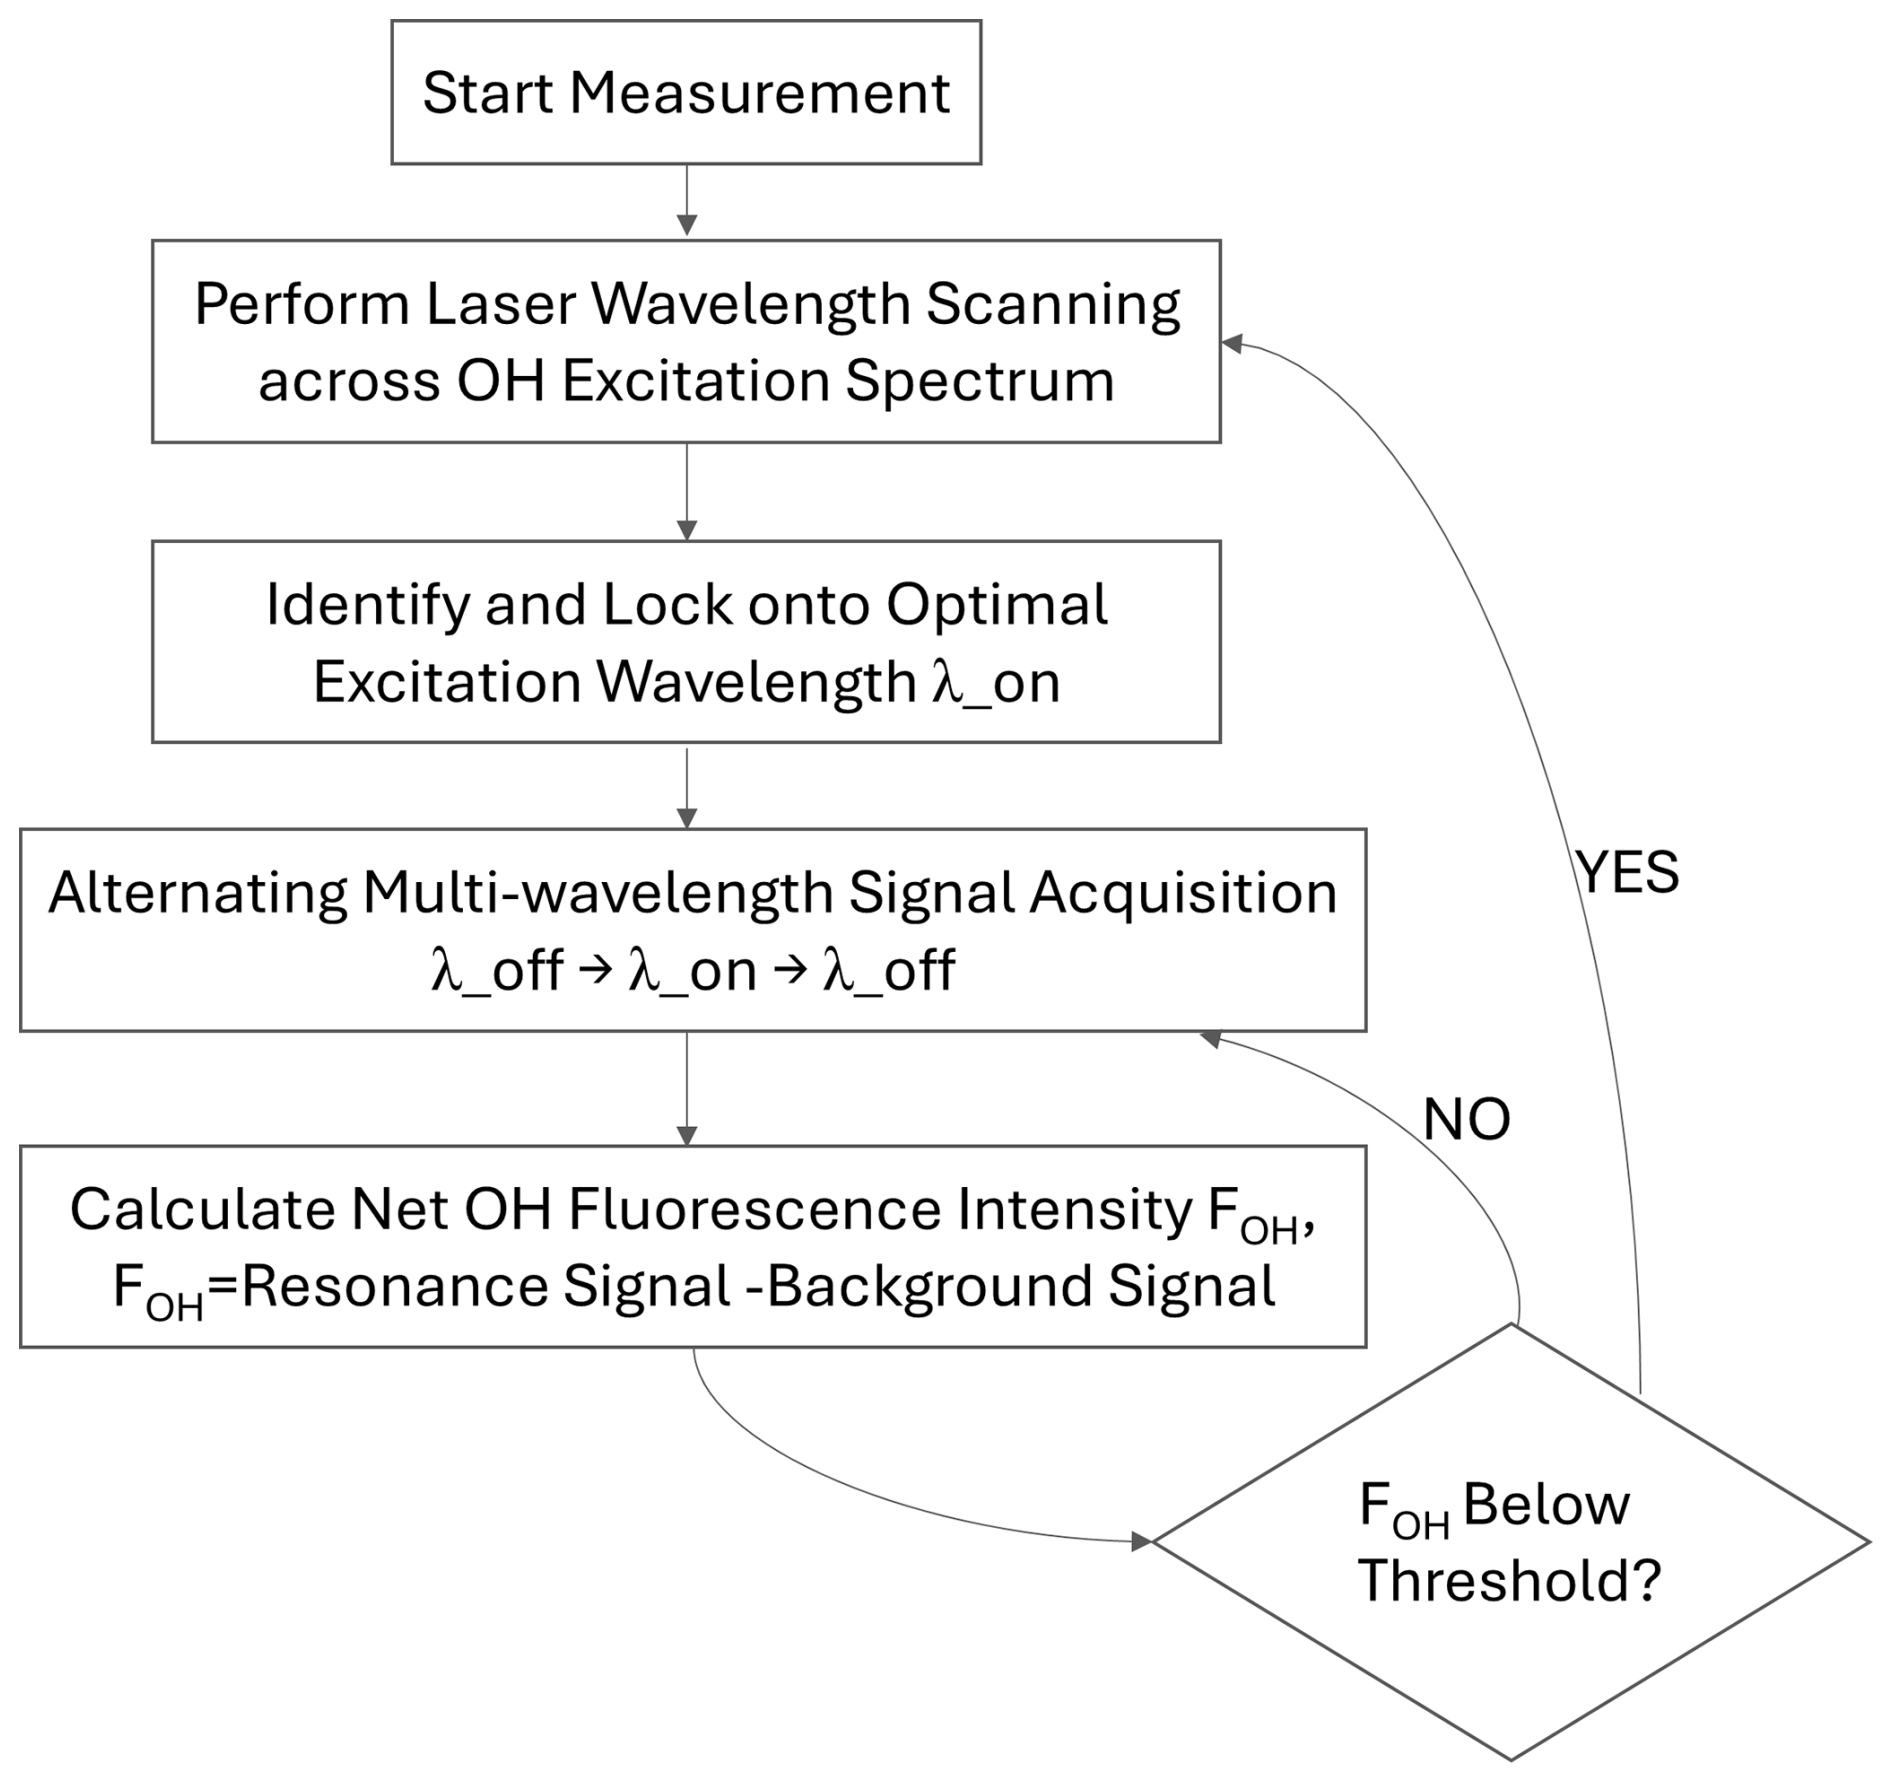
The measurement procedure for the reference system in our LIF-FAGE measurement is illustrated in Fig. 3. This workflow implements an automated closed loop control system, encompassing wavelength scanning, signal acquisition, and adaptive wavelength correction, to maintain the laser output locking onto the OH excitation line. The specific steps are as follows: (1) Wavelength scanning and optimal excitation wavelength identification: the measurement begins by performing a laser wavelength scan across the characteristic excitation spectrum of the OH radical (typically around 308.160 nm) to identify the spectral peak and lock onto the corresponding wavelength, λ_on. (2) Alternating acquisition of background and resonance signals: adjust the laser output wavelength according to a preset sequence: λ_on − δ nm (low-wavelength background), λ_on and λ_on + δ nm (high-wavelength background) and get their corresponding signal intensities. (3) Signal processing and active wavelength adjustment: calculate the net OH signal intensity in real time as the difference between the resonance signal and the average of the two background signals. Once the net signal intensity falls below a preset threshold (e.g., 95 % of the peak intensity), identify this signal attenuation as laser wavelength drift event and immediately triggers a new wavelength scanning cycle to re-locate and relock onto the λ_on.
3.1 OH excitation spectrum
With a constant experimental condition, the laser wavelength was scanned across the range of 307.800 to 308.450 nm in 0.001 nm step to record the OH radical excitation fluorescence spectrum, as presented in Fig. 4, the measured spectral peaks agree well with those reported from the ULILLE FAGE reference cell (Shamas, 2023). Three prominent and adjacent peaks near 308.16 nm, assigned to the Q1(3), Q21(3), and P1(1) rotational transitions (Dorn et al., 1995), are clearly observed in the spectrum. To confirm the successful generation of OH radicals by the reference cell and their subsequent detection, an OH calibration source based on mercury-lamp photolysis of humidified synthetic air was connected to the ambient radical measurement system for simultaneous spectral scanning and thus comparison. As shown in the upper-left inset of Fig. 4, both the spectral positions and line shapes of the three characteristic peaks from two measurement systems show good agreement. Among the three characteristic peaks, the Q1(3) transition exhibits the highest fluorescence signal intensity, indicating the largest absorption cross-section and excitation efficiency, and thus is normally selected as the optimal OH excitation wavelength for experimental investigation and field campaign measurements.
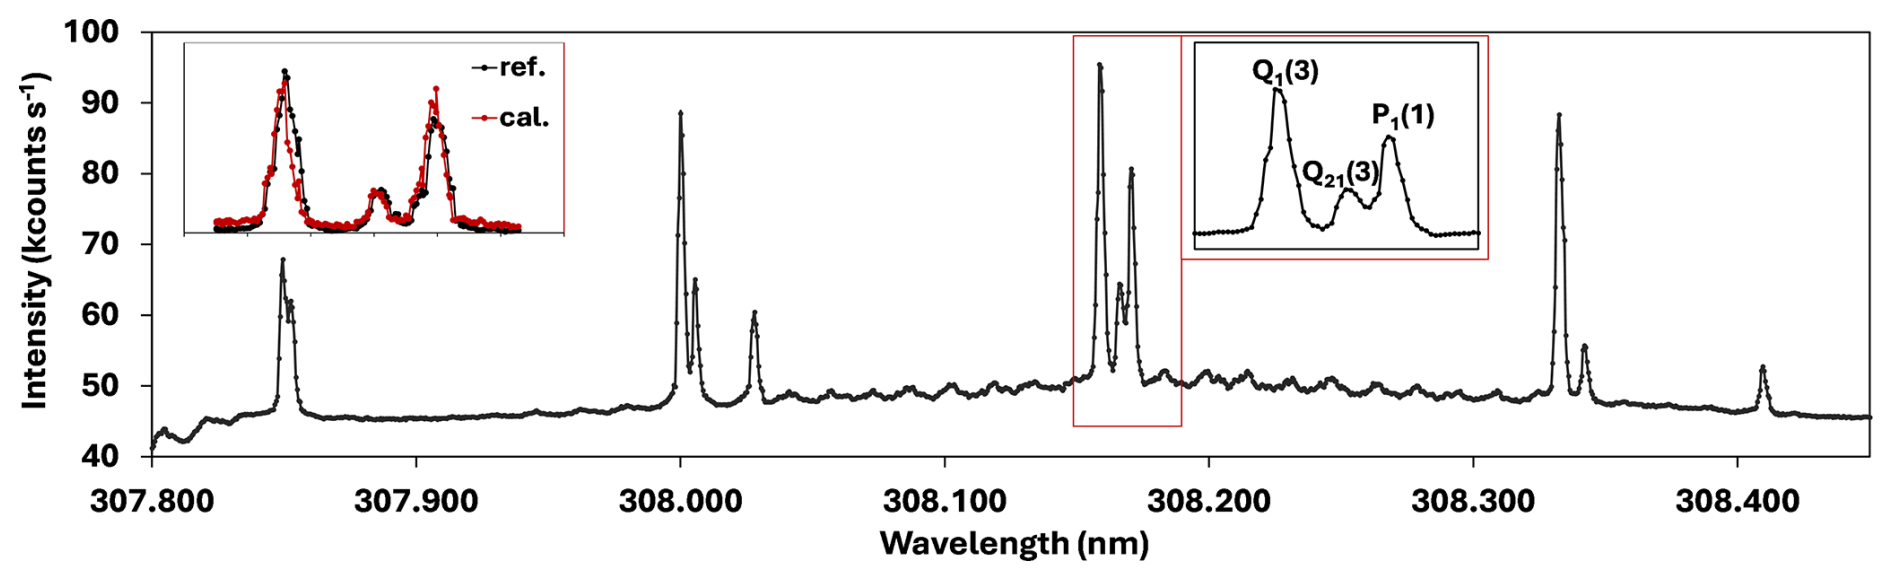
Figure 4OH excitation spectrum obtained by scanning the laser from 307.800 to 308.450 nm in 0.001 nm steps. The inset with red frame shows the characteristic three peaks corresponding to the Q1(3), Q21(3), and P1(1) rovibronic transitions. The upper-left inset shows the comparison results of the three characteristic peaks measured simultaneously by the reference (ref.) system and the ambient measurement system combined with an OH calibration (cal.) source.
3.2 Systematic characterization of the reference cell
A systematic characterization of the reference cell parameters was conducted to identify the optimal operating range for achieving stable and high concentration OH generation and thus a high signal-to-noise fluorescence signal detection. The investigated parameters include laser power, filament operating conditions (current, voltage), and cell environment (pressure/inlet gas flow rate, inlet gas relative humidity).
As shown in Fig. 5, the OH fluorescence signal intensity exhibits a linear increase with increasing excitation laser power (0.5–2.1 mW), and with a good linear correlation (R2=0.998). This behavior aligns with the principle that the population of excited-state molecules increases with photon flux, within the non-saturated excitation regime, higher laser power effectively enhances the number of OH radicals in the resonant absorption state, thereby increasing the fluorescence signal through radiative transition processes. The strong linear dependence demonstrates that normalization of the raw fluorescence signal against laser power can effectively eliminate the influence of laser power fluctuations on the measurement results. Consequently, during general measurements, the laser power is controlled and maintained within this specific range. Operating outside this window risks entering a non-linear or even saturated excitation regime, where the fluorescence signal no longer faithfully tracks laser power fluctuations.
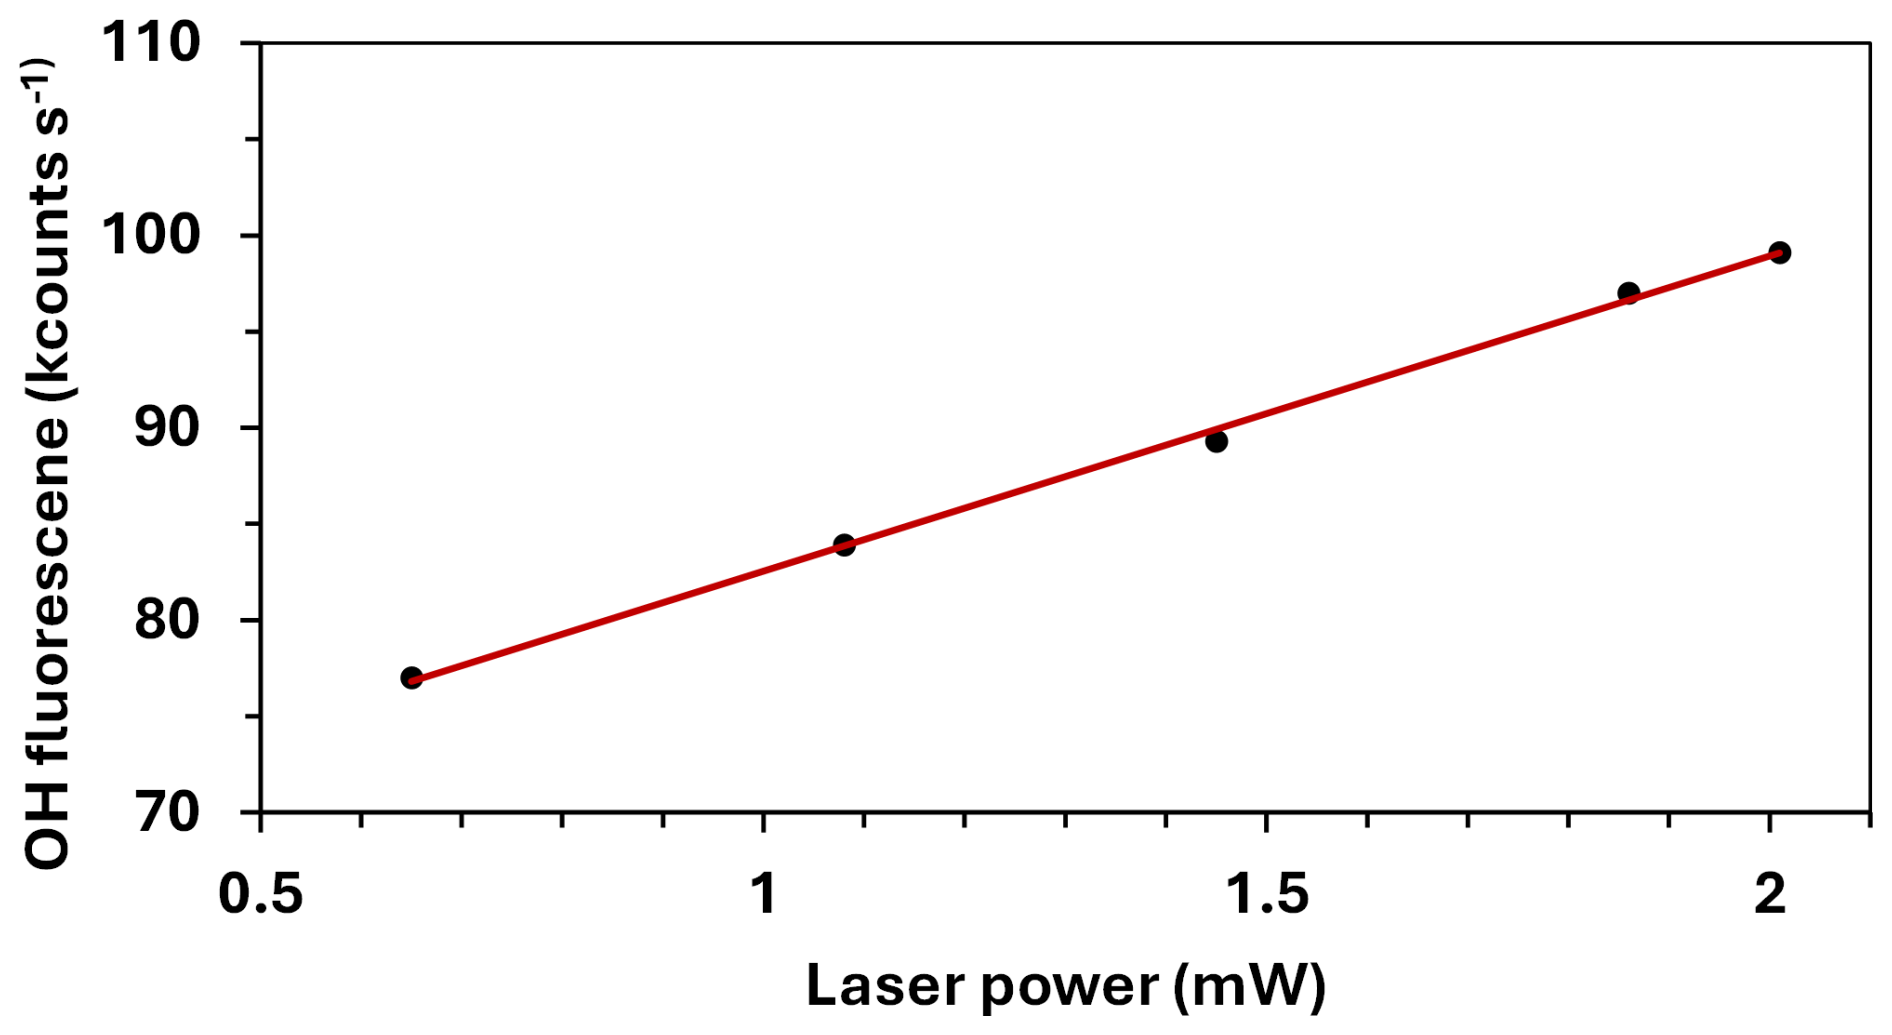
Figure 5The linear dependence of OH fluorescence signal on the laser power in the reference cell, black dots represent experimental data, and the solid red line is the linear fit result (R2=0.998).
Figure 6 reveals the coupled influence of inlet gas flow rate and pressure inside the reference cell on the OH fluorescence. As the pump system lacks an active pressure control valve, any adjustment of the inlet flow rate directly determines the pressure within the reference cell. As shown in Fig. 6a, the pressure increases linearly with the inlet flow rate, indicating a stable flow–pressure response characteristic of the system within the experimental range. Figure 6b shows that the laser power normalized OH fluorescence intensity () decreases with increasing pressure (i.e., increasing flow rate), and exhibits a bi-exponential decay. This trend is primarily attributed to the prolonged fluorescence lifetime of OH radicals and the reduced collisional quenching effect under low-pressure conditions, which both significantly enhance the fluorescence yield. The results demonstrate that lower flow rates and thus pressure conditions are more conducive to achieving high signal-to-noise OH fluorescence signal. In our system, the flowrate of the inlet ambient air is commonly maintained at the minimal value of ∼0.1 sccm (∼0.4 kPa).
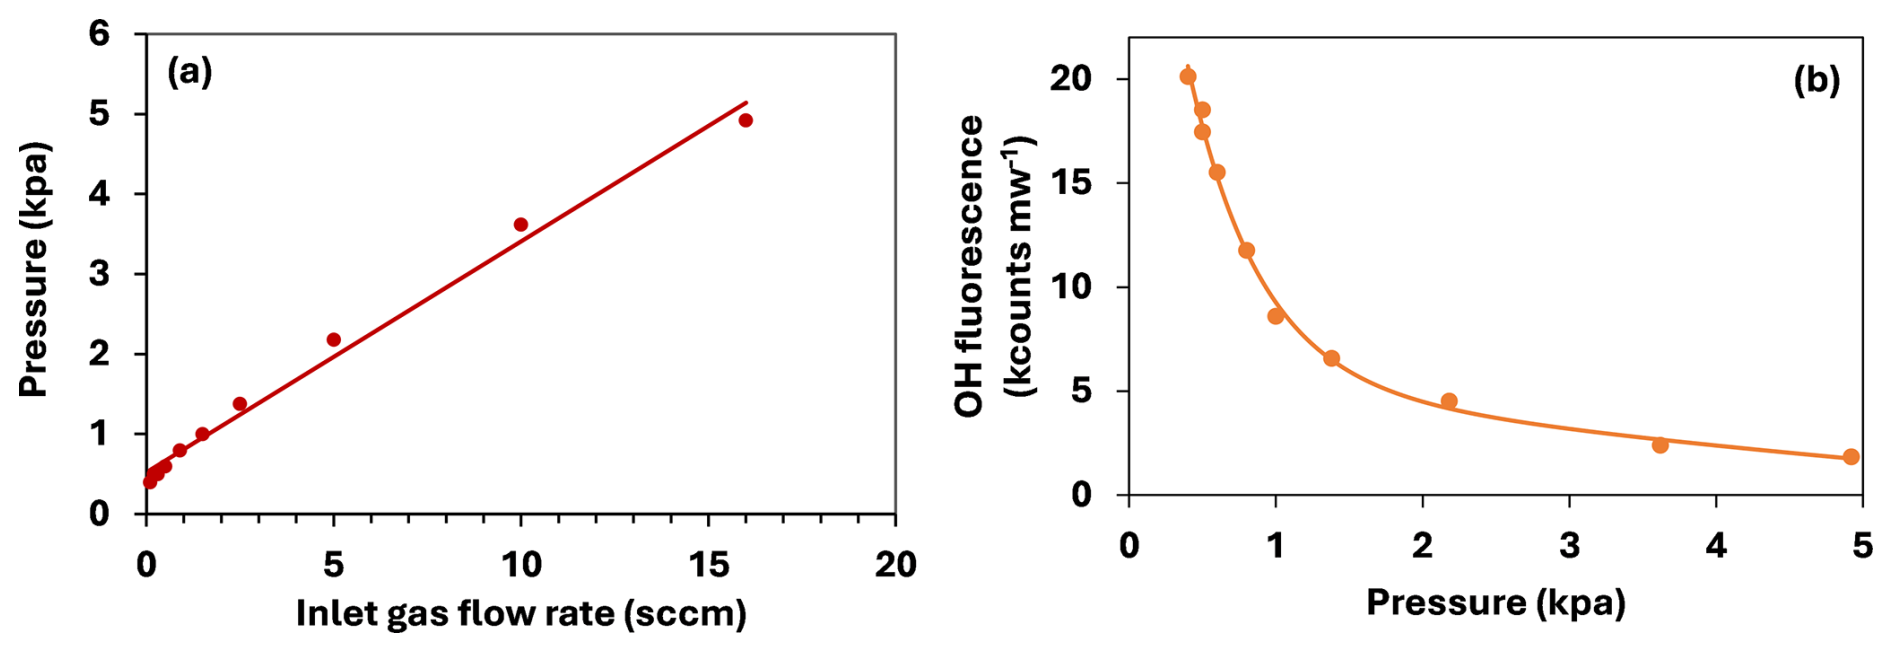
Figure 6(a) Linear response of the pressure with inlet gas flow rate and (b) bi-exponential decay of the laser power normalized OH fluorescence with pressure of the reference cell, where dots represent experimental data and solid lines represent fitting results.
Under conditions of minimized inlet gas flow rate and fixed laser power, the effects of filament operating conditions on OH fluorescence signal intensity were also investigated, the experimental results are presented in Fig. 7. As shown in Fig. 7a, the voltage (U) across the filament increases linear with the applied current (I) over the range of 2.0–3.0 A under constant-current operation. A linear fit yields a coefficient (R2) of 0.999, confirming stable and predictable electrical characteristics of the filament within this operating range, with the slope corresponding to a filament resistance of 1.1 Ω. Figure 7b illustrates the corresponding dependence of the signal intensity on the filament power (Pf=I2R). Both the on-resonance fluorescence signal, S_on, and the background noise, S_off, increase with rising Pf. Nevertheless, the elevated Pf enhances the OH fluorescence intensity, and the linear response with an R2 value of 0.995. It should be noted that the data point corresponding to the lowest Pf has been excluded from the linear fit due to its clear deviation from the trend. At such low power levels, the OH signal is notably weak and could introduce considerable uncertainty into the measurement. Although higher power favors signal enhancement, it also accelerates filament degradation and shortens its operational lifetime. Thus, to balance long-term stability with sufficient signal intensity, the filament supply current is optimally maintained within the range of 2.5 ± 0.2 A. According to the specifications from the manufacturer, this heating wire has a service life exceeding three years when operated at a supply current of 2.5 A.
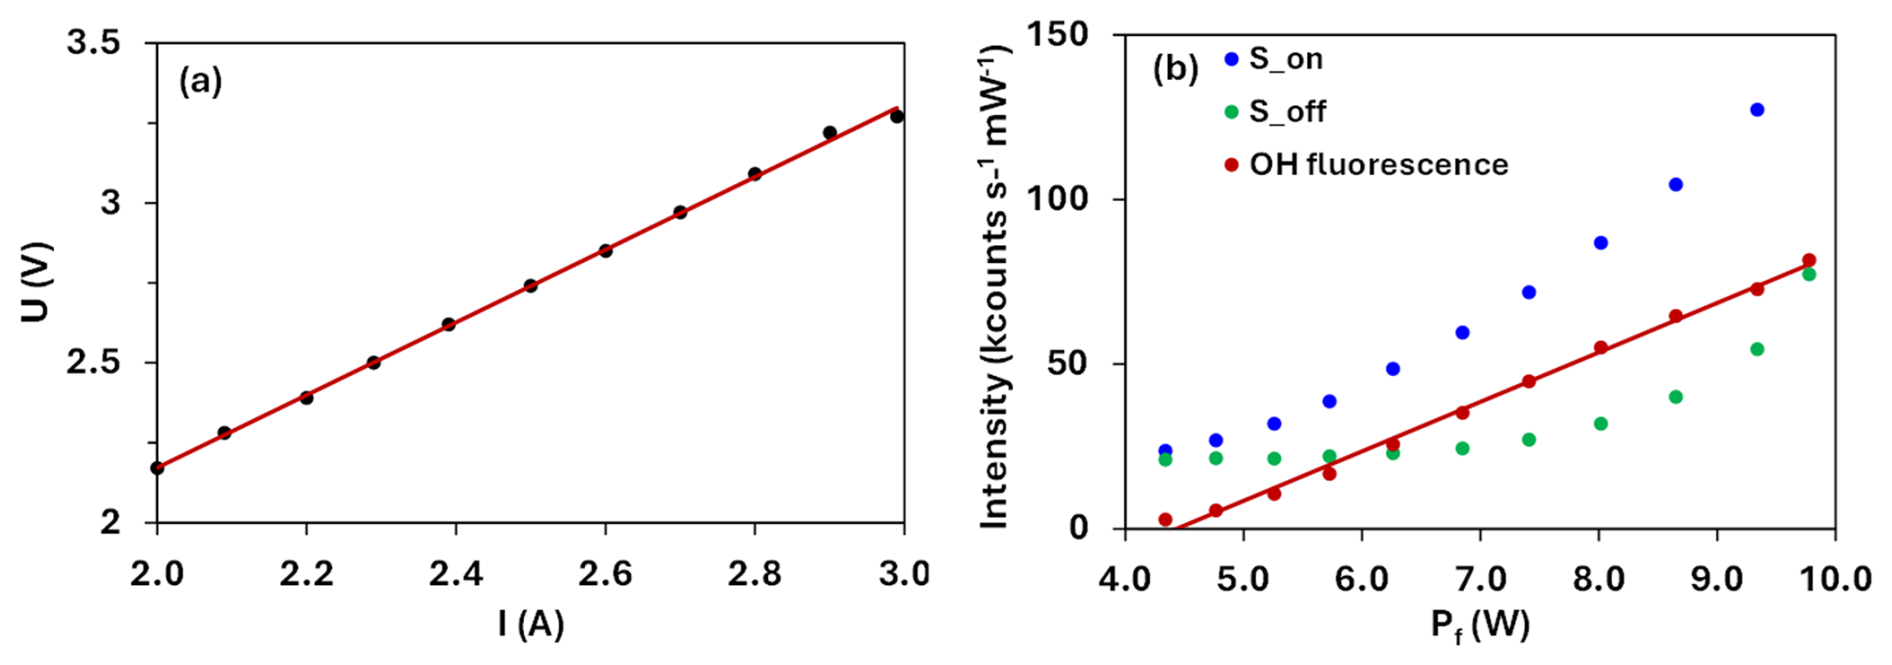
Figure 7(a) Voltage–current relationship of the filament, (b) on-resonance signal intensity, S_on, background noise, S_off, and the OH fluorescence signal at elevated filament power. Where dots represent experimental data and solid lines represent linear fit results, the coefficients are 0.999 and 0.995 for (a) and (b).
The dependence of the OH fluorescence signal intensity on the relative humidity (RH) of the inlet gas is presented in Fig. 8. The RH was controlled by mixing dry and humidified synthetic air flow, with the latter generated by passing dry air through a water bubbler, and was continuously monitored by a sensor. Starting from an initial RH of approximately 20 %, humidity was then gradually increased. Given that the temperature remained constant throughout the process, the changes in RH directly correspond to the changes in H2O molecule concentration. As shown in Fig. 8, the OH signal increases steadily with RH from 23 % to 55 %, indicating enhanced OH production driven by the higher water vapor concentration. A growth plateau is observed as the RH increases further from 55 % to about 74 %. Beyond this plateau, the fluorescence intensity decreases from its peak. These trends highlight the critical role of humidity control in system operation, lower RH limits the supply of H2O as a reactant, whereas excessively high RH leads to fluorescence quenching. Although the nonlinear response suggests that the optimal OH signal occurs at around 74 % RH, such a high humidity level in the reference cell would cause slight filament cooling and thus complicate signal interpretation and increase system instability. In addition, high RH levels would also accelerate the aging of electronic components and increase long-term operational risk. Hence, in practice, RH is maintained within the 30 %–40 % range, which balances signal intensity with sustained system performance.
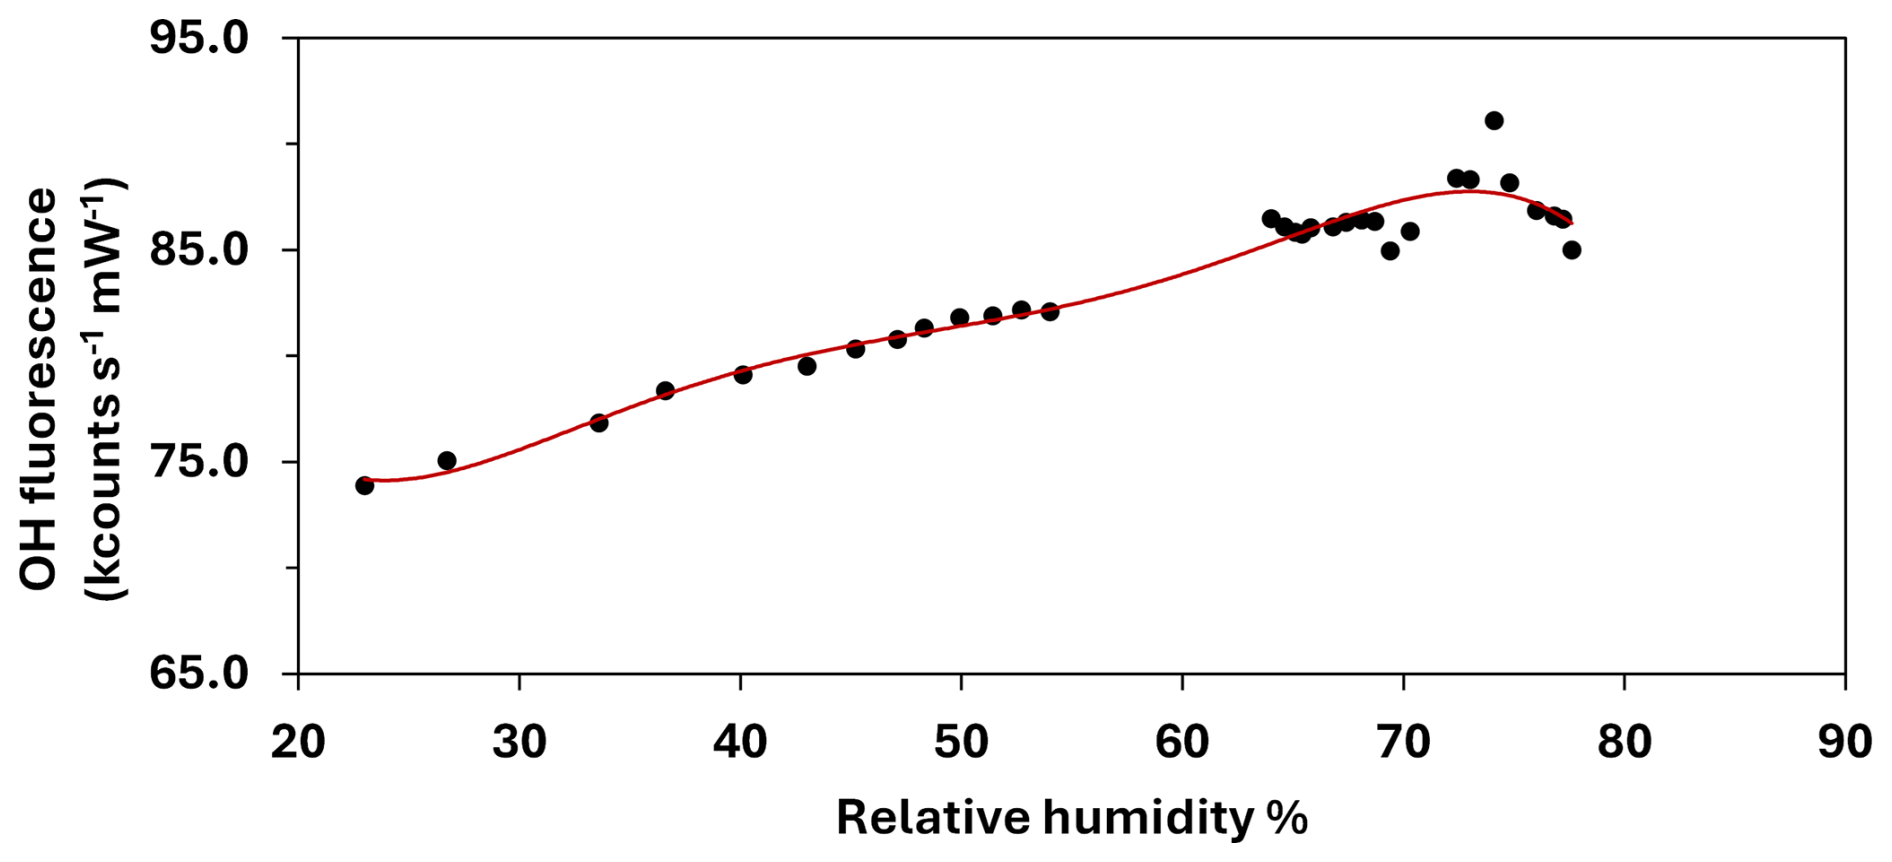
Figure 8Correlation between the normalized OH fluorescence signal and the relative humidity (RH)% of the inlet gas. The red line represents a polynomial fit to the measurement results and illustrates the overall trend of OH signal variation with RH%.
In conclusion, the systematic characterization presented herein enables the identification of robust operational parameters for the reference cell. For general measurements, the inlet flow rate and filament power are maintained at their optimized values to ensure a stable and high concentration OH source. The reference cell, along with the laser source, is housed in an air-conditioned enclosure to have a relative constant temperature and humidity environment. This configuration also isolates the system from ambient variations, thereby minimizing their potential impact on the OH production and detection in the reference cell, and also contributes to long-term operational stability.
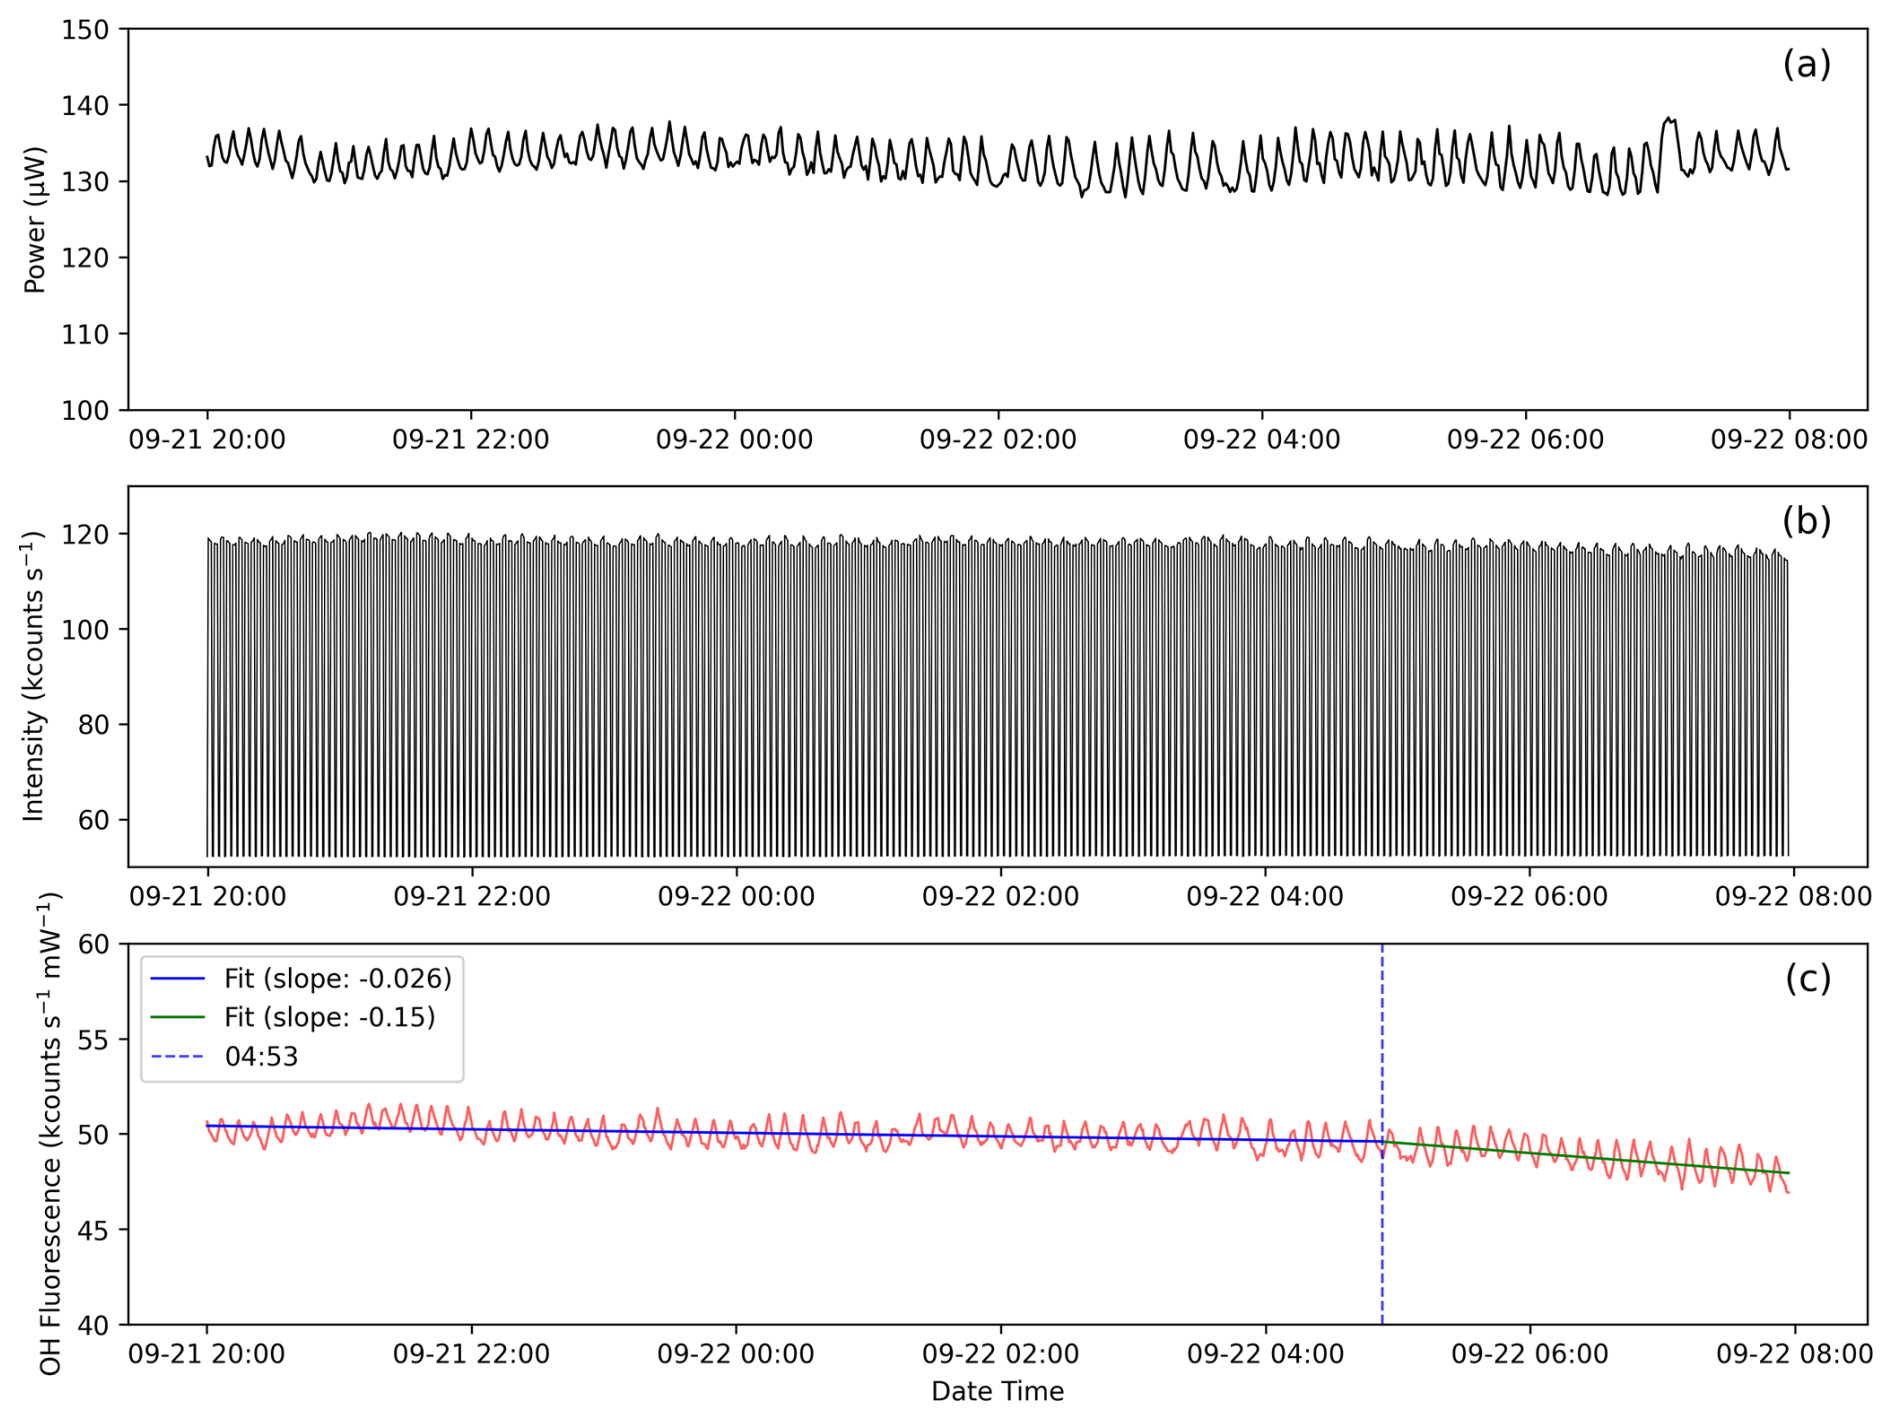
Figure 9Long-term stability assessment of the reference system: (a) laser power in the reference cell, (b) signal intensities during alternating acquisition of background and on-resonance measurements, and (c) derived OH fluorescence signal, from 20:00 on 21 September to 08:00 on 22 September. The short-term fluctuations observed in the signals are primarily attributed to the instability of the laser.
3.3 Long-term stability assessment of the reference system
The long-term operational stability of the reference system was evaluated through a continuous 12 h measurement from 20:00 on 21 September to 08:00 (local time) on 22 September. As shown in Fig. 9a, the laser power in the reference cell maintained oscillatory stability with a mean value of 132.3 ± 1.1 µW (1σ), despite regular short-term fluctuations due to laser performance limitations. Figure 9b presents the alternating on- and off-resonance signals from the reference cell, which remained relatively stable overall, with a noticeable decline only towards the end of the period. The derived laser power normalized OH fluorescence signal in Fig. 9c reveals two distinct trends. During the initial 9 h period (20:00, 21 September to 04:50, 22 September), OH signal maintains a high intensity of 49.7 and a narrow fluctuation of ±1.3 . A linear fit over this period yielded a negligible slope of () s−1, equivalent to an hourly drift of 0.093 , or a relative attenuation rate of 0.2 %. This stability over the first 9 h confirms the reliable performance of the reference cell. In the subsequent 3 h (04:50 to 08:00), however, the signal shows a systematic gradual decline. The green fitting line indicates an hourly decrease of 0.537 , about 8 times greater than in the first period, corresponding to an attenuation rate of 1.1 %. This gradual signal decay indicated a slow drift in the laser output wavelength, however, the signal attenuation during the experimental measurement period remained below the threshold and without triggering the wavelength scanning and re-locking program. Other effective strategy to address such long-term, slow laser drift could implement a supplementary timed calibration program to complement the existing threshold-based feedback control mechanism. For example, initiate an automatic wavelength relocking procedure every 8 h, irrespective of the current signal level. The reason we recommend periodic timed re-scans as a supplement to the 5 % signal attenuation threshold is that the system is inevitably subject to various fluctuations during long-term operation. An overly strict threshold (e.g., 1 %–2 %) would increase the risk of frequent triggering of the wavelength scan procedure, introducing undesired mechanical adjustments and potentially exacerbating wavelength drift. Therefore, the 5 % threshold combined with scheduled periodic re-scans represents a robust strategy that maintains measurement accuracy while minimizing system instability. As instrument performance continues to improve in the future, stricter thresholds could be adopted to further enhance measurement precision.
Accurate quantification of atmospheric OH radicals is fundamental for understanding atmospheric oxidation mechanisms. While the LIF-FAGE technique has enabled direct OH detection, its measurement accuracy is compromised by systematic wavelength drift in the excitation laser source. This limitation necessitates the development of real time reference systems for active wavelength correction. Although reference cells are widely implemented in LIF-FAGE instruments globally, detailed characterizations of experimental parameters and their system performances remain scarce in literatures, with most studies providing only descriptive introductions. In this work, we present the developed real time reference system for wavelength locking in LIF-FAGE measurement. The detailed configuration of the reference cell and its feedback mechanism have been described. Systematic characterization results of key parameters, including laser power, inlet gas flow rate/cell pressure, filament power, and inlet gas relative humidity, on the reference system performance have also been presented. The characterization results provide us the establishment and verification of the optimal operational window for OH radicals generation and detection. The wavelength locking program, implemented with closed-loop feedback mechanism, realizes active wavelength correction based on the measured OH fluorescence signal, and thus sustains the optimal overlapping between the laser wavelength and the OH excitation line over extended measurements. A 12 h continuous stability assessment confirms the system's robustness, demonstrating remarkably stable performance with a signal drift rate of merely 0.2 % h−1 during the initial 9 h period. We believe that the comprehensive characterization and validated performance of this reference system not only enhance the reliability of LIF-FAGE-based atmospheric OH measurements but also establish a transferable framework for precision wavelength locking in other spectroscopic applications.
The data used in this study are available from the corresponding authors upon request.
Shiyi Chen: technology R&D (Reference cell), conceptualization, investigation, methodology, writing (review and editing); Cuihong Zhang: conceptualization, formal analysis, investigation, methodology, writing (original draft preparation), writing (review and editing); Yihui Wang: investigation; Qi Zang: investigation; Xuefei Ma: investigation; Zhaofeng Tan: investigation; Limin Zeng: investigation; Yuanhang Zhang: investigation; Keding Lu: funding acquisition, project administration, writing (review and editing).
At least one of the (co-)authors is a member of the editorial board of Atmospheric Measurement Techniques. The peer-review process was guided by an independent editor, and the authors also have no other competing interests to declare.
Publisher's note: Copernicus Publications remains neutral with regard to jurisdictional claims made in the text, published maps, institutional affiliations, or any other geographical representation in this paper. The authors bear the ultimate responsibility for providing appropriate place names. Views expressed in the text are those of the authors and do not necessarily reflect the views of the publisher.
This research has been supported by the National Natural Science Foundation of China (grant no. 22325601).
This paper was edited by Pinhua Xie and reviewed by two anonymous referees.
Amédro, D.: Atmospheric measurements of OH and HO2 radicals using FAGE: Development and deployment on the field, PhysicoChimie des Processus de Combustion et de l'Atmosphère (PC2A), University of Lille, Lille, France, https://doi.org/10.70675/d67f2ad5z1ee2z427ez8da7zdc2b8357966b, 2012.
Baardsen, E. L. and Terhune, R. W.: Detection of OH in the atmosphere using a dye laser, Appl. Phys. Lett., 21, 209–211, https://doi.org/10.1063/1.1654347, 1972.
Creasey, D. J., Heard, D. E., Pilling, M. J., Whitaker, B. J., Berzins, M., and Fairlie, R.: Visualisation of a supersonic free-jet expansion using laser-induced fluorescence spectroscopy: Application to the measurement of rate constants at ultralow temperatures, Appl. Phys. B-Lasers O., 65, 375–391, https://doi.org/10.1007/s003400050285, 1997.
Davis, D. D., Rodgers, M. O., Fischer, S. D., and Asai, K.: An experimental assessment of the interference problem in the detection of natural levels of OH via laser induced fluorescence, Geophys. Res. Lett., 8, 69–72, https://doi.org/10.1029/GL008i001p00069, 1981.
Dorn, H. P., Neuroth, R., and Hofzumahaus, A.: Investigation of OH absorption cross-sections of rotational transitions in the A2Σ+, , band under atmospheric conditions: Implications for tropospheric long-path absorption-measurements, J. Geophys. Res.-Atmos., 100, 7397–7409, https://doi.org/10.1029/94jd03323, 1995.
Dusanter, S., Vimal, D., Stevens, P. S., Volkamer, R., and Molina, L. T.: Measurements of OH and HO2 concentrations during the MCMA-2006 field campaign – Part 1: Deployment of the Indiana University laser-induced fluorescence instrument, Atmos. Chem. Phys., 9, 1665–1685, https://doi.org/10.5194/acp-9-1665-2009, 2009.
Ehhalt, D. H.: Photooxidation of trace gases in the troposphere, Phys. Chem. Chem. Phys., 1, 5401–5408, https://doi.org/10.1039/a905097c, 1999.
Faloona, I. C., Tan, D., Lesher, R. L., Hazen, N. L., Frame, C. L., Simpas, J. B., Harder, H., Martinez, M., Di Carlo, P., Ren, X., and Brune, W. H.: A laser-induced fluorescence instrument for detecting tropospheric OH and HO2: Characteristics and calibration, J. Atmos. Chem., 47, 139–167, https://doi.org/10.1023/B:JOCH.0000021036.53185.0e, 2004.
Hanabusa, M., Wang, C. C., Japar, S., Killinger, D. K., and Fisher, W.: Pulsewidth dependence of ozoneinterference in the laser fluorescence measurement of OH in the atmosphere, J. Chem. Phys., 66, 2118–2120, https://doi.org/10.1063/1.434174, 1977.
Hard, T. M., O'Brien, R. J., Cook, T. B., and Tsongas, G. A.: Interference suppression in HO fluorescence detection, Appl. Optics, 18, 3216–3217, https://doi.org/10.1364/AO.18.003216, 1979.
Heard, D. E.: Atmospheric field measurements of the hydroxylradical using laser-induced fluorescence spectroscopy, Annu. Rev. Phys. Chem., 191–216, https://doi.org/10.1146/annurev.physchem.57.032905.104516, 2006.
Heard, D. E. and Pilling, M. J.: Measurement of OH and HO2 in the troposphere, Chem. Rev., 103, 5163–5198, https://doi.org/10.1021/cr020522s, 2003.
Hofzumahaus, A., Aschmutat, U., Hessling, M., Holland, F., and Ehhalt, D. H.: The measurement of tropospheric OH radicals by laser-induced fluorescence spectroscopy during the POPCORN field campaign, Geophys. Res. Lett., 23, 2541–2544, https://doi.org/10.1029/96gl02205, 1996.
Lelieveld, J., Butler, T. M., Crowley, J. N., Dillon, T. J., Fischer, H., Ganzeveld, L., Harder, H., Lawrence, M. G., Martinez, M., Taraborrelli, D., and Williams, J.: Atmospheric oxidation capacity sustained by a tropical forest, Nature, 452, 737–740, https://doi.org/10.1038/nature06870, 2008.
Levy, H.: Tropospheric budgets for methane, carbon-monoxide, and related species, J. Geophys. Res., 78, 5325–5332, https://doi.org/10.1029/JC078i024p05325, 1973.
Li, X., Lu, K., Wei, Y., and Tang, X.: Technique progress and chemical mechanism research of tropospheric peroxy radical in field measurement, Prog. Chem., 26, 682–694, https://doi.org/10.7536/PC130846, 2014.
Lu, K. and Zhang, Y.: Observations of HOx radical in field studies and the analysis of its chemical mechanism, Prog. Chem., 22, 500–514, https://webofscience.clarivate.cn/wos/alldb/full-record/WOS:000275994000032 (last access: 13 May 2026), 2010.
Lu, K., Guo, S., Tan, Z., Wang, H., Shang, D., Liu, Y., Li, X., Wu, Z., Hu, M., and Zhang, Y.: Exploring atmospheric free-radical chemistry in China: the self-cleansing capacity and the formation of secondary air pollution, Natl. Sci. Rev., 6, 579–594, https://doi.org/10.1093/nsr/nwy073, 2019.
Ren, X. R., Harder, H., Martinez, M., Faloona, I. C., Tan, D., Lesher, R. L., Di Carlo, P., Simpas, J. B., and Brune, W. H.: Interference testing for atmospheric HOx measurements by laser-induced fluorescence, J. Atmos. Chem., 47, 169–190, https://doi.org/10.1023/b:Joch.0000021037.46866.81, 2004.
Shamas, N.: Understanding of atmospheric and indoor air chemistry through HOx radical measurements, Doctoral, PhysicoChimie des Processus de Combustion et de l'Atmosphère (PC2A), University of Lille, Lille, France, https://doi.org/10.70675/4a41830fz1974z4a8dzaa91z11fb49b80c3f, 2023.
Stimpfle, R. M. and Anderson, J. G.: In-situ detection of OH in the lower stratosphere with a balloon borne high repetition rate laser system, Geophys. Res. Lett., 15, 1503–1506, https://doi.org/10.1029/GL015i013p01503, 1988.
Tan, Z., Lu, K., Jiang, M., Su, R., Wang, H., Lou, S., Fu, Q., Zhai, C., Tan, Q., Yue, D., Chen, D., Wang, Z., Xie, S., Zeng, L., and Zhang, Y.: Daytime atmospheric oxidation capacity in four Chinese megacities during the photochemically polluted season: a case study based on box model simulation, Atmos. Chem. Phys., 19, 3493–3513, https://doi.org/10.5194/acp-19-3493-2019, 2019.
Tan, Z., Ma, X., Lu, K., Li, X., Zeng, L., and Zhang, Y.: Reproducing strong urban oxidation capacity in Beijing using an empirical parametrization, Environ. Sci. Technol., 59, 13343–13351, https://doi.org/10.1021/acs.est.5c05933, 2025.
Wang, C. C., Davis, L. I., Wu, C. H., and Japar, S.: Laser-induced dissociation of ozone and resonance fluorescence of OH in ambient air, Appl. Phys. Lett., 28, 14–16, https://doi.org/10.1063/1.88561, 1976.
Wang, F., Hu, R., Chen, H., Xie, P., Wang, Y., Li, Z., Jin, H., Liu, J., and Liu, W.: Development of a field system for measurement of tropospheric OH radical using laser-induced fluorescence technique, Opt. Express, 27, A419–A435, https://doi.org/10.1364/OE.27.00A419, 2019.
Wennberg, P. O., Cohen, R. C., Hazen, N. L., Lapson, L. B., Allen, N. T., Hanisco, T. F., Oliver, J. F., Lanham, N. W., Demusz, J. N., and Anderson, J. G.: Aircraft-borne, laser-induced fluorescence instrument for the in-situ detection of hydroxyl and hydroperoxyl radicals, Rev. Sci. Instrum., 65, 1858–1876, https://doi.org/10.1063/1.1144835, 1994.
Xing, X. B., Hu, R. Z., Xie, P. H., Chen, H., Ling, L. Y., Wang, D., Wu, J., and Li, Z. Y.: Study of a laser wavelength correction method applied to the measurement of OH Radical with laser-induced fluorescence, Guang Pu Xue Yu Guang Pu Fen Xi, 37, 692–696, 2017.