the Creative Commons Attribution 4.0 License.
the Creative Commons Attribution 4.0 License.
 | 26 May 2026
DTL-IceNet: a dual-task learning architecture with multi-scale fusion mechanisms for enhanced ice detection on transmission lines
Yufei Fu
Yang Cheng
Song Yuan Cao
Jiaxin He
Mengya Wang
Icing on transmission lines can significantly impact the stable operation of the power system. Deep learning-based ice image recognition is effective but remains vulnerable to background interference and noise, degrading accuracy. Moreover, when detecting ice thickness, the 2D nature of ice images introduces spatial limitations in representing the 3D ice state, which can lead to detection errors caused by a single viewpoint. To tackle the aforementioned challenges, this paper proposes DTL-IceNet (Dual-Task Learning Ice Detection Network), a dual-task learning-based network for transmission line icing detection that is designed to accurately identify both the type and thickness of ice on overhead transmission lines. DTL-IceNet incorporates a multi-branch structured ice coating recognition module, ResSepNet (Residual & Depth-Separable Convolution Network), which segments the background and conductor areas to mitigate the influence of background noise. Additionally, a semantic segmentation module, MOMSA-SegNet (MobileOne & Multi-Scale Attention Segmentation Network) is designed to segment the ice-covered areas in both the main and side views of the image. The multi-scale attention mechanism is employed to extract spatial features from the raw icing image. When calculating ice thickness, the multi-scale fusion and correction optimization are adopted to enhance the algorithm. Experimental results show that compared with other models, the proposed method achieves an improvement of 4.17 % in icing type identification accuracy and a MAPE of 11.82 % in icing thickness detection. The application of this approach is crucial for reducing the hazards caused by ice coating on transmission lines and improving the stability of the power grid.
- Article
(8686 KB) - Full-text XML
- BibTeX
- EndNote


Extreme weather can lead to ice accumulation on power lines, significantly increasing the risk of incidents such as conductor breakage and tower collapse, thereby threatening the stability of the power supply. Therefore, real-time monitoring of ice type, thickness, and other conditions on transmission lines is essential for ensuring the safe and stable operation of the power grid.
Traditional ice detection methods primarily rely on physical sensors and manual inspections (Zhang et al., 2024). However, these methods often suffer from high costs, low real-time performance, and limited detection accuracy, making them insufficient for effective ice monitoring in complex environments. In recent years, with the rapid advancement of deep learning and computer vision technologies, intelligent detection methods based on the YOLO architectures have increasingly become an effective approach. Chen et al. (2024a) proposed a transmission line icing detection method based on YOLOv8. They utilized the ghost shuffle convolution to reduce model parameters and improve computational efficiency. Additionally, they incorporated the BiFormer attention mechanism and the Wise-IoUv3 loss function to enhance the model's accuracy in detecting ice-covered areas. Kong et al. (2024) integrated the GE attention module into YOLOv8 to enhance detection accuracy and replaced the concatenate structure in the original network with the BiFPN feature fusion module. This modification enables the detection of ice-covered areas on power transmission lines in complex backgrounds. Although the YOLO-based detection algorithm effectively locates ice-covered areas on transmission lines, it fails to detect and assess key information, such as ice contours and thickness. Building on this, Lu (2024) proposed the Canny-UNet model by enhancing YOLOv8 with EfficientViT (Liu et al., 2023), and integrating the Canny edge detection algorithm along with semantic segmentation technology, which further enabled accurate segmentation of ice contours. Similarly, He et al. (2023a) applied the ProtoNet segmentation model to the detection results of the improved YOLOv5s, enabling the segmentation of ice-covered areas based on target detection. Similarly, He et al. (2023b) utilized the GrabCut algorithm in conjunction with target detection to identify and segment transmission line insulators.
Although the aforementioned methods employ edge detection and semantic segmentation techniques to segment and detect the contours of ice-covered regions, the calculation of ice thickness primarily depends on edge detection algorithms. Wang et al (2023) proposed an image denoising algorithm based on an adaptive switching median filter. Building upon this, an optimized Canny operator was employed to detect the edges of the ice-covered conductor's contour. The computed ice thickness was then compared with the results obtained from optical fiber detection, yielding an average error of just 4.10 %. Yang et al. (2023) proposed an ice monitoring method integrating image edge detection and normal detection. The approach first preprocesses micro-photographed images of transmission lines, applies algorithms such as eight-neighborhood tracking to detect edges and determine the longest side of the conductor, and designs an ice thickness detection method based on edge normal detection. Experimental results indicate that the relative error of real-time conductor ice thickness measurements using this method does not exceed 9 %. He et al. (2023c) proposed a novel measurement method for thickness of uneven icing on transmission line in complex background. Their method involved image grayscaling, median-filter denoising, and the maximum inter-class variance method for image analysis. By integrating the result-domain characteristics of transmission line icing information and background noise, they extracted the re-icing transmission line. Finally, the vertical line approximation method was applied to determine the re-icing thickness. Such methods leverage edge detection techniques to enhance the extraction of ice cover information and initially estimate the corresponding ice thickness. However, they exhibit limited robustness to environmental interferences such as lighting variations and haze and fail to account for the three-dimensional spatial distribution of the conductors. Consequently, when encountering irregular ice formations, these methods may yield larger errors.
Accurately identifying the type of ice on transmission lines is crucial for improving ice detection capabilities. In the field of ice classification, some researchers analyze monitoring data to distinguish different ice types. Fan and Jiang (2018) analyzed the collision rate of water droplets on conductors with varying diameters and employed the standard ice thickness normalization method to quantify the extent of conductor icing. Hao et al. (2023) analyzed multi-source data and applied the KNN algorithm to classify four distinct types of ice cover. Chen et al. (2024b) proposed a method to monitor the status of ice-covered transmission lines based on conductor end displacement, which can aptly capture the stress characteristics of transmission lines in frozen rain environments. Due to limitations in monitoring data and conditions, these methods face significant constraints. In recent years, visual image-based recognition technology has advanced rapidly. Most research on ice recognition has focused on sea ice, river ice, and road ice (Liu et al., 2025; Ansari et al., 2024; Gui et al., 2023), achieving excellent detection performance. However, studies on ice type recognition for transmission lines remain scarce. This is partly due to the challenges associated with capturing ice images of transmission lines and partly due to the interference caused by complex background noise in such images, which must be accounted for in recognition processes.
Beyond ice physical parameters and imagery, the accuracy of transmission line ice detection can be further enhanced by incorporating environmental data. Numerous studies have demonstrated that meteorological factors, such as wind and humidity, are closely correlated with conductor icing (Dong et al., 2022; Meng et al., 2025; Han et al., 2024; Wang et al., 2023; Yang et al., 2025), offering valuable insights for ice thickness detection. Therefore, to address the challenges of low accuracy in ice type recognition and thickness detection for transmission lines, this paper proposes DTL-IceNet (Dual-Task Learning Ice Detection Network), a dual-task learning framework designed to enhance the performance of both ice coating recognition and thickness detection. DTL-IceNet employs a multi-branch ice coating recognition module to separately extract spatial feature information of both the background and ice-covered regions, thereby determining the ice type. Simultaneously, a multi-scale attention-based semantic segmentation module is utilized to segment the ice-covered areas. Finally, the model integrates ice type recognition, ice segmentation results, and key meteorological factors to optimize ice thickness estimation, yielding more accurate identification of ice types and thickness on transmission lines. The main contributions of this paper are as follows:
-
To address the issue of low ice thickness detection accuracy caused by the irregular shape of ice on transmission lines and complex environmental conditions, this paper proposes a dual-task learning framework, DTL-IceNet. The framework enhances ice thickness detection performance by leveraging ice type classification and key meteorological elements to assist ice segmentation. The proposed framework incorporates an ice coating recognition module, ResSepNet (Residual & Depth-Separable Convolution Network), an icing region segmentation module, MOMSA-SegNet (MobileOne & Multi-Scale Attention Network), and an ice thickness optimized calculation module. By integrating ice segmentation results with ice types and key meteorological factors through multi-scale fusion, the framework refines ice thickness estimation. Through the fusion of multi-source heterogeneous data and the multi-scale fusion of image classification and segmentation techniques, the reliance on a single ice contour for thickness estimation is eliminated, significantly enhancing detection accuracy.
-
To address the challenge of incomplete information extraction and utilization in transmission line ice images due to background noise interference, such as fog and light noise, a ResSepNet ice coating recognition module is developed. This module integrates a nested residual structure with depthwise separable convolution and divides the image into an upper background region and a lower conductor region. Additionally, three branches are designed to extract features from the entire image, background, and conductors separately, effectively mitigating the impact of background noise.
-
Considering the limitations of two-dimensional ice images in representing the spatial distribution of three-dimensional ice, which may lead to detection errors, this study designs the MOMSA-SegNet icing region segmentation module. The module incorporates an improved MobileOne encoder and a multi-scale attention mechanism to segment the ice region from both the main and side perspectives of the image, thereby enhancing the information capture capability of a single perspective. Additionally, a skip connection structure and multi-scale attention mechanism are employed to comprehensively extract spatial features from the raw icing image, further improving segmentation accuracy.
The detection of ice in transmission line images primarily involves two tasks: ice type recognition and ice thickness detection. This paper presents DTL-IceNet, a dual-task learning framework for ice detection, designed to achieve ice type recognition and ice thickness detection for transmission lines. Through the coordinated design of multiple modules, the proposed framework effectively addresses the limitations in the accuracy of ice type recognition and thickness detection. The overall framework structure of DTL-IceNet is illustrated in Fig. 1.
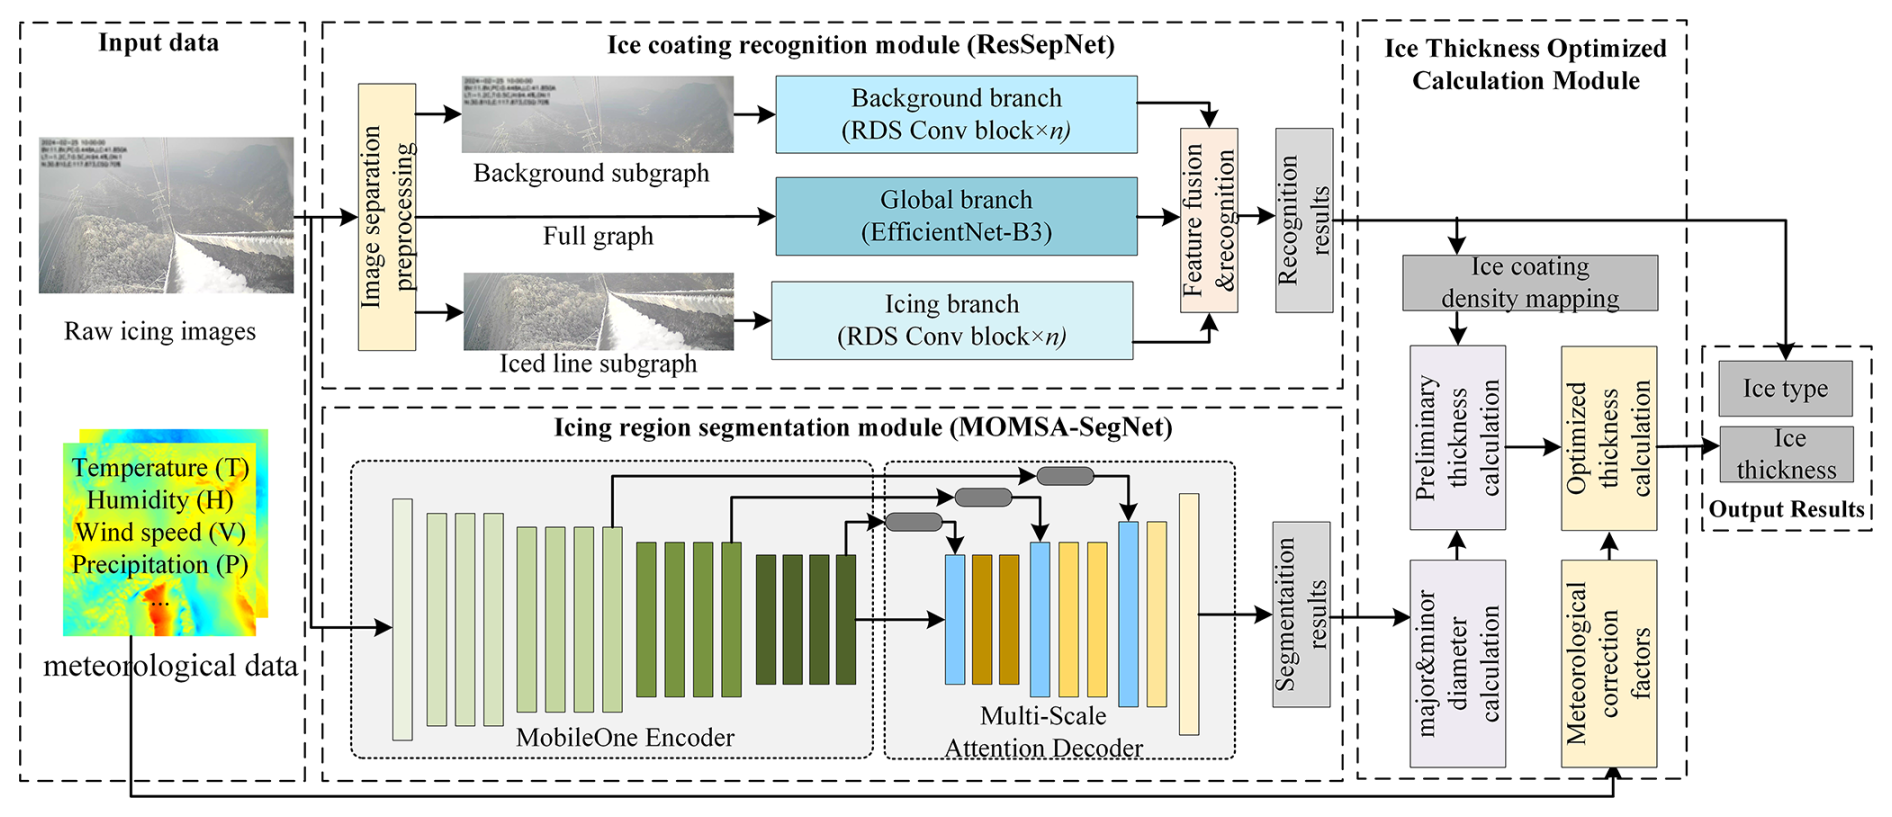
Figure 1DTL-IceNet overall framework structure. Note. For details on the ice coating recognition module, please refer to Sect. 2.2; for details on the icing region segmentation module, please refer to Sect. 2.3; for details on the equivalent thickness optimized calculation module, please refer to Sect. 2.4.
DTL-IceNet primarily consists of three components: the ice coating recognition module (ResSepNet), the icing region segmentation module (MOMSA-SegNet), and the ice thickness optimized calculation module. In the ResSepNet module, the raw icing image undergoes preprocessing to generate the background subgraph and the iced-conductor subgraph. Along with the full icing image, three branches are employed to extract features from different spatial regions, which are then fused to determine the ice type. In the MOMSA-SegNet module, the raw icing image is processed through a multi-scale attention-based semantic segmentation network to segment the ice-covered region from both the main view and the side view. In the optimized ice-thickness calculation module, the results of ice coating recognition and icing region segmentation are integrated, and key meteorological data are incorporated for correction and refinement to obtain equivalent ice thickness values, thereby completing the ice-type recognition and thickness-detection tasks.
The subsequent sections will provide a detailed description of the ResSepNet module, MOMSA-SegNet module, and the ice thickness optimized calculation module.
2.1 ResSepNet
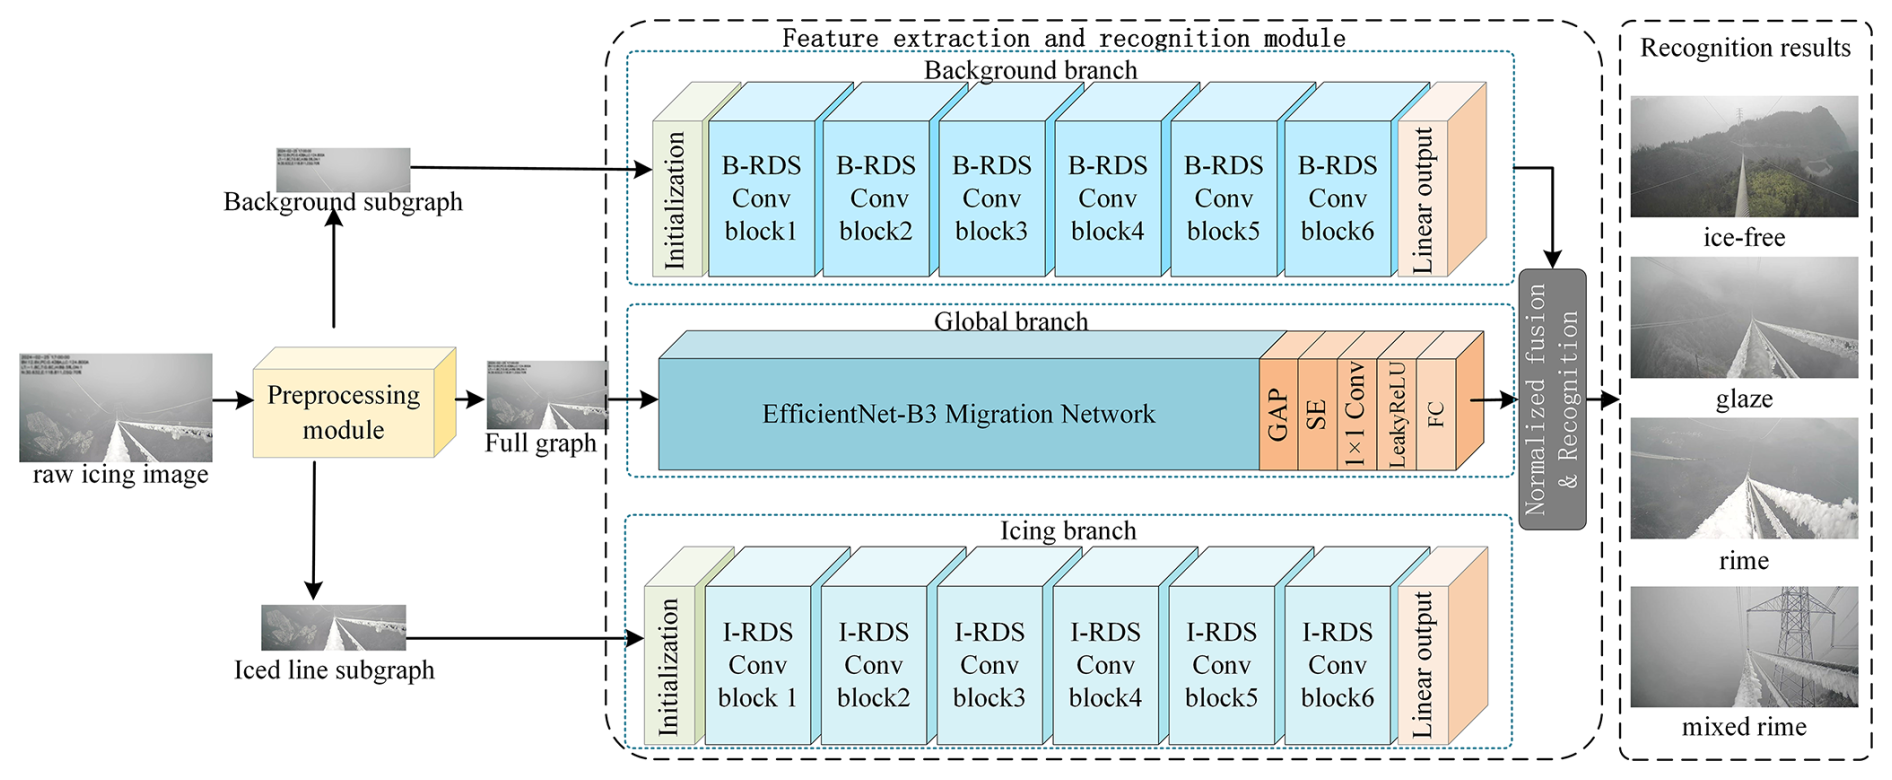
The ice coating recognition module, ResSepNet, consists of a background branch, an icing branch, and a global branch. It is capable of recognizing four types of icing: ice-free, glaze, rime, and mixed rime. To mitigate background noise interference, the original image is divided into a background subgraph and an iced-conductor subgraph. The background and icing branches extract features from their respective regions, while the global branch utilizes a transfer learning model to capture the overall ice-covered features of the entire image. By employing a multi-branch structure, ice-covered features at different spatial scales are normalized, fused, and recognized to produce the final recognition result. The model structure of ResSepNet is shown in Fig. 2, which mainly includes an ice segmentation preprocessing module and a feature extraction and recognition module.
2.1.1 RDS Convolutional Block
To enhance the feature extraction performance of the model in complex icing scenarios, this paper incorporates multiple RDS convolution blocks into ResSepNet, utilizing a nested residual structure and depthwise separable convolution. These blocks serve as the core feature extraction modules in both the background and icing branches. The structure of the RDS convolution block is illustrated in Fig. 3. The convolution block in the background branch is referred to as B-RDS, while the one in the icing branch is denoted as I-RDS. Both branches adopt similar network architectures (as shown in Fig. 2). Figure 3 presents the structure of a single RDS convolution block.
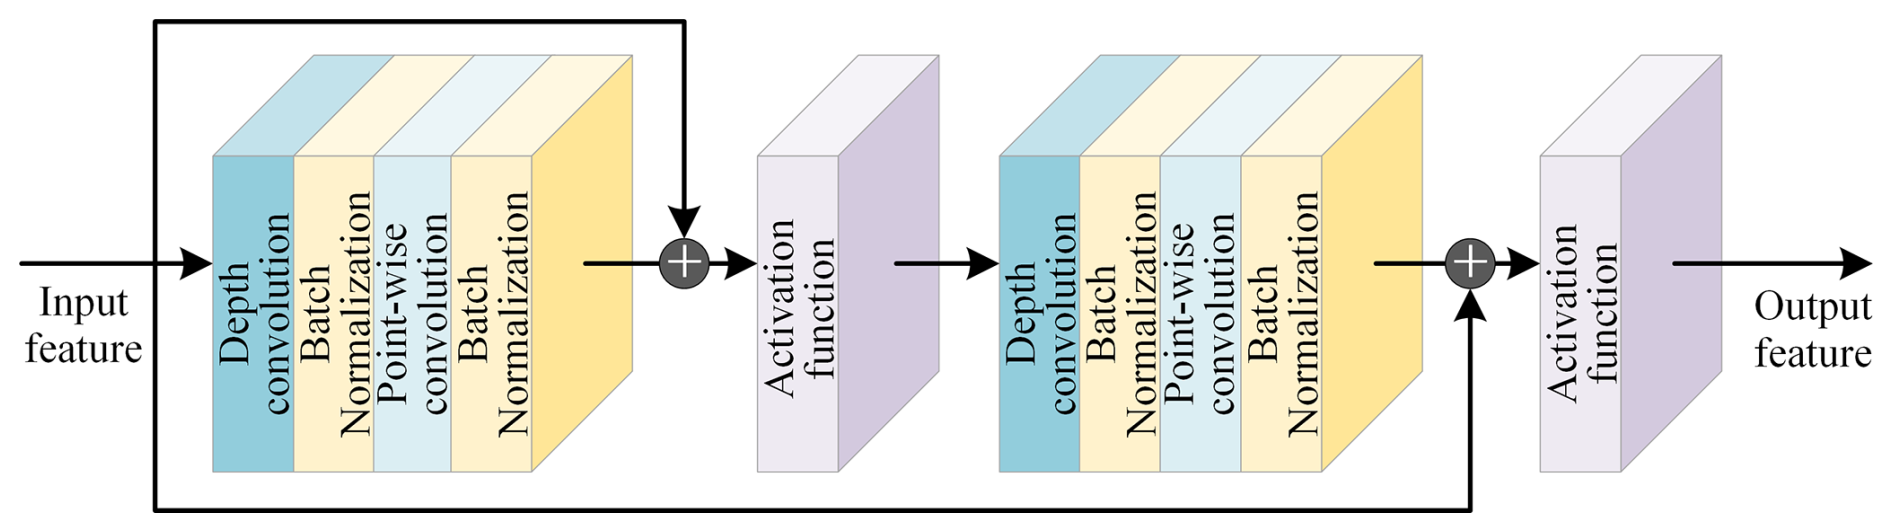
The nested residual structure in the RDS convolutional block incorporates skip connections, enabling gradients to propagate directly from shallow layers to deeper layers. This effectively mitigates the gradient vanishing problem while preventing network overfitting and degradation. By employing multiple nested residual blocks, the model captures complex features at deeper levels while preserving shallow features, thereby enhancing its capability to extract intricate features in real-world ice-covered scenarios. On the other hand, the RDS convolution block incorporates depthwise separable convolution, a decomposition method that effectively reduces the number of parameters in convolution operations. This significantly enhances the computational efficiency of the network, resulting in a more compact and responsive model. Its flexibility allows deployment in resource-constrained environments, facilitating distributed processing and real-time computation, making it particularly suitable for transmission line ice detection tasks.
2.1.2 Multi-Branch Feature Extraction and Fusion Recognition Module
To mitigate background noise interference in icing images, ResSepNet employs a three-branch structure comprising a background branch, a global branch, and an icing branch. By extracting local and global features at multiple scales, it effectively reduces the impact of background noise on recognition performance. The raw icing image undergoes preprocessing to generate a background subgraph in the upper region and an iced-conductor subgraph in the lower region. The background subgraph is fed into the background branch to focus on extracting feature information from the background environment. The iced-conductor subgraph is directed to the icing branch to emphasize the extraction of ice feature information in the transmission line area. Meanwhile, the complete image is directly input into the global branch to capture overall icing-related features. The global branch feature extraction network utilizes EfficientNet-B3 (Tan and Le, 2019) with a transfer learning setting. EfficientNet-B3 achieves a balance between model size and feature extraction capability, ensuring effective feature extraction without excessive computational resource consumption. To adapt to the transmission line icing scenario, the ResSepNet global branch enhances EfficientNet-B3 by incorporating an adaptive output layer. This layer primarily consists of a global average pooling (GAP) layer, a squeeze-and-excitation (SE) module (Hu et al., 2018), a 1 × 1 convolutional layer, a LeakyReLU activation function, and a fully connected (FC) output layer.
After extracting features from the background branch, icing branch, and global branch, ResSepNet normalizes and sums the ice-covered features output by the three branches to mitigate amplitude differences among features from different branches. This process is mathematically represented by Eq. (1):
where ∥f∥ denotes the L2 norm of the feature vector, and fbg, fice, and fmain represent the output features of the background branch, icing branch, and global branch, respectively. fmixed represents the final multi-branch fusion output feature, which serves as the icing type recognition result of the transmission line, including ice-free, glaze, rime, and mixed rime.
2.2 MOMSA-SegNet
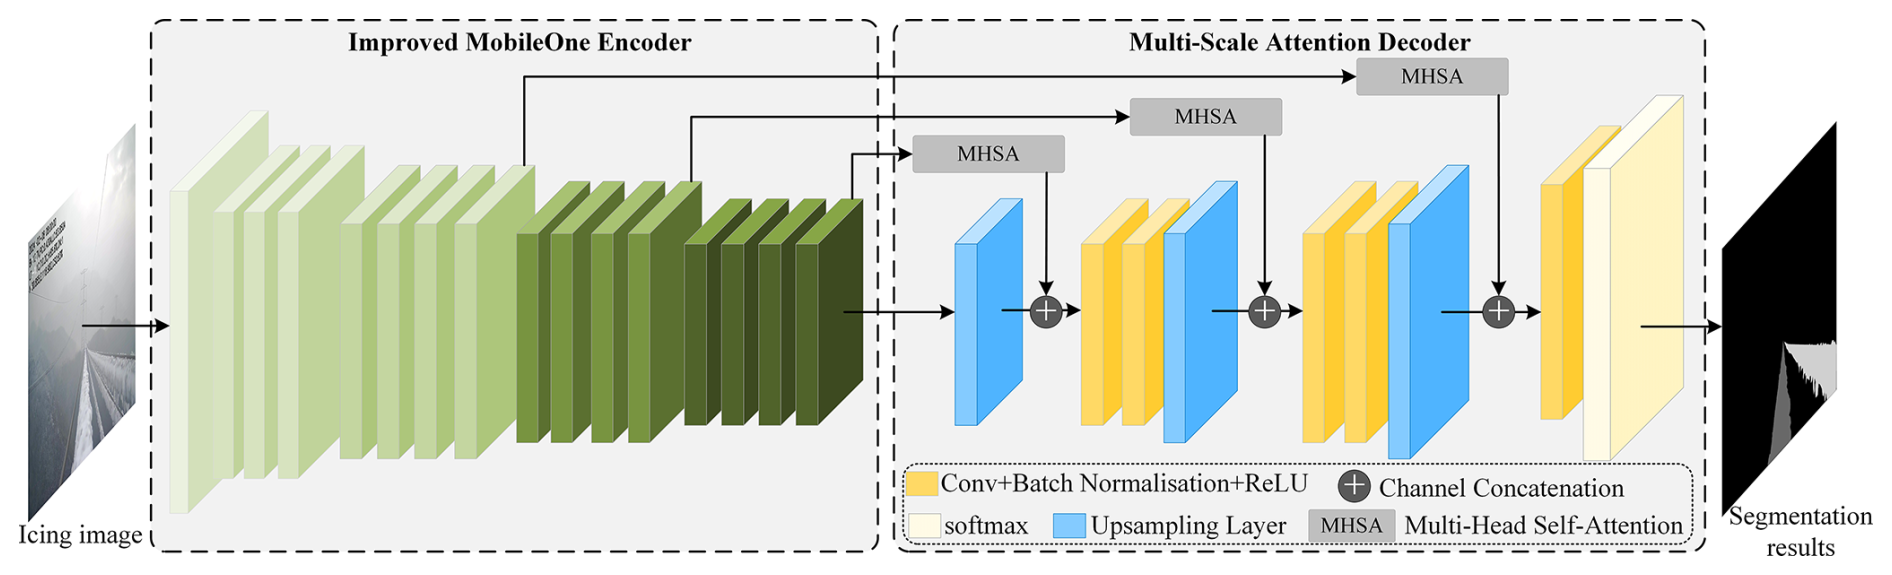
The icing region segmentation module, MOMSA-SegNet, employs the improved MobileOne (Vasu et al., 2023) model as its encoder and incorporates a multi-scale skip connection structure in the decoder. This design forms a semantic segmentation network with a large encoder-small decoder architecture, enabling precise segmentation of the ice-covered regions on transmission lines. The module structure is illustrated in Fig. 4.
To address the issue of information loss resulting from a single perspective, which can reduce ice thickness detection accuracy, MOMSA-SegNet segments the transmission lines from both the main and side perspectives in the raw icing image. This segmentation leverages the multi-split transmission line structure to capture ice information more comprehensively. The definitions of the main perspective line and side perspective line in the raw icing image are illustrated in Fig. 5.
2.2.1 Improved MobileOne Encoder
MobileOne employs a re-parameterized convolutional structure, enabling complex branched architectures to be transformed into a single efficient convolutional operation during inference. This significantly reduces computational overhead and inference latency. Furthermore, MobileOne is designed with hardware adaptability in mind, ensuring efficient execution on low-power devices. This feature is particularly crucial for edge devices, such as pole tower ice monitoring systems, where model deployment is required. Moreover, the convolutional structure of the MobileOne model exhibits strong capability in capturing local details, making it well-suited for the fine segmentation of ice-covered regions. Given the complexity of ice-covered images of power transmission lines – caused by factors such as lighting variations, haze, and background clutter – this study enhances the original MobileOne by enlarging the dilation rate in its feature encoding module to expand the receptive field (see the left side of Fig. 4). Additionally, multi-scale features are extracted from multiple intermediate layers. By integrating a multi-head attention mechanism, a multi-scale skip connection structure is designed to provide the decoder with contextual spatial features at different scales, thereby enhancing segmentation accuracy in complex ice-covered scenarios.
2.2.2 Multi-scale Attention Decoder
The multi-scale attention decoder primarily consists of multiple multi-head self-attention (MHSA) sub-modules, convolutional layers, and upsampling layers. It extracts feature maps from various intermediate layers of the improved MobileOne encoder, as illustrated in Fig. 4. Each feature map is first processed by an MHSA sub-module, after which the self-attention output features are concatenated with the corresponding decoder layer at the same feature scale, thereby forming the multi-scale attention decoder structure. The architecture of the MHSA sub-module is depicted in Fig. 6.
The detailed feature processing procedure of the MHSA sub-module can be expressed by Eq. (2):
where output represents the output feature, while X denotes the input feature, which undergoes a linear transformation to obtain the query (Q), key (K), and value (V) matrices. Q, K, and V are divided into h heads, with each head having its own transformation parameters Qi, Ki, Vi. The attention weight matrix is computed using function softmax, where serves as a scaling factor to prevent gradient vanishing. The attention weight matrix is then multiplied by Vi to obtain the output for each head, denoted as . Subsequently, the attention outputs of all heads are concatenated using function Concat, followed by a linear transformation Wo that remaps the transformed features back to the original feature space. To further enhance local feature extraction, MHSA applies an additional convolutional layer (Conv) after the linear transformation, reinforcing the model's capability to extract fine-grained local features.
The multi-scale attention decoder integrates the features from each MHSA output with the original input X through multiple residual structures. This approach preserves the original input information, enhances the model's capability to extract contextual features, and improves its overall stability.
2.3 Ice Thickness Optimized Calculation Module
The dual-task learning framework proposed in this paper simultaneously outputs both ice type and ice thickness. The output of the ice coating recognition module serves not only as a final result but also as a key input for ice thickness estimation. The ice thickness optimized calculation module first performs an initial ice thickness estimation based on the identified ice type and segmentation results. Subsequently, key meteorological data are incorporated to refine the calculation, yielding an optimized ice thickness. Given that actual ice accumulation on transmission lines is typically uneven and irregularly shaped, the equivalent ice-cover thickness is adopted as the final representation in the calculation.
In the preliminary estimation of ice thickness, it is essential to determine the major and minor axes of the ice-covered cross-section. First, the pixel area of the ice-covered region in both the main view and side view of the original ice image is obtained based on the segmentation results from MOMSA-SegNet. Given the known wire diameter, the major and minor axes of the ice-covered cross-section can be estimated by comparing the pixel area of the bare wire in the same transmission line under an ice-free condition. The parameters of the ice-covered cross-section are illustrated in Fig. 7, where d represents the bare wire diameter, and a and b denote the major and minor axes of the ice-covered cross-section, respectively.
Based on the icing-type recognition results from the ice coating recognition module, the corresponding icing density can be determined. Subsequently, the icing density is combined with the major and minor axes of the icing cross-section to perform an initial estimation of the equivalent ice cover thickness.
2.3.1 Calculation of Equivalent Ice Cover Thickness
According to the layout specifications of overhead transmission lines, the main view line and the side view line are positioned on the same horizontal plane. Therefore, the major and minor diameters can be determined by analyzing the icing conditions of both lines.
The calculation of the major diameter a is given by Eq. (3):
where S(x,y) denotes the pixel value at coordinate (x,y) in the segmentation result generated by MOMSA-SegNet. represents the total number of pixels in the segmented ice-covered area, while denotes the total number of pixels in the bare wire area without ice. The minor axis b can be computed using the same approach.
Based on the ice type identification result, the corresponding ice density ρ (Li et al., 2016) is determined. According to Eq. (4), the irregular ice cross-section can be approximated as a regular circular cross-section with an equivalent area, enabling the calculation of the equivalent ice thickness T.
2.3.2 Optimization Calculation of Ice Thickness
Due to factors such as the placement of the ice monitoring device, the shooting angle, and variations in ambient light intensity, ice thickness estimates derived solely from ice images often exhibit certain errors. To address this issue, this study incorporates meteorological data in addition to ice images, leveraging key surrounding meteorological factors to refine and optimize the initial ice thickness calculations. This approach ensures greater alignment with the actual freezing conditions and enhances the overall robustness of the algorithm.
This study maps the latitude, longitude, and image capture time recorded by the ice-monitoring device to the corresponding ERA5 meteorological data. This mapping enables the extraction of key environmental factors, including temperature T (°C), relative humidity H (%), wind speed V (m s−1), and precipitation P (mm h−1) (Xu et al., 2023), for each ice image. To refine ice-thickness estimation, a key meteorological correction factor is constructed using the Gradient Boosting Decision Trees (GBDT) algorithm and is parameterized as shown in Eq. (5):
where α, β, γ and δ are correction parameters. (−αT) indicates that an increase in temperature leads to a decrease in ice cover, (1+βH)indicates that ice coverage increases with increasing humidity, (1−γV) signifies that high wind speed may result in a decrease in ice cover, and (1+δP) indicates that higher precipitation leads to greater ice thickness.
The correction parameters in Eq. (5) are determined using the GBDT algorithm. The environmental meteorological factors are used as input features, with the optimized ice thickness value serving as the output target variable. The input feature set and the target variable set Ytrue are constructed. After normalizing the input feature set W, the GBDT regression model is built, and Ytrue is fitted. Assuming that the model's prediction value F0(w) is the mean value of the target variable, the pseudo residual value during the mth iterative optimization process of the regression model can be expressed by Eq. (6):
where N denotes the total number of samples and L represents the MSE loss function.
The pseudo residual value is used as the target variable to fit the decision tree and obtain the regression tree h(w). The model update is expressed as:
where ξ represents the learning rate, and h(w) denotes the output of the mth regression tree. After training, the optimized prediction model is obtained, and each correction parameter can be determined using Eq. (8):
where represents the sensitivity of the model prediction to the key meteorological factors. The model hyperparameters are adjusted based on accuracy requirements, and the correction process is iteratively optimized to obtain the final key meteorological factor correction parameters. The optimized result for the equivalent ice thickness Tf is given by Eq. (9):
This paper constructs a dataset using raw icing images provided by the power grid and conducts performance validation experiments on ice coating recognition and ice thickness detection algorithms. The experimental work primarily involves constructing datasets for ice-coating recognition and icing-region segmentation, training and testing models on these datasets, evaluating model performance, and conducting comparative analyses with existing methods. The experiments were conducted on a Windows 11 operating system equipped with an NVIDIA GeForce RTX 3090 GPU and 24 GB of memory. The proposed model was developed and tested using the PyTorch framework, and all related experiments were then conducted accordingly.
3.1 Experimental Plan and Evaluation Indicators
To evaluate the effectiveness of the proposed method, experiments were conducted on ice coating recognition, ice region segmentation, and ice thickness detection. The experimental plan includes: (1) Ablation studies to assess the contribution of each branch in the ice coating recognition model, ResSepNet. (2) Performance comparison of ResSepNet with other mainstream classification models for ice type recognition. (3) Segmentation performance comparison between MOMSA-SegNet and other advanced segmentation models. (4) Transmission line icing state detection in real-world scenarios using the proposed DTL-IceNet model.
To facilitate model training and testing for ice coating recognition and ice thickness detection, this paper utilizes ice monitoring images captured by ice-viewing devices deployed in the power grid. Corresponding datasets are constructed for the ice-coating recognition and ice-thickness detection tasks to meet the training, validation, and testing requirements of the proposed algorithm.
For the ice type recognition experiment, this paper primarily evaluates and compares model performance using classification accuracy, precision, recall, F1-score, and confusion matrices. The calculation formulas for each metric are as follows:
where TP denotes the number of samples correctly classified as positive, TN denotes the number of samples correctly classified as negative, FP denotes the number of samples incorrectly classified as positive, and FN denotes the number of samples incorrectly classified as negative.
For the icing region segmentation experiment, this paper primarily employs intersection over union (IoU), mean IoU (MIoU), and mean pixel accuracy (mPA) to assess and compare the segmentation performance of the model. The formulas for each metric are as follows:
where A represents the predicted target area, B represents the actual target area, A∩B denotes the overlapping area between the two, A∪B denotes their total coverage area, Pi represents the number of correctly classified pixels for category i, and Ti represents the total number of actual pixels in category i.
3.2 Dataset
For the tasks of ice coating recognition and icing region segmentation, this paper constructs two datasets. The ice coating recognition task focuses on classifying different types of icing on transmission lines. Therefore, a diverse set of icing samples, including ice-free, glaze, rime, and mixed rime, was selected from a large collection of original transmission line icing images. During the data preprocessing stage, manual labeling was employed to classify each sample, ensuring label accuracy and consistency. Subsequently, data cleaning is performed to remove blurry, abnormally captured, or incomplete images, retaining only clear and representative ice-covered samples. Finally, an ice coating recognition dataset, IceType, consisting of 20 684 images, was constructed and divided into a training set, test set, and validation set in a 6 : 2 : 2 ratio.
The ice thickness detection task is primarily accomplished through semantic segmentation, focusing on pixel-level recognition of ice-covered and background areas in transmission line images. Based on the raw icing images, this study manually selects high-quality images with clearly distinguishable ice-covered regions. Subsequently, the ImageLabeler tool in Matlab is used to label the ice-covered areas pixel by pixel, ensuring that each pixel's category label accurately corresponds to either the ice-covered region or the background. Meanwhile, considering the fixed shooting angle characteristics of the ice-viewing device, the ice-covered images underwent appropriate preprocessing and cropping. To enhance data volume and enrich sample distribution, random flipping was applied. Ultimately, an ice-covered region segmentation dataset, IceSeg, containing 6360 pixel-level annotations, was constructed and split into training, test, and validation sets in a 7 : 2 : 1 ratio.
3.3 Ice Type Identification Experiment
3.3.1 ResSepNet Branch Ablation Experiment
In ResSepNet, the ice type recognition task is achieved through the collaborative efforts of the background branch, icing branch, and global branch. The background branch preprocesses the original image to extract the background subgraph, focusing on capturing environmental features in the image while minimizing the interference of background noise. The icing branch, on the other hand, specializes in extracting features of the icing on the transmission line. It uses a structure similar to that of the background branch but places greater emphasis on capturing the details and texture information of the icing area. The global branch directly inputs the entire image, utilizing EfficientNet-B3 as the backbone network to extract macro features from the full image and capture global context information through a transfer learning model. The design of these three branches aims to capture both local and global information at different spatial scales by performing feature extraction in different regions, thereby effectively reducing the influence of background noise and improving the accuracy of ice type recognition. By normalizing and fusing the features extracted from the different branches, ResSepNet can fully leverage the spatial scale information extracted by each branch, ultimately leading to more accurate ice type recognition results.
Figure 8(a) Validation accuracy and (b) validation loss. Performance of each branch of ResSepNet.
To evaluate the performance of each branch in ResSepNet, this study conducts a controlled experiment comparing ResSepNet with its individual branches on the IceType dataset. The accuracy and loss variation curves of ResSepNet and its branches on the IceType validation set are illustrated in Fig. 8.
As shown in Fig. 8, the background branch alone yields suboptimal ice type recognition performance, achieving an accuracy of only 86.55 %. The icing branch improves recognition accuracy to 89.82 %; however, it remains insufficient due to the omission of environmental factors. ResSepNet, which integrates the background, icing, and global branches, comprehensively accounts for both environmental influences and transmission line icing characteristics, ultimately achieving a recognition accuracy of 95.23 %.
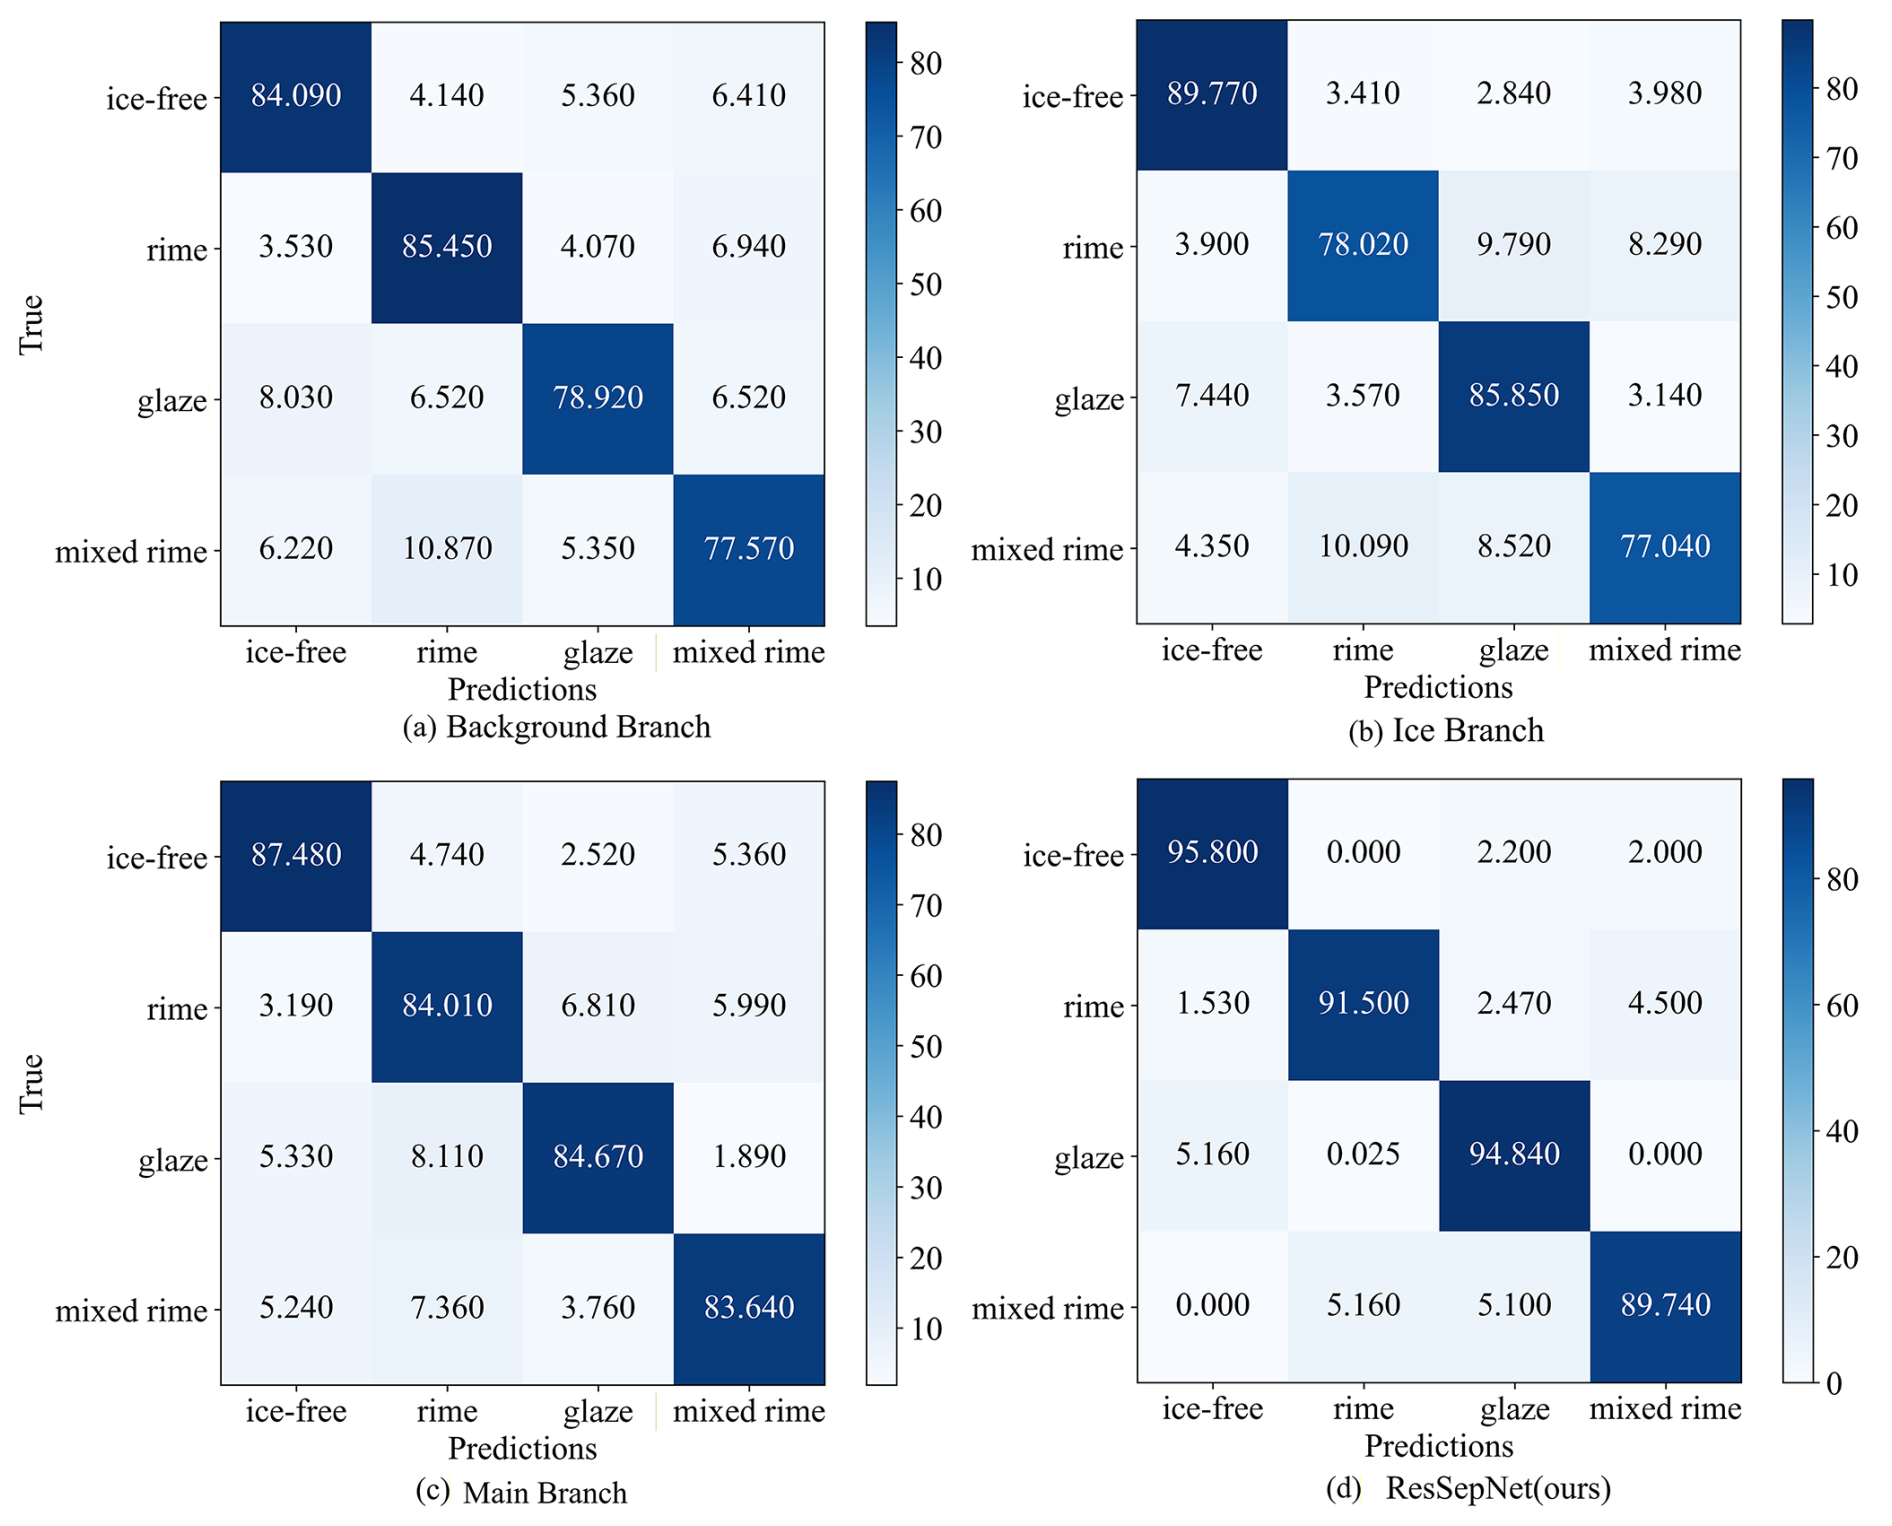
To more clearly illustrate the performance contribution of each branch across different ice types, the confusion matrix for ice type recognition on the IceType test set is presented in Fig. 9.
For the results in Fig. 9, five independent experimental runs were conducted and the average values were reported to ensure data stability and reliability. All runs used the same training and test datasets and were performed under identical hardware conditions to guarantee consistency. Thus, the confusion matrix in Fig. 9 represents the averaged results with minimal variation, indicating high model stability across repeated experiments. Based on the confusion matrix, it can be observed that the recognition accuracy of each branch, including ResSepNet, is lower for mixed rime than for the other ice types. This is attributed to the complex morphology of mixed rime. Nevertheless, ResSepNet still achieves a high recognition accuracy of 89.74 % for this type. This is because ResSepNet simultaneously extracts multi-scale features from the background area, ice-covered area, and the entire image, enabling a more comprehensive capture of image information. The background branch demonstrates superior rime recognition compared to other branches due to the distinct color differentiation of this type. The icing branch excels in recognizing bare wire (ice-free) since the morphology of the wire in this category exhibits more significant differences. The global branch maintains a more balanced recognition across various types, as it does not specifically extract local area features. This also compensates for the limitations of the background branch and icing branch in recognizing mixed rime and other complex types. Overall, ResSepNet achieves outstanding performance in ice type recognition, attaining high accuracy, which confirms that the multi-branch design is well-structured and significantly enhances the recognition capability for ice-covered types.
3.3.2 Comparative Experiments with ResSepNet
To evaluate the ice coating recognition performance of ResSepNet, comparative experiments were conducted on the IceType dataset using mainstream models such as EfficientNet-V2 (Tan and Le, 2021), MobileNet-V3 (Howard et al., 2019), ResNeXt (Xie et al., 2017), and MobileOne (Vasu et al., 2023). The accuracy and loss curves for each model on the IceType validation set are presented in Fig. 10.
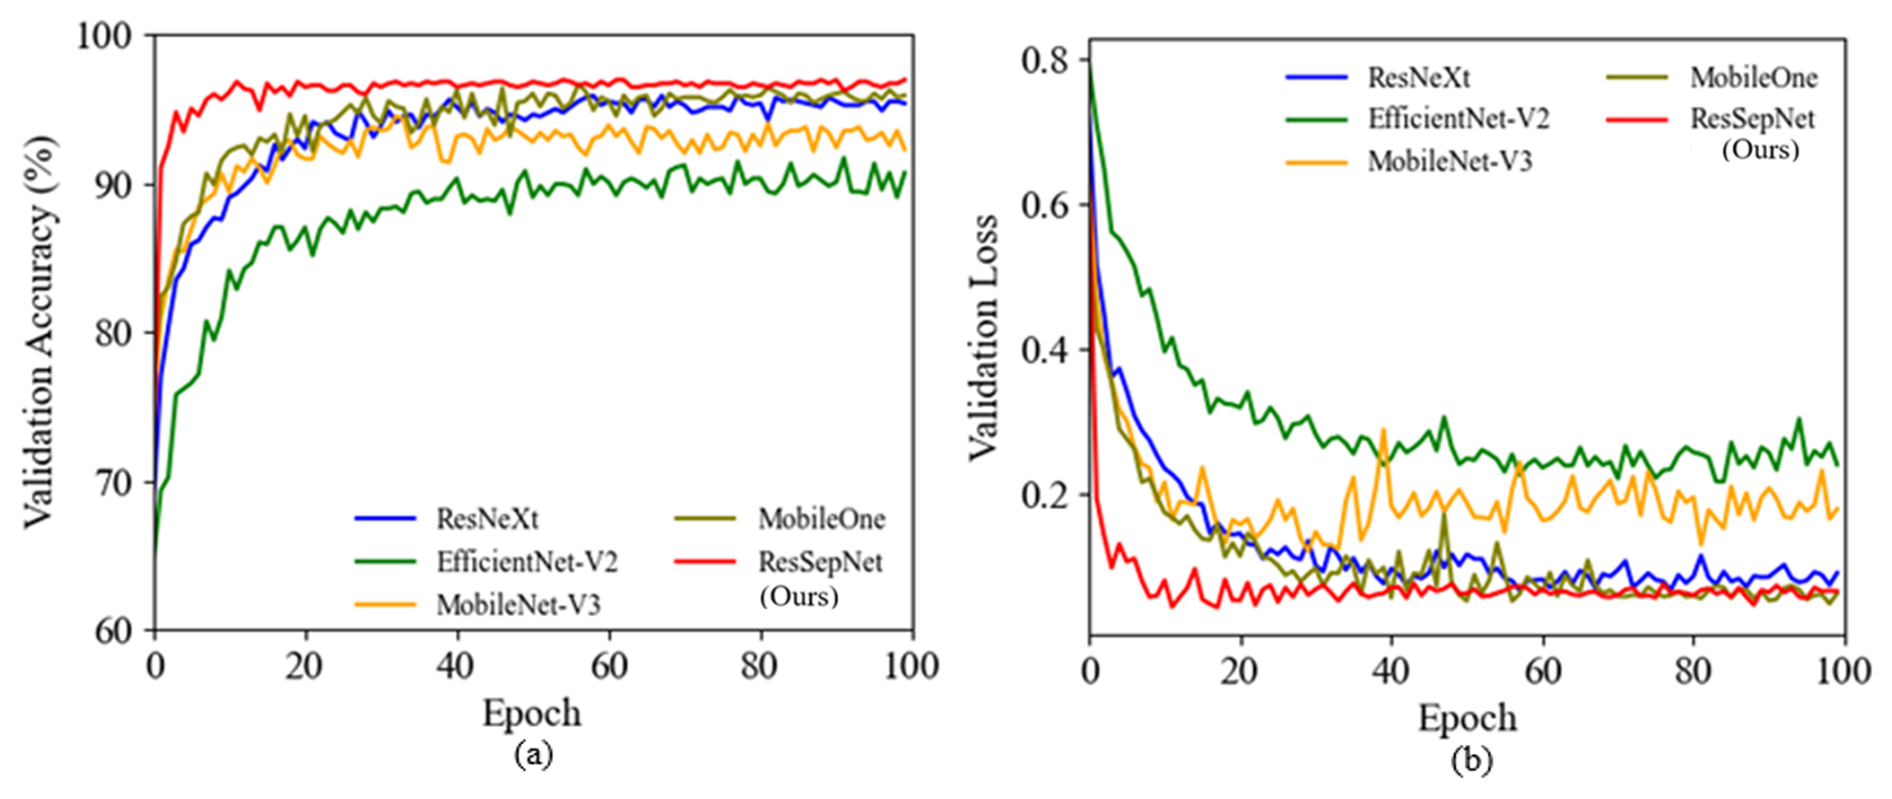
Figure 10(a) Validation accuracy and (b) validation loss. Performance comparison of various models.
As shown in Fig. 10, the ResSepNet model proposed in this paper not only achieves the highest accuracy but also demonstrates superior convergence speed and stability. This performance can be attributed to the model's lightweight and multi-branch structure, which allows it to maintain a compact size while ensuring rapid convergence. Additionally, the multi-branch design enables more comprehensive capture of the ice coverage information, reduces the impact of background noise, and enhances the overall recognition accuracy. The following section presents a comparison of various evaluation metrics for each model on the IceType test set, as shown in Fig. 11.
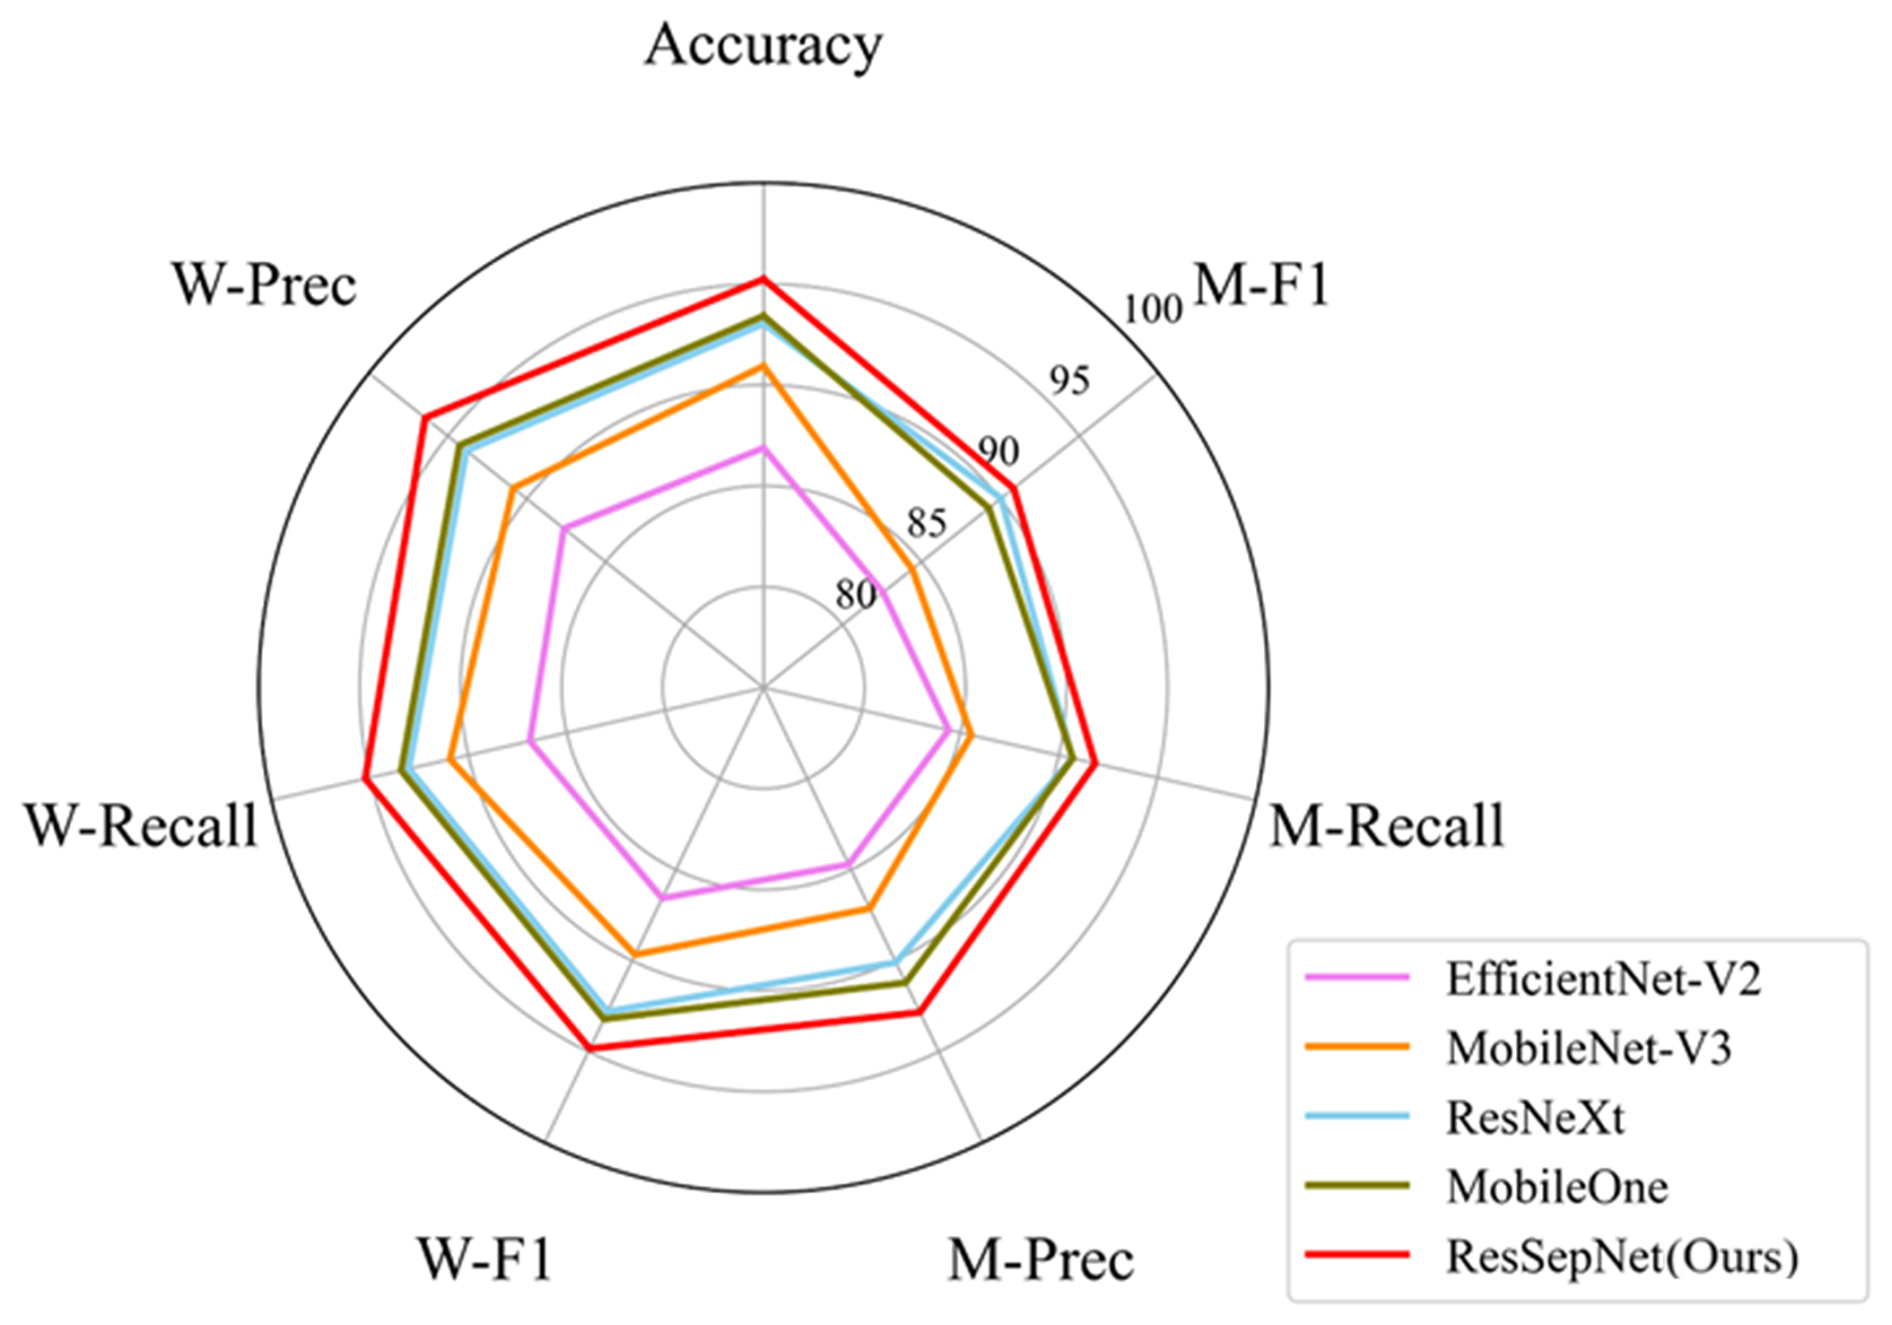
Table 1Comparison of icing type recognition performance of various recognition models.
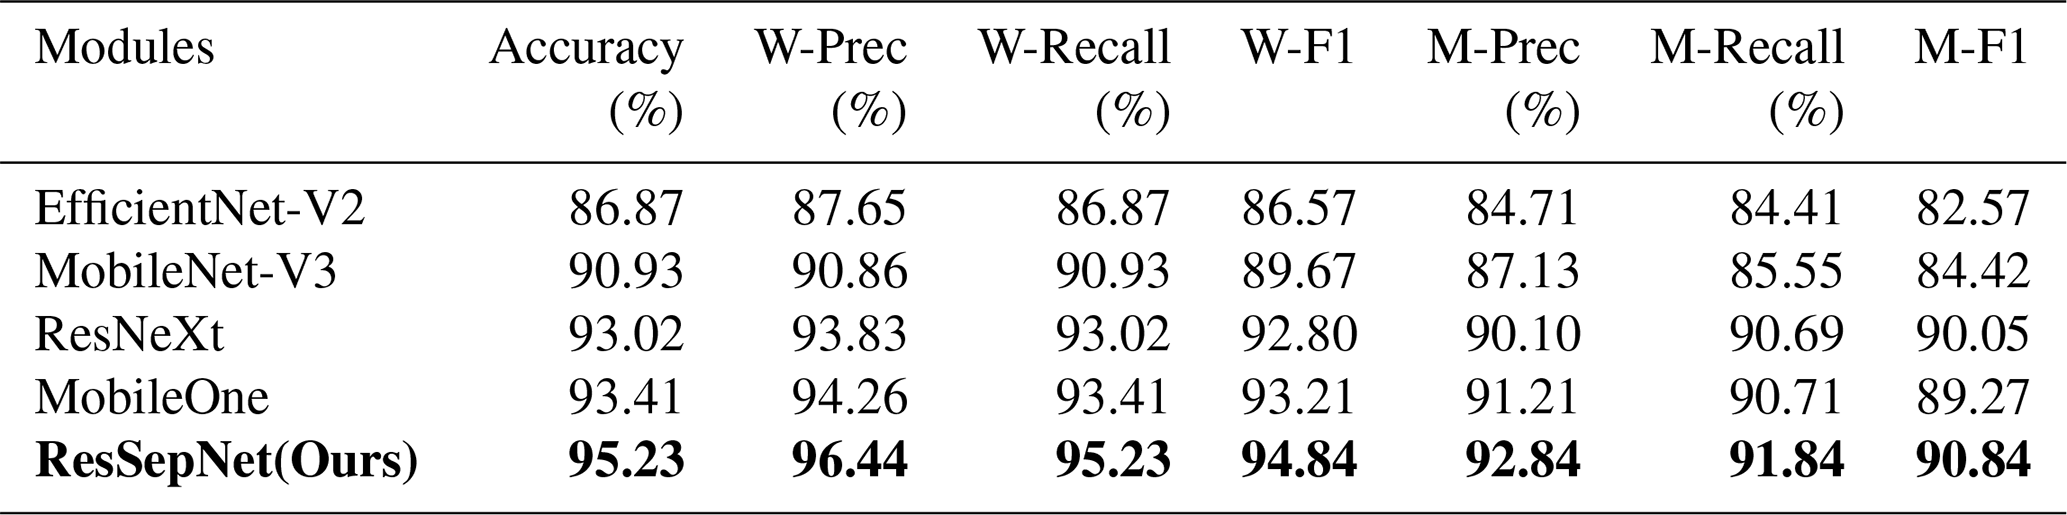
Note: bold font is the optimal value.
From the radar chart comparison results in Fig. 11, it is evident that the proposed ResSepNet outperforms other models in terms of accuracy, precision, recall, and F1-score. Compared with other methods, the proposed method achieves an average improvement of 4.17 % in accuracy, 4.79 % in weighted precision (W-Prec), 4.17 % in weighted recall (W-Recall), and 4.28 % in weighted F1-score (W-F1). Additionally, macro precision (M-Prec), macro recall (M-Recall), and macro F1-score (M-F1) exhibit average improvements of 4.55 %, 4 %, and 4.26 %, respectively. Combined with the results in Fig. 10, these findings demonstrate that ResSepNet consistently maintains superior performance in ice type recognition, both in terms of individual evaluation metrics and overall effectiveness. The specific values corresponding to Figs. 10 and 11 are presented in Table 1, where the bolded values indicate the best results.
3.4 Icing Region Segmentation Experiment
3.4.1 Segmentation Effects in Different Scenarios
Since the accuracy of ice thickness calculation is directly influenced by the segmentation results of the icing region, this study evaluates the performance of the proposed icing region area segmentation module under various environmental conditions. To this end, segmentation tests were conducted in representative scenarios, including sunny days, heavy fog, and nighttime. The results are presented in Fig. 12, where the red regions indicate the segmentation results for the main view line, while the yellow regions represent those for the side view line.

As illustrated in Fig. 12, the proposed icing region segmentation module, MOMSA-SegNet, effectively segments both the main view line and the side view line across different environmental conditions, including sunny days, foggy conditions, and nighttime. These results demonstrate that the proposed segmentation method can reliably meet the requirements for ice thickness calculation.
3.4.2 Comparison of Segmentation Performance of Different Models
To further evaluate the segmentation performance of the proposed MOMSA-SegNet, classic models such as UNet++ (Zhou et al., 2018), SegNet (Badrinarayanan et al., 2017), and DySample (Lin et al., 2017) were trained on the IceSeg dataset and compared with MOMSA-SegNet on the test set. The evaluation primarily focused on key metrics, including the Intersection over Union (IoU) for the main view, side view, and background, as well as the mean IoU (MIoU) and mean Pixel Accuracy (mPA). The comparative results are presented in Table 2.
Table 2Comparison of segmentation performance of different models.
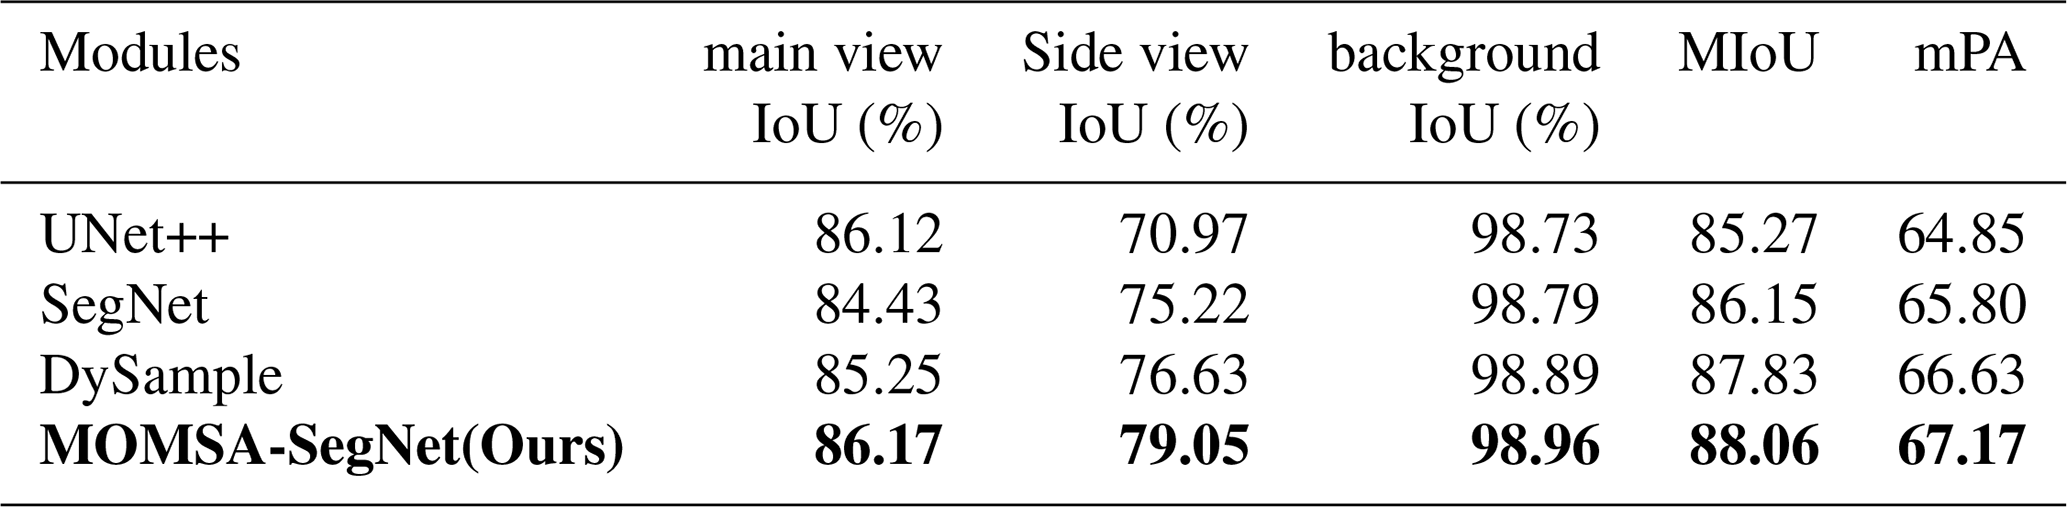
Note: bold font is the optimal value.
From Table 2, it can be observed that although the performance differences among the models are relatively small, MOMSA-SegNet achieves the highest scores across all evaluation metrics. Specifically, compared to other models, the proposed method improves the IoU of the main view and side view by 0.9 % and 4.78 %, respectively. Additionally, it enhances background IoU by 0.16 %, while MIoU and mPA increase by 1.64 % and 1.41 %, respectively. These results highlight the superior segmentation performance of MOMSA-SegNet across different scenarios. The comparative segmentation results of each model on the IceSeg test set are illustrated in Fig. 13.
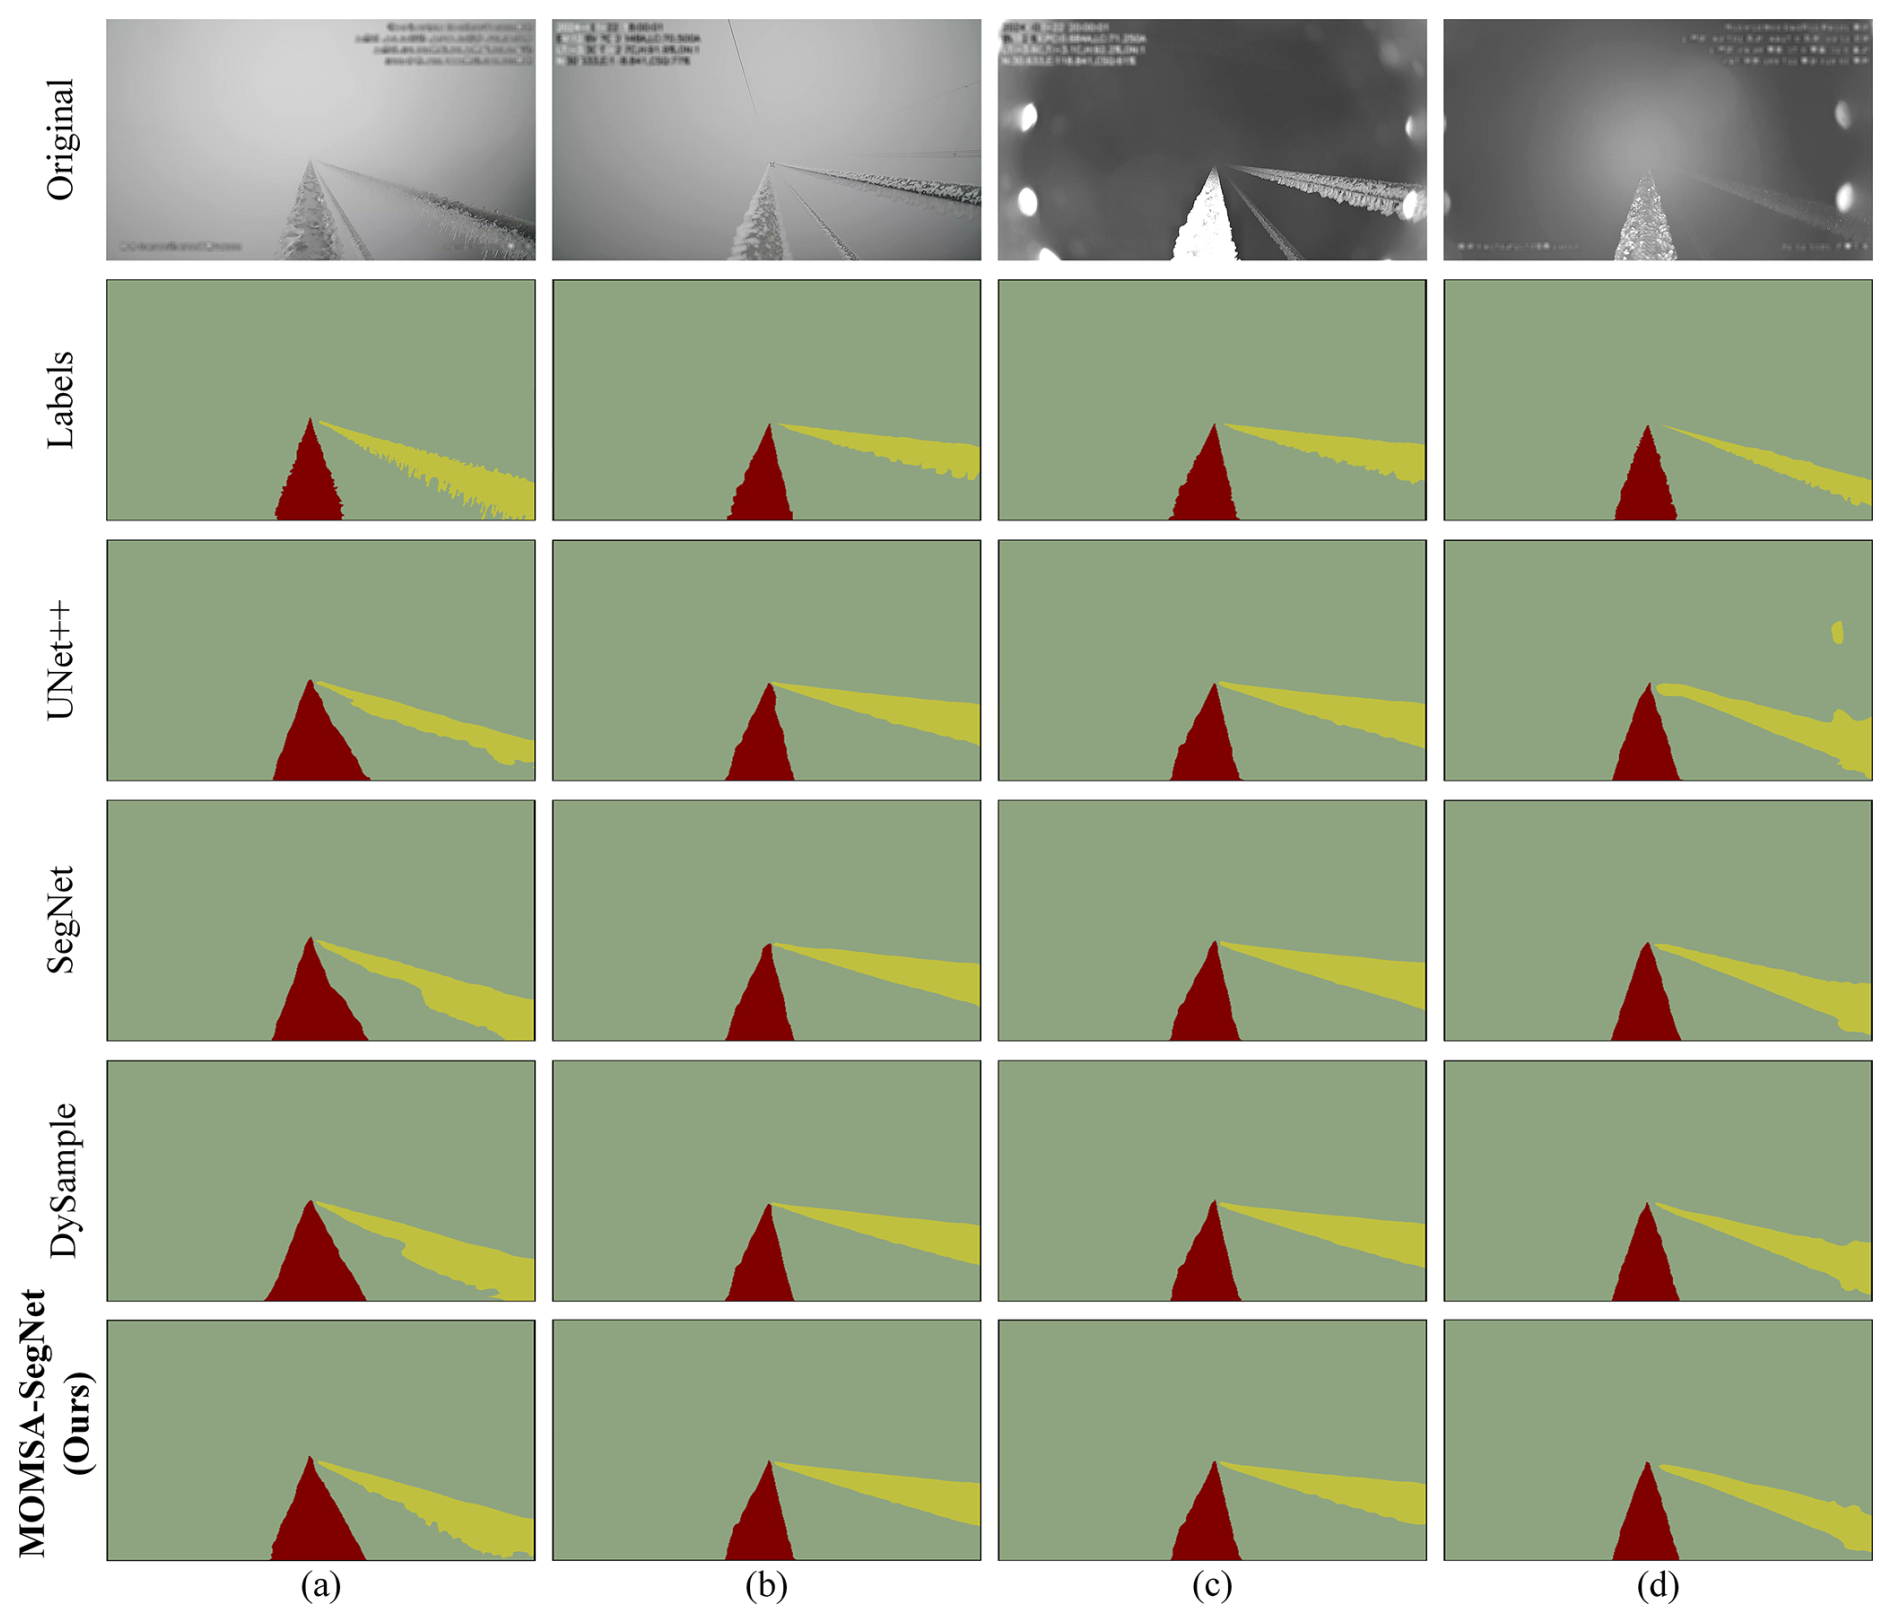
Figure 13Comparison of segmentation performance across different models. (a) Segmentation result under daytime conditions (first image), (b) Segmentation result under daytime conditions (second image), (c) Segmentation result under nighttime conditions (first image), and (d) Segmentation result under nighttime conditions (second image).
Figure 13 intuitively demonstrates that the segmentation performance of each model on the main view line exhibits minimal differences. However, under the influence of factors such as fog and ambient light, the segmentation results for the side view line vary significantly among models. Notably, the proposed MOMSA-SegNet achieves superior segmentation performance on the side view line and demonstrates the best overall performance. This can be attributed to its skip-connection structure and multi-scale attention mechanism, which effectively capture the characteristics of different view lines and provide precise support for subsequent ice thickness calculations.
3.5 Ice Thickness Detection Experiment
3.5.1 Overall Thickness Detection Performance of the Observation Field
To verify the accuracy of the final ice thickness measurement, a simple pole tower and conductor device were constructed at the experimental site of Nanjing University of Information Science and Technology. This setup simulated actual transmission line icing conditions in a natural environment. Using an ice viewing device, a small transmission line ice thickness dataset was created, covering ice thickness levels ranging from 0 to 30 mm, with a bare wire diameter of 33.8 mm. To approximate the shooting angle of real ice monitoring equipment, pixel expansion processing was applied to the original images, followed by annotation of the ice-covered areas. The results are shown in Fig. 14. Due to site conditions, no side view line was included. The performance of the proposed model was validated using the thickness dataset.
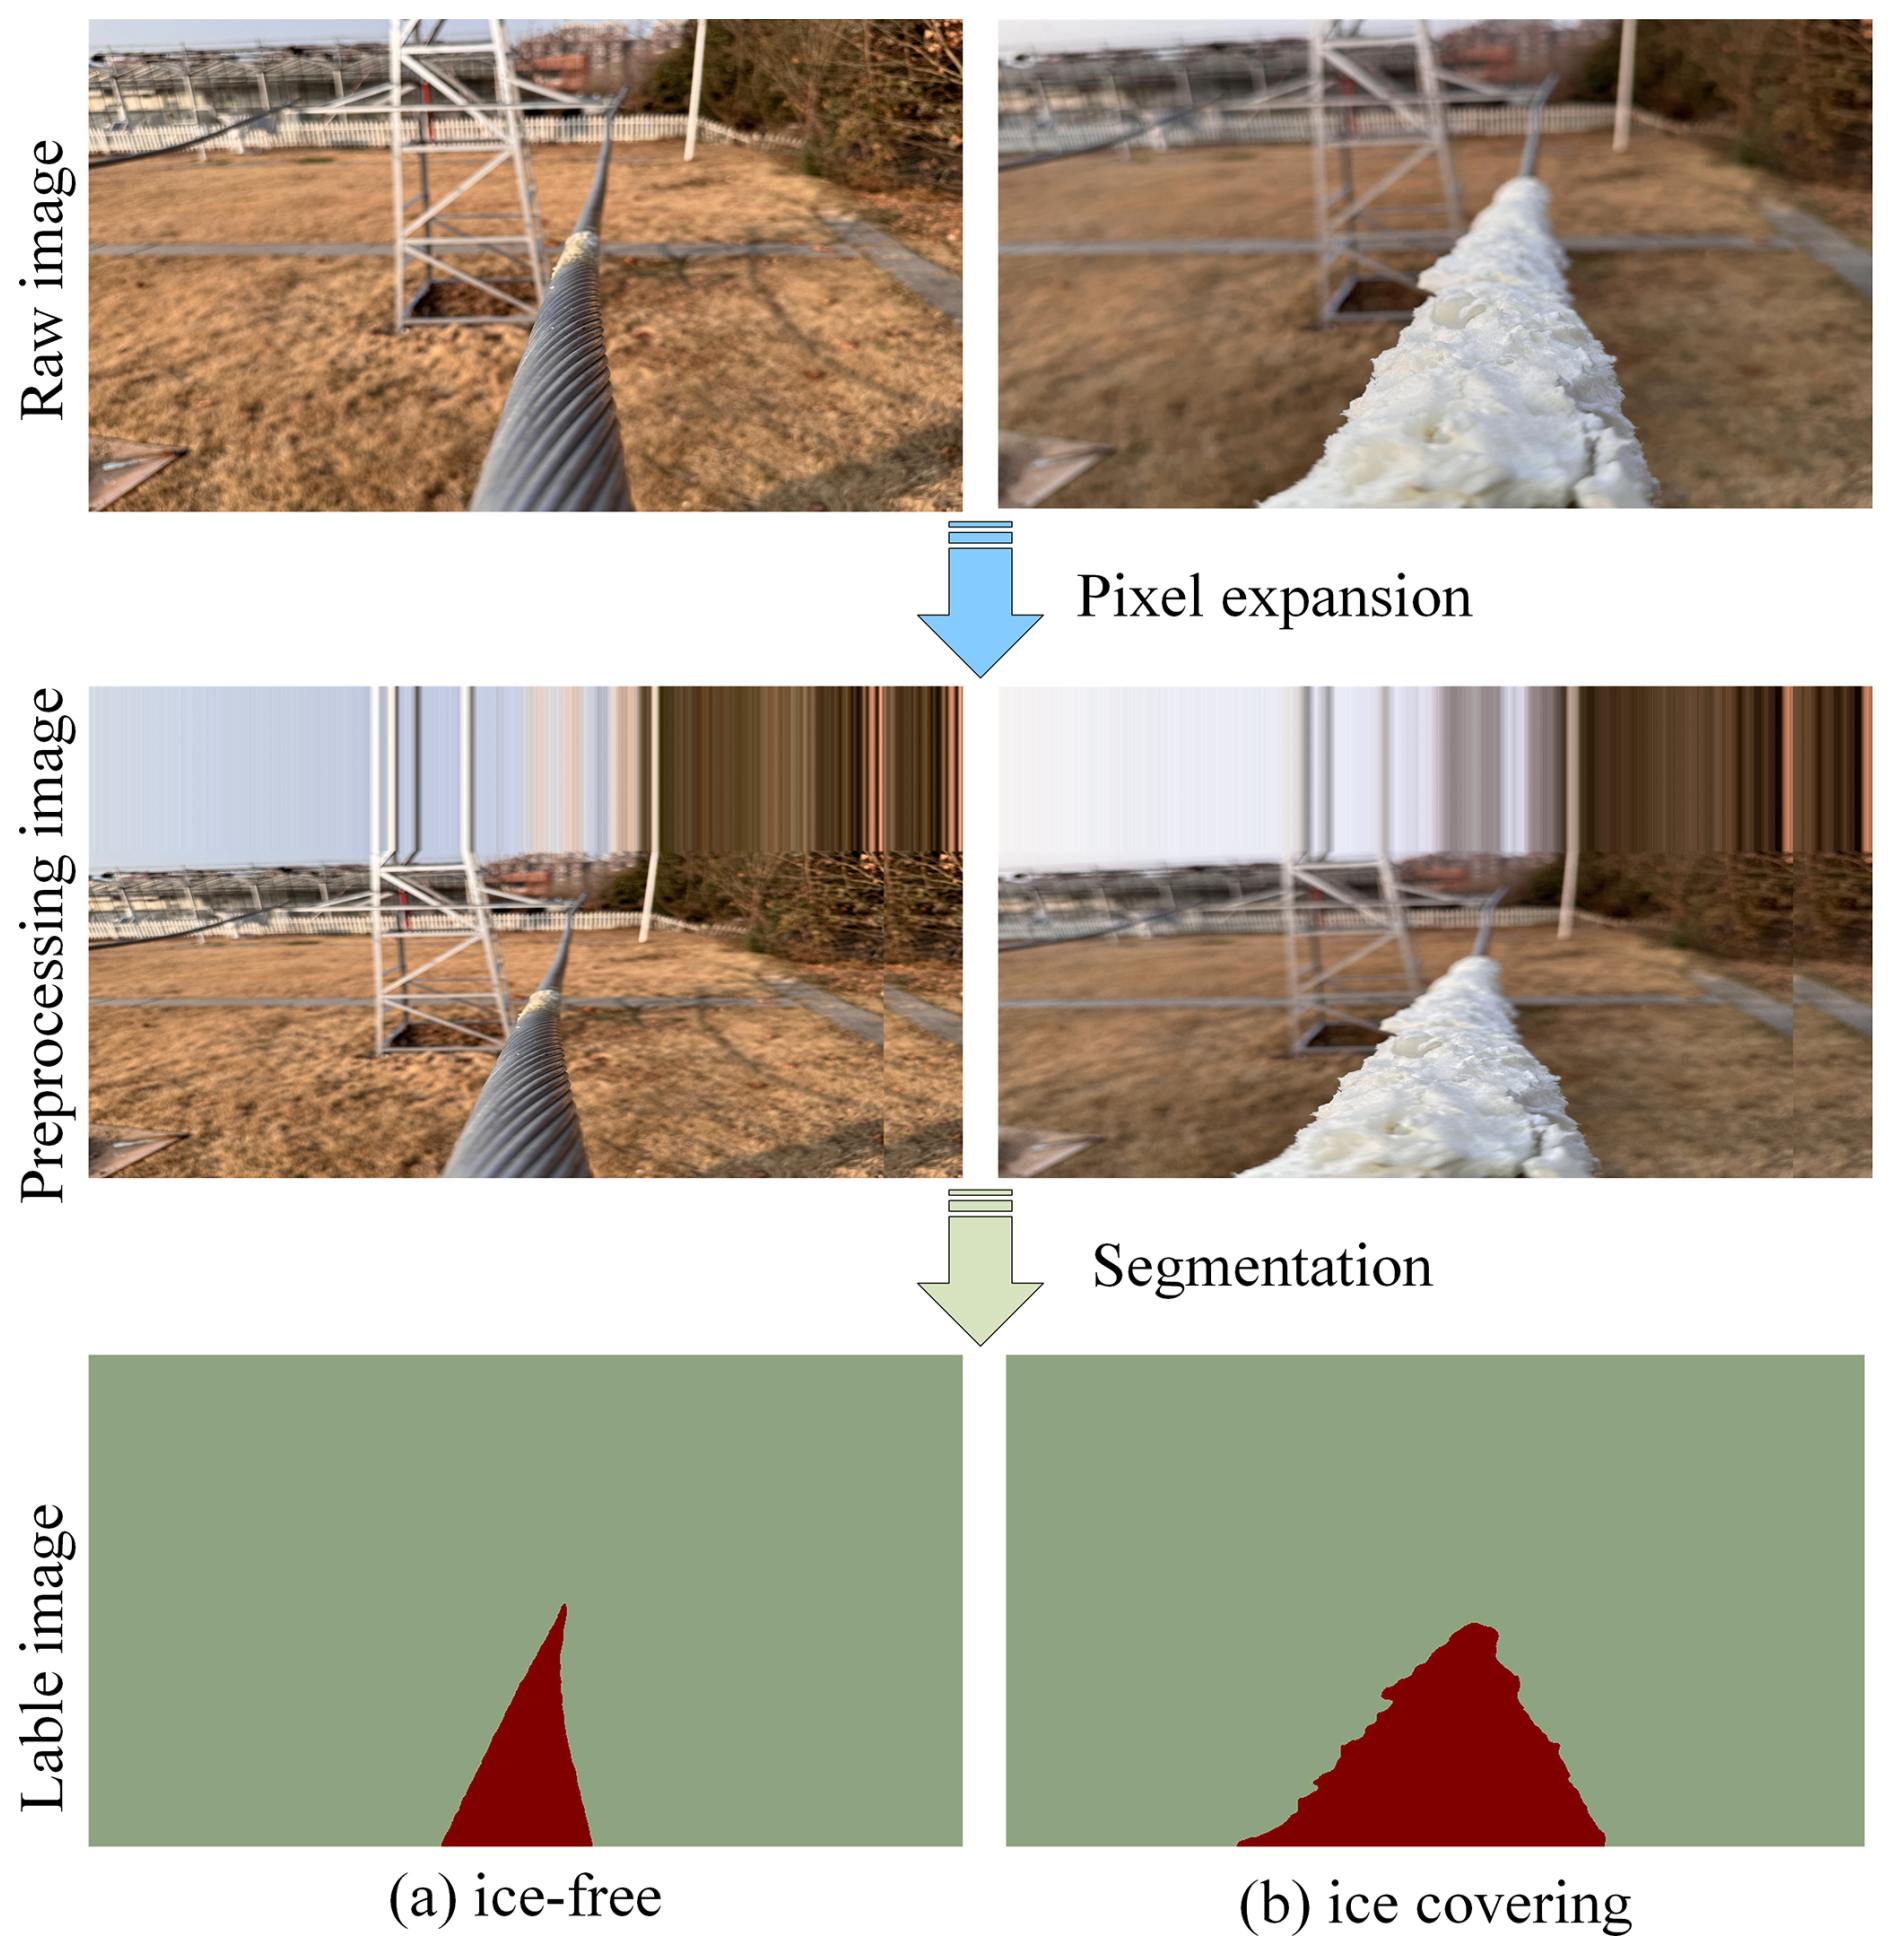
Figure 14The segmentation effect of the ice-covered image of the simulated transmission line at the experimental site.
Table 3Comparison between measured values and actual values.
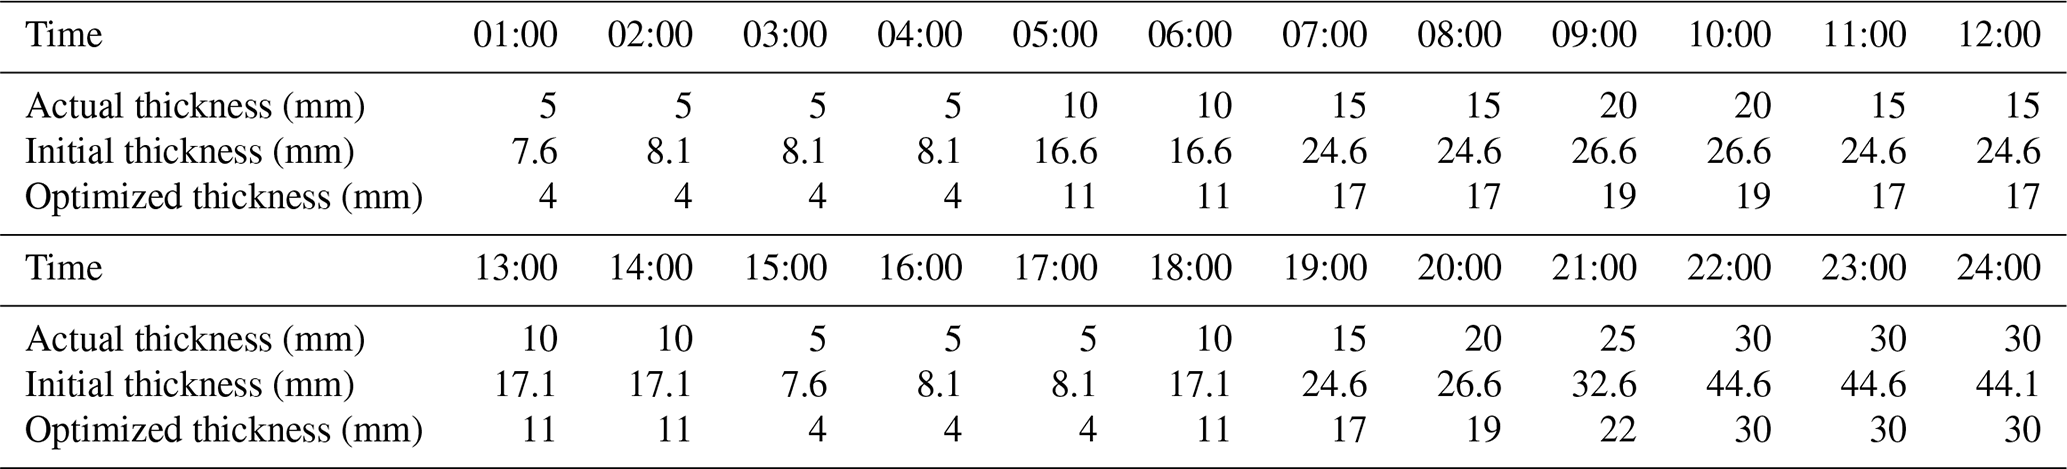
Note: The two lines of time represent the 12 h before and after a day.
Based on the ice data collected from the observation field, we tracked the complete ice accumulation and variation process of the transmission line over a 24 h period. The ice thickness measurement results for this process are illustrated in Fig. 15, with detailed values presented in Table 3. In Fig. 15, dark blue represents the actual ice thickness, light blue denotes the optimized ice thickness estimated by the proposed model, and green indicates the initial ice thickness of the main (side) view line measured by the model. Given that the simulated ice cross-section is circular, the side view thickness is assumed to be equal to the main view thickness.
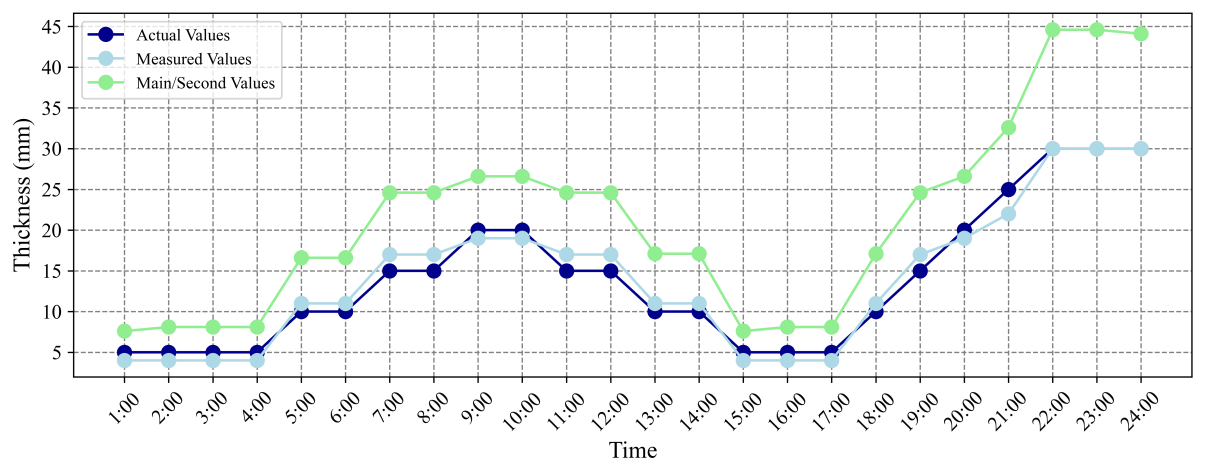
As shown in Fig. 15, both the initial and optimized thickness values align with the overall trend of the actual thickness, demonstrating that the proposed model can accurately capture the growth pattern of ice thickness. Moreover, the optimized thickness measurement is closer to the actual thickness, indicating that key meteorological data effectively refine the ice thickness estimation, yielding more accurate measurement results. To further evaluate the accuracy of the proposed method in detecting ice thickness, we compared the optimized and initial ice thickness measurements with the actual values. Additionally, we calculated key evaluation metrics, including the mean absolute percentage error (MAPE), Pearson correlation coefficient (PCC), and mean square error (MSE). The results are presented in Table 4.

As observed in Fig. 15 and Table 4, the optimized ice thickness calculated by the proposed model closely follows the actual values. The Pearson correlation coefficient reaches 0.99, indicating a strong correlation, while the measurement error remains minimal. The mean absolute percentage error is only 11.82 %, and the mean square error is as low as 1.83, demonstrating the model's high accuracy. These results confirm that the proposed method performs well in real-world scenarios and meets the practical application requirements.
3.5.2 Effect of Different Segmentation Models on Ice Thickness Detection
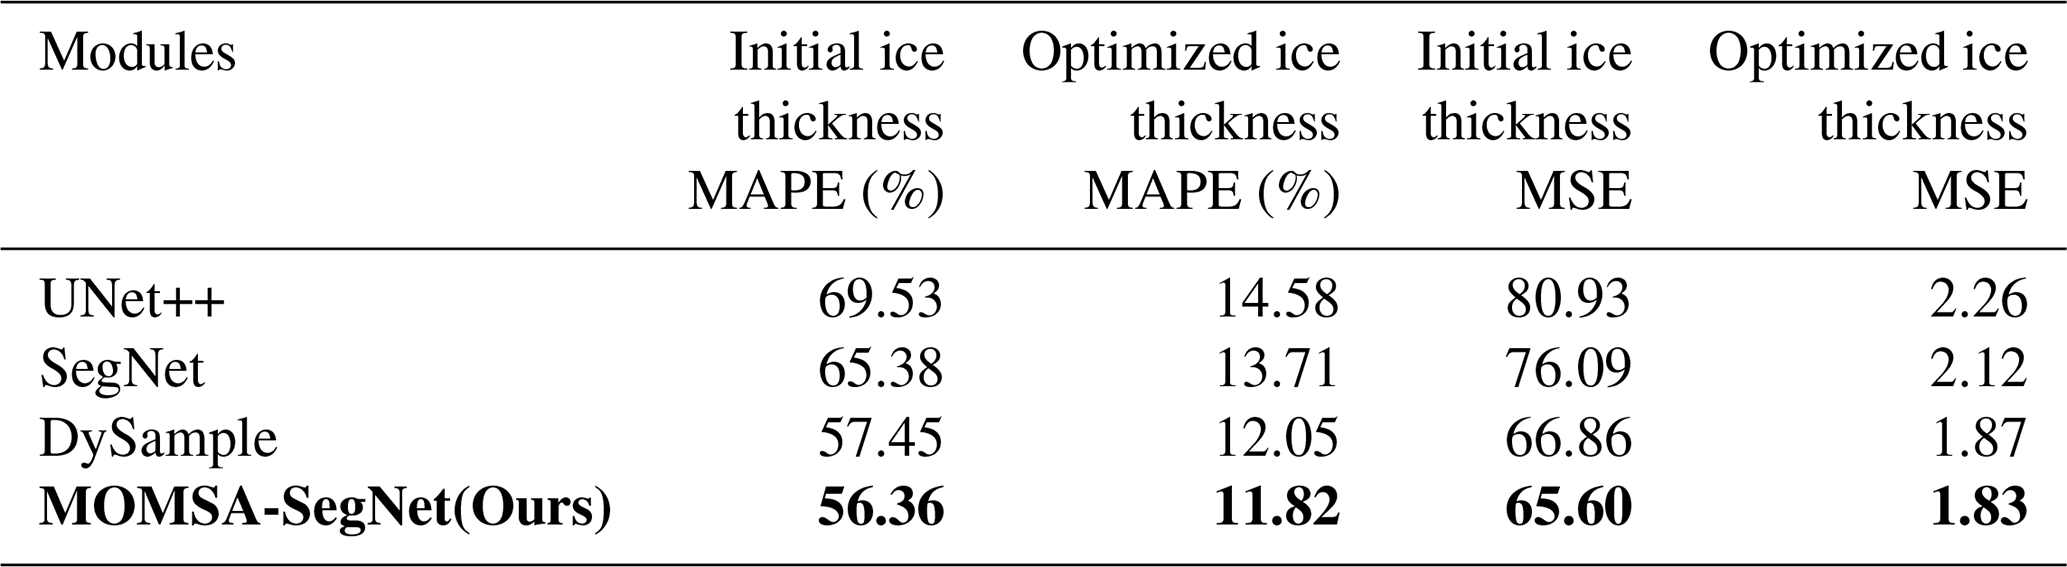
To quantitatively evaluate the impact of the segmentation module on the accuracy of final ice thickness estimation, this study, under the premise of maintaining consistency in the ice type recognition and thickness optimization calculation processes, uses UNet++, SegNet, DySample, and MOMSA-SegNet as the frontend segmentation models. The thickness estimation experiments were conducted on the same observation field test dataset. The ice type recognition module and thickness optimization calculation module were kept unchanged, and only the ice segmentation submodule was replaced with different typical methods. The initial thickness and optimized thickness errors were then computed on the corresponding observation field thickness test data. This approach allows a direct comparison of the effects of different segmentation models on geometric scale calculation and error propagation within a unified framework, providing a clearer insight into the structural relationship between segmentation quality and thickness detection accuracy. The experimental results are shown in Table 5.
Table 5Comparison of ice thickness detection performance driven by different segmentation models.
Note: bold font is the optimal value.
As seen in Table 5, under the same ice type recognition and meteorological correction processes, the performance of ice thickness detection shows a consistent trend with different segmentation models as frontend submodules. The better the segmentation performance, the lower the initial and optimized thickness errors. When MOMSA-SegNet, the segmentation model proposed in this paper, is used, both the MAPE and MSE of the initial thickness are the lowest. After replacing it with UNet++, SegNet, or DySample, both errors increase to varying degrees. This indicates that the segmentation stage directly affects the accuracy of the ice contour and area depiction, which in turn influences the downstream geometric parameter estimation. Segmentation errors accumulate and amplify in the calculation of equivalent ice thickness.
A further comparison of the initial and optimized thickness metrics reveals that after the introduction of meteorological correction, the MAPE and MSE for all models significantly decrease, showing that the environmental-driven correction terms can effectively compensate for the system errors caused by the 2D perspective and geometric simplifications. However, the relative differences between the models still remain even after optimization. Even with meteorological correction, the thickness estimation based on MOMSA-SegNet maintains the lowest MAPE and MSE, while segmentation models with weaker performance still exhibit higher optimization errors. This suggests that the meteorological correction mainly targets global system biases related to environmental processes, and cannot fully counteract the structural errors in the ice region contour and scale caused by segmentation. Thus, it can be concluded that segmentation quality determines the geometric baseline for thickness estimation, while meteorological correction fine-tunes this baseline, forming a hierarchical complementary relationship.
In conclusion, under the condition of complete consistency in the thickness estimation algorithm and test dataset, simply replacing the segmentation module results in a monotonous or nearly monotonous decrease in thickness errors with the improvement of segmentation model performance. This result confirms the substantial contribution of MOMSA-SegNet in ice thickness detection from a data-driven perspective. Its higher segmentation accuracy not only reflects in pixel-level metrics but also significantly reduces the initial errors in downstream thickness estimation, maintaining its advantage even after meteorological correction and effectively transmitting the improved segmentation performance to the final physical quantity estimation results.
3.5.3 Ablation Experiment on Multi-Source Input Data
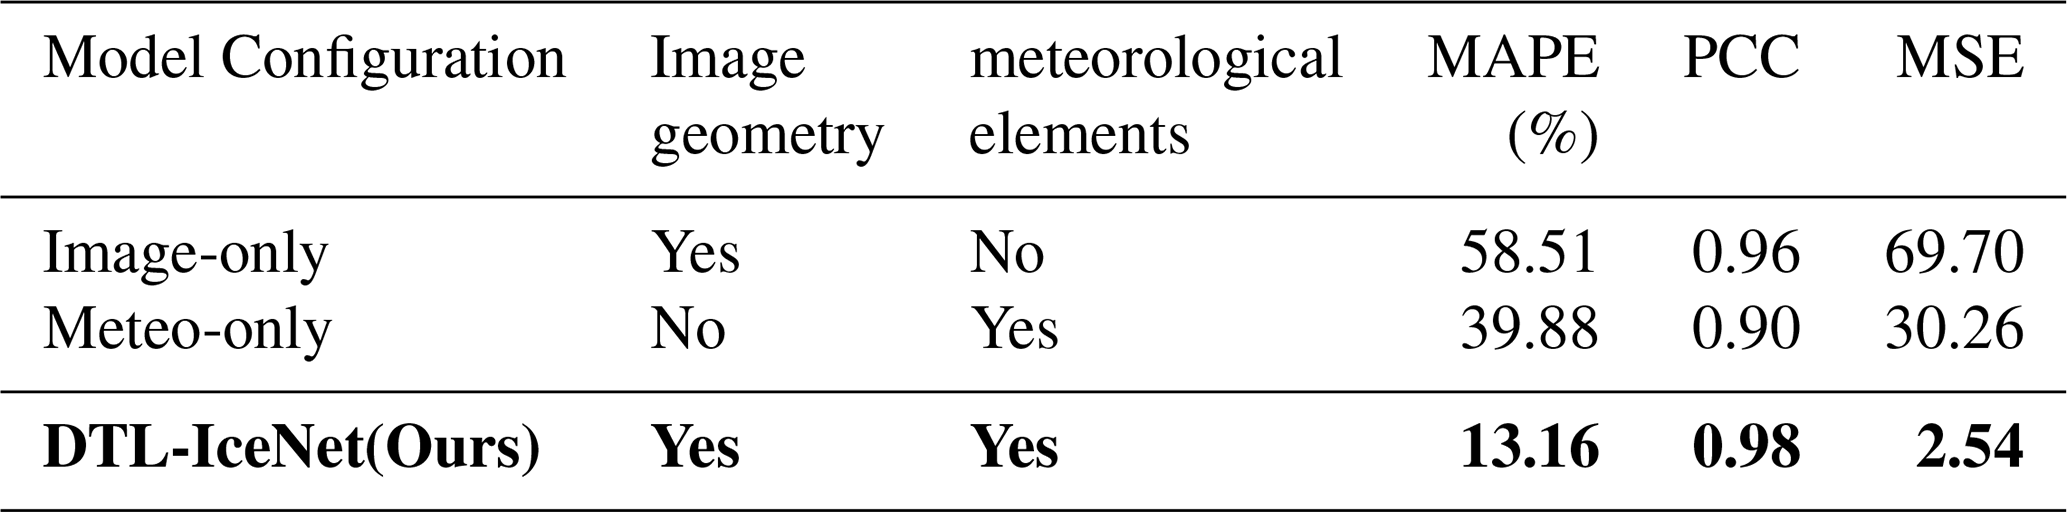
To systematically assess the independent contributions and complementary relationship between image geometric information and meteorological factors in ice thickness estimation, this study conducted an ablation experiment based on the observation field thickness test data. Under the premise of maintaining consistent datasets, thickness calibration methods, and evaluation metrics, three different information configurations were constructed. The first configuration retained only the thickness estimation derived from the segmentation results and the area-ratio-based geometric relationship, aiming to evaluate the independent capability of the image-based geometric pathway; the second configuration relied solely on meteorological features such as temperature, humidity, wind speed, and precipitation to directly fit ice thickness using a regression model, evaluating the prediction potential of environmental driving factors without image data; the third configuration introduced the meteorological correction term based on geometric thickness, which is the complete fusion mode of DTL-IceNet proposed in this paper, used to test the practical benefits of the synergistic effects between the two information sources. The comparison results of the three configurations are shown in Table 6.
Table 6Comparison of ablation experimental results based on source input data.
Note: bold font is the optimal value.
As seen in Table 6, the three input configurations exhibit clear hierarchical differences in thickness estimation accuracy, reflecting the complementary nature of image geometry and meteorological factors in terms of information structure. In the Image-only mode, the PCC reaches 0.96, indicating that the geometric thickness derived from the segmentation results and area ratio relationship can well capture the trend of ice variation over time. However, due to the scale uncertainty introduced by single-view imaging, the amplification effect of segmentation errors on area estimation, and the simplification of cross-sectional morphology, the magnitude deviation is still significant, with MAPE reaching 58.51 % and MSE reaching 69.70, which reflects the inherent limitations of the geometric path in the absence of environmental process constraints. In the Meteo-only mode, the thickness estimation, relying on the phase changes of meteorological conditions, partially captures the growth and melting rhythm of the ice layer, so the PCC remains at a reasonable level of 0.90. However, due to the lack of spatial volume information, this mode struggles to differentiate between absolute thickness differences, exhibiting characteristics of large magnitude errors and significant fluctuations. These results indicate that meteorological factors alone cannot provide precise thickness information, especially in scenarios with small-scale changes and significant spatial heterogeneity.
In contrast, DTL-IceNet uses geometric thickness as a spatial scale constraint and employs meteorological features to fit the systemic offset driven by environmental factors, significantly suppressing errors in both trend and magnitude. The fusion mode's MAPE decreases significantly to 13.16 %, MSE reduces to 2.54, and PCC increases to 0.98. This demonstrates that the structured information provided by the geometric path and the temporal features captured by the meteorological path are highly complementary in mechanism, with the former determining the spatial baseline for estimation and the latter correcting the deviations caused by changes in meteorological conditions. As the ice formation process involves both geometric morphological evolution and meteorological-driven characteristics, both types of information are indispensable. Therefore, a single modality struggles to achieve high accuracy in thickness prediction, while the fusion mode can fully leverage the advantages of both types of information, reflecting a dual enhancement in robustness and physical consistency.
The dual-task learning framework, DTL-IceNet, proposed in this study demonstrates high reliability in both ice type recognition and thickness detection tasks. Its main contribution lies in the unified modeling of three types of information: type, geometry, and meteorology, which effectively enhances the comprehensive sensing ability of icing conditions on transmission lines. This fusion-based design aligns with the view emphasized in the literature that “ice physics, image features, and environmental processes must be considered in a coordinated manner” (Fan and Jiang, 2018; Hao et al., 2023; Chen et al., 2024b; Dong et al., 2022; Meng et al., 2025; Han et al., 2024), and it achieves both discriminative ability and physical consistency in typical monitoring scenarios, leading to significant improvements over existing methods.
In the ice type recognition task, the model explicitly separates the background, conductor, and icing regions through a multi-branch feature extraction structure. Studies by Fan and Jiang (2018) and Hao et al. (2023) have pointed out that ice recognition is highly sensitive to the environmental background, and deep networks based on a single-path feature extraction often struggle to fully capture the local texture of the conductor in complex backgrounds. The decomposition-based modeling approach of DTL-IceNet significantly enhances the distinction between different types of icing under complex lighting, fog, and noise conditions, providing stronger anti-interference ability compared to single-branch methods.
In the ice region segmentation task, MOMSA-SegNet leverages a multi-scale attention module to improve the representation capability of thin conductors and irregularly shaped icing areas. Existing research has shown that traditional edge detection or low-level feature methods exhibit poor robustness in weak boundaries, low contrast, and nighttime scenarios (Han et al., 2024; Tan and Le, 2019; Hu et al., 2018; Vasu et al., 2023; Li et al., 2016). In contrast, the multi-scale attention mechanism effectively utilizes the contextual structure surrounding the transmission line, allowing the model to maintain stable geometric-contour predictions under typical conditions such as sunny, foggy, and nighttime scenes. Its accuracy advantage stems from the targeted utilization of the transmission line image structure rather than relying solely on the depth of the network or the scale of parameters.
For ice thickness estimation, the improvement in model performance is mainly attributed to the synergistic effect of geometric and meteorological constraints. The image geometric information provides the basic trend of ice volume changes, but relying solely on 2D images cannot accurately reflect the true 3D shape of the ice, leading to systematic biases during temperature, humidity, wind speed, and precipitation phases. By introducing the meteorological correction term based on environmental factors, the model performs consistent corrections on the initial thickness estimation according to the basic physical laws of ice growth and melting, effectively compensating for the inherent structural biases in the geometric estimation. Experimental results show that the thickness curves align more closely with the actual distribution across multiple phases, indicating the complementary role of geometric and meteorological information in thickness estimation.
Although DTL-IceNet demonstrates robustness under typical monitoring conditions, its applicability is still limited by the data coverage and experimental conditions. The data used in this study were primarily collected in typical meteorological scenarios and have not yet covered extreme weather conditions such as severe convection or freezing rain coupled with strong winds. Under such conditions, the image signal-to-noise ratio and the rate of change in ice morphology may fall outside the training distribution, and the model's robustness therefore requires further validation. Moreover, the current experimental data do not systematically reflect complex spatial environments with significant topographic variations. Existing studies have shown that terrain, especially in valley wind fields, significantly impacts icing distribution, so the model's performance in complex terrain scenarios remains uncertain.
While the segmentation experiments presented in this study systematically show performance differences under various imaging conditions such as sunny days, fog, and nighttime, the thickness validation experiments were limited by the actual conditions of the observation field, which only included real thickness calibration data from sunny scenarios and could not directly quantify thickness estimation accuracy under various weather conditions. To address this logical gap, we will further analyze the potential impact of weather factors on thickness estimation. Mechanistically, weather changes affect thickness results mainly through two paths. First, imaging degradation such as fog and low light reduces the clarity of the ice and conductor boundaries, causing segmentation masks to deviate in geometric details and directly affecting the preliminary thickness calculation based on area and contour inference. Second, meteorological variables such as temperature, humidity, and wind speed determine the growth and melting rates of the ice, strongly driving the temporal evolution of thickness. The meteorological correction module of DTL-IceNet can provide systematic corrections based on this driving pattern, but it cannot completely compensate for geometric deviations caused by severe imaging degradation. Therefore, under real fog or nighttime conditions, the initial thickness errors may increase, while the optimized thickness is expected to show more stable but still limited corrections.
The dual-perspective approach proposed in this study is one of the key innovations of the overall framework. Through joint segmentation of the main and side perspectives, the major and minor axes of the ice-covered cross-section can be theoretically estimated, improving the certainty of geometric parameters. However, it is important to note that the thickness validation experiment in this paper was limited by site constraints and did not actually deploy transmission lines for real side-perspective imaging. Thickness detection relied on a simplified geometric assumption primarily based on the main perspective. This experimental condition means that the final obtained thickness accuracy mainly reflects the performance under the simplified single-perspective system rather than the upper limit of a complete dual-perspective structure. Therefore, while the current results prove the feasibility and potential value of the proposed framework, they do not fully validate the information gain of the dual-perspective structure in real multi-conductor scenarios. This also suggests that the side-perspective segmentation error's impact on thickness calculation has not been fully quantified. Future work will focus on building an experimental platform that truly reflects the dual-perspective structure to systematically evaluate error propagation mechanisms and further optimize geometric fusion methods.
In summary, DTL-IceNet provides a cohesive solution for ice-type recognition, geometric-structure extraction, and thickness estimation, with its advantages arising from complementary constraints between tasks and the explicit incorporation of physical processes.
To address the challenge of insufficient accuracy in ice coating recognition and thickness detection for high-altitude transmission lines, this paper proposes DTL-IceNet, dual-task learning architecture with multi-scale fusion mechanisms for enhanced ice detection on transmission lines, which enables precise ice coating recognition and ice thickness estimation.The proposed method employs ResSepNet, a multi-branch network designed to fuse and extract ice features across different spatial scales, effectively mitigating background noise interference and enhancing ice type classification accuracy. Additionally, a semantic segmentation network, MOMSA-SegNet, incorporating a skip structure and multi-scale attention mechanism, is utilized to segment icing regions on transmission lines, thereby facilitating ice thickness estimation. Furthermore, key meteorological data are integrated to optimize the correction of ice thickness measurements. Based on the original ice images provided by the power grid, we constructed a series of ice image datasets, including IceType and IceSeg. The experimental results demonstrate that the proposed DTL-IceNet achieves 4.17 % higher ice recognition accuracy compared to EfficientNet-V2, MobileNet-V3, ResNeXt, and MobileOne, while its ice area segmentation MIoU surpasses that of mainstream segmentation models such as UNet++ by 1.64 %. These findings indicate that the dual-task learning framework effectively detects and identifies both ice type and thickness on transmission lines. Furthermore, in the simulation test at the test site, the MAPE of ice thickness estimation reached 11.82 %, and the PCC attained 0.99, demonstrating the proposed method's robust ice detection performance in real-world conditions. However, due to hardware limitations, this study does not account for the impact of terrain elements on transmission line icing. The detection performance of the proposed method under significant environmental changes requires further improvement. Future work will focus on incorporating terrain elements into the model and examining their correlation with transmission line icing.
The datasets and code utilized for the analyses in this study are publicly available at https://doi.org/10.5281/zenodo.15718305 (Fu et al., 2025).
Yufei Fu, Wenjie Zhang planned the campaign; Yang Cheng, SongYuan Cao, Ling Tan performed the measurements; Yufei Fu, Jiaxin He, Mengya Wang, Wenjie Zhang analyzed the data; Yufei Fu and Wenjie Zhang wrote the manuscript draft; Wenjie Zhang, Yang Cheng, SongYuan Cao, reviewed and edited the manuscript.
The contact author has declared that none of the authors has any competing interests.
Publisher's note: Copernicus Publications remains neutral with regard to jurisdictional claims made in the text, published maps, institutional affiliations, or any other geographical representation in this paper. The authors bear the ultimate responsibility for providing appropriate place names. Views expressed in the text are those of the authors and do not necessarily reflect the views of the publisher.
This work was supported by National Key R&D Program of China (grant no. 2023YFE0208100).
This research has been supported by the National Key Research and Development Program of China, Chinese Polar Environment Comprehensive Investigation and Assessment Programmes (grant no. 2023YFE0208100).
This paper was edited by Simone Lolli and reviewed by two anonymous referees.
Ansari, S., Rennie, C. D., Clark, S. P., and Seidou, O.: River Ice Detection and Classification using Oblique Shore-based Photography, Cold Reg. Sci. Tech., 228, 104303, https://doi.org/10.1016/j.coldregions.2024.104303, 2024.
Badrinarayanan, V., Kendall, A., and Cipolla, R.: Segnet: A deep convolutional encoder-decoder architecture for image segmentation, IEEE T. Pattern Anal., 39, 2481–2495, https://doi.org/10.1109/TPAMI.2016.2644615, 2017.
Chen, J. B., Yang, R., Wang, Q., Chai, J., Zhang, G. R., and He, Y. C.: Icing Detection of Transmission Lines Based on Improved YOLOv8, Measurement and Control Technology, 43, 23–30, https://doi.org/10.19708/j.ckjs.2024.04.220, 2024a.
Chen, Q. H., Liu, T. Y., Wang, Z. Q., and Miao, R.: Research on monitoring method for ice-covered state of transmission lines based on conductor end displacement, Elect. Pow. Syst. Res., 236, 110918, https://doi.org/10.1016/j.epsr.2024.110918, 2024b.
Dong, B., Jiang, X. L., and Xiang, Z.: Calculation model and experimental verification of equivalent ice thickness on overhead lines with tangent tower considering ice and wind loads, Cold Reg. Sci. Tech., 200, 103588, https://doi.org/10.1016/j.coldregions.2022.103588, 2022.
Fan, C. J. and Jiang, X.: Analysis of the icing accretion performance of conductors and its normalized characterization method of icing degree for various ice types in natural environments, Energies, 11, 2678, https://doi.org/10.3390/en11102678, 2018.
Fu, Y., Cheng, Y., Cao, S., Tan, L., He, J., Wang, M., Zhang, W., and Yang, Y.: Data from the article “DTL-IceNet: A Dual-Task Learning Architecture with Multi-Scale Fusion Mechanisms for Enhanced Ice Detection on Transmission Lines”, Zenodo [data set], https://doi.org/10.5281/zenodo.15718305, 2025.
Gui, Q. X., Wang, G., Wang, L., Cheng, J., and Fang, H.: Road surface state recognition using deep convolution network on the low-power-consumption embedded device, Microprocess. Microsy., 96, 104740, https://doi.org/10.1016/j.micpro.2022.104740, 2023.
Han, S. J., Li, D. Q., Li, K. Y., Wu, H. Y., Gao, Y. M., Zhang, Y., and Yuan, R. H.: Analysis and study of transmission line icing based on grey correlation Pearson combinatorial optimization support vector machine, Measurement, 236, 115086, https://doi.org/10.1016/j.measurement.2024.115086, 2024.
Hao, Y., Wang, X., Liang, W., Zhang, W. X., He, J. Q., Wang, J. X. and Wu, J. R.: Ice Types Identification and Prediction of Overhead Transmission Lines Driven by Micro-Meteorological Data of Three Consecutive Days Icing, Southern Power System Technology, 17, 107–116, https://doi.org/10.13648/j.cnki.issn1674-0629.2023.06.013, 2023.
He, J., Wang, Z. G., Cao, J. P., Chen, L., and Lian, Y. F.: Detection and Segmentation of Overhead Transmission Line Icing Conductor Based on Improved YOLOv5, 2023 3rd International Conference on New Energy and Power Engineering (ICNEPE), 917–920, https://doi.org/10.1109/ICNEPE60694.2023.10429575, 2023a.
He, J. Q., Li, R. H., Li H., Liao, Y. L., Gong, B., Hao, Y. P., Liang, W., Wu, J. R., and Wen, Y.: Visible Light lmage Automatic Recognition and Segmentation Method for Overhead Power Line Insulators Based on Yolo v5 and Grabcut, Southern Power System Technology, 17, 128–135, https://doi.org/10.13648/j.cnki.issn1674-0629.2023.06.015, 2023b.
He, X. Q., Wu, X. Y., and Wei, Y. W.: Measurement method for thickness of uneven icing on transmission line in complex background, Journal of Electric Power Science and Technology, 38, 224–229, https://doi.org/10.19781/j.issn.1673-9140.2023.03.025, 2023c.
Howard, A., Sandler, M., Chen, B., Wang, W. J., Chen, L. C., Tan, M. X., Chu, G., Vasudevan, V., Zhu, Y. K., Pang, R. M., Adam, H., and Le, Q.: Searching for mobilenetv3, Proceedings of the IEEE/CVF international conference on computer vision, 1314–1324, https://doi.org/10.1109/ICCV.2019.00140, 2019.
Hu, J., Shen, L., and Sun, G.: Squeeze-and-excitation networks, Proceedings of the IEEE conference on computer vision and pattern recognition, arXiv [preprint], 7132–7141, https://doi.org/10.48550/arXiv.1709.01507, 2018.
Kong, X. H., Guan, H. L., Jiang, L., Wang, Y. Y., and Zhang, C.: Icing detection on ADSS transmission optical fiber cable based on improved YOLOv8 network, Signal Image Video P., 18, 5323–5332, https://doi.org/10.1007/s11760-024-03235-9, 2024.
Li, D. L., Cao, L., and Yang, X. D.: Discussion on Otherness of the Calculated Methods for Conductor Icing Density in Transmission Line, Electric Power Survey & Design, 28, 177–179, https://doi.org/10.13500/j.cnki.11-4908/tk.2016.s2.041, 2016.
Lin, G. S., Milan, A., Shen, C. H., and Reid, I.: Refinenet: Multi-path refinement networks for high-resolution semantic segmentation, Proceedings of the IEEE conference on computer vision and pattern recognition, 1925–1934, https://doi.org/10.48550/arXiv.1611.06612, 2017.
Liu, W. X., Tsamados, M., Petty, A., Jin, T. Y., Chen, W. B., and Stroeve, J.: Enhanced sea ice classification for ICESat-2 using combined unsupervised and supervised machine learning, Remote Sens. Environ., 318, 114607, https://doi.org/10.1016/j.rse.2025.114607, 2025.
Liu, X. Y., Peng, H. W., Zheng, N. X., Yang, Y. Q., Hu, H., and Yuan, Y. X.: EfficientViT: Memory Efficient Vision Transformer with Cascaded Group Attention, Proceedings of the IEEE/CVF conference on computer vision and pattern recognition, arXiv [preprint], 14420–14430, https://doi.org/10.48550/arXiv.2305.07027, 2023.
Lu, Y. K.: Research on icing identification of transmission lines based on YOLO optimized edge detection, (Master's thesis), North China Electric Power University, Beijing, https://doi.org/10.27140/d.cnki.ghbbu.2024.001039, 2024.
Meng, X. R., Tian, L., Liu, J. C., and Jin, Q. T.: Failure prediction of overhead transmission lines incorporating time series prediction model for wind-ice loads, Reliab. Eng. Syst. Safe., 259, 110927, https://doi.org/10.1016/j.ress.2025.110927, 2025.
Tan, M. X. and Le, Q.: Efficientnet: Rethinking model scaling for convolutional neural networks, International conference on machine learning, arXiv [preprint], 97, 6105–6114, https://doi.org/10.48550/arXiv.1905.11946, 2019.
Tan, M. X. and Le, Q.: Efficientnetv2: Smaller models and faster training, International conference on machine learning, arXiv [preprint], 139, 10096–10106, https://doi.org/10.48550/arXiv.2104.00298, 2021.
Vasu, P. K. A., Gabriel, J., Zhu, J., Tuzel, O., and Ranjan, A.: Mobileone: An improved one millisecond mobile backbone, Proceedings of the IEEE/CVF conference on computer vision and pattern recognition, 7907–7917, https://doi.org/10.48550/arXiv.2206.04040, 2023.
Wang, L. Y., Chen, Z. C., Zhang, W. J., Lu, Z. Q., Cheng, Y., Qu, X. L., Gul, C., and Yang, Y. J.: The causes and forecasting of icing events on power transmission lines in southern China: A review and perspective, Atmosphere, 14, 1815, https://doi.org/10.3390/atmos14121815, 2023.
Xie, S. N., Girshick, R., Dollár, P., Tu, Z. W., and He, K. M.: Aggregated residual transformations for deep neural networks, Proceedings of the IEEE conference on computer vision and pattern recognition, 1492–1500, https://doi.org/10.48550/arXiv.1611.05431, 2017.
Xu, Q., Li, D. Q., Peng, H. C., Li, C., Chen, H. T., and Dong, J. Z.: Support Vector Machine-Based Impact Analysis of Multidimensional Ice-Covering Factors, 2023 3rd International Conference on New Energy and Power Engineering (ICNEPE), 541–545, https://doi.org/10.1109/ICNEPE60694.2023.10429504, 2023.
Yang, J., Gao, Y. F., Zhang, K., Wang, Y., Zhang, Y. L., Xia, N., and Yao, G.: A Conductor Icing Monitoring Method Based on Image Edge Detection and Normal Direction Detection, Power System and Clean Energy, 39, 24–32, https://doi.org/10.3969/j.issn.1674-3814.2023.02.004, 2023.
Yang, Y. J., Chen, Z. C., Ning, G. C., Zhang, W. J., Lu, Z. Q., Wang, L. Y., Yi, Y. D., Zhao, J. R., He, J. X., Bai, S., and Zhou, B. T.: Meteorological drivers and micrometerological variability of two consecutive icing events on power transmission lines in the mountainous region of southern Anhui in December 2023, Transactions of Atmospheric Sciences, 48, 705–722, https://doi.org/10.13878/j.cnki.dqkxxb.20250521002, 2025.
Zhang, Y., Cheng Z. J., and Liu Y.: Research Progress and Development Trends on Online Icing-monitoring of Transmission Lines, Power Systems and Big Data, 27, 32–42, https://doi.org/10.1049/enc2.12131, 2024.
Zhou, Z. W., Rahman Siddiquee, M. M., Tajbakhsh, N., and Liang, J. M.: Unet++: A nested u-net architecture for medical image segmentation, Deep learning in medical image analysis and multimodal learning for clinical decision support: 4th international workshop, 11045, 3–11, https://doi.org/10.1007/978-3-030-00889-5_1, 2018.