the Creative Commons Attribution 4.0 License.
the Creative Commons Attribution 4.0 License.
 | 24 Jun 2026
Evaluation of ice hydrometeor retrieval using multi-band radar and millimeter-wave radiometer measurements from the IMPACTS campaign
Hirohiko Masunaga
Understanding the microphysical properties of ice hydrometeors remains challenging. This study develops and evaluates a cloud-ice retrieval algorithm that synergistically uses W-band radar, Ku/Ka-band radar, and millimeter-wave radiometer observations. This strategy enables to observe deep inside precipitating clouds unreachable by conventional combined radar–lidar measurements due to severe attenuation.
The retrieved cloud microphysical parameters are compared with aircraft in situ measurements from the Investigation of Microphysics and Precipitation for Atlantic Coast-Threatening Snowstorms (IMPACTS) campaign. The bias between retrieved values and in situ measurements varied by roughly two orders of magnitude depending on the particle habit assumptions. A mixture of rosette and snowflake habits based on physical considerations yielded the best overall performance. Under this habit assumption, the mean ratios of the retrieved values to in situ probe measurements of ice water content (IWC), total number concentration (Nt), mass-weighted mean diameter (Dm) are 1.01, 0.97, and 1.05. The mean bias and RMSE for terminal fall velocity (Vt) are −0.02 and 0.30 m s−1. Forward-simulated measurements from the retrieved profiles reproduce the actual radars and radiometer observations well, confirming the self-consistency of the current algorithm.
A theoretical sensitivity analysis demonstrates that the radar–radiometer synergy becomes particularly effective in deep cloud layers where particle sizes are large, ensuring that the multi-sensor retrieval outperform the W-band radar-only retrieval especially deep inside clouds. These results highlight the potential of combining multi-band radar and millimeter-wave radiometer observations to advance our understanding of ice-hydrometeor microphysics in deep precipitating clouds.
- Article
(9397 KB) - Full-text XML
-
Supplement
(1522 KB) - BibTeX
- EndNote


In developed precipitation systems, ice hydrometeors such as cloud ice, snowflakes, and graupel play crucial roles in cloud microphysical processes and precipitation formation. In convective clouds, intense updrafts promote riming and coalescence, leading to the formation of graupels and hails that cause locally intense precipitation. In contrast, within stratiform clouds, relatively weak updrafts allow ice crystals and snowflakes to gradually grow through vapor deposition and aggregation as they slowly fall toward the surface, producing widespread and weak precipitation. These microphysical processes are well documented in the literature as a key feature of organized precipitation systems (Houze, 2014). However, global-scale observations to verify the ice cloud microphysics remain limited.
One of the remaining challenges is technical difficulties in estimating the microphysical properties of ice hydrometeors from observations. Conventional satellite remote sensing by use of any single instrument alone often fails to simultaneously constrain various cloud-microphysical parameters such as particle size distribution and particle shape. A promising strategy to overcome this limitation is combining multiple sensors with different wavelengths and measurement principles. Notable examples include combined observations from the CloudSat and Cloud–Aerosol Lidar and Infrared Pathfinder Satellite Observations (CALIPSO) satellites, which carried a W-band radar and a lidar, respectively (Delanoë and Hogan, 2008, 2010; Deng et al., 2010, 2015; Okamoto, 2003; Okamoto et al., 2010). This approach has been further adopted for the W-band radar–lidar synergy algorithm onboard the Earth Cloud, Aerosol and Radiation Explorer (EarthCARE) satellite (Illingworth et al., 2015; Sato et al., 2025; Wehr et al., 2023). However, lidar observations are strongly affected by in-cloud attenuation at the expense of an excellent detectability of optically thin clouds, making them unsuitable for retrieving ice hydrometeors within optically thick, precipitating clouds.
As an illustrative example, Fig. 1a shows the W-band radar reflectivity (Zw) from Cloud Profiling Radar (CPR) aboard CloudSat as a color map and the cloud detection areas from Cloud-Aerosol LIdar with Orthogonal Polarization Lidar (CALIOP) aboard CALIPSO in gray shade. It is evident that lidar sensitivity is limited to near the cloud top due to strong attenuation, providing little information from deeper cloud layers. This means that the combined spaceborne radar–lidar observations do not provide a synergistic benefit for deep inside a thick cloud layer. Previous studies have also reported that retrieval uncertainties are particularly large in radar-only regions (Cazenave et al., 2019; Delanoë and Hogan, 2008). In heavily precipitating clouds rich in snow and graupel, even W-band radar reflectivity suffers from strong attenuation, making it even more difficult to retrieve ice hydrometeors in the deeper cloud layers (Mason et al., 2023).
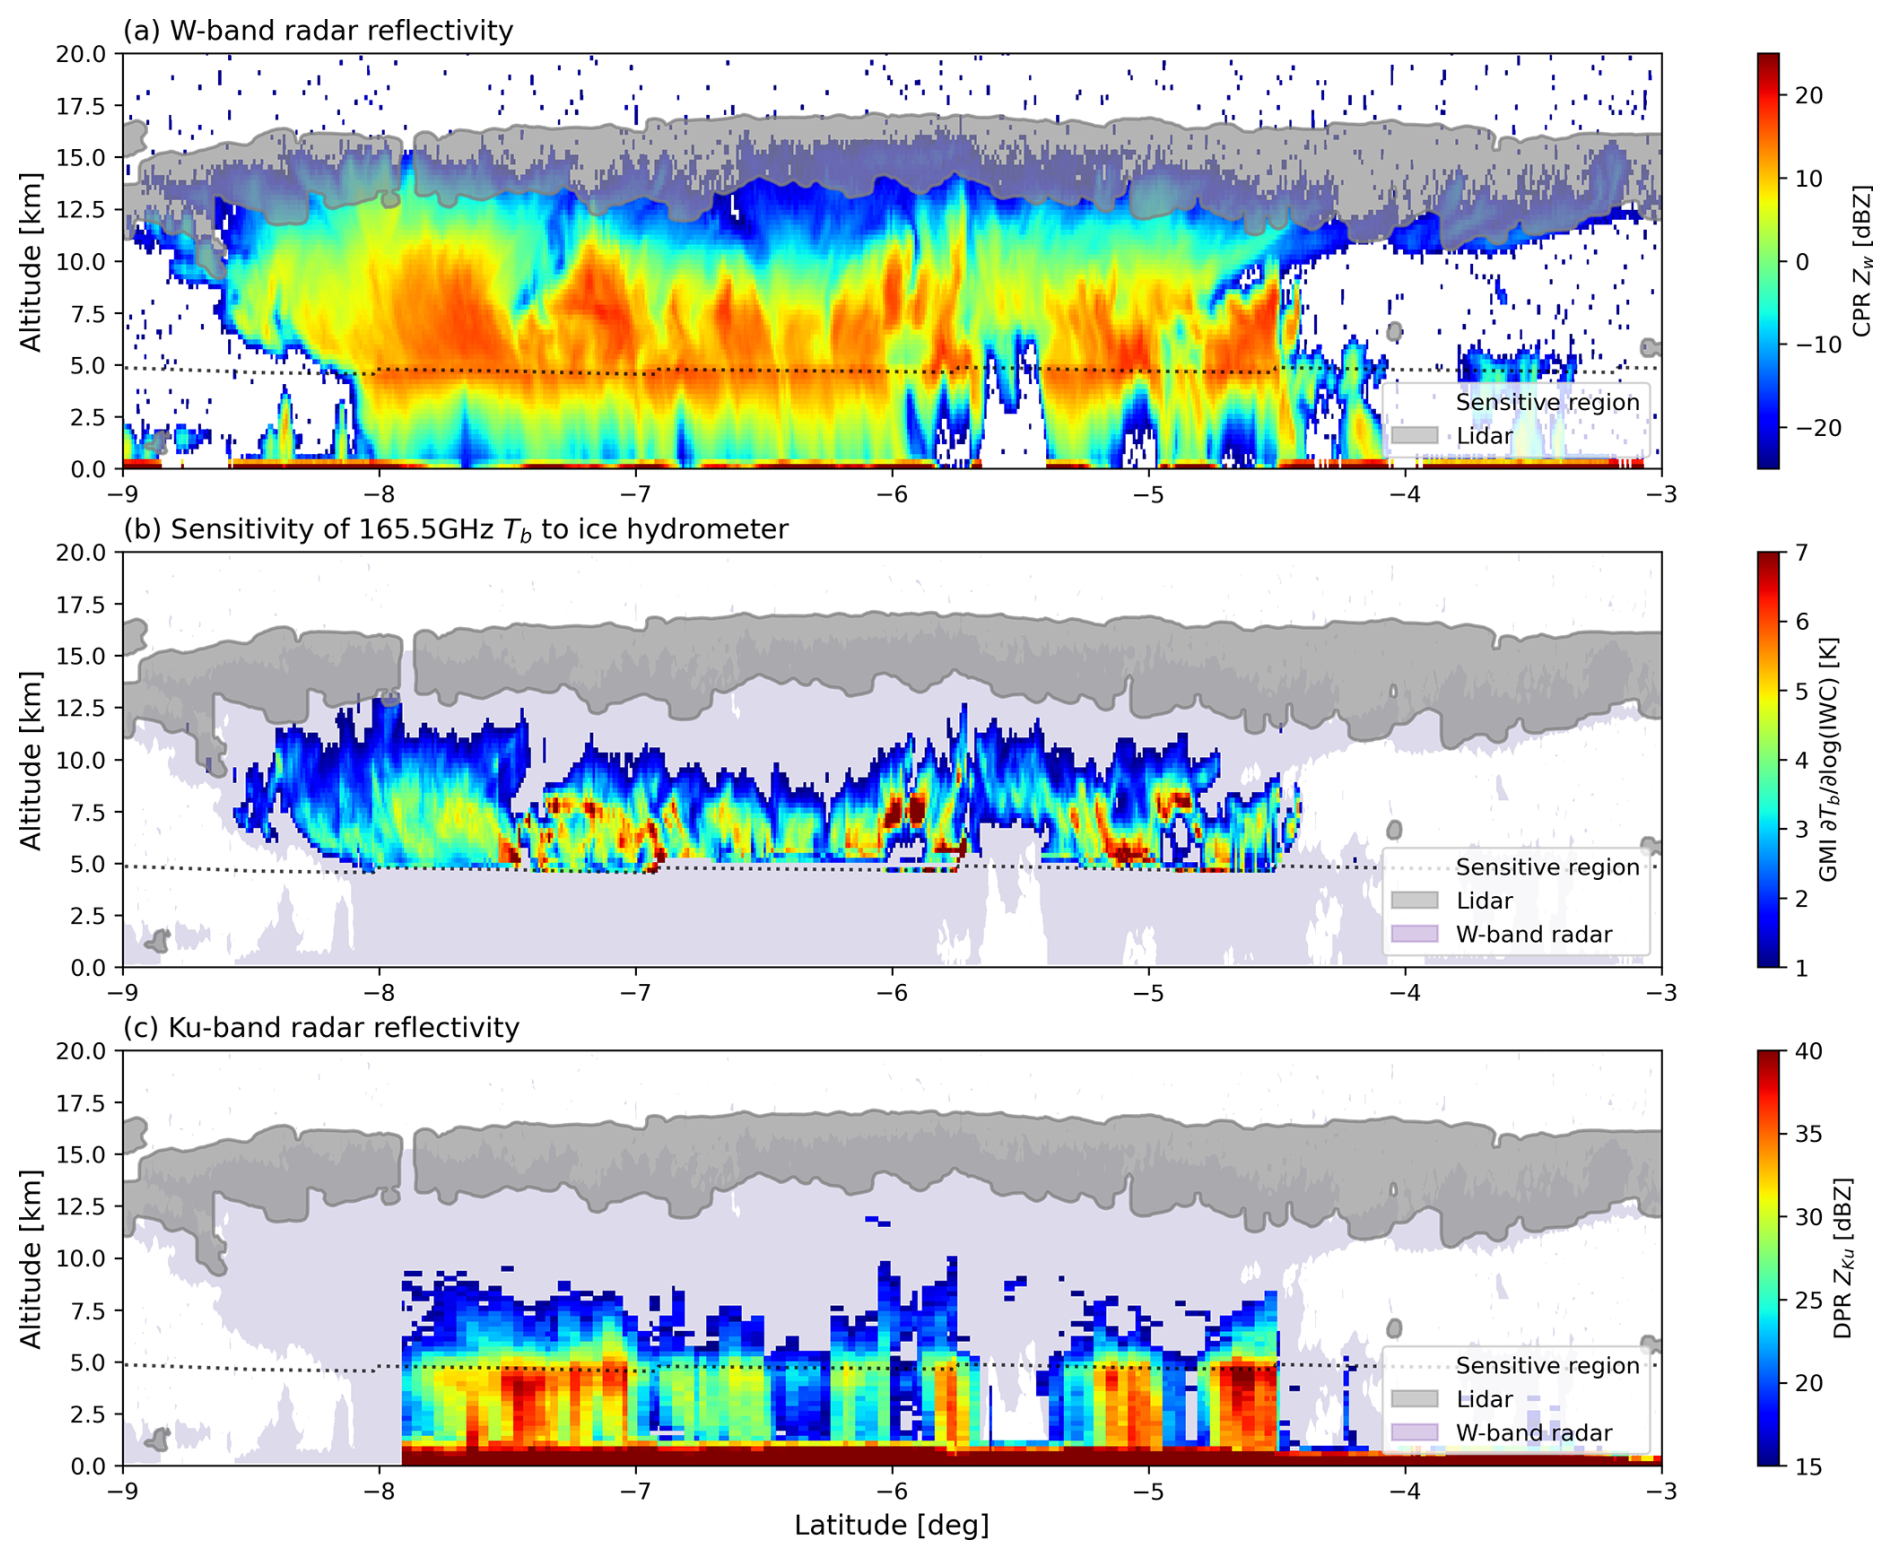
Figure 1Sensitivities of various satellite-borne sensors to ice hydrometeors. (a) The color contours represent CloudSat/CPR W-band radar reflectivity. The gray shading indicates cloud detected regions where the cloud fraction observed by the CALIPSO lidar (CALIOP) exceeds 25 %. (b) The sensitivity of the GPM/GMI brightness temperature at 166 GHz to perturbations of Ice Water Content in each layer. This value calculated from retrieved IWC in O25 using radiative transfer model. (c) The GPM Ku-band radar reflectivity. The black dashed line represents the 0 °C altitude.
In Ohara and Masunaga (2025, hereafter O25), an ice-hydrometeor retrieval algorithm was developed to address this issue by combining spaceborne W-band radar and high-frequency microwave radiometer measurements. Among the goals of the present study is to extend this algorithm to incorporate Ku- and Ka-band radar observations as well. Figure 1b–c show the sensitivity of 165.5 GHz brightness temperature to IWC from the Global Precipitation Measurement (GPM) Microwave Imager (GMI), and the Ku-band radar reflectivity observations (ZKu>15 dBZ) from the Dual-frequency Precipitation Radar (DPR), together with the sensitivity domains of lidar (gray shading) and W-band radar (light-purple shading). These sensors are sensitive to ice hydrometeors in the deep layers of clouds, where lidar observations have no sensitivity. Therefore, combining observations from high-frequency microwave radiometers and Ku- and Ka-band radars with W-band radar measurements is expected to reduce retrieval uncertainties of ice-hydrometeor microphysical properties in the deep precipitating clouds.
The combined retrieval algorithm of O25 uses a matchup dataset between the CloudSat and GPM observations, while validation has yet to be performed in comparison with in situ observations. The objective of this study is to evaluate the performance of the O25 retrieval algorithm by applying it to airborne remote-sensing instruments and examining their results against in situ measurements obtained during the Investigation of Microphysics and Precipitation for Atlantic Coast-Threatening Snowstorms (IMPACTS) field campaign (McMurdie et al., 2022). Section 2 describes the IMPACTS datasets, the forward model, and the ancillary data used in the retrieval algorithm. Section 3 presents an overview of the retrieval methodology including cloud microphysical assumptions along with updates to the O25 algorithm. Section 4 evaluates the retrieval performance and examines the influence of particle habit assumptions on the retrieval accuracy. Section 5 assesses the particle fall velocity diagnosed from the retrieved microphysical parameters using in situ probe measurements and W-band Doppler radar observations. It also discusses the improvement in retrieval accuracy through the synergistic use of multiple microwave sensors. Finally, Section 6 summarizes the overall findings of this study.
2.1 IMPACTS dataset
The IMPACTS field campaign, conducted during the winters of 2020, 2022, and 2023, was a comprehensive observational program designed to investigate the microphysical and dynamical processes of snowstorms along the eastern United States. Coordinated measurements were made using NASA's ER-2 high-altitude aircraft and the P-3 cloud-sampling aircraft. The ER-2 carried a set of remote-sensing instruments, including high-frequency microwave radiometers and W-, Ku-, and Ka-band Doppler radars, while the P-3 carried in situ microphysical probes and meteorological sensors for detailed measurements of cloud and precipitation particles. The integration of these datasets offers a valuable testbed for validating and improving a multi-sensor algorithm to retrieve ice hydrometeors.
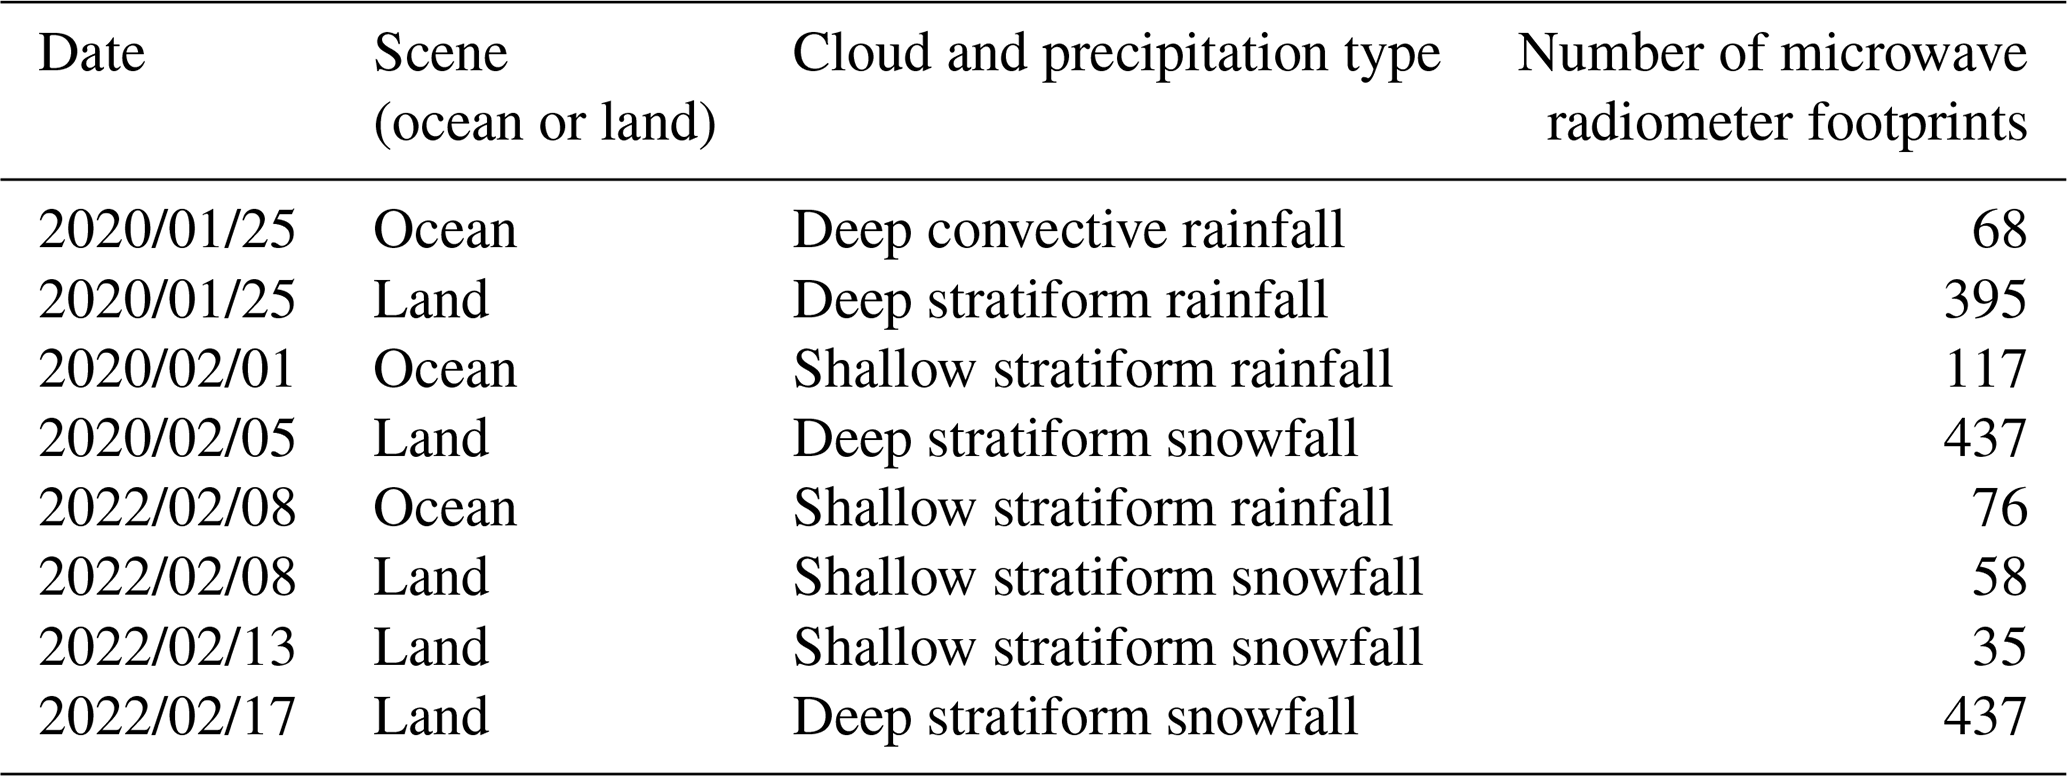
Table 1 lists the IMPACTS flight cases analyzed in this study, including observation dates, scenes (ocean or land), the dominant cloud–precipitation type, and the number of microwave radiometer footprints. Only cases with coincident ER-2 and P-3 observations that have a temporal difference between the two platforms within 15 min are selected. A match-up is adopted when the P-3 flight track is located within the ER-2 microwave radiometer footprint and all the necessary parameters for algorithm input and validation are available. The cloud–precipitation types are classified using W-band echo-top temperature ( °C for deep, °C for shallow) (Aoki et al., 2026), presence or absence of strong updrafts in the W-band Doppler velocity (convective or stratiform), and near-surface air temperature (>0 °C for rainfall, <0 °C for snowfall).
Table 1IMPACTS flight cases that satisfy the ER-2 and P-3 match-up criteria.
2.1.1 Radar and radiometer observations from ER-2 aircraft
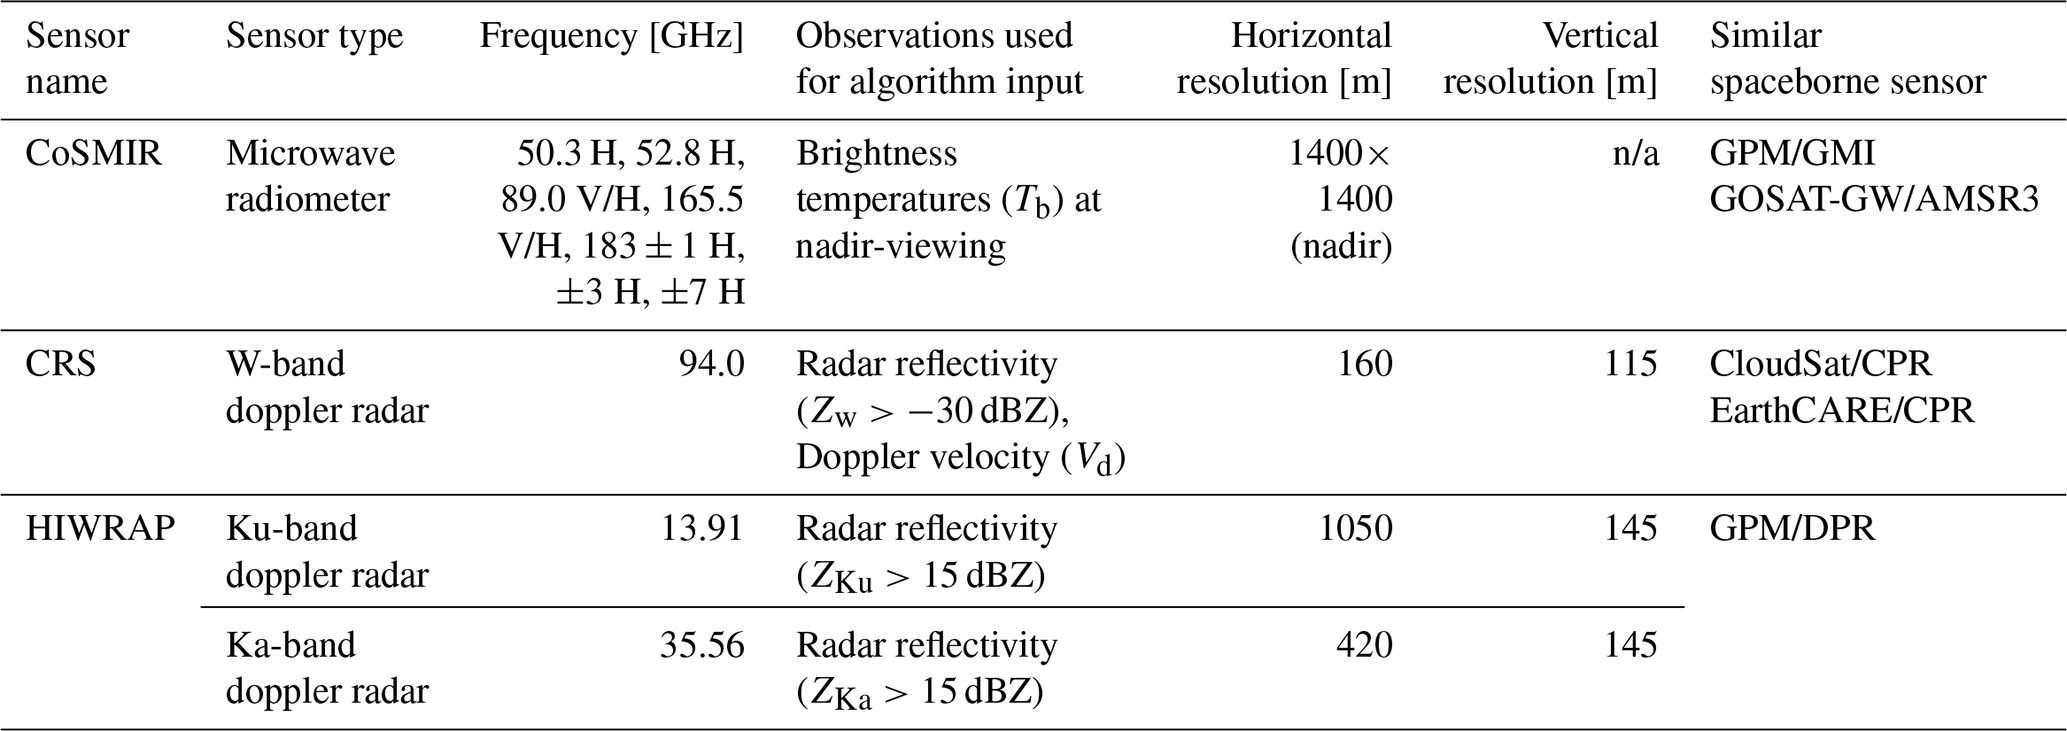
The ER-2 aircraft flies at an altitude of approximately 20 km carrying nadir-looking instruments as listed in Table 2. The Cloud Radar System (CRS) (Li et al., 2004) is a W-band radar that shares the same operating frequency as the CloudSat/CPR and EarthCARE/CPR and is equipped with Doppler capability. The Conical Scanning Millimeter-wave Imaging Radiometer (CoSMIR) (Wang et al., 2013) is equipped with high-frequency channels at 89, 165.5, and 183±3, 7 GHz, which correspond to the high-frequency channels (≥89 GHz) of GPM/GMI. The High Altitude Imaging Wind and Rain Airborne Profiler (HIWRAP) (Li et al., 2016) is a dual-frequency (Ku- and Ka-band) radar system that employs the same frequencies as the GPM/DPR. The similarity in microwave frequencies between the airborne and satellite sensors ensures that the framework of the multi-sensor retrieval algorithm developed by O25 using coincident CloudSat–GPM observations can be applied to the ER-2 measurements as well. CoSMIR brightness temperatures (Tb) at 89, 165.5, and 183±3, ±7 GHz (only same channels as GMI) are used. HIWRAP Ku- and Ka-band radar reflectivity (ZKu and ZKa) data above 15 dBZ (almost same as DPR sensitivity limit) are utilized, while Doppler velocities are not used. For CRS data, W-band radar reflectivity (Zw) above −30 dBZ (almost same as CPR sensitivity limit) and Doppler velocity (Vd) are used.
Table 2Specifications of sensors onboard ER-2 aircraft.
n/a: not applicable
Figure 2a illustrates the footprint sizes and sampling intervals of the sensors – CoSMIR (nadir-viewing), CRS, and HIWRAP. The CoSMIR footprint is substantially larger than those of the radar instruments, and the difference in spatial resolution among the sensors can be a source of retrieval error in the multi-sensor algorithm. To mitigate this effect, CRS and HIWRAP observations located within each CoSMIR footprint averaged using a Gaussian weight representing the CoSMIR antenna pattern before input to the algorithm. The averaging of radar reflectivity is performed in linear units ([mm6 m−3]). Figure 2b shows the aircraft flight tracks and the column-integrated water vapor for an over-ocean case on 25 January 2025. Figure 2c presents the CoSMIR high-frequency Tb for this case, while Fig. 2d–g show the footprint-adjusted CRS Zw, Vd, and the HIWRAP ZKu, ZKa vertical profiles. The black dashed line indicates the 0 °C level, where a distinct bright band is evident particularly in ZKu and ZKa, accompanied by a pronounced increase in negative Vd. These are as expected to occur as the result of the melting of solid precipitation particles into raindrops.
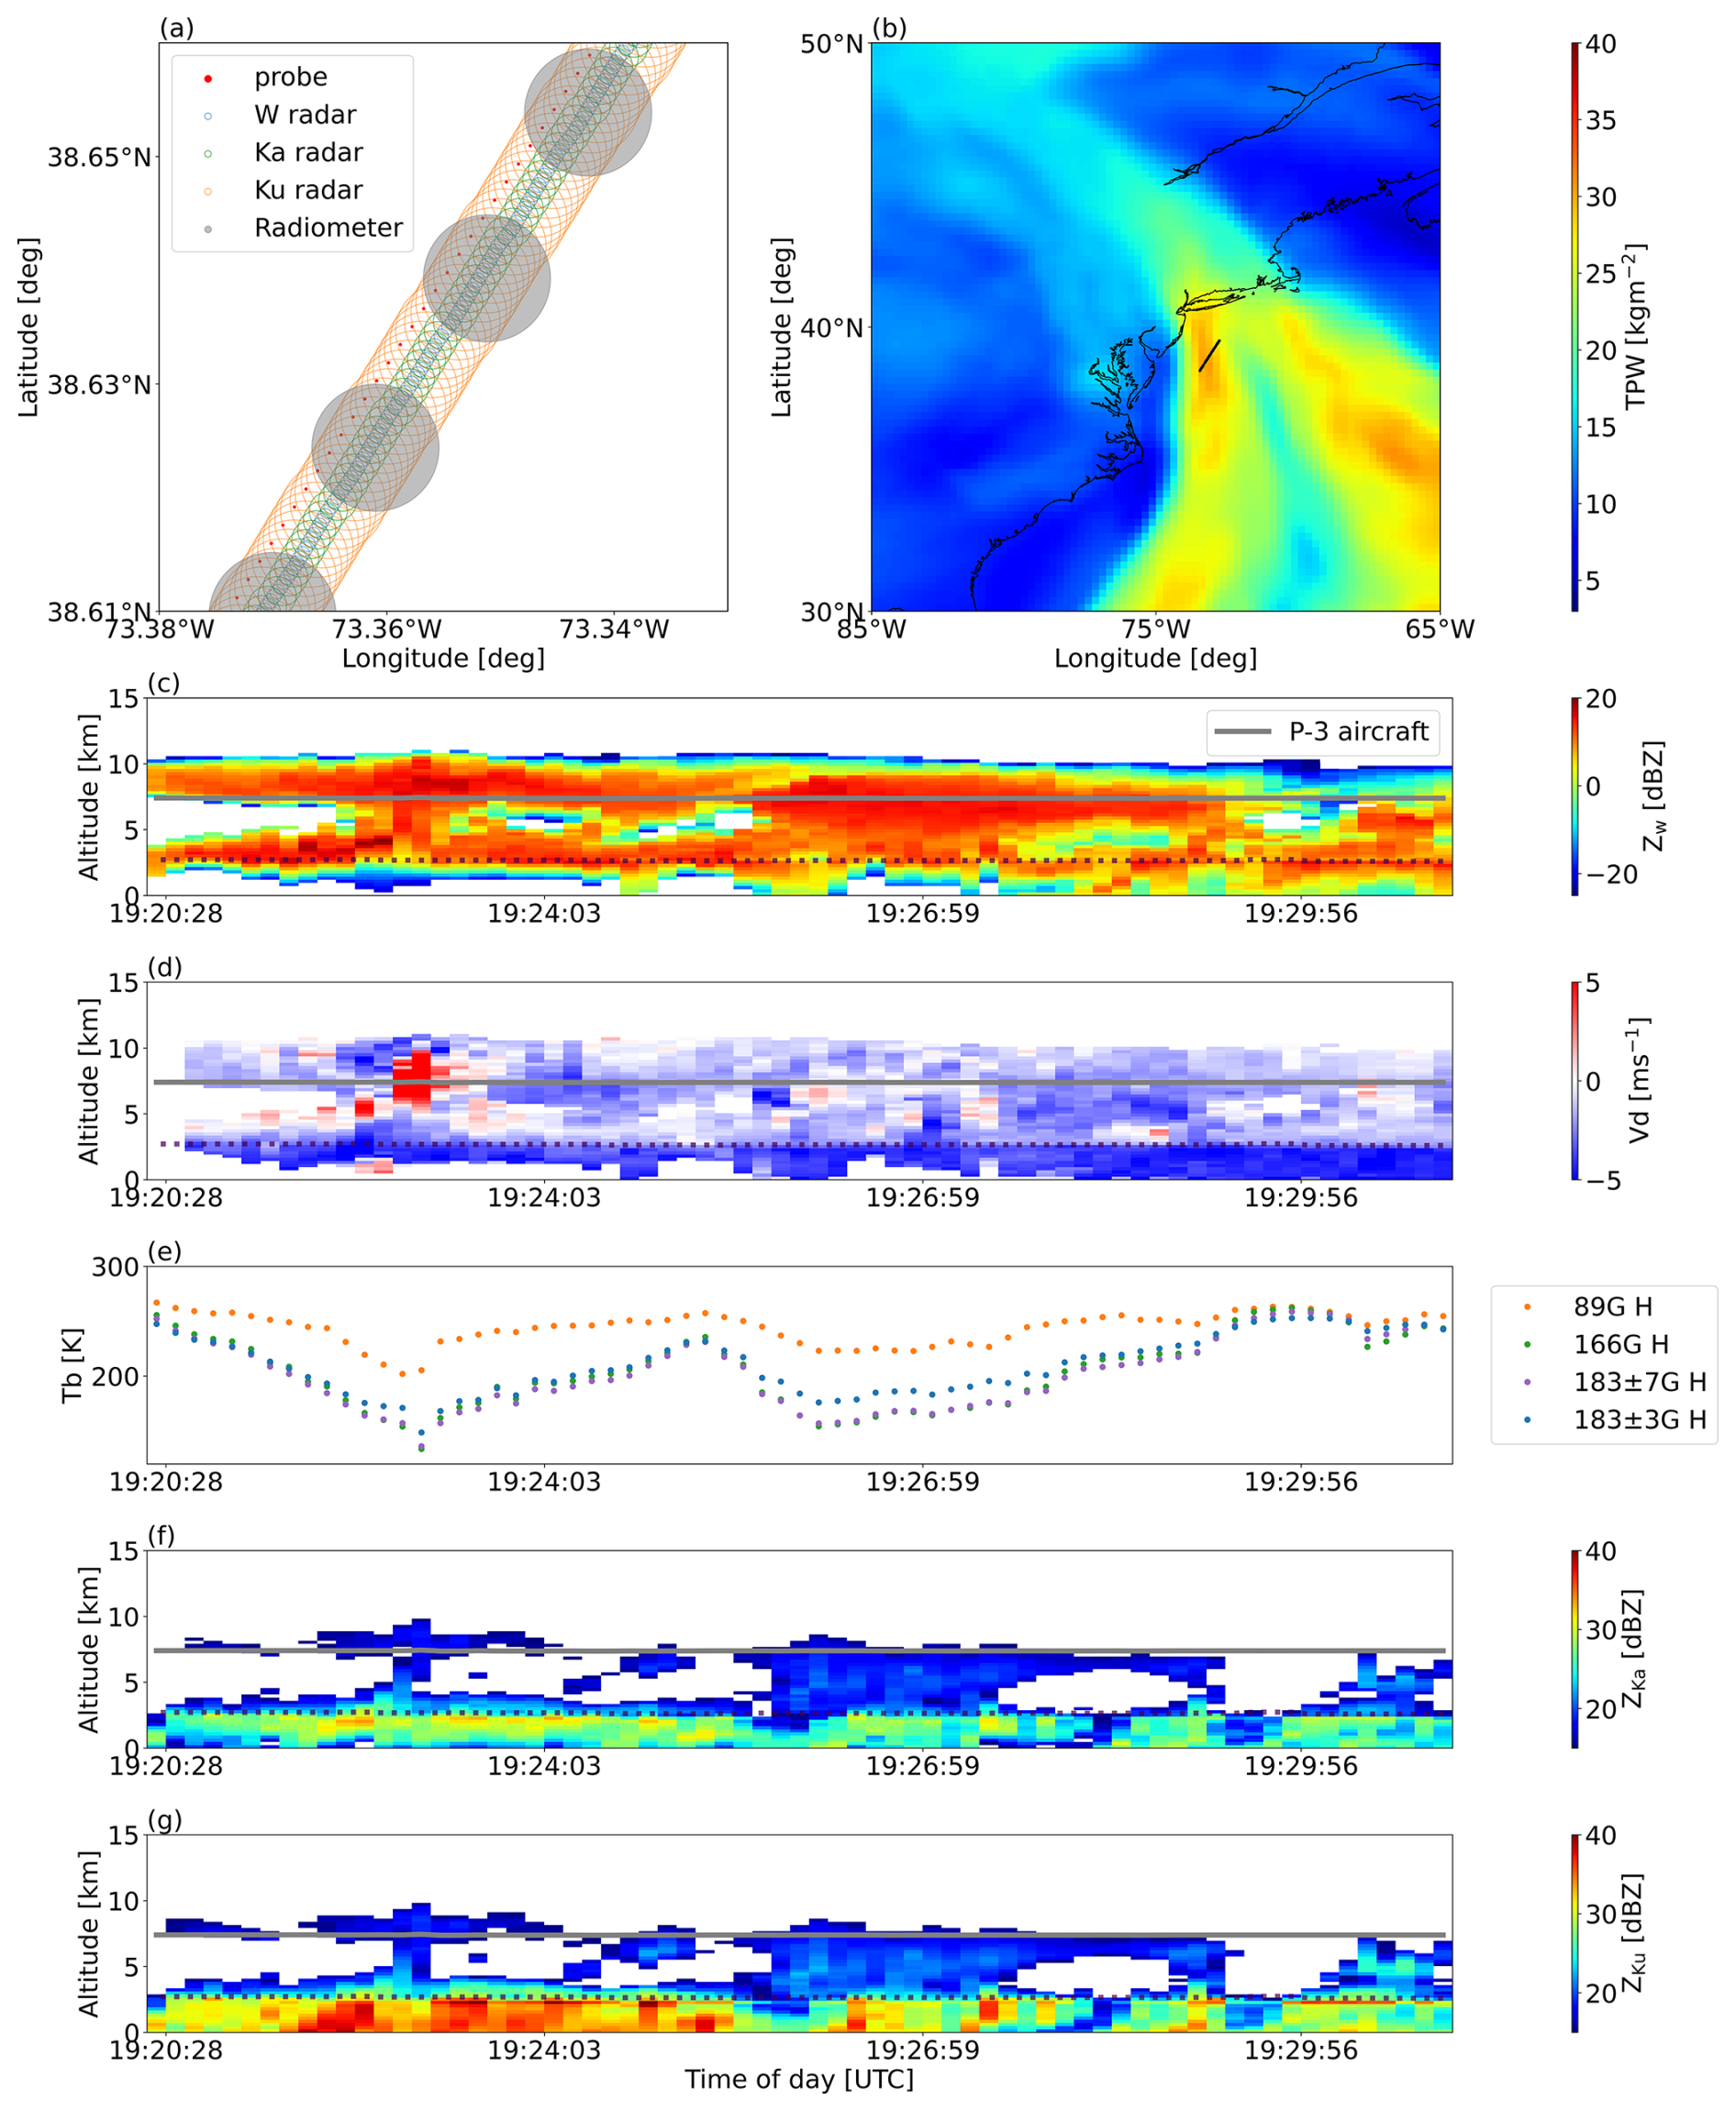
Figure 2An example of observations by multiple sensors aboard the ER-2 aircraft on 25 January 2025. (a) Comparison of footprint sizes and sampling intervals among the ER-2-borne CoSMIR (radiometer), CRS (W-band radar), HIWRAP (Ku- and Ka-band radar), and the in-situ probes onboard the P-3 aircraft. (b) Flight track (black line) and the surrounding distribution of column-integrated water vapor (color map). (c) CoSMIR (nadir) brightness temperatures at 89, 165.5, and GHz. (d) CRS W-band radar reflectivity. (e) CRS Doppler velocity. (f) HIWRAP Ka-band radar reflectivity. (g) HIWRAP Ku-band radar reflectivity. The gray solid line indicates the P-3 flight altitude, and the black dashed line indicates the 0 °C level.
2.1.2 In situ observations from P-3 aircraft
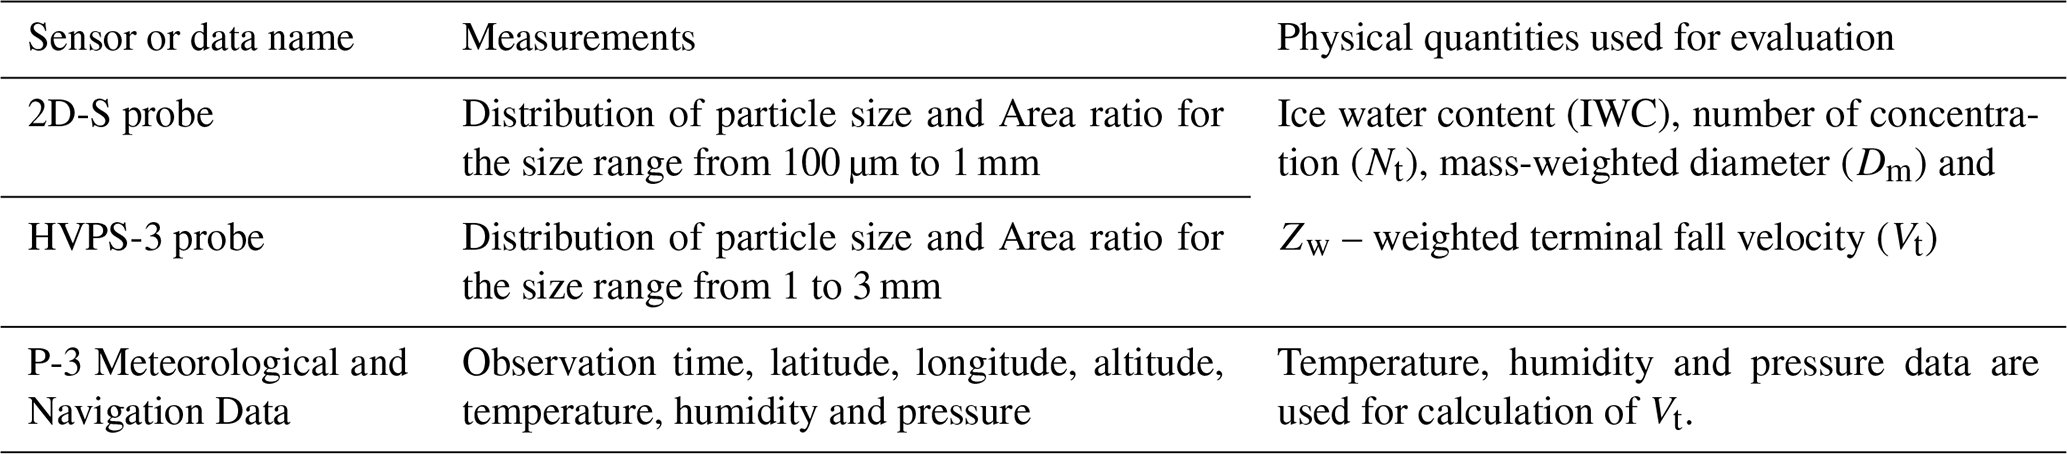
Table 3 lists the in situ instruments onboard the P-3 aircraft and the physical quantities used for algorithm validation. The Two-Dimensional Stereo probe (2D-S) and the High-Volume Precipitation Spectrometer (HVPS-3) are optical array probes that record two-dimensional shadow images of particles passing through horizontal and vertical arrays to measure particle size distributions (PSD) and area ratios Ar (the ratio of particle cross-sectional area to the area of the circumscribed circle) (Field et al., 2006; Lawson et al., 2006). In this study, the mean of the horizontal and vertical array measurements is used when they are both valid. When one array data is missing, the valid one is adopted. The 2D-S is suitable for detecting particles smaller than approximately 1 mm, while the HVPS-3 is optimized for larger particles exceeding 1 mm. A merged product combining 2D-S and HVPS-3 observations is used to obtain PSD and Ar data. The P-3 aircraft also records the observation time, position (latitude and longitude), flight altitude, temperature, humidity, and pressure. These data were obtained from the P-3 Meteorological and Navigation Data products.
The sampling intervals of the probe measurements are shown as red dots in Fig. 2a. As done for the radar observations, the probe measurements are spatially averaged within each CoSMIR footprint using Gaussian. The P-3 flight altitude during the case shown in Fig. 2 is indicated by gray solid lines in Fig. 2d–g. The examples of PSD and Ar measurements at this altitude are shown in Fig. 3a–b. From these microphysical probe measurements, several parameters used for algorithm validation are derived, including ice water content (IWC), total number concentration (Nt), mass-weighted mean diameter (Dm), and Zw-weighted terminal fall velocity (Vt).
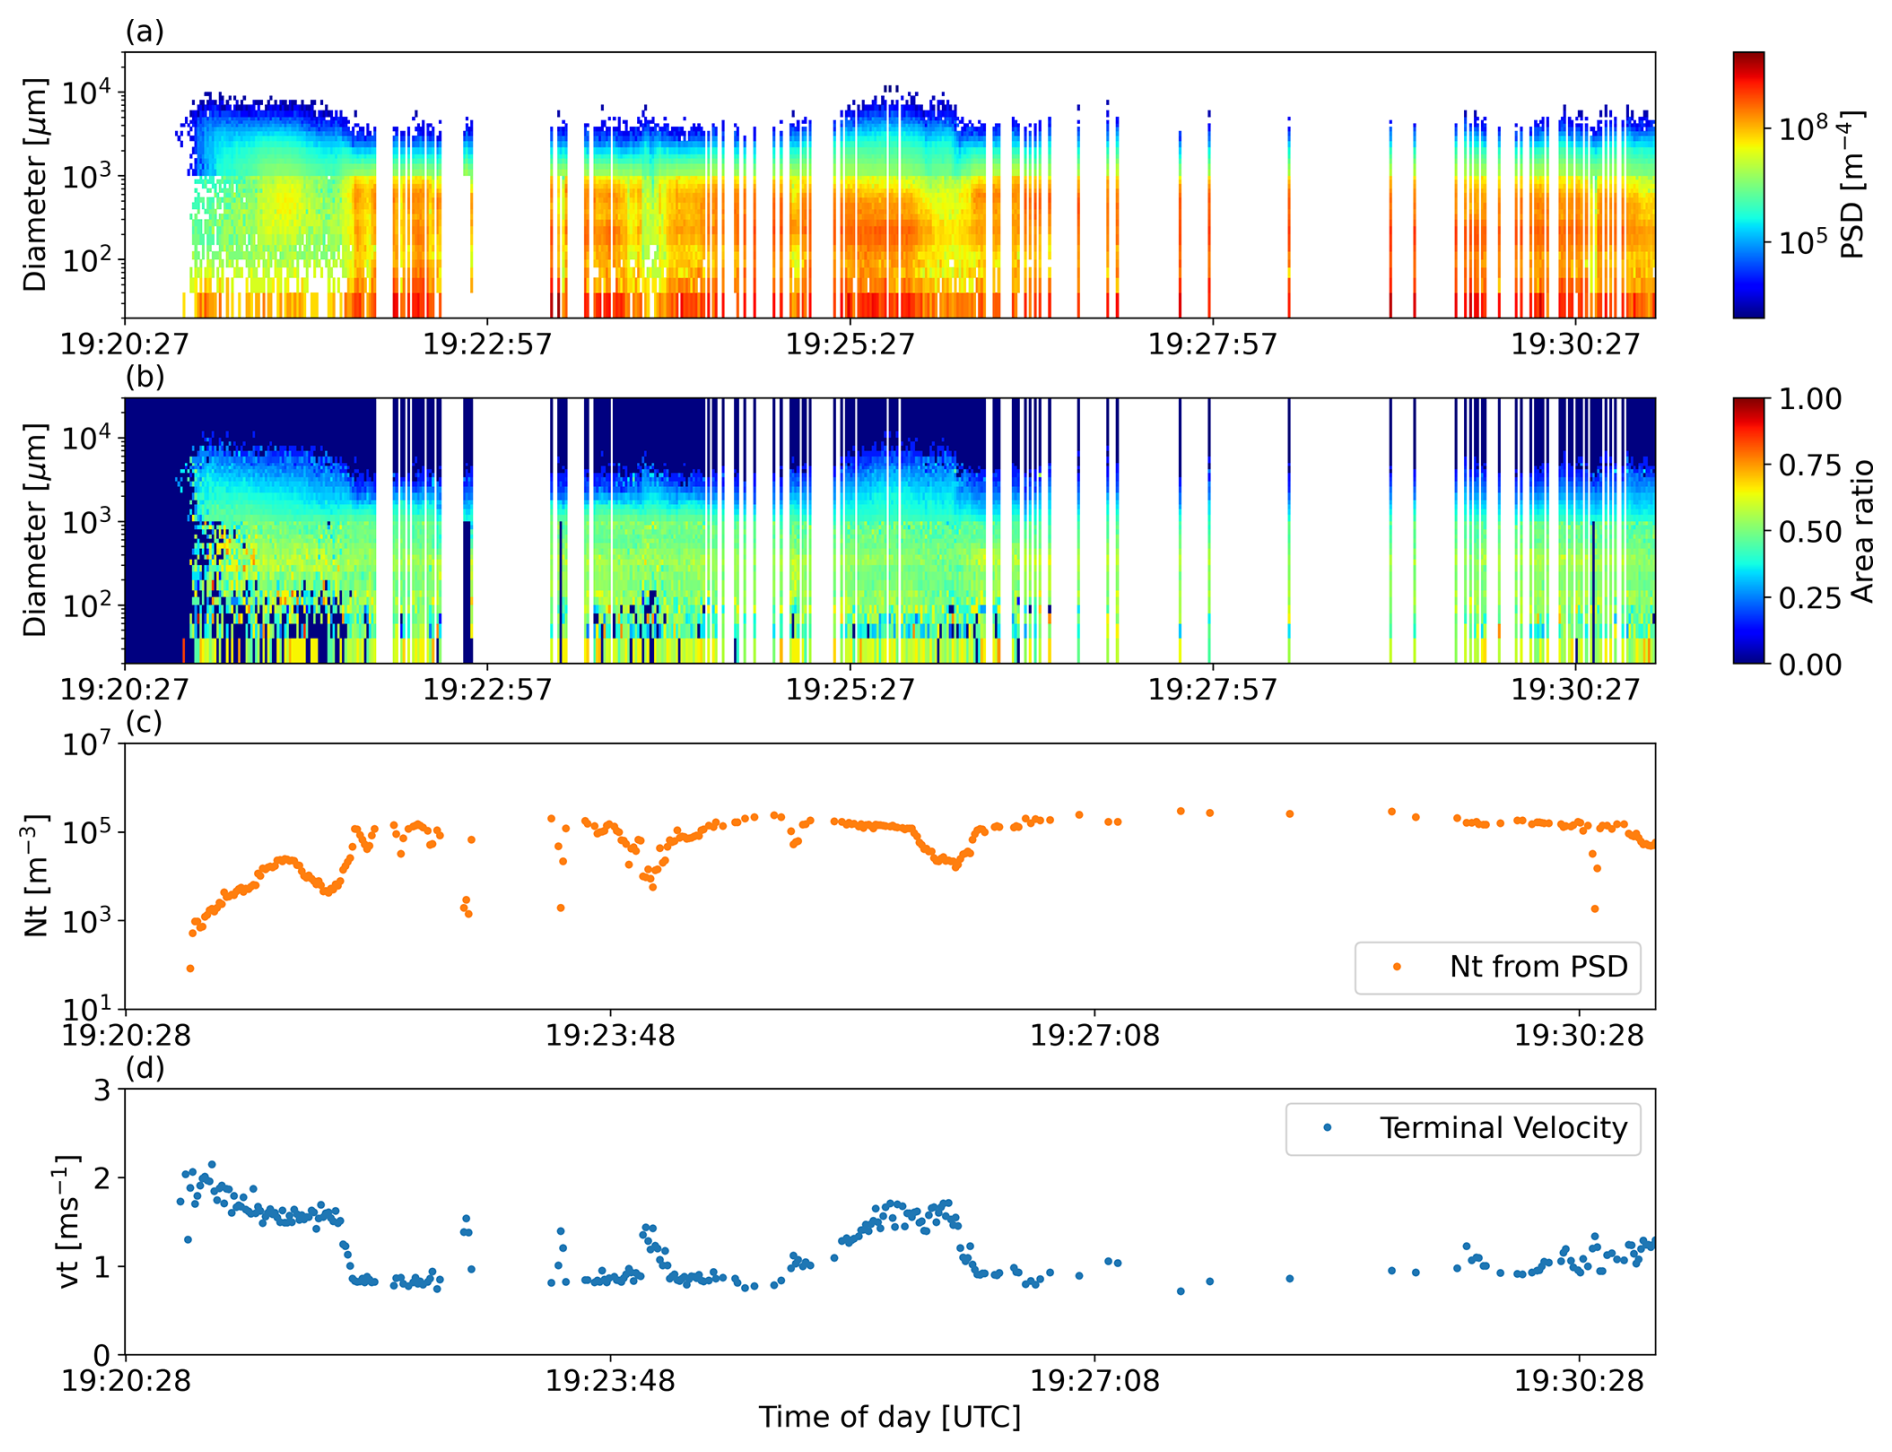
Figure 3Example of in situ probe measurements from the P-3 aircraft. (a) Particle size distribution (PSD). (b) Area ratio (Ar) distribution. (c) Total number concentration (Nt) and (d) Zw-weighted terminal fall velocity (Vt) calculated from the PSD in (a) and Ar in (b).
Table 3P-3 aircraft in situ measurements used for algorithm evaluation.
The method used to derive the cloud microphysical parameters (IWC, Nt, Dm and Vt) from the probe observations of PSD and Ar is described below. The parameters Nt, Dm and IWC are obtained from the measured PSD N(D) using Eqs. (1), (2) and (3):
here, D represents the maximum dimension of a particle. The integral is applied to diameters larger than 100 µm only, because probe measurements for particles smaller than 100 µm are known to have large uncertainties. The mass–dimension relationship m(D) in Eq. (3) depends on the assumed particle habit. For consistency between the retrieval and validation, the same m(D) relationship as assumed in the combined retrieval algorithm is adopted in Eq. (3). Details of the m(D) relationship are described in Sect. 3.2. Figure 3c shows examples of Nt derived from the PSD measurements in Fig. 3a using the above procedure.
The terminal fall velocity of individual particles, vt(D), is calculated from the PSD and Ar probe observations using the theoretical and empirical formulations proposed by Heymsfield and Westbrook (2010) as expressed by Eqs. (4)–(6):
here, ρair is the air density, η is the dynamic viscosity, both calculated using the temperature and pressure data from the P-3 Meteorological and Navigation Data. g denotes the gravitational acceleration. The boundary-layer depth δ0 and pressure drag coefficient C0 are taken from the coefficients used by Heymsfield and Westbrook (2010). X∗ represents the Best number, and Re denotes the Reynolds number. For validation using W-band Doppler velocity observations, it is convenient to use the terminal fall velocity weighted by the PSD and W-band backscattering cross section σb(D) defined as
Because σb(D) depends on the assumed particle habit, the same σb(D) as used in the combined retrieval algorithm (Sect. 3.2) is employed. Figure 3d shows the Zw-weighted terminal fall velocity Vt calculated from the PSD and Ar measurements in Fig. 3a–b.
2.2 Forward model and ancillary data
The combined retrieval algorithm for ice hydrometeors employs the Joint Simulator for Satellite Sensors (J-sim) developed by the Japan Aerospace Exploration Agency (JAXA) (Hashino et al., 2013, 2016) for forward simulations. J-sim contains the Satellite Data Simulator Unit (SDSU) (Masunaga et al., 2010), which enables simulation of a wide range of microwave satellite observations, including W-band Doppler radar, Ku- and Ka-band radar, and microwave radiometers (Ohara et al., 2023; Ohara and Masunaga, 2025). J-sim is also applicable to analogous airborne sensors such as CRS, CoSMIR, and HIWRAP.
As ancillary data for the forward calculations, vertical profiles of temperature, water vapor, and pressure, as well as surface temperature and sea surface wind speed, are taken from the ERA5 hourly reanalysis data (Hersbach et al., 2023). Within cloudy and precipitating regions ( dBZ), relative humidity is set to 100 % instead of using ERA5 values. These variables are treated as fixed inputs in the retrieval algorithm described in the next section.
Land surface emissivity is modeled by the NESDIS microwave land emissivity model (Weng et al., 2001) implemented in the radiative transfer model in use (J-Sim). The emissivity is calculated assuming a vegetation fraction of 100 %, soil moisture fraction of 50 %, surface temperature from ERA5 hourly data, and zero snow depth in this study. These simplified assumptions may introduce errors in surface emissivity, particularly under conditions such as snow cover, which could affect primarily low-frequency brightness temperatures. However, the high-frequency channels (≥ 89 GHz) used in this study are more strongly influenced by water vapor absorption and cloud/precipitation scattering, and thus have reduced sensitivity to the surface, suggesting that the impact is relatively small.
The vertical profile of liquid water content (LWC) is estimated from the HIWRAP Ku-band radar reflectivity using the ZKu–LWC relationship (Masunaga, 2022) derived under the assumption of the Marshall and Palmer (1948) raindrop size distribution and the Rayleigh-scattering approximation. The liquid particle size distribution is assumed to follow the exponential form of Marshall and Palmer (1948), where , and λl varies as a function of LWC. Under these assumptions and the Rayleigh approximation, is obtained (see Chapter 10.2.1 of Masunaga, 2022). The uncertainty associated with this LWC estimate is discussed in the Supplement. In the present retrieval framework, liquid and ice particles are treated separately based on temperature from ERA5 hourly data, and thus mixed-phase conditions are not considered. The treatment of supercooled liquid water is a potentially critical limitation of the current approach and should be addressed in future work.
3.1 Overview of combined algorithm
The structure of the retrieval algorithm is illustrated in Fig. 4. The overall framework is based on O25. In the first step, the algorithm rapidly estimates an initial guess of ice-hydrometeor profiles reasonably close to the solution, using an existing training dataset. In the second step, these initial values are refined through an optimal estimation (OE) method that updates the solution so it is further consistent with the multi-sensor observations along with estimated retrieval uncertainties. Finally, the terminal fall velocity of cloud and precipitation particles and the vertical air motion are estimated using the retrieved cloud-ice parameters and the observed W-band Doppler velocity (Vd).
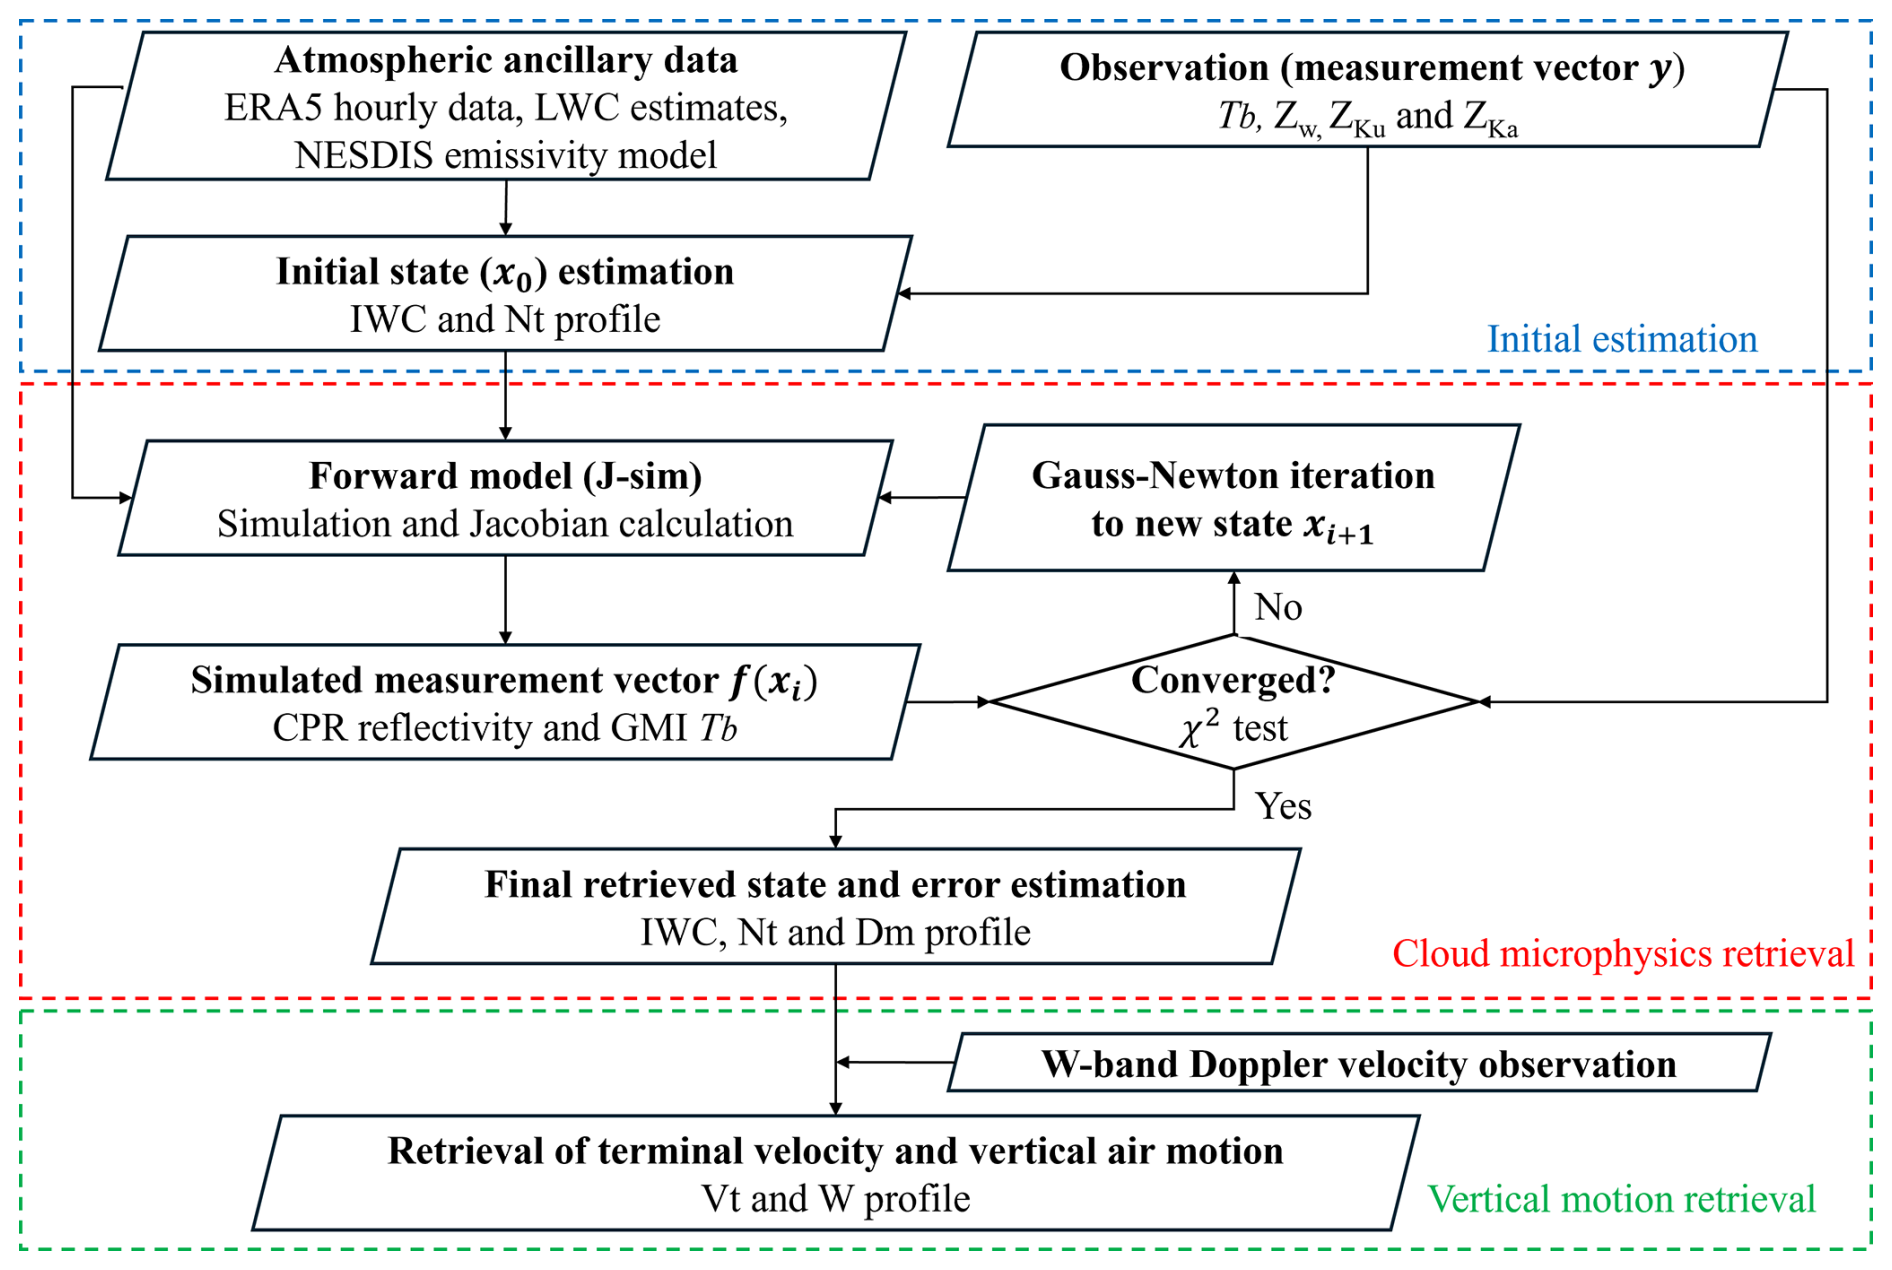
Figure 4Flow of the combined retrieval algorithm using multi-band radar and radiometer measurements. The blue dashed box denotes the initial-value estimation flow. The red dashed box indicates the optimal-estimation retrieval flow for cloud microphysical parameters (IWC, Nt and Dm). The part marked by green dashed box estimates Vt and W.
This section briefly revisits the algorithm framework described in O25 and highlights the improvements implemented in this study. The major updates include: (1) the incorporation of a mixed-habit representation of nonspherical ice particles (Sect. 3.2); (2) an improved initial estimation method (Sect. 3.3); (3) the extension of the OE framework to include ZKu and ZKa profiles in addition to Zw profile and high-frequency Tb (Sect. 3.3); and (4) the estimation of terminal fall velocity and vertical air motion (Sect. 3.3). Finally, Sect. 3.4 presents theoretical sensitivity experiments to demonstrate the difference in scattering characteristics captured by high-frequency Tb, Zw, ZKu and ZKa measurements, as well as the expected synergistic benefits among these sensors.
3.2 Cloud microphysical assumption
The particle size distribution (PSD) is one of the key microphysical properties that governs both bulk cloud physical quantities (Eqs. 1–3) and the microwave scattering characteristics. In many previous studies, the PSD has been commonly approximated using analytical functions such as exponential, gamma, or lognormal distributions for computational convenience (Austin et al., 2009; Deng et al., 2010). Ice particles gradually grow as they fall through the cloud, evolving from small pristine crystals into larger aggregates, snowflakes, or graupel through processes such as vapor deposition, aggregation, and riming. To account for this vertical growth, several studies have introduced temperature-dependent PSD formulations (Austin et al., 2009; Heymsfield et al., 2013). Following O25, the present study assumes the temperature-dependent gamma PSD proposed by Heymsfield et al. (2013) expressed as
here N0 is the intercept parameter, μ is the dispersion parameter, λ is the slope parameter, and D denotes the maximum particle dimension. In the retrieval framework, μ is assumed as a function of air temperature (T) according to Eq. (8), while N0 and λ are free parameters to be optimized in the algorithm.
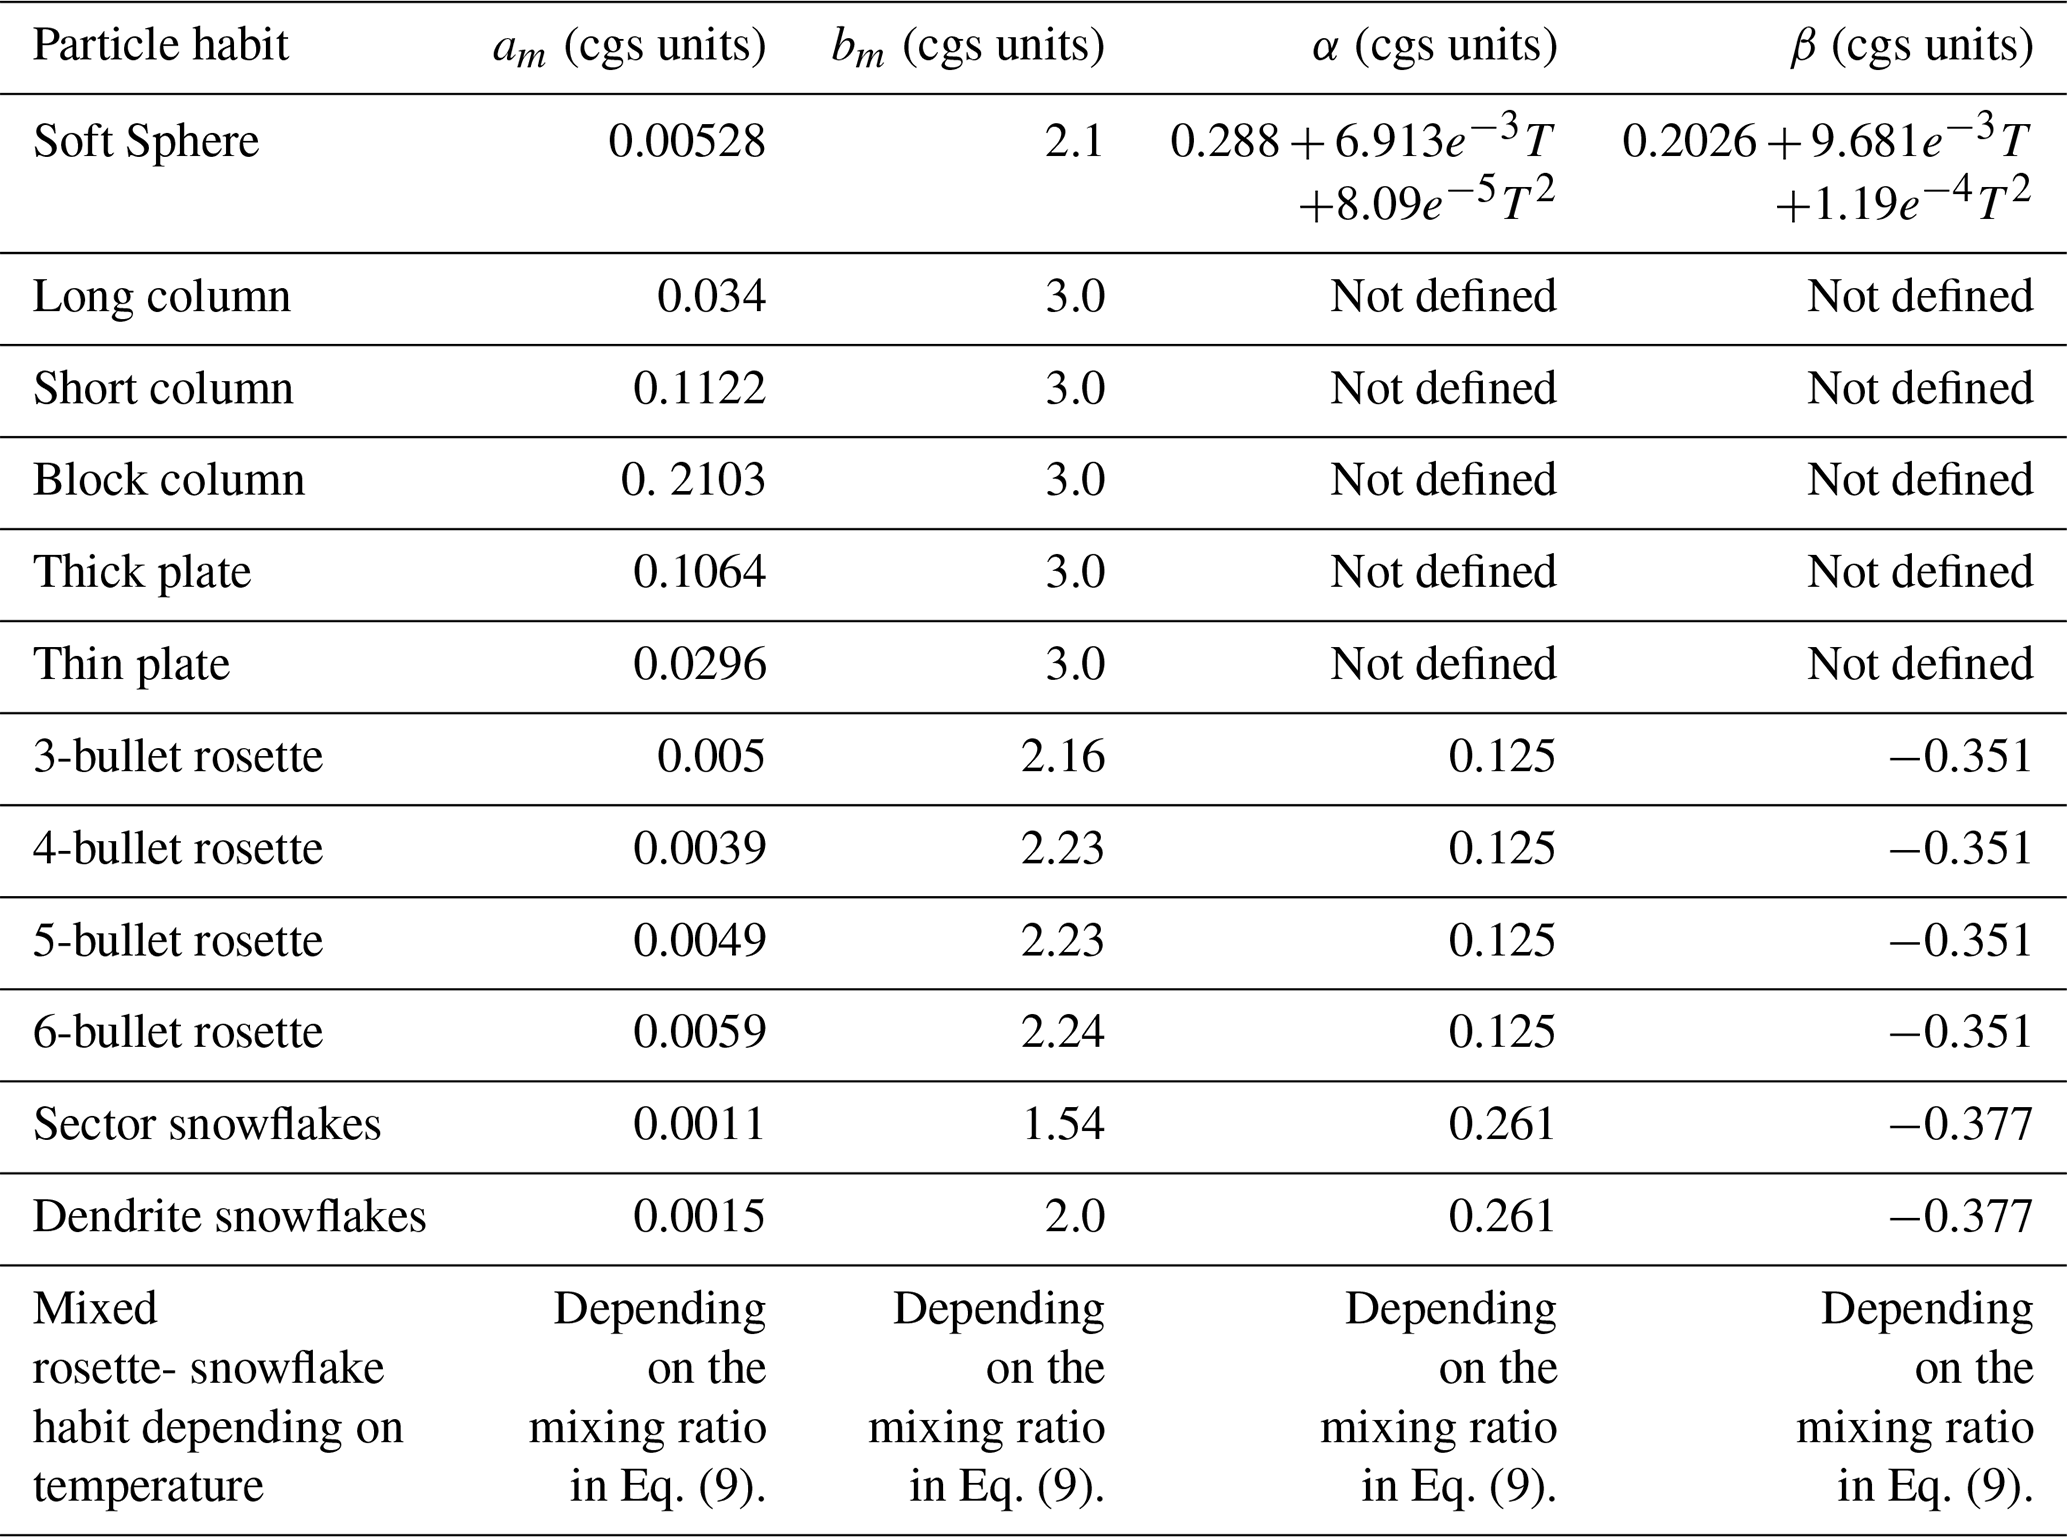
Another key microphysical property is the particle habit. In the present retrieval framework, the particle habit is prescribed in advance instead of being treated as a retrievable parameter. The particle habit assumption strongly affects both the microphysical relationships, such as the mass–dimension m(D) and area-ratio Ar(D) relationships, and the microwave single-scattering properties (SSPs). Selecting an appropriate particle habit is essential for achieving accurate ice-hydrometeor retrievals. In previous studies, the m(D) and Ar(D) relationships for various particle models have commonly been expressed in power-law form, m(D)=aDb and Ar(D)=αDβ, with the coefficients ( and β) varying according to the assumed habit (Eriksson et al., 2018; Heymsfield et al, 2013; Liu, 2008). While SSPs for spherical particles can be computed exactly using Mie theory, the SSPs of nonspherical particles in the microwave regime are typically obtained from precomputed databases generated using the Discrete Dipole Approximation (DDA) (Draine and Flatau, 1994; Liu, 2008; Okamoto, 2002).
Table 4 lists the power-law coefficients ( and β) of m(D) and Ar (D) for each particle habit assumed in this study. The total of 13 particle-habit models are evaluated, consisting of (1) the soft-sphere model based on the m(D) and Ar(D) relationships reported by Heymsfield et al. (2013), with SSPs computed using Mie theory; (2) 11 nonspherical particle models from Liu (2008), each with distinct m(D), Ar (D), and DDA-derived SSPs; and (3) a temperature-dependent mixed-habit configuration described below. Whereas O25 assumed a single particle habit independent of environmental conditions, previous observational and laboratory studies have shown that the dominant ice-particle habit in nature is primarily controlled by temperature and secondarily by ice supersaturation. Under highly supersaturated conditions at temperatures below −40 °C, bullet rosettes are known to dominate (Bailey and Hallett, 2004, 2009), and aircraft observations have confirmed the prevalence of rosettes in cirrus at similar temperatures (Lawson et al., 2019). For temperatures above −40 °C, the habit distribution becomes increasingly complex. Bullet rosettes originating in upper levels may grow into plate-like polycrystals as they fall, while dendrite and sector snowflakes tend to dominate at temperatures warmer than −20 °C (Bailey and Hallett, 2009). Inspired by this physical background, this study defines a temperature-dependent mixed-habit configuration: bullet rosettes are assumed for all particles at temperatures below −40 °C, while the fraction of bullet rosettes (Fr) linearly decreases as the fraction of dendrite/sector snowflakes (Fs) increases with temperature between −40 and 0 °C. This mixing ratio (Fr and Fs) is expressed by the following equation.
The impact of these habit assumptions on retrieval performance is discussed in Sect. 4.3.
Table 4Power-law coefficients for the mass–dimension m(D) and area ratio Ar(D) relationships associated with the ice-particle habits used in this study. The coefficients for the soft-sphere model are taken from Heymsfield et al. (2013), while those for the other nonspherical particle models are taken from Liu (2008). For the column-like and plate-like nonspherical models, α and β are not defined because no reported values are available. The unit of temperature T is °C.
3.3 Synergistic cloud microphysics retrieval using multi-band radars and radiometer
This subsection describes the retrieval algorithm illustrated in Fig. 4. The first step, marked by the blue dashed box in Fig. 4, corresponds to the initial estimation. In O25, the initial values of cloud-ice profiles were estimated using a machine-learning approach trained on reference data derived from a cloud-resolving model, the Nonhydrostatic ICosahedral Atmospheric Model (NICAM), over tropical oceans. Simulated satellite observations from the reference data using J-sim were used as input to the machine-learning system. This was proved to be a workable approach but is limited by the model performance such as the extent to which simulated cloud properties represent the variability in nature. In this study, the training strategy is modified and simplified. First, a wide range of cloud temperatures and IWC values are prescribed, and the corresponding Zw is simulated using the forward model (J-sim). Because a temperature-dependent gamma PSD with parameters μ(T) and λ(T) are assumed here (Heymsfield et al., 2013), the Zw–IWC relationship depends on the cloud temperature. Using this dataset, a regression model is trained to predict IWC from Zw and cloud temperature. Once IWC is retrieved, the associated Nt can be diagnosed from the μ(T) and λ(T). Applying this method to observed Zw profiles from CRS and temperature profiles from the ERA5 hourly reanalysis provides initial guess of the vertical profiles of IWC and Nt. However, this initial estimation still contains errors arising from signal attenuation of Zw within the cloud and the assumption that λ depends solely on temperature. These errors are corrected within OE framework in the second step of the algorithm, shown in the red dashed box of Fig. 4. In this step, Zw attenuation is explicitly accounted for, and λ is treated as a free parameter.
In the OE framework, the initial profiles of IWC and Nt are optimized by using CRS Zw, CoSMIR Tb, HIWRAP ZKu and ZKa. The details of the OE implementation are based on the theoretical background given by Rodgers, (2000) as described in O25. This subsection provides a brief overview and modifications introduced in this study. The vertical distribution of ice-phase hydrometeors to be retrieved is represented by the state vector X, and the observational inputs are represented by the measurement vector Y. The retrieval problem is expressed as the maximization of the posterior probability density function ppost(X|Y), which is equivalent to minimizing the cost function shown in Eq. (11) under the assumption of Gaussian probability density function.
The state vector X contains the vertical profiles of IWC and Nt, where n denotes the number of cloud layers. In O25, the measurement vector Y consisted only of the Tb and Zw vertical profiles, whereas the vertical profiles of ZKu and ZKa are additionally included in this study. F(X) is the simulated measurement vector (Tb, Zw, ZKu, ZKa) from the state vector X using a forward model (J-sim). The a priori state vector Xa corresponds to the initial estimate of the ice profile, and the error covariance matrices Sa and Se are defined in the same manner as in O25. Details of the specifications of Sa and Se are described in Sect. 3.3 of O25. The cost function is minimized iteratively using the Gauss–Newton method Eq. (12).
The Jacobian matrix Hi, which represents the sensitivity of each observation to perturbations in IWC and Nt at each layer, is computed by repeated forward simulations and is updated each time the state vector is updated. The iterations are continued until the χ2 convergence criterion of Rodgers (2000) is satisfied, yielding the final retrieved state vector Xfin. The uncertainty of the retrieval is then calculated from the final Jacobian matrix Hfin using Eq. (14).
Using the retrieved IWC and Nt together with μ(T) assumed in Eq. (8), the PSD can be diagnosed as Nret(D). For the comparison with probe measurements, Nret(D) is substituted into Eqs. (1)–(7) to calculate the cloud microphysical parameters (IWC, Nt, Dm, and Vt) for particles larger than 100 µm to ensure consistency with the probe data. Here, the m(D) and Ar(D) relationships use the coefficients corresponding to the assumed particle habit (Table 4). Finally, the vertical air motion W is estimated by subtracting the retrieved terminal fall velocity Vt from the observed Doppler velocity Vd.
3.4 Synergy expected by combined observation from microwave sensors
This subsection discusses qualitatively the differences in the scattering signals detected by the multiple microwave sensors used as inputs to the algorithm as well as the expected synergy effects. The observed high-frequency Tb by passive microwave radiometers are sensitive to the extinction (absorption and scattering) by ice hydrometeors, while radar reflectivity mainly reflects their backscattering properties. Figure 5 shows contour lines of the 13 GHz backscattering coefficient σb13 (green), the 94 GHz backscattering coefficient σb94 (blue), and the 183±7 GHz extinction coefficient σe183± 7 (orange), obtained by varying IWC and Nt over a wide range. The bullet-rosette particles are assumed here. In the upper-left part of the figure, all three coefficients exhibit nearly parallel contour patterns, indicating that the observed scattering information is largely redundant across sensors. In contrast, in the lower-right region – where IWC is large and Nt is small, meaning that the particle size becomes larger – the contour patterns differ substantially. In particular, the contour lines of the σe183± 7 are nearly orthogonal to those of the σb13 and σb94 coefficients. This difference in contour patterns arises because 13 and 94 GHz wavelength remain within the Rayleigh-scattering regime for such particle sizes, while the shorter wavelength of 183 GHz interacts with the particles in Mie-scattering regime.
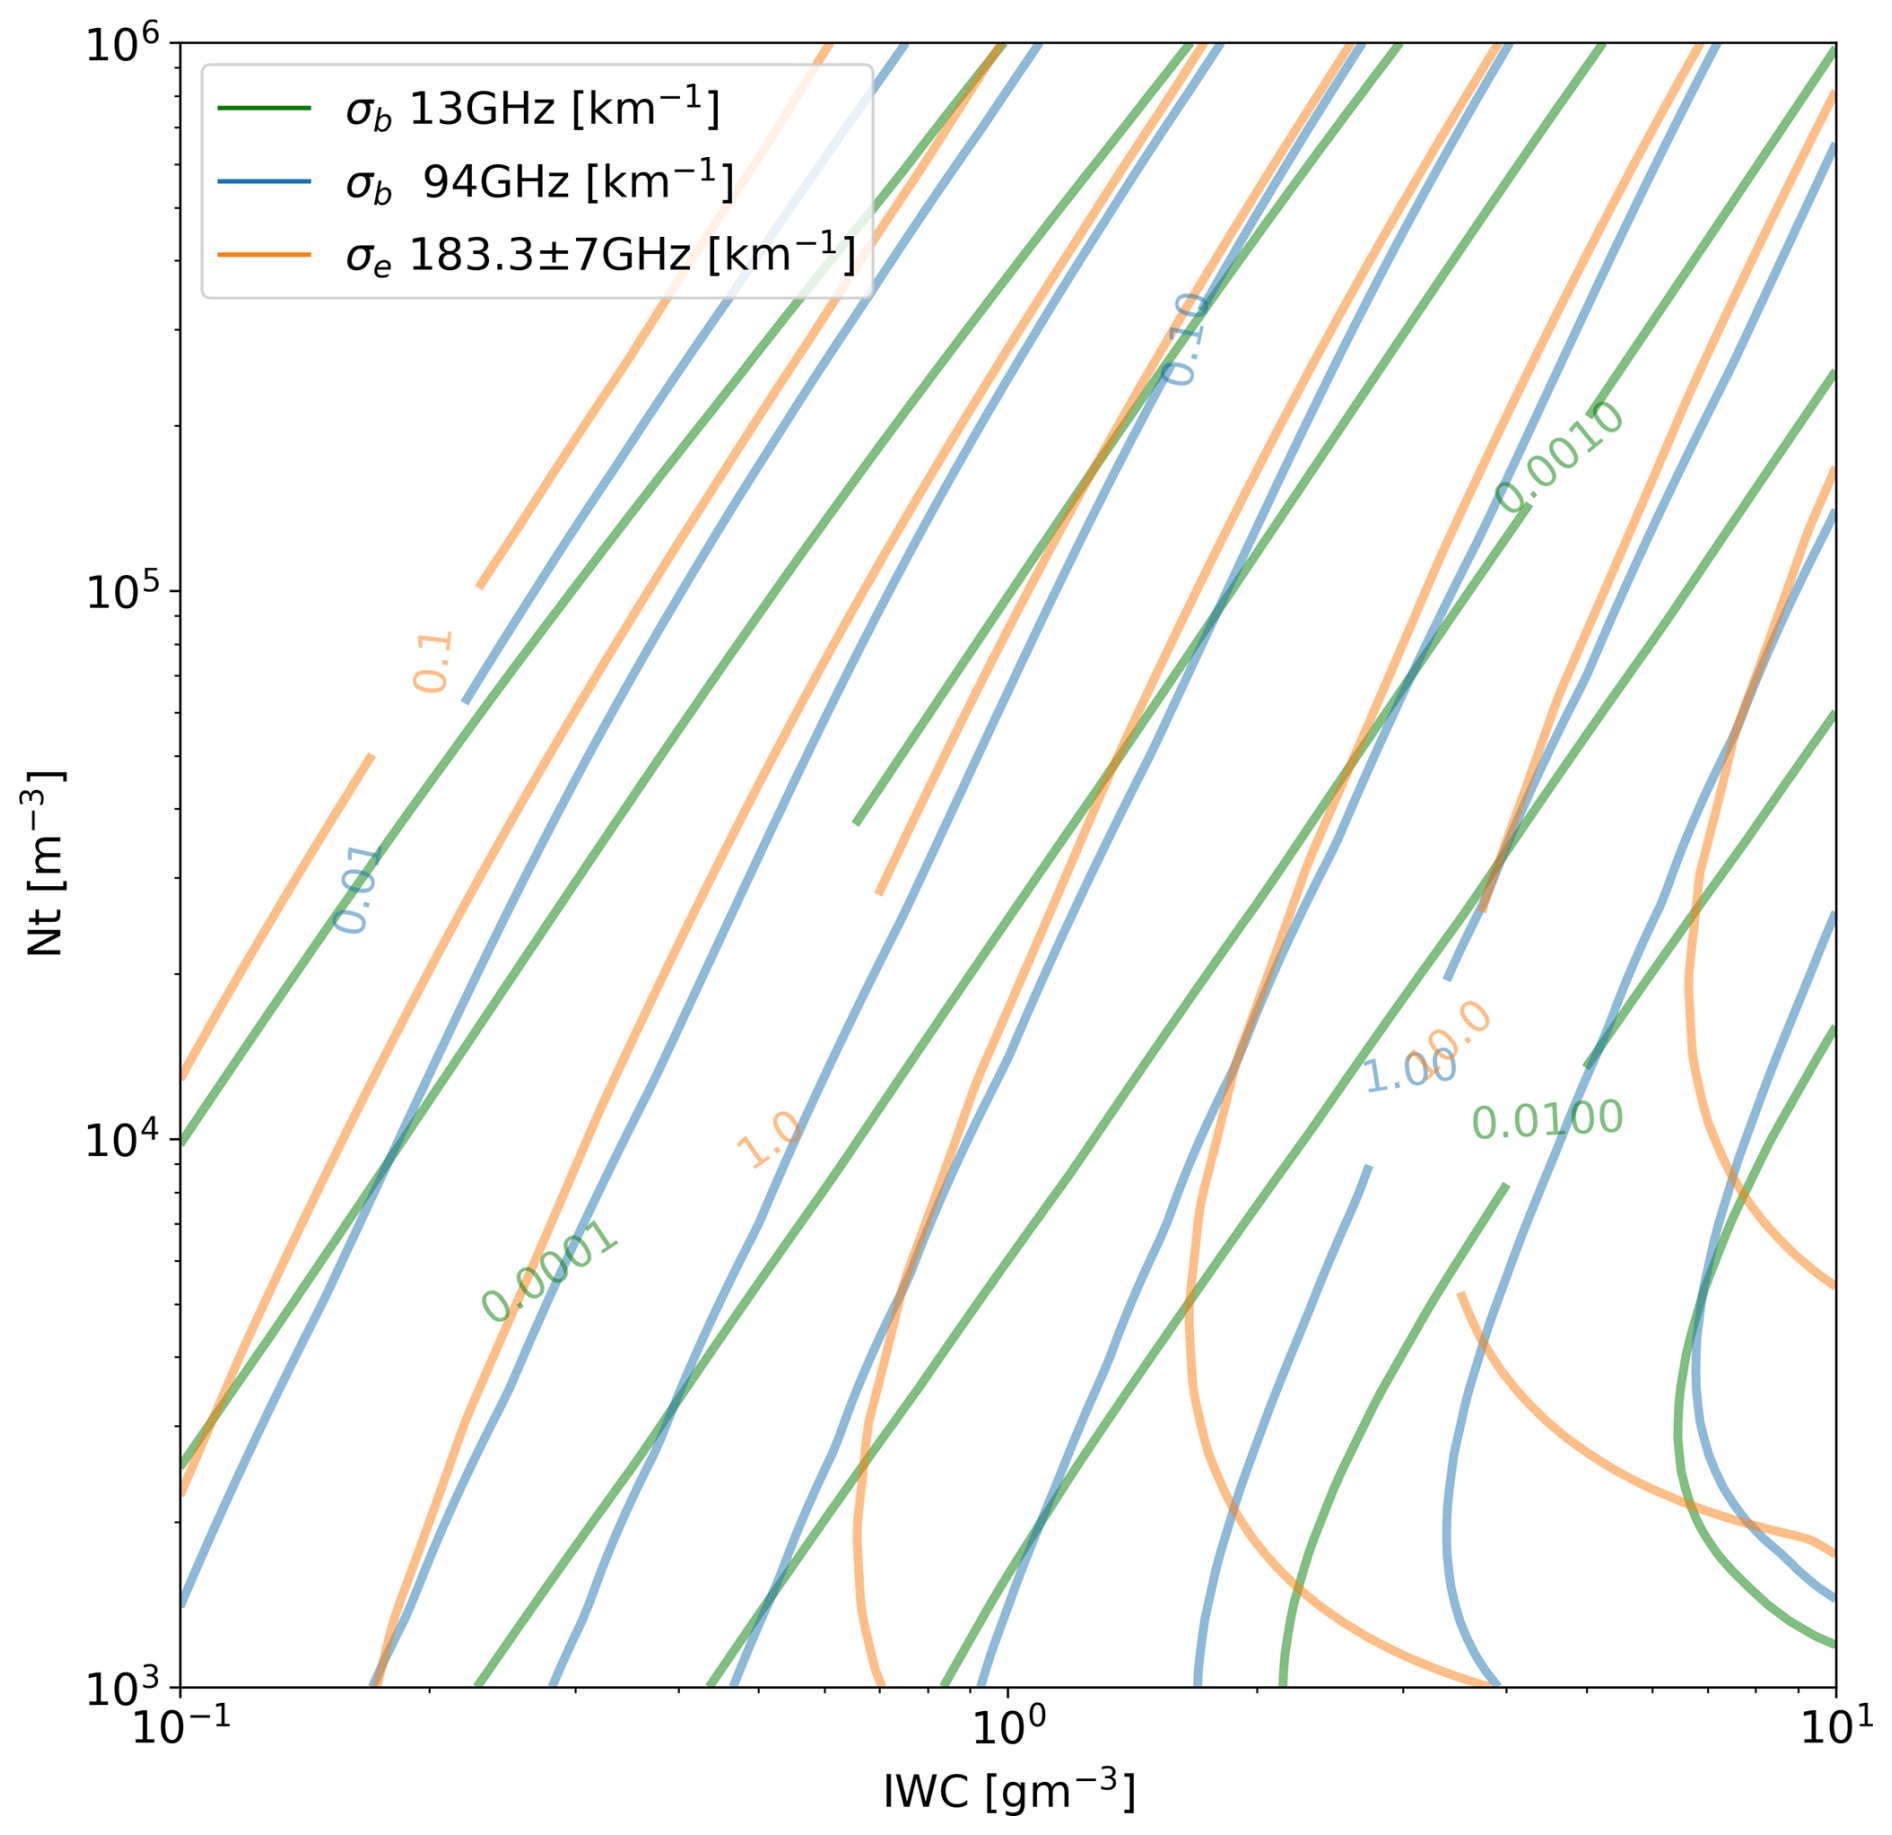
Figure 5Sensitivity of the 13 GHz backscattering coefficient σb13 (green), the 94 GHz backscattering coefficient σb94 (blue), and the 183±7 GHz extinction coefficient σe183± 7 (orange).
The near orthogonality of the two contours indicate that measurements from the two sensors carry independent information in retrieving Nt and IWC simultaneously (Pfreundschuh et al., 2020). In our retrieval framework, these complementary sensitivities are explicitly incorporated through the Jacobian matrix Hi in Eq. (13) to optimize the state vector X. For large ice hydrometeors, the combined use of radar and radiometer observations is expected to reduce the retrieval uncertainty in cloud microphysical properties that cannot be constrained by single sensor.
4.1 Validation of cloud microphysical parameters
In this section, the performance of the retrieval algorithm is assessed through a comparison with in situ observations. Figure 6a–c show the retrieved vertical cross-sections of IWC, Nt, and Dm for the deep stratiform snowfall event over land on 5 February 2020 listed in Table 1. The retrieval was conducted under the assumption of a mixed rosette–snowflake particle habit as described in Sect. 3.2. The dashed line in each panel indicates the 0 °C level, and the solid gray line marks the flight altitude of the P-3 aircraft carrying the probe instruments, enabling a direct comparison at this altitude. Figure 6d–f show the comparison between the retrieved values (orange) and the probe observations (blue) of IWC, Nt, and Dm. Overall, the retrieved values exhibit good agreement with the in situ probe measurements in magnitude and variability.
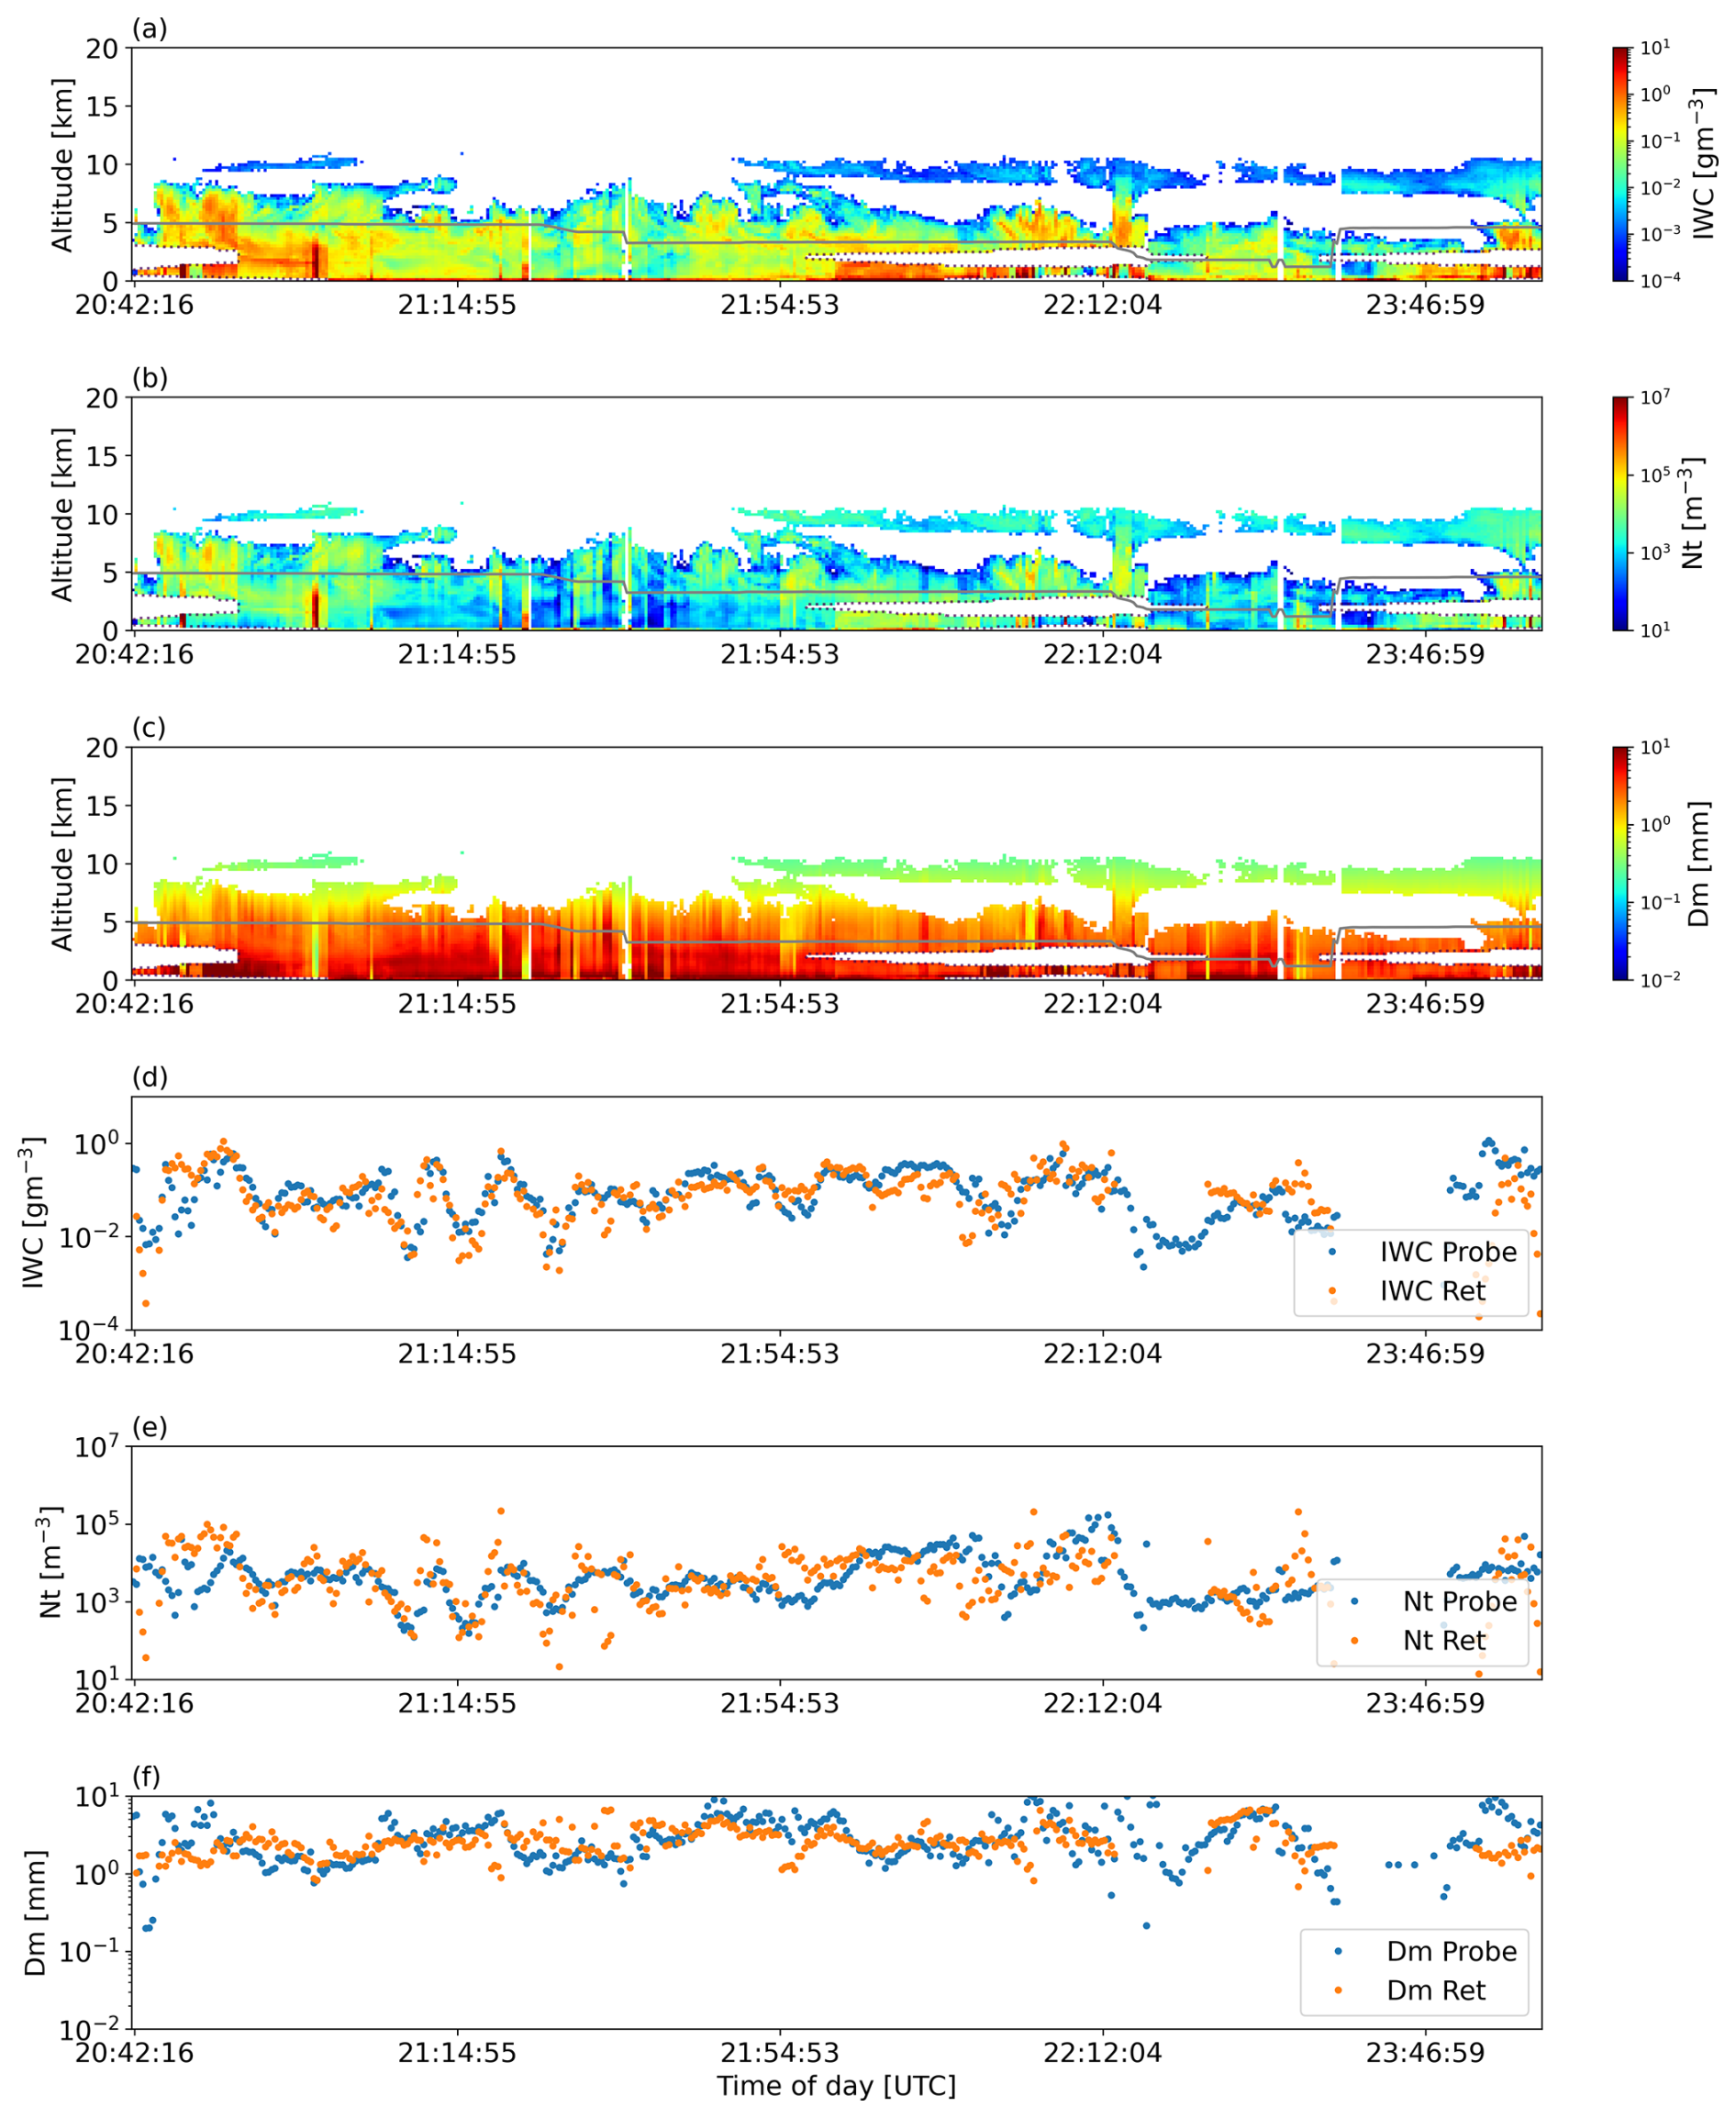
Figure 6Comparison between the retrieved values and in situ probe measurements for the deep stratiform snowfall event over land on 5 February 2020. The retrieved vertical profiles of (a) IWC, (b) Nt, and (c) Dm. Comparisons between the retrieved values (orange) and probe measurements (blue) of (f) IWC, (g) Nt, and (h) Dm at the P-3 aircraft flight altitude (gray lines in a–c).
Figure 7 is as Fig. 6 but for the deep convective rainfall case over ocean on 25 January 2020 shown in Fig. 2. In this case, a consistent bias is evident between 19:20 and 19:26 UTC while the overall variability is still captured. One possible explanation for this bias is that the in-situ measurements were obtained near the cloud base or cloud edges, where the influence of spatiotemporal mismatch is more substantial. Another possible explanation is that the bias arises from assumptions regarding particle habit and other microphysical properties. For example, the assumed mixed rosette–snowflake habit, where rosette particles formed in the upper layer fall and grow into snowflakes, may not be appropriate in updraft regions such as those in the cases shown in Figs. 2 and 7. Rather, snow and graupel particles formed at lower levels can be transported upward and mixed with particles generated aloft within an updraft. The impact of particle habit assumptions on retrieval accuracy will be discussed in the next section.
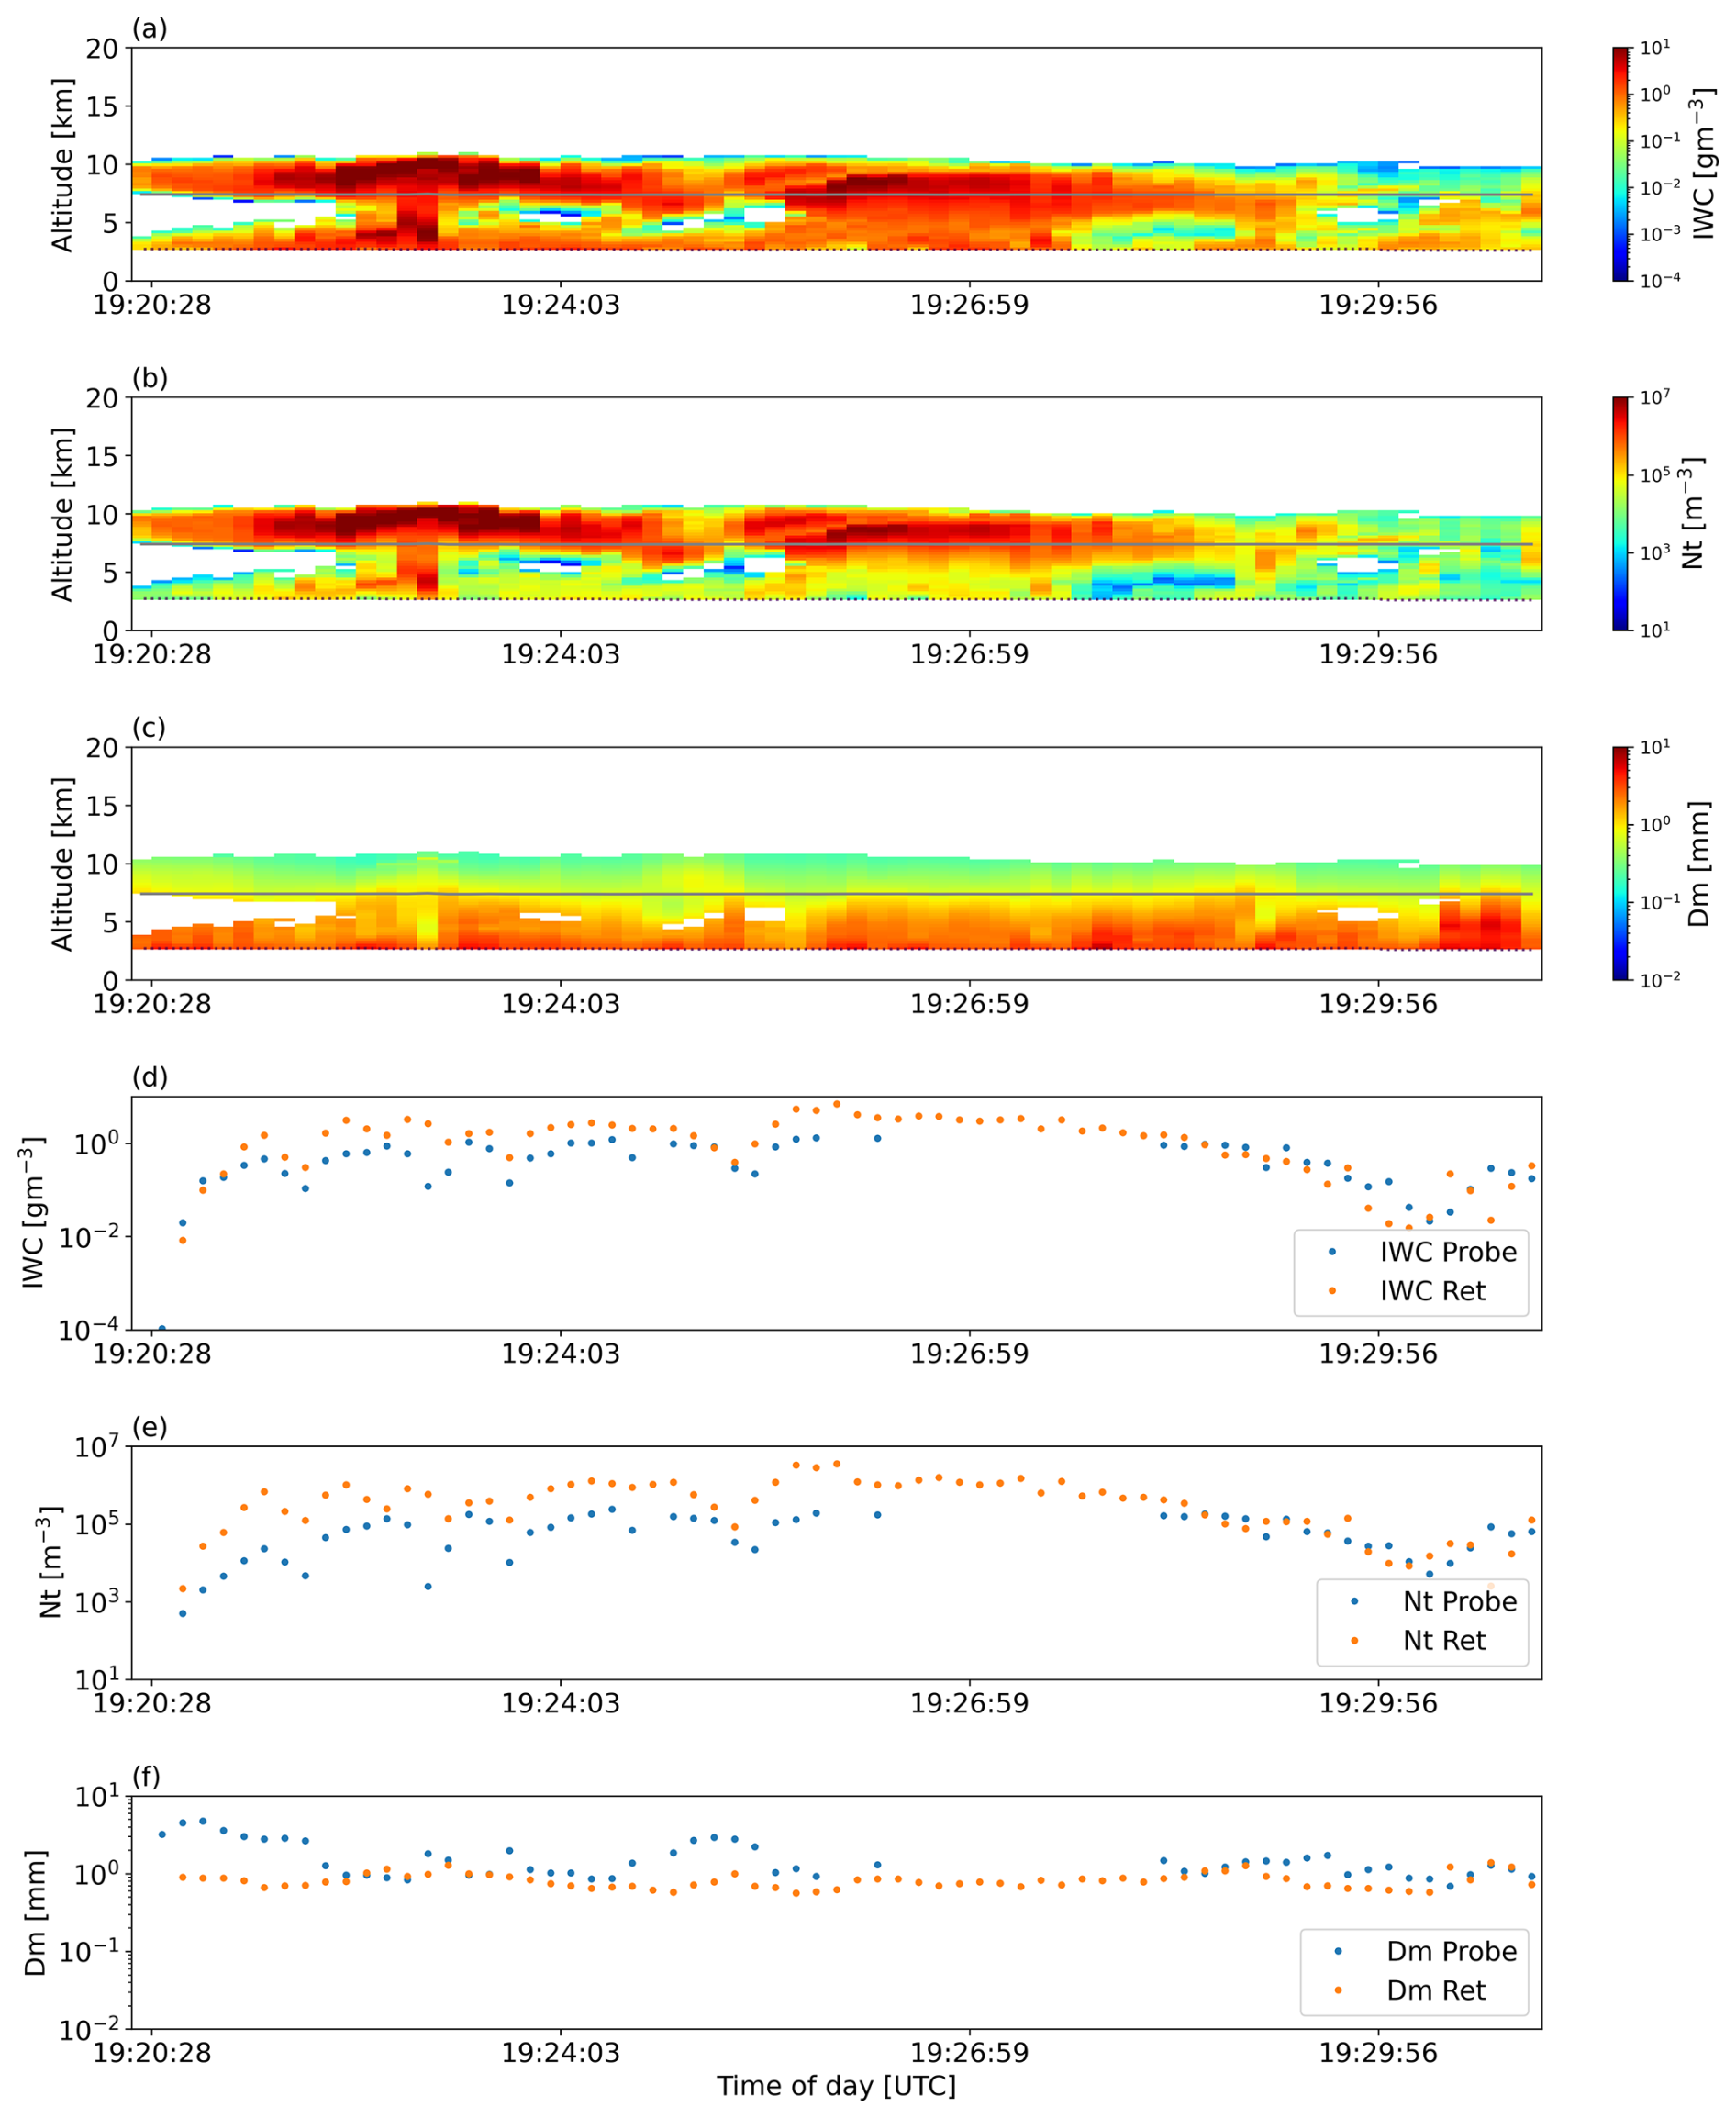
Figure 7Same comparison as shown in Fig. 6, but for the deep convective rainfall case over the ocean on 25 January 2020.
Figure 8 shows scatter plots comparing the retrieved values with the probe measurements for all cases listed in Table 1. Figure 8a–c correspond to the results for IWC, Nt, and Dm, respectively. The color scale indicates the number of data points contained in each bin. Although the scatter plots exhibit a considerable spread, mean bias relative to the probe data (in logarithmic scale) is small. The mean ratios of the retrieved values to the probe data are 1.01, 0.97, and 1.05 for IWC, Nt, and Dm, respectively. Deng et al. (2013) reported that the flight-mean ratios of retrieved IWC to in-situ values for the existing cloud-ice products 2C-ICE, DARDAR, and 2B-CWC-RVOD were 1.12, 1.59, and 1.02, and that the flight-mean ratios for the effective radius re were 1.05, 1.18, and 1.61, respectively. These values are comparable to the present results. Possible sources of the spread in Fig. 8a–c include differences in spatial resolution between the P-3 in situ probes and the ER-2 measurements as shown in Fig. 2b in addition to the uncertainties in assumptions (PSD and ice habit etc.) built in the algorithm. Additional sources of error may include uncertainties in the assumed water vapor and LWC estimates, as well as the temporal mismatch between the ER-2 and P-3 observations. However, supplementary analyses (see Supplement) indicate that these factors have a limited impact on the ice-hydrometeor retrieval accuracy for the IMPACTS cases.
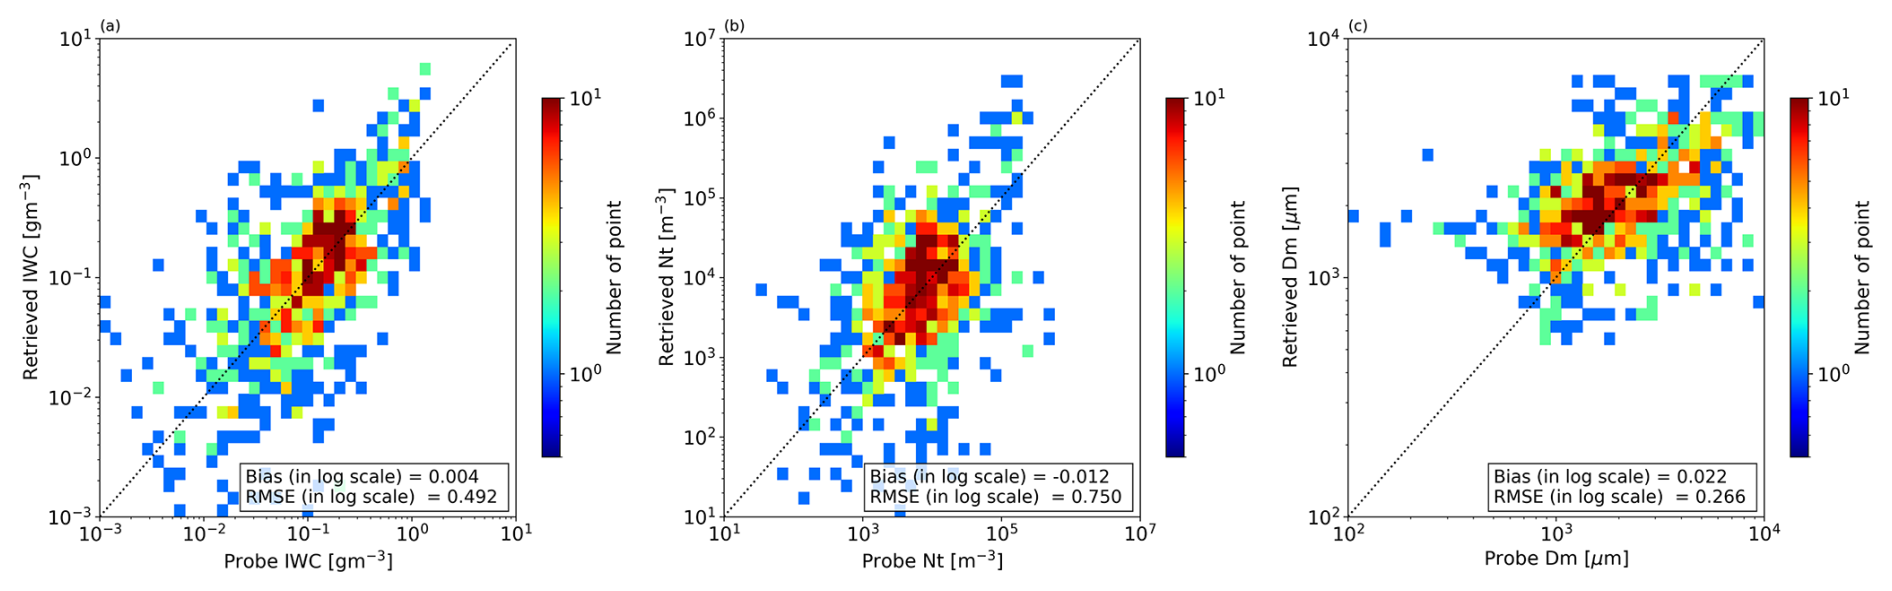
Figure 8Evaluation of the combined retrieval accuracy. Statistical comparisons between the retrieved and in situ probe–measured values of (a) IWC, (b) Nt, and (c) Dm. The bias and RMSE on a logarithmic scale are shown in the lower-right corner of each panel.
4.2 Impacts of particle habit assumptions
The impact of the assumed ice particle habit on the retrieval accuracy is examined. Retrievals are performed repeatedly for each habit listed in Table 4 one after another, and the results are compared with the in-situ measurements in the same manner as in Fig. 8. Figure 9 summarizes the retrieval bias and RMSE for IWC, Nt, and Dm under each habit assumption. Uncertainties in particle habit assumptions can lead to retrieval biases of up to roughly two orders of magnitude in IWC and Nt. It is evident that the retrieval accuracy for IWC and Nt is higher for bullet rosettes, snowflakes, soft spheres, or the mixed rosette-snowflake habit particles (denoted as “-b ros”, “-snow”, “Sphere” and “Mix”) than for column-like or plate-like particles (denoted as “-col” and “-pl”). Among these, the mixed habit assumption provides the best performance overall. It should be noted that this conclusion is derived only from the cases observed during the IMPACTS field campaign. This mixed-habit assumption may not necessarily be appropriate for other cloud environments, for example, tropical convective systems in which strong updrafts could mix various type of ice particles originating from many different temperature layers. To address this limitation, future work will use a global satellite radar–radiometer matchup dataset (Turk et al., 2021; Aoki et al., 2026) to evaluate whether the same habit assumptions remain valid across different regions, seasons, and cloud types.
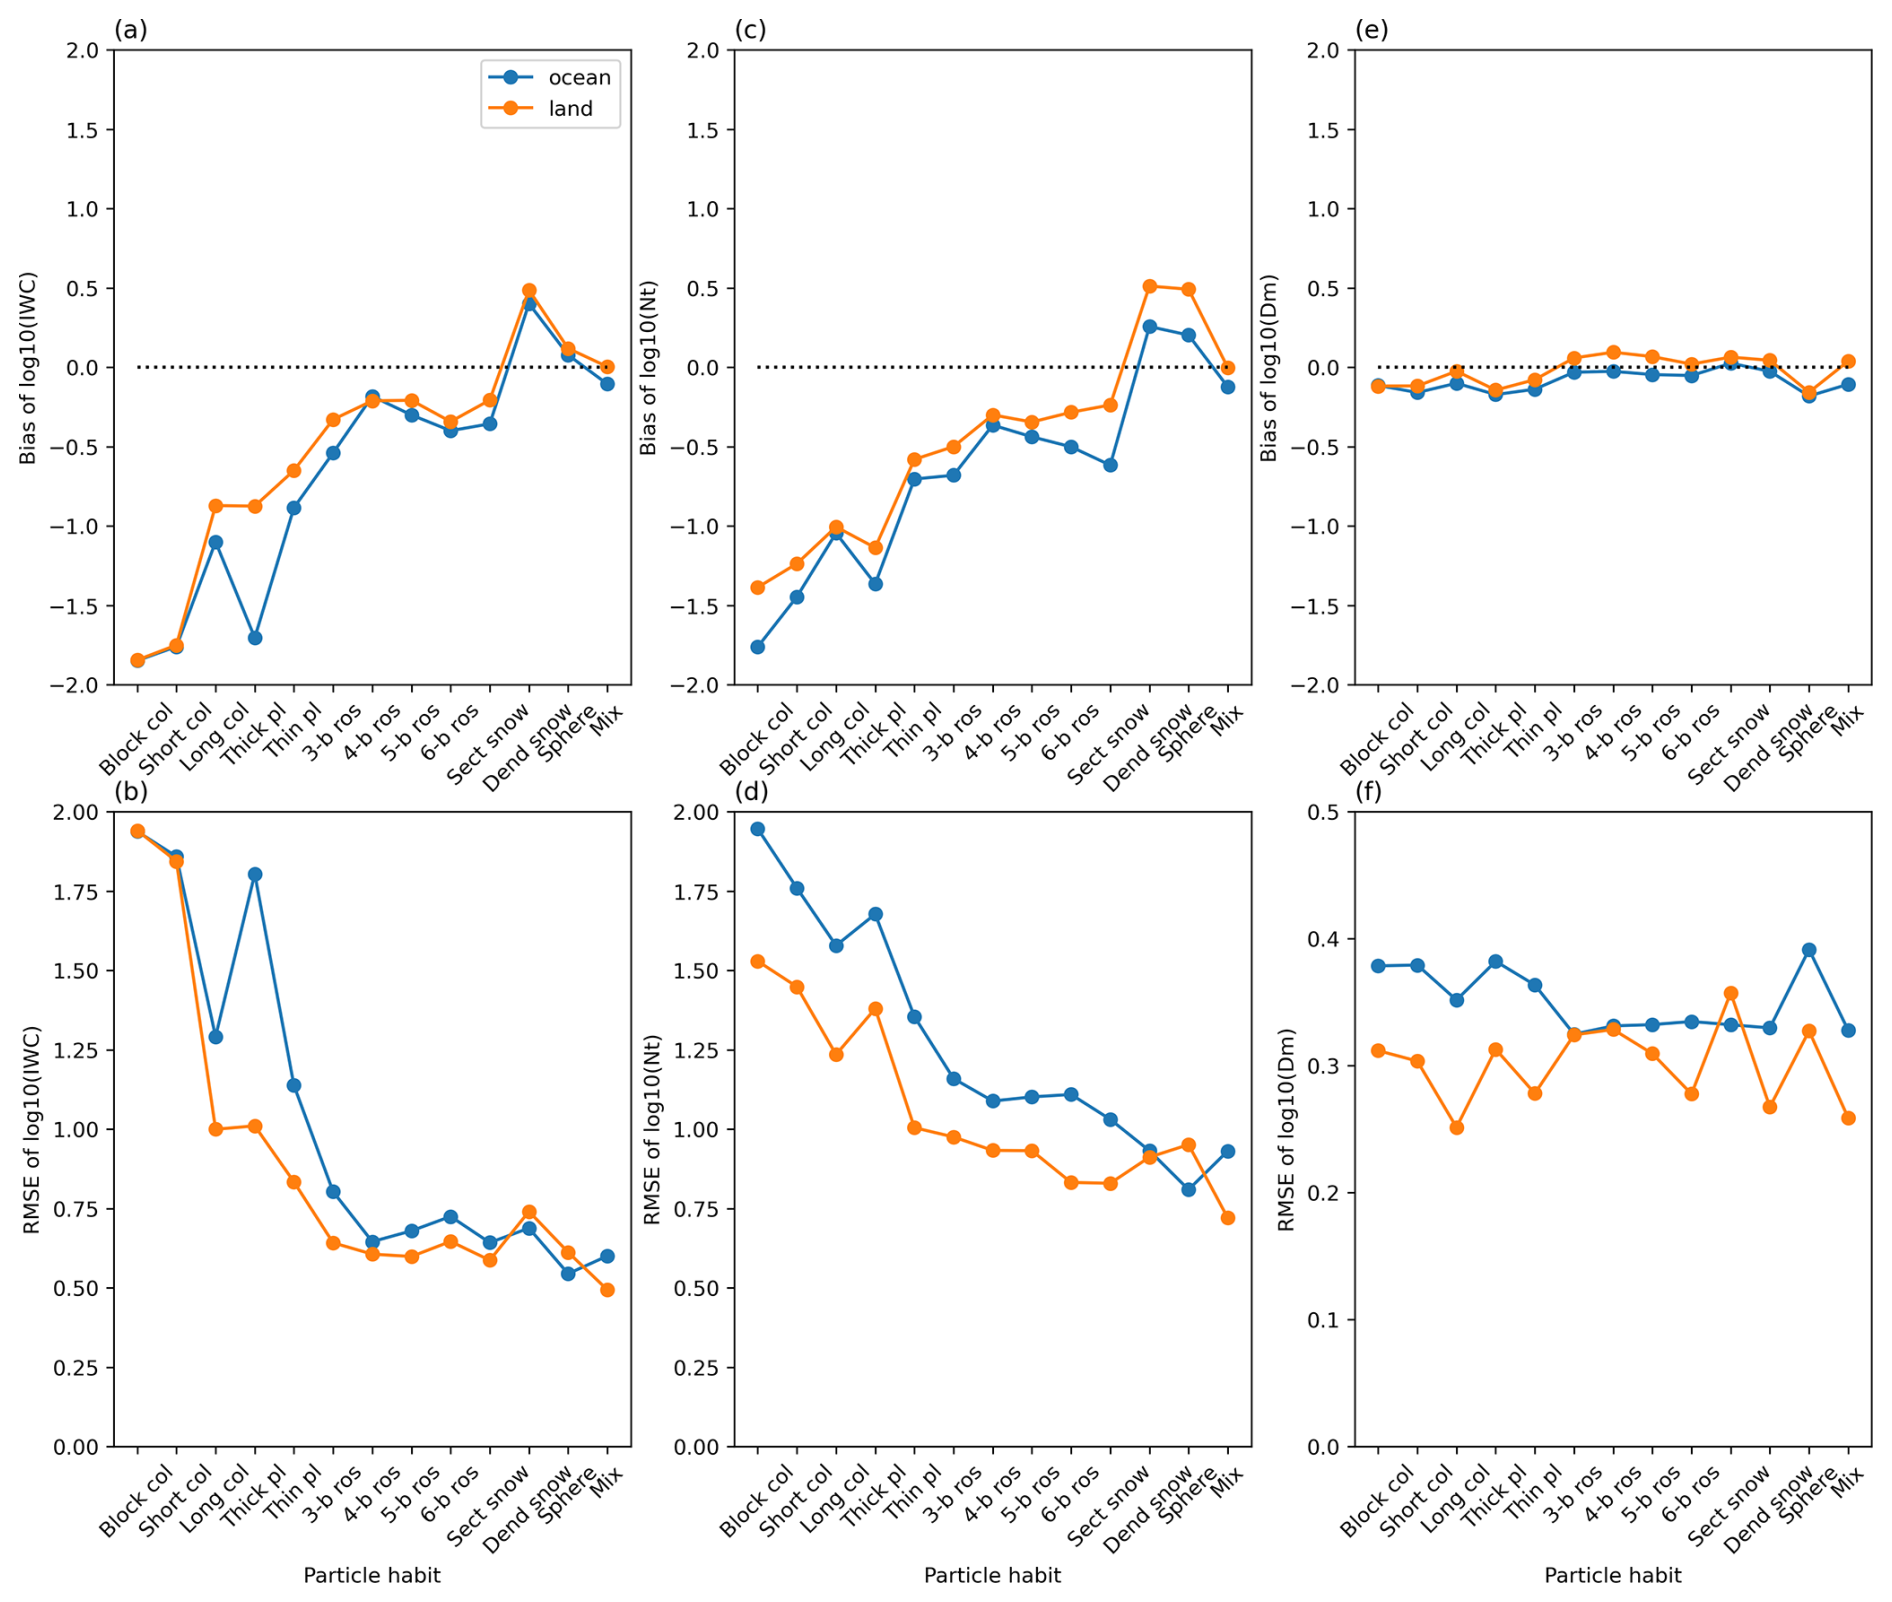
Figure 9Retrieval accuracy (bias and RMSE) for each assumed particle model listed in Table 4. The column-like and plate-like particle habits are denoted as “–col” and “–pl,” respectively; bullet-rosette habits as “–b ros”; snowflake habits as “–snow”; the soft-sphere model as “Sphere”; and the temperature-dependent mixed habit of rosettes and snowflakes as “Mix.” The orange lines represent results for all land cases, and the blue lines represent results for all ocean cases.
4.3 Consistency in measurement space
It is necessary to examine the self-consistency of the algorithm, that is, whether the synthetic observations simulated from the retrieved IWC, Nt, and Dm reproduce the actual ER-2 observations. Figure 10 compares the simulated and observed ER-2 measurements of CRS Zw, CoSMIR high-frequency Tb, and HIWRAP ZKa and ZKu for all cases listed in Table 1. Only the solid-hydrometeor layers (temperatures below −3 °C) are used in the radar reflectivity comparison. The color scale indicates the number of samples within each bin. An excellent agreement is generally achieved for all sensors (CRS, CoSMIR, and HIWRAP). This result demonstrates that the algorithm is able to retrieve ice-hydrometeor profiles that are physically consistent with passive and active microwave observations over a wide frequency range from 13 to 183 GHz.
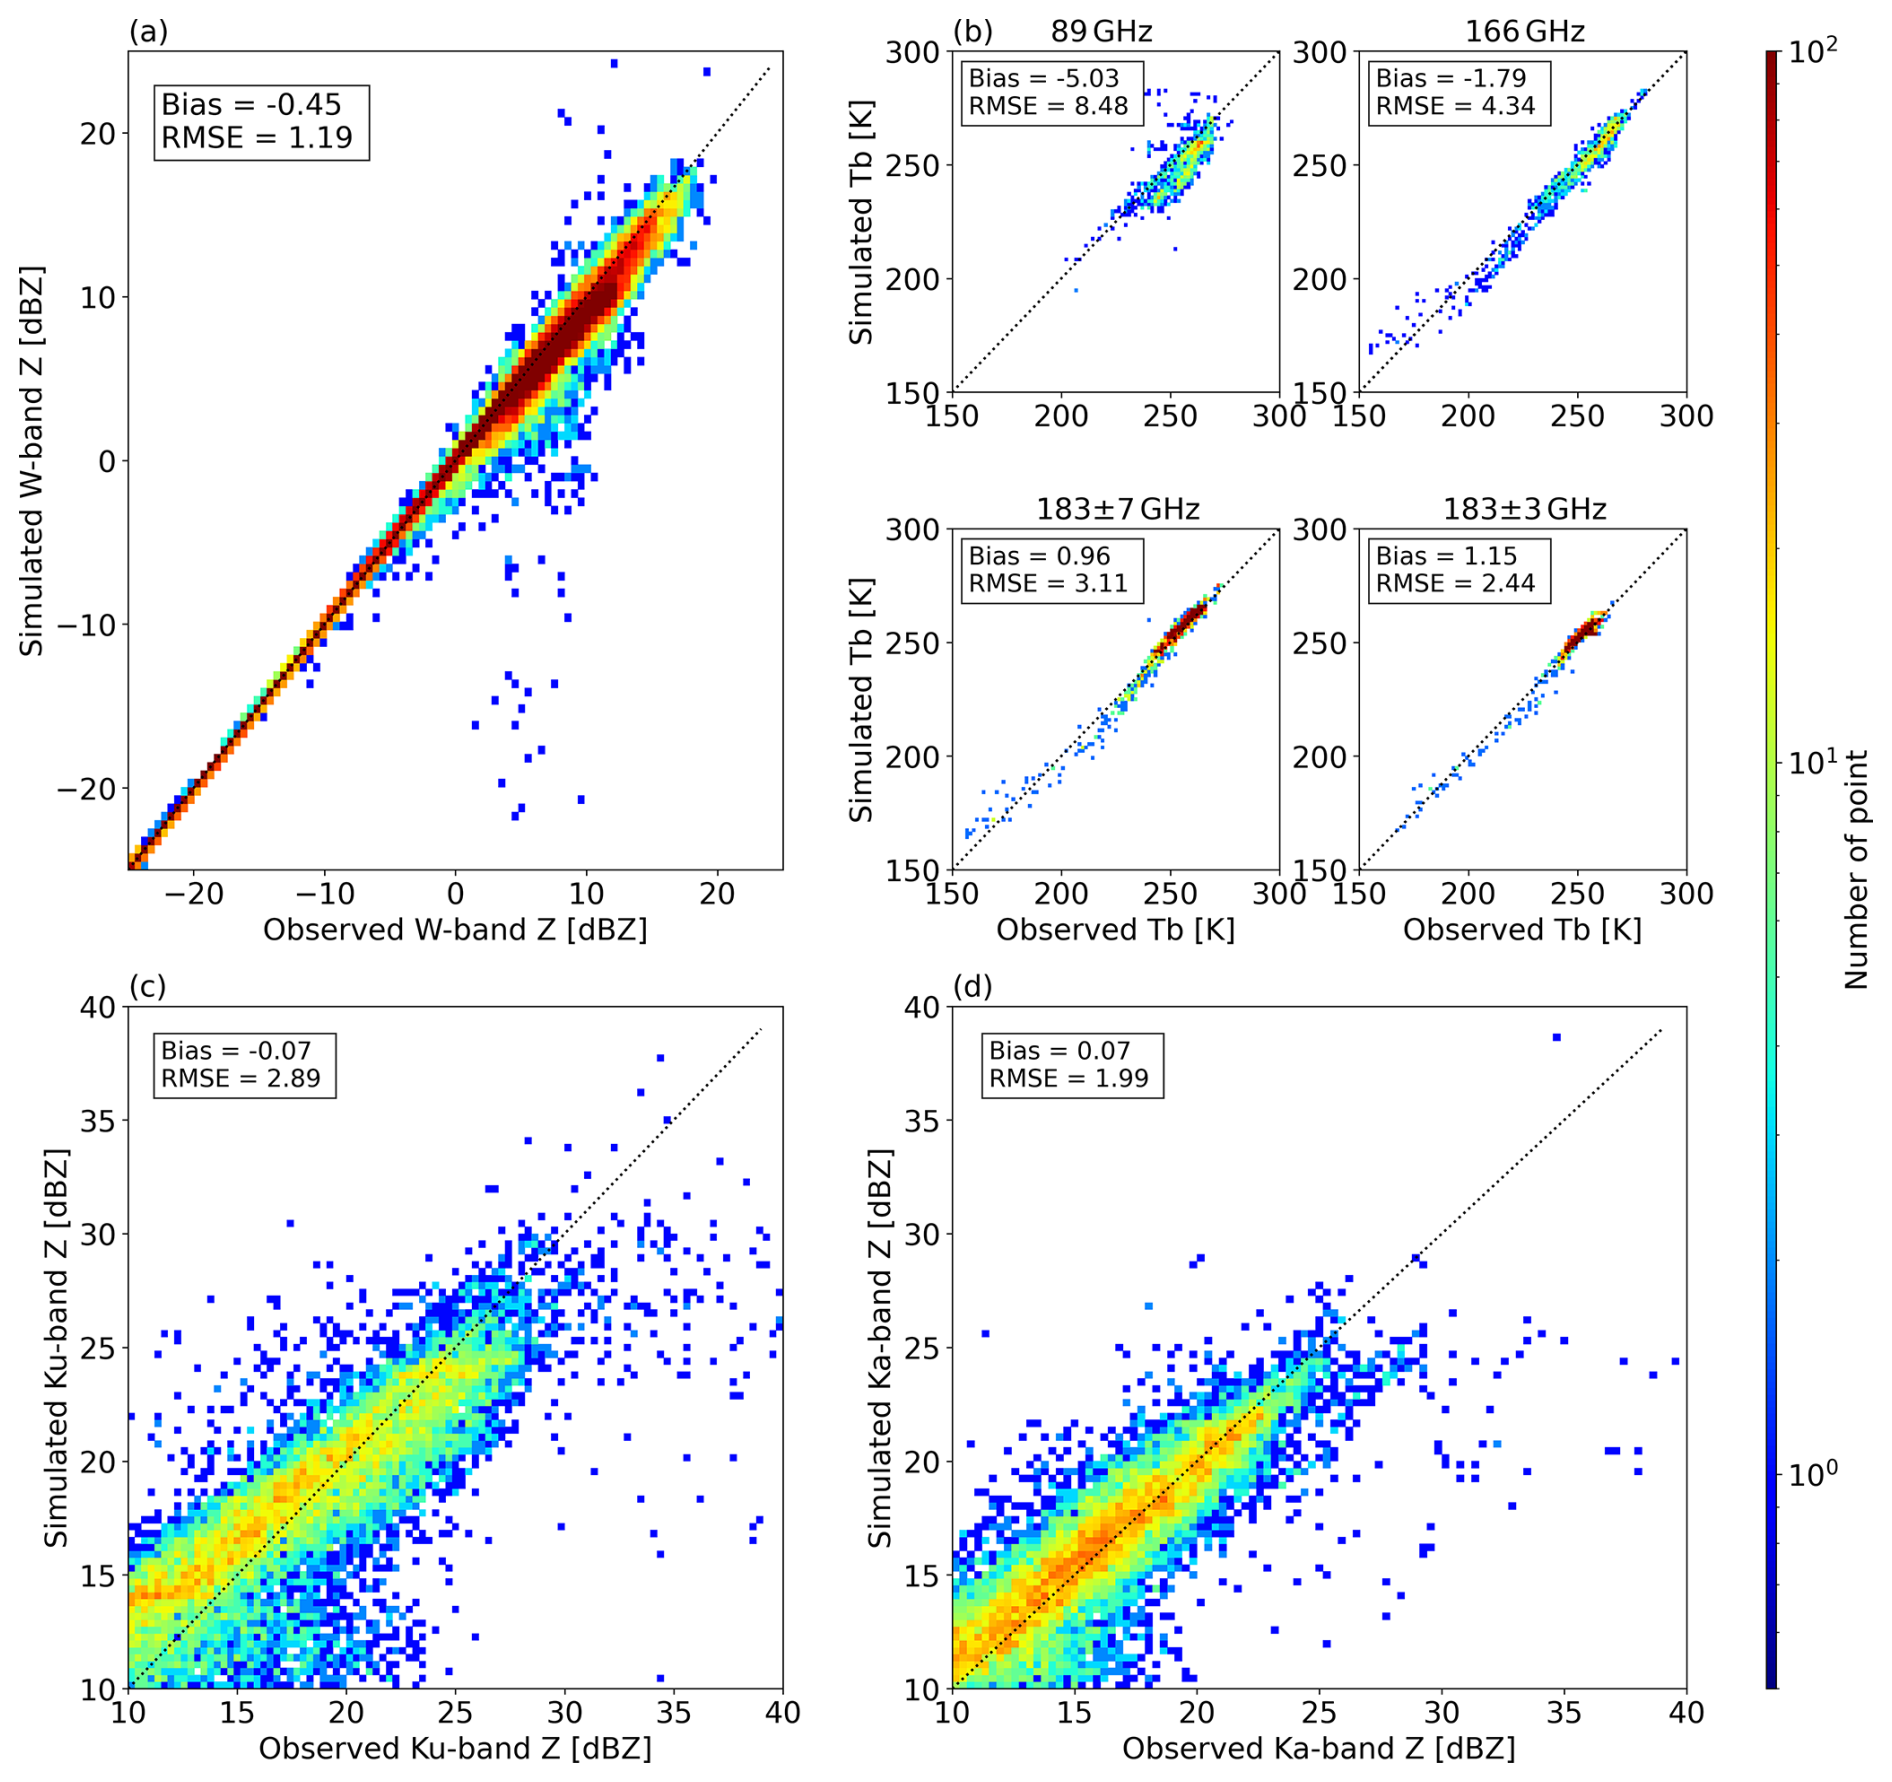
Figure 10Comparison between the radar reflectivity and brightness temperature from the ER-2 airborne sensors and the corresponding observations simulated from the retrieved ice-hydrometeor profiles using the forward model (J-sim). Retrievals assuming the mixed rosette–snowflake particle habit are used. (a) W-band radar reflectivity of CRS, (b) high-frequency brightness temperature of CoSMIR, (c) Ku-band radar reflectivity, and (d) Ka-band radar reflectivity of HIWRAP.
While Fig. 9 shows that the mixed particle habit yields the best agreement with the in-situ measurements, an important scientific question is whether the available observations alone are sufficient to constrain particle habit. O25 demonstrated that the simultaneous reproducibility of Zw and high-frequency Tb depends on the assumed particle habit. It also showed that the uncertainty in particle habit can be effectively reduced particularly for tropical clouds with large IWP. However, for the IMPACTS cases, no clear differences in reproducibility were found among the different habit assumptions (shown in the Supplement) unlike in O25. This finding suggests that, for midlatitude snowstorms, prescribing the particle habit assumption consistent with in situ observations may be a more effective approach than attempting to constrain it solely from remote sensing measurements. This issue will be further investigated in future work when extending the algorithm to a global framework including both tropical and midlatitude systems.
5.1 Evaluation of terminal fall velocity
This section extends the evaluation to validate the Zw-weighted terminal fall velocity (Vt) using not only the probe-measured PSD (Nprobe(D)) but also area ratio distribution (Arprobe(D)). This implies that agreement in terminal velocity requires not only consistency in the particle size distribution N(D) but also the validity of the assumed particle model Ar(D). Since Nret(D) can be diagnosed from the retrieved IWC, Nt, and Dm, and the assumed particle model (Table 4) provides the m(D) and Ar(D) relationship, Vt can be computed for both the retrieval results and the probe measurements using Eqs. (4)–(7). Here, the cloud retrieved values assuming the mixed rosette–snowflake habit, which exhibited the best overall performance in Fig. 9, is used to calculate Vt for comparison with the probe measurements.
Figure 11a–c show the vertical profiles of the Vt diagnosed from the retrieved cloud parameters for the two cases presented in Figs. 6 and 7. The velocity is defined as upward positive. Near the cloud top, the terminal fall velocity approaches 0 m s−1 because the ice particles are small, whereas Vt increases as the particles grow larger in the deeper cloud layers. At the altitudes indicated by the gray lines, the retrieved Vt values are compared with the probe-measured Vt as shown in Fig. 11b and d. The comparison in Fig. 11b shows good agreement, while Fig. 11d exhibits biases in some regions. This is likely because the retrieval accuracy of IWC, Nt, and Dm – that is, of the diagnosed Nret(D) – is lower for the case in Fig. 7 (Fig. 11d) than for that in Fig. 6 (Fig. 11b). Figure 11e presents statistical comparisons of Vt for all observation cases. Both the retrieved and probe-measured Vtvalues are concentrated around 1 m s−1, making the correlation difficult to evaluate, but the mean bias and RMSE is very small (−0.02 and −0.30 m s−1), indicating good overall agreement between the retrievals and probe measurement.
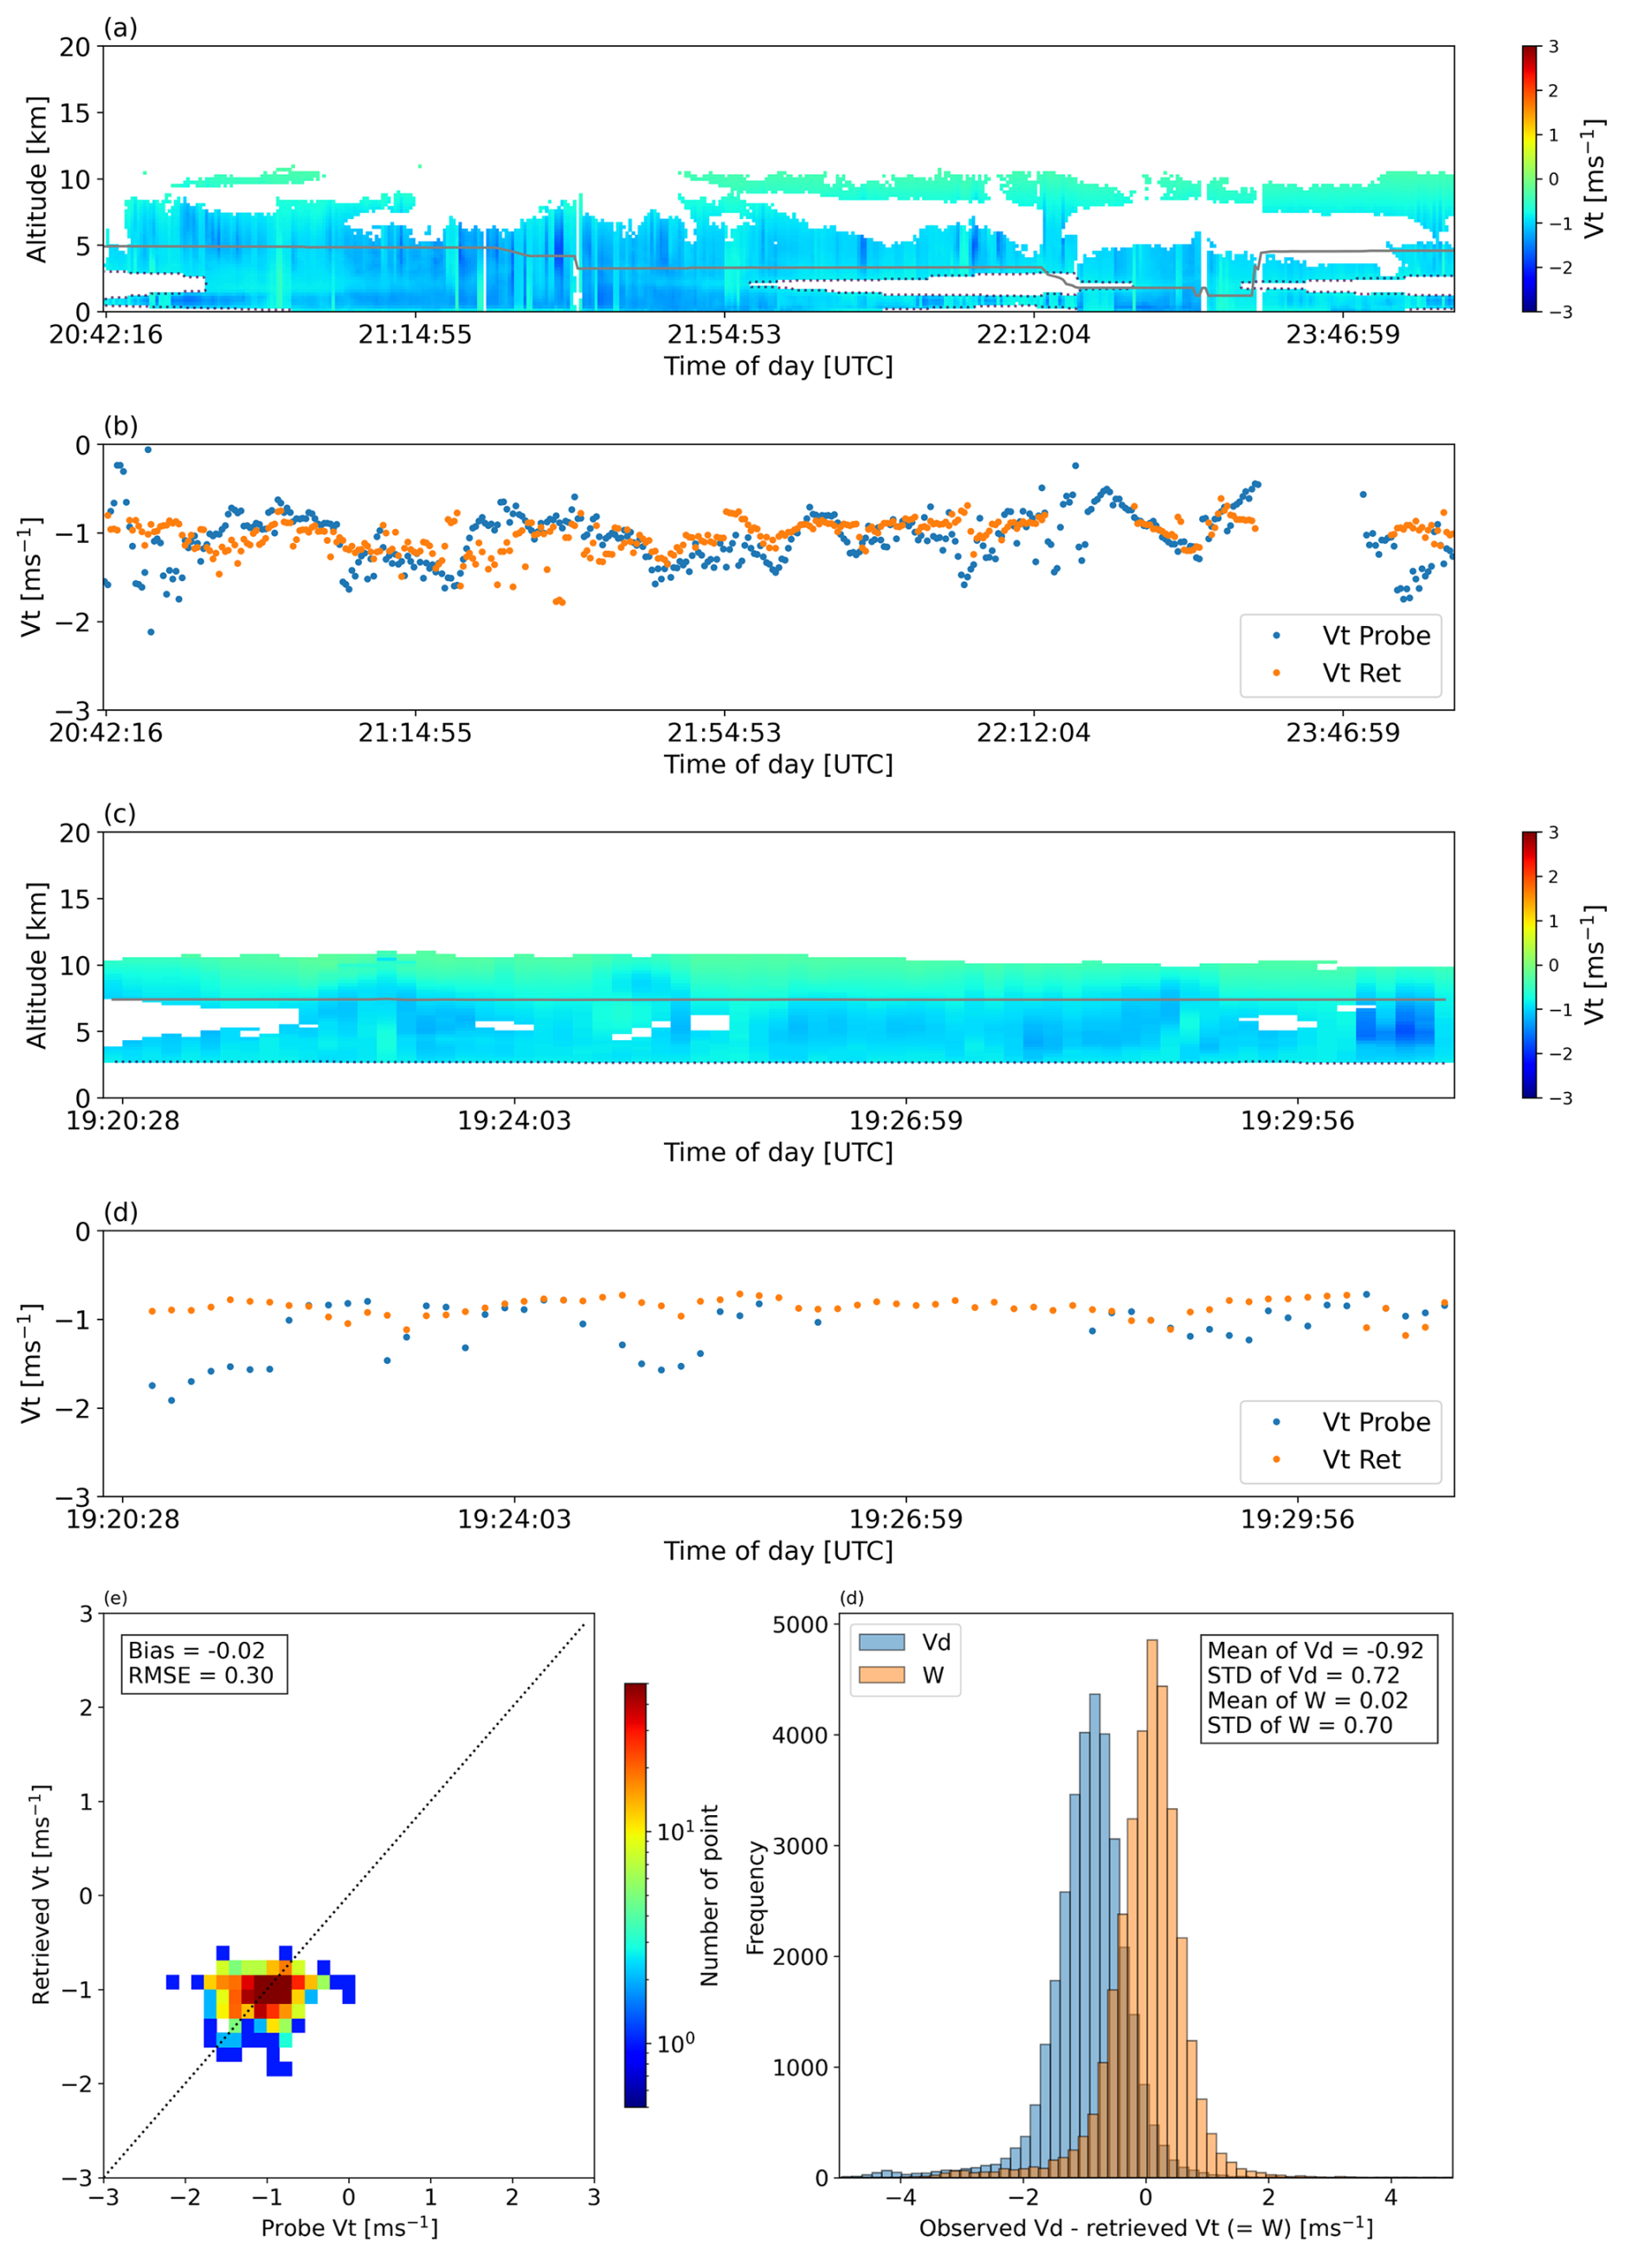
Figure 11Evaluation of the retrieval accuracy for Zw-weighted terminal fall velocity (Vt). (a) Vertical profiles of retrieved Vt and (b) comparison results between retrievals and probe measurements in the case shown in Fig. 6. (c) and (d) are same comparison as shown in (a) and (b), but for the case shown in Fig. 7. (e) Statistical comparison between retrieved and probe-measured Vt values across all cases. (f) Histogram of the difference between the CRS W-band Doppler velocity (Vd) and the retrieved Vt, corresponding to the vertical air motion W.
An additional validation for Vt and vertical air motion W is also conducted using the Doppler velocity (Vd) observed by the CRS. Since Doppler measurements provide vertical profiles, they allow evaluations at various altitudes beyond a specific level as in the in-situ probe measurements. Figure 11f shows the histogram of the difference between the observed Vd and the retrieved Vt, which corresponds to vertical air motion W in orange. For comparison, the histogram of observed Vd is shown in blue. Only solid-phase data (temperatures below −3 °C) are used. Since both updrafts and downdrafts are present, the mean and mode (i.e., the most frequent value) of W should ideally approach 0 m s−1 when a sufficient number of samples are available. As shown in Fig. 11f, the mean value of Vd is −0.92 m s−1, whereas the mean value of W is 0.02 m s−1, which is sufficiently close to zero. This indicates that particle fall velocity and vertical air motion are reasonably separated from the Doppler velocity. The width of the W histogram (standard deviation) is slightly smaller than that of Vd, although the difference is small. This may suggest that the variability in Vd is primarily explained by variations in W rather than Vt, but it may also reflect limited accuracy in the estimation of Vt.
5.2 Benefit of combined use of multiple sensor observation
This section discusses the improvement in retrieval accuracy achieved by multiple microwave sensors employed in tandem. Figure 12 compares the probe measurements (black lines) with the retrievals obtained using Zw only (blue), the combined use of Zw and Tb (green), and the combined use of Zw, Tb, ZKu, and ZKa (orange) for the land case on 25 January 2020. These retrievals are obtained by restricting the measurement vector Y, Jacobian matrix H, and measurement-error covariance matrix Se (see Sect. 3.3) to contain the selected components only of Zw, Zw+Tb, and .
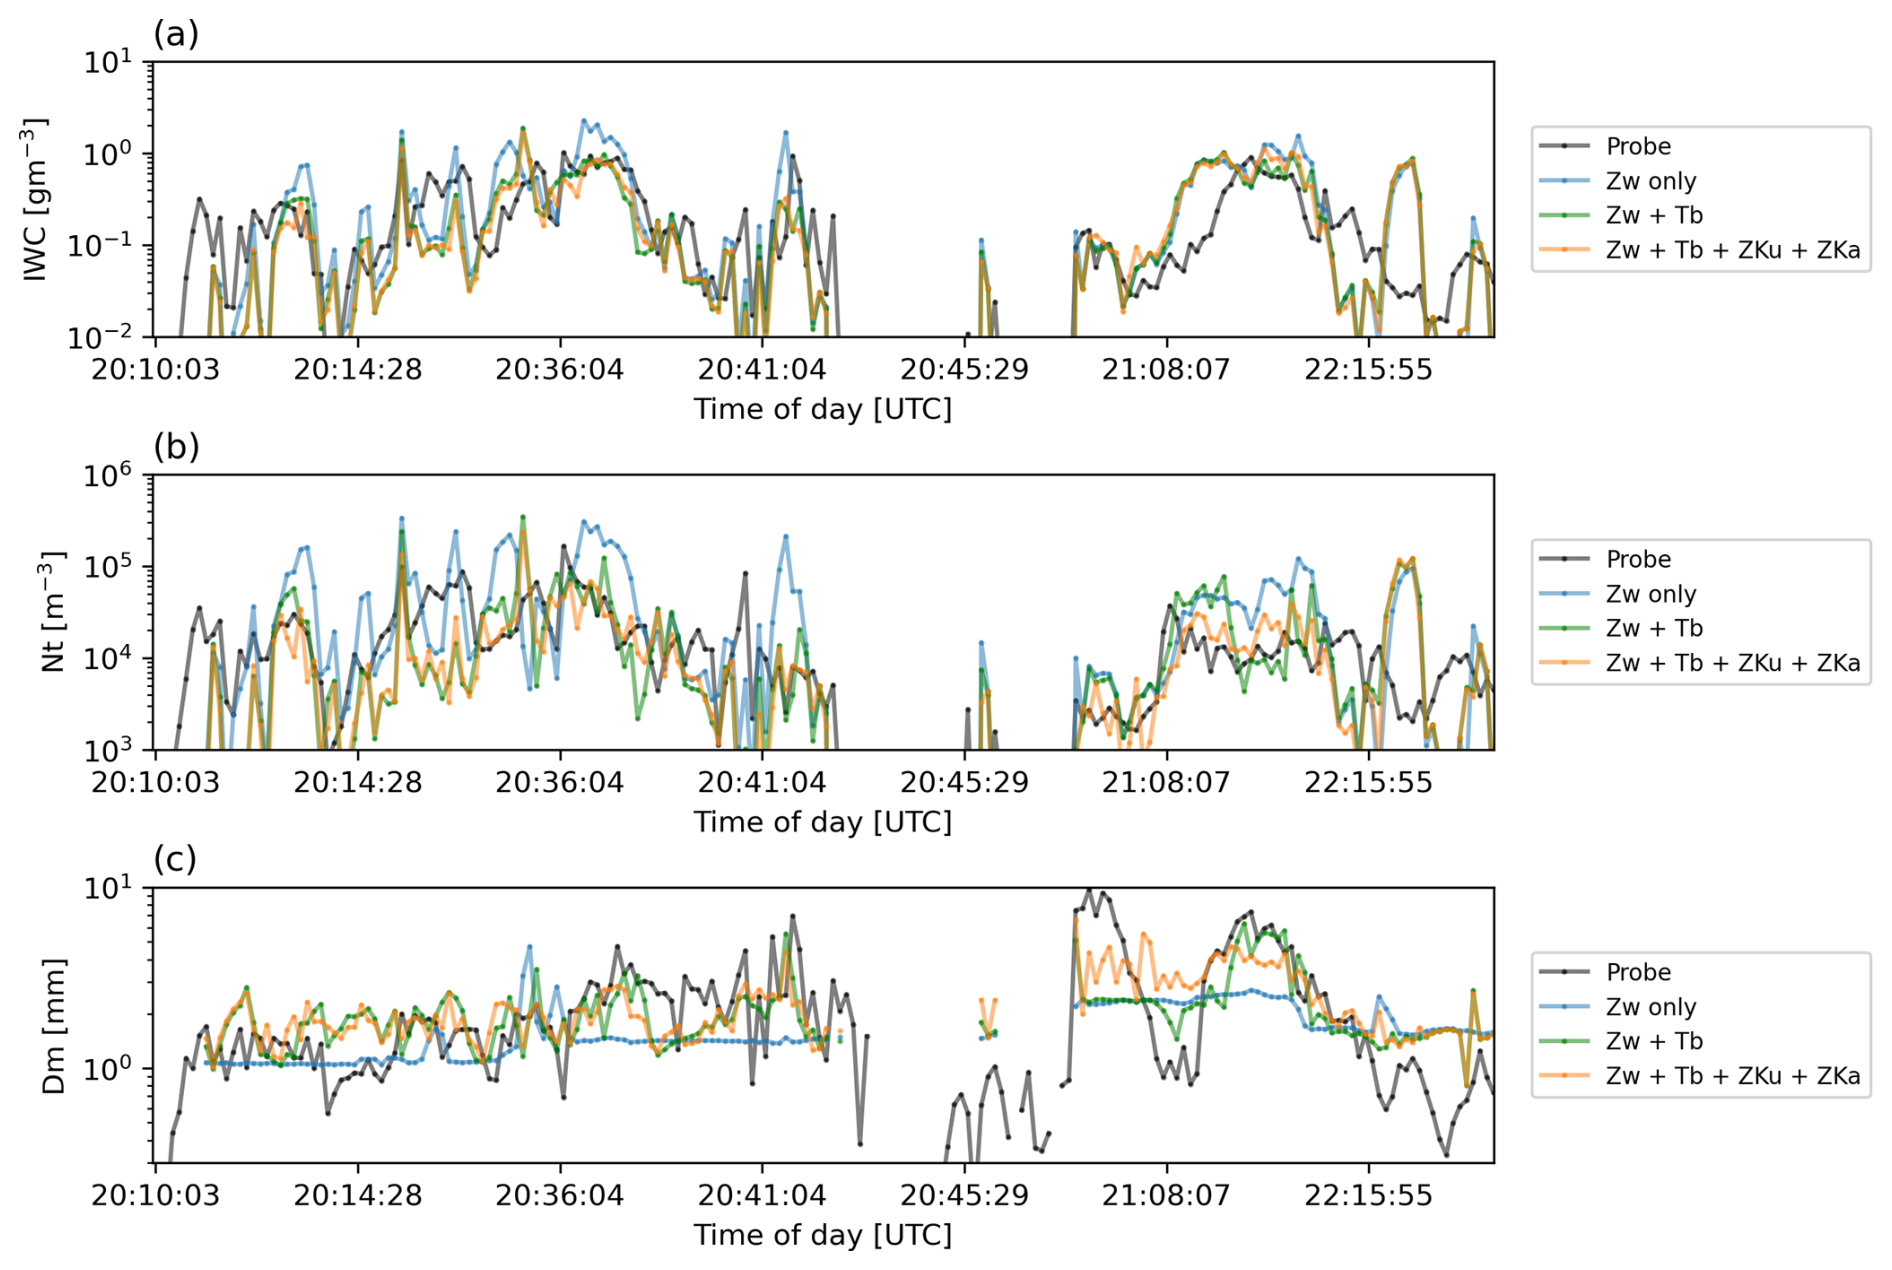
Figure 12Comparison of (a) IWC, (b) Nt, and (c) Dm between the probe measurements (black lines), Zw-only retrieved values (blue lines), Zw+Tb combined retrieved values (green lines), and combined retrieved values (orange lines) for the land case on 25 January 2020.
Retrievals using Zw only (blue lines) exhibit noticeable biases relative to the probe observations. In particular, the retrieved Dm remains nearly constant and fails to reproduce the variations observed by the probe measurements. This is likely because, in the optimal estimation using Zw only, the errors and uncertainties in the initial state Xa can hardly be corrected. In estimating Xa, attenuation effects are not considered, and the PSD parameters μ and λ are assumed to depend only on temperature. Therefore, the initial estimate contains errors due to attenuation as well as uncertainties in the assumed PSD parameters. When only Zw is used in the subsequent OE framework, attenuation-related errors can be corrected, whereas the uncertainty in λ assumed in the initial estimation cannot be effectively constrained. As a result, the retrieval accuracy of Nt and Dm remains limited when using Zw alone. In contrast, when other microwave sensor observations are incorporated (green and orange lines), the retrieval accuracy for Nt and Dm improves in several regions (e.g., between 20:36 and 20:43 UTC or between 21:08 and 22:15 UTC). This improvement demonstrates that additional information from Tb, ZKu and ZKa effectively constrains the uncertainties in Nt and Dm that cannot be resolved by Zw only.
Where does the combined use of multiple sensors most effectively improve the retrieval accuracy? The sensitivity experiment shown in Fig. 5 suggests that the synergistic effect is particularly efficient for large IWCs and small Nts, or resultingly large particle sizes. In the deeper cloud layers, water deposition and riming tend to increase IWC, while aggregation decreases Nt and increases Dm. Therefore, multi-sensor synergy is expected to enhance retrieval accuracy in deep ice-cloud layers.
Figure 13 shows the improvement in retrieval accuracy by the combined use of multiple sensors relative to the radar-only case as a function of the ice layer depth from the cloud top. The vertical axis represents the reduction in the retrieval error (on a logarithmic scale) against the in-situ probe observations when CoSMIR (Tb) or HIWRAP (ZKu and ZKa) measurements are incorporated. Positive values indicate an improvement in retrieval accuracy due to the combined use of sensors, whereas negative values indicate a degradation in accuracy. The horizontal axis shows IWPabove, a proxy for the depth of the cloud layer, defined as the vertically integrated IWC between the cloud top and the flight altitude of the probe measurement. Despite a considerable scatter, the mean values of bias reduction shown in solid lines indicate that the combined use of multiple sensors improves the retrieval accuracy of Nt and Dm, particularly within the deeper cloud layers (large IWPabove). This result supports the improved retrieval accuracy brought by additional instruments as exemplified in Fig. 12. The accuracy improvement with is comparable to that with Zw+Tb. This may indicate that, as discussed in Fig. 5, high-frequency Tb contains substantial scattering information independent of Zw. Alternatively, it may simply reflect the limited sensitivity of ZKu and ZKa to ice microphysics for the midlatitude snowstorm cases in the IMPACTS campaign and for the altitude range sampled by the in-situ observations. The addition of Ku- and Ka-band radar observations is expected to provide greater benefit for cloud systems such as tropical deep convection that contain larger ice hydrometeors (e.g., hail and graupel). Future work will further investigate the synergy of multi-sensor observations by applying the algorithm to global satellite coincidence datasets.
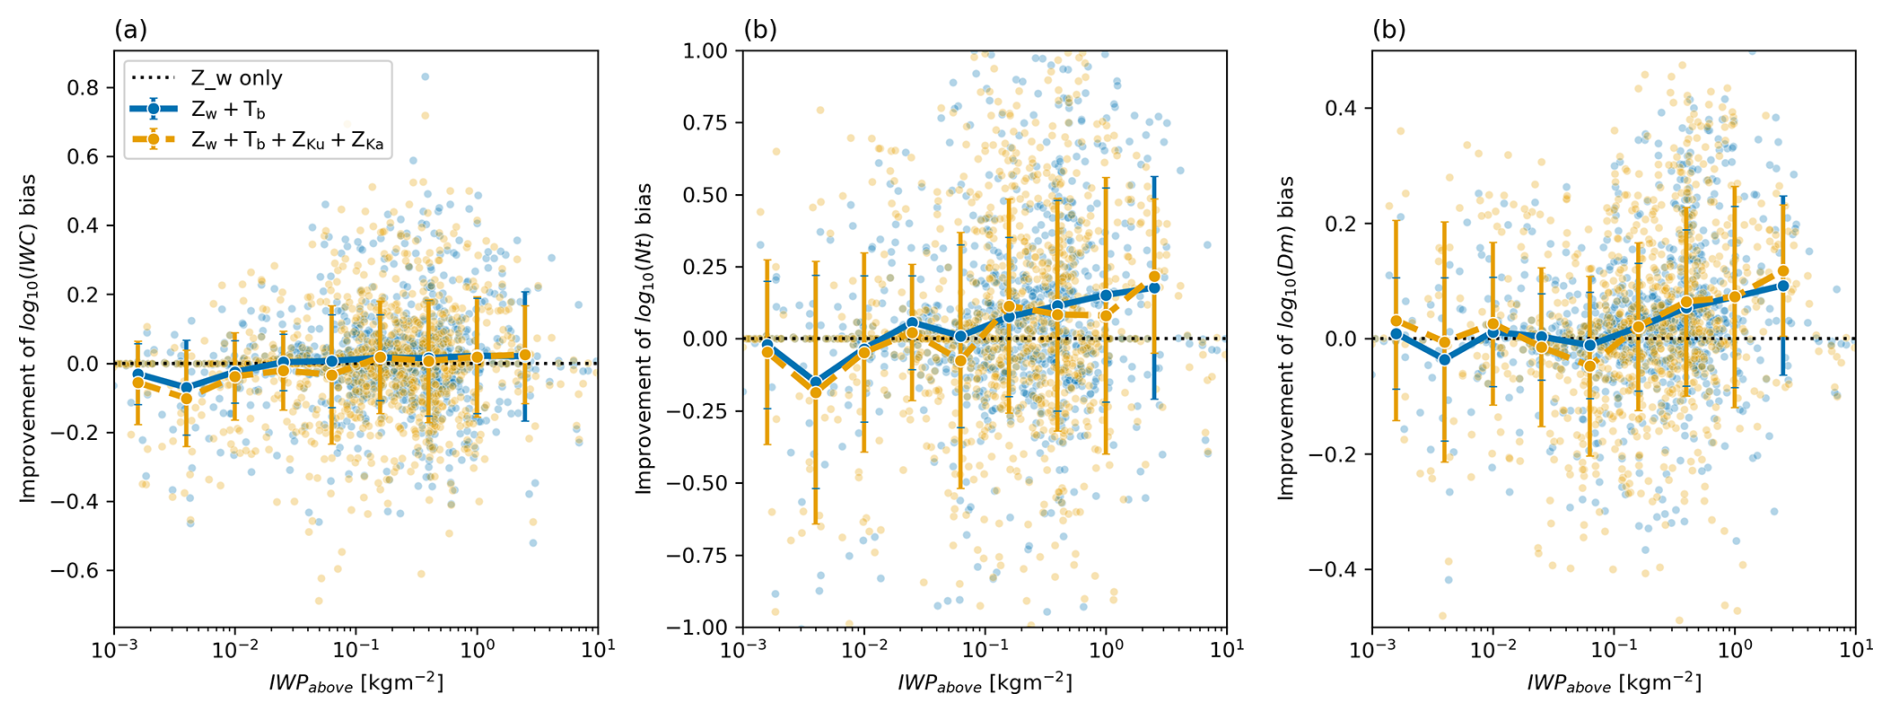
Figure 13Relationship between the retrieval improvements achieved by combined use of multiple sensors and the depth from the cloud top (IWPabove). The black dashed line denotes the baseline accuracy obtained using Zw only. The light-blue points show the bias reduction obtained from the combined use of Zw and Tb, while the blue solid line indicates the mean and standard deviation of the bias reduction within each IWPabove bin. The orange scatter points and orange dashed line show the corresponding results for the combined use of Zw, Tb, ZKu, and ZKa.
This study evaluates an ice-hydrometer retrieval algorithm which synergistically uses observations from a W-band radar, high-frequency microwave radiometers, Ku- and Ka-band radars. The validation dataset is obtained from the IMPACTS campaign including observations from ER-2 high-altitude aircraft and the P-3 cloud-sampling aircraft. The ER-2 aircraft provides simultaneous measurements from the microwave radiometer (CoSMIR), W-, Ku- and Ka-band doppler radar (CRS and HIWRAP) as inputs to the algorithm (Table 2 and Fig. 2). The P-3 aircraft provides in situ probe measurements of cloud microphysical properties (Table 3 and Fig. 3).
The combined algorithm originally developed in O25 consists of two main components. The first step estimates the initial guess of ice hydrometeor profiles using a training database, and the second step refines these profiles to be consistent with all microwave observations through the optimal estimation method (Fig. 4). The major updates from O25 algorithm are as follows: (1) the incorporation of mixed rosette-snowflake habit with its mixing ratio depending on temperature; (2) the initial-value estimation scheme has been simplified and generalized; (3) the algorithm has been extended to incorporate ZKu and ZKa profiles in addition to Zw profile and high-frequency Tb; and (4) the estimation of the Zw-weighted terminal fall velocity (Vt) and the vertical air motion (W).
The retrieved vertical profiles of IWC, Nt, Dm, and Vt are compared with probe measurements (Figs. 6, 7, and 11). Comparisons for all available IMPACTS cases (Table 1) show that all the retrieved microphysical parameters (IWC, Nt, Dm, and Vt) agree well with those from the probe measurements within random noise (Fig. 8). The mean ratios of the retrieved values to probe measurements for IWC, Nt, and Dm are 1.01, 0.97, and 1.05. The mean bias and RMSE for Vt are −0.02 and 0.30 m s−1 (Fig. 11). These results are obtained under the assumption of the mixed rosette–snowflake particle. Among the 13 particle-habit assumptions tested in this study (Table 4), this mixed habit provides the best overall retrieval accuracy (Fig. 9). Nevertheless, further investigation is required to examine whether this habit assumption is also optimal for other regions, seasons, and cloud types beyond the IMPACTS campaign.
The simulated Zw, Tb, ZKu, and ZKa with the forward model using the retrieved ice-hydrometeor profiles as input closely reproduce the actual ER-2 airborne sensors observations (Fig. 10). This agreement confirms that the current algorithm can retrieve ice-hydrometeor profiles that are consistent with multiple microwave measurements across a wide frequency range.
Sensitivity experiments demonstrate that a synergistic effect obtained from combining multi-sensor observations can be expected where IWC is large and Nt is small – that is, where the particle size is large – owing to the difference in scattering properties between Mie and Rayleigh scattering (Fig. 5). Consistent with this theoretical expectation, the retrieval uncertainties in Nt and Dm, which cannot be sufficiently constrained by Zw only, are reduced by incorporating high-frequency Tb, ZKu, and ZKa deep inside a cloud layer (Figs. 12 and 13). This result indicates that the combining radars and mm-wave radiometer observations is effective for improving our understanding of the microphysical properties in the deep precipitating clouds beyond the reach of conventional combined radar–lidar measurements.
In the future, this algorithm will be applied to the CloudSat–GPM (Turk et al., 2021) and EarthCARE–GPM (Aoki et al., 2026) satellite matchup datasets to generate a global-scale, long-term dataset of detailed microphysical properties of ice hydrometeors within precipitating systems. The cloud radar onboard the EarthCARE satellite is equipped with the world's first spaceborne Doppler observation capability. The global dataset of the particle fall velocities and the vertical air motion obtained from the Doppler measurements is expected to further advance our understanding of the formation and growth mechanisms of cloud and precipitation particles.
Available upon request.
The IMPACTS dataset is available from https://www.earthdata.nasa.gov/data/projects/impacts/collection (last access: 4 April 2025). The ER-5 hourly dataset is available from https://doi.org/10.24381/cds.bd0915c6 (Hersbach et al., 2023). The forward model used in this study (Joint Simulator for Satellite Sensors) is available from https://www.eorc.jaxa.jp/theme/Joint-Simulator/userform/js_userform.html (last access: 20 April 2022).
The supplement related to this article is available online at https://doi.org/10.5194/amt-19-4099-2026-supplement.
All coding, analysis, and writing of the first draft of this study were performed by KO. The study design, discussions on results, and manuscript improvement were greatly assisted by HM.
The contact author has declared that neither of the authors has any competing interests.
Publisher's note: Copernicus Publications remains neutral with regard to jurisdictional claims made in the text, published maps, institutional affiliations, or any other geographical representation in this paper. The authors bear the ultimate responsibility for providing appropriate place names. Views expressed in the text are those of the authors and do not necessarily reflect the views of the publisher.
Prof. Guosheng Liu and Assoc. Prof. T. Hashino are gratefully acknowledged for making the non-spherical scattering database publicly available and helping us use it in the forward model (Joint Simulator for Satellite Sensors).
This research has been supported by the Japan Society for the Promotion of Science (grant no. JP25K07407).
This paper was edited by Chao Liu and reviewed by two anonymous referees.
Aoki, S., Kubota, T., and Turk, F. J.: Exploring vertical motions in convective and stratiform precipitation using spaceborne radar observations: insights from EarthCARE and GPM coincidence dataset, Atmos. Meas. Tech., 19, 79–100, https://doi.org/10.5194/amt-19-79-2026, 2026.
Austin, R. T., Heymsfield, A. J., and Stephens, G. L.: Retrieval of ice cloud microphysical parameters using the CloudSat millimeter-wave radar and temperature, J. Geophys. Res., 114, https://doi.org/10.1029/2008jd010049, 2009.
Bailey, M. and Hallett, J.: Growth rates and habits of ice crystals between −20° and −70 °C, J. Atmos. Sci., 61, 514–544, 2004.
Bailey, M. P. and Hallett, J.: A Comprehensive Habit Diagram for Atmospheric Ice Crystals: Confirmation from the Laboratory, AIRS II, and Other Field Studies, J. Atmos. Sci., 66, 2888–2899, 2009.
Cazenave, Q., Ceccaldi, M., Delanoë, J., Pelon, J., Groß, S., and Heymsfield, A.: Evolution of DARDAR-CLOUD ice cloud retrievals: new parameters and impacts on the retrieved microphysical properties, Atmos. Meas. Tech., 12, 2819–2835, https://doi.org/10.5194/amt-12-2819-2019, 2019.
Delanoë, J. and R. J. Hogan: A variational scheme for retrieving ice cloud properties from combined radar, lidar, and infrared radiometer, J. Geophys. Res., 113, https://doi.org/10.1029/2007JD009000, 2008.
Delanoë, J. and R. J. Hogan: Combined CloudSat-CALIPSO-MODIS retrievals of the properties of ice clouds, J. Geophys. Res, 115, https://doi.org/10.1029/2009JD012346, 2010.
Deng, M., Mace, G. G., Wang, Z., and Okamoto, H.: Tropical Composition, Cloud and Climate Coupling Experiment validation for cirrus cloud profiling retrieval using CloudSat radar and CALIPSO lidar, J. Geophys. Res, 115, https://doi.org/10.1029/2009JD013104, 2010.
Deng, M., Mace, G. G., Wang, Z., and Paul Lawson, R.: Evaluation of Several A-Train Ice Cloud Retrieval Products with In Situ Measurements Collected during the SPARTICUS Campaign, J. Appl. Meteorol. Climatol., 52, 1014–1030, 2013.
Deng, M., Mace, G. G., Wang, Z., and Berry, E.: CloudSat 2C-ICE product update with a new Ze parameterization in lidar-only region, J. Geophys. Res., 120, https://doi.org/10.1002/2015jd023600, 2015.
Draine, B. T. and Flatau, P. J.: Discrete-dipole approximation for scattering calculations, J. Opt. Soc. Am. A Opt. Image Sci. Vis., 11, 1491, 1994.
Eriksson, P., Ekelund, R., Mendrok, J., Brath, M., Lemke, O., and Buehler, S. A.: A general database of hydrometeor single scattering properties at microwave and sub-millimetre wavelengths, Earth Syst. Sci. Data, 10, 1301–1326, https://doi.org/10.5194/essd-10-1301-2018, 2018.
Field, P. R., Heymsfield, A. J., and Bansemer, A.: Shattering and particle interarrival times measured by Optical array probes in ice clouds, J. Atmos. Ocean. Technol., 23, 1357–1371, 2006.
Hashino, T., Satoh, M., Hagihara, Y., Kubota, T., Matsui, T., Nasuno, T., and Okamoto, H.: Evaluating cloud microphysics from NICAM against CloudSat and CALIPSO, J. Geophys. Res., 118, 7273–7292, 2013.
Hashino, T., Satoh, M., Hagihara, Y., Kato, S., Kubota, T., Matsui, T., Nasuno, T., Okamoto, H., and Sekiguchi, M.: Evaluating Arctic cloud radiative effects simulated by NICAM with A-train, J. Geophys. Res., 121, 7041–7063, 2016.
Hersbach, H., Bell, B., Berrisford, P., Biavati, G., Horányi, A., Muñoz Sabater, J., Nicolas, J., Peubey, C., Radu, R., Rozum, I., Schepers, D., Simmons, A., Soci, C., Dee, D., and Thépaut, J.-N.: ERA5 hourly data on pressure levels from 1940 to present, Copernicus Climate Change Service (C3S) Climate Data Store (CDS) [data set], https://doi.org/10.24381/cds.bd0915c6, 2023.
Heymsfield, A. J. and Westbrook, C. D.: Advances in the estimation of ice particle fall speeds using laboratory and field measurements, J. Atmos. Sci., 67, 2469–2482, 2010.
Heymsfield, A. J., Schmitt, C, and Bansemer. A.: Ice cloud particle size distributions and pressure-dependent terminal velocities from in situ observations at temperatures from 0 to −86 °C, J. Atmos. Sci., 70, 4123–4154, 2013.
Houze Jr., R. A.: Cloud Dynamics, 2nd ed., Academic Press, ISBN 978-0-08-092146-4, 2014.
Illingworth, A. J., Barker, H. W., Beljaars, A., Ceccaldi, M., Chepfer, H., Clerbaux, N., Cole, J., Delanoë, J., Domenech, C., Donovan, D. P., Fukuda, S., Hirakata, M., Hogan, R. J., Huenerbein, A., Kollias, P., Kubota, T., Nakajima, T., Nakajima, T. Y., Nishizawa, T., Ohno, Y., Okamoto, H., Oki, R., Sato, K., Satoh, M., Shephard, M. W., Velázquez-Blázquez, A., Wandinger, U., Wehr, T., and van Zadelhoff, G.-J.: The EarthCARE satellite: The next step forward in global measurements of clouds, aerosols, precipitation, and radiation, Bull. Am. Meteorol. Soc., 96, 1311–1332, 2015.
Lawson, R. P., O'Connor, D., Zmarzly, P., Weaver, K., Baker, B., Mo, Q., and Jonsson, H.: The 2D-S (stereo) probe: Design and preliminary tests of a new airborne, high-speed, high-resolution particle imaging probe, J. Atmos. Ocean. Technol., 23, 1462–1477, 2006.
Lawson, R. P., Woods, S., Jensen, E., Erfani, E., Gurganus, C., Gallagher, M., Connolly, P., Whiteway, J., Baran, A. J., May, P., Heymsfield, A., Schmitt, C. G., McFarquhar, G., Um, J., Protat, A., Bailey, M., Lance, S., Muehlbauer, A., Stith, J., Korolev, A., Toon, O. B., and Krämer, M.: A review of ice particle shapes in cirrus formed in situ and in anvils, J. Geophys. Res., 124, 10049–10090, 2019.
Li, L., Heymsfield, G. M., Racette, P. E., Tian, L., and Zenker, E.: A 94-GHz cloud radar system on a NASA high-altitude ER-2 aircraft, J. Atmos. Ocean. Technol., 21, 1378–1388, 2004.
Li, L., Heymsfield, G., Carswell, J., Schaubert, D. H., McLinden, M. L., Creticos, J., Perrine, M., Coon, M., Cervantes, J. I., Vega, M., Guimond, S., Tian, L., and Emory, A.: The NASA high-altitude imaging wind and rain airborne profiler, IEEE Trans. Geosci. Remote Sens., 54, 298–310, 2016.
Liu, G.: A Database of Microwave Single-Scattering Properties for Nonspherical Ice Particles, Bull. Am. Meteorol. Soc., 89, 1563–1570, 2008.
Marshall, J. S. and Palmer, W. M. K.: The distribution of raindrops with size, J. Meteorol., 5, 165–166, 1948.
Mason, S. L., Hogan, R. J., Bozzo, A., and Pounder, N. L.: A unified synergistic retrieval of clouds, aerosols, and precipitation from EarthCARE: the ACM-CAP product, Atmos. Meas. Tech., 16, 3459–3486, https://doi.org/10.5194/amt-16-3459-2023, 2023.
Masunaga, H.: Satellite Measurements of Clouds and Precipitation, Springer Nature Singapore, 17 pp., ISBN 978-981-19-2242-8, 2022.
Masunaga, H., Matsui, T., Tao, W.-K., Hou, A. Y., Kummerow, C. D., Nakajima, T., Bauer, P., Olson, W. S., Sekiguchi, M., and Nakajima, T. Y.: Satellite Data Simulator Unit: A Multisensor, Multispectral Satellite Simulator Package, Bull. Am. Meteorol. Soc., 91, 1625–1632, 2010.
McMurdie, L. A., Heymsfield, G. M., Yorks, J. E., Braun, S. A., Skofronick-Jackson, G., Rauber, R. M., Yuter, S., Colle, B., McFarquhar, G. M., Poellot, M., Novak, D. R., Lang, T. J., Kroodsma, R., McLinden, M., Oue, M., Kollias, P., Kumjian, M. R., Greybush, S. J., Heymsfield, A. J., Finlon, J. A., McDonald, V. L., and Nicholls, S.: Chasing Snowstorms: The Investigation of Microphysics and Precipitation for Atlantic Coast-Threatening Snowstorms (IMPACTS) Campaign, Bull. Am. Meteorol. Soc., 103, E1243–E1269, 2022.
Ohara, K. and Masunaga, H.: Synergy of millimeter-wave radar and radiometer measurements for retrieving frozen hydrometeors in deep convective systems, Atmos. Meas. Tech., 18, 4791–4807, https://doi.org/10.5194/amt-18-4791-2025, 2025.
Ohara, K., Kubota, T., Kachi, M., and Kazumori, M.: Comparison of long-term total precipitable water products by the Advanced Microwave Scanning Radiometer 2 (AMSR2), J. Meteor. Soc. Japan, 101, 289–308, https://doi.org/10.2151/jmsj.2023-018, 2023.
Okamoto, H.: Information content of the 95-GHz cloud radar signals: Theoretical assessment of effects of nonsphericity and error evaluation of the discrete dipole approximation, J. Geophys. Res., 107, https://doi.org/10.1029/2001jd001386, 2002.
Okamoto, H.: An algorithm for retrieval of cloud microphysics using 95-GHz cloud radar and lidar, J. Geophys. Res., 108, https://doi.org/10.1029/2001jd001225, 2003.
Okamoto, H., Sato, K., and Hagihara, Y.: Global analysis of ice microphysics from CloudSat and CALIPSO: Incorporation of specular reflection in lidar signals, J. Geophys. Res., 115, https://doi.org/10.1029/2009JD013383, 2010.
Pfreundschuh, S., Eriksson, P., Buehler, S. A., Brath, M., Duncan, D., Larsson, R., and Ekelund, R.: Synergistic radar and radiometer retrievals of ice hydrometeors, Atmos. Meas. Tech., 13, 4219–4245, https://doi.org/10.5194/amt-13-4219-2020, 2020.
Rodgers, C. D.: Inverse Methods For Atmospheric Sounding: Theory And Practice, World Scientific, 256 pp., ISBN-13 978-981-02-2740-1, 2000.
Sato, K., Okamoto, H., Nishizawa, T., Jin, Y., Nakajima, T. Y., Wang, M., Satoh, M., Roh, W., Ishimoto, H., and Kudo, R.: JAXA Level 2 cloud and precipitation microphysics retrievals based on EarthCARE radar, lidar, and imager: the CPR_CLP, AC_CLP, and ACM_CLP products, Atmos. Meas. Tech., 18, 1325–1338, https://doi.org/10.5194/amt-18-1325-2025, 2025.
Turk, F. J., Ringerud, S. E., Camplani, A., Casella, D., Chase, R. J., Ebtehaj, A., Gong, J., Kulie, M., Liu, G., Milani, L., Panegrossi, G., Padullés, R., Rysman, J.-F., Sanò, P., Vahedizade, S., and Wood, N. B.: Applications of a CloudSat-TRMM and CloudSat-GPM Satellite Coincidence Dataset, Remote Sens., 13, 2264, https://doi.org/10.3390/rs13122264, 2021.
Wang, J. R., Skofronick-Jackson, G. M., Schwaller, M. R., Johnson, C. M., Monosmith, W. B., and Zhang, Z.: Observations of storm signatures by the recently modified conical scanning millimeter-wave imaging radiometer, IEEE Trans. Geosci. Remote Sens., 51, 411–424, 2013.
Wehr, T., Kubota, T., Tzeremes, G., Wallace, K., Nakatsuka, H., Ohno, Y., Koopman, R., Rusli, S., Kikuchi, M., Eisinger, M., Tanaka, T., Taga, M., Deghaye, P., Tomita, E., and Bernaerts, D.: The EarthCARE mission – science and system overview, Atmos. Meas. Tech., 16, 3581–3608, https://doi.org/10.5194/amt-16-3581-2023, 2023.
Weng, F., Yan, B., and Grody, N. C.: A microwave land emissivity model, J. Geophys. Res., 106, 20115–20123, https://doi.org/10.1029/2001JD900019, 2001.