the Creative Commons Attribution 4.0 License.
the Creative Commons Attribution 4.0 License.
 | 30 Jun 2026
Enhanced methane monitoring: a globally harmonized daily 0.1° XCH4 through machine learning-based fusion of GOSAT, GOSAT-2, and TROPOMI
Jebun Naher Keya
Yejin Kim
Hyunyoung Choi
Accurate global monitoring of atmospheric methane (CH4) is essential for tracking progress toward climate mitigation targets such as the Global Methane Pledge (GMP). Ground-based measurement networks are too sparse to provide sufficient spatial coverage, while satellite-derived retrievals are hindered by systematic biases and uncertainties, limiting their reliability for consistent global monitoring. We present the first global fusion of GOSAT, GOSAT-2, and TROPOMI to generate a globally consistent daily 0.1° land dataset for 2020–2023 for enhanced global column-averaged dry-air mole fraction of atmospheric methane (XCH4) mapping. The framework employs a three-step machine-learning (ML) approach: (1) sensor-specific bias correction using TCCON observations, (2) cross-sensor harmonization to GOSAT-2, the sensor with the strongest post-correction TCCON agreement, and (3) priority-based fusion. Tree-based ensemble regressors were trained with satellite retrieval parameters to reduce systematic biases and inter-sensor discrepancies. Independent validation at three withheld TCCON stations demonstrates robust generalization of the Fused product (R2 = 0.81, RMSE = 10.78 ppb), outperforming standard and operational bias-corrected satellite products and previously reported ML-based approaches. Regional assessments show that fusion substantially improves data availability and reduces systematic errors, delivering up to 9.5 % relative coverage gains compared to TROPOMI operational products in challenging regions (South Asia, Amazon Basin, Eastern Siberia). The Fused dataset reveals intensifying positive XCH4 anomalies (+60 ppb) over South Asia, East Asia, and Central Africa during 2020–2023, linked to MODIS-derived agricultural and urban land classes as well as known oil and gas fields. The dataset provides a scalable resource for regional CH4 emissions assessment and continuous monitoring, with the framework extendable to upcoming satellite missions (GOSAT-GW, CO2M) for long-term GMP progress tracking.
- Article
(15000 KB) - Full-text XML
-
Supplement
(1052 KB) - BibTeX
- EndNote


Methane (CH4) is a potent greenhouse gas (GHG), contributing approximately 0.6 °C of global warming since the pre-industrial era and accounting for nearly 30 % of the observed increase in global mean surface temperature (Naik et al., 2021; IEA, 2025). Despite lower atmospheric concentrations than CO2, its global warming potential is 28 times higher over a 100-year horizon (Myhre et al., 2013; IPCC, 2014). Its high radiative efficiency, combined with a relatively short atmospheric lifetime due to oxidation by hydroxyl radicals (OH), makes CH4 an especially effective target for near-term climate mitigation (Prather et al., 2012; Nisbet et al., 2020). Recent observations show that CH4 levels have been rising at an unprecedented rate, with 2020–2022 marking the fastest growth since systematic monitoring began (Saunois et al., 2025). Major CH4 sources include anthropogenic activities (livestock farming, rice cultivation, fossil-fuel exploitation, and waste management) and natural wetland emissions (Saunois et al., 2025). Reflecting the urgency of mitigation, the Global Methane Pledge (GMP), launched at the 26th Conference of the Parties (COP26), aims to reduce global CH4 emissions by at least 30 % from 2020 levels by 2030 (IEA, 2022). Accurate quantification of the column-averaged dry-air mole fraction of atmospheric methane (XCH4) is therefore essential for identifying emission sources and evaluating progress toward climate goals.
Ground-based monitoring systems such as the Total Carbon Column Observing Network (TCCON) provide high-precision XCH4 measurements and serve as key reference data for satellite validation and bias correction. Despite their accuracy, TCCON sites are limited in number and spatially sparse (Lorente et al., 2021), leaving large observational gaps across Africa, South America, and large parts of Asia. Satellite platforms help address these limitations by providing broad spatial coverage. The Greenhouse gases Observing SATellite (GOSAT), GOSAT-2, and the TROPOspheric Monitoring Instrument (TROPOMI) have enabled global-scale mapping of XCH4 and have been widely used for emission estimation and inverse modeling (Qu et al., 2021; Worden et al., 2022; Nesser et al., 2024; Maasakkers et al., 2019; Janardanan et al., 2020). However, these instruments exhibit distinct trade-offs in spatial resolution, revisit frequency, and retrieval accuracy. GOSAT and GOSAT-2 provide high spectral resolution (0.06 nm) but limited spatial and temporal coverage with ∼ 10 km circular footprints and multi-day revisit intervals (Kuze et al., 2016; Suto et al., 2021). In contrast, TROPOMI offers near-daily global coverage at finer spatial resolution (5.5 km × 7 km) but suffers from larger retrieval uncertainties due to lower spectral sensitivity and greater vulnerability to clouds and aerosols (Jacob et al., 2022; Hasekamp et al., 2022; Umezawa et al., 2025). As a result, no single satellite can offer both the accuracy and coverage desirable for robust global-scale XCH4 monitoring, making multi-sensor data fusion necessary. However, merging multiple sources first requires addressing the systematic biases inherent to each sensor to ensure inter-sensor consistency.
Previous bias correction studies have relied on statistical regression approaches that account for factors such as surface albedo, aerosol loading, and viewing geometry (Inoue et al., 2016), as well as small-area approximation methods that derive surface albedo-related biases directly from satellite observations (Lorente et al., 2021). However, such methods can struggle to capture nonlinear, sensor-specific bias structures. Machine learning (ML) approaches, including Random Forest (RF), Light Gradient Boosting Machine (LightGBM), and eXtreme Gradient Boosting (XGBoost), have demonstrated improved bias correction performance by learning complex relationships between retrieval errors and environmental or observational predictors (Balasus et al., 2023; Schneising et al., 2023; Li et al., 2024).
Despite these advances, several limitations remain. Some studies improve spatial coverage but retain substantial residual bias (Li et al., 2024), whereas others reduce systematic bias by applying global offsets to match TCCON means (Balasus et al., 2023; Parker et al., 2020), an approach that can ignore regional variations in sensor bias. Moreover, most prior work has focused on single-sensor enhancement or limited dual-sensor combinations (e.g., GOSAT + TROPOMI), leaving the potential of multi-sensor fusion underexplored (Fan et al., 2024; Balasus et al., 2023; Li et al., 2024). In contrast, XCO2 research has increasingly adopted multi-platform fusion (e.g., OCO-2, OCO-3, GOSAT, and GOSAT-2) as a standard approach (Chen et al., 2024; Wang et al., 2022), while comprehensive global XCH4 fusion products remain comparatively scarce. To the best of our knowledge, GOSAT-2 has not yet been incorporated into a global XCH4 fusion product, despite its improved spectral performance and expanded coverage relative to GOSAT.
To address these gaps and enable consistent global XCH4 monitoring, we develop an ML-based multi-sensor harmonization and fusion framework that (1) corrects sensor-specific biases using TCCON observations, (2) harmonizes all satellite retrievals to the most accurate sensor (GOSAT-2), and (3) fuses the harmonized retrievals to maximize daily spatial coverage while preserving accuracy. The resulting product provides global daily XCH4 over land (60° S–80° N) at 0.1° resolution for 2020–2023, with improved accuracy and spatiotemporal coverage, compared to individual sensor retrievals. This enhanced dataset enables more reliable regional emission analysis, hotspot identification, and source characterization.
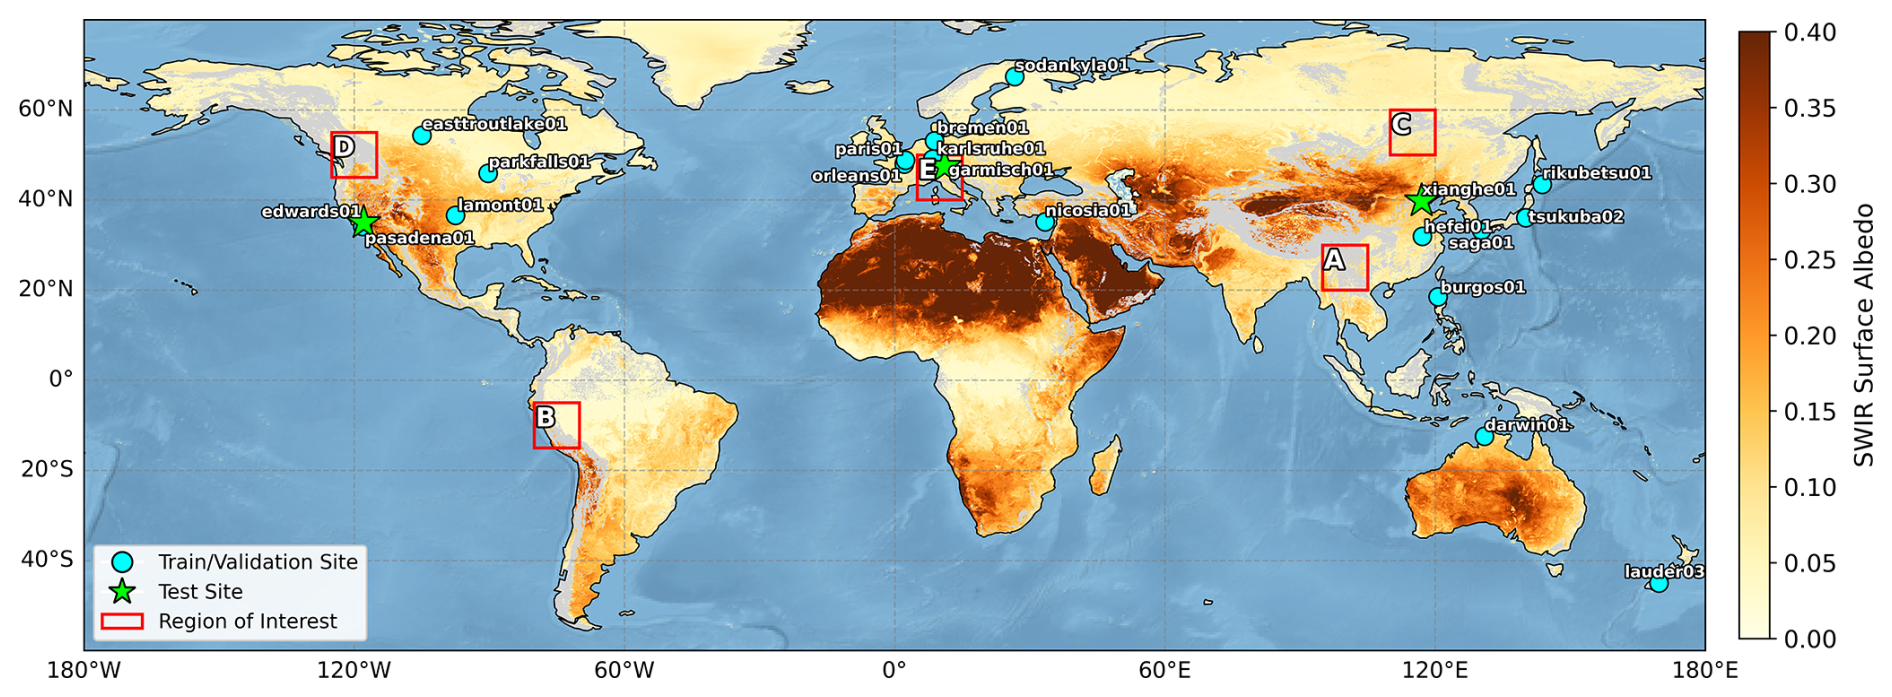
Figure 1Study domain and TCCON sites (GGG2020 XCH4) used during 2020–2023. Cyan circles denote sites used for model training/validation. Green stars indicate independent test sites held out from training and used only for evaluation of the Fused XCH4 product. Red boxes (A–E) denote regions of interest used for regional analyses in Sect. 4.3. The background map shows the 2020–2023 mean SWIR surface albedo from TROPOMI.
Table 1TCCON (GGG2020 version) sites used for evaluation of satellite XCH4 and machine learning based bias correction.
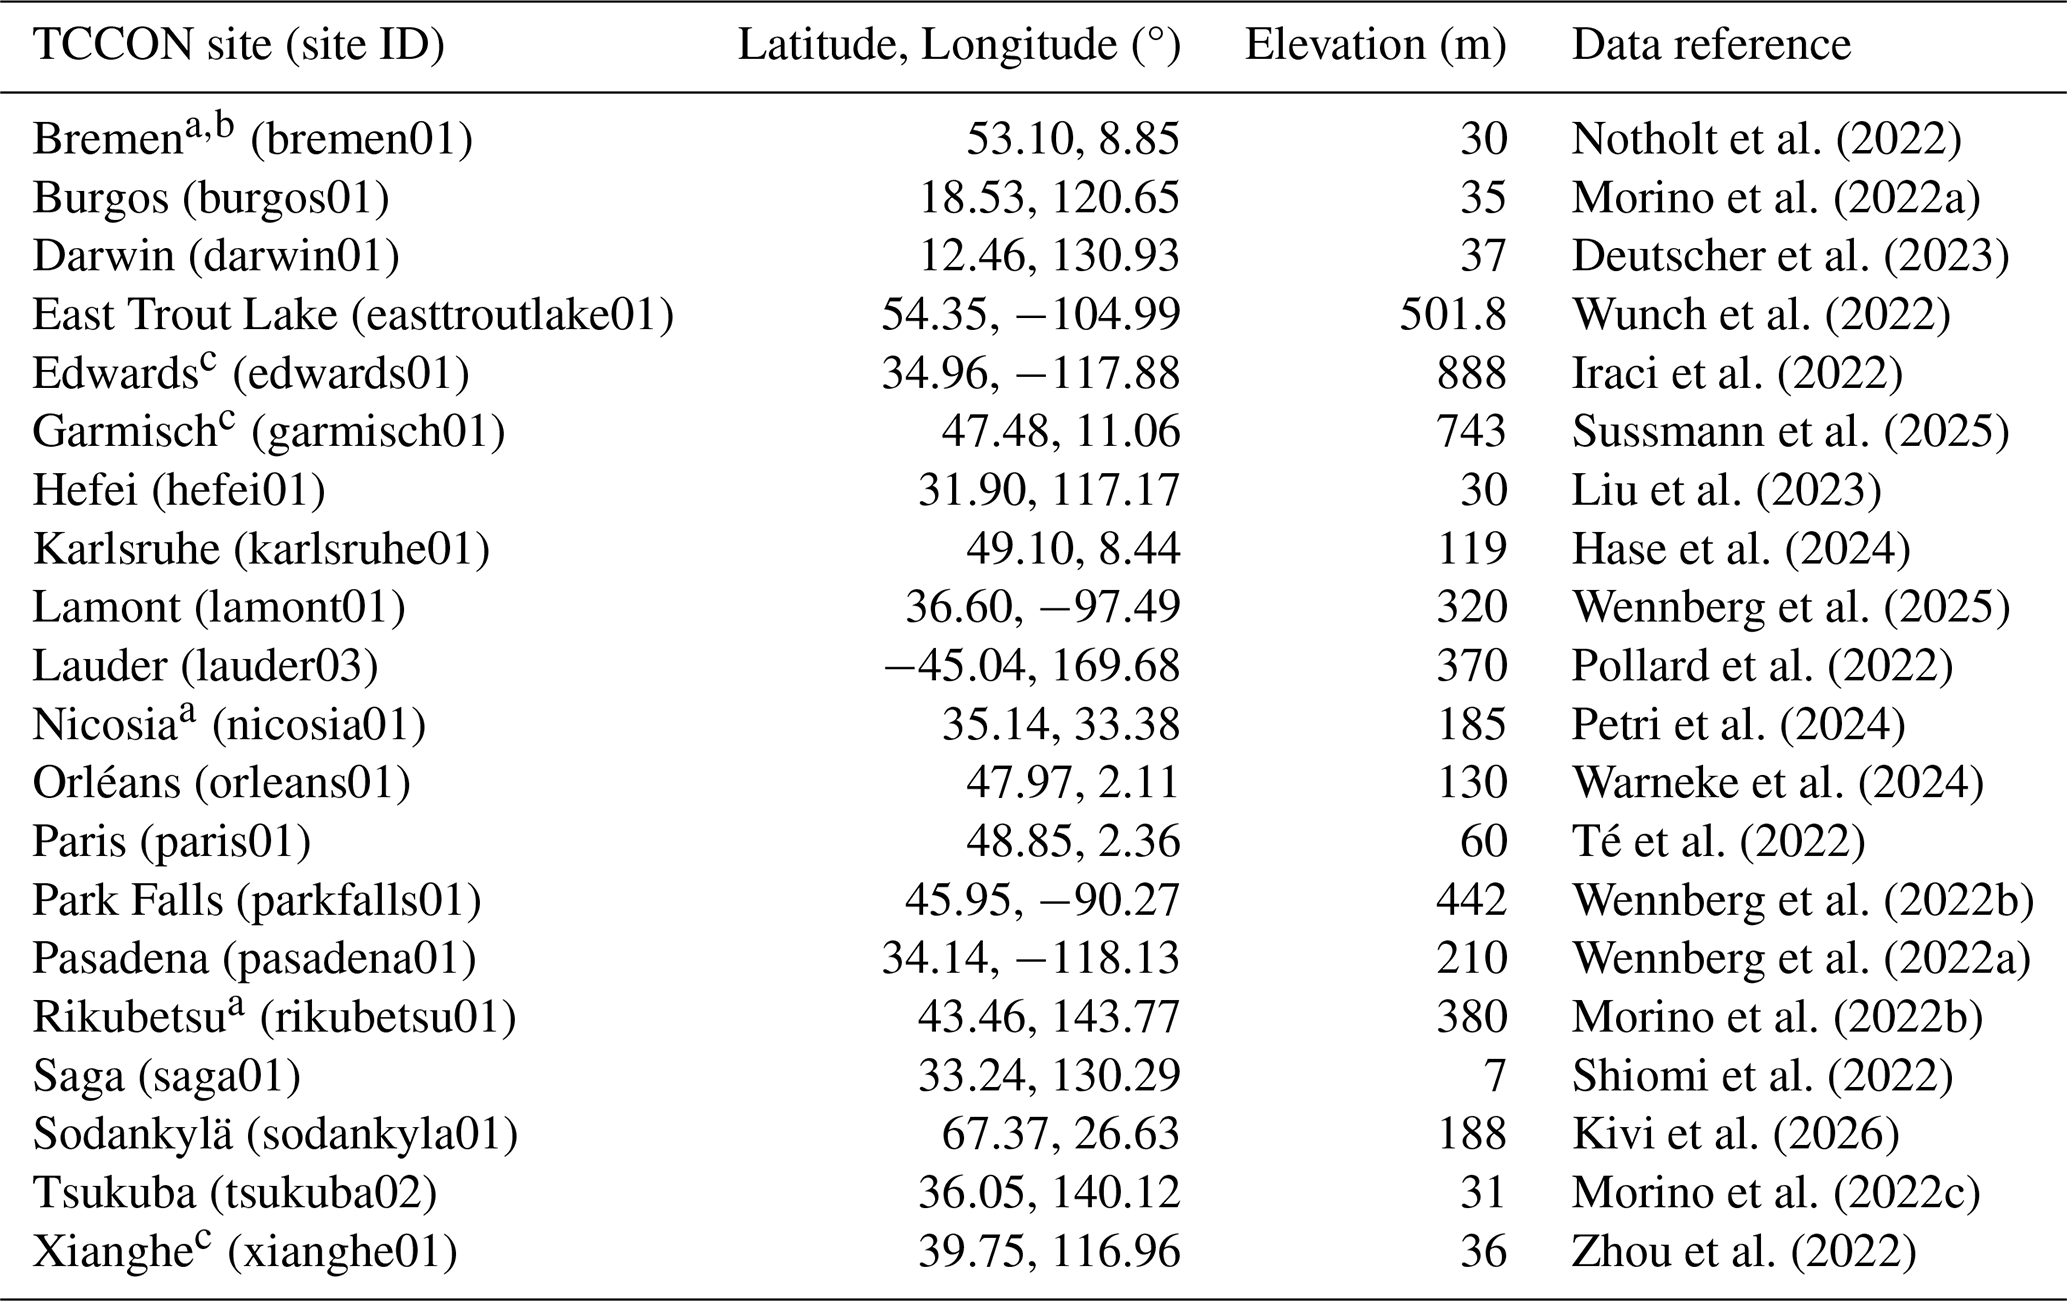
a Sites excluded from the GOSAT evaluation under the GOSAT colocation criteria. b Sites excluded from the GOSAT-2 evaluation under the GOSAT-2 colocation criteria. c Independent test sites not used for training/validation of the machine learning based bias-correction model.
2.1 Ground XCH4 observations
TCCON is a global network of ground-based Fourier transform spectrometers (FTSs) that record direct solar spectra in the near-infrared (NIR) region (Wunch et al., 2011). TCCON serves as a benchmark dataset for validating satellite-derived XCH4 because its measurements are minimally affected by aerosol loading, airmass uncertainty, and surface-reflectance variability compared with SWIR satellite retrievals (Dils et al., 2014; Malina et al., 2022). We obtained the latest TCCON GGG2020 dataset from the TCCON data archive hosted by CaltechDATA (https://tccondata.org/, last access: 26 December 2025) spanning January 2020 to December 2023, covering the overlapping observation period of TROPOMI, GOSAT, and GOSAT-2. Stations used in this study are shown in Fig. 1 and listed in Table 1.
Table 2Key specifications of GOSAT, GOSAT-2, and Sentinel-5P/TROPOMI XCH4 products used in this study.
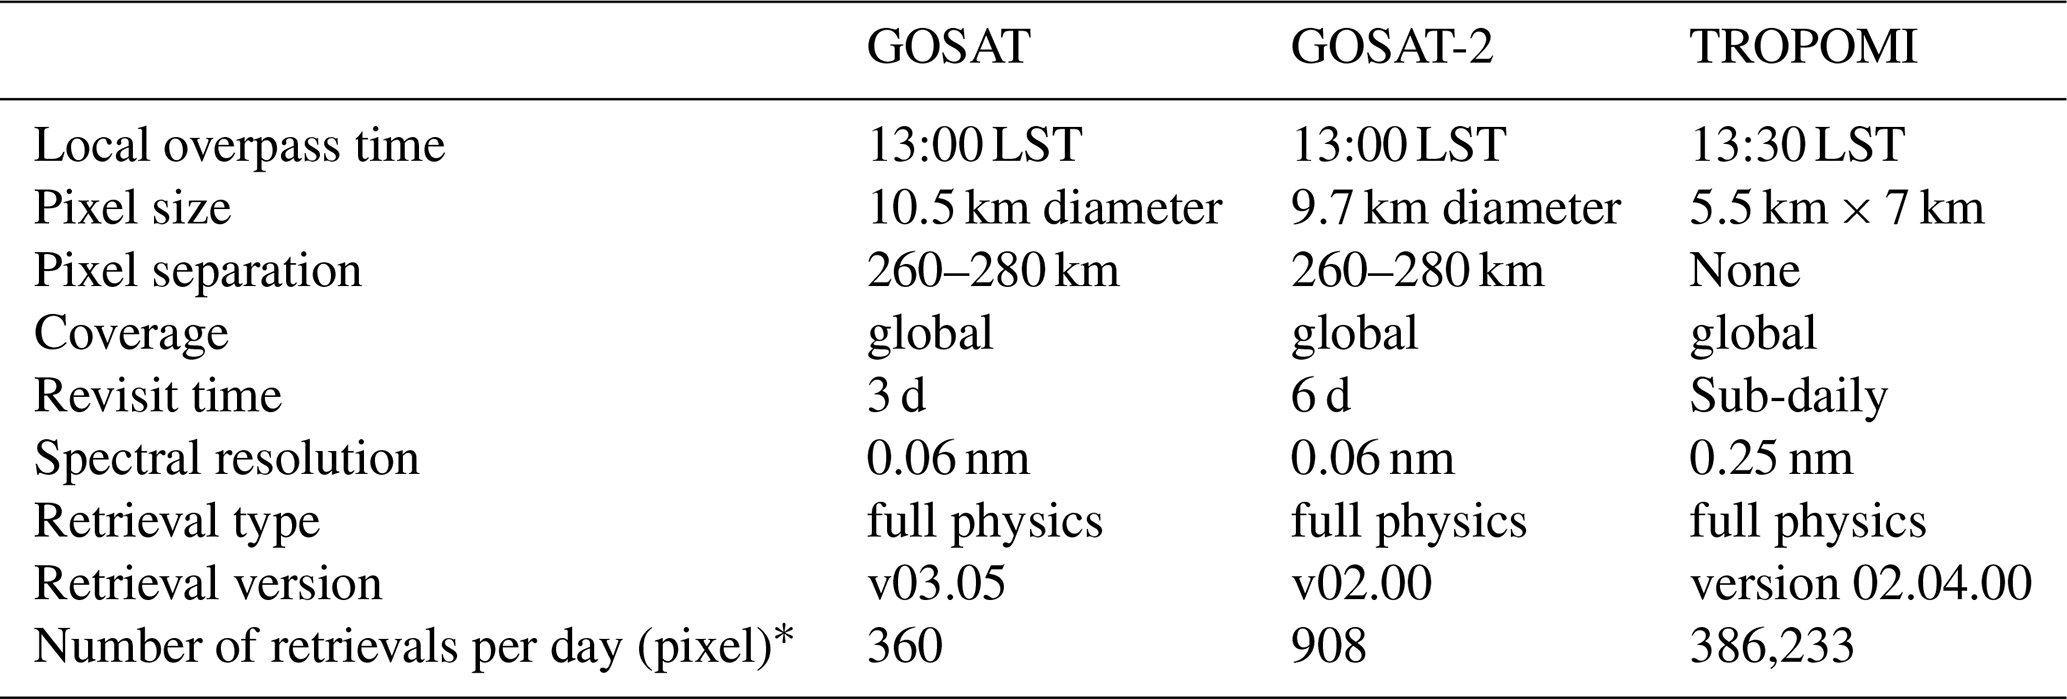
∗ The number of XCH4 retrievals per day represents the average soundings calculated per day over the full study period from 1 January 2020 to 31 December 2023.
LST: Local Solar Time.
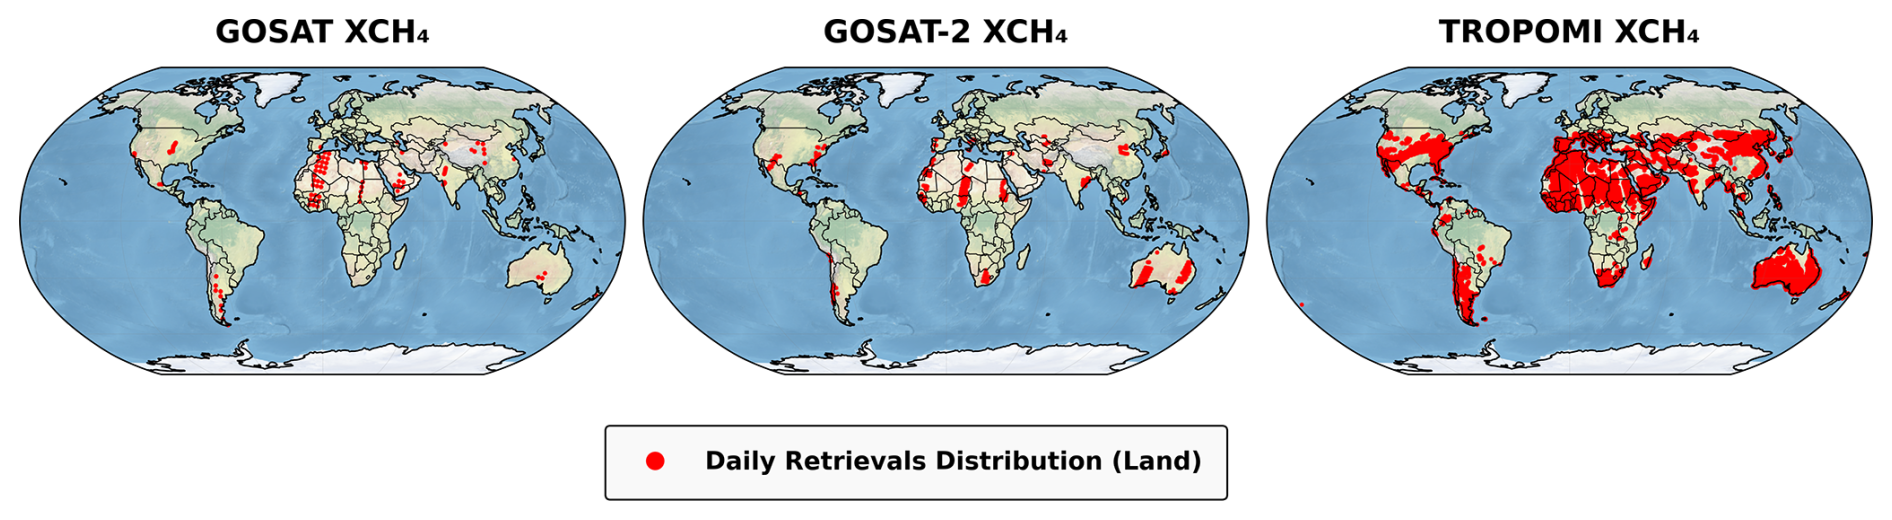
Figure 2Spatial distribution of daily XCH4 retrievals over land on 1 January 2020 from GOSAT, GOSAT-2, and TROPOMI. Red markers indicate native pixel locations of individual soundings and are enlarged for visualization purposes.
2.2 Satellite XCH4 products
This study used XCH4 products from TROPOMI, GOSAT, and GOSAT-2. These satellite platforms have been widely used for regional and global GHG monitoring, emission estimation, and multi-sensor XCH4 data integration (Balasus et al., 2023; Fan et al., 2024; Bao et al., 2025; Wang et al., 2025; Liu et al., 2026; Lee et al., 2025: Choi and Jeong, 2026). All three missions retrieve XCH4 using full-physics algorithms that simultaneously estimate surface albedo, atmospheric scattering, and trace-gas concentrations from SWIR and NIR spectra (Butz et al., 2011). However, full-physics retrievals are sensitive to clouds, aerosols, and surface heterogeneity, increasing retrieval bias and reducing data availability in high-aerosol regions and complex terrain (Jacob et al., 2022; Umezawa et al., 2025). GOSAT and GOSAT-2 provide high-precision measurements with spectral resolution approximately four times finer than that of TROPOMI (Kuze et al., 2009, 2016; Suto et al., 2021; Jacob et al., 2022; Noël et al., 2021; Table 2), whereas TROPOMI offers daily global mapping, which increases data density despite higher susceptibility to atmospheric interference (Hu et al., 2018; Qu et al.,2021). These contrasting characteristics reflect an inherent trade-off between sampling density and retrieval accuracy. Table 2 summarizes mission specifications, and Fig. 2 illustrates daily sampling patterns for 1 January 2020.
2.2.1 GOSAT
GOSAT (also known as Ibuki), launched in 2009, carries the Thermal And Near infrared Sensor for carbon Observation Fourier Transform Spectrometer (TANSO-FTS) and the TANSO Cloud and Aerosol Imager (CAI) in a sun-synchronous orbit at 666 km (Kuze et al., 2009). TANSO-FTS measures high-resolution spectra in the SWIR and thermal infrared bands, which are used to retrieve column abundances of CO2 and CH4 (Yoshida et al., 2011). We used the NIES SWIR L2 CH4 product (v03.05) from GOSAT Data Archive Service (GDAS: https://data2.gosat.nies.go.jp/, last access: 26 December 2025), which provides both bias-uncorrected (hereafter standard) and bias-corrected retrievals calibrated against TCCON GGG2014 (Inoue et al., 2016). The standard product was used as ML model input, while the bias-corrected product was used for comparison.
2.2.2 GOSAT-2
GOSAT-2, the successor to GOSAT, was launched in 2018, carries upgraded TANSO-FTS-2 and CAI-2 with an intelligent cloud-avoidance pointing strategy, enabling enhanced sensitivity and expanded spatial coverage (Suto et al., 2021; Imasu et al., 2023; Park et al., 2024). GOSAT-2 extends Band 3 spectral coverage to 2.33 µm (compared to 2.08 µm for GOSAT), capturing additional CH4 absorption features. We used the SWIR Level-2 full-physics XCH4 product (v02.00; hereafter standard) from the GOSAT-2 archive (https://data2.gosat.nies.go.jp/, last access: 26 December 2025). To ensure high data reliability, only retrievals with quality flag = 0 were retained for bias-correction modeling.
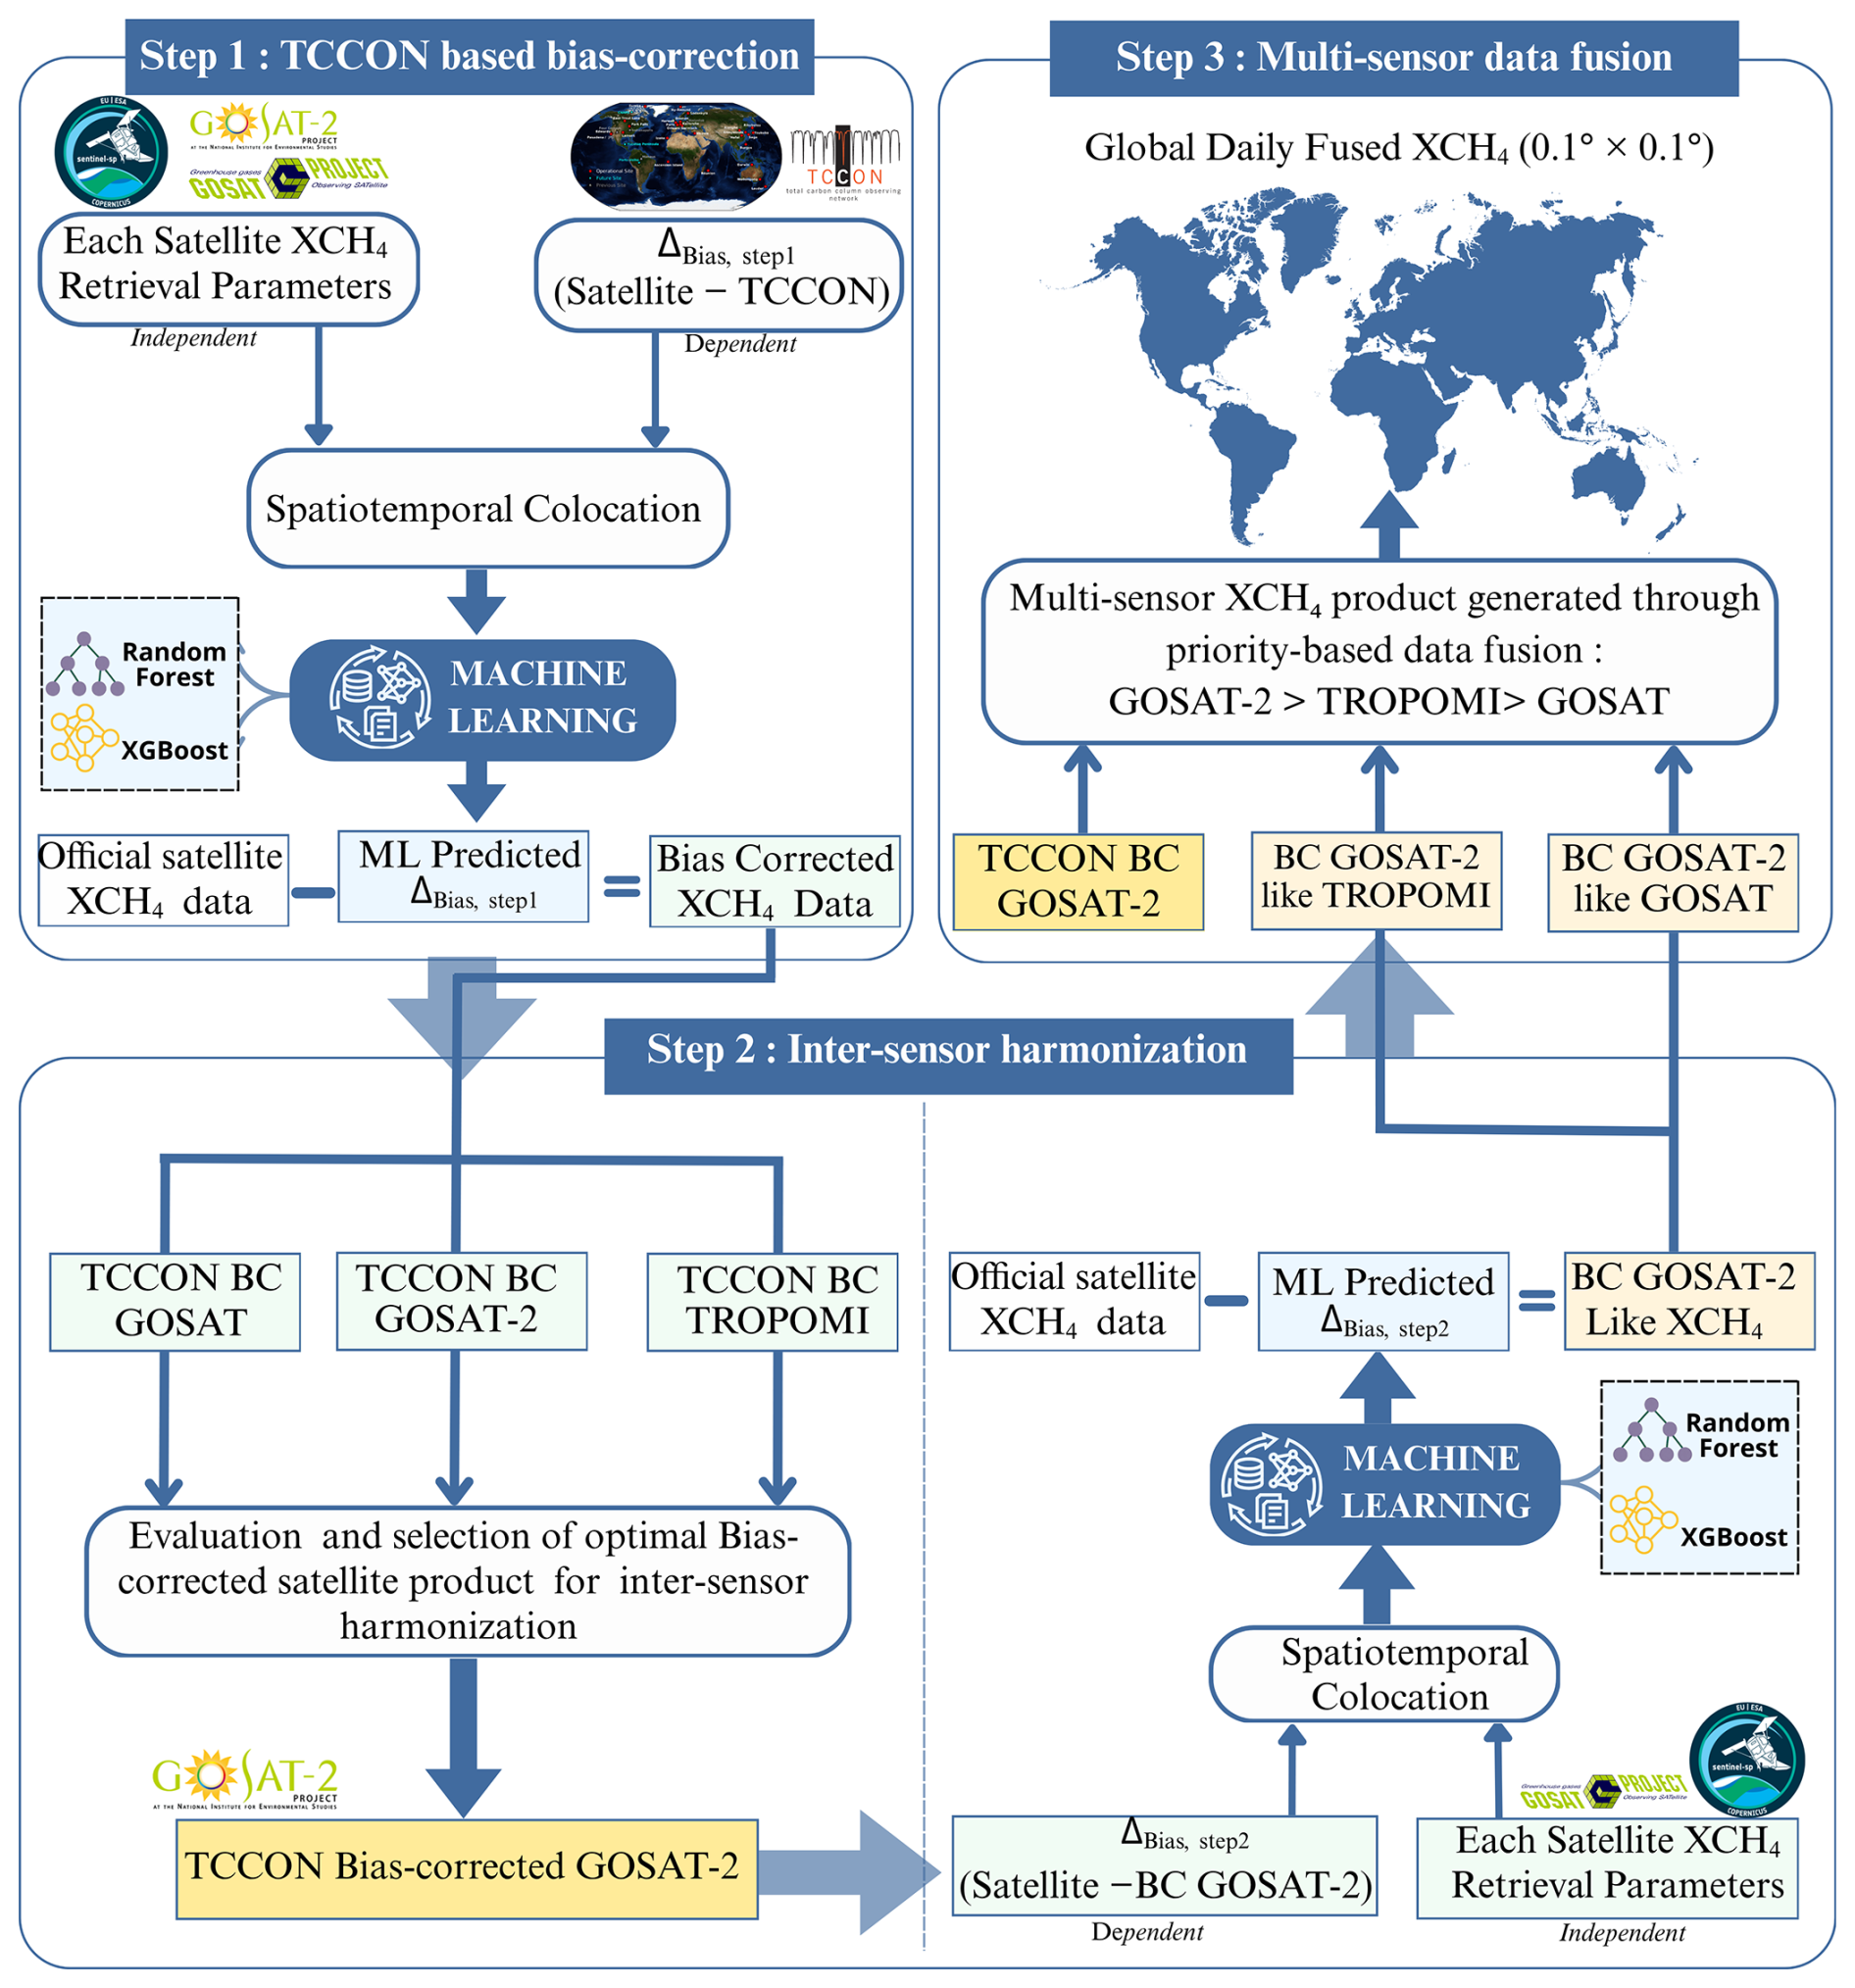
Figure 3Overview of the machine learning (ML)-based bias correction (BC) and data fusion framework used to generate the Fused XCH4 product.
2.2.3 TROPOMI
TROPOMI, the sole payload on ESA's Sentinel-5 Precursor (S5P) mission launched in 2017, is a nadir-viewing push-broom hyperspectral imaging spectrometer that measures radiance from the ultraviolet (UV) to the SWIR (Veefkind et al., 2012). CH4 retrievals are derived using the RemoTeC algorithm (Hasekamp et al., 2022), and the sun-synchronous orbit with an approximately 2,600 km swath width enables near-daily global mapping of atmospheric CH4. We used the S5P Level-2 XCH4 product (S5P_L2__CH4____HiR) from NASA Goddard Earth Sciences Data and Information Services Center (GES DISC; https://disc.gsfc.nasa.gov/datasets/S5P_L2__CH4____HiR_2/summary?keywords=methane, last access: 22 June 2026). This dataset provides both uncorrected XCH4 (hereafter standard) and the posteriori albedo-dependent bias corrected XCH4 (Lorente et al., 2021), along with associated retrieval parameters. For consistency with GOSAT and GOSAT-2, we selected standard XCH4 retrievals with a quality assurance flag qa_value = 1 as model input, while the official bias-corrected product was used for comparison.
To address limitations of single-sensor CH4 retrievals and inter-satellite inconsistencies, we developed an integrated ML framework that combines bias correction, cross-sensor harmonization, and multi-sensor fusion of XCH4 retrievals from TROPOMI, GOSAT, and GOSAT-2. The framework produces a globally harmonized daily 0.1° land XCH4 product for 2020–2023 through three hierarchical steps (Fig. 3):
-
Step 1: Sensor-specific bias correction using TCCON as the calibration standard.
-
Step 2: Inter-satellite harmonization by aligning all datasets to the most accurate sensor (bias-corrected GOSAT-2).
-
Step 3: Multi-sensor fusion to maximize daily spatial coverage while preserving accuracy.
We define the systematic retrieval bias for a given satellite observation as:
where XCH4, Satellite denotes the standard (uncorrected) satellite retrieval and XCH4, Reference denotes the reference value (TCCON in Step 1; bias-corrected GOSAT-2 in Step 2). For BC, we used ensemble tree-based regressors (RF and XGBoost) due to their strong performance and stability in tabular regression with nonlinear interactions (Hwang and Song, 2023; Shwartz-Ziv and Armon, 2022). For GOSAT and GOSAT-2, the predictor set additionally included co-retrieved XCO2-related variables because CH4 and CO2 are retrieved simultaneously from the same SWIR spectra using a shared full-physics forward model (Butz et al., 2010). Scattering-induced light-path errors often affect both gases in a correlated manner (Oshio et al., 2020). As TROPOMI does not retrieve CO2, only XCH4 retrieval parameters were selected based on established practice (Balasus et al., 2023). Using these parameters, mission-specific BC models were trained to predict bias () and the predicted bias was subtracted from the original retrieval:
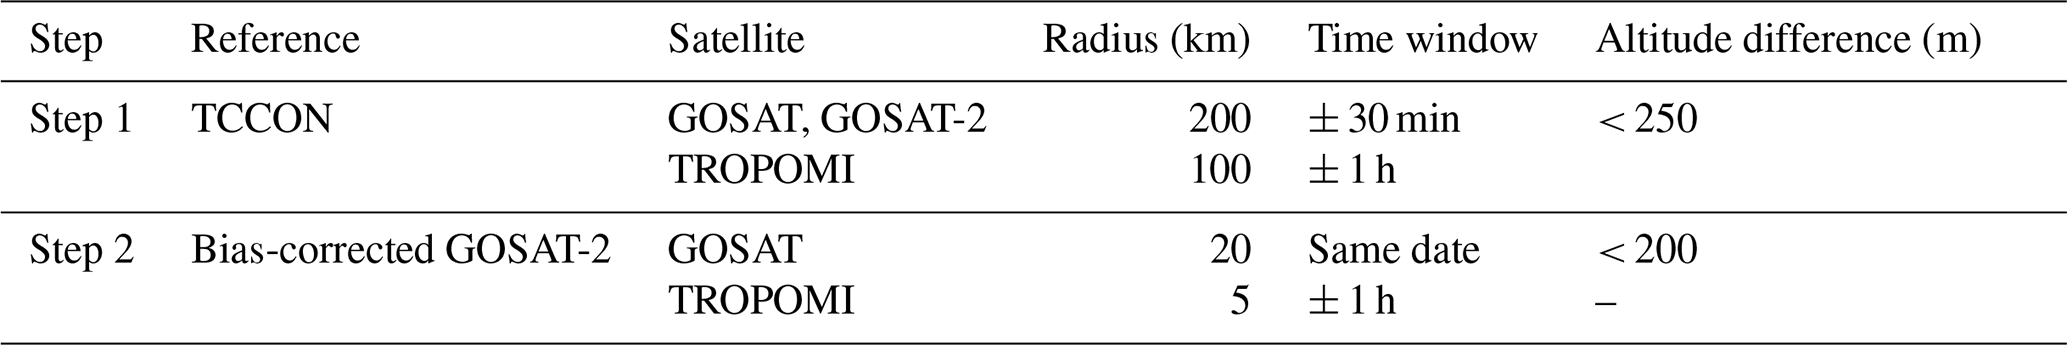
Table 3Colocation criteria used for TCCON-based bias correction (Step 1) and inter-satellite harmonization (Step 2). All thresholds were chosen based on satellite-specific characteristics and standard validation practices.
3.1 Data preprocessing and colocation
Reliable colocation between satellite retrievals and reference observations is essential for bias correction and validation. The sparse global distribution of TCCON sites prevents perfectly coincident measurements (Zhou et al., 2016). We therefore constructed collocated training pairs using satellite-specific spatiotemporal and elevation constraints, adopting criteria from previous studies and official validation strategies (Balasus et al., 2023; Yoshida et al., 2023). Using the criteria in Table 3, we first established Step 1 between each satellite and TCCON. To ensure adequate temporal representation across 2020–2023 and sufficient training samples, TCCON site with fewer than 20 collocated observations (i.e., eureka01) was excluded. We then constructed Step 2 inter-satellite colocations, pairing GOSAT and TROPOMI observations with TCCON calibrated GOSAT-2 using the thresholds in Table 3.
3.2 ML-based bias correction and harmonization
While GOSAT and TROPOMI provide official bias-corrected products (Inoue et al., 2016; Lorente et al., 2021), GOSAT-2 does not. To treat all sensors consistently, we developed a unified ML framework using TCCON as the calibration standard. Previous studies improved TROPOMI XCH4 by aligning to GOSAT official (Fan et al., 2024) or GOSAT proxy data (Balasus et al., 2023; Li et al., 2024), which applies a single global offset to force mean bias to zero and is available only through 2021 (Parker et al., 2020). Our approach directly calibrates each sensor against TCCON, enabling spatially and temporally adaptive bias correction throughout 2020–2023 and data-driven harmonization reference selection.
3.2.1 Step 1: TCCON-based bias correction
For each satellite, we trained ML models using satellite–TCCON collocated pairs to predict the systematic bias between raw satellite retrievals and TCCON:
Satellite-specific retrieval parameters were used as predictors to model systematic error in the raw XCH4 retrievals. Because each mission provides a large number of candidate retrieval parameters (> 100), we applied a three-stage feature selection procedure:
- 1.
Correlation screening: Pearson and Spearman analyses to rank predictors based on linear and monotonic associations with ΔBias,step1.
- 2.
Recursive feature elimination (RFE): RFE with cross-validation to identify a compact predictor subset.
- 3.
Refinement: final adjustment using feature-importance rankings from preliminary models.
The final predictor lists are provided in Tables S1–S3 in the Supplement. The trained model predicts , and the bias-corrected product is computed using Eq. (2).
3.2.2 Step 2: Inter-sensor harmonization
To select a harmonization reference, we evaluated the Step 1 bias-corrected outputs from all three sensors against common TCCON observations. GOSAT-2 exhibited the highest agreement with TCCON and was therefore selected as the harmonization reference (detailed results in Sect. 4.2). Using inter-satellite collocations, we developed ML models to reduce sensor-to-sensor discrepancies relative to calibrated GOSAT-2:
where XCH4, Satellite is the standard retrieval from the target sensor (GOSAT or TROPOMI) and is the Step-1 bias-corrected GOSAT-2 retrieval. Feature selection followed the same three-stage procedure as in Sect. 3.2.1 (correlation screening, RFE, and importance refinement). Final predictor lists are provided in Tables S3 and S4. We trained ML models to predict and generated GOSAT-2-like harmonized products by subtracting the predicted bias:
3.3 Step 3: Data Fusion
The fusion step integrates harmonized satellite datasets into a single daily 0.1° gridded product. We adopted a hierarchical priority-based fusion strategy (Chen et al., 2024), ranking datasets by their validation performance against TCCON and inter-sensor consistency. Because GOSAT-2 was selected as the harmonization reference and exhibits the strongest independent agreement with TCCON, it was assigned the highest priority. Based on the Step-2 evaluation, the final ranking used for fusion was:
For each day and each 0.1° grid cell (x,y), the Fused product was defined as:
This rule retains the highest-priority valid observation at each location and time, thereby improving both spatial coverage and precision of the Fused daily XCH4 product.
3.4 Model evaluation
The spatial and temporal generalization performance of the BC was quantitatively evaluated using step-specific validation strategies. In Step 1, spatial generalization was assessed using leave-one-site-out cross-validation (LOSOCV) to account for site-to-site differences in background XCH4 levels and spatial heterogeneity. Temporal generalization was evaluated using leave-one-month-out cross-validation (LOMOCV) and leave-one-year-out cross-validation (LOYOCV) to account for interannual variability and growth trends (Jang et al., 2024). In Step 2, leave-one-band-out cross-validation (LOBOCV) was applied across 11 latitudinal zones (60° S–80° N; Fig. S1 in the Supplement) to account for latitudinal gradients in CH4 emissions (Maasakkers et al. 2019; Hwang et al., 2026), with temporal validation using LOMOCV and LOYOCV. Model performance was evaluated using three standard metrics: coefficient of determination (R2), root mean square error (RMSE) and mean absolute error (MAE) (Eqs. S1–S3 in the Supplement).
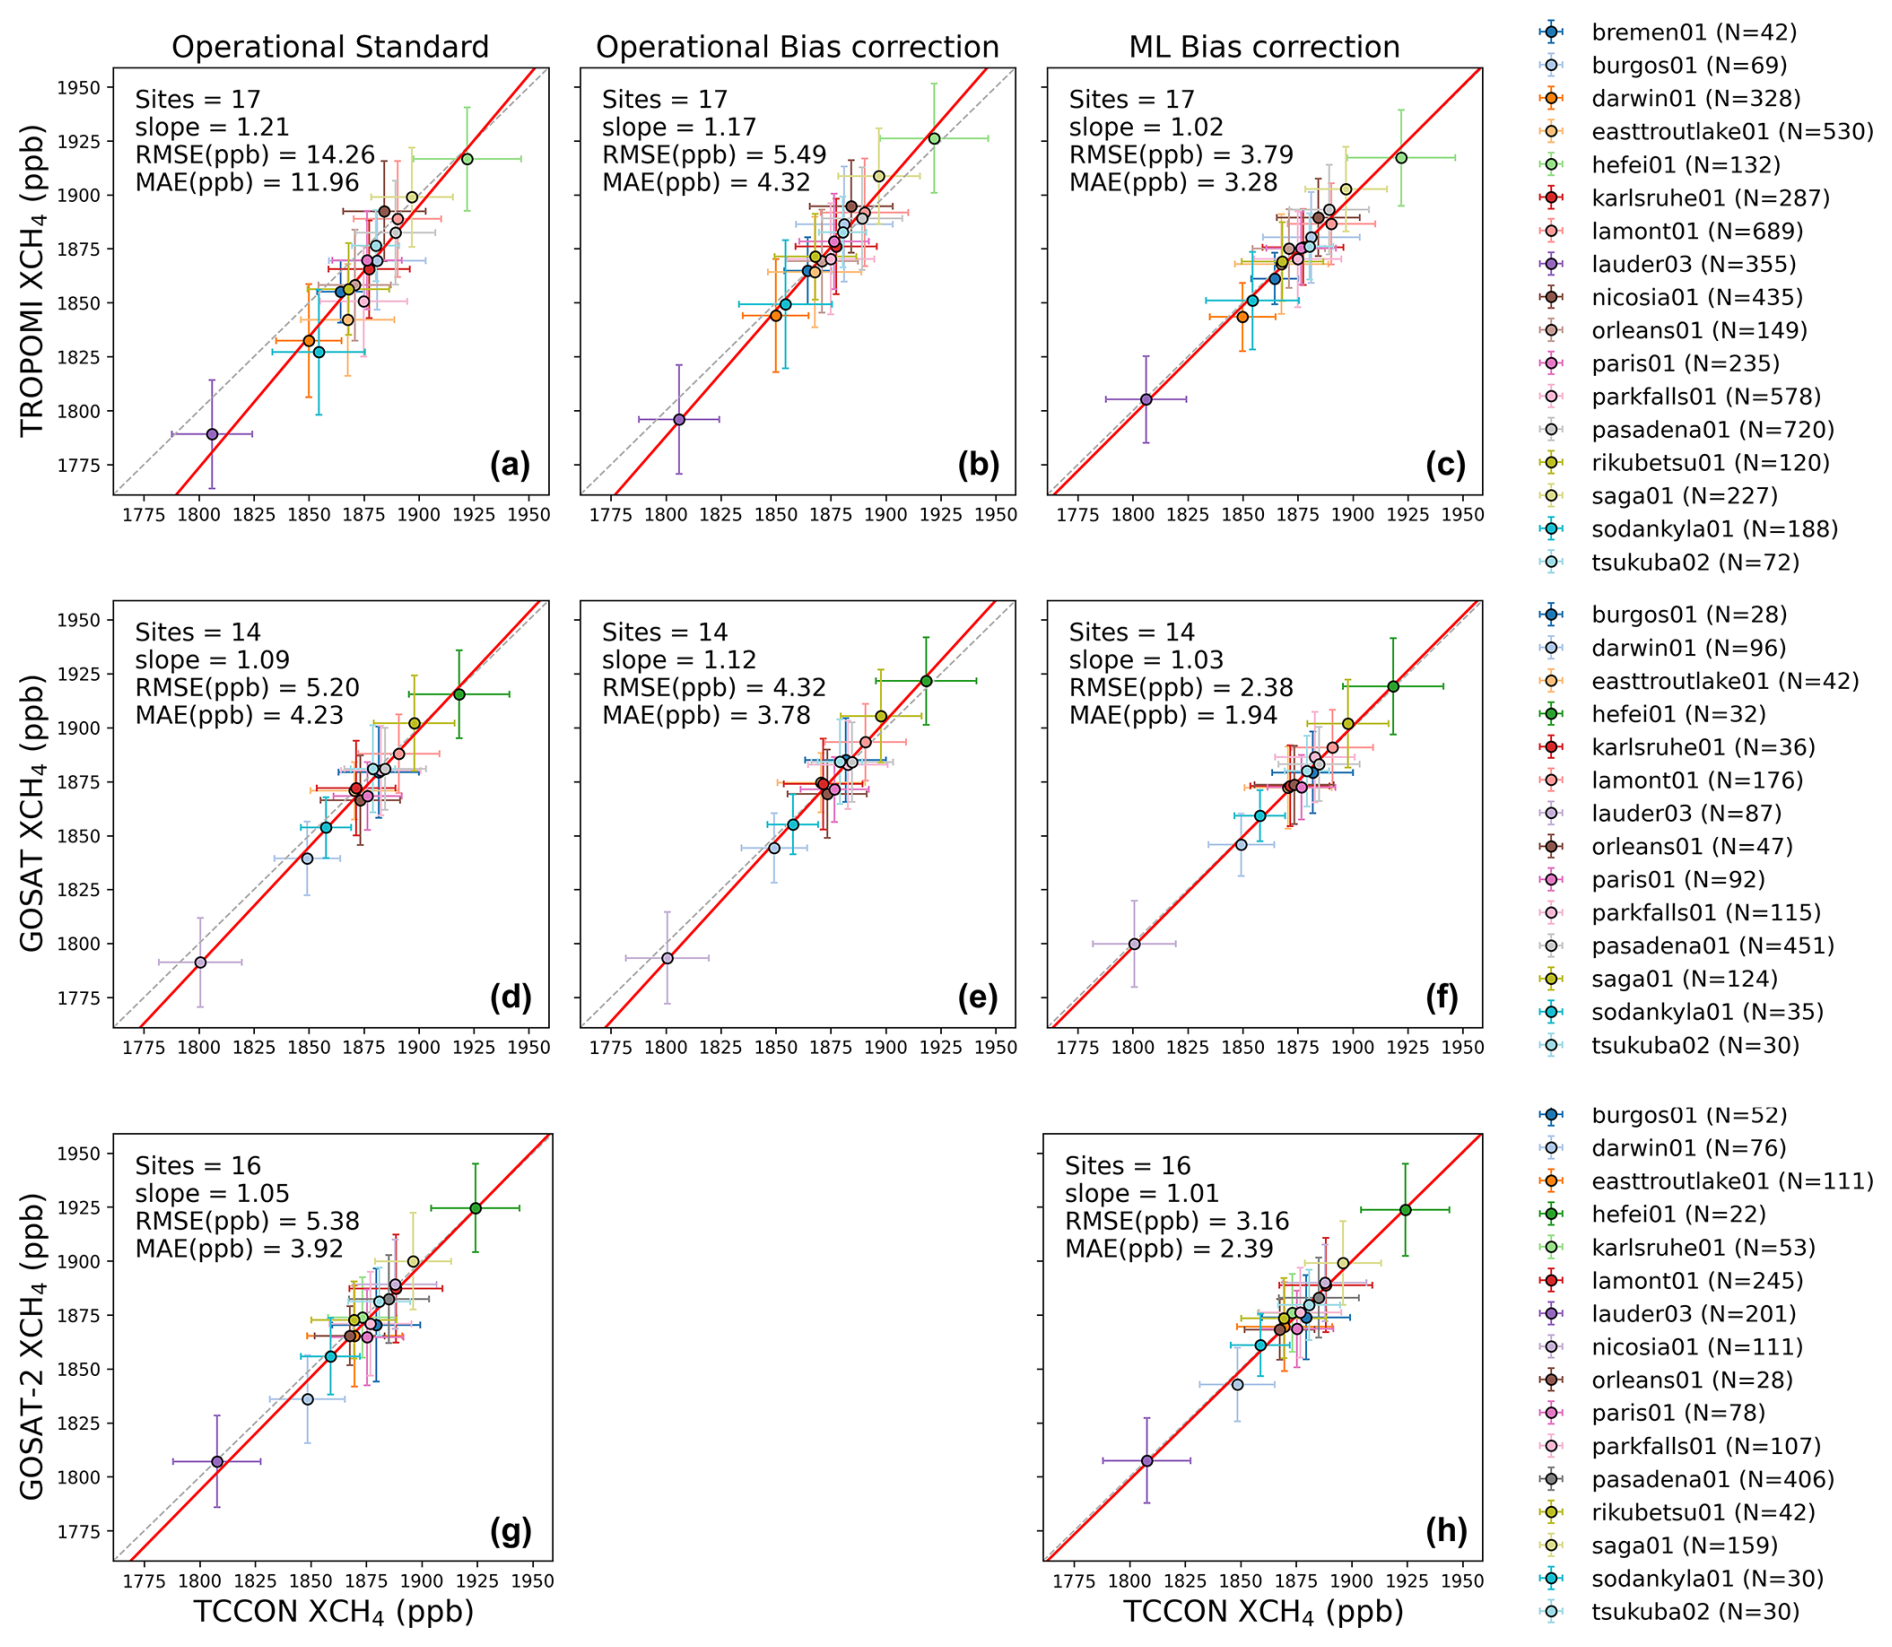
Figure 4Site-wise scatterplots of column-averaged dry-air methane (XCH4) between Total Carbon Column Observing Network (TCCON) and satellite products; (a–c) TROPOMI XCH4, (d–f) GOSAT XCH4, (g–h) GOSAT-2 XCH4 for the operational standard and operational bias-corrected products, and machine learning (ML) based bias-corrected result (under leave-one-site-out cross-validation), respectively. Each marker represents the mean XCH4 at one TCCON site over the study period (2020–2023), with horizontal and vertical error bars indicating one standard deviation of TCCON and satellite XCH4, respectively. Red lines denote least-squares linear regression fits.
4.1 Overall validation against TCCON
We evaluated the spatiotemporal generalization performance of official satellite products and ML-based bias-correction against TCCON. In Fig. 4, LOSOCV results and TCCON observations were aggregated at each TCCON site to examine site-level mean bias, within-site variability, and station-to-station consistency. The standard products systematically deviated from the 1:1 line, with pronounced negative biases at low-XCH4 sites such as darwin01, lauder03, and sodankyla01 (Fig. 4a, d, and g; see Fig. 1 for site locations). These sites are located in the Southern Hemisphere or high latitudes, where challenging retrieval conditions (e.g., high solar zenith angle and high surface albedo) and limited TCCON sampling can amplify errors. In addition, operational bias corrections tuned around typical global XCH4 levels (≈ 1850–1900 ppb) can leave larger residual deviations at the low and high tails.
In contrast, the ML-based correction tightened site-level agreement for all sensors, reducing both RMSE and MAE. This correction used sensor-specific models selected based on CV performance (Table S5; XGBoost for TROPOMI, RF for GOSAT and GOSAT-2). For TROPOMI, the RMSE decreased from 14.26 ppb (standard) and 5.49 ppb (operational bias-corrected) to 3.79 ppb (ML), corresponding to reduction of 73 % and 31 %, respectively (Fig. 4a–c). For GOSAT, RMSE reductions of 54 % and 45 % were achieved relative to the operational standard and bias-corrected products, respectively, while GOSAT-2 showed a 41 % reduction relative to the operational standard (Fig. 4d–h). Site-wise error statistics (Figs. S2–S4) confirmed these improvements, with ML-based correction reducing both station-wise mean bias (μ) and variability (σ), indicating more uniform performance under spatially heterogeneous conditions. Given a global XCH4 growth rate of ∼ 8–14 ppb yr−1 during the study period (NOAA GML; https://gml.noaa.gov/ccgg/trends_ch4/, last access: 26 December 2025), these reductions are large enough to influence long-term trend interpretation.
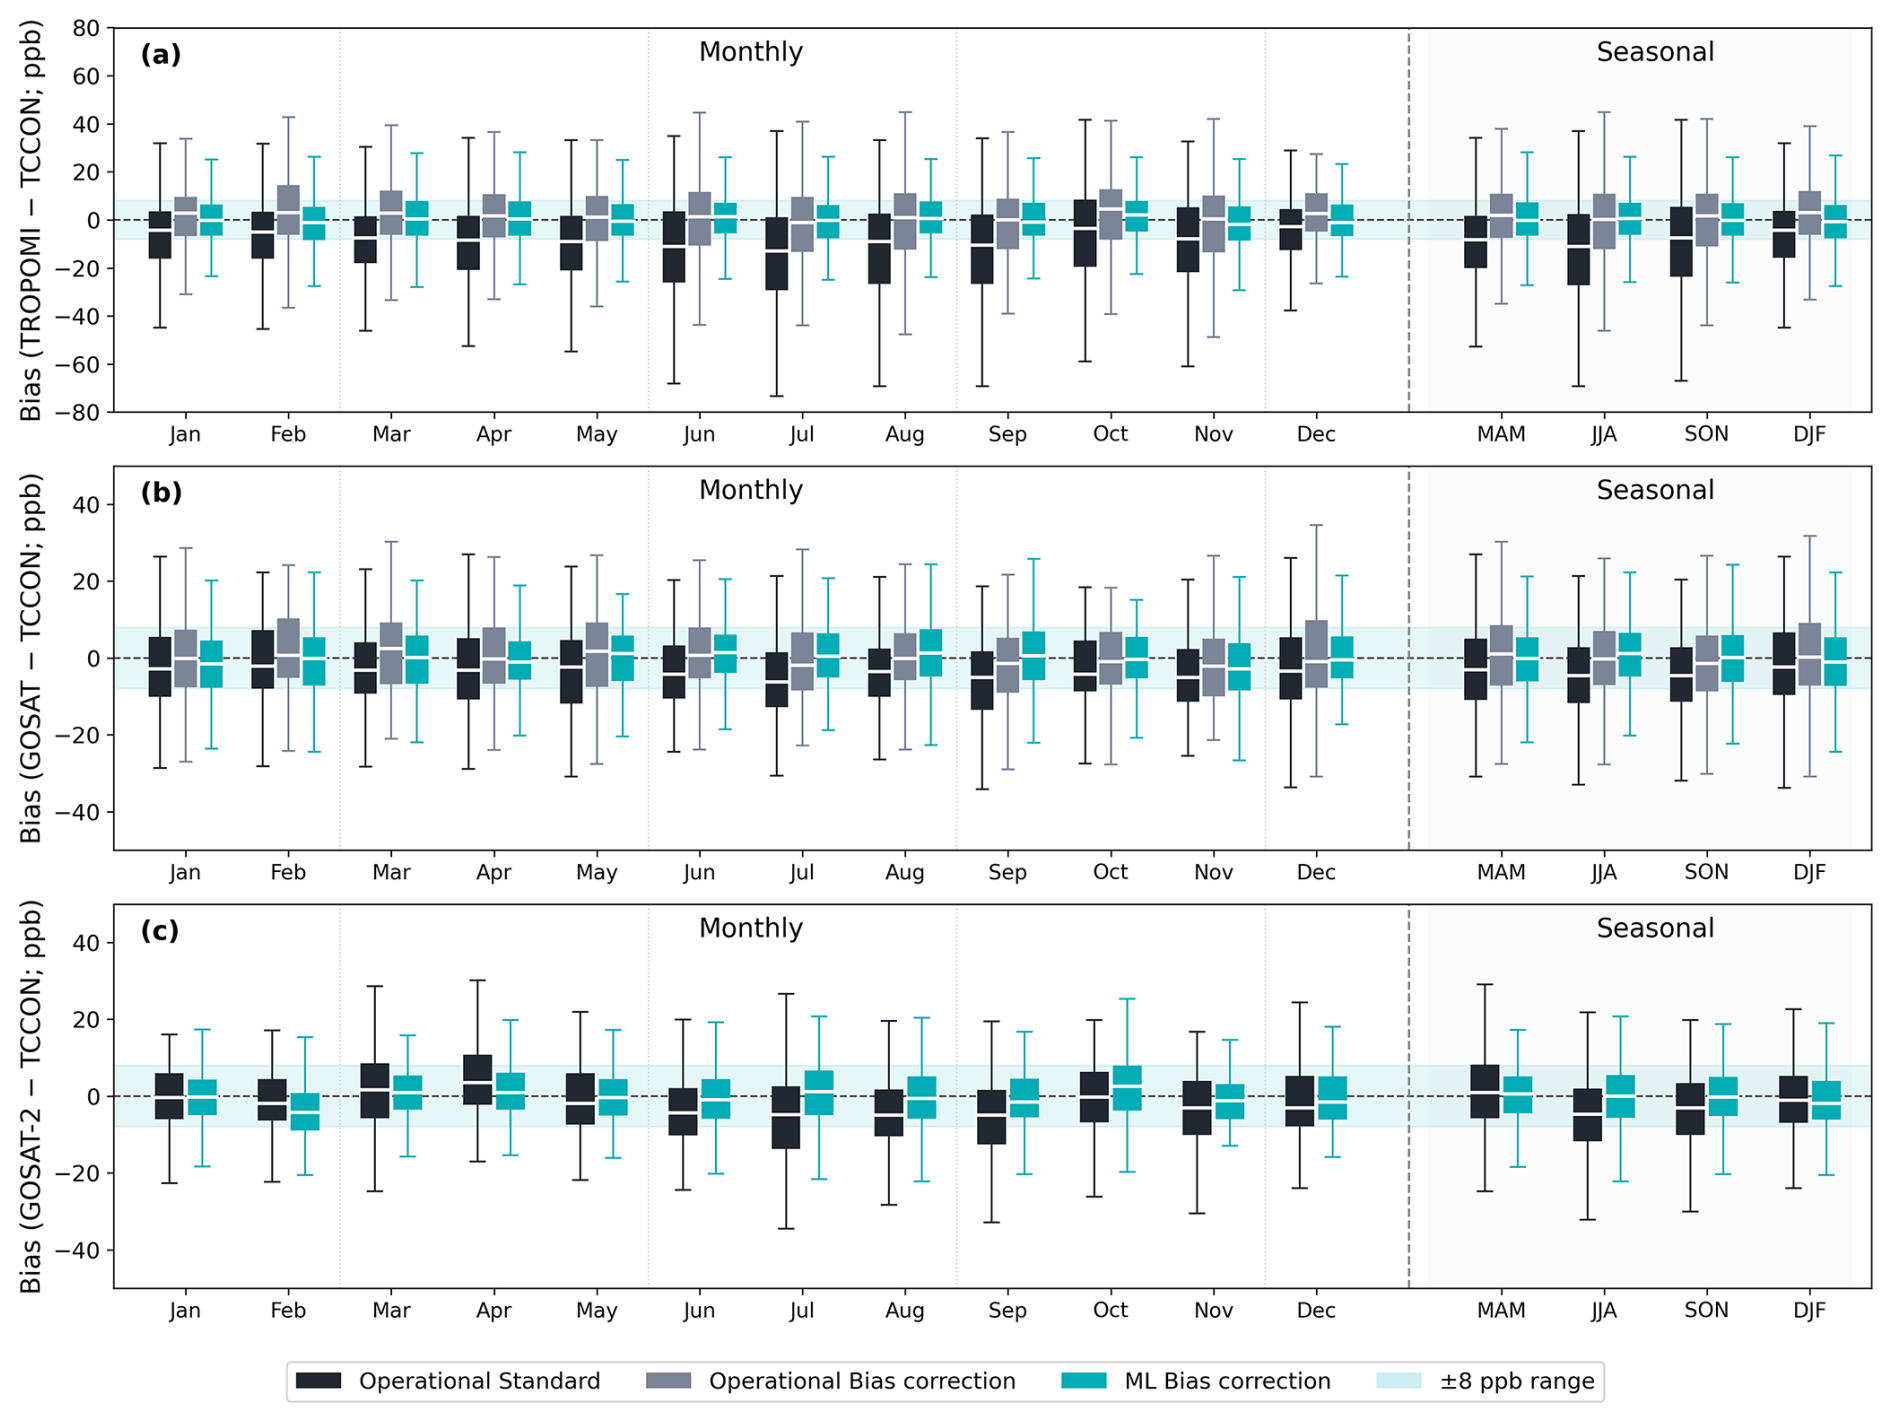
Figure 5Monthly and seasonally aggregated XCH4 bias distributions under leave-one-month-out cross-validation (LOMOCV). Box-and-whisker plots show bias distributions (Satellite − TCCON) for each calendar month and their seasonal aggregations for (a) TROPOMI, (b) GOSAT, and (c) GOSAT-2. The compared datasets include the uncorrected operational standard products, operational bias-corrected products, and ML-based bias-corrected results. Boxes indicate the interquartile range (IQR) with the median shown as a horizontal white line. The shaded band marks the ± 8 ppb range around zero bias.
The LOMOCV results further highlighted differences in temporal generalization (Fig. 5). Across sensors, the standard products showed negative biases and broad interquartile ranges (IQRs) throughout the year, with strong negative shifts from June to September. The seasonal aggregation confirmed that this negative bias was most pronounced in June–July–August (JJA). This seasonal pattern is consistent with known sensitivities of SWIR-based XCH4 retrievals to surface albedo and atmospheric scattering by aerosols and cirrus (Inoue et al., 2016; Hu et al., 2016; Lorente et al., 2021; Oshio et al., 2020). These factors can modify the effective light path and vary seasonally with vegetation, humidity, cloud conditions, and solar geometry. Operational bias correction shifted the median bias toward zero but still exhibited larger seasonal dispersion than the ML-based correction. The ML-based correction maintained seasonal medians near zero and reduced both the IQRs and non-outlier spread, with most IQRs remaining within ± 8 ppb, indicating more stable performance under seasonal variability.
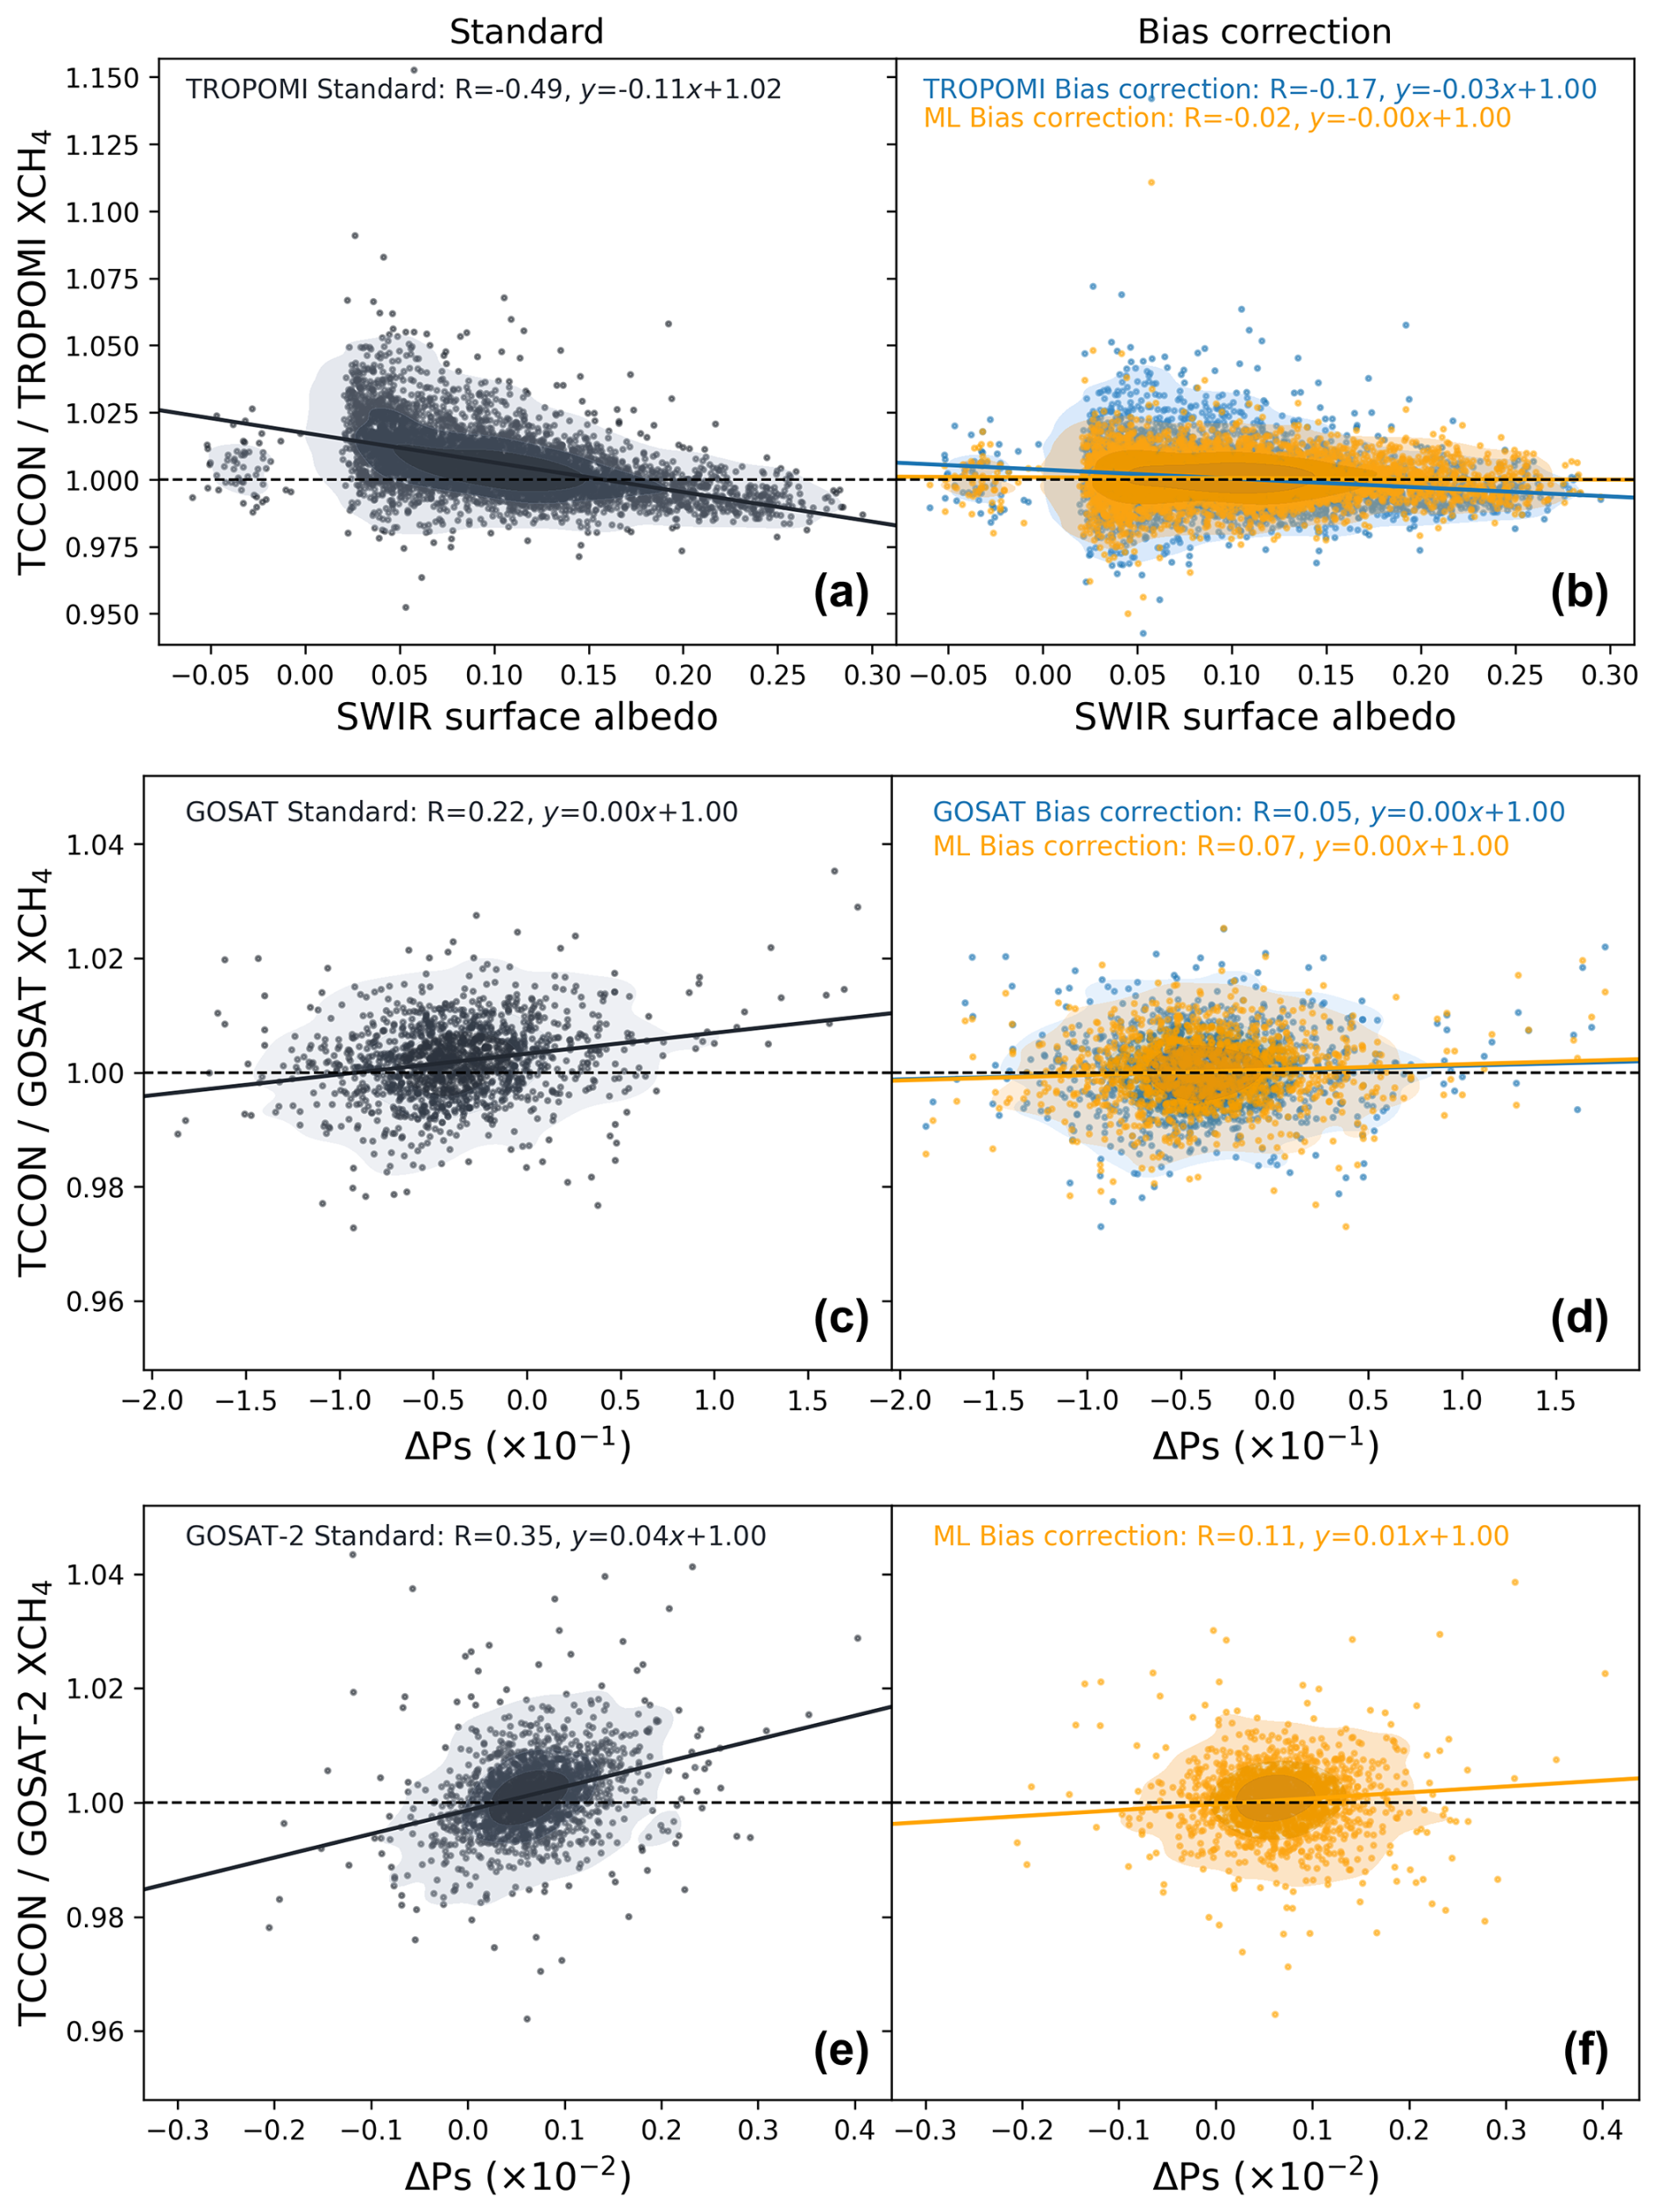
Figure 6Dependence of XCH4 ratios () on key retrieval variables and its reduction after bias correction. (a, b) () XCH4 ratio as a function of SWIR surface albedo for the standard product (a) and after bias correction (b). (c–f) Same as (a), (b) but for GOSAT and GOSAT-2 as a function of surface pressure difference (ΔPs): standard product in (c), (e) and bias-corrected results in (d), (f). Solid lines denote the fitted least-squares regressions, and the dashed horizontal line indicates the unbiased reference level (ratio = 1). The Pearson correlation coefficient (R) and regression equation are reported in each panel.
Figure 6 further illustrates condition-dependent biases by relating the XCH4 ratio () to key retrieval variables. For TROPOMI, the standard product shows a strong negative dependence on SWIR surface albedo (R = −0.49; Fig. 6a), consistent with known sensitivity to scattering-related light-path errors under low-albedo conditions (Lorente et al., 2021; Balasus et al., 2023; Li et al., 2024). Bias correction substantially reduces this dependence (Fig. 6b), yielding near-zero correlation (R = −0.02) and indicating that albedo-driven bias is largely mitigated. For the GOSAT series, operational bias correction is implemented as a multiple linear regression using explanatory variables (e.g., ΔPs, XH2O, airmass, and ΔT) (Inoue et al., 2016; Yoshida et al., 2023). Consistently, ΔPs dependence is weak for GOSAT (R=0.22; Fig. 6c) and more evident for GOSAT-2 (R=0.35; Fig. 6e) in the standard products, and it is reduced after correction (Fig. 6d and f). Overall, the ML-based correction reduces not only mean bias but also bias sensitivity to key retrieval conditions across sensors.
4.2 Inter-satellite harmonization
Multi-sensor fusion requires minimizing inter-sensor inconsistencies by defining a common reference scale. Table 4 compares the ML-based bias-corrected products from all three sensors evaluated against TCCON using common collocated samples under LOSOCV, ensuring that the reference selection is based on independent out-of-site performance. GOSAT-2 achieved the highest accuracy (R2 = 0.67; RMSE = 10.67 ppb) and was therefore selected as harmonization reference.
Table 4Accuracy comparison of machine learning (ML) based bias-corrected XCH4 from three satellite sensors (TROPOMI, GOSAT, GOSAT-2), evaluated against TCCON using common collocated samples (N=309) under leave-one-site-out cross-validation. Boldface indicates the satellite with the best performance for each error metric.
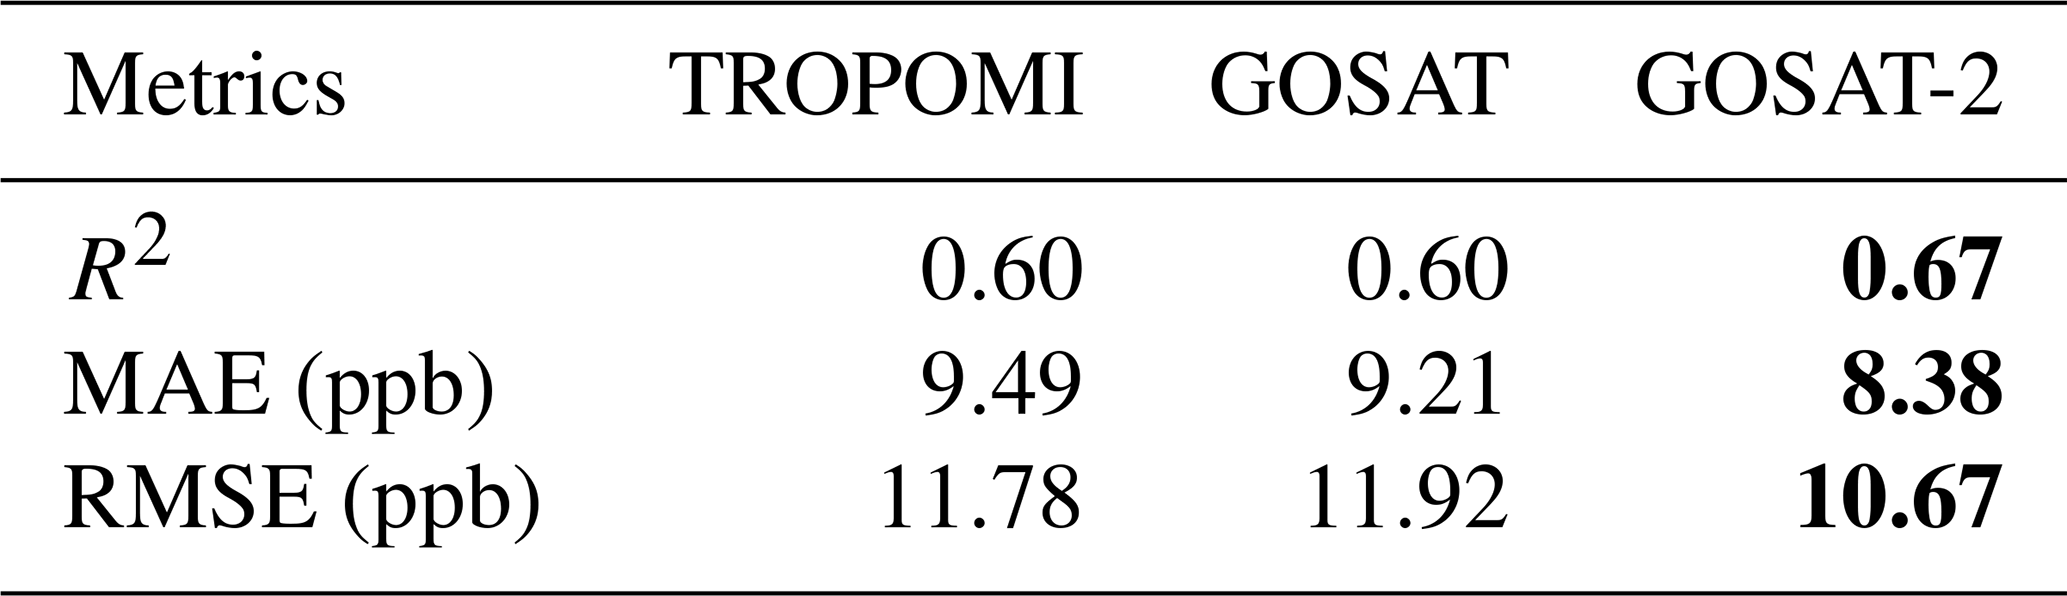
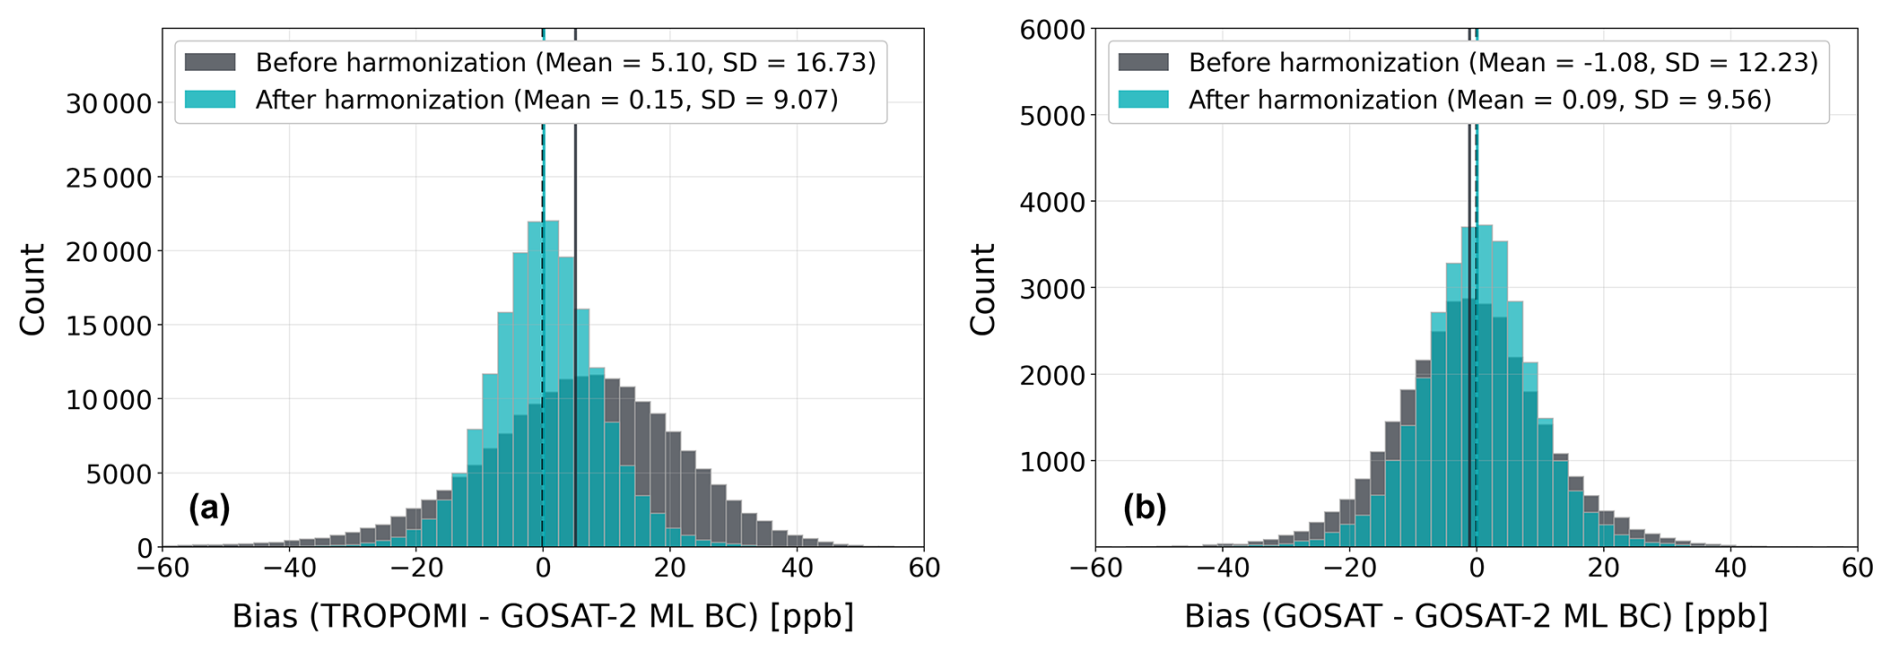
Figure 7Inter-satellite harmonization to the ML bias-corrected GOSAT-2 ML BC scale. Distributions of XCH4 bias relative to the ML-based bias-corrected GOSAT-2 product (a: TROPOMI − GOSAT-2; b: GOSAT − GOSAT-2) before and after cross-satellite harmonization. Solid vertical lines denote the mean bias for each distribution, and the legend reports the corresponding mean and standard deviation (SD).
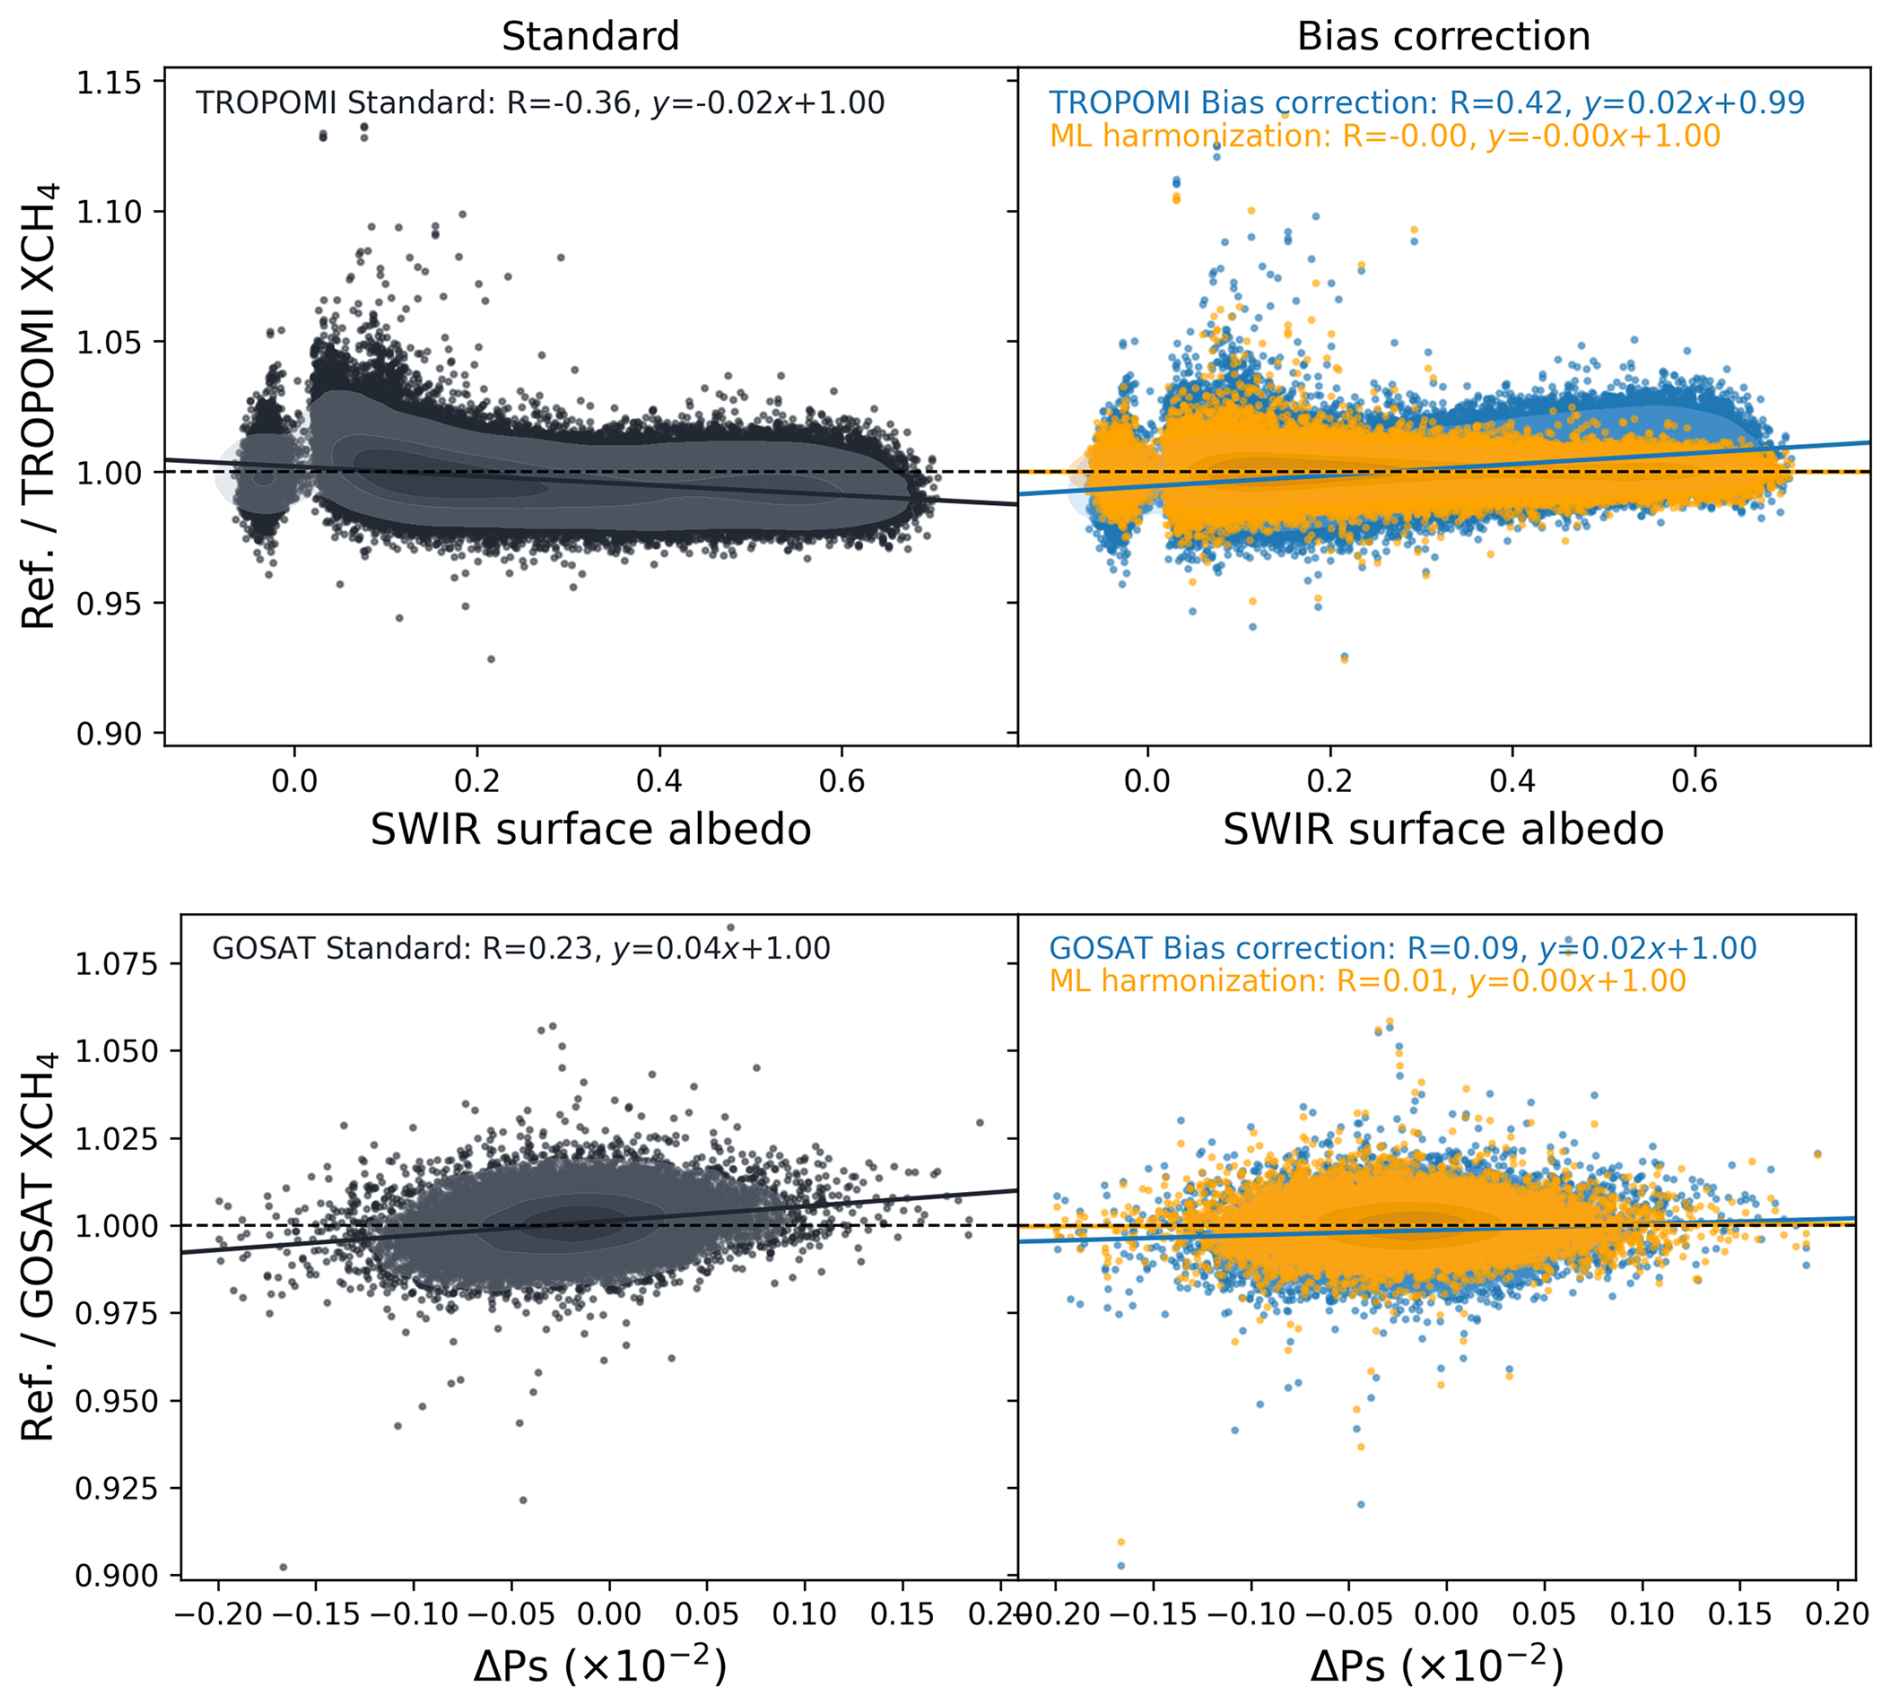
Figure 8Retrieval-parameter dependency of harmonized XCH4 relative to the final target. Scatter density plots show the ratio of the final target (i.e.,ML-based bias-corrected GOSAT-2 XCH4) to satellite XCH4, as a function of key retrieval parameters using satellite co-location samples. The upper panels show the dependency of TROPOMI XCH4 on SWIR surface albedo, and the lower panels show the dependency of GOSAT XCH4 on the surface pressure difference, ΔPs. For each sensor, the left panels show the standard products, while the right panels compare the operational bias-corrected products and the ML-based harmonized results.
To improve cross-sensor consistency, the GOSAT and TROPOMI products were calibrated to the ML-based bias-corrected GOSAT-2 scale (i.e., generating “GOSAT-2-like” XCH4). Across the evaluated algorithms, XGBoost yielded the best harmonization performance (Table S6). Figure 7 shows distributional shifts before and after harmonization: after harmonization, bias distributions for GOSAT and TROPOMI moved toward near-zero mean bias relative to GOSAT-2 and their spread was reduced. This inter-sensor harmonization further assessed the major retrieval-parameter dependencies identified in the TCCON-based analysis over broader parameter ranges (Fig. 8). After ML-based harmonization, the SWIR surface albedo dependency of TROPOMI and the ΔPs dependency of GOSAT were nearly removed, indicating improved consistency with the ML-based bias-corrected GOSAT-2 scale.
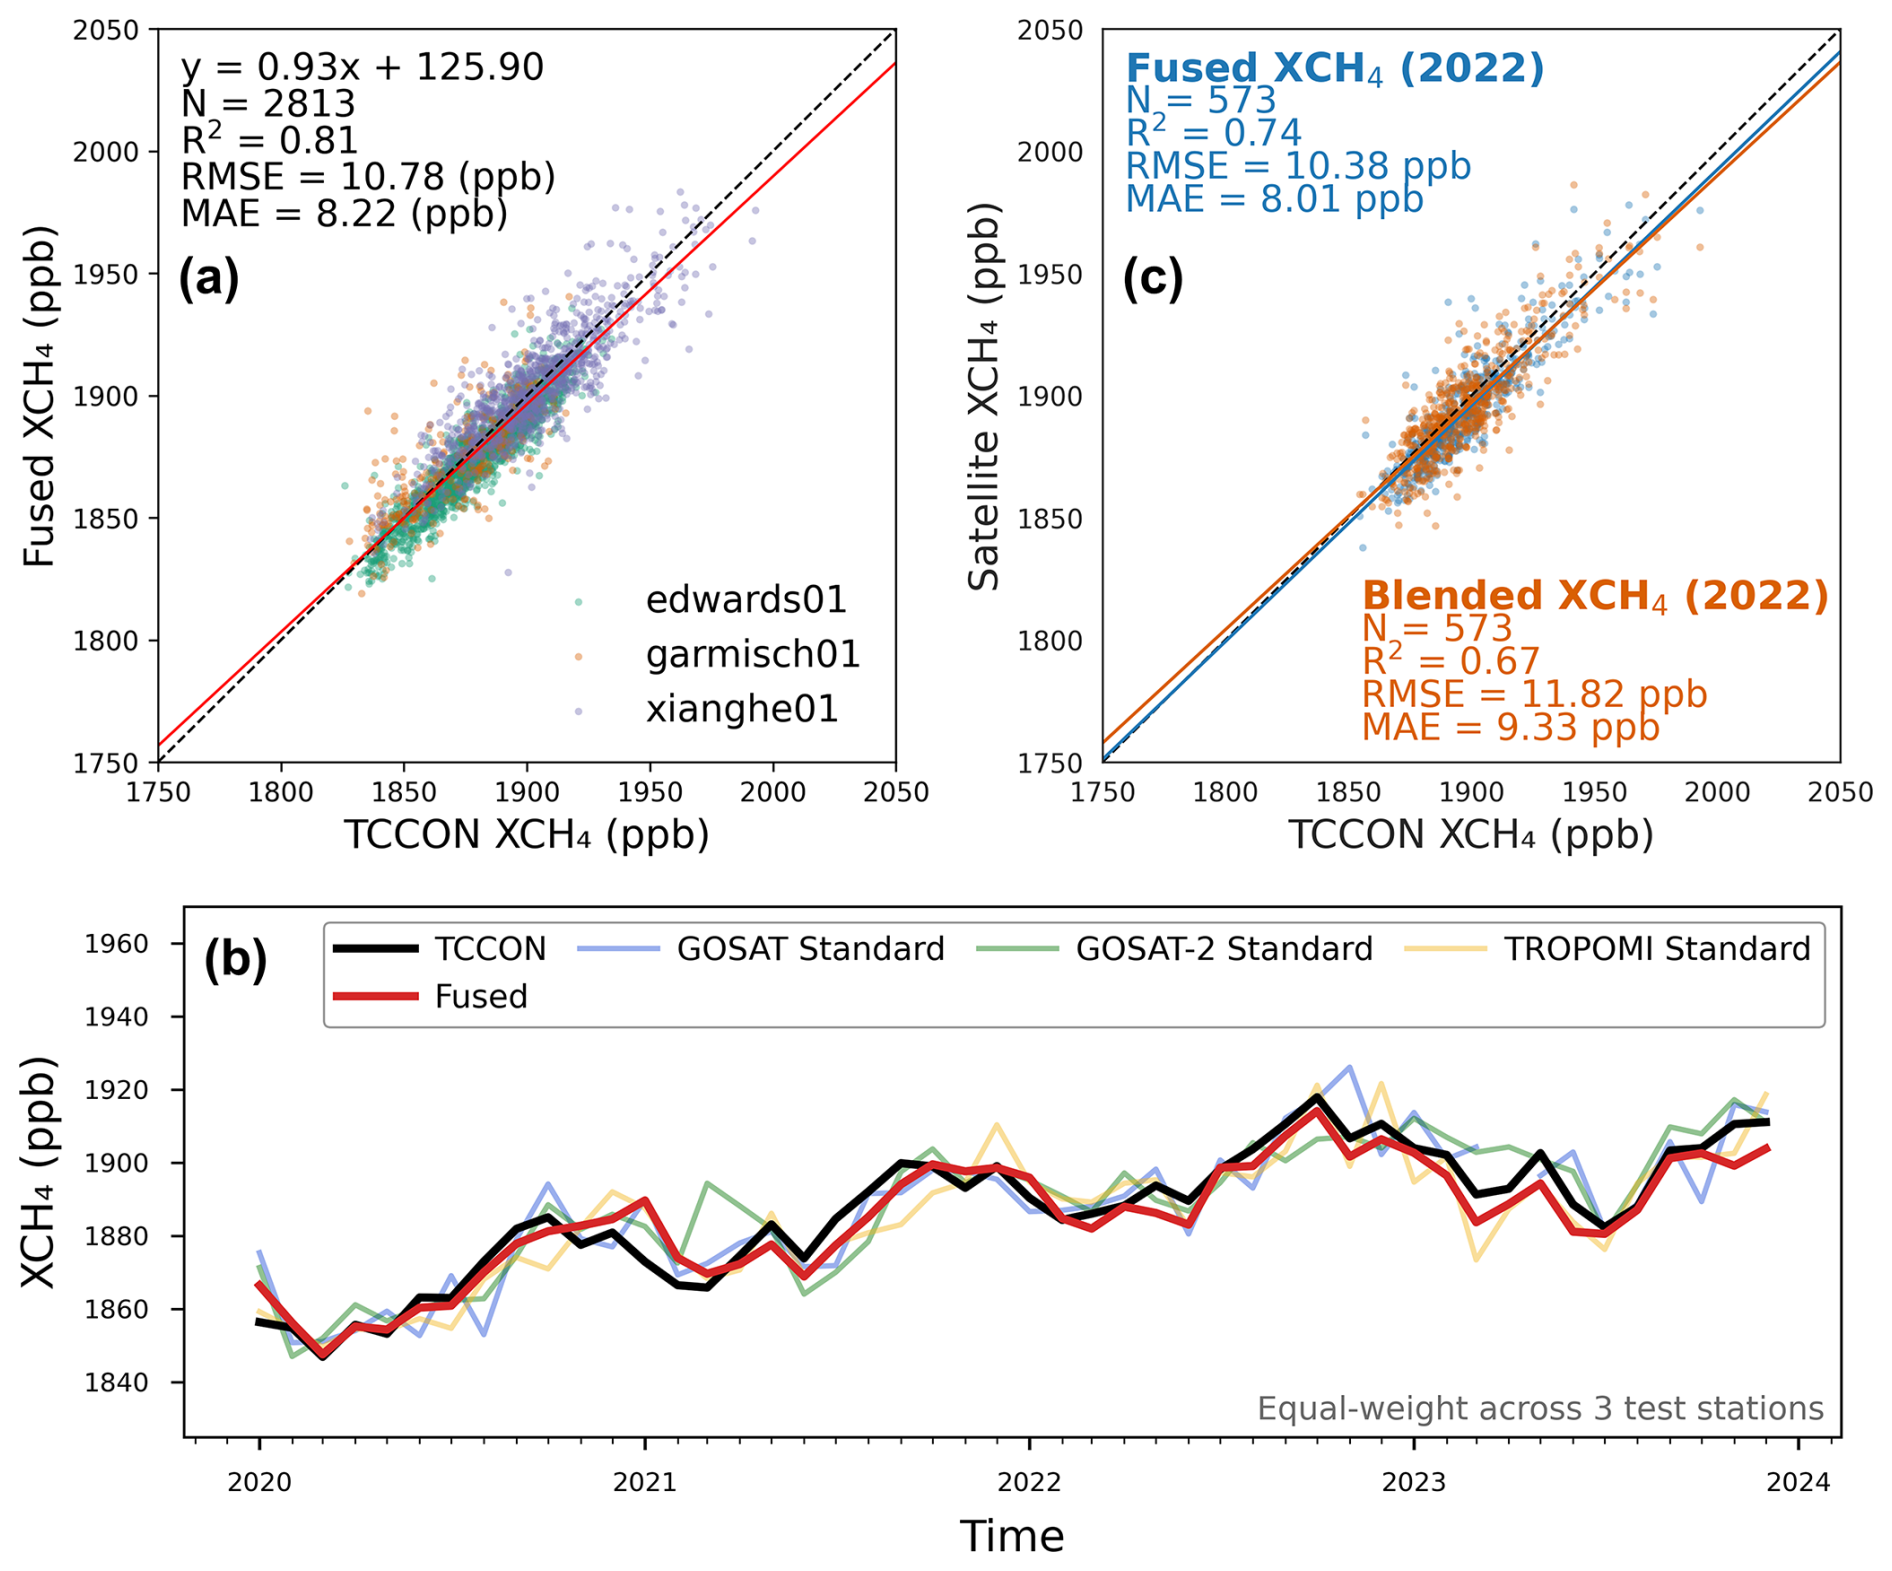
Figure 9Independent validation of the Fused XCH4 at three TCCON test stations and comparison with a Blended product (Balasus et al., 2023). (a) Scatter plot of Fused XCH4 versus TCCON XCH4 at three independent sites (Xianghe01, Edwards01, and Garmisch01); colors indicate individual stations. The red line denotes the fitted regression. (b) Time series of station-mean XCH4 averaged across the three test stations (equal-weight mean), comparing TCCON, Fused, and the standard products from GOSAT, GOSAT-2, and TROPOMI. (c) Comparison against TCCON for 2022 at the same test stations, contrasting the Fused XCH4 (blue) with the Blended XCH4 product based on TROPOMI and GOSAT (orange). The solid-colored lines denote fitted regressions, respectively.
After harmonization, TROPOMI exhibited slightly higher agreement with GOSAT-2 (Table S6) than GOSAT and provided approximately 6 times more collocated observations (183 550 for TROPOMI vs. 32 244 for GOSAT). Accordingly, the fusion priority was set to GOSAT-2 → TROPOMI → GOSAT to balance reference consistency and sampling density and to enhance robustness of the Fused XCH4 product. Finally, we generated a daily 0.1° Fused XCH4 product by integrating the harmonized observations from the three satellites.
Figure 9 evaluates the Fused XCH4 product at three independent TCCON sites (xianghe01, edwards01, and garmisch01) and includes a comparison with the Blended TROPOMI + GOSAT XCH4 product of Balasus et al. (2023). These sites were excluded from the TCCON-based bias correction in Step 1 to assess generalization under independent conditions. The three stations represent distinct environments: a peri-urban site influenced by strong anthropogenic emissions (Xianghe, China; mean = 1903.16 ppb), an arid high-desert site with high surface albedo (Edwards, USA; mean = 1880.37 ppb), and a mountainous site (Garmisch, Germany; mean = 1872.98 ppb). Across all sites, the Fused XCH4 showed strong agreement with TCCON (R2 = 0.81, RMSE = 10.78 ppb; Fig. 9a). The time series further indicates that the Fused product reproduces temporal variability, while reducing inter-sensor offsets relative to the individual satellite products (Fig. 9b). For 2022, the Fused product achieved higher accuracy than the Blended XCH4 product at the same locations, (R2 = 0.74, RMSE = 10.38 ppb vs. R2 = 0.67, RMSE = 11.82 ppb; Fig. 9c), which may reflect the use of a harmonized multi-sensor framework that incorporates the higher-accuracy GOSAT-2 product.
4.3 Coverage improvements from multi-satellite fusion
The Fused XCH4 product achieved annual global land coverage of 87.1 %, 86.9 %, 86.8 %, and 88.1 % for 2020–2023, corresponding to improvements of 0.45–0.74 percentage points over TROPOMI alone (Fig. S5a). Although global annual averages show modest gains, multi-sensor fusion yields substantial regional enhancements where individual sensors face systematic retrieval limitations.
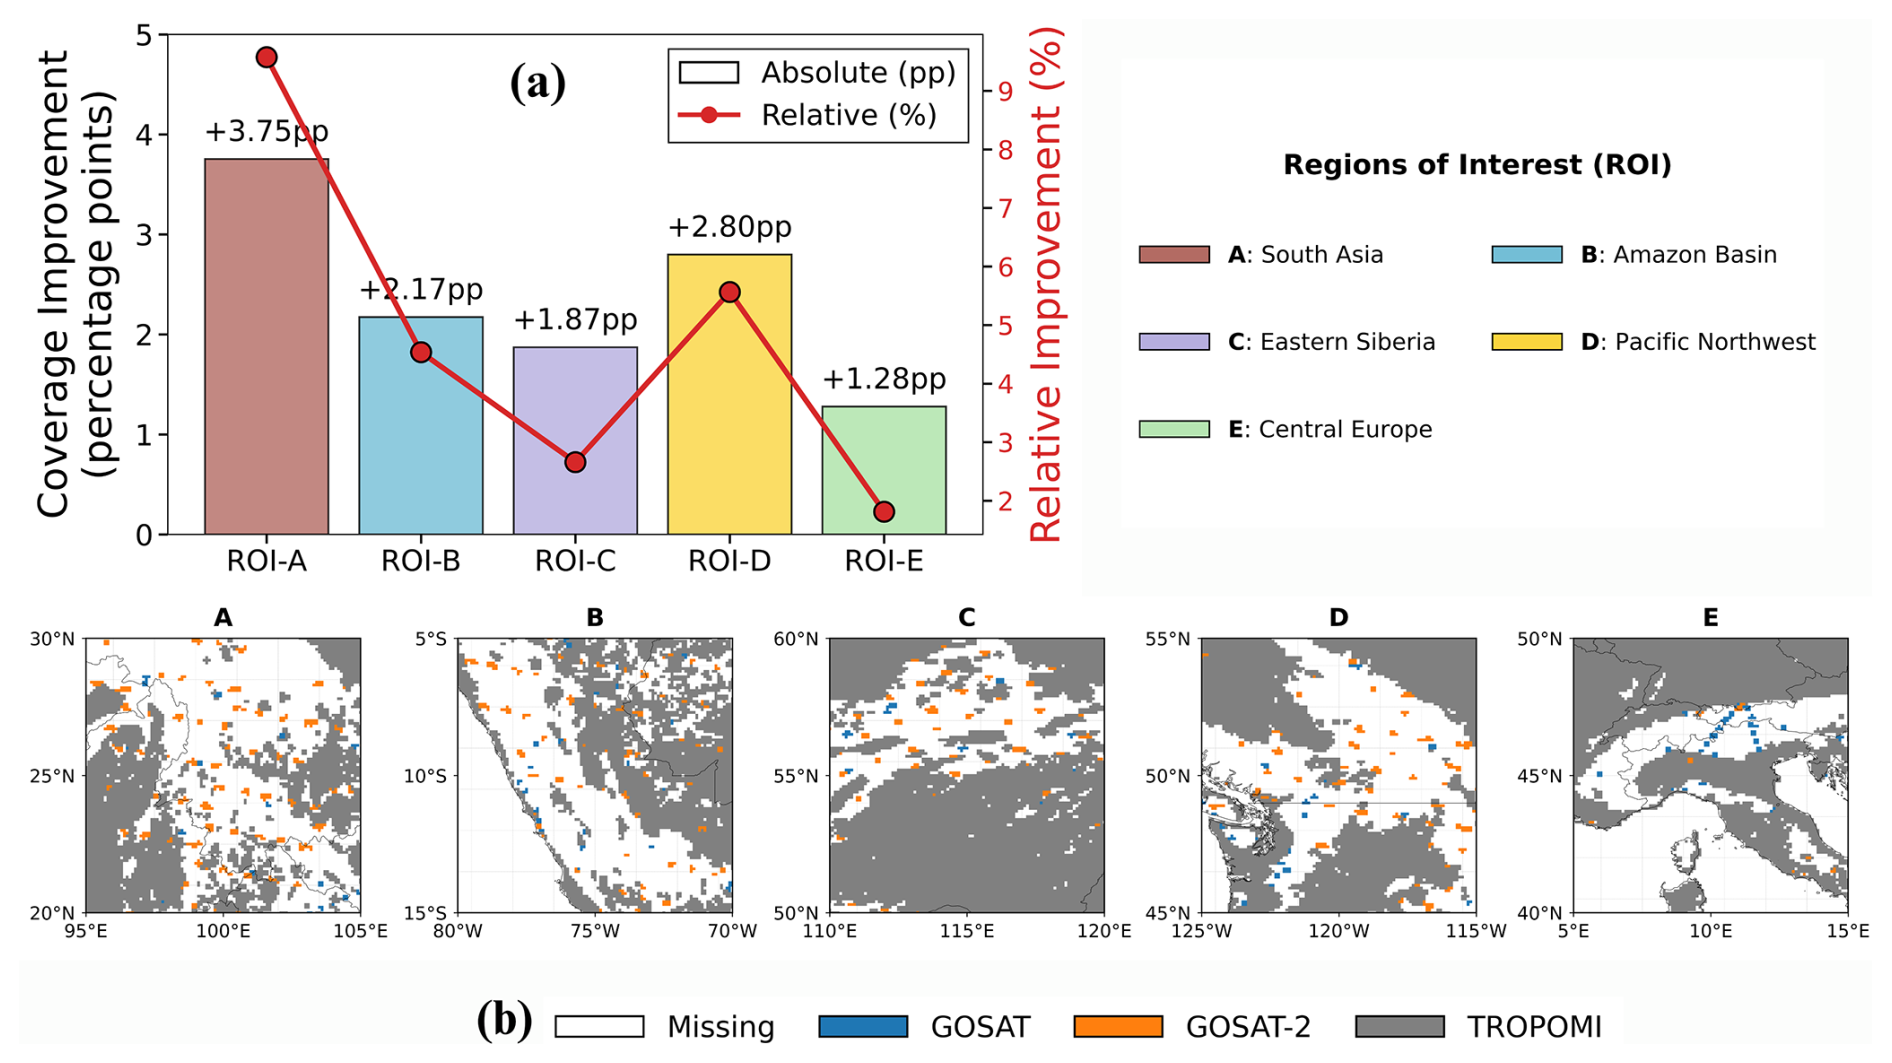
Figure 10Regional assessment of multi-sensor XCH4 fusion benefits in 2023 across five regions representing distinct retrieval challenges. (a) Coverage enhancement relative to TROPOMI showing absolute gain in percentage points (bars, left axis) and relative improvement (line, right axis). (b) Annually dominant sensor per pixel based on valid retrieval frequency in 2023 for each ROI (GOSAT: blue, GOSAT-2: orange, TROPOMI: grey, missing data: white). Orange and blue pixels indicate locations where TROPOMI data are unavailable but coverage is provided by GOSAT-2 or GOSAT.
To quantify fusion benefits under challenging retrieval conditions for TROPOMI, we examined five case-study regions (ROIs; see Fig. 1) in 2023 representing diverse environments and emission regimes: South Asia (ROI-A) and the Amazon Basin (ROI-B) as cloudy tropical regions with aerosol impacts; Eastern Siberia (ROI-C) as high-latitude wetlands with seasonal snow/ice constraints; the Pacific Northwest (ROI-D) as complex coastal terrain; and Central Europe (ROI-E) as Alpine topography (Fig. 10). Compared with TROPOMI, coverage improvements ranged from ∼ 1.8 % to ∼ 9.6 %, with the largest gain in South Asia (Fig. 10a). Source attribution maps illustrate how the GOSAT series spatially complements TROPOMI coverage in 2023 (Fig. 10b): GOSAT-2 provides the majority of additional observations, particularly filling monsoon-related gaps in South Asia and cloudy tropical regions, while GOSAT supplements coverage over Alpine terrain, where complex topography challenges both TROPOMI and GOSAT-2 retrievals.
Fusion also improves temporal resilience during periods of single-mission data loss. Missing VIIRS cloud-screening information in July–August 2022 and August 2023 (Borsdorff et al., 2024) led to substantial gaps in TROPOMI XCH4, which were partially filled by overlapping GOSAT and GOSAT-2 observations (Fig. S5b). This multi-sensor complementarity highlights the importance of global-scale fusion for comprehensive CH4 monitoring.
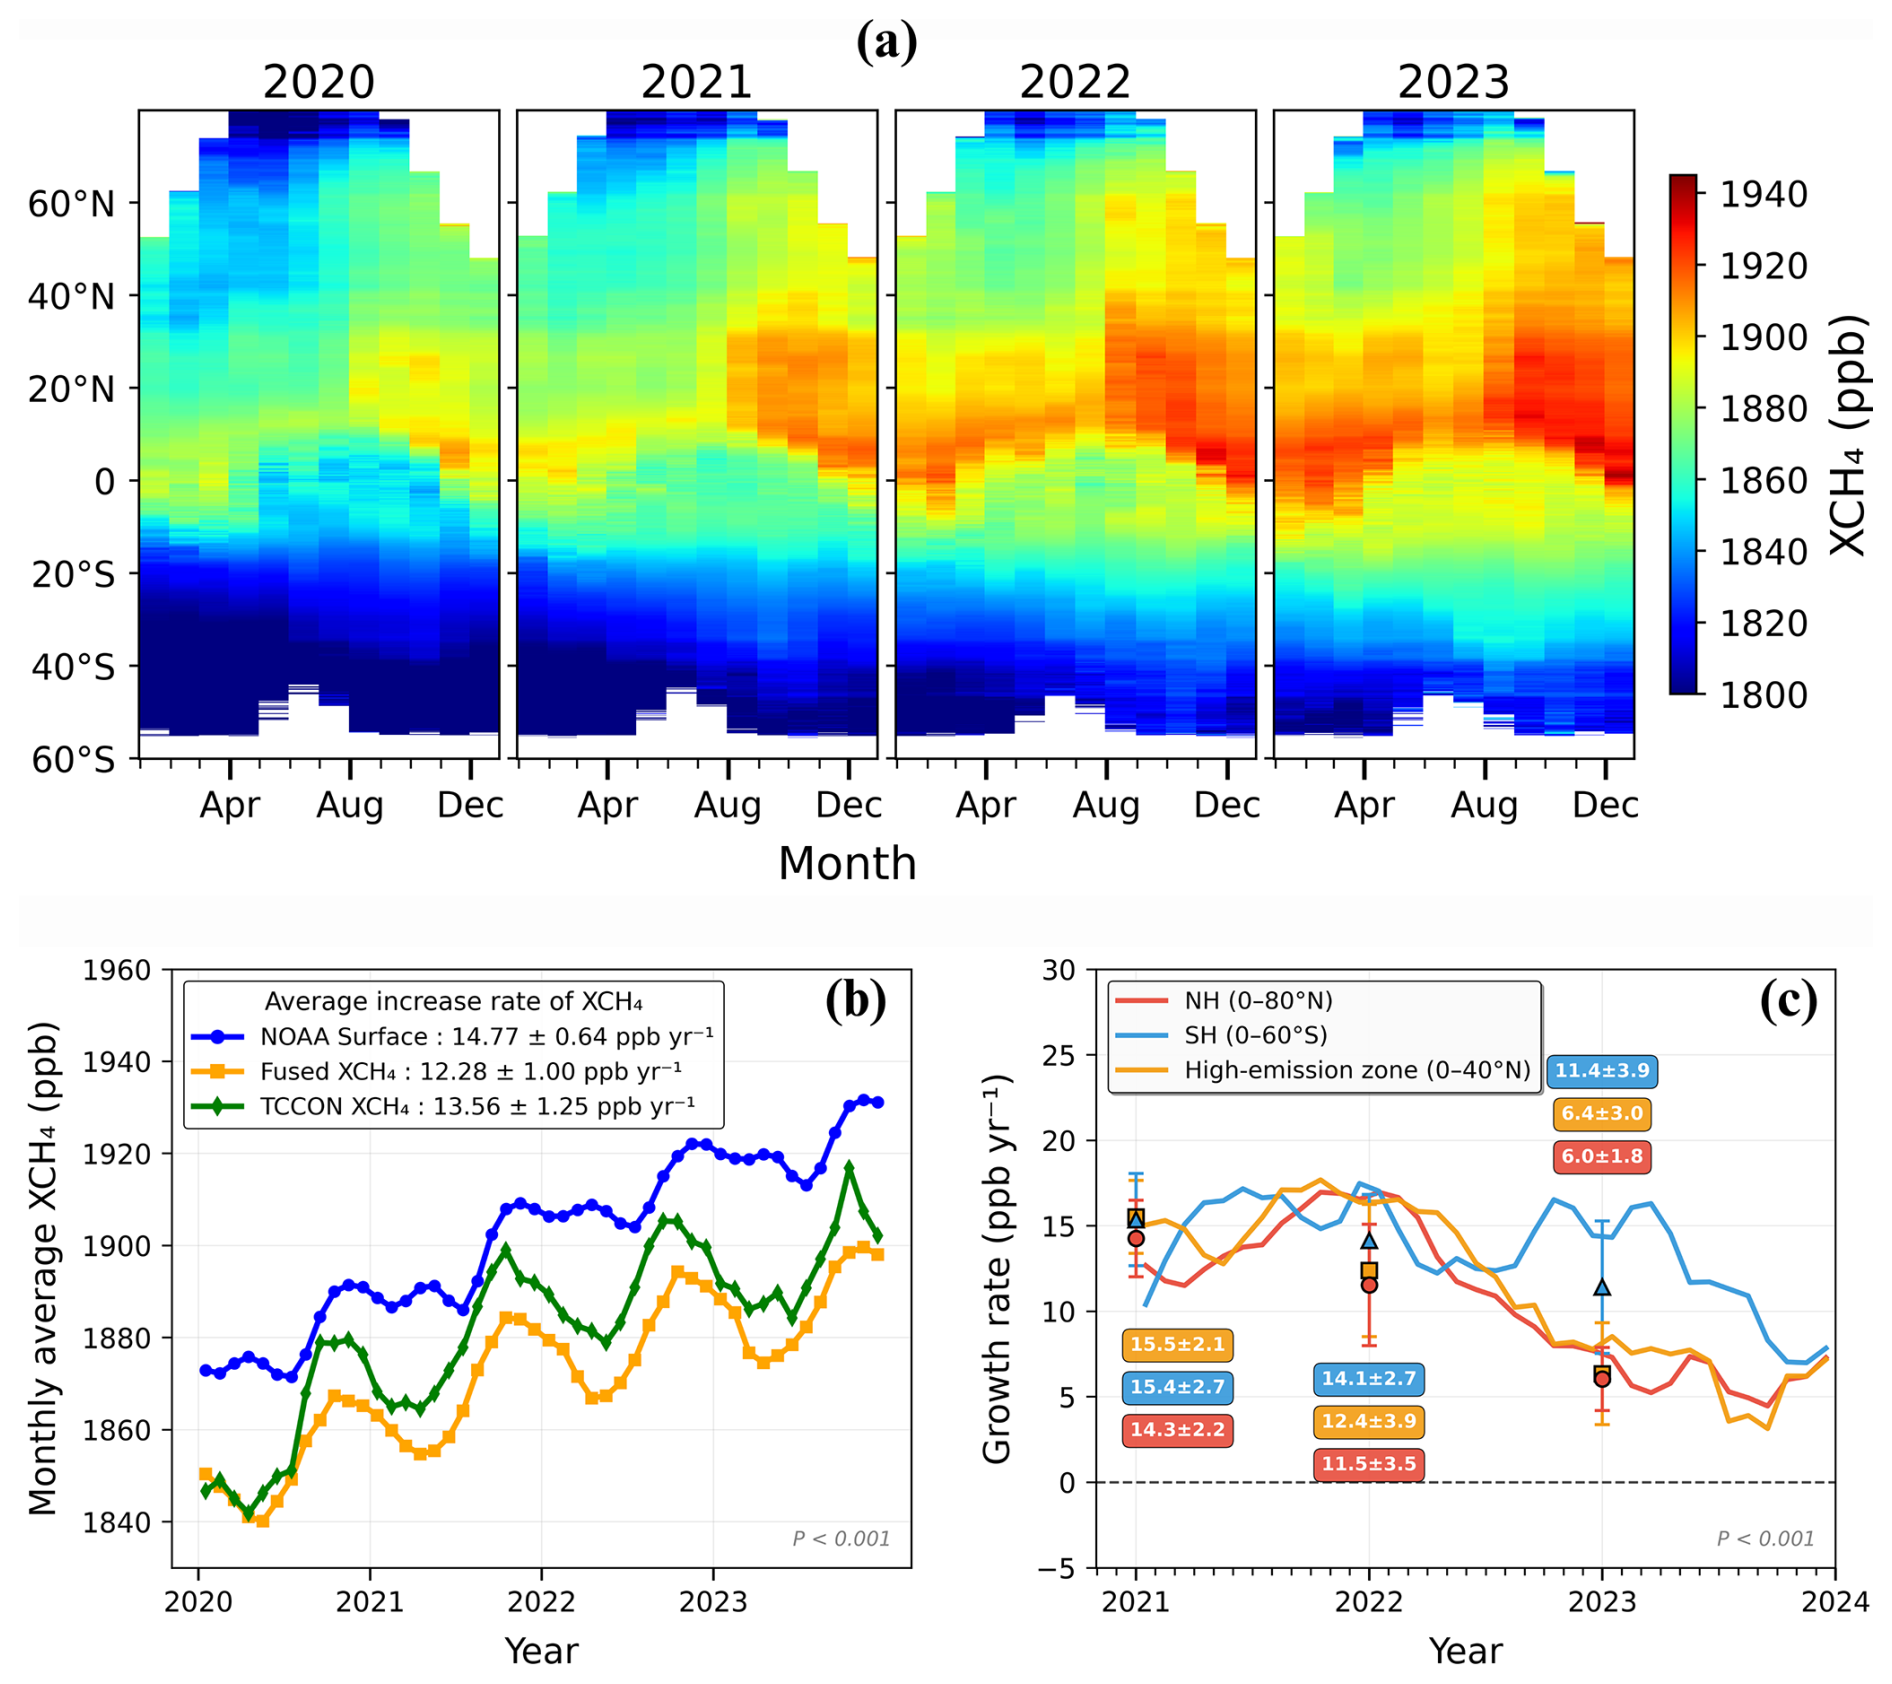
Figure 11Spatiotemporal characteristics and growth of Fused XCH4 during 2020–2023. (a) Monthly latitudinal distribution of Fused XCH4 concentrations at 0.1° spatial resolution from 2020 to 2023. (b) Comparison of monthly global mean methane time series from the Fused XCH4 product (orange), NOAA marine surface CH4 measurements (blue), and TCCON ground-based XCH4 observations (green). Values in the legend indicate mean annual growth rates over 2020–2023 with associated uncertainties. (c) Monthly hemispheric year-over-year differences (solid lines) and annual mean growth rates (markers) for the Northern Hemisphere (NH; 0–80° N, red), Southern Hemisphere (SH; 0–60° S, blue), and high-emission zone (0–40° N, orange). Error bars represent the standard deviation of monthly growth rates within each year. All trends shown in panels (b) and (c) were statistically significant (p < 0.001).
4.4 Global XCH4 mapping and spatiotemporal analysis
The Fused dataset reveals distinct spatiotemporal patterns across 2020–2023. Time–latitude diagrams (Fig. 11a) show a persistent interhemispheric gradient of 30–40 ppb between the Northern Hemisphere (NH) and Southern Hemisphere (SH). Elevated XCH4 is consistently observed in the northern subtropical belt (0–40° N), where mean concentrations increased from 1872.72 ppb to 1906.98 ppb over the study period (+34.26 ppb), exceeding the global mean increase. While the highest concentrations remained in the north, the Fused product captured a progressive southward expansion in XCH4 increases beginning in 2021, consistent with recent findings (Umezawa et al., 2025).
To quantify global growth rates, we compared the monthly global average of the Fused XCH4 dataset with independent observations from TCCON ground-based XCH4 measurements and NOAA marine surface CH4 records (https://gml.noaa.gov/ccgg/trends_ch4/, last access: 26 December 2025). Mean annual growth rates were calculated from the monthly time series over 2020–2023, while uncertainties represent the variability of monthly growth rates within each year. The Fused product captures a sustained increase from approximately 1850 ppb in early 2020 to nearly 1900 ppb by late 2023, corresponding to a mean global growth rate of 12.28 ± 1.00 ppb yr−1 (Fig. 11b). This agrees well with TCCON (13.56 ± 1.25 ppb yr−1) and NOAA (14.77 ± 0.64 ppb yr−1), supporting the ability of the Fused dataset to represent large-scale atmospheric CH4 variability and interannual trends.
Interannual growth rates exhibited strong regional variability (Fig. 11c). The NH (0–80° N), SH (60° S–0), and the high-emission zone (0–40° N) all peaked in 2021 at 14.3 ± 2.2, 15.4 ± 2.7, and 15.5 ± 2.1 ppb yr−1, respectively, consistent with record global XCH4 increases reported for that period (Saunois et al., 2025). Following this peak, growth rates generally declined during 2022–2023, reaching approximately 6.0 ± 1.8 ppb yr−1 in the NH, 11.4 ± 3.9 ppb yr−1 in the SH, and 6.4 ± 3.0 ppb yr−1 in the high-emission zone by 2023, consistent with recent inverse modeling estimates (Pendergrass et al., 2025).
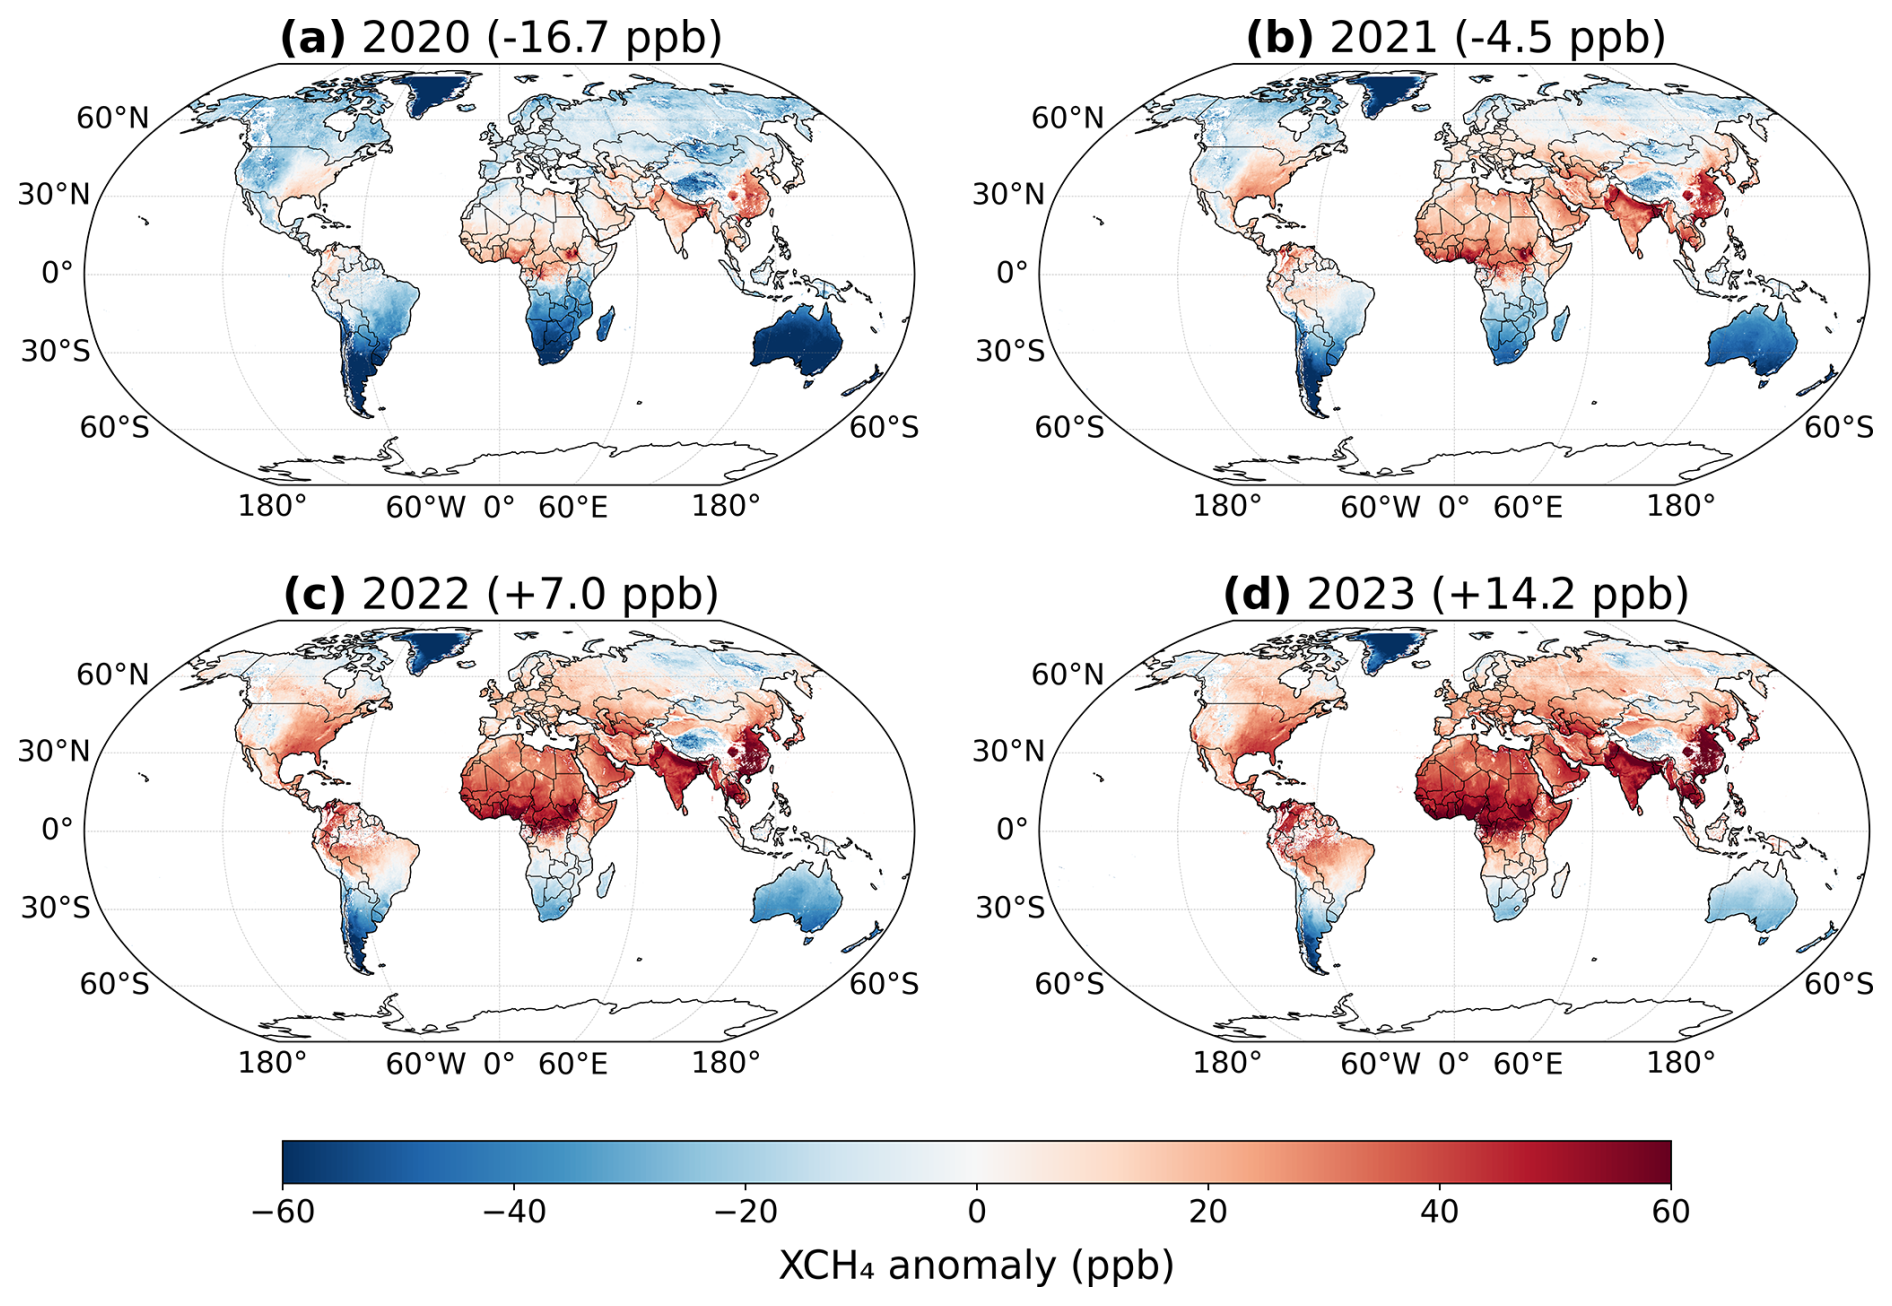
Figure 12Annual XCH4 anomaly maps for (a) 2020, (b) 2021, (c) 2022, and (d) 2023 relative to the four-year mean. Parentheses show global mean anomalies (ppb). Positive (red) and negative (blue) shading indicate regions with XCH4 above and below the four-year baseline, respectively.
To highlight emission hotspots relative to the global baseline, we computed annual anomalies by subtracting the 4-year mean (1869.95 ppb) from each year's XCH4 field (Fig. 12). By 2023, positive anomalies exceeding +60 ppb were apparent over South Asia, East Asia, and Central Africa, with maxima over the Indo-Gangetic Plain and the Ganges–Brahmaputra delta (Fig. 12d). The shift in global mean anomaly from −16.74 ppb (2020) to +14.16 ppb (2023) indicates increasing XCH4 accumulation over the study period.
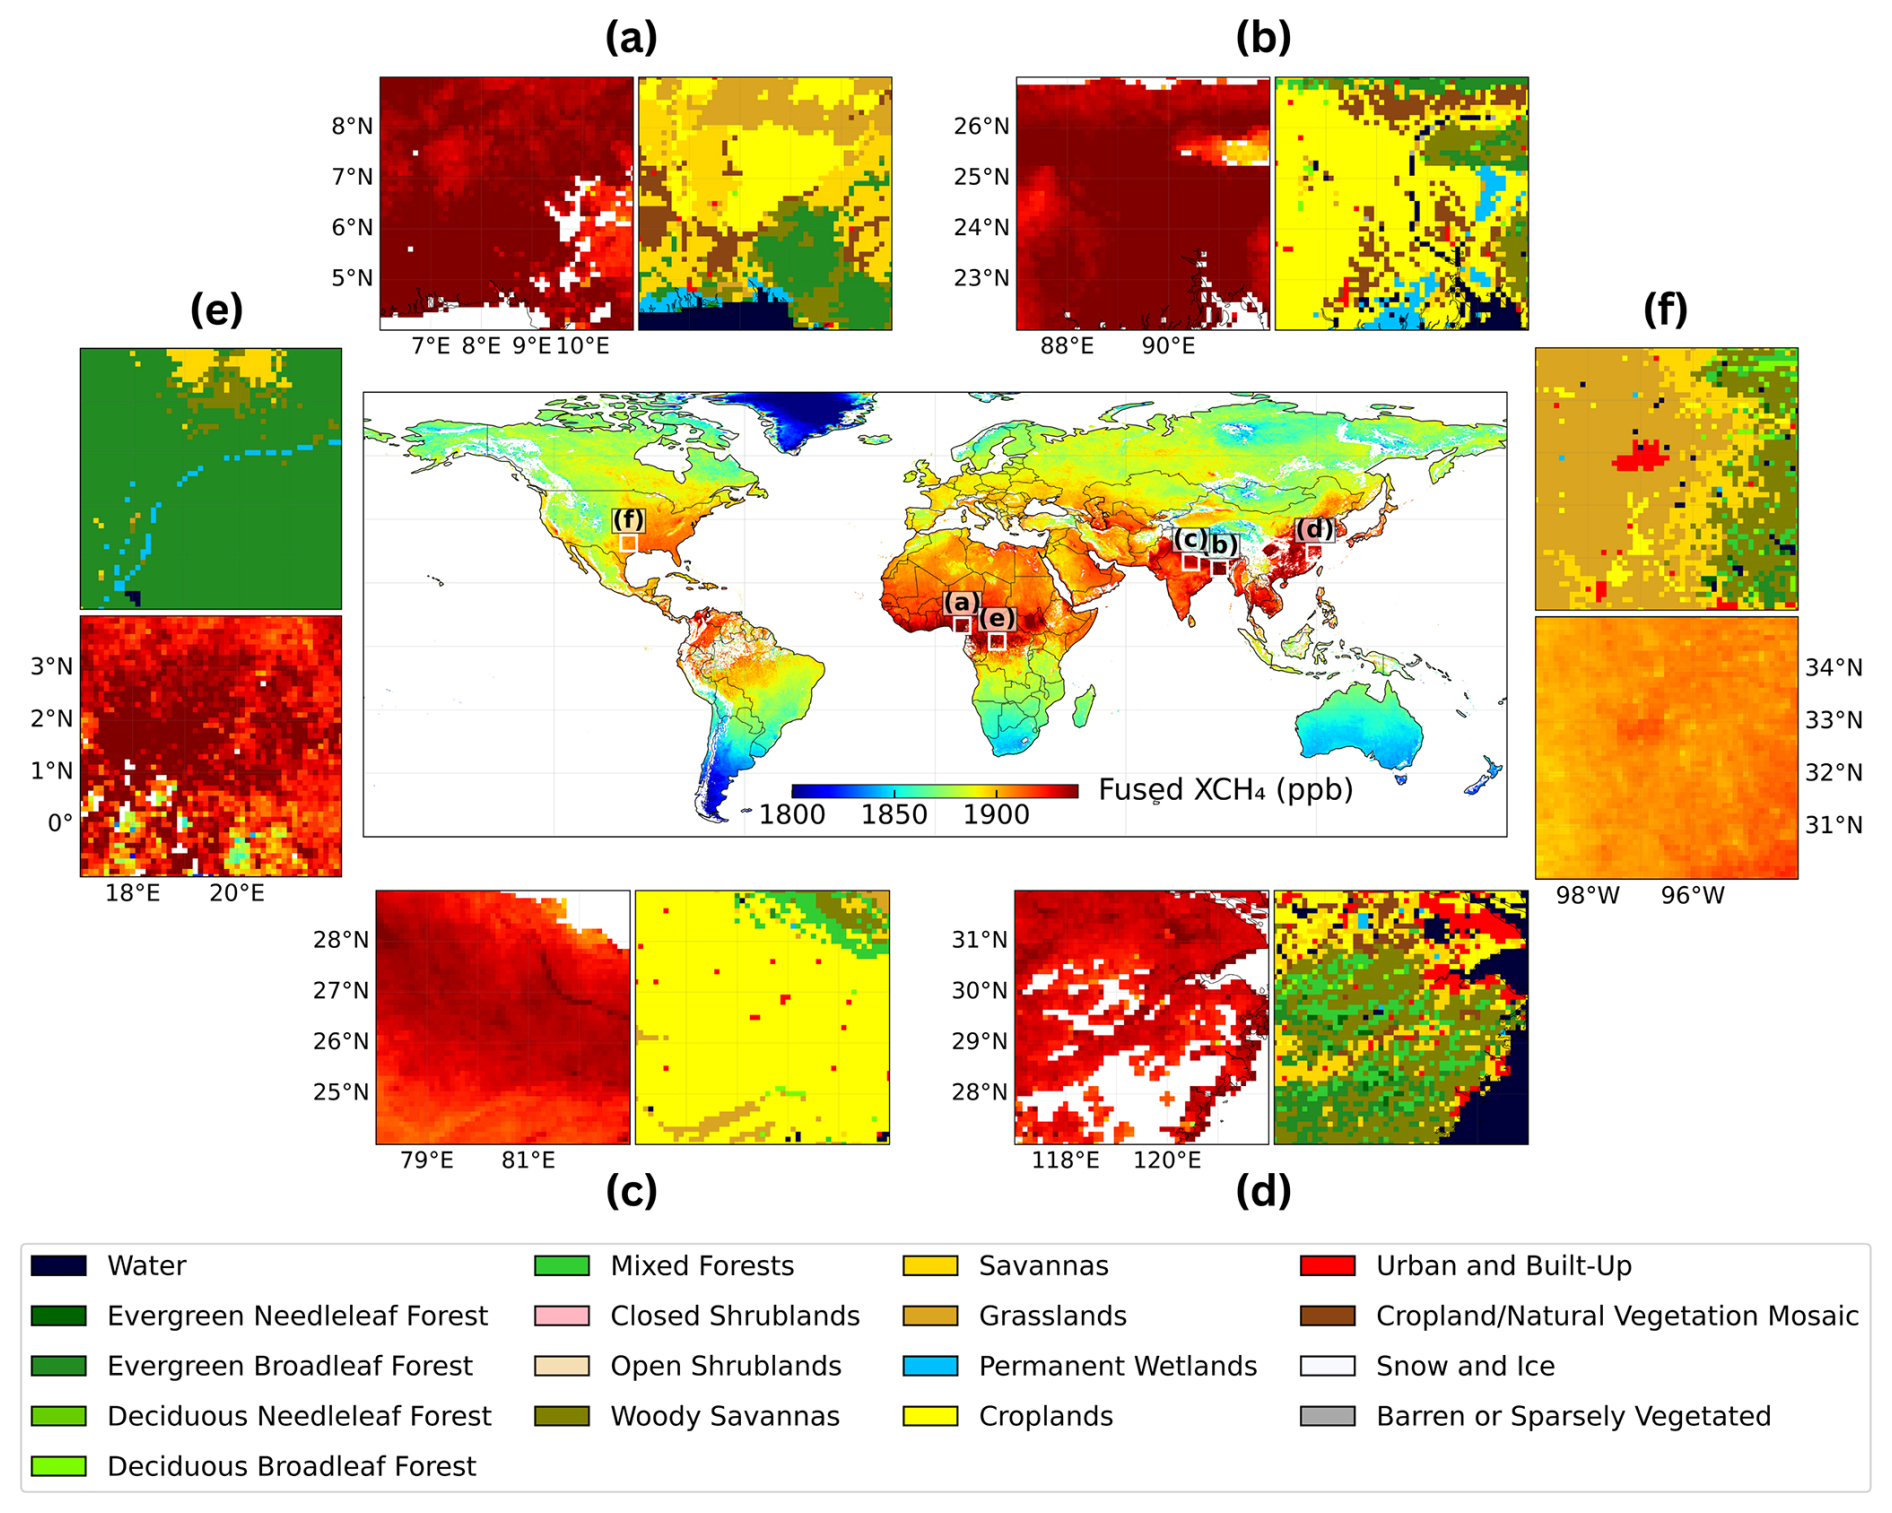
Figure 13Regional XCH4 emission hotspots and corresponding land-cover characteristics for 2023. The central map displays the global distribution of Fused XCH4 concentrations with six representative high-emission regions marked (a–f). Each regional panel pair shows XCH4 concentrations (left) and MODIS MCD12Q1 land-cover classifications (right) for the Niger Delta (a), Ganges–Brahmaputra Delta (b), Indo–Gangetic Plain (c), Yangtze River Delta (d), Congo Basin (e), and Barnett Shale region (f). Land-cover legend follows the MODIS MCD12Q1 LC_Type1 classification.
To interpret drivers of elevated concentrations, we examined high-anomaly regions in 2023 using MODIS MCD12Q1 land-cover information (Fig. 13). Hotspots showed distinct land-cover signatures: the Niger Delta (Fig. 13a) exhibited strong anomalies over a mix of croplands, evergreen broadleaf forests, coastal wetlands, and urban areas associated with petroleum infrastructure (Olukaejire et al., 2024); the Ganges–Brahmaputra Delta (Fig. 13b) showed the largest anomaly over rice paddies and permanent wetlands; the Indo-Gangetic Plain (Fig. 13c) and Yangtze River Delta (Fig. 13d) displayed persistent enhancements over irrigated croplands and expanding metropolitan areas; the Congo Basin (Fig. 13e) showed elevated concentrations over tropical peatlands and evergreen forests; and the southern United States (Fig. 13f) showed enhancements over the Barnett Shale region in Texas, consistent with documented oil-and-gas emissions (Harriss et al., 2015; Lan et al., 2015). The spatial correspondence between enhanced XCH4 and wetland/cropland/urban land classes demonstrates the Fused product's ability to resolve regional emission patterns.
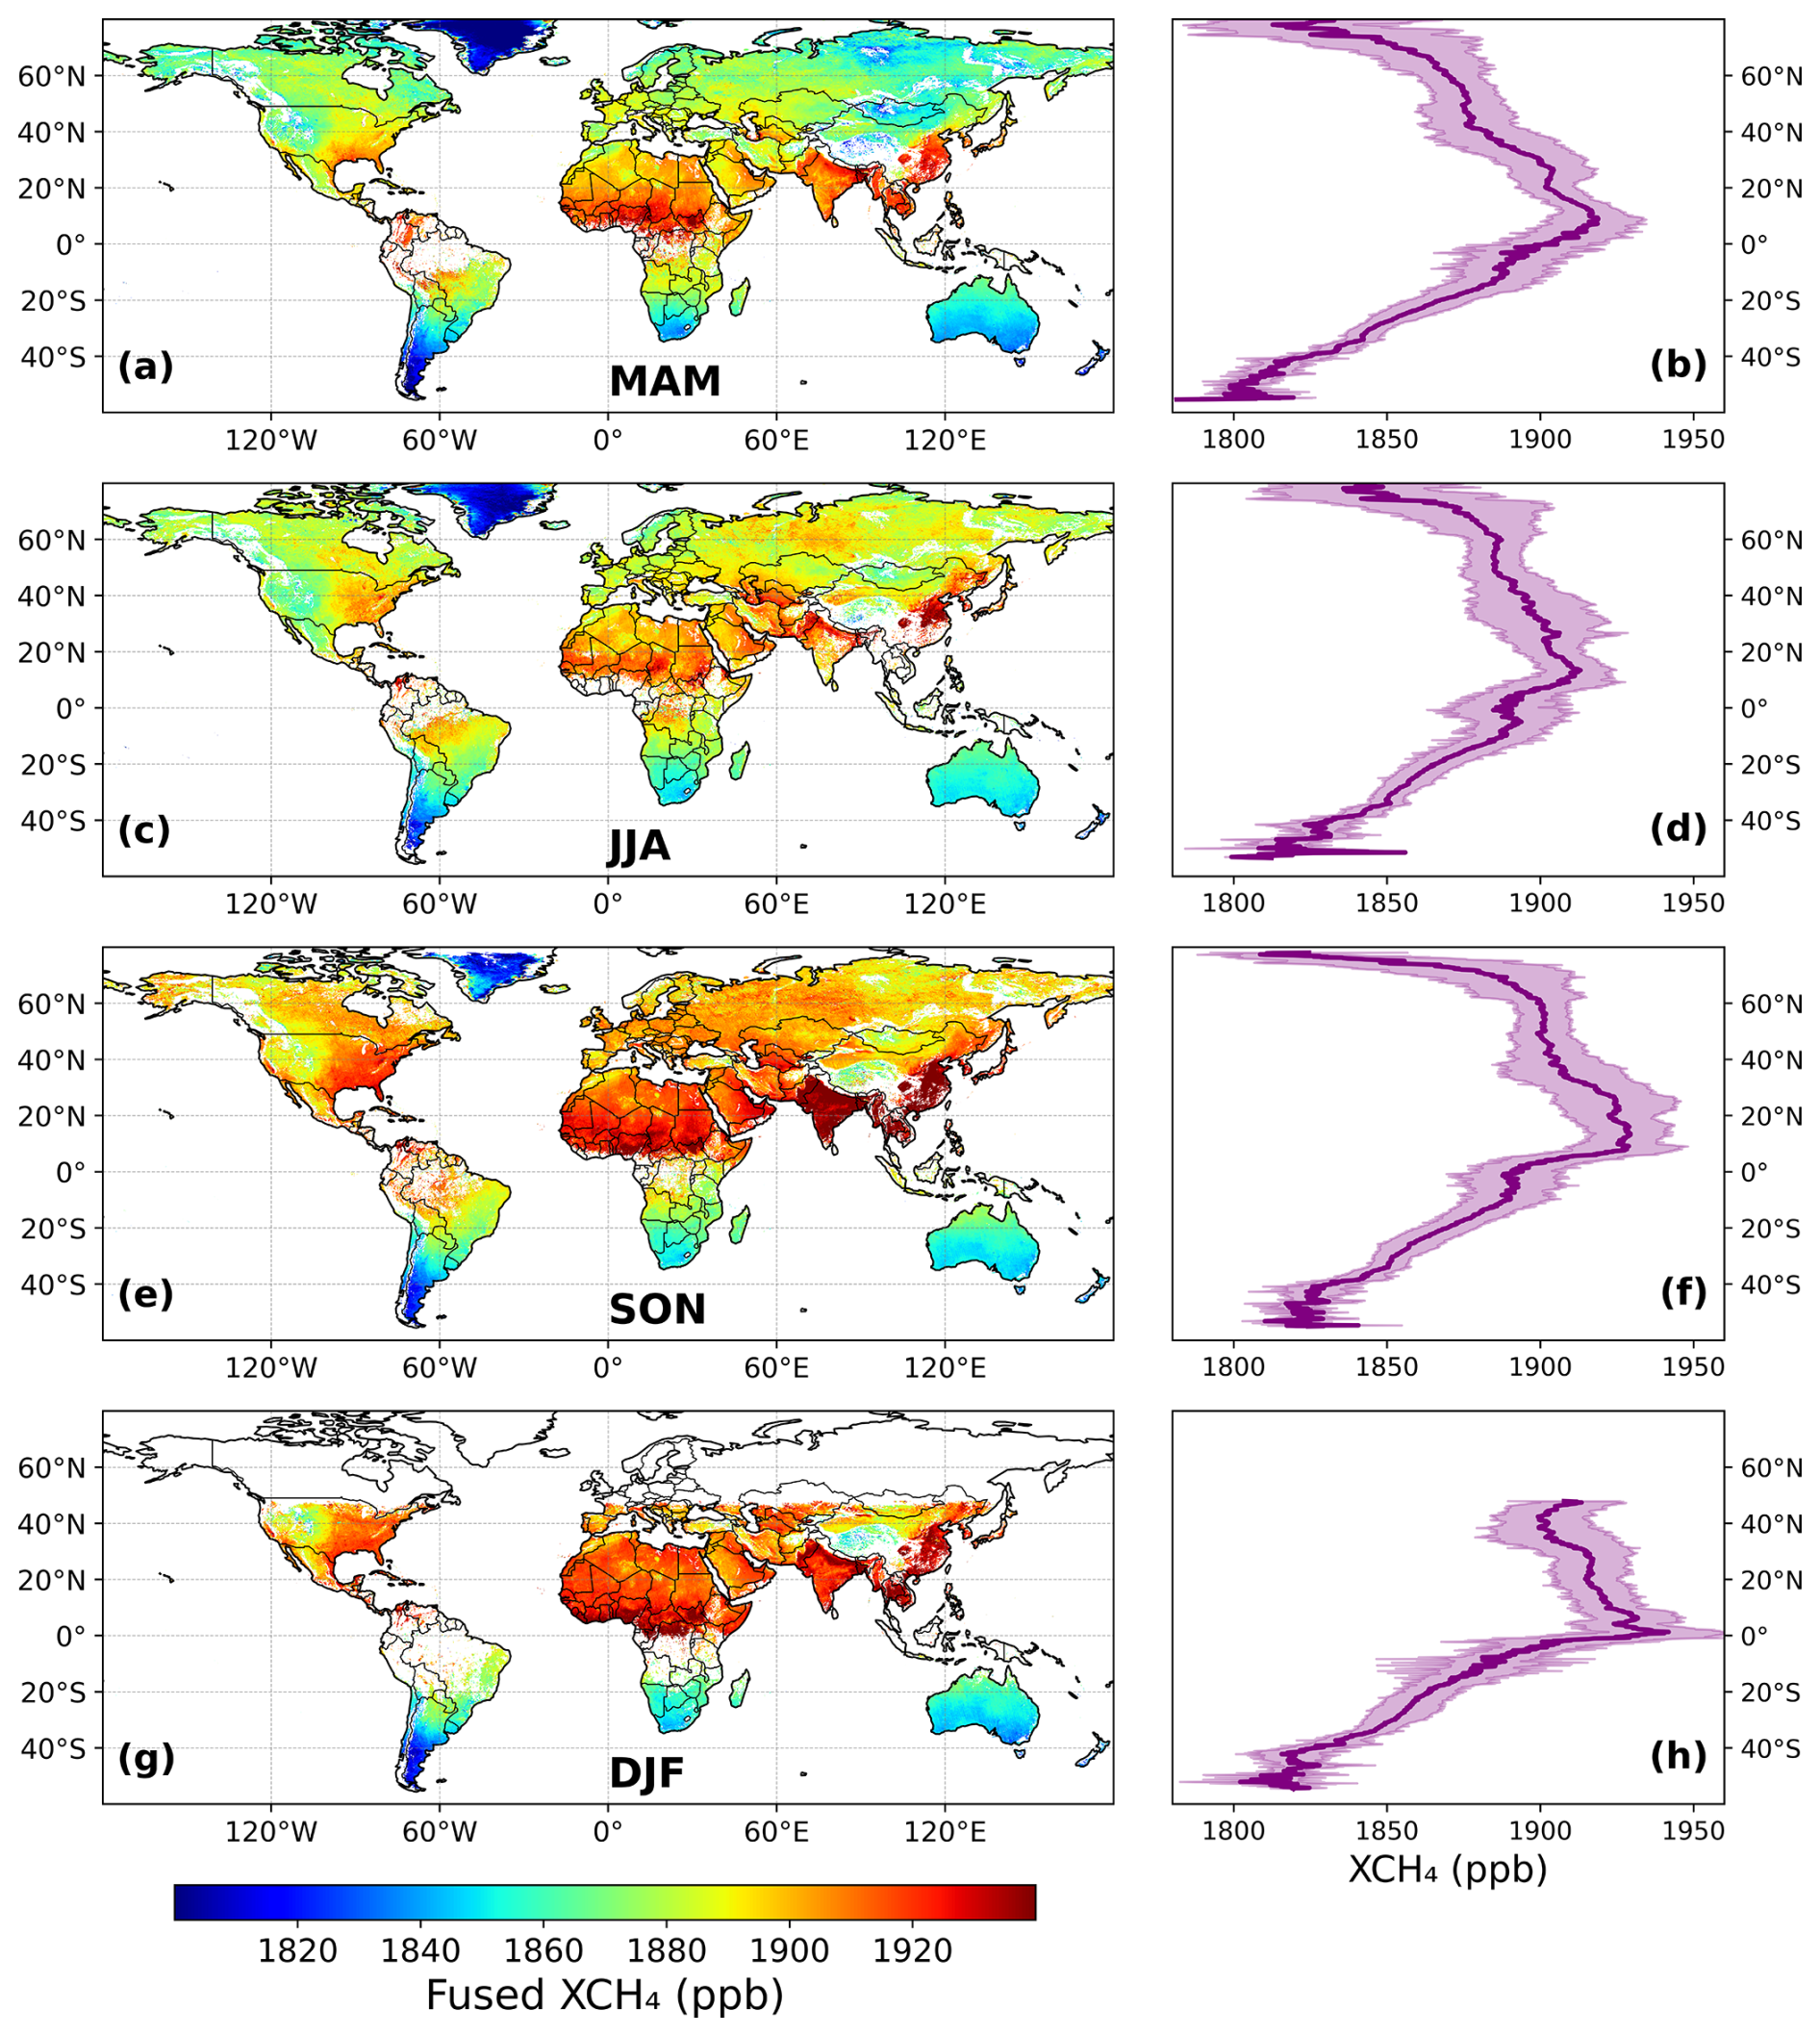
Figure 14Seasonal distributions of Fused XCH4 concentrations and latitudinal gradients in 2023. Left panels (a, c, e, g) show seasonal mean XCH4 concentrations at 0.1° resolution for March–April–May (MAM), June–July–August (JJA), September–October–November (SON), and December–January–February (DJF). Right panels (b, d, f, h) display corresponding zonal mean profiles (solid purple line) with shaded regions representing spatial variability (± 1σ standard deviation) across each latitude band. Latitudes with data coverage below 2 % were excluded from zonal mean calculations to ensure statistical robustness. Regional definitions and seasonal statistics are detailed in Table S7.
Finally, we examined seasonal patterns of global XCH4 in 2023. To preserve localized XCH4 enhancements, zonal-mean profiles were calculated at native 0.1° latitude resolution (Fig. 14), and seasonal statistics were summarized for major latitude zones (Table S7). The NH (0–80° N) exhibited the largest seasonal amplitude (32.14 ppb), peaking in winter (DJF; 1915.36 ppb) and reaching a minimum in spring (MAM; 1883.22 ppb). Within the NH, the high-emission zone (0–40° N) remained consistently elevated throughout the year, ranging from approximately 1901 ppb in JJA to approximately 1918 ppb in SON/DJF, with a moderate seasonal amplitude of 16.50 ppb. In contrast, the SH (60° S–0) showed a smaller amplitude (6.77 ppb), varying between 1850.66 ppb in MAM and 1857.43 ppb in JJA. The pronounced NH seasonality reflects strong source variability from wetland and agricultural emissions, whereas the smoother SH cycle is more strongly governed by the OH sink than by local emissions (East et al., 2024).
4.5 Limitations
While the framework substantially improves retrieval accuracy across sensors, several limitations should be noted. First, the ML-based bias correction relies on TCCON as the primary reference dataset. Although TCCON provides high-precision ground-based XCH4 observations, its spatial distribution is limited and does not fully represent the diverse retrieval conditions encountered globally, particularly high-surface-albedo conditions. We partly addressed this limitation through LOSOCV strategy and additional satellite match-up analyses over broader surface albedo ranges, but independent validation under underrepresented retrieval conditions remains necessary. Second, the Fused dataset uses a fixed sensor-priority strategy (GOSAT-2 → TROPOMI → GOSAT) based on overall accuracy and sampling density, which may introduce regional bias because local observing conditions can favor a non-prioritized sensor. Third, although the fusion framework improves robustness, global annual coverage gains are modest (0.45–0.74 percentage points over TROPOMI). Fourth, ML-based correction in this study relies primarily on retrieval parameters to model systematic biases; incorporating external environmental covariates (e.g., temperature, humidity, and wind) may further reduce regional biases and improve generalization (Qu et al., 2025). Finally, the 0.1° resolution supports regional-scale analyses but remains insufficient for resolving fine-scale emission sources detectable by emerging high-resolution missions (e.g., EMIT or GHGSat). Future work could address these limitations via adaptive sensor weighting, uncertainty quantification, and integration of additional environmental covariates.
This study presents the first global multi-sensor fusion framework that integrates XCH4 retrievals from GOSAT, GOSAT-2, and TROPOMI. Using a three-step ML strategy – (1) TCCON-calibrated bias correction, (2) inter-sensor harmonization, and (3) fusion – we produced a globally harmonized daily 0.1° land XCH4 dataset for 2020–2023. Independent evaluation at withheld TCCON sites demonstrates strong generalization (R2 = 0.81, RMSE = 10.78 ppb), outperforming the standard and operationally bias-corrected satellite products.
A key outcome is that GOSAT-2 provides an effective anchor for cross-sensor harmonization, offering high agreement with TCCON while maintaining broader sampling than GOSAT. The bias-correction and harmonization analyses also revealed and mitigated sensor-specific residual bias structures, including the SWIR surface albedo dependency in TROPOMI and the ΔPs dependency in GOSAT. These results indicate that the proposed framework not only improves the final Fused product but also provides diagnostic insight into retrieval-condition-dependent limitations of the individual satellite products.
Regional assessments show that fusion improves data availability in retrieval-limited environments, increasing coverage by ∼ 1.8 % to ∼ 9.6 % depending on the region compared to the TROPOMI operational product. Although the overall global coverage gain is modest, the Fused product provides complementary XCH4 information in regions or conditions where TROPOMI retrievals are limited.
The Fused product reproduces key spatiotemporal characteristics of atmospheric XCH4, including interannual hemispheric variability and persistent emission hotspots in tropical and subtropical regions associated with wetlands, agriculture, and fossil-fuel infrastructure. The dataset can support downstream applications such as XCH4 gap filling, multi-sensor intercomparison and harmonization, regional methane assessment, hotspot identification, and the development of advanced fusion strategies. The sensor-specific corrected and harmonized products can also serve as reference-scale benchmarks for future XCH4 bias-correction studies. The proposed framework is extensible to upcoming missions (GOSAT-GW, CO2M), enabling enhanced monitoring. Continued advances in multi-sensor harmonization and uncertainty characterization will be crucial for supporting progress toward the GMP target of a 30 % CH4 emission reduction by 2030.
The publicly available dataset includes the daily globally harmonized Fused XCH4 product at 0.1° spatial resolution for 2020–2023, individual harmonized gridded products used in the fusion process (TCCON bias-corrected GOSAT-2, GOSAT-2-like harmonized TROPOMI, and GOSAT-2-like harmonized GOSAT), and source sensor identifiers indicating which satellite contributed each valid observation in the Gused product. All products are provided in HDF5 format and are available on Zenodo at https://doi.org/10.5281/zenodo.20304047 (Keya et al., 2026). The fusion pipeline and example usage code are available at https://github.com/jnkeya/Fused_XCH4 (last access: 22 June 2026). All input datasets used in this study are publicly available as described in Sect. 2.
The supplement related to this article is available online at https://doi.org/10.5194/amt-19-4313-2026-supplement.
J.K.: Writing – original draft, Visualization, Validation, Methodology, Investigation, Formal analysis, Conceptualization. Y.K.: Writing – original draft, Visualization, Validation, Methodology, Investigation, Formal analysis, Conceptualization. H.C.: Writing – review and editing. J.I.: Writing – review and editing, Supervision, Methodology, Funding acquisition, Conceptualization.
The contact author has declared that none of the authors has any competing interests.
Publisher's note: Copernicus Publications remains neutral with regard to jurisdictional claims made in the text, published maps, institutional affiliations, or any other geographical representation in this paper. The authors bear the ultimate responsibility for providing appropriate place names. Views expressed in the text are those of the authors and do not necessarily reflect the views of the publisher.
The authors gratefully acknowledge the financial support of the Korea Ministry of Environment (MOE) and the Ministry of Education.
This work was supported by Korea Environment Industry & Technology Institute (KEITI) through Project for developing an observation-based GHG emissions geospatial information map, funded by Korea Ministry of Environment (MOE) (RS-2023-00232066). Yejin Kim was partially supported by Basic Science Research Program through the National Research Foundation of Korea (NRF), funded by the Ministry of Education (RS-2024-00408905).
This paper was edited by Andre Butz and reviewed by two anonymous referees.
Balasus, N., Jacob, D. J., Lorente, A., Maasakkers, J. D., Parker, R. J., Boesch, H., Chen, Z., Kelp, M. M., Nesser, H., and Varon, D. J.: A blended TROPOMI+GOSAT satellite data product for atmospheric methane using machine learning to correct retrieval biases, Atmos. Meas. Tech., 16, 3787–3807, https://doi.org/10.5194/amt-16-3787-2023, 2023.
Bao, C., Bagan, H., Te, T., Wang, Q., Boris, Z., and Kinoshita, T.: Spatiotemporal variability of methane concentrations driven by ruminant livestock in Mongolia: insights from satellite observations and machine learning, GISci. Remote Sens., 62, 2582118, https://doi.org/10.1080/15481603.2025.2582118, 2025.
Borsdorff, T., Martinez-Velarte, M. C., Sneep, M., ter Linden, M., and Landgraf, J.: Random Forest Classifier for Cloud Clearing of the Operational TROPOMI XCH4 Product, Remote Sens., 16, 1208, https://doi.org/10.3390/rs16071208, 2024.
Butz, A., Hasekamp, O. P., Frankenberg, C., Vidot, J., and Aben, I.: CH4 retrievals from space-based solar backscatter measurements: Performance evaluation against simulated aerosol and cirrus loaded scenes, J. Geophys. Res.-Atmos., 115, https://doi.org/10.1029/2010JD014514, 2010.
Butz, A., Guerlet, S., Hasekamp, O., Schepers, D., Galli, A., Aben, I., Frankenberg, C., Hartmann, J.-M., Tran, H., Kuze, A., Keppel-Aleks, G., Toon, G., Wunch, D., Wennberg, P., Deutscher, N., Griffith, D., Macatangay, R., Messerschmidt, J., Notholt, J., and Warneke, T.: Toward accurate CO2 and CH4 observations from GOSAT, Geophys. Res. Lett., 38, https://doi.org/10.1029/2011GL047888, 2011.
Chen, J., Hu, R., Chen, L., Liao, Z., Che, L., and Li, T.: Multi-sensor integrated mapping of global XCO2 from 2015 to 2021 with a local random forest model, ISPRS J. Photogramm., 208, 107–120, https://doi.org/10.1016/j.isprsjprs.2024.01.009, 2024.
Choi, H. and Jeong, U.: Spatiotemporal Variations of Atmospheric Methane over the Korean Peninsula from Sentinel-5P/TROPOMI Observations, Korean Journal of Remote Sensing, 42, 77–90, https://doi.org/10.7780/kjrs.2026.42.1.6, 2026.
Deutscher, N. M., Griffith, D. W. T., Paton-Walsh, C., Velazco, V. A., Wennberg, P. O., Blavier, J.-F., Washenfelder, R. A., Yavin, Y., Keppel-Aleks, G., Toon, G. C., Jones, N. B., Kettlewell, G. C., Connor, B. J., Macatangay, R. C., Wunch, D., Roehl, C., and Bryant, G. W.: TCCON data from Darwin (AU), Release GGG2020.R0, CaltechDATA [data set], https://doi.org/10.14291/tccon.ggg2020.darwin01.R0, 2023.
Dils, B., Buchwitz, M., Reuter, M., Schneising, O., Boesch, H., Parker, R., Guerlet, S., Aben, I., Blumenstock, T., Burrows, J. P., Butz, A., Deutscher, N. M., Frankenberg, C., Hase, F., Hasekamp, O. P., Heymann, J., De Mazière, M., Notholt, J., Sussmann, R., Warneke, T., Griffith, D., Sherlock, V., and Wunch, D.: The Greenhouse Gas Climate Change Initiative (GHG-CCI): comparative validation of GHG-CCI SCIAMACHY/ENVISAT and TANSO-FTS/GOSAT CO2 and CH4 retrieval algorithm products with measurements from the TCCON, Atmos. Meas. Tech., 7, 1723–1744, https://doi.org/10.5194/amt-7-1723-2014, 2014.
East, J. D., Jacob, D. J., Balasus, N., Bloom, A. A., Bruhwiler, L., Chen, Z., Kaplan, J. O., Mickley, L. J., Mooring, T. A., Penn, E., Poulter, B., Sulprizio, M. P., Worden, J. R., Yantosca, R. M., and Zhang, Z.: Interpreting the Seasonality of Atmospheric Methane, Geophys. Res. Lett., 51, e2024GL108494, https://doi.org/10.1029/2024GL108494, 2024.
Fan, L., Wan, Y., and Dai, Y.: Development of a Multi-Source Satellite Fusion Method for XCH4 Product Generation in Oil and Gas Production Areas, Appl. Sci., 14, 11100, https://doi.org/10.3390/app142311100, 2024.
Harriss, R., Alvarez, R. A., Lyon, D., Zavala-Araiza, D., Nelson, D., and Hamburg, S. P.: Using Multi-Scale Measurements to Improve Methane Emission Estimates from Oil and Gas Operations in the Barnett Shale Region, Texas, Environ. Sci. Technol., 49, 7524–7526, https://doi.org/10.1021/acs.est.5b02305, 2015.
Hase, F., Herkommer, B., Groß, J., Blumenstock, T., Kiel, M. ä., and Dohe, S.: TCCON data from Karlsruhe (DE), Release GGG2020.R2, CaltechDATA [data set], https://doi.org/10.14291/tccon.ggg2020.karlsruhe01.R2, 2024.
Hasekamp, O., Lorente, A., Hu, H., Butz, A., Aan de Brugh, J., and Landgraf, J.: Algorithm Theoretical Baseline Document for Sentinel-5 Precursor Methane Retrieval, v2.4.0, https://sentinels.copernicus.eu/documents/247904/2476257/Sentinel-5P-TROPOMI-ATBD-Methane-retrieval.pdf (last access: 18 June 2026), 2022.
Hu, H., Hasekamp, O., Butz, A., Galli, A., Landgraf, J., Aan de Brugh, J., Borsdorff, T., Scheepmaker, R., and Aben, I.: The operational methane retrieval algorithm for TROPOMI, Atmos. Meas. Tech., 9, 5423–5440, https://doi.org/10.5194/amt-9-5423-2016, 2016.
Hu, H., Landgraf, J., Detmers, R., Borsdorff, T., Aan de Brugh, J., Aben, I., Butz, A., and Hasekamp, O.: Toward Global Mapping of Methane With TROPOMI: First Results and Intersatellite Comparison to GOSAT, Geophys. Res. Lett., 45, 3682–3689, https://doi.org/10.1002/2018GL077259, 2018.
Hwang, Y. and Song, J.: Recent deep learning methods for tabular data, Communications for Statistical Applications and Methods, 30, 215–226, https://doi.org/10.29220/CSAM.2023.30.2.215, 2023.
Hwang, S., Choi, H., Kang, Y., and Im, J.: Reconstructing long-term (2003–2019) global high-resolution XCO2: bridging observational gaps with machine learning, GISci. Remote Sens., 63, 2627042, https://doi.org/10.1080/15481603.2026.2627042, 2026.
IEA: Global Methane Tracker 2022, IEA, Paris, https://www.iea.org/reports/global-methane-tracker-2022 (last access: 23 April 2026), 2022.
IEA: Global Methane Tracker 2025 – Analysis, IEA, Paris, https://www.iea.org/reports/global-methane-tracker-2025 (last access: 23 April 2026), 2025.
Imasu, R., Matsunaga, T., Nakajima, M., Yoshida, Y., Shiomi, K., Morino, I., Saitoh, N., Niwa, Y., Someya, Y., Oishi, Y., Hashimoto, M., Noda, H., Hikosaka, K., Uchino, O., Maksyutov, S., Takagi, H., Ishida, H., Nakajima, T. Y., Nakajima, T., and Shi, C.: Greenhouse gases Observing SATellite 2 (GOSAT-2): mission overview, Prog. Earth Planet. Sci., 10, 33, https://doi.org/10.1186/s40645-023-00562-2, 2023.
Inoue, M., Morino, I., Uchino, O., Nakatsuru, T., Yoshida, Y., Yokota, T., Wunch, D., Wennberg, P. O., Roehl, C. M., Griffith, D. W. T., Velazco, V. A., Deutscher, N. M., Warneke, T., Notholt, J., Robinson, J., Sherlock, V., Hase, F., Blumenstock, T., Rettinger, M., Sussmann, R., Kyrö, E., Kivi, R., Shiomi, K., Kawakami, S., De Mazière, M., Arnold, S. G., Feist, D. G., Barrow, E. A., Barney, J., Dubey, M., Schneider, M., Iraci, L. T., Podolske, J. R., Hillyard, P. W., Machida, T., Sawa, Y., Tsuboi, K., Matsueda, H., Sweeney, C., Tans, P. P., Andrews, A. E., Biraud, S. C., Fukuyama, Y., Pittman, J. V., Kort, E. A., and Tanaka, T.: Bias corrections of GOSAT SWIR XCO2 and XCH4 with TCCON data and their evaluation using aircraft measurement data, Atmos. Meas. Tech., 9, 3491–3512, https://doi.org/10.5194/amt-9-3491-2016, 2016.
Intergovernmental Panel on Climate Change (IPCC) (Ed.): Anthropogenic and Natural Radiative Forcing, in: Climate Change 2013 – The Physical Science Basis: Working Group I Contribution to the Fifth Assessment Report of the Intergovernmental Panel on Climate Change, Cambridge University Press, Cambridge, 659–740, https://doi.org/10.1017/CBO9781107415324.018, 2014.
Iraci, L. T., Podolske, J. R., Roehl, C., Wennberg, P. O., Blavier, J.-F., Allen, N., Wunch, D., and Osterman, G. B.: TCCON data from Edwards (US), Release GGG2020.R0, CaltechDATA [data set], https://doi.org/10.14291/tccon.ggg2020.edwards01.R0, 2022.
Jacob, D. J., Varon, D. J., Cusworth, D. H., Dennison, P. E., Frankenberg, C., Gautam, R., Guanter, L., Kelley, J., McKeever, J., Ott, L. E., Poulter, B., Qu, Z., Thorpe, A. K., Worden, J. R., and Duren, R. M.: Quantifying methane emissions from the global scale down to point sources using satellite observations of atmospheric methane, Atmos. Chem. Phys., 22, 9617–9646, https://doi.org/10.5194/acp-22-9617-2022, 2022.
Janardanan, R., Maksyutov, S., Tsuruta, A., Wang, F., Tiwari, Y. K., Valsala, V., Ito, A., Yoshida, Y., Kaiser, J. W., Janssens-Maenhout, G., Arshinov, M., Sasakawa, M., Tohjima, Y., Worthy, D. E. J., Dlugokencky, E. J., Ramonet, M., Arduini, J., Lavric, J. V., Piacentino, S., Krummel, P. B., Langenfelds, R. L., Mammarella, I., and Matsunaga, T.: Country-Scale Analysis of Methane Emissions with a High-Resolution Inverse Model Using GOSAT and Surface Observations, Remote Sens., 12, 375, https://doi.org/10.3390/rs12030375, 2020.
Jang, J., Kim, G., Sim, J., Kim, J., and Lee, Y.: Machine Learning-Based Mapping of Daily Methane Concentration in Rice Paddies Using Meteorological Data and Satellite Images: A Case of South Korea, Korean Journal of Remote Sensing, 40, 1095–1108, https://doi.org/10.7780/kjrs.2024.40.6.1.18, 2024.
Keya, J. N., Kim, Y., Choi, H., and Im, J.: A global harmonized daily 0.1° XCH4 from GOSAT, GOSAT-2, and TROPOMI using machine learning-based bias correction and data fusion (Version v2), Zenodo [data set], https://doi.org/10.5281/zenodo.20304047, 2026.
Kivi, R., Heikkinen, P., and Kyrö, E.: TCCON data from Sodankylä (FI), Release GGG2020.R1, CaltechDATA [data set], https://doi.org/10.14291/tccon.ggg2020.sodankyla01.R1, 2026.
Kuze, A., Suto, H., Nakajima, M., and Hamazaki, T.: Thermal and near infrared sensor for carbon observation Fourier-transform spectrometer on the Greenhouse Gases Observing Satellite for greenhouse gases monitoring, Appl. Optics, 48, 6716–6733, https://doi.org/10.1364/AO.48.006716, 2009.
Kuze, A., Suto, H., Shiomi, K., Kawakami, S., Tanaka, M., Ueda, Y., Deguchi, A., Yoshida, J., Yamamoto, Y., Kataoka, F., Taylor, T. E., and Buijs, H. L.: Update on GOSAT TANSO-FTS performance, operations, and data products after more than 6 years in space, Atmos. Meas. Tech., 9, 2445–2461, https://doi.org/10.5194/amt-9-2445-2016, 2016.
Lan, X., Talbot, R., Laine, P., and Torres, A.: Characterizing Fugitive Methane Emissions in the Barnett Shale Area Using a Mobile Laboratory, Environ. Sci. Technol., 49, 8139–8146, https://doi.org/10.1021/es5063055, 2015.
Lee, D., Choi, W., Hong, H., and Lee, H.: Global Estimation of Surface Methane Using Low-Earth Orbit Satellite Data and Machine Learning: Comparison of Linear and Nonlinear Models, Korean Journal of Remote Sensing, 41, 387–400, https://doi.org/10.7780/kjrs.2025.41.2.1.12, 2025.
Li, K., Bai, K., Jiao, P., Chen, H., He, H., Shao, L., Sun, Y., Zheng, Z., Li, R., and Chang, N.-B.: Developing unbiased estimation of atmospheric methane via machine learning and multiobjective programming based on TROPOMI and GOSAT data, Remote Sens. Environ., 304, 114039, https://doi.org/10.1016/j.rse.2024.114039, 2024.
Liu, C., Wang, W., Sun, Y., and Shan, C.: TCCON data from Hefei (PRC), Release GGG2020.R1, CaltechDATA [data set], https://doi.org/10.14291/tccon.ggg2020.hefei01.R1, 2023.
Liu, R., Li, S., Zhang, G., Liu, M., Lu, X., Peng, S., Shen, L., Zhang, Y., Zhuang, M., Zuo, X., and Dong, J.: Recent advances in TROPOMI-based methane source detection: a systematic review, GISci. Remote Sens., 63, 2650822, https://doi.org/10.1080/15481603.2026.2650822, 2026.
Lorente, A., Borsdorff, T., Butz, A., Hasekamp, O., aan de Brugh, J., Schneider, A., Wu, L., Hase, F., Kivi, R., Wunch, D., Pollard, D. F., Shiomi, K., Deutscher, N. M., Velazco, V. A., Roehl, C. M., Wennberg, P. O., Warneke, T., and Landgraf, J.: Methane retrieved from TROPOMI: improvement of the data product and validation of the first 2 years of measurements, Atmos. Meas. Tech., 14, 665–684, https://doi.org/10.5194/amt-14-665-2021, 2021.
Maasakkers, J. D., Jacob, D. J., Sulprizio, M. P., Scarpelli, T. R., Nesser, H., Sheng, J.-X., Zhang, Y., Hersher, M., Bloom, A. A., Bowman, K. W., Worden, J. R., Janssens-Maenhout, G., and Parker, R. J.: Global distribution of methane emissions, emission trends, and OH concentrations and trends inferred from an inversion of GOSAT satellite data for 2010–2015, Atmos. Chem. Phys., 19, 7859–7881, https://doi.org/10.5194/acp-19-7859-2019, 2019.
Malina, E., Veihelmann, B., Buschmann, M., Deutscher, N. M., Feist, D. G., and Morino, I.: On the consistency of methane retrievals using the Total Carbon Column Observing Network (TCCON) and multiple spectroscopic databases, Atmos. Meas. Tech., 15, 2377–2406, https://doi.org/10.5194/amt-15-2377-2022, 2022.
Morino, I., Velazco, V. A., Hori, A., Uchino, O., and Griffith, D. W. T.: TCCON data from Burgos, Ilocos Norte (PH), Release GGG2020.R0, CaltechDATA [data set], https://doi.org/10.14291/tccon.ggg2020.burgos01.R0, 2022a.
Morino, I., Ohyama, H., Hori, A., and Ikegami, H.: TCCON data from Rikubetsu (JP), Release GGG2020.R0, CaltechDATA [data set], https://doi.org/10.14291/tccon.ggg2020.rikubetsu01.R0, 2022b.
Morino, I., Ohyama, H., Hori, A., and Ikegami, H.: TCCON data from Tsukuba (JP), 125HR, Release GGG2020.R0, CaltechDATA [data set], https://doi.org/10.14291/tccon.ggg2020.tsukuba02.R0, 2022c.
Myhre, G., Shindell, D., Bréon, F.-M., Collins, W., Fuglestvedt, J., Huang, J., Koch, D., Lamarque, J.-F., Lee, D., Mendoza, B., Nakajima, T., Robock, A., Stephens, G., Takemura, T., and Zhang, H.: Anthropogenic and natural radiative forcing, in: Climate Change 2013: The Physical Science Basis. Contribution of Working Group I to the Fifth Assessment Report of the Intergovernmental Panel on Climate Change, edited by: Stocker, T. F., Qin, D., Plattner, G.-K., Tignor, M., Allen, S. K., Doschung, J., Nauels, A., Xia, Y., Bex, V., and Midgley, P. M., Cambridge University Press, 659–740, https://doi.org/10.1017/CBO9781107415324.018, 2013.
Naik, V., Szopa, S., Adhikary, B., Artaxo, P., Berntsen, T., Collins, W. D., Fuzzi, S., Gallardo, L., Kiendler Scharr, A., Klimont, Z., Liao, H., Unger, N., and Zanis, P.: Short-Lived Climate Forcers, in: Climate Change 2021: The Physical Science Basis. Contribution of Working Group I to the Sixth Assessment Report of the Intergovernmental Panel on Climate Change, edited by: Masson-Delmotte, V., Zhai, P., Pirani, A., Connors, S. L., Péan, C., Berger, S., Caud, N., Chen, Y., Goldfarb, L., Gomis, M. L., Huang, M., Leitzell, K., Lonnoy, E., Matthews, J. B. R., Maycock, T. K., Waterfield, T., Yelekçi, O., Yu, R., and Zhou, B., Cambridge University Press, https://www.ipcc.ch/report/ar6/wg1/downloads/report/IPCC_AR6_WGI_Chapter06.pdf (last access: 20 June 2026), 2021.
Nesser, H., Jacob, D. J., Maasakkers, J. D., Lorente, A., Chen, Z., Lu, X., Shen, L., Qu, Z., Sulprizio, M. P., Winter, M., Ma, S., Bloom, A. A., Worden, J. R., Stavins, R. N., and Randles, C. A.: High-resolution US methane emissions inferred from an inversion of 2019 TROPOMI satellite data: contributions from individual states, urban areas, and landfills, Atmos. Chem. Phys., 24, 5069–5091, https://doi.org/10.5194/acp-24-5069-2024, 2024.
Nisbet, E. G., Fisher, R. E., Lowry, D., France, J. L., Allen, G., Bakkaloglu, S., Broderick, T. J., Cain, M., Coleman, M., Fernandez, J., Forster, G., Griffiths, P. T., Iverach, C. P., Kelly, B. F. J., Manning, M. R., Nisbet-Jones, P. B. R., Pyle, J. A., Townsend-Small, A., al-Shalaan, A., Warwick, N., and Zazzeri, G.: Methane Mitigation: Methods to Reduce Emissions, on the Path to the Paris Agreement, Rev. Geophys., 58, e2019RG000675, https://doi.org/10.1029/2019RG000675, 2020.
Noël, S., Reuter, M., Buchwitz, M., Borchardt, J., Hilker, M., Bovensmann, H., Burrows, J. P., Di Noia, A., Suto, H., Yoshida, Y., Buschmann, M., Deutscher, N. M., Feist, D. G., Griffith, D. W. T., Hase, F., Kivi, R., Morino, I., Notholt, J., Ohyama, H., Petri, C., Podolske, J. R., Pollard, D. F., Sha, M. K., Shiomi, K., Sussmann, R., Té, Y., Velazco, V. A., and Warneke, T.: XCO2 retrieval for GOSAT and GOSAT-2 based on the FOCAL algorithm, Atmos. Meas. Tech., 14, 3837–3869, https://doi.org/10.5194/amt-14-3837-2021, 2021.
Notholt, J., Petri, C., Warneke, T., and Buschmann, M.: TCCON data from Bremen (DE), Release GGG2020.R0, CaltechDATA [data set], https://doi.org/10.14291/tccon.ggg2020.bremen01.R0, 2022.
Olukaejire, S., Ifiora, C., Osaro, P., Osuji, L., and Hart, A.: Petroleum exploration in the Niger Delta region and implications for the environment: A review, J. Energy Res. Rev., 16, 19–29, https://doi.org/10.9734/jenrr/2024/v16i5350, 2024.
Oshio, H., Yoshida, Y., Matsunaga, T., Deutscher, N. M., Dubey, M., Griffith, D. W. T., Hase, F., Iraci, L. T., Kivi, R., Liu, C., Morino, I., Notholt, J., Oh, Y.-S., Ohyama, H., Petri, C., Pollard, D. F., Roehl, C., Shiomi, K., Sussmann, R., Té, Y., Velazco, V. A., Warneke, T., and Wunch, D.: Bias Correction of the Ratio of Total Column CH4 to CO2 Retrieved from GOSAT Spectra, Remote Sens., 12, 3155, https://doi.org/10.3390/rs12193155, 2020.
Park, H., Lee, B., Sohn, E.-H., and Kim, J. Y.: Seasonal Variability of Solar-Induced Fluorescence and Correlation with Greenhouse Gas across Different Land Cover in East Asia, Korean Journal of Remote Sensing, 40, 579–588, https://doi.org/10.7780/kjrs.2024.40.5.1.13, 2024.
Parker, R. J., Webb, A., Boesch, H., Somkuti, P., Barrio Guillo, R., Di Noia, A., Kalaitzi, N., Anand, J. S., Bergamaschi, P., Chevallier, F., Palmer, P. I., Feng, L., Deutscher, N. M., Feist, D. G., Griffith, D. W. T., Hase, F., Kivi, R., Morino, I., Notholt, J., Oh, Y.-S., Ohyama, H., Petri, C., Pollard, D. F., Roehl, C., Sha, M. K., Shiomi, K., Strong, K., Sussmann, R., Té, Y., Velazco, V. A., Warneke, T., Wennberg, P. O., and Wunch, D.: A decade of GOSAT Proxy satellite CH4 observations, Earth Syst. Sci. Data, 12, 3383–3412, https://doi.org/10.5194/essd-12-3383-2020, 2020.
Pendergrass, D. C., Jacob, D. J., Balasus, N., Estrada, L., Varon, D. J., East, J. D., He, M., Mooring, T. A., Penn, E., Nesser, H., and Worden, J. R.: Trends and seasonality of 2019–2023 global methane emissions inferred from a localized ensemble transform Kalman filter (CHEEREIO v1.3.1) applied to TROPOMI satellite observations, Atmos. Chem. Phys., 25, 14353–14369, https://doi.org/10.5194/acp-25-14353-2025, 2025.
Petri, C., Vrekoussis, M., Rousogenous, C., Warneke, T., Sciare, J., and Notholt, J.: TCCON data from Nicosia (CY), Release GGG2020.R1, CaltechDATA [data set], https://doi.org/10.14291/tccon.ggg2020.nicosia01.R1, 2024.
Pollard, D. F., Robinson, J., and Shiona, H.: TCCON data from Lauder (NZ), Release GGG2020.R0, CaltechDATA [data set], https://doi.org/10.14291/tccon.ggg2020.lauder03.R0, 2022.
Prather, M. J., Holmes, C. D., and Hsu, J.: Reactive greenhouse gas scenarios: Systematic exploration of uncertainties and the role of atmospheric chemistry, Geophys. Res. Lett., 39, https://doi.org/10.1029/2012GL051440, 2012.
Qu, Y., Wei, J., Xing, H., Shi, X., Ao, Z., and Meng, X.: Global Estimates of Daily Gapless Atmospheric XCH4 Concentrations From Satellite and Reanalysis Data During 2003–2020, IEEE T. Geosci. Remote, 63, 1–12, https://doi.org/10.1109/TGRS.2025.3593486, 2025.
Qu, Z., Jacob, D. J., Shen, L., Lu, X., Zhang, Y., Scarpelli, T. R., Nesser, H., Sulprizio, M. P., Maasakkers, J. D., Bloom, A. A., Worden, J. R., Parker, R. J., and Delgado, A. L.: Global distribution of methane emissions: a comparative inverse analysis of observations from the TROPOMI and GOSAT satellite instruments, Atmos. Chem. Phys., 21, 14159–14175, https://doi.org/10.5194/acp-21-14159-2021, 2021.
Saunois, M., Martinez, A., Poulter, B., Zhang, Z., Raymond, P. A., Regnier, P., Canadell, J. G., Jackson, R. B., Patra, P. K., Bousquet, P., Ciais, P., Dlugokencky, E. J., Lan, X., Allen, G. H., Bastviken, D., Beerling, D. J., Belikov, D. A., Blake, D. R., Castaldi, S., Crippa, M., Deemer, B. R., Dennison, F., Etiope, G., Gedney, N., Höglund-Isaksson, L., Holgerson, M. A., Hopcroft, P. O., Hugelius, G., Ito, A., Jain, A. K., Janardanan, R., Johnson, M. S., Kleinen, T., Krummel, P. B., Lauerwald, R., Li, T., Liu, X., McDonald, K. C., Melton, J. R., Mühle, J., Müller, J., Murguia-Flores, F., Niwa, Y., Noce, S., Pan, S., Parker, R. J., Peng, C., Ramonet, M., Riley, W. J., Rocher-Ros, G., Rosentreter, J. A., Sasakawa, M., Segers, A., Smith, S. J., Stanley, E. H., Thanwerdas, J., Tian, H., Tsuruta, A., Tubiello, F. N., Weber, T. S., van der Werf, G. R., Worthy, D. E. J., Xi, Y., Yoshida, Y., Zhang, W., Zheng, B., Zhu, Q., Zhu, Q., and Zhuang, Q.: Global Methane Budget 2000–2020, Earth Syst. Sci. Data, 17, 1873–1958, https://doi.org/10.5194/essd-17-1873-2025, 2025.
Schneising, O., Buchwitz, M., Hachmeister, J., Vanselow, S., Reuter, M., Buschmann, M., Bovensmann, H., and Burrows, J. P.: Advances in retrieving XCH4 and XCO from Sentinel-5 Precursor: improvements in the scientific TROPOMI/WFMD algorithm, Atmos. Meas. Tech., 16, 669–694, https://doi.org/10.5194/amt-16-669-2023, 2023.
Sha, M. K., Langerock, B., Blavier, J.-F. L., Blumenstock, T., Borsdorff, T., Buschmann, M., Dehn, A., De Mazière, M., Deutscher, N. M., Feist, D. G., García, O. E., Griffith, D. W. T., Grutter, M., Hannigan, J. W., Hase, F., Heikkinen, P., Hermans, C., Iraci, L. T., Jeseck, P., Jones, N., Kivi, R., Kumps, N., Landgraf, J., Lorente, A., Mahieu, E., Makarova, M. V., Mellqvist, J., Metzger, J.-M., Morino, I., Nagahama, T., Notholt, J., Ohyama, H., Ortega, I., Palm, M., Petri, C., Pollard, D. F., Rettinger, M., Robinson, J., Roche, S., Roehl, C. M., Röhling, A. N., Rousogenous, C., Schneider, M., Shiomi, K., Smale, D., Stremme, W., Strong, K., Sussmann, R., Té, Y., Uchino, O., Velazco, V. A., Vigouroux, C., Vrekoussis, M., Wang, P., Warneke, T., Wizenberg, T., Wunch, D., Yamanouchi, S., Yang, Y., and Zhou, M.: Validation of methane and carbon monoxide from Sentinel-5 Precursor using TCCON and NDACC-IRWG stations, Atmos. Meas. Tech., 14, 6249–6304, https://doi.org/10.5194/amt-14-6249-2021, 2021.
Shiomi, K., Kawakami, S., Ohyama, H., Arai, K., Okumura, H., Ikegami, H., and Usami, M.: TCCON data from Saga (JP), Release GGG2020.R0, CaltechDATA [data set], https://doi.org/10.14291/tccon.ggg2020.saga01.R0, 2022.
Shwartz-Ziv, R. and Armon, A.: Tabular data: Deep learning is not all you need, Inf. Fusion, 81, 84–90, https://doi.org/10.1016/j.inffus.2021.11.011, 2022.
Sussmann, R., Rettinger, M., and Mostafavi Pak, N.: TCCON data from Garmisch (DE), Release GGG2020.R1, CaltechDATA [data set], https://doi.org/10.14291/tccon.ggg2020.garmisch01.R1, 2025.
Suto, H., Kataoka, F., Kikuchi, N., Knuteson, R. O., Butz, A., Haun, M., Buijs, H., Shiomi, K., Imai, H., and Kuze, A.: Thermal and near-infrared sensor for carbon observation Fourier transform spectrometer-2 (TANSO-FTS-2) on the Greenhouse gases Observing SATellite-2 (GOSAT-2) during its first year in orbit, Atmos. Meas. Tech., 14, 2013–2039, https://doi.org/10.5194/amt-14-2013-2021, 2021.
Té, Y., Jeseck, P., and Janssen, C.: TCCON data from Paris (FR), Release GGG2020.R0, CaltechDATA [data set], https://doi.org/10.14291/tccon.ggg2020.paris01.R0, 2022.
Umezawa, T., Tohjima, Y., Terao, Y., Sasakawa, M., Müller, A., Saeki, T., Machida, T., Nakaoka, S.-I., Nara, H., Nomura, S., Nishihashi, M., Mukai, H., Frey, M. M., Morino, I., Ohyama, H., Yoshida, Y., Zeng, J., Noda, H., Saito, M., Matsunaga, T., Sugita, T., Tanimoto, H., Niwa, Y., Ito, A., Yamashita, Y., Shirai, T., Ishizawa, M., Ishijima, K., Tsuboi, K., Sawa, Y., and Matsueda, H.: Long-term and interannual variations of atmospheric methane observed by the NIES and collaborative observation networks, Prog. Earth Planet. Sci., 12, 39, https://doi.org/10.1186/s40645-025-00711-9, 2025.
Veefkind, J. P., Aben, I., McMullan, K., Förster, H., de Vries, J., Otter, G., Claas, J., Eskes, H. J., de Haan, J. F., Kleipool, Q., van Weele, M., Hasekamp, O., Hoogeveen, R., Landgraf, J., Snel, R., Tol, P., Ingmann, P., Voors, R., Kruizinga, B., Vink, R., Visser, H., and Levelt, P. F.: TROPOMI on the ESA Sentinel-5 Precursor: A GMES mission for global observations of the atmospheric composition for climate, air quality and ozone layer applications, Remote Sens. Environ., 120, 70–83, https://doi.org/10.1016/j.rse.2011.09.027, 2012.
Wang, F., Maksyutov, S., Janardanan, R., Ito, A., Morino, I., Yoshida, Y., Someya, Y., Tohjima, Y., Kelly, B. F. J., Kaiser, J. W., Lan, X., Mammarella, I., and Matsunaga, T.: Methane emissions from Australia estimated by inverse analysis using in-situ and Satellite (GOSAT) atmospheric observations, GISci. Remote Sens., 62, 2488595, https://doi.org/10.1080/15481603.2025.2488595, 2025.
Wang, W., He, J., Feng, H., and Jin, Z.: High-Coverage Reconstruction of XCO2 Using Multisource Satellite Remote Sensing Data in Beijing–Tianjin–Hebei Region, Int. J. Env. Res. Pub. He., 19, 10853, https://doi.org/10.3390/ijerph191710853, 2022.
Warneke, T., Petri, C., Notholt, J., and Buschmann, M.: TCCON data from Orléans (FR), Release GGG2020.R1, CaltechDATA [data set], https://doi.org/10.14291/tccon.ggg2020.orleans01.R1, 2024.
Wennberg, P. O., Roehl, C. M., Wunch, D., Blavier, J.-F., Toon, G. C., Allen, N. T., Treffers, R., and Laughner, J.: TCCON data from Caltech (US), Release GGG2020.R0, CaltechDATA [data set], https://doi.org/10.14291/tccon.ggg2020.pasadena01.R0, 2022a.
Wennberg, P. O., Roehl, C. M., Wunch, D., Toon, G. C., Blavier, J.-F., Washenfelder, R., Keppel-Aleks, G., and Allen, N. T.: TCCON data from Park Falls (US), Release GGG2020.R1, CaltechDATA [data set], https://doi.org/10.14291/tccon.ggg2020.parkfalls01.R1, 2022b.
Wennberg, P. O., Wunch, D., Roehl, C. M., Blavier, J.-F., Toon, G. C., and Allen, N. T.: TCCON data from Lamont (US), Release GGG2020.R1, CaltechDATA [data set], https://doi.org/10.14291/tccon.ggg2020.lamont01.R1, 2025.
Worden, J. R., Cusworth, D. H., Qu, Z., Yin, Y., Zhang, Y., Bloom, A. A., Ma, S., Byrne, B. K., Scarpelli, T., Maasakkers, J. D., Crisp, D., Duren, R., and Jacob, D. J.: The 2019 methane budget and uncertainties at 1° resolution and each country through Bayesian integration Of GOSAT total column methane data and a priori inventory estimates, Atmos. Chem. Phys., 22, 6811–6841, https://doi.org/10.5194/acp-22-6811-2022, 2022.
Wunch, D., Toon, G. C., Blavier, J.-F. L., Washenfelder, R. A., Notholt, J., Connor, B. J., Griffith, D. W. T., Sherlock, V., and Wennberg, P. O.: The Total Carbon Column Observing Network, Philos. T. R. Soc. A, 369, 2087–2112, https://doi.org/10.1098/rsta.2010.0240, 2011.
Wunch, D., Mendonca, J., Colebatch, O., Allen, N. T., Blavier, J.-F., Kunz, K., Roche, S., Hedelius, J., Neufeld, G., Springett, S., Worthy, D., Kessler, R., and Strong, K.: TCCON data from East Trout Lake, SK (CA), Release GGG2020.R0, CaltechDATA [data set], https://doi.org/10.14291/tccon.ggg2020.easttroutlake01.R0, 2022.
Yoshida, Y., Ota, Y., Eguchi, N., Kikuchi, N., Nobuta, K., Tran, H., Morino, I., and Yokota, T.: Retrieval algorithm for CO2 and CH4 column abundances from short-wavelength infrared spectral observations by the Greenhouse gases observing satellite, Atmos. Meas. Tech., 4, 717–734, https://doi.org/10.5194/amt-4-717-2011, 2011.
Yoshida, Y., Someya, Y., Ohyama, H., Morino, I., Matsunaga, T., Deutscher, N. M., Griffith, D. W. T., Hase, F., Iraci, L. T., Kivi, R., Notholt, J., Pollard, D. F., Té, Y., Velazco, V. A., and Wunch, D.: Quality Evaluation of the Column-Averaged Dry Air Mole Fractions of Carbon Dioxide and Methane Observed by GOSAT and GOSAT-2, Sola, 19, 173–184, https://doi.org/10.2151/sola.2023-023, 2023.
Zhou, M., Dils, B., Wang, P., Detmers, R., Yoshida, Y., O'Dell, C. W., Feist, D. G., Velazco, V. A., Schneider, M., and De Mazière, M.: Validation of TANSO-FTS/GOSAT XCO2 and XCH4 glint mode retrievals using TCCON data from near-ocean sites, Atmos. Meas. Tech., 9, 1415–1430, https://doi.org/10.5194/amt-9-1415-2016, 2016.
Zhou, M., Wang, P., Kumps, N., Hermans, C., and Nan, W.: TCCON data from Xianghe, China, Release GGG2020.R0, Version R0, CaltechDATA [data set], https://doi.org/10.14291/tccon.ggg2020.xianghe01.R0, 2022.