
the Creative Commons Attribution 4.0 License.
the Creative Commons Attribution 4.0 License.
 | 27 Jul 2026
Five-channel TD-CEAS measurements of gaseous and particulate organic nitrates with NO ∕ NO2 interference correction under high-NOx conditions
Xiao Tian
Hongcheng Lu
Wei Song
Xue Yu
Organic nitrates (ONs) are important temporary reservoirs of atmospheric NOx and, for sufficiently low-volatility species, contributors to secondary organic aerosol formation. However, online measurements of particle-phase ONs remain limited, hindering quantitative constraints on ON abundance and gas–particle partitioning. Here we present a five-channel thermal dissociation cavity-enhanced absorption spectrometer (TD-CEAS) for in situ, time-resolved measurements of NO2 and operationally defined ON classes in both the gas and particle phases. The instrument combines a room-temperature channel for ambient NO2 with thermal dissociation channels operated at 250 and 450 °C to quantify total peroxy nitrates (ΣPNs) and total alkyl nitrates (ΣANs), respectively. Gas–particle separation is achieved using paired inlet/filter configurations, and gas- and particle-phase ΣPNs and ΣANs are retrieved by channel differencing. The 1σ (1 s) detection limits are 49 pptv for gΣPNs, 49 pptv for pΣPNs, 48 pptv for gΣANs, and 68 pptv for pΣANs. Laboratory characterization included temperature-dependent dissociation measurements, cross-validation of PAN against GC–ECD (R2 = 0.988; slope = 0.987), and an operational calibration for particulate ΣANs using 2-ethylhexyl nitrate (recovery slope = 1.036 ± 0.028; method detection limit = 0.029 µg NO2). Dedicated interference experiments showed that NO and NO2 can introduce substantial nonlinear biases in ΣPN measurements; these effects were parameterized using a multiple nonlinear regression model. The instrument was deployed at an urban site in Guangzhou during September–October 2025 and provided 6 min measurements of NO2, gas- and particle-phase ΣPNs, and gas- and particle-phase ΣANs under high-NOx conditions. During the October intensive period, corrected gas-phase ΣPNs covaried well with independently measured PAN (R2 = 0.83), and PAN accounted for 78 % of daytime gΣPNs. This five-channel TD-CEAS provides a framework for continuous observations of ON phase partitioning and reactive nitrogen processing in polluted urban atmospheres.
- Article
(2655 KB) - Full-text XML
-
Supplement
(879 KB) - BibTeX
- EndNote


Organic nitrates (ONs), defined here as organic compounds containing the –ONO2 functional group, are ubiquitous in the atmosphere. They are produced primarily during the oxidation of volatile organic compounds (VOCs) in the presence of NOx via daytime OH chemistry and nighttime NO3 chemistry. By temporarily sequestering NOx and subsequently releasing it through thermal decomposition, photolysis, and further oxidation (Kirchner et al., 1999; Neu et al., 2008; Zare et al., 2018), ONs act as both reservoirs and sinks of reactive nitrogen, thereby influencing ozone production and the redistribution of NOx on regional scales (Perring et al., 2013). In addition, many ONs are sufficiently low in volatility, or become so through continued oxidation and accretion, that they partition to the particle phase and contribute to secondary organic aerosol (SOA) formation (Atkinson, 2000; Rollins et al., 2012; Fisher et al., 2016; Day et al., 2022). Quantifying ON abundance and gas-particle partitioning is therefore important for constraining both reactive nitrogen budgets and coupled oxidant–aerosol chemistry.
Operationally, ONs are often grouped into peroxy nitrates (RO2NO2, ΣPNs) and alkyl nitrates (RONO2, ΣANs), which differ in formation pathways, thermal stability, and atmospheric lifetimes (Roberts, 1990). Acyl peroxy nitrates such as peroxyacetyl nitrate (PAN) and peroxypropionyl nitrate (PPN) are relatively thermally stable and can represent a substantial fraction of ΣPNs, whereas non-acyl peroxy nitrates such as HO2NO2 and CH3O2NO2 are much less stable under typical boundary-layer conditions (Murphy et al., 2004). ΣANs are produced in both OH- and NO3-initiated oxidation, with especially important contributions from nighttime NO3 chemistry and implications for SOA formation and reactive nitrogen cycling (Rollins et al., 2012; Perring et al., 2013; Kiendler-Scharr et al., 2016). The structural diversity, multifunctionality, and composition-dependent volatility of ONs make them challenging targets for comprehensive, in situ measurements, particularly when both gas- and particle-phase ONs are of interest.
Thermal dissociation (TD) coupled with fast NO2 detection has emerged as a practical approach for class-resolved ON measurements because the O–NO2 bond strengths differ between RO2NO2 and RONO2, enabling ΣPNs and ΣANs to be converted to NO2 at different temperatures (Roberts, 1990; Kirchner et al., 1999). Measurement techniques include laser-induced fluorescence (LIF) (Day et al., 2002), cavity ring-down spectrometry (CRDS) (Paul et al., 2009), chemical ionization mass spectrometry (CIMS) (Zheng et al., 2011), cavity attenuated phase shift spectrometry (CAPS) (Sadanaga et al., 2016), and cavity-enhanced absorption spectrometry (CEAS) (Li et al., 2021). These instruments have enabled sensitive measurements of gas-phase ON classes, and recent work has also extended TD-based approaches to the particle phase (Keehan et al., 2020). Nevertheless, online measurements of particle-phase ONs remain comparatively limited. In many studies, particle-phase ONs are inferred indirectly from aerosol mass spectrometry or derived from offline filter analysis, both of which have limitations in chemical specificity, time resolution, or operational simplicity (Yu et al., 2019; Chen et al., 2022). Extending TD-based measurements to particle-phase ONs requires careful inlet design, phase separation, and evaluation of potential sampling artifacts.
A central challenge in TD-based ΣPN measurements is that thermal dissociation of peroxy nitrates generates RO2 radicals, which can react with NO (positive bias) or recombine with NO2 (negative bias) (Day et al., 2002; Li et al., 2021; Lin et al., 2024). Regarding bias in NO2 measurements in the ANs channel, Sobanski et al. (2016) conducted a laboratory study on the transmission efficiency of NO2 in heated glass tubes equipped with filters and filled with glass beads, finding that NO2 losses in the 448 and 648 K channels were within 2 % and 5 %, respectively. Furthermore, Thieser et al. (2016) also noted that losses due to TD temperature settings and pipe wall effects are negligible. Therefore, NO2 transmission losses in the PNs/ANs channel are typically disregarded in both laboratory experiments and field deployments.
Several strategies have been proposed to reduce or correct these interferences. Hardware-based approaches include decreasing the residence time available for secondary chemistry by modifying inlet pressure or flow conditions (Day et al., 2002), adding downstream packing materials intended to remove radical intermediates (Sobanski et al., 2016; Dewald et al., 2021; Lin et al., 2024), or redesigning the dissociation channel and introducing O3 downstream so that NO is converted to NO2 and the instrument effectively measures NOx rather than NO2 alone (Friedrich et al., 2020; Gingerysty et al., 2021; Ohara et al., 2024; Wüst et al., 2025). Calibration-based approaches have also been used, in which known NO or NO2 perturbations are applied to PAN standard gas and the resulting deviations are represented as correction factors or lookup tables for ambient data processing (Li et al., 2021). These approaches have improved TD measurements substantially, but they also involve different trade-offs. NOx-based architectures can suppress part of the NO-mediated bias, but they require additional post-inlet conversion chemistry and careful control of ozone-derived interferences. Calibration-based approaches retain simpler hardware, but their validity depends on how well the laboratory source represents the inlet chemistry encountered in ambient air. The net bias depends on the chemical regime in the inlet and becomes particularly important under high-NO2 conditions, where NO and NO2 coexist in ambient air. In addition, PAN standards are commonly generated photochemically from acetone-containing systems, which may introduce excess peroxyacetyl radicals and other secondary products that complicate the interpretation of separate NO and NO2 addition experiments (Wüst et al., 2025). Inaccurate treatment of this interference can compromise quantitative ΣPN retrieval in polluted urban air. For that reason, the secondary inlet chemistry is modelled explicitly for some instruments in order to correct the data (Keehan et al., 2020; Sobanski et al., 2016; Taha et al., 2018; Thieser et al., 2016). In that case input of measured ambient NO, NO2 and uncorrected ANs/PNs is required in order to account for the simultaneous bias by NO and NO2 as well as the chemical regime and surface chemistry. In the present work, we retain a compact single-detector NO2-based architecture and evaluate whether a laboratory-constrained correction can make such a design operationally useful in high-NOx urban air.
These considerations are particularly important for multi-channel instruments designed to retrieve both gas- and particle-phase PNs and ANs. In such systems, a bias in the PN channel propagates directly into the derived gas-phase signal and can also affect the particle-phase product through channel differencing. A robust treatment of NO NO2-dependent interference is therefore essential not only for accurate ΣPN quantification, but also for reliable gas-particle partitioning in polluted environments. There remains controversy regarding the interference of NO and NO2 on the quantification of ANs, which is related to the standard sample systems employed in different studies. When experiments were conducted using pure standards as diffusion sources, no dependence of ANs on NO and NO2 was observed (Paul et al., 2009). In contrast, when NO and NO2 were added to ANs generated from the oxidation of VOCs by NO3 or OH, significant measurement biases were observed, accompanied by a broad thermal decomposition range (Dewald et al., 2021; Wüst et al., 2025). This discrepancy may be attributed to the formation of byproducts, such as peroxy nitrates, during the reaction process. Therefore, careful selection of the standard sample system and consideration of potential interference from byproducts are necessary when conducting experiments. At the same time, there remains a practical need for compact instruments that can measure ON classes in both phases using a single NO2 detector and a field-deployable inlet architecture.
In this work, we develop a five-channel thermal dissociation TD-CEAS that extends TD-CEAS for in situ measurements of gaseous and particulate ONs. The instrument combines a single CEAS NO2 detector with two TD setpoints (250 °C for ΣPNs and 450 °C for ΣANs) and paired filter configurations to retrieve gas- and particle-phase ΣPNs and ΣANs by channel differencing. Particular emphasis is placed on the characterization and correction of NO NO2-dependent interference in the ΣPN channels under high-NOx conditions. To this end, we perform dedicated laboratory experiments, develop a multiple nonlinear regression correction model for the combined effects of NO and NO2, and compare its performance with a previously reported lookup-table approach. We further characterize the instrument response, evaluate its precision and detection limits, and demonstrate its performance during an urban field deployment in Guangzhou. This study aims to provide both a practical measurement framework for continuous ON observations in gas and particle phases and a correction strategy for improving TD-based ΣPN measurements in chemically complex, high-NOx environments, enabling derivation of gas- and particle-phase ON classes by channel differencing.
2.1 Thermal dissociation (TD) inlets
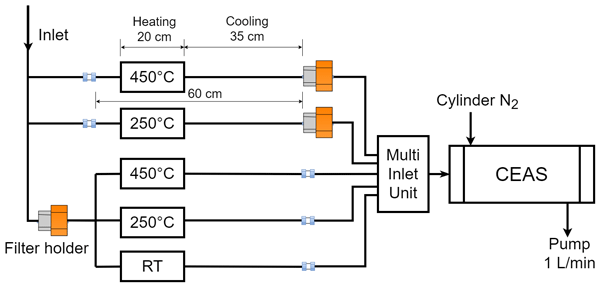
TD is implemented using heated quartz-tube reactors. Each TD inlet consists of a quartz tube (60 cm length; in. outer diameter; 3.9 mm inner diameter) wrapped with 20 cm Ni–Cr heating wire and insulated with thermal cotton to minimize heat loss. A K-type thermocouple positioned at the center of the heated region monitors the tube outer-wall temperature and is regulated by a temperature controller (stability ±2 °C). The thermocouple accuracy is ±1 °C over −20–1000 °C.
Sample air is delivered through in. PTFE tubing with PTFE straight/tee fittings (Swagelok). During operation, the sampling flow is 1 L min−1, corresponding to a residence time of 0.048 s in the heated region. This short residence time is designed to promote rapid dissociation of thermally labile ONs while minimizing post-dissociation chemistry within the heated section. Because the thermocouple measures the tube wall temperature rather than the gas temperature, the reported TD setpoints are expected to be higher than the corresponding gas temperature. Therefore, TD setpoints reported here should be interpreted as operational setpoints for this specific reactor design and are not necessarily directly comparable with other TD geometries.
2.2 CEAS NO2 spectrometer
Thermally generated NO2 is detected by CEAS near 405 nm. In CEAS, an optical cavity provides a long effective absorption pathlength through multiple reflections between high-reflectivity mirrors, enabling sensitive absorption-based NO2 measurements while retaining the selectivity of optical spectroscopy. NO2 has strong, structured absorption in the 405 nm region, allowing retrieval via spectral fitting. A single CEAS NO2 spectrometer is used for all five inlet channels. The CEAS instrument used here has been characterized previously (Zhou et al., 2022). In the present configuration, the CEAS reports NO2 mixing ratios for each channel segment, and all TD-derived quantities are obtained by differencing of channel measurements (Sect. 2.5).
2.3 Standards and laboratory generation
2.3.1 PAN (representative ΣPNs)
PAN is used as a representative PN for laboratory characterization of the PN channel. PAN is produced photochemically by UV photolysis (285 nm) of excess acetone in O2 to generate peroxyacetyl (PA) radicals, followed by reaction with NO (He et al., 2023). PAN mixing ratios are adjusted by varying the NO flow. PAN is quantified independently using a GC-ECD and is used for cross-validation of the TD-CEAS response.
2.3.2 Alkyl nitrates (representative ΣANs) and aerosol tests
Isobutyl nitrate and isopropyl nitrate (95 % purity, Macklin, China) are used as operational gas-phase AN standards to characterize the ΣAN channel temperature response. These standards are generated by dilution of their vapor into zero air following established approaches (Paul et al., 2009). They were selected because pure standards are commercially available and have been detected in the ambient (Zeng et al., 2018), but they are not intended to span the full thermal behavior of ambient multifunctional ANs.
For particle-phase tests, 2-ethylhexyl nitrate (2-EHN, Aladdin, China) solution is aerosolized to produce organic nitrate-containing particles, which are introduced into the TD-CEAS to evaluate particle-phase response and quantification. Because particulate inorganic nitrate may also generate NO2 upon heating, sodium nitrate aerosol is generated in a similar manner to characterize its temperature-dependent contribution and assess potential interference in the particle-phase channels.
Isopropyl nitrate and isobutyl nitrate were selected as benchmark compounds for this instrument test. While these compounds have been detected in the urban atmosphere (Zeng et al., 2018), we acknowledge that they do not necessarily represent the full composition of ambient alkyl nitrates, particularly in urban environments where isoprene- and aromatics-derived nitrates can be more important (Li et al., 2023). Our selection was instead based on their well-characterised thermal behaviour, commercial availability, and suitability for controlled laboratory experiments to characterise the instrumental response. We therefore use these compounds as operational standards for the present inlet design rather than as chemically comprehensive proxies for all ambient ANs.
2.4 Five-channel configuration, sampling sequence, and channel definitions
The five-channel TD-CEAS combines two TD temperatures (250 and 450 °C) with two filter placements (upstream versus downstream) to enable separation of gas and particle phases (Fig. 1). Ambient air is sampled through a PM2.5 cyclone prior to entering the inlet manifold. A multi-channel inlet selection unit sequentially routes each channel to the shared CEAS detector. When the multi-channel inlet unit is in operation, only the sample flow from the currently selected channel is allowed to enter the analyzer. Since there is a transition period during which the NO2 signal stabilizes after switching channels, the data from the first 15 s following the channel switch should be discarded, as shown in Fig. S2 in the Supplement.
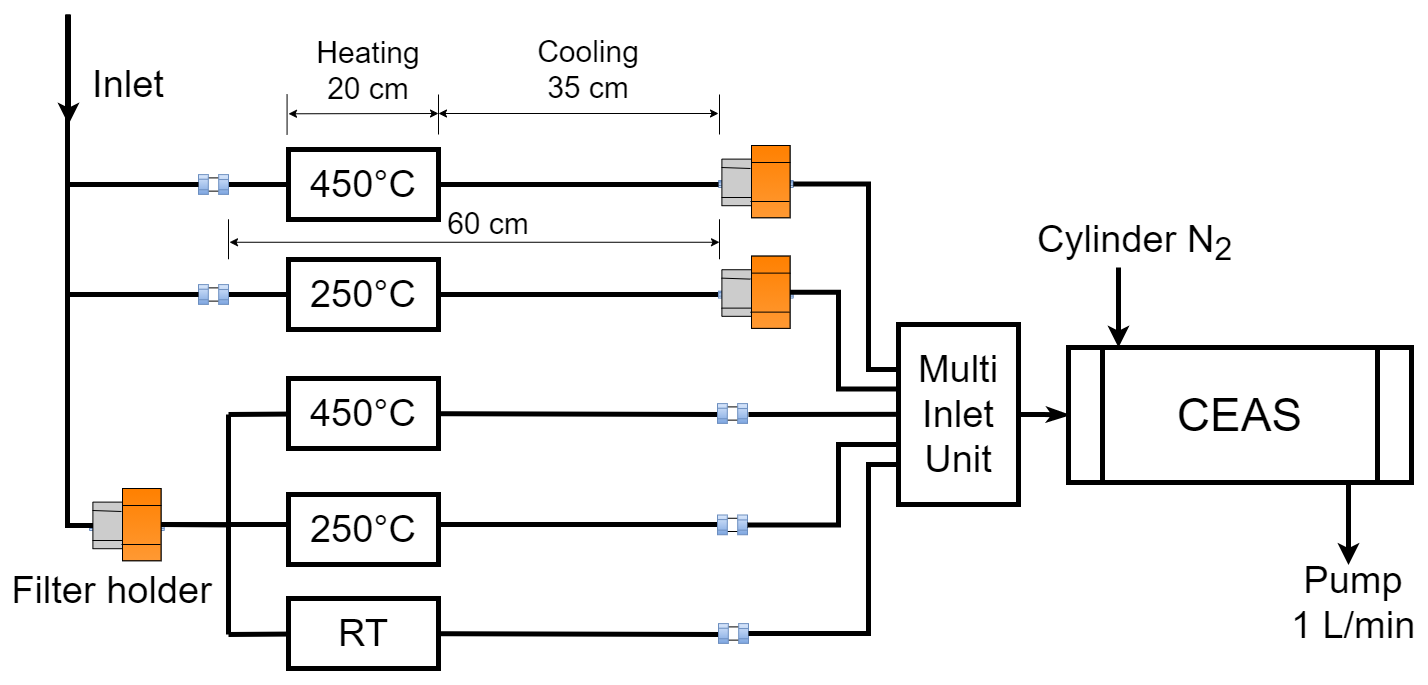
The instrument samples five channels plus an ultra-high-purity N2 reference segment. The ultra-high-purity N2 is supplied from cylinders and fed directly into the CEAS zero-air inlet, the N2 flow rate matches the sampling. Each channel is sampled for 1 min, followed by a 1 min N2 segment, yielding a 6 min measurement cycle. The N2 segment is used as a reference for instrument baseline and stability (Sect. 2.6).
We denote “F” as a particle filter placed upstream of the TD (gas-only enters TD), and “UF” as an inlet without an upstream filter (gas + particle enter TD), with a particle filter placed downstream of the TD reactor to prevent particles from entering the CEAS cavity. The filters are made of PTFE and has a diameter of 47 mm, with retention efficiency of 99.5 % or higher for 0.3 µm particles. The filter is replaced once a week during field campaigns, or earlier if the analyzer's flow rate decreases and in the event of air pollution. Table S1 summarizes the channel definitions and the corresponding quantities measured as NO2 mixing ratios by CEAS.
According to a study by Rollins et al. (2010), particulate transmission experiments using non-volatile NaCl particles revealed significant loss of small-particle-size (≤ 100 nm) particles, while the transmission efficiency for particles larger than 100 nm exceeded 85 % (represent a lower limit to the transmission and detection efficiency for semi volatile particles). As for volatile particles, they rapidly evaporate and thermally decompose into NO2 within the TD. In addition, Garner et al. (2020) performed a cross-validation of NaNO3 aerosols using TD-CRDS and SMPS; the correlation coefficient between NaNO3 and the NO2 produced by its quantitative conversion was 0.98 ± 0.03, which further demonstrates the high transmission efficiency of the particles. Although there may be transmission losses for small particles, these losses are generally acceptable. One line of evidence suggesting that wall losses of organic nitrates (ONs) are negligible is that the uncertainty in the recovery of 2-EHN is below 4 % (Fig. 4). This indicates that ANs rapidly decompose into NO2 during transport through the TD inlet, and that no significant back-reaction loss of RO radicals with NO2 occurs. Of course, for high-molecular-weight ONs, wall loss effects are largely dependent on compound volatility, tubing material, and temperature. In this study, we used PTFE tubing and ambient-temperature sampling to minimize such effects.
2.5 Retrieval of g/p ΣPNs and g/p ΣANs
For each 1 min segment, the CEAS reports an NO2 mixing ratio for the selected channel. Let CRTF, C250F, C450F, C250UF, and C450UF denote the NO2 mixing ratios (pptv or ppbv) measured by CEAS in the corresponding channels. Gas- and particle-phase ON classes are retrieved by channel differencing:
These expressions correspond to the field configuration in which the RT/250/450 channels are operated with upstream particle filtration for gas-phase retrieval, while paired 250/450 channels without upstream filtration (but with downstream particle removal) provide total (gas + particle) ON classes. Sobanski et al. (2016) noted that heated quartz tubes packed with frit and glass beads exhibit a small but significant loss of NO2, which may be attributed to the packing material increasing the collision area for NO2, resulting in a small loss of NO2. No NO2 transmission losses were observed in heated quartz tubes without packing material (Thieser et al., 2016; Lin et al., 2024).
Because channels are sampled sequentially, each derived quantity is timestamped at the midpoint of the corresponding 1 min segment. When longer averaging periods are applied (e.g., hourly means), within-cycle timing offsets are typically small compared with the averaging window.
2.6 Uncertainty propagation, detection limits, and reporting conventions
Detection limits are reported as 1σ precision inferred from Allan deviation analyses with ultra-high purity N2 continuously introduced to each channel. For the RT, 250, and 450 °C channels, the 1σ NO2 detection limits at 1 s integration are 34, 35, and 33 pptv, respectively; at 10 s integration they are 12, 13, and 12 pptv.
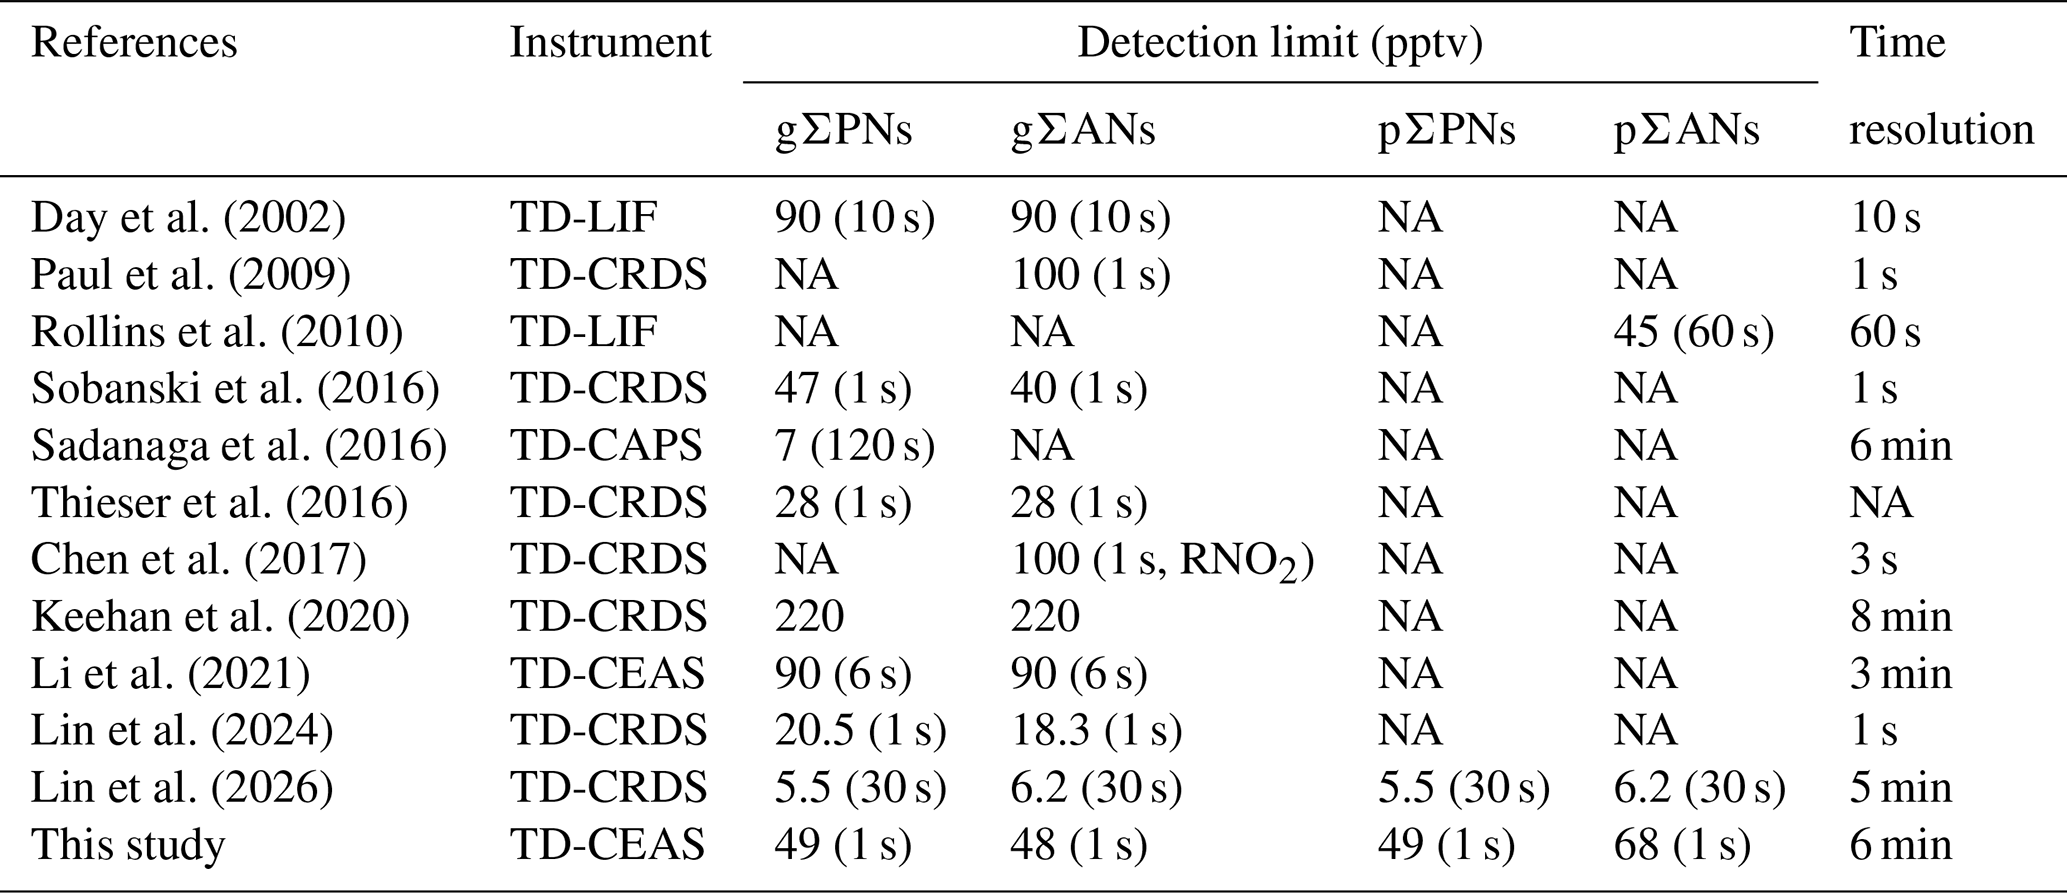
Table 1Summary of reported 1σ detection limits (pptv) for thermal-dissociation-based measurements of gΣPNs, pΣPNs, gΣANs and pΣANs from the literature and this study, with the integration time (s) indicated in parentheses. For this study, ΣPN and ΣAN detection limits are obtained by propagating Allan-deviation-derived NO2 precision through the channel-differencing retrieval. Reported detection limits as given in the cited studies. NA indicates not available. Time resolution refers to the time for all species to complete one cycle.
Derived ON quantities are calculated as differences between channels. Assuming independent noise among channel measurements, the uncertainty for a difference A−B is propagated as:
Using the 1 s NO2 precision for relevant channels, the resulting 1σ (1 s) detection limits for derived gas-phase ΣPNs and ΣANs are:
And for particle-phase ONs are:
These values correspond to the reported field-operation performance. Table 1 compares the detection limits of the present TD-CEAS with those reported for representative TD-based techniques. Overall, the detection limits achieved here are within the range of recent TD instruments, while the present configuration additionally enables sequential retrieval of gas- and particle-phase PNs and ANs using a single NO2 spectrometer. Because published detection limits are reported at different integration times and for different instrument configurations, the comparison is intended as a general benchmark rather than a strict ranking of sensitivity.
The uncertainty of the reported ONs classes includes detector calibration, channel differencing, and inlet-related artifacts. For the underlying NO2 measurement, the CEAS calibration uncertainty is approximately 6 % (Zhou et al., 2022), and the repeatability for continuous 10 ppbv NO2 passed through the TD-CEAS configuration is 1.4 %. These values describe instrumental accuracy and stability for simple NO2 inputs. They do not include composition-dependent TD chemistry, aerosol transmission losses, or the representativeness of surrogate standards, which may dominate the uncertainty of ambient ΣPN and ΣAN retrievals. Accordingly, the quantitative results reported below are best interpreted as operational ON measurements for the present inlet geometry and correction framework.
2.7 Box model
A zero-dimensional box model was implemented to reproduce the correction-factor lookup table reported by Li et al. (2021) and to compare that approach with the regression-based correction proposed in this study. The chemical mechanism followed previous work and was based on the Master Chemical Mechanism (MCM) v3.3. The wall loss rate constants for RO2, HO2, and OH radicals were set to 0.3, 0.5 and 5.4 s−1, respectively, following Fuchs et al. (2008), Wooldridge et al. (2010), Thieser et al. (2016), and Li et al. (2021). These values are used as ballpark and do not necessarily reflect the wall losses of the inlets since they vary with inlet geometry and operating conditions such as flow and temperature. The model was used only for method comparison and not for interpretation of ambient observations.
3.1 TD temperature selection and dissociation behavior
To define operational TD temperature for PNs and ANs, we measured temperature-dependent NO2 yields (“thermal decomposition profile”) for representative organic nitrates. PAN was used as a surrogate acyl peroxy nitrate, isopropyl nitrate and isobutyl nitrate were used as surrogate alkyl nitrates, and 2-ethylhexyl nitrate (2-EHN) aerosol was used as a surrogate particulate organic nitrate. Sodium nitrate aerosol was used to evaluate potential interference from particulate inorganic nitrate.
For each compound, the TD setpoint was stepped across the temperature range and the NO2 enhancement in the heated channel (relative to room temperature) was used to infer dissociation completeness. As shown in Fig. 2, PAN reaches a stable plateau in NO2 yield at temperatures above ∼ 250 °C, indicating near-complete conversion at and above this temperature. In contrast, isopropyl nitrate and isobutyl nitrate show minimal dissociation below 250 °C (< 10 % of the high-temperature plateau), increase sharply near ∼ 300 °C, and reach stable plateau by ∼ 350 °C. The particulate 2-EHN shows a similar trend, stabilizing near ∼ 400 °C. Particulate inorganic nitrate behaves differently: the NO2 yield remains < 10 % below 400 °C and does not reach a stable plateau until ∼ 750 °C, implying that particulate inorganic nitrate from NaNO3 contributes minimally to the NO2 signal at 450 °C for this TD geometry and residence time.
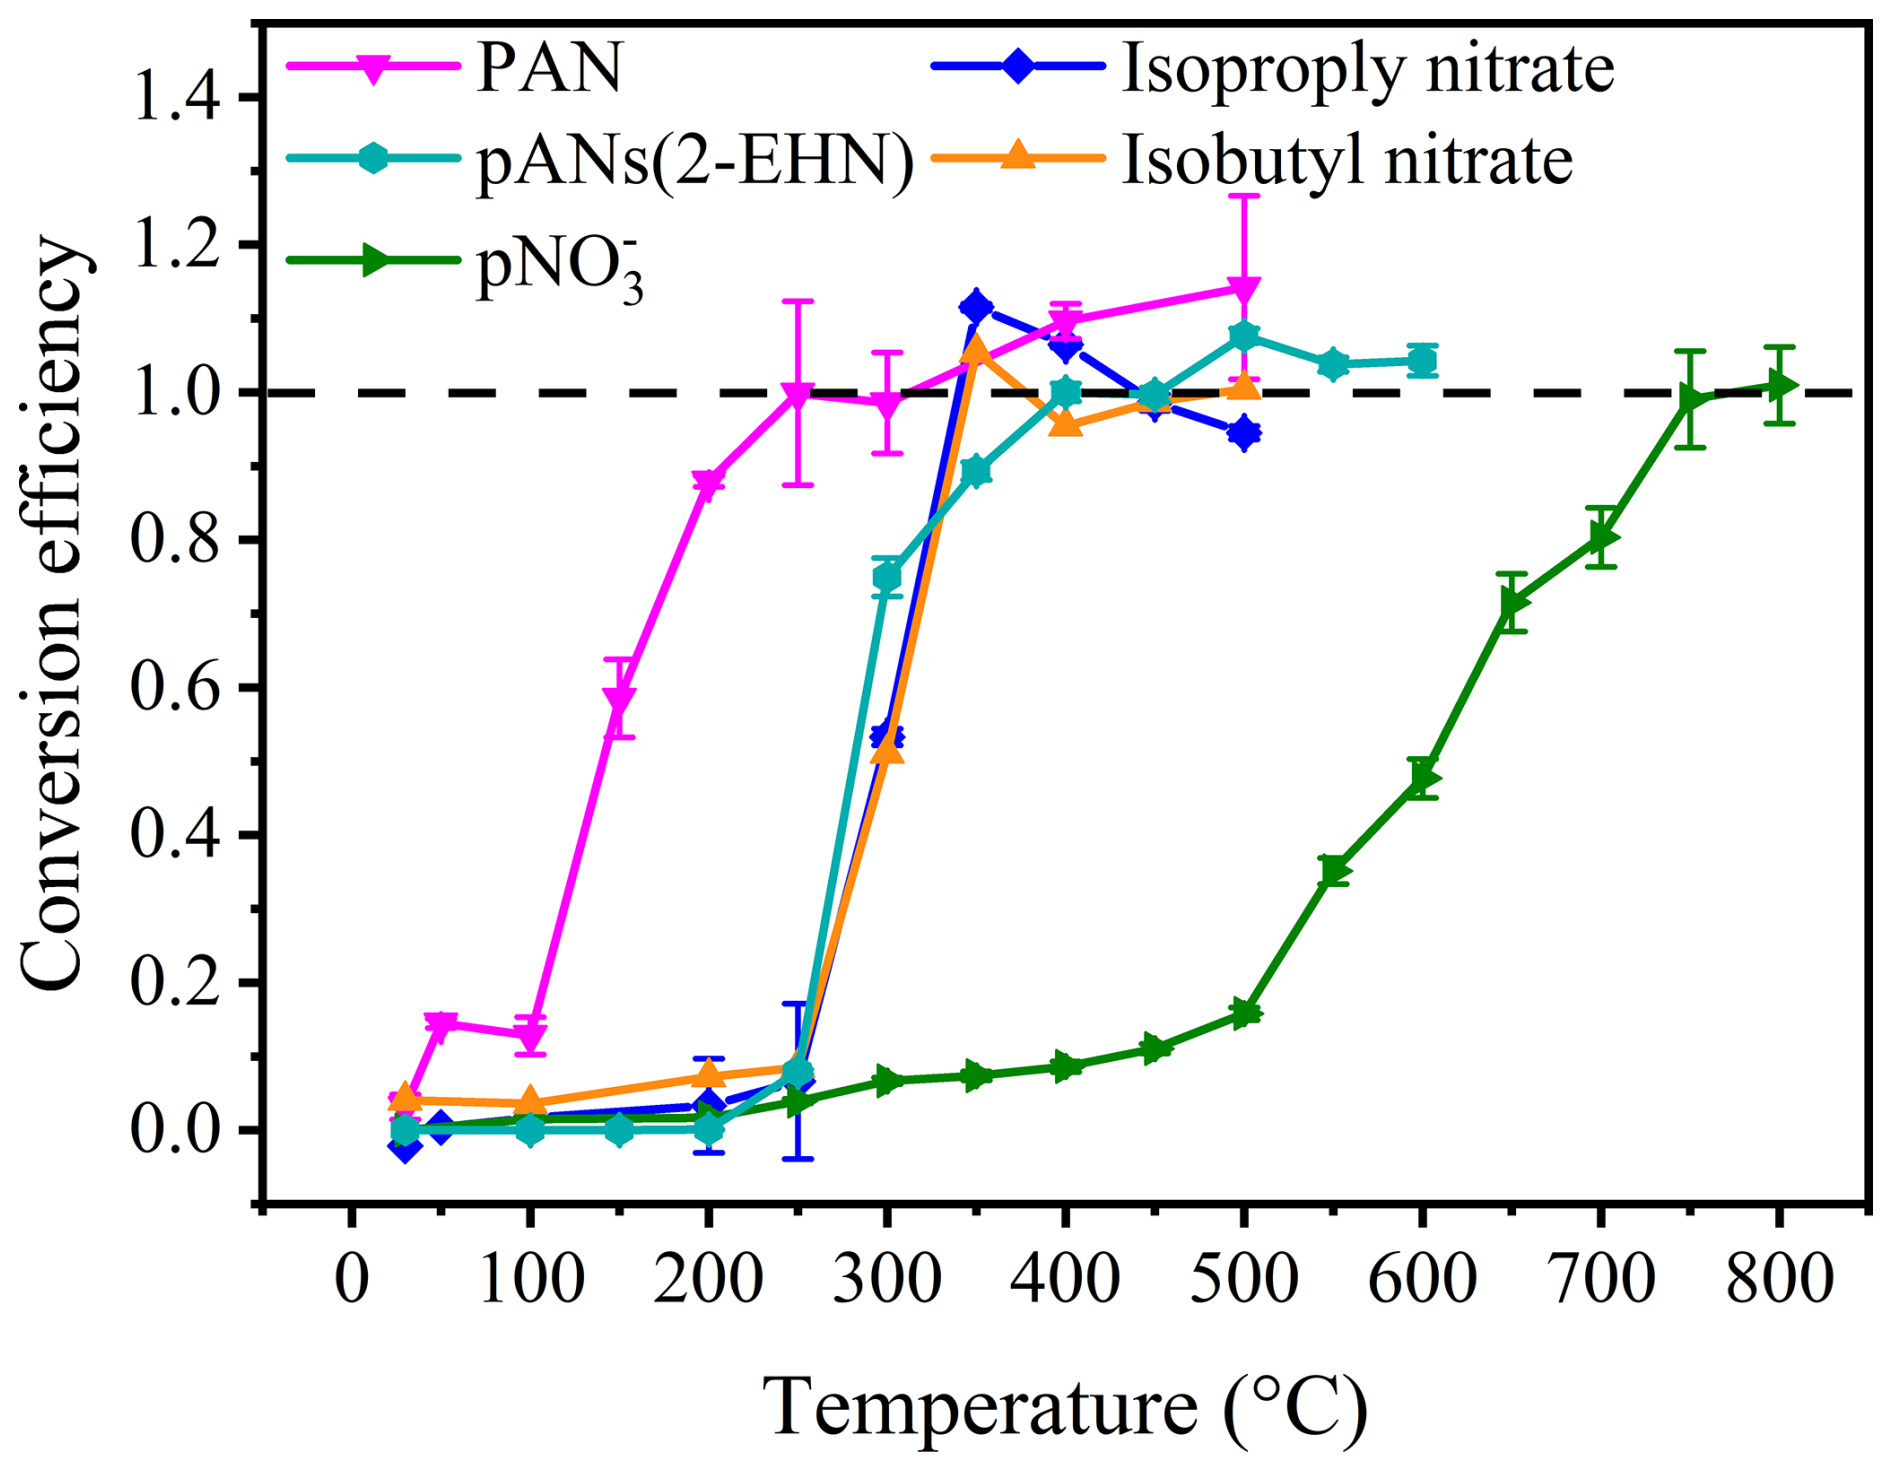
Figure 2Temperature-dependent thermal dissociation response (“thermal decomposition profile”) for representative organic nitrate standards and aerosol nitrate in the TD inlet. Shown are peroxyacetyl nitrate (PAN; proxy for ΣPNs), isopropyl nitrate and isobutyl nitrate (proxies for gas-phase ΣANs), particulate 2-ethylhexyl nitrate (2-EHN; proxy for particle-phase organic nitrates), and particulate inorganic nitrate (pNO, generated from NaNO3 aerosol). The conversion efficiency (unitless) is calculated as the NO2 yield at each setpoint normalized to the high-temperature plateau for each compound; the dashed line denotes unity (complete conversion). Error bars indicate ±1σ from replicate measurements. Temperature refers to the TD tube wall temperature at the thermocouple location.
Based on these measured thermal decomposition profiles, we selected 250 °C as the operational setpoint for ΣPNs and 450 °C as the operational setpoint for ΣANs. These setpoints are specific to the present TD reactor design (Sect. 2.1) and correspond to wall temperatures measured at the tube exterior. Because they were derived from surrogate standards, they should not be interpreted as compound-independent thresholds for all ambient ONs; in particular, partial dissociation of some multifunctional ANs in the lower temperature channel cannot be excluded (Dewald et al., 2021).
3.2 Calibration and quantitative performance
3.2.1 PAN calibration and GC-ECD cross-validation
PAN was generated using the photochemical source described in Sect. 2.3.1 and quantified independently by GC–ECD (Zhang et al., 2012). Over 0–20 ppb supplied NO, the relationship between NO input and generated PAN indicates stable PAN production with an average conversion efficiency of ∼ 84 % (R2 = 0.99). PAN derived from the TD-CEAS channel agrees closely with GC-ECD (R2 = 0.988; slope = 0.987; Fig. 3) from clean background (e.g., PAN < 1 ppbv) to heavily polluted conditions (e.g., PAN > 10 ppbv). This agreement supports quantitative retrieval of ΣPNs for representative acyl peroxy nitrates under the tested conditions. The slope in Fig. 3 reflects the difference in detection limits between TD-CEAS and GC-ECD. Owing to its higher measurement accuracy and sensitivity, CEAS is able to resolve the differences between channels at low concentrations.
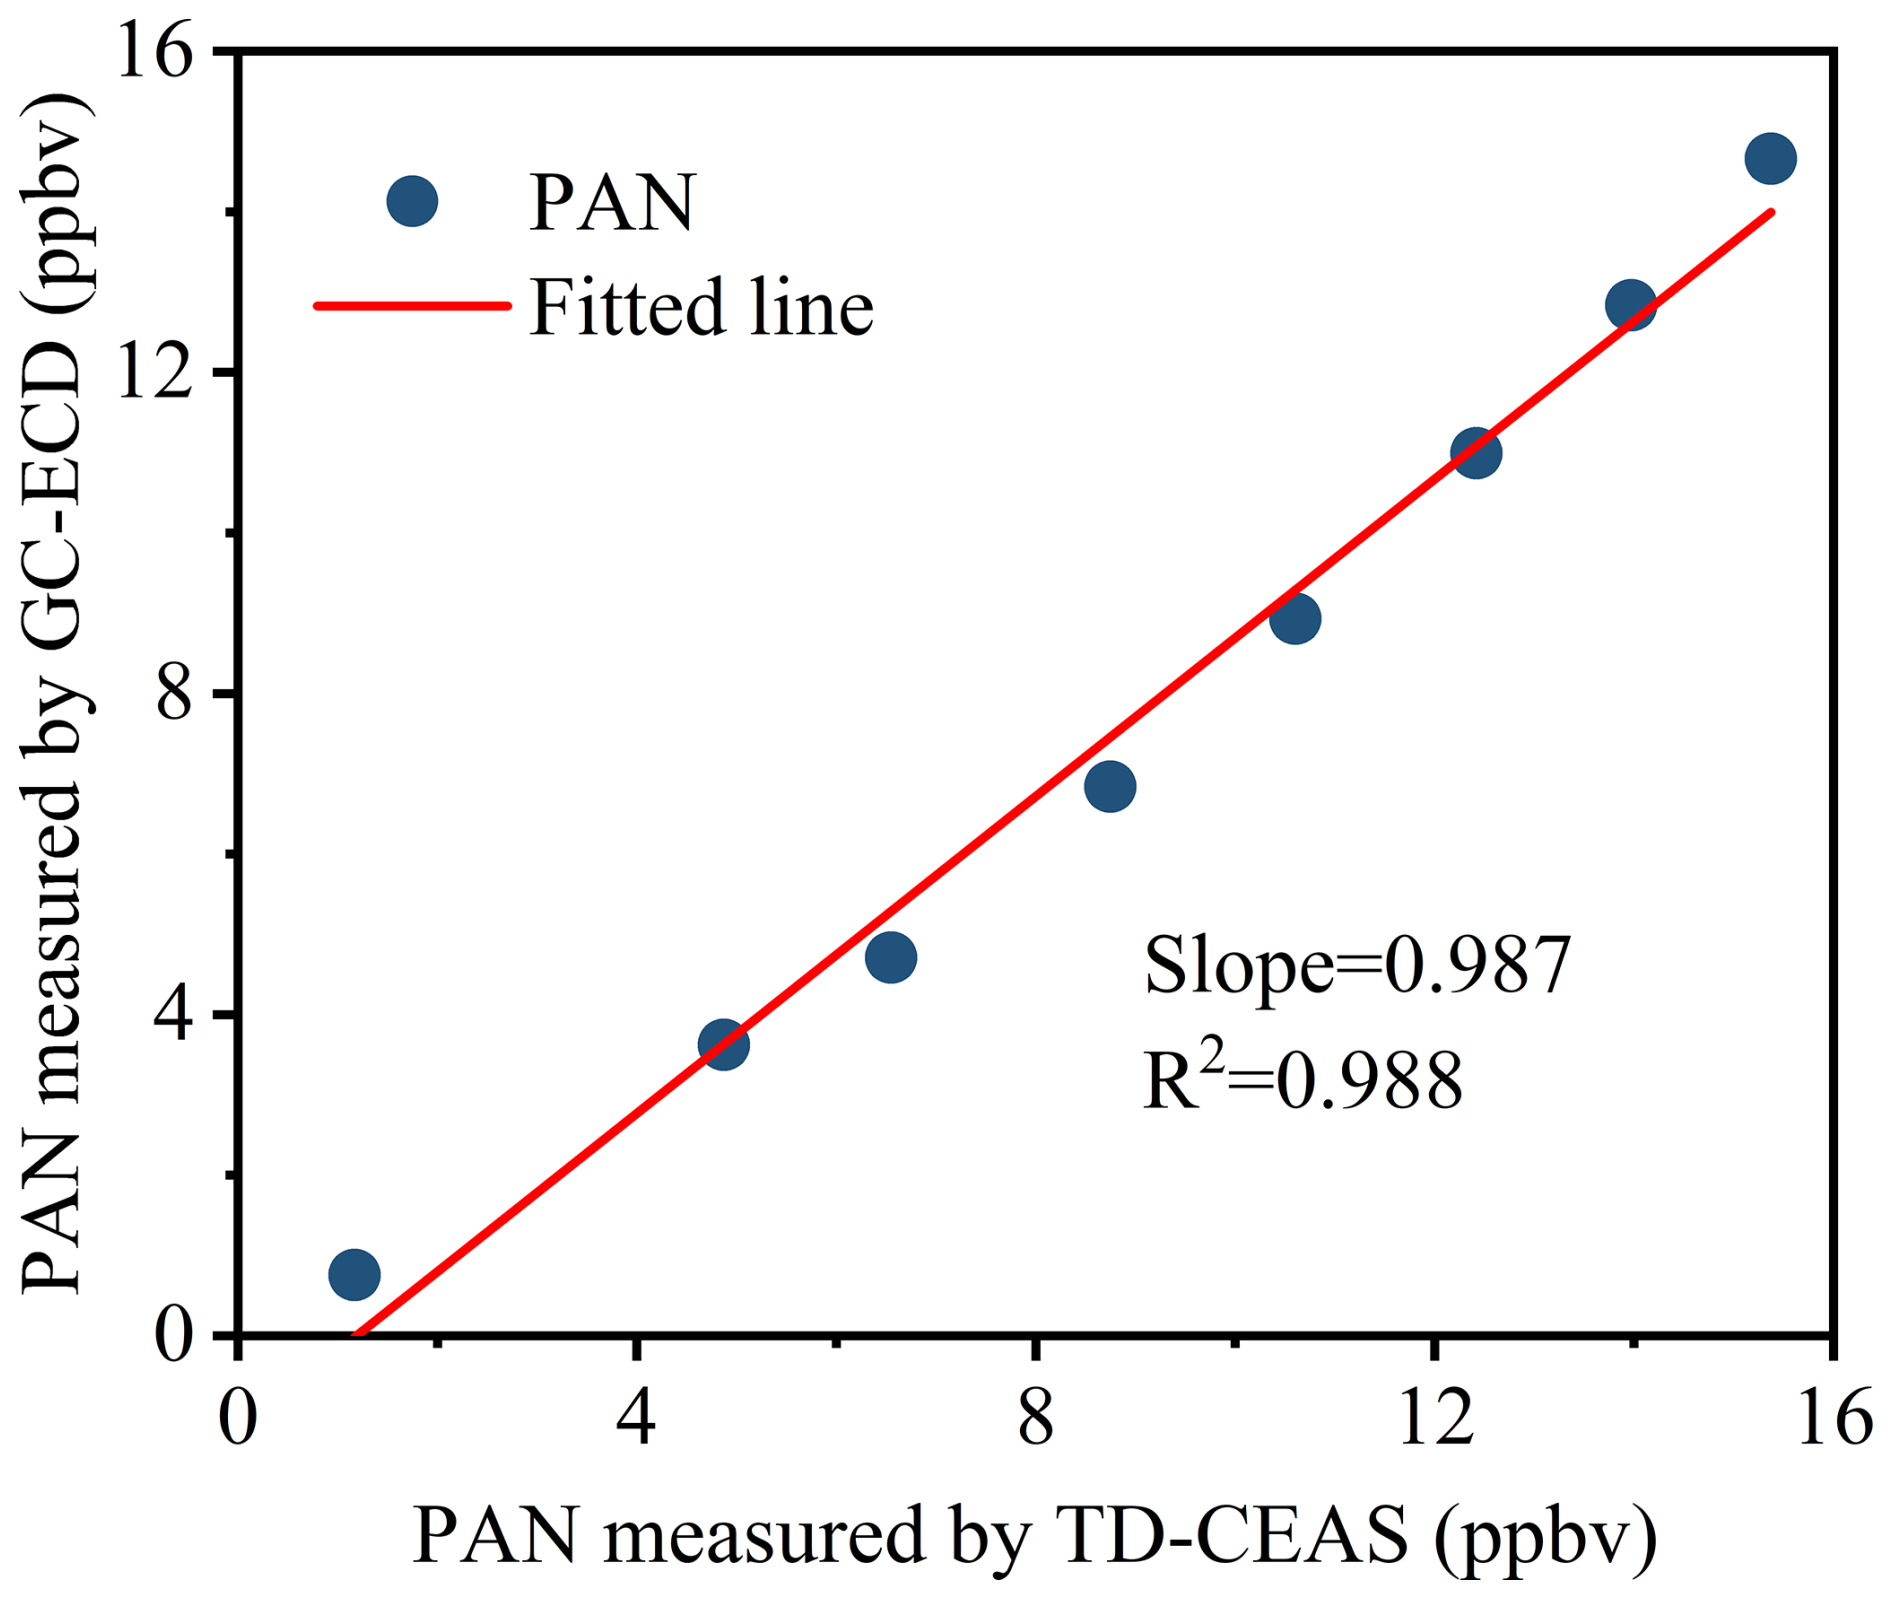
Figure 3Cross-validation of PAN measured TD-CEAS against an independent gas chromatography–electron capture detector (GC–ECD) measurement. PAN (TD) is derived from the TD-CEAS 250 °C channel after subtraction of the room-temperature NO2 channel. The red line shows a least-squares linear regression; the slope and coefficient of determination (R2) are reported in the panel.
3.2.2 Particle-phase ΣAN calibration via filter thermolysis of 2-EHN
Because stable gas-phase ANs standards at known mixing ratios were not available in our setup, we established an operational particulate ΣANs calibration using filter thermolysis of 2-EHN (Yu et al., 2021). A known volume of 2-EHN solution was injected onto a pre-baked quartz filter (0.5 cm2; baked at 450 °C for 4 h) placed inside a quartz TD tube held at 450 °C. A second 450 °C TD stage was installed downstream to promote complete conversion prior to NO2 detection. The resulting NO2 signal was measured by CEAS in dry, clean air.
This calibration was conducted through the complete heated inlet configuration rather than by direct injection into the optical cell, so it reflects the integrated response of the present inlet-plus-detector system. It should therefore be viewed as an operational calibration for this configuration, not as an absolute molecular sensitivity applicable to all particulate ANs compositions.
The recovered NO2 mass from each injection was calculated by integrating the NO2 time series:
where [NO2]i is the NO2 mixing ratio in ppb at time step i, is the molar mass of NO2 (g mol−1), Q is the CEAS sampling flow (16.67 mL s−1), Δt = 1 s, and Vm = 24.5 L mol−1 at 25 °C and 101 kPa. The 106 factor converts ppbv and flow units to mass in µg.
Seven blank-filter runs were used to determine method detection limit of 0.029 µg NO2. 2-EHN calibration using five injection volumes (1, 2, 5, 8, 10 µL) shows excellent linearity (R2 = 0.99; Fig. 4). The recovery regression slope is 1.036 ± 0.028 with a small intercept (−0.020 ± 0.046), indicating quantitative recovery for this surrogate particulate ΣAN standard under the calibration conditions. It is important to note that we conducted the experiments using the complete sampling system and subtracted the blank from the results.
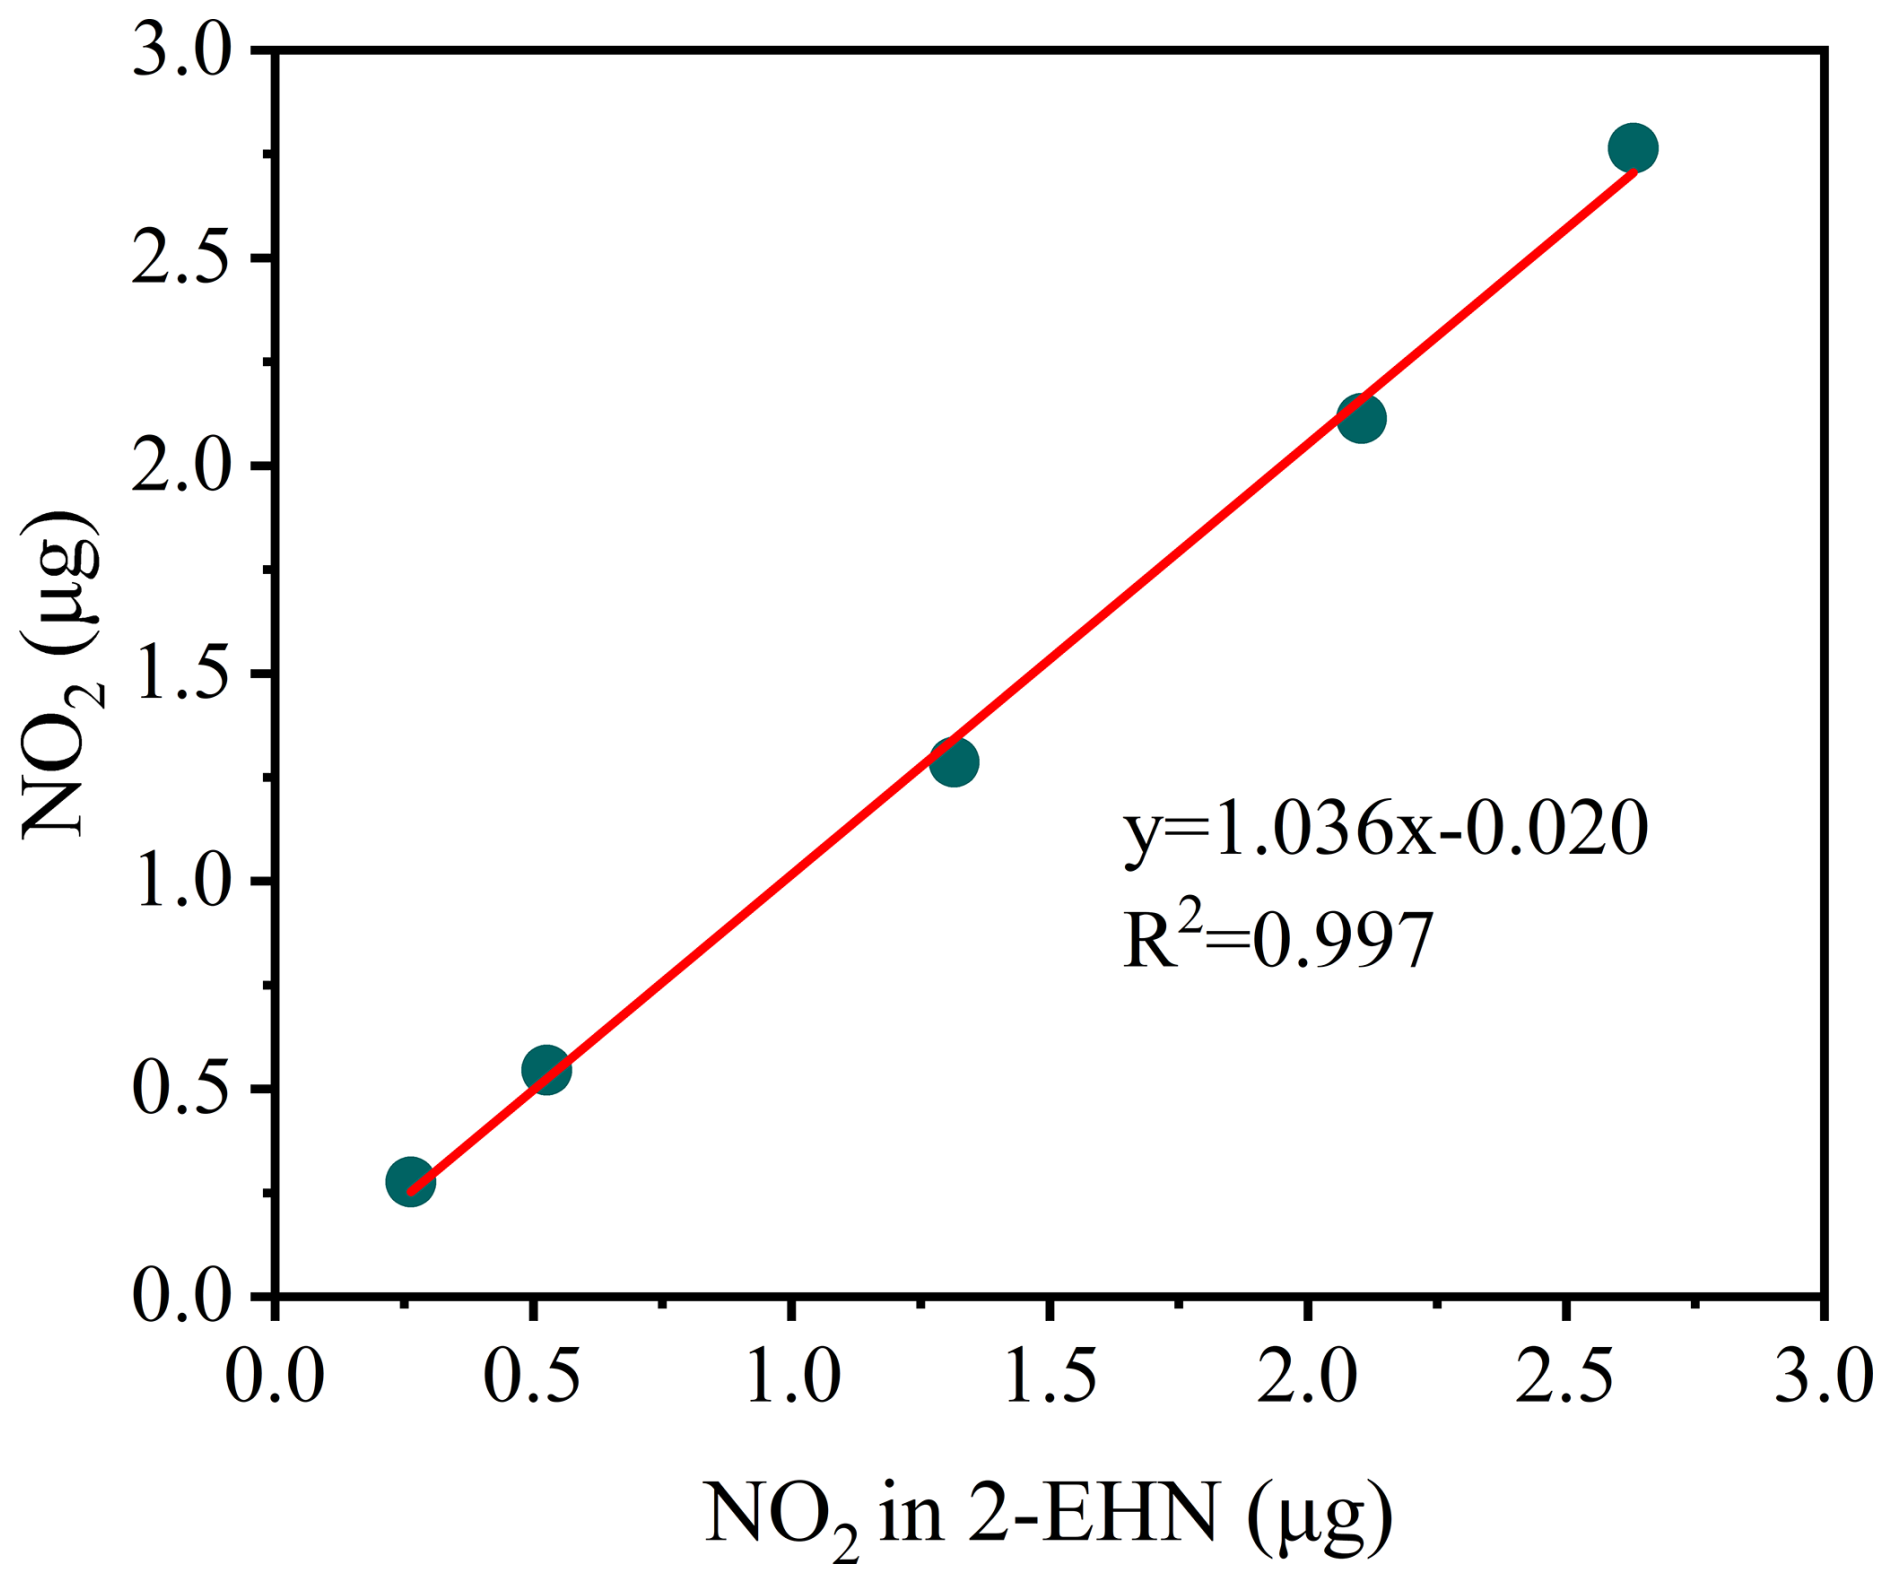
Figure 4Calibration of particulate AN response using filter thermolysis of 2-ethylhexyl nitrate (2-EHN). The recovered NO2 mass (integrated CEAS signal) is plotted as a function of the expected NO2 mass associated with the injected 2-EHN amount. The red line denotes a linear regression; the fit equation and R2 are given in the panel.
3.3 Interferences and correction strategies
3.3.1 NO and NO2 interferences on ΣPNs
Thermal dissociation of ΣPNs produces RO2 radicals that can participate in rapid secondary chemistry within the heated inlet. In the presence of NO2, these radicals can recombine to re-form peroxy nitrates and bias ΣPNs low. In the presence of NO, they can convert NO to NO2 and bias ΣPNs high (Day et al., 2002; Sobanski et al., 2016; Li et al., 2021; Lin et al., 2024). These competing pathways are expected to be especially important under high-NOx conditions, where NO and NO2 coexist at elevated concentrations and the competing reactions take place in parallel.
To characterize these effects for the present TD geometry, we conducted laboratory interference experiments using PAN as a representative acyl peroxy species. As described in Sect. S1, PAN was generated photochemically in an acetone/air system while the NO input was progressively increased. PAN was measured by GC-ECD, NO and NO2 was measured by a Thermo Scientific 42i-TL analyzer, and ΣPNs and ΣANs were measured by TD-CEAS. This configuration enabled direct comparison between the reference PAN concentration and the uncorrected TD-CEAS ΣPNs signal over a range of NO NO2 regimes.
During the gradient experiments, the acetone concentration was held constant and only the NO input was varied. At acetone-rich, low-NO conditions, most added NO was converted to NO2, which promoted PAN formation. Under these conditions, the measured PN signal was biased low because of excess peroxyacetyl (PA) radicals, together with PA radicals produced by PAN dissociation in the TD inlet, could recombine with NO2 downstream of the heated section. As the NO mixing ratio increased, PAN formation was increasingly suppressed, while PA radicals generated by PAN dissociation reacted increasingly with NO to form additional NO2, causing the measured PNs signal to become biased high. These experiments therefore show that both the sign and the magnitude of the bias are governed by the chemical regime in the inlet rather than by NO or NO2 alone.
To account for the combined effects of NO and NO2, we developed a multiple nonlinear regression model based on the experimental dataset. Because temperature was held constant in these experiments and PAN formation and dissociation are closely related to the NO NO2 ratio (Zhang et al., 2015), the NO NO2 ratio was used as the explanatory variable to represent the relevant chemical regime:
where [PNs]real is the PAN reference concentration measured by GC-ECD, [PNs]meas is the uncorrected TD-CEAS concentration, and [NO] and [NO2] are expressed in ppbv. The a, b, and c are the fitting coefficients, with values of 1.57, −3.44, and 0.58 respectively.
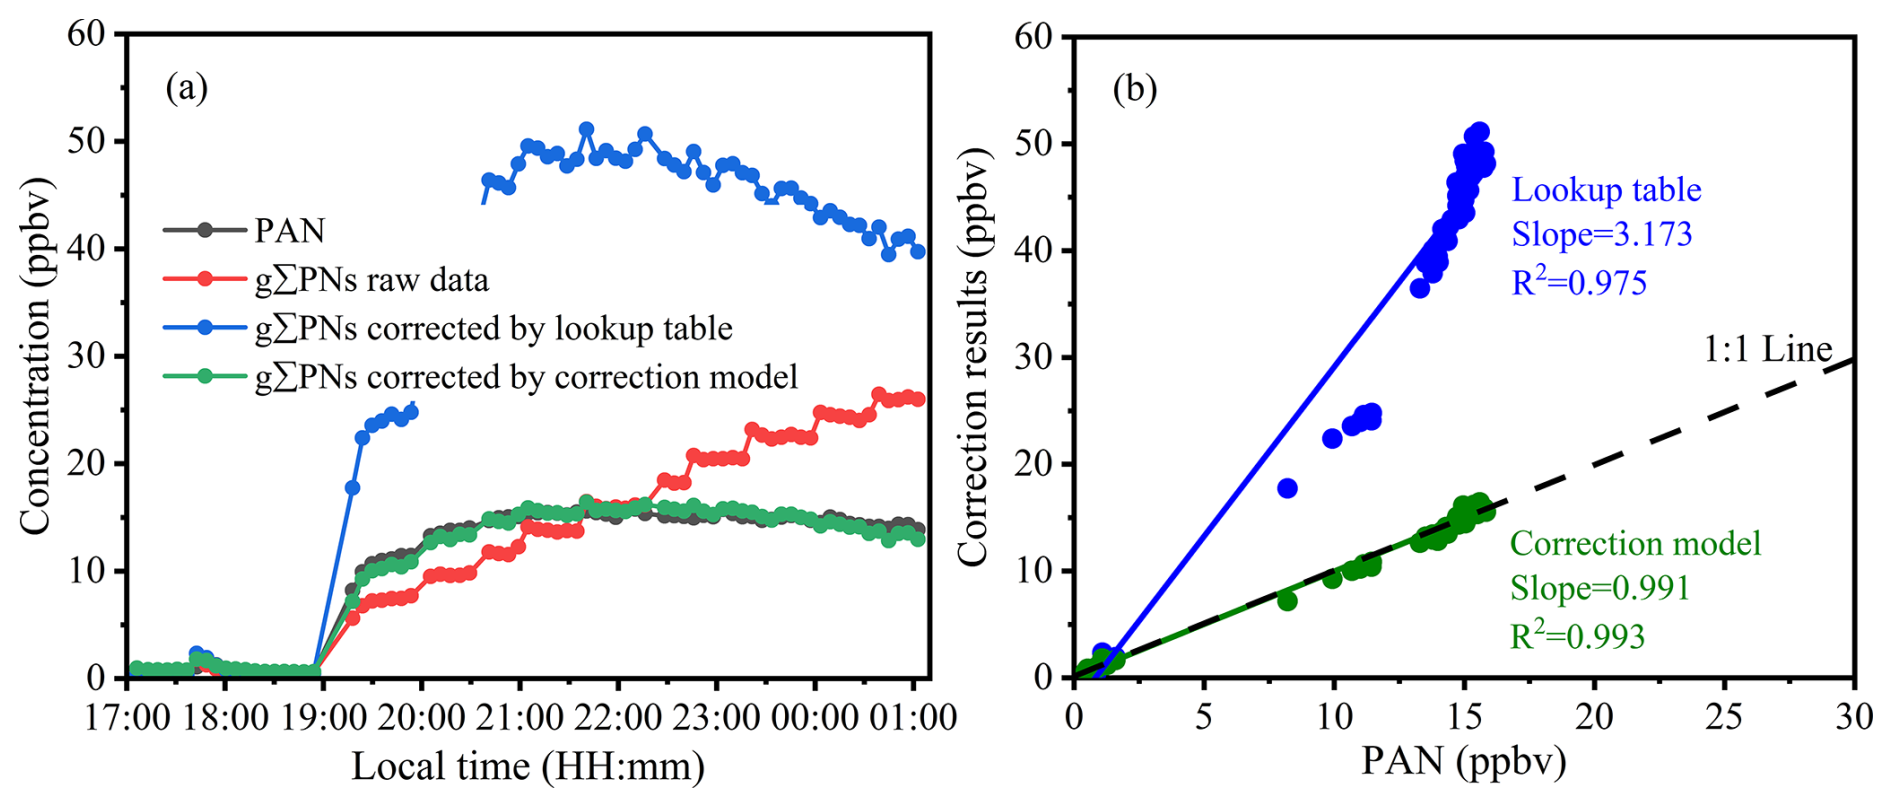
Figure 5(a) The measured PAN and gPNs alongside the correction PNs by lookup table and correction model, (b) linear fit of correction results of lookup table and correction model with measured PAN. PAN is measured by GC-ECD, and gPNs is measured by TD-CEAS through the difference subtraction method.
For comparison, we also reproduced the correction-factor lookup-table correction approach of Li et al. (2021) using the box model configuration described in Sect. 2.7. Figure 5 compares corrected PNs values obtained with the two approaches against the reference PAN measurements with GC-ECD. The multiple nonlinear regression model reproduced the reference PAN vales well (R2 = 0.993; RMSE = 0.49 ppbv) across both low and high PAN ranges. By comparison, the reproduced lookup-table approach did not perform well across the entire concentration range, despite an overall correlation of 0.975 (R2), the method increasingly overestimated PAN, especially under high-NOx conditions. The corresponding evaluation metrics for both methods are summarized in Table S2. Relative to the lookup-table method, the regression model provides a more compact correction framework and better captures the coupled effects of NO and NO2 across the experimental range. In addition, we compared the performance of the two calibration methods on field observation data, as shown in Fig. S7. As can be seen, regardless of whether the PAN concentration is low or high, the lookup table calibration results significantly overestimate.
In this experiment, the lookup table correction for PAN resulted in substantial overestimation. This is because the lookup table was constructed by simply combining experimental data from Box model simulations that had been validated separately for experiments with NO or NO2 addition. Consequently, this approach does not account for the combined bias arising from the simultaneous presence of NO and NO2. The experimental results of Li et al. (2021) further indicate that the positive measurement bias induced by NO addition is considerably larger than the negative bias induced by NO2 addition. Therefore, the lookup table method introduces significant uncertainty under high NOx conditions.
To further assess robustness, replicate experiments were performed under otherwise identical conditions but with a series of NO concentrations. As shown in Fig. S5, the corrected PNs agreed well with the measured PAN, with correlation coefficient of 0.98 and slopes of 1.06, indicating that the regression-based correction was reproducible across independent experiments.
In terms of proportion, PAN accounts for more than 70 % of ΣPNs (Wooldridge et al., 2010). However, ΣPNs also include PPN, MPAN, and non-acyl peroxynitrates. Given their similar pyrolysis characteristics, these species can be measured separately. Moreover, their pyrolysis products (RO2) exhibit comparable chemical properties, so they are typically treated as a single class of compounds for experimental analysis and discussion. In this experiment, the NO NO2 ratio ranged from 0.044 to 2.015; in validation tests, it ranged from 0.040 to 0.246; and in the real atmosphere, it ranged from 0.021 to 0.607 (see Sect. 4). Thus, the measured ratios essentially cover the NO NO2 ratios encountered under various conditions.
Previous studies have reported the presence of alkyl nitrates and other by-products in photochemical PAN sources (Paul et al., 2009; Wüst et al., 2025), consistent with the ANs signal observed in the 450 °C channel during these experiments (Fig. S4). The key point for the present instrument is that the source-related perturbation varied only weakly with the NO and NO2 and was present in both heated channels. We therefore treated the residual 450–250 signal as the best available operational ANs estimate for this configuration, while explicitly acknowledging that composition-dependent AN biases may remain. During field observations, the correction model was applied only to the 250 °C channel measurements using simultaneously measured NO and NO2, and the corrected 250 °C data were then used to derive ΣPNs.
The ozone-supplemented method has been successfully applied in several studies (e.g., Friedrich et al., 2020; Wüst et al., 2025; Shao et al., 2026; Wild et al., 2014), yielding satisfactory results. We do not regard these NOx-based designs as inferior; rather, they represent a different instrument trade-off, by carefully optimizing the concentration of the ozone-supplemented, the formation of NO3 and N2O5 can be avoided. Although ozone exhibits weak absorption at 405 nm (Wild et al., 2014), this background absorption cancels out in differential measurements because an O3 flow is continuously injected during both zeroing and sampling; therefore, no additional correction is required (Wüst et al., 2025). In the present study, we retained a single-cavity NO2-based architecture because it keeps the five-channel system compact and avoids adding post-inlet conversion chemistry to every channel. This choice requires an explicit correction for coupled NO NO2 effects. The regression approach proposed here is therefore intended as a practical correction strategy for a compact NO2-based instrument, whereas NOx-based architectures remain attractive when the highest possible suppression of compound-specific inlet chemistry is the overriding priority.
3.3.2 NO and NO2 interferences on ΣANs
Previous studies reported only weak PAN interference in the ΣANs channel when radical-scavenging packing materials (glass beads and glass fiber filters) are used (Sobanski et al., 2016). In our unpacked quartz configuration, Fig. S4 should be interpreted primarily as a diagnostic of common-mode source artifacts and relative channel behavior rather than as a clean quantification of PAN chemistry in the 450 °C channel. The NO2 signal observed in the ΣANs channel follows the same general NO-dependent trend as in the ΣPNs channel, while the offset between channels is likely influenced by secondary products from the photochemical PAN source (Li et al., 2021). This behaviour indicates that much of the PAN-source interference is shared by both heated channels and is therefore reduced by 450–250 channel differencing, but it does not exclude compound-specific biases for atmospherically relevant multifunctional ANs.
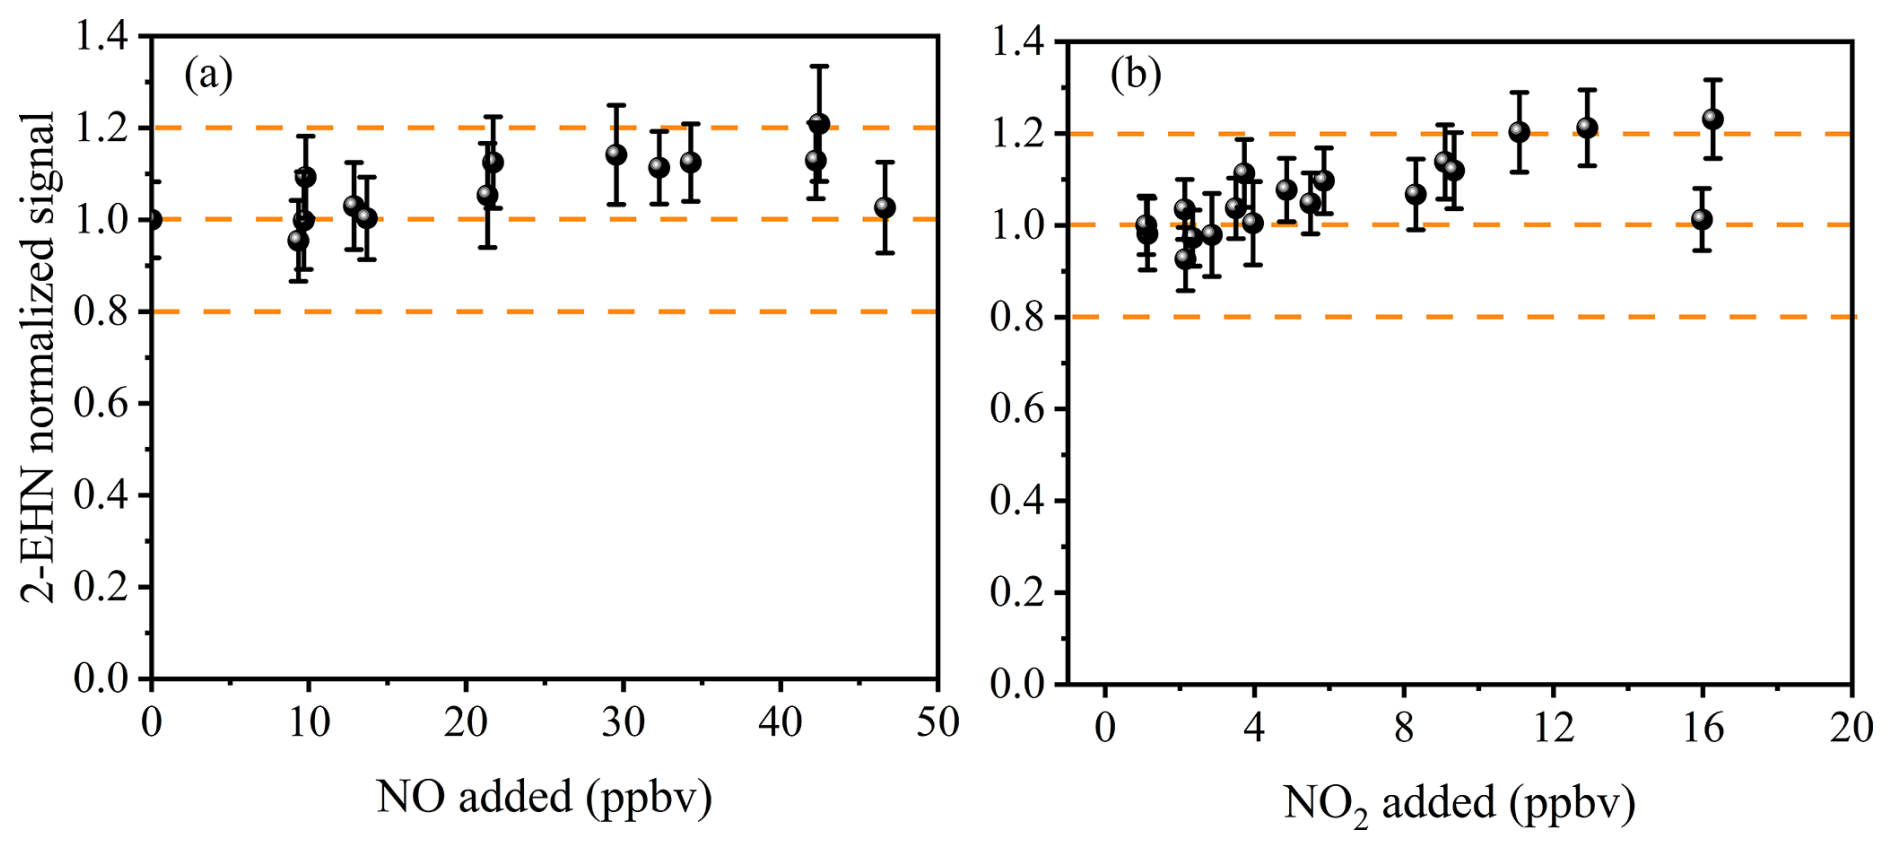
Figure 62-EHN normalized signal at ΣANs channel with (a) NO added, and (b) NO2 added. The error bars represent 1σ standard deviation. In the NO and NO2 addition experiments, the initial concentrations of 2-EHN were 37.4 and 56.1 ppbv, respectively.
To further verify the effect of NOx on ΣANs measurements, this study conducted experiments involving the addition of NO and NO2 using a 2-EHN diffusion source. The results are shown in Fig. 6 and show no systematic monotonic dependence on the added NO or NO2. Across the tested range, the normalized 2-EHN response varied by less than 20 %, and the remaining scatter is consistent with the stability of the diffusion source and flow control. We therefore did not introduce an additional empirical AN correction term for the present field dataset. Instead, ΣANs is reported as an operational quantity derived from 450–250 channel differencing. This conclusion is supported for 2-EHN under our test conditions, but it should not be generalized to all ambient multifunctional ANs without further validation.
We acknowledge that 2-EHN provides a useful operational benchmark for instrument calibration. However, ambient organic nitrates comprise a diverse suite of multifunctional species, including nitrates derived from isoprene, monoterpenes, and aromatics. These compounds may differ in thermal dissociation behaviour and in their susceptibility to NOx-related interference. The marginal NOx effect observed for 2-EHN under the tested conditions is consistent with the broader finding of Wüst et al. (2025) that NO-dependent inlet responses can be compound specific. It should therefore not be taken to imply comparable performance across all classes of organic nitrates. Future work should extend this characterization to multifunctional surrogates to better constrain the instrument response under atmospherically relevant conditions.
3.3.3 O3 interference
O3 thermally dissociates at elevated temperatures (> 330 °C), producing O atoms that can perturb the NO NO2 partitioning in the heated region. Prior laboratory studies indicate that even high O3 (200–240 ppb) mixed with 25.1 ppb NO2 results in only ∼ 3.5 % NO2 loss at 600 °C, and no significant NO2 bias is observed across typical O3 levels in comparable TD systems (Day et al., 2002). Kinetic estimates under representative polluted conditions (e.g., O3 100 ppb, NO 2 ppb, NO2 5 ppb) suggest that O3-related NO2 perturbations in heated channels are within ∼ 3 %, smaller than the overall measurement uncertainty. The experiment further demonstrated that variations in the amounts of introduced NO2 and O3 did not produce significant differences in NO2 concentrations across the different measurement channels (Li et al., 2021). On this basis, O3 interference is neglected for the present analysis.
3.3.4 Other interferences (nitro-aromatics, ClNO2, N2O5, HONO, HNO3, NH4NO3)
Nitro-aromatics and nitrophenols can potentially generate NO2 upon heating. To evaluate this potential interference in the AN channel, we tested 3-nitrophenol and 1-nitropyrene (1 mg mL−1; 1 µL injection) at 450 °C. The integrated NO2 masses were below the detection limit, suggesting negligible interference for ΣANs under these test conditions.
Reactive nitrogen species such as ClNO2 and N2O5 can thermally dissociate near the chosen TD temperatures (∼ 450 and ∼ 210 °C, respectively), which could bias gas-phase ΣANs and ΣPNs at night (Thaler et al., 2011; Sobanski et al., 2016). Because these species are largely nocturnal and photolyze rapidly after sunrise, daytime gas-phase ON retrievals are expected to be less affected (Li et al., 2021). Ambient concentrations of N2O5 and ClNO2 exhibit substantial variability depending on atmospheric conditions. According to the literature, N2O5 concentrations in urban environments typically range from 0.1 to 1 ppbv, with occasional peaks reaching several ppbv (Wang et al., 2017). ClNO2 concentrations are generally lower, typically ranging from tens of pptv to several ppbv, i.e., 0.1–0.5 ppbv (Mielke et al., 2011; Riedel et al., 2014). Consequently, considerable uncertainty exists in the nighttime measurement of gaseous ΣANs and ΣPNs, and such interferences are difficult to quantify due to the variability of ambient conditions. Li et al. (2021) refrained from analyzing nighttime measurements because of these interferences. In contrast, in this study, the nighttime observational datasets were retained only to support the particulate-phase retrievals discussed in Sect. 4. Because particle-phase ONs are obtained by paired-channel differencing, common gas-phase contributions are reduced substantially; however, complete cancellation cannot be guaranteed if interfering species behave differently in the gas-only and particle-inclusive paths. Nighttime pΣPNs and pΣANs should therefore be regarded as more robust than nighttime gas-phase data, but still operational rather than fully interference-free.
HONO undergoes thermal or photolytic decomposition to yield NO. Pérez et al. (2007) and Friedrich et al. (2020) reported initial decomposition temperatures of HONO at 450 and 400 °C, respectively, with complete thermal decomposition occurring only in the range of 650–700 °C. Consequently, in the ΣPNs channel (250 °C) of this study, HONO is not thermally decomposed, while in the ΣANs channel (450 °C), the decomposition efficiency does not exceed 10 %. Ambient HONO concentrations at urban sites are typically below 3 ppbv (Wang et al., 2025), resulting in NO production from thermal decomposition of less than 300 pptv. Moreover, HONO is rapidly photolyzed after sunrise, thus exerting minimal influence on daytime TD measurements. Overall, the thermal decomposition of HONO in the ANs channel produces only trace amounts of NO, which may nonetheless interfere with TD channels and systems that target NO2 as the analyte.
It should be noted that the thermal tests described above were conducted using NaNO3 as a proxy for particulate inorganic nitrate. While NaNO3 is thermally refractory, ammonium nitrate (NH4NO3) is likely to dominate much of the urban inorganic nitrate burden in China and is substantially more semivolatile. Literature data indicate that NH4NO3 begins to decompose at temperatures as low as ∼ 400 °C, and that its conversion efficiency to NO2 at 450 °C is less than 50 % (Garner, et al., 2020). Because this temperature range overlaps with the ΣANs setpoint used here, ambient NH4NO3 could contribute a positive artifact to measured ΣANs. Using a typical Pearl River Delta NH4NO3 mass concentrations of < 10 µg m−3 (Liu et al., 2026) and a conservative conversion efficiency, we obtain an order-of-magnitude upper bound of ∼ 1.4 ppbv NO2 equivalent. The exact magnitude for our inlet remains unquantified because NH4NO3 was not tested directly in the laboratory. This is an important limitation of the current study, especially for cool or heavily polluted conditions.
3.4 Precision and detection limits (Allan deviation)
Instrument precision was assessed using Allan deviation analysis with ultra-high-purity N2 introduced to the inlet. The 1σ (1 s) NO2 detection limits are 34 pptv (RT), 35 pptv (250 °C), and 33 pptv (450 °C), improving to 12–13 pptv at 10 s integration (Fig. 7). Propagating these channel precisions through the channel-differencing retrieval (Sect. 2.6) yields 1σ (1 s) detection limits of 49 pptv for gΣPNs, 49 pptv for pΣPNs, 48 pptv for gΣANs, and 68 pptv for pΣANs, consistent with values used for field reporting.
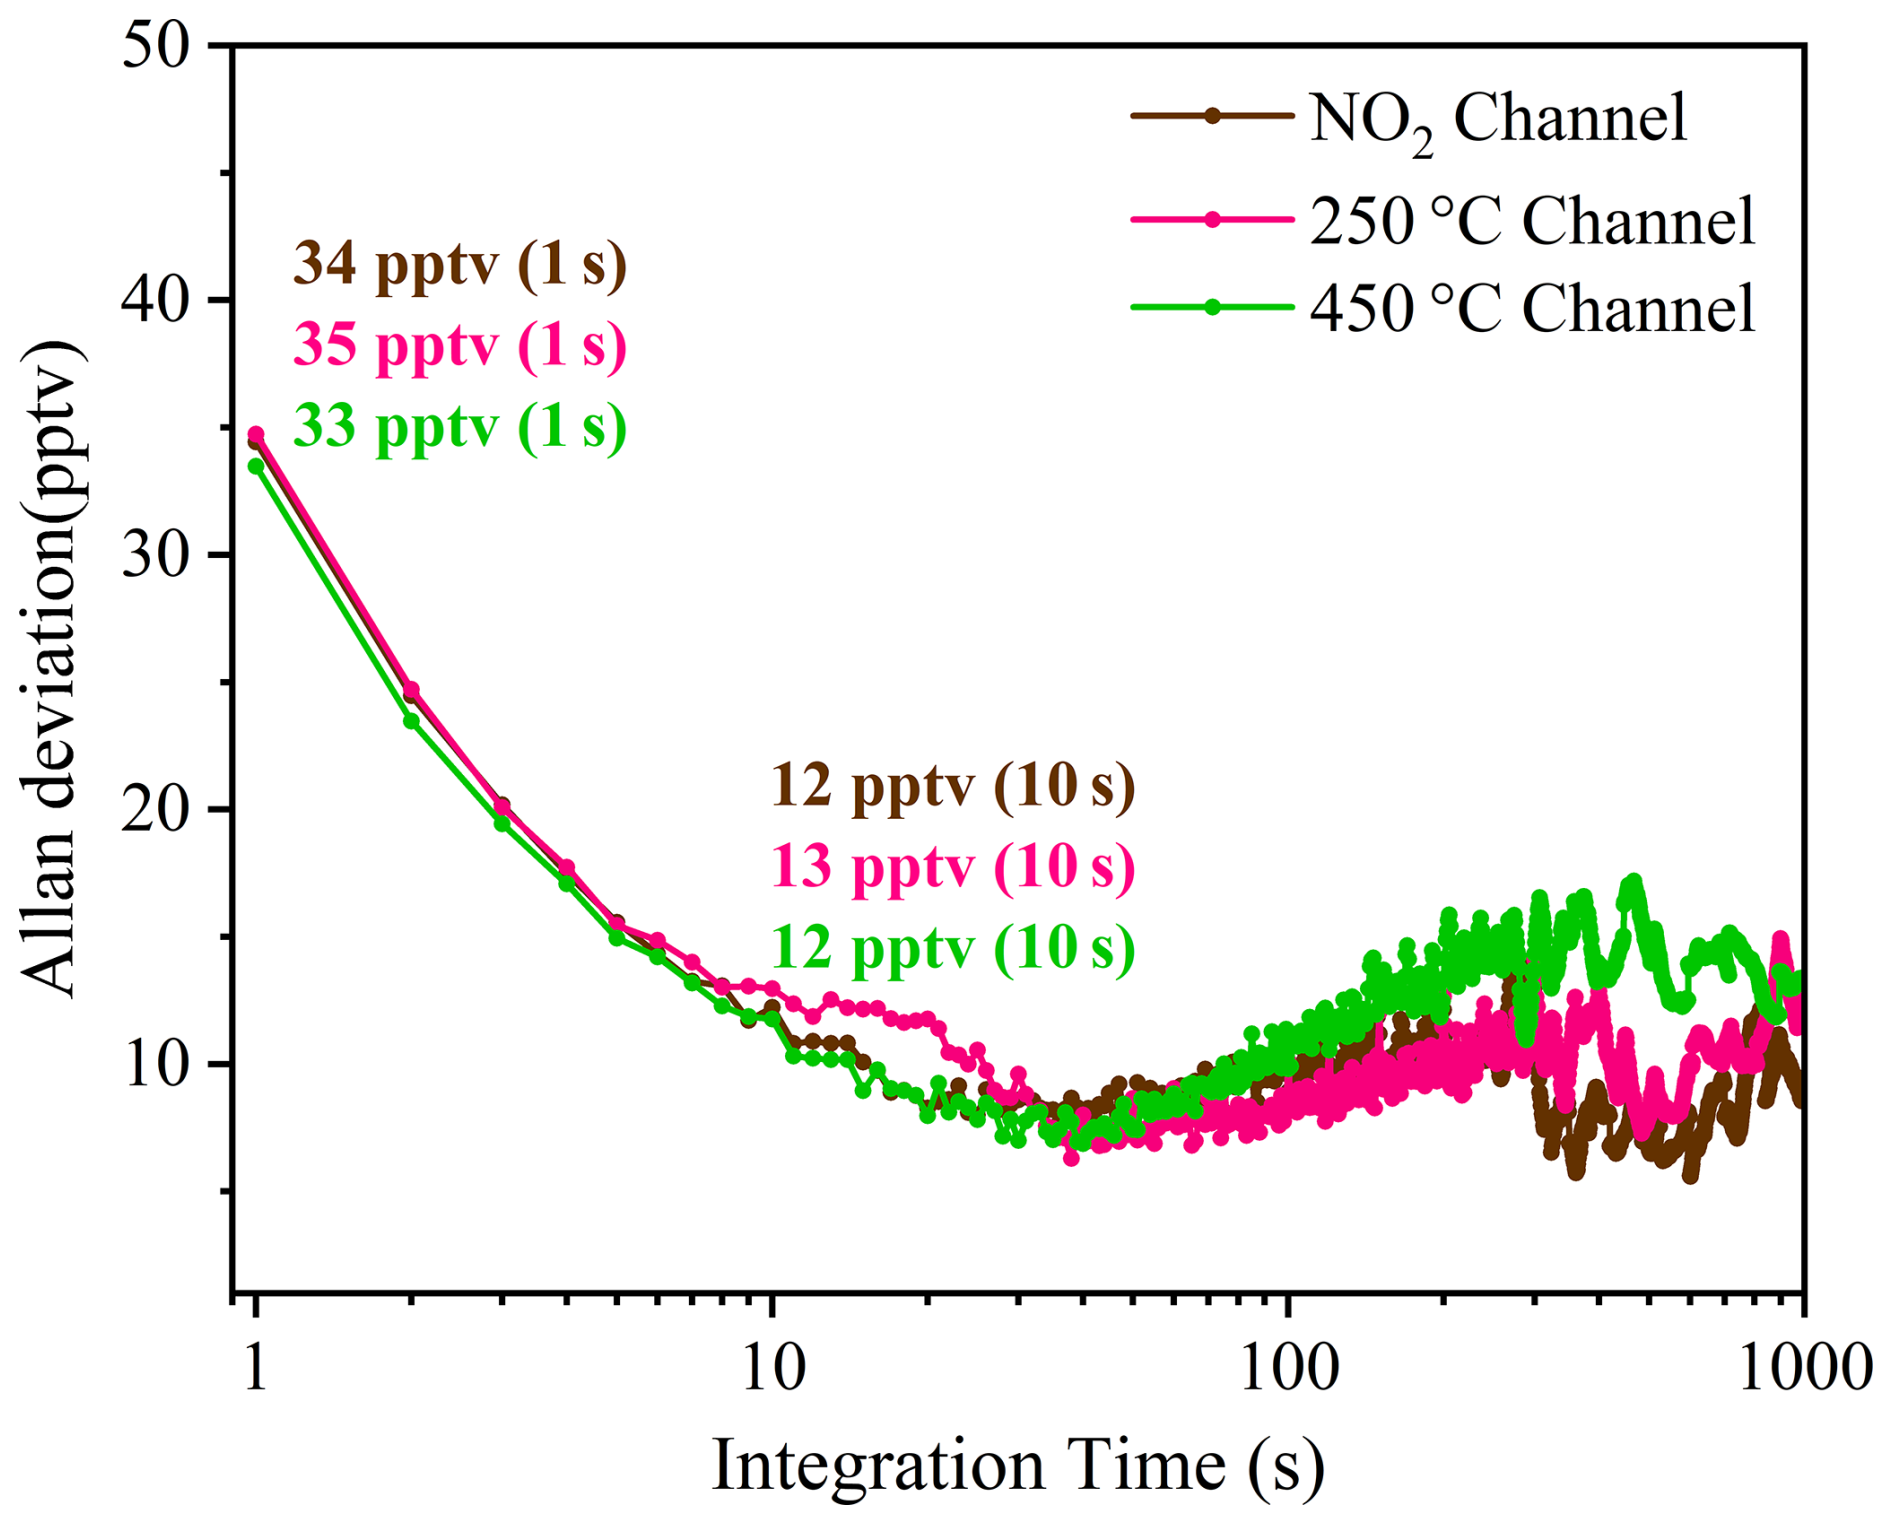
Figure 7Allan Deviation of NO2 mixing ratios retrieved by CEAS for the room-temperature NO2 channel and the heated TD channels (250 and 450 °C), calculated from continuous ultra-high-purity N2 sampling. The Allan deviation quantifies 1σ precision as a function of integration time; annotated values indicate the 1 and 10 s precisions for each channel.
Table 1 compares detection limits reported for representative TD-based techniques. The present TD-CEAS achieves detection limits comparable to the lower end of reported TD methods, while providing simultaneous gas/particle partitioning using a single, compact NO2 spectrometer framework. In terms of temporal resolution, single-cavity configurations are limited by channel switching, resulting in a lower time resolution. Multi-cavity designs therefore represent a promising direction for future instrumental development. Various strategies have been explored to mitigate measurement interferences, including the use of glass bead packing (which reduces but does not fully eliminate interference), correction factor lookup tables, and post-inlet ozone addition. In this study, we propose a correction model based on the NO NO2 ratio that accounts for the coupled effects of both interferents. Existing TD setups for particulate-phase measurements mainly employ either denuders or filter. Denuders require careful monitoring of absorption efficiency and saturation, whereas filter membranes only need to be replaced periodically, making them more convenient to use.
4.1 Site description and ancillary measurements
The five-channel TD-CEAS was deployed on the rooftop (∼ 15 m a.g.l.) of an office building at the Guangzhou Institute of Geochemistry (GIG), Guangzhou, China (113°21′49′′ E, 23°8′46′′ N), as shown in Fig. S6. The site is located in a densely populated urban area influenced by nearby traffic corridors (∼ 350 m). Two short intensive observation campaigns were conducted during 4–7 September and 1–2 October 2025 under clear, rain-free conditions.
When measuring ambient air, the air passes through a PM2.5 cyclone separator (Fig. S6) into a in. stainless steel main sampling tube with a high-flow pump used to draw air at the end. The TD-CEAS system collects samples via a bypass line (PTFE, ∼ 2 m) connected to the main sampling tube. Ancillary reactive nitrogen measurements were used to support evaluation of TD-CEAS performance and to enable post-processing correction of TD artifacts. NO was measured with a chemiluminescence NOx analyzer (Thermo Scientific 42i-TL). During the October deployment, PAN was measured concurrently by a GC–ECD system for intercomparison with the TD-CEAS gas-phase PN signal. Unless otherwise stated, times are reported in local time (UTC+8).
4.2 Measurement cycle, field configuration, and data processing
Ambient air was sampled through a PM2.5 cyclone upstream of the inlet manifold. The instrument was operated in the five-channel configuration described in Sect. 2, with paired inlet/filter arrangements used to separate gas-only and total (gas + particle) signals. The gas-phase channels (RT-F, 250-F, 450-F) used an upstream particle filter (PTFE, retention efficiency of 99.5 % or higher for 0.3 µm particles) to remove particles prior to the TD reactors and CEAS, thereby providing NO2, gΣPNs, and gΣANs by channel differencing. The particle-inclusive channels (250-UF, 450-UF) sampled air without upstream filtration so that both gas and particles entered the TD reactors, while a downstream filter removed particles immediately before the CEAS cavity. These channels therefore provided total (gas + particle) ΣPNs and ΣANs, and particle-phase quantities (pΣPNs and pΣANs) were obtained by differencing the total and gas-only channels.
Each channel was sampled for 1 min, after all five channels have been measured, a 1 min ultra-high-purity N2 segment was introduced, yielding a 6 min measurement cycle. One-minute mean NO2 values were calculated for each channel segment, and the derived ON products were reported at the 6 min cadence of the cycle. For clarity in time-series presentation, hourly means were calculated from the 6 min data (Sect. 4.3).
Because thermally labile nocturnal species such as N2O5 and ClNO2 can decompose in the TD inlets and bias gas-phase ON retrievals, the quantitative discussion in this work focuses on daytime gas-phase ONs, when such interferences are expected to be less important. Nighttime gas-phase ON data are shown for completeness and should be interpreted with caution. This is because the presence of other reactive nitrogen oxides at night, such as ClNO2, N2O5, and HONO, as described in Sect. 3.3.4 (which form at night and photolysis during the day), can significantly interfere with ON measurements. In contrast, particle-phase ONs were retained for both daytime and nighttime because the differencing approach reduces gas-phase interferences that are common to the gas-only and total configurations, although it may not remove them completely.
Laboratory-derived NO NO2 interferences in the ΣPN channels (Sect. 3.3.1) are expected to be most relevant under urban, high-NOx conditions. Accordingly, the correction model obtained from PAN-based laboratory experiments was applied to the 250 °C channel measurements using simultaneously measured NO from the chemiluminescence analyzer and NO2 from the RT channel. The corrected 250 °C data were then used to derive gΣPNs and pΣPNs. No additional correction was applied to ΣANs beyond the 450–250 differencing described above, and the resulting ΣAN values are interpreted operationally.
4.3 Time series and evaluation against PAN
Figure 8 shows hourly mean time series for NO, NO2, gΣPNs, pΣPNs, gΣANs, and pΣANs during the two intensive observation periods. NO and NO2 exhibited typical urban variability, with higher concentrations at night and lower concentrations during the day. The mean NO and NO2 mixing ratios were 1.5 ± 2.1 and 14.8 ± 9.3 ppbv (mean ±1σ) in September, and 1.4 ± 1.3 and 18.2 ± 14.4 ppbv in October.
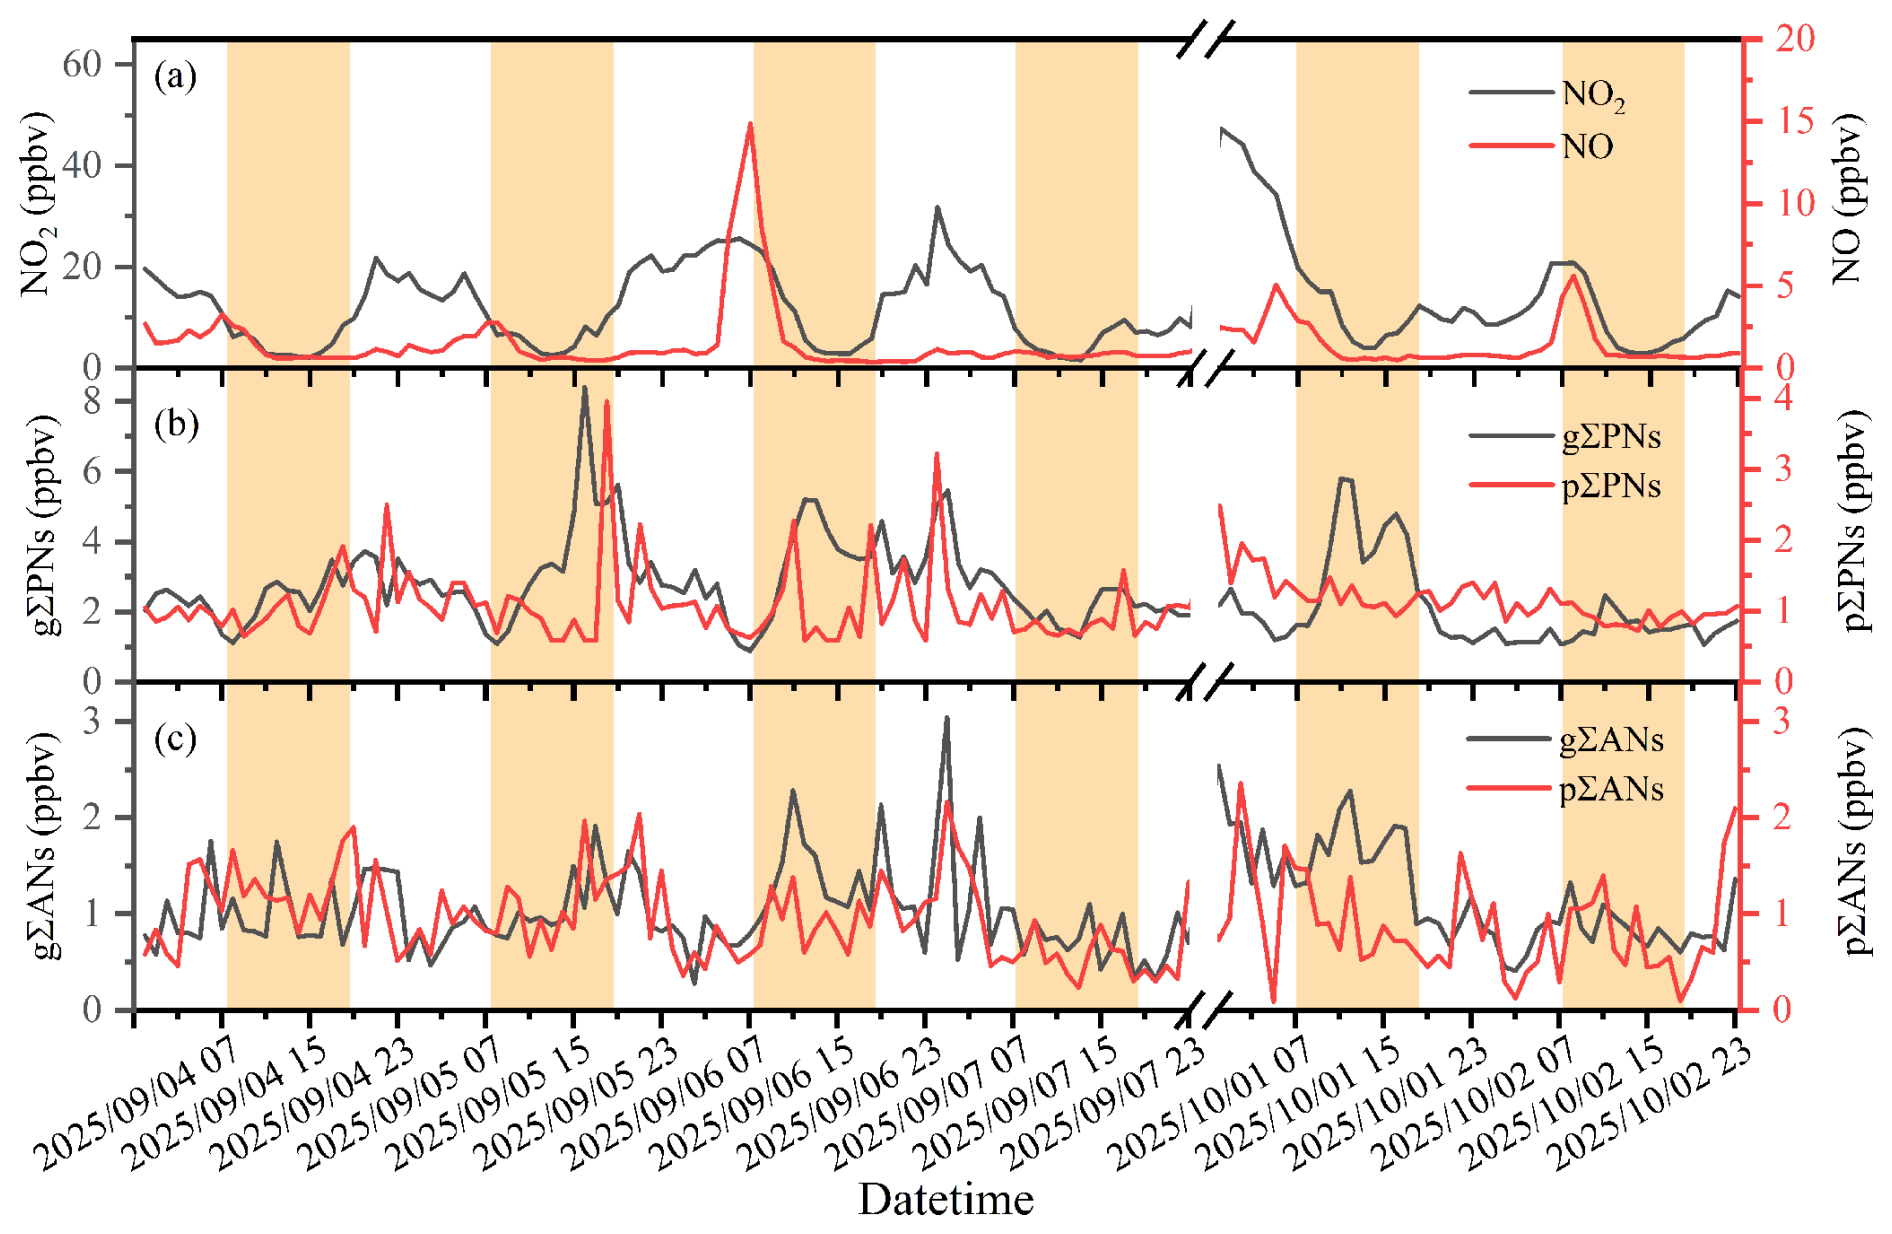
Figure 8Hourly mean time series of NO measured by a Thermo Scientific 42i-TL analyzer, NO2 measured by the RT channel, and class-resolved organic nitrates measured by the five-channel TD-CEAS during two intensive periods at the urban Guangzhou site (4–7 September and 1–2 October 2025; local time, UTC+8). From top to bottom, panels show NO and NO2, gas- and particle-phase peroxy nitrates (gΣPNs and pΣPNs), and gas- and particle-phase alkyl nitrates (gΣANs and pΣANs). ΣPNs are shown after application of the NO NO2-dependent correction model derived from laboratory PAN experiments. Orange shading indicates daytime. All mixing ratios are in ppbv.
Daytime gΣPNs are elevated in both campaigns, with mean values of 2.8 ± 1.2 ppbv in September and 2.1 ± 1.2 ppbv in October and corresponding maxima of 8.4 and 5.8 ppbv, respectively. Particle-phase ΣPNs were smaller (e.g., 1.1 ± 0.5 ppbv in September) and showed less distinct diel structure. gΣANs displayed clear daytime maxima, with a mean of 1.0 ± 0.5 and 1.2 ± 0.5 ppbv in September and October, respectively. In contrast, pΣANs (1.0 ± 0.4 ppbv in September; 0.9 ± 0.5 ppbv in October) tended to peak at night, consistent with enhanced nighttime nitrate chemistry contributions and the expected nocturnal partitioning/production of low-volatility ONs (Fry et al., 2013).
The trends in daytime gΣPNs and temperature are positively correlated, as shown in Fig. 9. The fractions of gΣPNs (gΣPNs (gΣPNs + pΣPNs)) increases from less than 60 % in the morning (08:00, ∼ 29 °C) to nearly 80 % in the afternoon (16:00, ∼ 34 °C), which is qualitatively consistent with warmer conditions favoring the gas phase. We therefore regard the daytime evolution of gΣPNs as robust in a relative sense. By contrast, the absolute magnitude of pΣPNs should be interpreted more cautiously because pΣPN is obtained by channel subtraction and has not been directly validated with a particulate PN standard. The residual particulate signal may reflect a combination of less volatile PN components, temperature-dependent partitioning, and subtraction uncertainty. Relative humidity may also influence ΣPNs through PAN hydrolysis and heterogeneous uptake on particles (Salas et al., 2020; Sun et al., 2022). The nighttime increase in gΣPNs is not interpreted quantitatively because ClNO2, N2O5, and HONO can contribute to the gas-phase channels after dark. For ΣANs, the particle-phase fraction increases as temperature decreases, which is consistent with partitioning of lower-volatility organic nitrates towards the condensed phase during nighttime conditions.
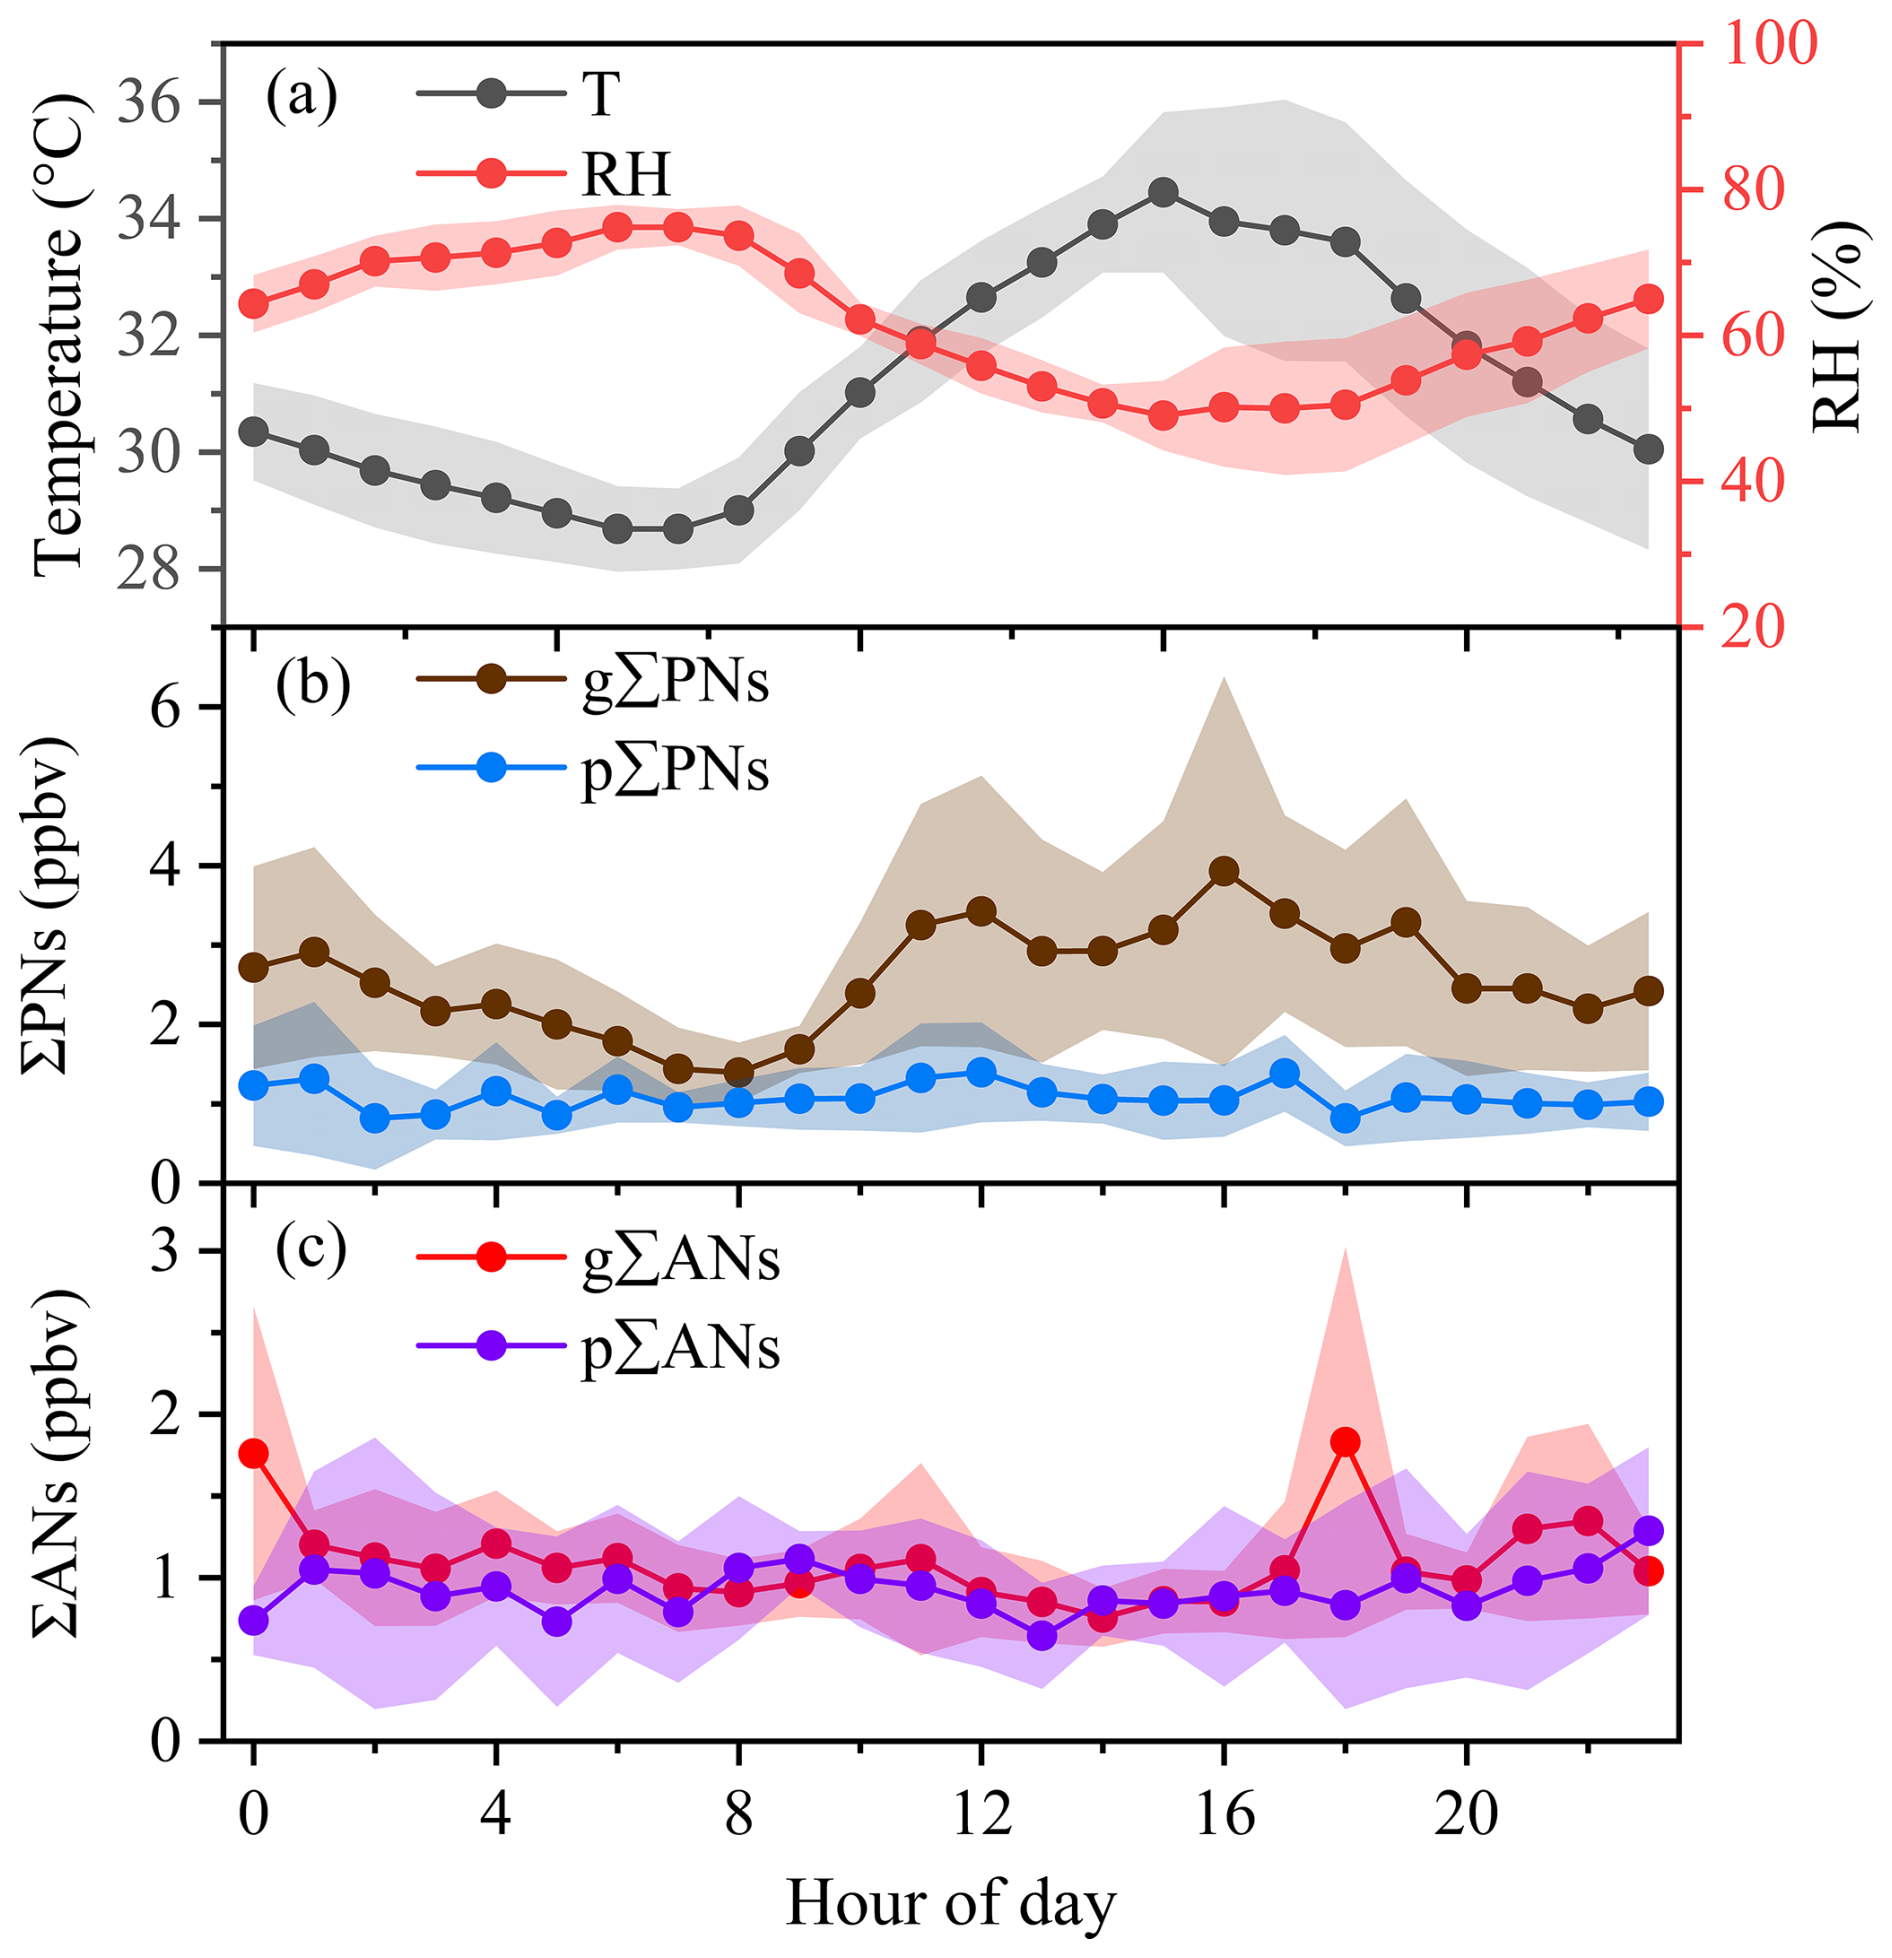
Figure 9Daily average of (a) temperature and relative humidity, (b) gas- and particle-phase ΣPNs, and (c) gas- and particle-phase ΣANs. Shading indicating the error of ±1σ.
During the October campaign, corrected gΣPNs were evaluated against independently measured PAN from the GC-ECD system. The two measurements agreed well in temporal variability, and linear regression yielded R2 = 0.83. The regression slope indicates that PAN accounted for approximately 78 % of daytime gΣPNs (Figs. S7, S8). This proportion ranges from 48 % to 78 % at the temperate forest site in Paris, France (Andersen et al., 2025). This supports the quantitative performance of the TD-CEAS gas-phase ΣPNs retrieval under urban conditions and provides an observational constraint on the extent to which PAN dominated the measured gΣPNs pool during the deployment. Based on the comparison of raw ΣPNs and PAN (where gΣPNs are, at certain times, unreasonably lower than PAN), it is necessary to correct the raw data because the uncorrected values occasionally imply a physically implausible negative inlet bias. At the same time, the correction remains PAN-anchored. In the real atmosphere, ΣPNs comprise a mixture of peroxy nitrates, whose thermal dissociation products may not all behave identically to the PA radical. The corrected daytime gΣPNs values should therefore be interpreted as operational ΣPN estimates constrained by PAN, rather than as composition-independent absolute totals.
These field observations demonstrate the capability of the five-channel TD-CEAS to provide continuous measurements of NO2 and operational ON classes in both gas and particle phases at a 6 min cadence, with performance evaluation supported by independent PAN measurements and correction for NO NO2-dependent artifacts relevant to high-NOx environments.
We developed and characterized a five-channel TD-CEAS system for in situ measurements of NO2 and operationally defined ON classes in both the gas and particle phases. The instrument couples a single NO2 detector (405 nm) with two thermal dissociation setpoints (250 and 450 °C) and paired inlet/outlet configurations (upstream filtration for gas-only; downstream filtration for particle-inclusive sampling) to enable retrieval of gas- and particle-phase ΣPNs and ΣANs by channel differencing. In the field configuration used here, the system cycles through the five channels plus an N2 reference segment, providing a complete set of NO2, g/pΣPNs, and g/pΣANs at a 6 min cadence.
Laboratory characterization of PNs and ANs standards supported the selection of operational TD temperatures. Under these conditions, particulate inorganic nitrate (NaNO3) showed minimal contribution to the NO2 signal at 450 °C. Allan deviation analysis yielded 1 σ (1 s) detection limits of 49 pptv for gΣPNs, 49 pptv for pΣPNs, 48 pptv for gΣANs, and 68 pptv for pΣANs. The gas-phase ΣPN response was validated using PAN, with TD-CEAS PAN-equivalent mixing ratios agreeing with GC-ECD measurements (slope = 0.987; R2 = 0.988). For particle-phase ΣANs, an operational calibration based on filter thermolysis of 2-EHN produced a linear response (slope = 1.036 ± 0.028) and a method detection limit of 0.029 µg NO2. Dedicated interference experiments demonstrated that NO and NO2 can introduce substantial, nonlinear biases in ΣPNs retrievals through radical chemistry in the TD inlet. These effects are reduced using a regression-based correction model that outperformed the reproduced lookup-table approach across the tested NOx conditions.
Field deployment at an urban site in Guangzhou during September–October 2025 demonstrated stable instrument operation under high-NOx conditions and produced continuous time series of gas- and particle-phase ON classes. During the October intensive period, corrected gΣPNs covaried well with independently measured PAN, with R2 of 0.83, and PAN accounted for approximately 78 % of daytime gΣPNs. The observed diurnal variation of gas-phase ONs and the day-night pattern of particle-phase ONs provide a useful approach for investigating the daytime phase partitioning of ONs and the transformation processes of reactive nitrogen in urban air. Because thermally labile nocturnal species such as N2O5 and ClNO2 may interfere with gas-phase ON retrievals, nighttime gas-phase data should be interpreted cautiously and are not used here for quantitative discussion.
Several limitations remain important. First, the ΣPN correction is anchored to PAN and may not fully capture the behavior of mixed ambient PN ensembles. Second, the ΣAN channel was evaluated with a limited set of surrogate standards, and direct laboratory validation for particle-phase PNs and NH4NO3 interference is still lacking. Third, nighttime gas-phase data are not used quantitatively, and nighttime particle-phase data, although less sensitive to common gas-phase interferences, should still be regarded as operational. Finally, parallel multi-cavity or multi-detector designs would further reduce artifacts associated with channel switching. Within these bounds, the five-channel TD-CEAS provides a practical framework for continuous, class-resolved monitoring of organic nitrates in both phases, while explicitly addressing NO NO2-dependent TD chemistry in high-NOx environments.
The data used in this study can be available at https://doi.org/10.5281/zenodo.21404210 (Tian and Lu, 2026).
The supplement related to this article is available online at https://doi.org/10.5194/amt-19-4797-2026-supplement.
XW acquired funds. XT designed and characterized the instrument with the support of XW and WS. XT carried out the instrument assessments. XT, HL, XY, and WS carried out the ONs measurements in the field. XT prepared the manuscript. XW and WS supervised the study. XW revised and edited the manuscript.
The contact author has declared that none of the authors has any competing interests.
Publisher's note: Copernicus Publications remains neutral with regard to jurisdictional claims made in the text, published maps, institutional affiliations, or any other geographical representation in this paper. The authors bear the ultimate responsibility for providing appropriate place names. Views expressed in the text are those of the authors and do not necessarily reflect the views of the publisher.
The efforts of the three anonymous reviewers have greatly improved the quality of this paper and are sincerely appreciated.
This research has been supported by the National Key Research and Development Program of China (grant no. 2022YFC3701103), the National Natural Science Foundation of China (grant no. 42321003), and the Department of Science and Technology of Guangdong (grant nos. 2023B0303000007 and 2023B1212060049).
This paper was edited by Anna Novelli and reviewed by three anonymous referees.
Andersen, S. T., Sander, R., Dewald, P., Wüst, L., Seubert, T., Türk, G. N. T. E., Schuladen, J., McGillen, M. R., Xue, C., Mellouki, A., Kukui, A., Michoud, V., Cirtog, M., Cazaunau, M., Bauville, A., Bouzidi, H., Formenti, P., Denjean, C., Etienne, J.-C., Garrouste, O., Cantrell, C., Lelieveld, J., and Crowley, J. N.: Short-lived organic nitrates in a suburban temperate forest: an indication of efficient assimilation of reactive nitrogen by the biosphere?, Atmos. Chem. Phys., 25, 5893–5909, https://doi.org/10.5194/acp-25-5893-2025, 2025.
Atkinson, R.: Atmospheric chemistry of VOCs and NOx, Atmos. Environ., 34, 2063–2101, https://doi.org/10.1016/s1352-2310(99)00460-4, 2000.
Chen, J., Wu, H., Liu, A. W., Hu, S. M., and Zhang, J.: Field measurement of NO2 and RNO2 by two-channel thermal dissociation cavity ring down spectrometer, Chin. J. Chem. Phys., 30, 493–498, https://doi.org/10.1063/1674-0068/30/cjcp1705084, 2017.
Chen, J., Wang, X., Zhang, J., Li, M., Liu, Z., Bi, Y., Wu, D., Yin, X., Gu, R., Jiang, Y., Shan, Y., Zhao, Y., Xue, L., and Wang, W.: Particulate organic nitrates at Mount Tai in winter and spring: Variation characteristics and effects of mountain-valley breezes and elevated emission sources, Environ. Res., 212, 113182, https://doi.org/10.1016/j.envres.2022.113182, 2022.
Day, D. A., Wooldridge, P. J., Dillon, M. B., Thornton, J. A., and Cohen, R. C.: A thermal dissociation laser-induced fluorescence instrument for in situ detection of NO2, peroxy nitrates, alkyl nitrates, and HNO3, J. Geophys. Res.-Atmos., 107, ACH 4-1–ACH 4-14, https://doi.org/10.1029/2001jd000779, 2002.
Day, D. A., Campuzano-Jost, P., Nault, B. A., Palm, B. B., Hu, W., Guo, H., Wooldridge, P. J., Cohen, R. C., Docherty, K. S., Huffman, J. A., de Sá, S. S., Martin, S. T., and Jimenez, J. L.: A systematic re-evaluation of methods for quantification of bulk particle-phase organic nitrates using real-time aerosol mass spectrometry, Atmos. Meas. Tech., 15, 459–483, https://doi.org/10.5194/amt-15-459-2022, 2022.
Dewald, P., Dörich, R., Schuladen, J., Lelieveld, J., and Crowley, J. N.: Impact of ozone and inlet design on the quantification of isoprene-derived organic nitrates by thermal dissociation cavity ring-down spectroscopy (TD-CRDS), Atmos. Meas. Tech., 14, 5501–5519, https://doi.org/10.5194/amt-14-5501-2021, 2021.
Fisher, J. A., Jacob, D. J., Travis, K. R., Kim, P. S., Marais, E. A., Chan Miller, C., Yu, K., Zhu, L., Yantosca, R. M., Sulprizio, M. P., Mao, J., Wennberg, P. O., Crounse, J. D., Teng, A. P., Nguyen, T. B., St. Clair, J. M., Cohen, R. C., Romer, P., Nault, B. A., Wooldridge, P. J., Jimenez, J. L., Campuzano-Jost, P., Day, D. A., Hu, W., Shepson, P. B., Xiong, F., Blake, D. R., Goldstein, A. H., Misztal, P. K., Hanisco, T. F., Wolfe, G. M., Ryerson, T. B., Wisthaler, A., and Mikoviny, T.: Organic nitrate chemistry and its implications for nitrogen budgets in an isoprene- and monoterpene-rich atmosphere: constraints from aircraft (SEAC4RS) and ground-based (SOAS) observations in the Southeast US, Atmos. Chem. Phys., 16, 5969–5991, https://doi.org/10.5194/acp-16-5969-2016, 2016.
Friedrich, N., Tadic, I., Schuladen, J., Brooks, J., Darbyshire, E., Drewnick, F., Fischer, H., Lelieveld, J., and Crowley, J. N.: Measurement of NOx and NOy with a thermal dissociation cavity ring-down spectrometer (TD-CRDS): instrument characterisation and first deployment, Atmos. Meas. Tech., 13, 5739–5761, https://doi.org/10.5194/amt-13-5739-2020, 2020.
Fry, J. L., Draper, D. C., Zarzana, K. J., Campuzano-Jost, P., Day, D. A., Jimenez, J. L., Brown, S. S., Cohen, R. C., Kaser, L., Hansel, A., Cappellin, L., Karl, T., Hodzic Roux, A., Turnipseed, A., Cantrell, C., Lefer, B. L., and Grossberg, N.: Observations of gas- and aerosol-phase organic nitrates at BEACHON-RoMBAS 2011, Atmos. Chem. Phys., 13, 8585–8605, https://doi.org/10.5194/acp-13-8585-2013, 2013.
Fuchs, H., Dube, W. P., Cicioira, S. J., and Brown, S. S.: Determination of inlet transmission and conversion efficiencies for in situ measurements of the nocturnal nitrogen oxides, NO3, N2O5 and NO2, via pulsed cavity ring-down spectroscopy, Anal. Chem., 80, 6010–6017, https://doi.org/10.1021/ac8007253, 2008.
Garner, N. M., Matchett, L. C., and Osthoff, H. D.: Quantification of non-refractory aerosol nitrate in ambient air by thermal dissociation cavity ring-down spectroscopy, Environ. Sci. Technol., 54, 9854–9861, https://doi.org/10.1021/acs.est.0c01156, 2020.
Gingerysty, N. J., Odame-Ankrah, C. A., Jordan, N., and Osthoff, H. D.: Interference from HONO in the measurement of ambient air NO2 via photolytic conversion and quantification of NO, J. Environ. Sci., 107, 184-193, https://doi.org/10.1016/j.jes.2020.12.011, 2021.
He, X. W., Zhang, C. L., Liu, P. F., Zhang, G., Wu, H., Peng, Y. X., Liu, J. F., Liu, C. T., and Mu, Y. J.: A novel photochemical conversion technique for reliable calibration of peroxyacetyl nitrate (PAN) analyzers, Sci. Total Environ., 872, 162164, https://doi.org/10.1016/j.scitotenv.2023.162164, 2023.
Keehan, N. I., Brownwood, B., Marsavin, A., Day, D. A., and Fry, J. L.: A thermal-dissociation–cavity ring-down spectrometer (TD-CRDS) for the detection of organic nitrates in gas and particle phases, Atmos. Meas. Tech., 13, 6255–6269, https://doi.org/10.5194/amt-13-6255-2020, 2020.
Kiendler-Scharr, A., Mensah, A. A., Friese, E., Topping, D., Nemitz, E., Prevot, A. S. H., Äijälä, M., Allan, J., Canonaco, F., Canagaratna, M., Carbone, S., Crippa, M., Dall Osto, M., Day, D. A., De Carlo, P., Di Marco, C. F., Elbern, H., Eriksson, A., Freney, E., Hao, L., Herrmann, H., Hildebrandt, L., Hillamo, R., Jimenez, J. L., Laaksonen, A., McFiggans, G., Mohr, C., O'Dowd, C., Otjes, R., Ovadnevaite, J., Pandis, S. N., Poulain, L., Schlag, P., Sellegri, K., Swietlicki, E., Tiitta, P., Vermeulen, A., Wahner, A., Worsnop, D., and Wu, H. C.: Ubiquity of organic nitrates from nighttime chemistry in the European submicron aerosol, Geophys. Res. Lett., 43, 7735–7744, https://doi.org/10.1002/2016GL069239, 2016.
Kirchner, F., Mayer-Figge, A., Zabel, F., and Becker, K. H.: Thermal stability of peroxynitrates, Int. J. Chem. Kinet., 31, 127–144, https://doi.org/10.1002/(SICI)1097-4601(1999)31:2<127::AID-KIN6>3.0.CO;2-L, 1999.
Li, C., Wang, H., Chen, X., Zhai, T., Chen, S., Li, X., Zeng, L., and Lu, K.: Thermal dissociation cavity-enhanced absorption spectrometer for measuring NO2, RO2NO2, and RONO2 in the atmosphere, Atmos. Meas. Tech., 14, 4033–4051, https://doi.org/10.5194/amt-14-4033-2021, 2021.
Li, C., Wang, H., Chen, X., Zhai, T., Ma, X., Yang, X., Chen, S., Li, X., Zeng, L., and Lu, K.: Observation and modeling of organic nitrates on a suburban site in southwest China, Sci. Total Environ., 859, 160287, https://doi.org/10.1016/j.scitotenv.2022.160287, 2023.
Lin, C., Hu, R., Xie, P., Zhang, G., Liu, X., Tong, J., and Liu, W.: A three-channel thermal dissociation cavity ring-down spectrometer for simultaneous measurement of ambient total peroxy nitrates, total alkyl nitrates, and NO2, Talanta, 270, 125524, https://doi.org/10.1016/j.talanta.2023.125524, 2024.
Lin, C., Hu, R., Liu, X., Ren, Y., Zhang, G., Tong, J., Wang, R., Wei, L., Xie, P., and Liu, W.: A high-sensitive multi-pass thermal dissociation cavity ring-down spectrometer for PNs and ANs measurement: Accurate quantification in realtime under gas and particle phase, Sens. Actuat. B, 449, https://doi.org/10.1016/j.snb.2025.139090, 2026.
Liu, Z., Hu, W., Cai, Y., Feng, T., Pan, T., Zhao, W., Huang, S., and Yuan, B.: Unveiling the shifting PM2.5 chemistry in industrial regions of Pearl River Delta, China: Rising nitrate contributions amidst emission reductions, J. Hazard. Mater., 503, 140986, https://doi.org/10.1016/j.jhazmat.2025.140986, 2026.
Mielke, L. H., Furgeson, A., and Osthoff, H. D.: Observation of CINO2 in a Mid-Continental Urban Environment, Environ. Sci. Technol., 45, 8889–8896, https://doi.org/10.1021/es201955u, 2011.
Murphy, J. G., Thornton, J. A., Wooldridge, P. J., Day, D. A., Rosen, R. S., Cantrell, C., Shetter, R. E., Lefer, B., and Cohen, R. C.: Measurements of the sum of HO2NO2 and CH3O2NO2 in the remote troposphere, Atmos. Chem. Phys., 4, 377–384, https://doi.org/10.5194/acp-4-377-2004, 2004.
Neu, J. L., Lawler, M. J., Prather, M. J., and Saltzman, E. S.: Oceanic alkyl nitrates as a natural source of tropospheric ozone, Geophys. Res. Lett., 35, L13814, https://doi.org/10.1029/2008gl034189, 2008.
Ohara, N., Shioji, T., Matsumoto, J., Inomata, S., Sakamoto, Y., Kajii, Y., Shiigi, H., and Sadanaga, Y.: Improved continuous measurement system for atmospheric total peroxy and total organic nitrate under the high NOx condition, Rev. Sci. Instrum., 95, https://doi.org/10.1063/5.0172219, 2024.
Paul, D., Furgeson, A., and Osthoff, H. D.: Measurements of total peroxy and alkyl nitrate abundances in laboratory-generated gas samples by thermal dissociation cavity ring-down spectroscopy, Rev. Sci. Instrum., 80, 8, https://doi.org/10.1063/1.3258204, 2009.
Pérez, I. M., Wooldridge, P. J., and Cohen, R. C.: Laboratory evaluation of a novel thermal dissociation chemiluminescence method for in situ detection of nitrous acid, Atmos. Environ., 41, 3993–4001, https://doi.org/10.1016/j.atmosenv.2007.01.060, 2007.
Perring, A. E., Pusede, S. E., and Cohen, R. C.: An observational perspective on the atmospheric impacts of alkyl and multifunctional nitrates on ozone and secondary organic aerosol, Chem. Rev., 113, 5848–5870, https://doi.org/10.1021/cr300520x, 2013.
Riedel, T. P., Wolfe, G. M., Danas, K. T., Gilman, J. B., Kuster, W. C., Bon, D. M., Vlasenko, A., Li, S.-M., Williams, E. J., Lerner, B. M., Veres, P. R., Roberts, J. M., Holloway, J. S., Lefer, B., Brown, S. S., and Thornton, J. A.: An MCM modeling study of nitryl chloride (ClNO2) impacts on oxidation, ozone production and nitrogen oxide partitioning in polluted continental outflow, Atmos. Chem. Phys., 14, 3789–3800, https://doi.org/10.5194/acp-14-3789-2014, 2014.
Roberts, J. M.: The atmospheric chemistry of organic nitrates, Atmos. Environ. A, 24, 243–287, https://doi.org/10.1016/0960-1686(90)90108-y, 1990.
Rollins, A. W., Smith, J. D., Wilson, K. R., and Cohen, R. C.: Real time in situ detection of organic nitrates in atmospheric aerosols, Environ. Sci. Technol., 44, 5540–5545, https://doi.org/10.1021/es100926x, 2010.
Rollins, A. W., Browne, E. C., Min, K. E., Pusede, S. E., Wooldridge, P. J., Gentner, D. R., Goldstein, A. H., Liu, S., Day, D. A., Russell, L. M., and Cohen, R. C.: Evidence for NOx control over nighttime SOA formation, Science, 337, 1210–1212, https://doi.org/10.1126/science.1221520, 2012.
Sadanaga, Y., Takaji, R., Ishiyama, A., Nakajima, K., Matsuki, A., and Bandow, H.: Thermal dissociation cavity attenuated phase shift spectroscopy for continuous measurement of total peroxy and organic nitrates in the clean atmosphere, Rev. Sci. Instrum., 87, 074102, https://doi.org/10.1063/1.4958167, 2016.
Salas, J., Paci, M. A. B., and Malanca, F. E.: Water vapour influence over the PAN stability: Homogeneous and heterogeneous processes between PAN-NO2-H2O, Atmos. Environ., 232, https://doi.org/10.1016/j.atmosenv.2020.117537, 2020.
Shao, D., Qin, M., Fang, W., Han, B. B., Xie, J. Y., Zhao, X. D., Liao, Z. T., Ren, E. B., and Wei, Z.: Quantification of organic nitrates using thermal dissociation broadband cavity-enhanced absorption spectroscopy: interference suppression and atmospheric measurement, Anal. Chem., 98, 2048–2059, https://doi.org/10.1021/acs.analchem.5c05426, 2026.
Sobanski, N., Schuladen, J., Schuster, G., Lelieveld, J., and Crowley, J. N.: A five-channel cavity ring-down spectrometer for the detection of NO2, NO3, N2O5, total peroxy nitrates and total alkyl nitrates, Atmos. Meas. Tech., 9, 5103–5118, https://doi.org/10.5194/amt-9-5103-2016, 2016.
Sun, M., Zhou, Y., Wang, Y., Qiao, X., Wang, J., and Zhang, J.: Heterogeneous reaction of peroxyacetyl nitrate on real-world PM2.5 aerosols: kinetics, influencing factors, and atmospheric implications, Environ. Sci. Technol., 56, 9325–9334, https://doi.org/10.1021/acs.est.2c03050, 2022.
Taha, Y. M., Saowapon, M. T., Assad, F. V., Ye, C. Z., Chen, X., Garner, N. M., and Osthoff, H. D.: Quantification of peroxynitric acid and peroxyacyl nitrates using an ethane-based thermal dissociation peroxy radical chemical amplification cavity ring-down spectrometer, Atmos. Meas. Tech., 11, 4109–4127, https://doi.org/10.5194/amt-11-4109-2018, 2018.
Thaler, R. D., Mielke, L. H., and Osthoff, H. D.: Quantification of nitryl chloride at part per trillion mixing ratios by thermal dissociation cavity ring-down spectroscopy, Anal. Chem., 83, 2761–2766, https://doi.org/10.1021/ac200055z, 2011.
Thieser, J., Schuster, G., Schuladen, J., Phillips, G. J., Reiffs, A., Parchatka, U., Pöhler, D., Lelieveld, J., and Crowley, J. N.: A two-channel thermal dissociation cavity ring-down spectrometer for the detection of ambient NO2, RO2NO2 and RONO2, Atmos. Meas. Tech., 9, 553–576, https://doi.org/10.5194/amt-9-553-2016, 2016.
Tian, X. and Lu, H.: Five-channel TD-CEAS measurements of gaseous and particulate organic nitrates with NO NO2 interference correction under high-NOx conditions, Zenodo [data set], https://doi.org/10.5281/zenodo.21404210, 2026.
Wang, L., Chai, J., Gaubert, B., and Huang, Y.: A review of measurements and model simulations of atmospheric nitrous acid, Atmos. Environ., 347, 121094, https://doi.org/10.1016/j.atmosenv.2025.121094, 2025.
Wang, X., Wang, H., Xue, L., Wang, T., Wang, L., Gu, R., Wang, W., Tham, Y. J., Wang, Z., Yang, L., Chen, J., and Wang, W.: Observations of N2O5 and ClNO2 at a polluted urban surface site in North China: High N2O5 uptake coefficients and low ClNO2 product yields, Atmos. Environ., 156, 125–134, https://doi.org/10.1016/j.atmosenv.2017.02.035, 2017.
Wild, R. J., Edwards, P. M., Dube, W. P., Baumann, K., Edgerton, E. S., Quinn, P. K., Roberts, J. M., Rollins, A. W., Veres, P. R., Warneke, C., Williams, E. J., Yuan, B., and Brown, S. S.: A measurement of total reactive nitrogen, NOy, together with NO2, NO, and O3 via cavity ring-down spectroscopy, Environ. Sci. Technol., 48, 9609–9615, https://doi.org/10.1021/es501896w, 2014.
Wooldridge, P. J., Perring, A. E., Bertram, T. H., Flocke, F. M., Roberts, J. M., Singh, H. B., Huey, L. G., Thornton, J. A., Wolfe, G. M., Murphy, J. G., Fry, J. L., Rollins, A. W., LaFranchi, B. W., and Cohen, R. C.: Total Peroxy Nitrates (ΣPNs) in the atmosphere: the Thermal Dissociation-Laser Induced Fluorescence (TD-LIF) technique and comparisons to speciated PAN measurements, Atmos. Meas. Tech., 3, 593–607, https://doi.org/10.5194/amt-3-593-2010, 2010.
Wüst, L., Dewald, P., Türk, G. N. T. E., Lelieveld, J., and Crowley, J. N.: Influence of ambient NO and NO2 on the quantification of total peroxy nitrates (ΣPNs) and total alkyl nitrates (ΣANs) by thermal dissociation cavity ring-down spectroscopy (TD-CRDS), Atmos. Meas. Tech., 18, 1943–1959, https://doi.org/10.5194/amt-18-1943-2025, 2025.
Yu, K., Zhu, Q., Du, K., and Huang, X.-F.: Characterization of nighttime formation of particulate organic nitrates based on high-resolution aerosol mass spectrometry in an urban atmosphere in China, Atmos. Chem. Phys., 19, 5235–5249, https://doi.org/10.5194/acp-19-5235-2019, 2019.
Yu, X., Li, A. F., Ge, Y., Li, Y. M., Liao, K. Z., Huang, X. H., Li, J. J., and Yu, J. Z.: Simultaneous determination of aerosol inorganic and organic nitrogen by thermal evolution and chemiluminescence detection, Environ. Sci. Technol., 55, 11579–11589, https://doi.org/10.1021/acs.est.1c04876, 2021.
Zare, A., Romer, P. S., Nguyen, T., Keutsch, F. N., Skog, K., and Cohen, R. C.: A comprehensive organic nitrate chemistry: insights into the lifetime of atmospheric organic nitrates, Atmos. Chem. Phys., 18, 15419–15436, https://doi.org/10.5194/acp-18-15419-2018, 2018.
Zeng, L. W., Lyu, X. P., Guo, H., Zou, S. C., and Ling, Z. H.: Photochemical formation of C1–C5 Alkyl nitrates in suburban Hong Kong and over the South China Sea, Environ. Sci. Technol., 52, 5581–5589, https://doi.org/10.1021/acs.est.8b00256, 2018.
Zhang, G., Mu, Y., Liu, J., and Mellouki, A.: Direct and simultaneous determination of trace-level carbon tetrachloride, peroxyacetyl nitrate, and peroxypropionyl nitrate using gas chromatography-electron capture detection, J. Chromatogr. A, 1266, 110–115, https://doi.org/10.1016/j.chroma.2012.09.092, 2012.
Zhang, G., Mu, Y. J., Zhou, L. X., Zhang, C. L., Zhang, Y. Y., Liu, J. F., Fang, S. X., and Yao, B.: Summertime distributions of peroxyacetyl nitrate (PAN) and peroxypropionyl nitrate (PPN) in Beijing: Understanding the sources and major sink of PAN, Atmos. Environ., 103, 289–296, https://doi.org/10.1016/j.atmosenv.2014.12.035, 2015.
Zheng, W., Flocke, F. M., Tyndall, G. S., Swanson, A., Orlando, J. J., Roberts, J. M., Huey, L. G., and Tanner, D. J.: Characterization of a thermal decomposition chemical ionization mass spectrometer for the measurement of peroxy acyl nitrates (PANs) in the atmosphere, Atmos. Chem. Phys., 11, 6529–6547, https://doi.org/10.5194/acp-11-6529-2011, 2011.
Zhou, J., Zhao, W., Zhang, Y., Fang, B., Cheng, F., Xu, X., Ni, S., Zhang, W., Ye, C., Chen, W., and Venables, D. S.: Amplitude-modulated cavity-enhanced absorption spectroscopy with phase-sensitive detection: A new approach applied to the fast and sensitive detection of NO2, Anal. Chem., 94, 3368–3375, https://doi.org/10.1021/acs.analchem.1c05484, 2022.