
the Creative Commons Attribution 4.0 License.
the Creative Commons Attribution 4.0 License.
1.645 µm differential absorption lidar measurements of atmospheric methane using an Er:YAG laser
Dimitri Edouart
Fabien Gibert
Claire Cénac
A differential absorption lidar (DIAL) based on an Er:YAG laser was used to retrieve methane concentration profiles within the mixed layer along a near-horizontal line of sight (4° above the horizontal) from the École Polytechnique site, directed northward toward the western part of the city of Paris. The achieved precision remains below 1 % up to a range of 3.5 km for profiles with a spatio-temporal resolution of 470 m per 20 min. The measurements were compared with in situ observations from an ICOS (Integrated Carbon Observation System) site located 5 km from the lidar. The lidar successfully captured the late stage of the dispersion of a methane plume originating from a fire occurred at a waste-sorting facility in the city of Paris, in good agreement with the in situ measurements. Both random and systematic errors in the lidar measurements are dominated by uncertainties in the ON wavelength measurement.
- Article
(1348 KB) - Full-text XML
- BibTeX
- EndNote
Methane (CH4) is the second most important anthropogenic greenhouse gas after CO2. CH4 emissions come from various sources, ∼ 60 % of which being anthropogenic through three major processes: anaerobic biochemical degradation of organic matter (wetlands, termites, livestock, rice cultivation, landfills); natural degassing of the Earth's crust and the exploitation of fossil fuels; and biomass burning under low-oxygen conditions (Saunois et al., 2020). The terrestrial sink of CH4 results primarily (∼ 90 %) from oxidation by the OH radical and from chemical reactions with the Cl radical (in the marine environment) or from heterogeneous reactions (in dry soils). The current trend, i.e., the significant increase of atmospheric CH4 since 2007, is not compatible with the Paris Agreement's objective of limiting the global warming to below 2 °C compared to pre-industrial levels and requires action from the scientific community to understand, locate, measure, and verify inventories of CH4 emissions across various spatial scales. An in-situ measurement network exists at the surface (150 stations) but remains heterogenous in time and space, while uncertainties concern both individual processes and the regional scale. These observations are completed by vertical profiles in the troposphere (routine AIRCORE profiles) (Membrive et al., 2017), by passive remote sensing measurements from the ground (TCCON: Total Carbon Column Observing Network) (Zhou et al., 2019), and, since 2003, by reconstructions of integrated methane columns from space (SCIAMACHY, IASI, TANSO-FTS (GOSAT), TROPOMI) (Buchwitz et al., 2000; Clerbaux et al., 1998; Butz et al., 2011; Lorente et al., 2021; among others). Private nanosats (e.g., GHGsat, Bluefield, methaneSAT) also have objectives for estimating local industrial sources.
Differential absorption lidar (DIAL) is well suited tool to monitor CH4 concentration in the atmosphere, as it enables three-dimensional mapping of anthropogenic methane plumes, vertical profiling in the troposphere and study of the atmospheric transport when combined with wind measurements. Note that global observations from space are also foreseen in a near future with the development of the MERLIN CH4 lidar mission (launch is currently planned to 2029) (Ehret et al., 2017).
The expected lidar performance in terms of spatial and temporal resolution, as well as measurement precision, depends on the intended application. From a ground-based perspective, the lidar could contribute to the validation of satellite observations, in particular those from the MERLIN lidar mission. For this purpose, high spatial and temporal resolution is not critical. An integration time of one hour combined with a vertically integrated measurement would be sufficient to validate the satellite observations. However, it will still be necessary to achieve the 1 % relative statistical error on the integrated column expected for MERLIN. For applications aimed at methane city emission inventories, a spatial resolution of 1 km associated with a temporal integration time of 1 min and a relative statistical error on methane concentration of approximately few percent are expected (Saboya et al., 2022). The requirements for methane flux measurements using the eddy covariance method are the most demanding. Indeed, this application requires, first, spatial and temporal resolutions on the order of 100 m and 10 s, respectively, to respect turbulence scales together with a precision on the order of 1 % to obtain a 1 h mean significant geophysical flux measurement (Nemitz et al., 2018).
Since the late 1990s, several DIAL systems have been developed for atmospheric methane measurements. Ikuta et al. (1999) used a Ti:sapphire laser combined with a Raman cell to access methane absorption lines near 1.67 µm, with a system primarily dedicated to methane leak detection at ranges of a few hundred meters. The National Physical Laboratory (NPL, UK) subsequently developed a containerized DIAL system with scanning capabilities for field deployments, dedicated to monitoring methane emissions at industrial sites (Innocenti et al., 2017). ONERA also developed a DIAL system for industrial methane leak detection (Cezard et al., 2020), based on fiber laser technology combined with a Raman cell to reach methane absorption lines. Its heterodyne detection scheme additionally enables radial wind measurements, opening perspectives for the quantification of methane emission rates. Stroud et al. (2023) developed a multi-wavelength DIAL system based on an optical parametric oscillator (OPO) laser and photomultiplier tube (PMT) detection. The multi-wavelength capability relaxes the constraints on wavelength accuracy. The airborne HALO (High Altitude Lidar Observatory) system, also based on an OPO laser and using InGaAs avalanche photodiode (APD) detection, is primarily dedicated to integrated path differential absorption (IPDA) measurements, but has demonstrated its capability to retrieve methane profiles within the atmospheric boundary layer (Barton-Grimley et al., 2022). Meng et al. (2018) proposed an alternative detection approach using nonlinear optical frequency conversion (upconversion detection), enabling the use of PMTs in the visible spectral range, where detector performance is significantly enhanced, and demonstrating promising potential for range-resolved methane measurements. Veselovskii et al. (2019) investigated the retrieval of atmospheric methane profiles using the Raman lidar technique. Due to the very weak Raman signal, measurements are limited to nighttime conditions, and significant biases were reported, potentially originating from aerosol fluorescence.
In this study, we present methane mixing ratio profile measurements obtained with a DIAL system using a novel laser source based on Er:YAG crystals (Edouart et al., 2024). This laser technology provides high optical power with good wall-plug efficiency and features a simpler architecture compared to OPO-based systems. We first describe the lidar system design, then detail the data processing chain used to retrieve methane mixing ratio profiles. Atmospheric measurements performed along a quasi-horizontal line of sight and their comparison with in situ observations are presented. Finally, the main sources of random and systematic errors affecting the lidar measurements are identified and quantified.
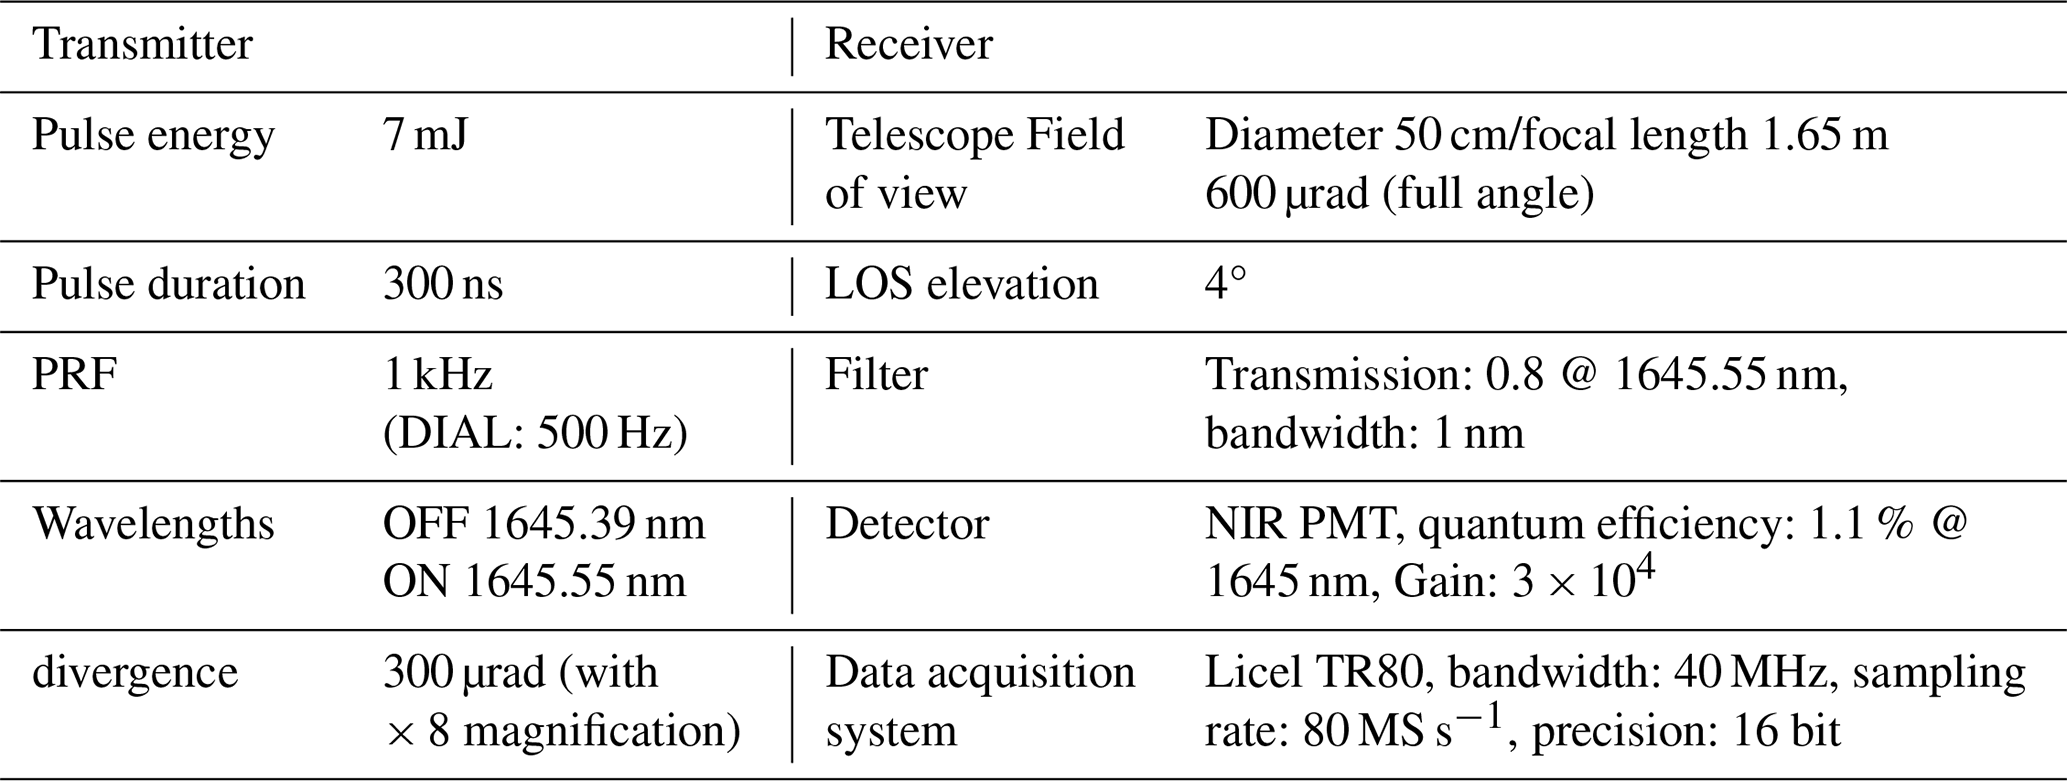
The schematic layout of the lidar system is shown in Fig. 1 and its main specifications are summarized in Table 1. The laser source is a prototype developed in the laboratory. Its operation and performance have been described in detail in Edouart et al. (2024). Here, we briefly recall its main characteristics. The laser cavity contains an 8 cm long Er:YAG rod (0.25 % doping) and an acousto-optic Q-switch (AOM) enabling pulsed operation. The output coupler transmission is 20 %. The dichroic mirrors surrounding the Er:YAG crystal are plane, while those around the AOM Q-switch are concave with a radius of curvature of 1 m. Two linearly polarized Erbium-doped fiber pump lasers (IPG Photonics – model ELR-30-1532-LP), each delivering 30 W at 1532 nm, are combined using a polarizer to end pump the Er:YAG crystal inside the cavity. An additional polarizer is inserted in the cavity to enforce linearly polarized emission. Although such polarization is not required for direct-detection DIAL measurements, it enables the future implementation of a heterodyne detection channel, thus allowing simultaneous wind velocity retrieval in addition to methane concentration measurements as it was previously done for CO2 (Gibert et al., 2015). Provided that the spatio-temporal resolution is sufficient, this combination could give access to turbulent methane flux measurements using the lidar eddy-covariance technique (Gibert et al., 2025). The laser cavity is seeded alternately by two continuous-wave (CW) fiber-coupled distributed-feedback (DFB) diode lasers (output power: 15 mW), using a fast fiber switch (fSWT). This fast fiber switch, featuring a switching time of 100 ns, is configured in a dual-stage configuration, thereby providing a crosstalk of 35 dB between the two channels. It alternates the wavelengths on a shot-to-shot basis at the 1 kHz laser repetition rate. Consequently, the DIAL measurements are repeated at a rate of 500 Hz. The seeders are injected into the laser cavity through the first diffraction order of the AOM. A booster optical amplifier (BOA) is employed to maintain an injection power of 15 mW despite insertion losses of the fiber components. One DFB wavelength is tuned to the center of the methane triplet at 1645.55 nm (ON line), while the second is tuned close to the absorption line at 1645.39 nm (OFF line). Each wavelength is locked to the cavity resonance by applying an external phase modulation with an electro-optic modulator (EOM) and implementing a Pound-Drever-Hall (PDH) double-phase servo loop (Gibert et al., 2014). Despite the difference in Er:YAG gain between the ON and OFF wavelengths, the laser emits pulses with identical energy (7 mJ) and duration (300 ns) at a repetition rate of 1 kHz, as a differential loss is introduced by the AOM Q-switch between the two wavelengths (Edouart et al., 2024). Two fiber couplers extract 10 % of the power from each DFB for wavelength monitoring with a wavemeter (Bristol 621 A-IR, accuracy: 35 MHz @ 1645 nm). The wavelength measurement alternates between the two DFBs using a fiber switch (sSWT) toggling every 10 s, thereby tracking the slow drift of each seeder locked to the laser cavity. The wavemeter requires a few seconds to stabilize its measurement, therefore, a 10 s switching interval represents a good compromise between accurate wavelength measurement and effective monitoring of the slow drift of the ON and OFF wavelengths. A beam expander with a magnification of × 8 is used to reduce the laser beam divergence to approximately 300 µrad (full angle). Relay mirrors direct the beam vertically along the telescope optical axis. A large gold-coated steering mirror is used to direct the beam along a nearly horizontal line-of-sight while reflecting the atmospheric backscattered lidar signal towards the telescope. An elevation angle of 4° above the horizontal was maintained to avoid obstacles in the line-of-sight. The telescope is of Newtonian type, with a 50 cm diameter primary mirror (gold-coated) and a focal length of 1.65 m. An iris placed at the focal plane limits the detection field-of-view (full angle) to 600 µrad. An interference filter centered at 1645.55 nm with a 1 nm bandwidth is used to filter the solar background while transmitting the laser wavelengths. The telescope primary mirror is imaged onto the photocathode of a photomultiplier tube (NIR PMT, Hamamatsu-H10330C-75), and the signal is subsequently digitized by a lidar signal acquisition module (Licel TR80-16bit-3U). The Licel module includes two separate memory channels that allow ON and OFF shots to be accumulated independently while the laser alternates between the two wavelengths. The PMT gain is limited to 3 × 10⁴ (corresponding to an applied voltage of −400 V) in order to restrict the continuous anode current generated by the solar background transmitted through the interference filter during daytime measurements. The Licel acquisition module can operate in both the analog mode (voltage digitization via an analog-to-digital converter) and the photon-counting mode. The measurements presented here make use of the analog mode only. It should be noted that, since the laser pulse duration is 300 ns, the spatial resolution of the lidar profile cannot exceed 45 m. As the lidar signal is sampled at 80 MSamples s−1 by the acquisition module, corresponding to one point every 1.9 m, the profile is therefore oversampled with respect to its actual spatial resolution.
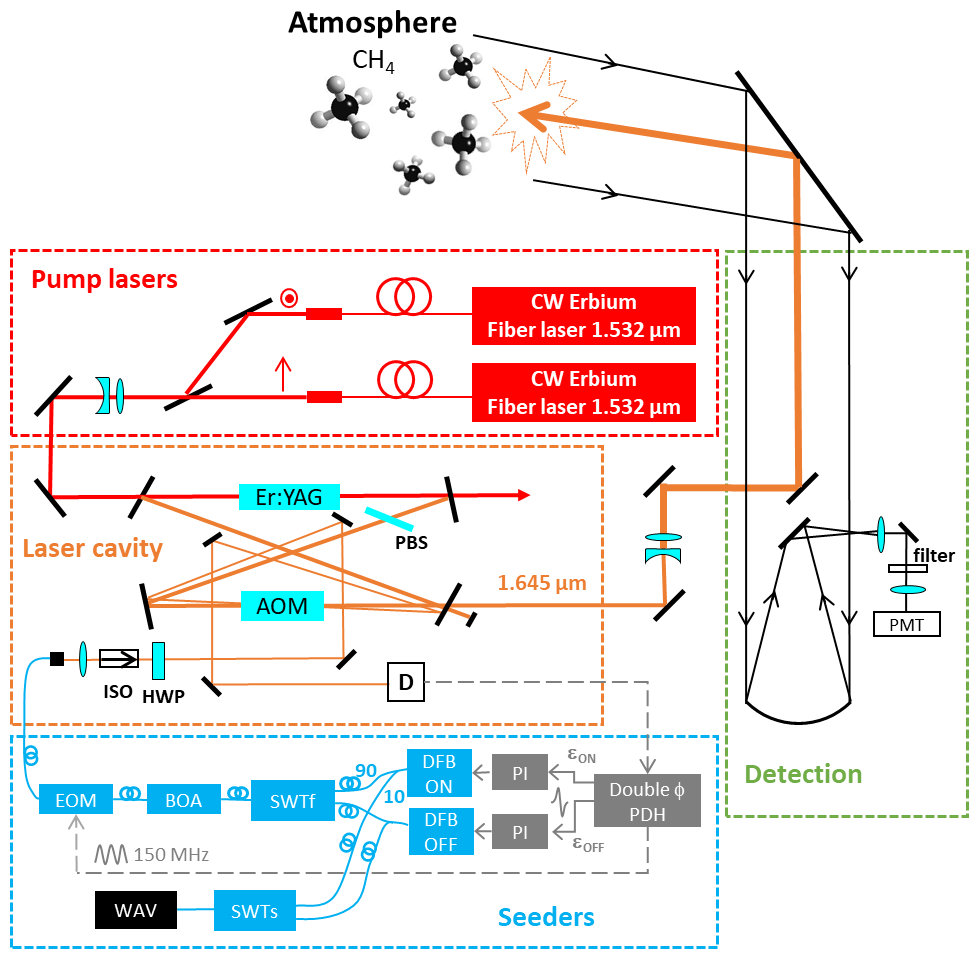
Figure 1DIAL set-up for methane measurements. AOM: acousto-optic modulator, PBS: polarization beam splitter, ISO: optical isolator, HWP: half wave plate, D: detector, EOM: electro optic modulator, BOA: boost optical amplifier, fSWT: fast optical switch, sSWT: slow optical switch, WAV: wavemeter, PI: proportional integral servo controller, PMT: photo-multiplier tube.
The lidar system is installed on the second floor of the laboratory, located 10 km southwest of Paris. The 45° steering mirror positioned above the telescope is mounted at roof level, approximately 15 m above ground. The laser beam is directed northward, toward the western suburbs of Paris.
3.1 DIAL equations
The principle of the DIAL (Differential Absorption Lidar) technique for measuring atmospheric methane profiles relies on the acquisition of two lidar signals. The first one, referred to as the OFF-line profile, corresponds to a wavelength only weakly absorbed by the atmospheric gases, particularly methane, and serves as a reference. The second one, the ON-line profile, is spectrally positioned on a methane absorption line that is spectrally isolated from the absorption lines of other atmospheric constituents and as close as possible in wavelength to the OFF-line. Consequently, the only significant difference between the two profiles arises from methane absorption. From these two profiles, the differential absorption optical depth (DAOD) due to methane absorption along the line of sight can be computed and related to the methane dry-air mixing ratio profile by the following expression:
where S(λOFF,R), S(λON,R) are the lidar power profiles at the OFF and ON wavelengths, respectively; is the methane dry-air mixing ratio profile; nd(r) is the dry-air molecular number density profile; and , are the effective methane absorption cross-sections at the ON and OFF wavelengths. The methane mixing ratio profile is then retrieved by derivation of the previous expression:
with , the differential absorption coefficient, and , the weighting function.
The ON and OFF lidar profiles used to compute the differential optical depth are averaged over several laser shots and spatially integrated along the line of sight, resulting in a coarser effective range resolution than the original sampling resolution of 1.9 m at 80 MS s−1. Such spatial and temporal averaging is necessary to achieve sufficient signal-to-noise ratios (SNR), ensuring that the ratio remains positive and that the optical depth (Eq. 1) can be reliably computed. The ratio of the two profiles can then be temporally integrated so that the SNR on the optical depth becomes high enough to allow a bias-minimized estimation of its derivative. These considerations regarding the space and time integration of the lidar profiles will be discussed in more detail in a subsequent section.
3.2 Weighting function calculation and spectroscopy
To retrieve the methane mixing ratio profile, the DIAL method requires the computation of the weighting function. The effective absorption cross-sections take into account the laser spectral linewidth and possible spectral impurities of the emitted pulses. In the present measurements, which are limited to the atmospheric boundary layer, the lidar backscatter is dominated by Mie scattering from aerosols. This scattering regime causes a spectral broadening of the scattered light on the order of a few MHz, which remains negligible compared with the methane absorption linewidths (typically of the order of GHz). Furthermore, the spectral impurity of the laser source used here can also be neglected (Edouart et al., 2024). As a result, the effective absorption cross-sections can be considered equal to the methane absorption cross-sections at the ON and OFF wavelengths and the weighting function can thus be expressed as:
The dry-air number density profile is given by:
where p, T, ρw are the pressure, temperature, and water vapor mixing ratio profiles along the line of sight, and kB is the Boltzmann constant. In addition, the absorption cross sections also depend on temperature and pressure. Consequently, computing the weighting function requires knowledge of the pressure, temperature, and water vapor profiles. For the quasi-horizontal profiles considered here, standard atmospheric profiles are assumed.
The methane absorption cross-sections are obtained by interpolating precomputed spectral atlases with a resolution of 5 × 10⁻⁴ cm−1, covering the range of thermodynamic conditions encountered in the atmosphere (44 pressure levels and 12 temperature levels per pressure level). These atlases are generated using the HITRAN2020 spectroscopic database (Gordon et al., 2022), which includes recent improvements in methane spectroscopic parameters (Delahaye et al., 2016, 2019). The calculations apply the Hartmann–Tran line-shape model (Ngo et al., 2013) and account for line mixing, particularly for the methane multiplet near the ON wavelength. Figure 2 shows the absorption spectra of methane, water vapor, and carbon dioxide at ground level. The CO2 lines can be neglected, whereas water vapor contributes non-negligibly to the total absorption, especially between 1645.0–1645.5 nm and beyond 1645.7 nm. Because water vapor concentration can vary by more than an order of magnitude, it is essential to select ON and OFF wavelengths with similar water vapor absorption. Indeed, since the residual water vapor absorption at the ON wavelength cannot be neglected without introducing a potential bias in the methane measurement, the OFF wavelength must be selected to exhibit a water vapor absorption identical to that at the ON wavelength. This ensures that the corresponding differential optical depth is zero and that the potential bias is eliminated regardless of the water vapor content (Refaat et al., 2015). The selection of the OFF wavelength must also provide a suitable differential optical depth for methane DIAL measurements. Three OFF candidates were considered: 1645.31, 1645.39, and 1645.88 nm. Due to the Er:YAG gain bandwidth, wavelengths beyond 1645.6 nm are difficult to reach (Edouart et al., 2024). Although using 1645.31 nm as the OFF wavelength would provide a slightly larger differential optical depth, this wavelength lies near the edge of the interference filter transmission band. Therefore, 1645.39 nm was selected as the OFF wavelength. In the current laser configuration, the ON and OFF wavelengths may slightly drift over time, since they are locked to the laser cavity rather than to an absolute reference (e.g., a methane absorption cell). As the wavelengths are continuously monitored by the wavemeter, the weighting function can be recalculated accordingly to compensate for these drifts. However, such drifts may also lead to incomplete compensation of residual water vapor absorption between the ON and OFF wavelengths. In that case, the contribution of water vapor must be subtracted from the measured differential absorption coefficient prior to deriving the methane mixing ratio profile, using either external water vapor measurements or a modeled humidity profile.
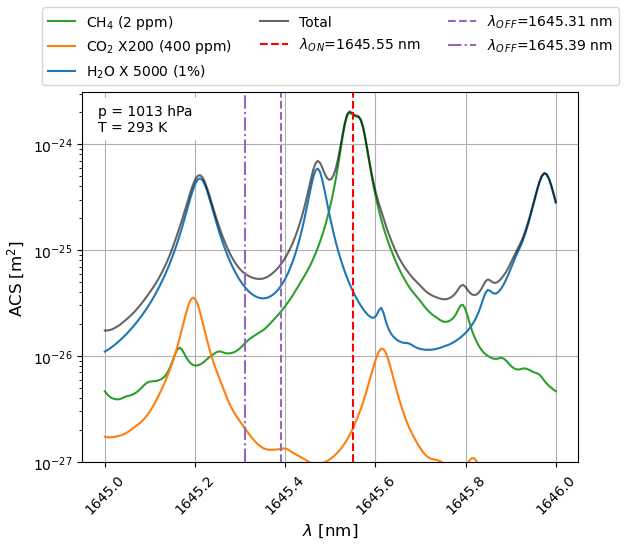
Figure 2Absorption cross sections of the CH4 multiplet near 1645.55 nm, together with those of H2O and CO2 normalized to their relative atmospheric abundances with respect to CH4. The positions of the ON wavelength and the OFF wavelengths accessible with the Er:YAG laser are also indicated.
4.1 ON and OFF lidar profiles
The lidar measurements were conducted on the morning of 8 April 2025 between 10:30 and 13:30 LT (local time). The Licel acquisition module integrates 2000 laser shots for both ON and OFF wavelengths in real time, resulting in ON and OFF profiles recorded with a temporal resolution of 4 s. A screening of the profiles is performed to eliminate those obtained with improperly seeded laser pulses, which are likely to exhibit a non-compliant spectral profile. This screening is carried out by monitoring the pulse build-up time. Under nominal operating conditions (i.e., in the absence of significant mechanical or thermal disturbances), such malfunctions are rare (< 0.3 %). These raw ON and OFF profiles are then integrated along the line of sight using a 25-point moving average. The resulting spatial resolution is therefore 47 m, which corresponds to the limit imposed by the 300 ns laser pulse duration. Distance-corrected ON and OFF quicklook profiles are shown in Fig. 3 (left). The color scale is displayed on a logarithmic axis because the signal dynamics between particulate and molecular scattering are very large in the near-infrared. At the beginning of the measurement sequence, since the laser beam is slightly inclined upward (4° above horizontal), it exits the boundary layer at a distance of 4 km. The subsequent rise of the boundary layer over the course of the time series is clearly observable. The retrieval of methane mixing ratios will here be limited to the first 5 km, where atmospheric backscatter is dominated by particulate scattering. Indeed, because molecular scattering in the near-infrared is much weaker than particulate scattering, the measurement precision degrades significantly outside the boundary layer. Moreover, DIAL processing using signals dominated by molecular scattering is more complex (Bösenberg, 1998) and will be addressed in a subsequent publication.
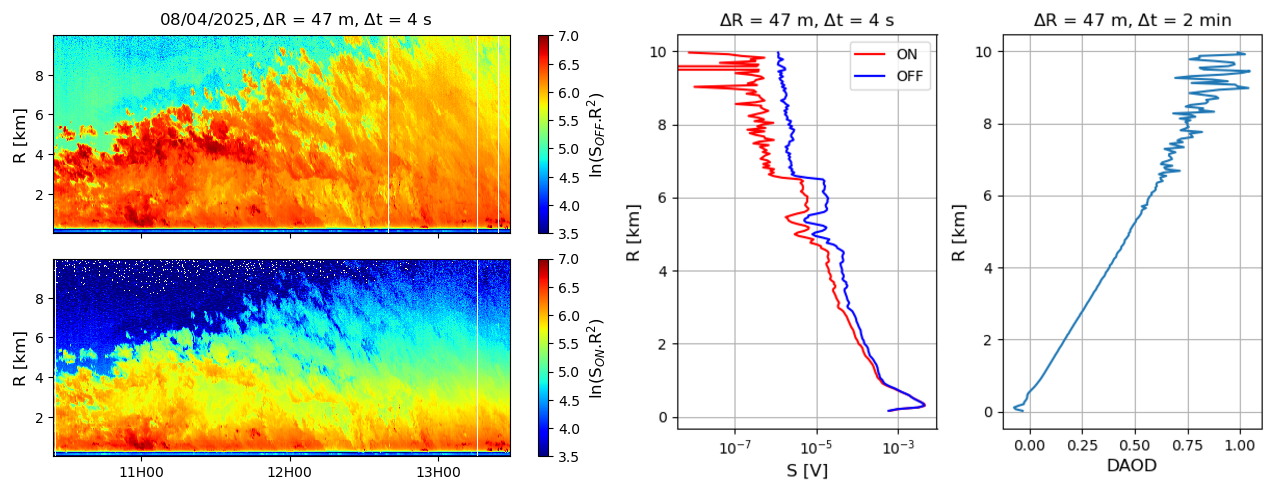
Figure 3Time series of the logarithm of the range-squared-corrected ON and OFF signals (left). Examples of ON and OFF signals and the corresponding DAOD around 11:16 LT (right).
4.2 Temporal integration of the lidar signals
To determine the minimum temporal integration times for the ON and OFF signals, Fig. 4 (left) presents the Allan deviations of these signals at distances of 5 and 10 km. For the ON and OFF signals at 5 km, the Allan deviation follows a dependence up to τ ≈ 100 s. This indicates that the signal fluctuations are dominated by turbulent atmospheric motions following a Kolmogorov law. The instrumental noise of the 4 s integrated signals is therefore lower than the atmospheric turbulent fluctuations. At a distance of 10 km, the ON-signal fluctuations are dominated by white instrumental noise ( law) up to τ ≈ 30 s. Thus, at this range, additional temporal averaging of the lidar signals is required to reduce instrumental noise before atmospheric fluctuations can emerge. The OFF-signal fluctuations at 10 km lie between both regimes at small τ and then follow a Kolmogorov-type behavior similar to the 5 km signals. For τ > 100 s, turbulent fluctuations give way to larger-scale atmospheric variations.
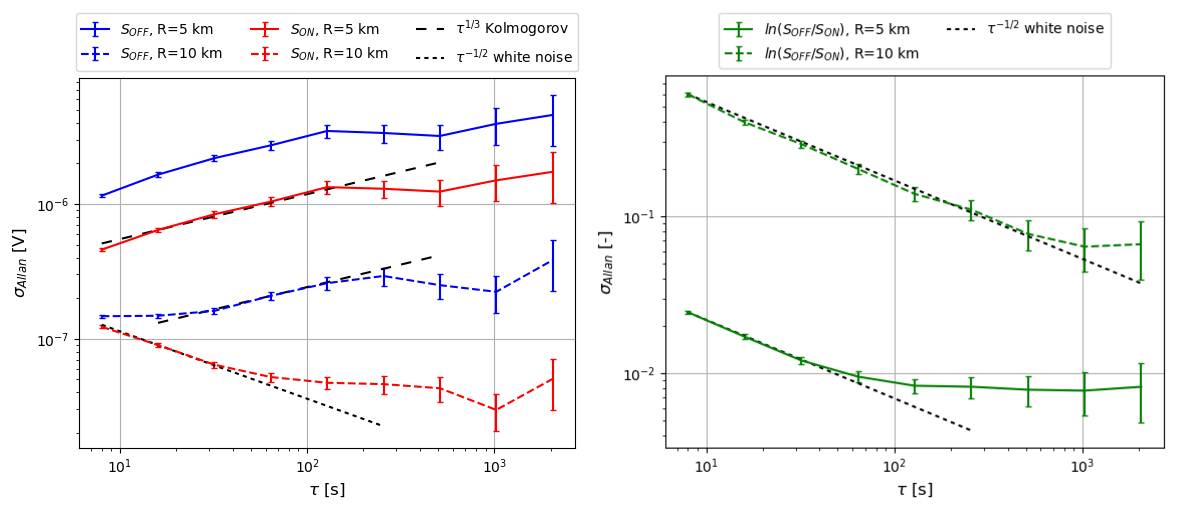
Figure 4Allan deviation of the ON and OFF signals at ranges of 5 and 10 km (left). Allan deviation of the DAOD at 5 and 10 km (right). Characteristic Allan deviation trends for white noise and for a turbulent signal with a Kolmogorov-type spectrum are added for comparison.
When the temporal integration of the lidar signals is sufficient for instrumental noise to become negligible, the DAOD can be retrieved. Turbulent fluctuations in the ON and OFF signals cancel in the ratio , leaving the DAOD dominated by instrumental noise. This is illustrated in Fig. 4 (right), which shows the Allan deviation of at distances of 5 and 10 km. At 5 km, white instrumental noise dominates the DAOD fluctuations for τ up to roughly 100 s. This indicates that after a few minutes of integration, the lidar precision is sufficient to resolve fluctuations in atmospheric methane concentration and/or a drift of the weighting function. Such a potential drift of the weighting function may in particular be caused by spectral drifts of the laser wavelength, which is not actively stabilized. At a distance of 10 km, the DAOD must be averaged for more than one thousand seconds (∼ 17 min) for instrumental noise to become negligible. Accordingly, for ranges shorter than 5 km, the DAOD will be integrated over 2 min in order to minimize instrumental white noise. Figure 3 (right) shows an example of the DAOD integrated over 2 min. Further integration of the DAOD could introduce an additional error in the retrieval of the methane mixing ratio due to a potential drift of the weighting function. To further reduce the statistical uncertainty, the methane mixing ratio itself must then be temporally averaged. In this study, methane mixing ratios retrieved with a 2 min temporal resolution are averaged over 20 min to reduce the statistical error.
4.3 Calculation of the weighting function
To compute the weighting function (see Eq. 3), it is first necessary to determine the dry air density profile (see Eq. 4). The SIRTA observatory at the École Polytechnique site (https://sirta.ipsl.fr/, last access: July 2026) provides measurements of surface pressure, as well as temperature and humidity measured on a 50 m mast. Since the laser beam has a slight upward inclination (4° above the horizontal), typical decreases in temperature and pressure with altitude are taken into account in the calculation of the weighting function. The water vapor mixing ratio is assumed to be constant, as the lidar measurement of the methane profile is restricted to the mixed layer. The temperature and pressure profiles are also used to compute the absorption cross sections by interpolating spectroscopic atlases at the ON and OFF wavelengths recorded by the wavemeter. Figure 5 shows the time series of surface pressure, temperature, and humidity, as well as the wavelength drifts of the ON and OFF pulses and the corresponding weighting functions at the lidar location (R=0 km) and at a range R=5 km.
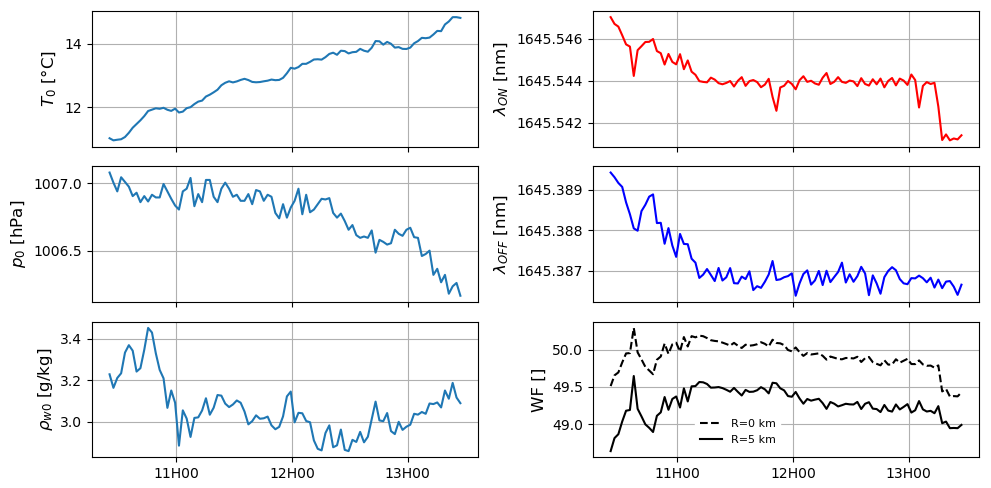
Figure 5Time series of surface pressure, temperature, and humidity (at 50 m) provided by the SIRTA observatory (left). Measurements of the ON and OFF wavelengths and evolution of the weighting functions at the lidar location (R=0 km) and at a range R=5 km (right).
4.4 Time series of methane mixing ratio profiles
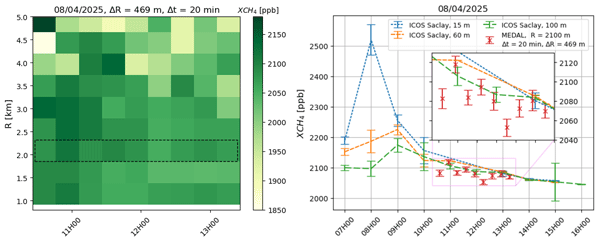
The time series of methane mixing ratio profiles is shown in Fig. 6 (left). Differential absorption coefficients are computed using linear fits applied to contiguous range gates of 10 points. As a result, the spatial resolution of the profile is reduced to 469 m. The use of a linear fit based on the least-squares method corresponds to the maximum-likelihood estimator when the noise is assumed to be Gaussian, white, and of constant variance. In addition, the fit provides an estimate of the uncertainty in the calculated slope and therefore allows the statistical error associated with the methane retrieval to be assessed. Methane mixing ratios retrieved with a 2 min temporal resolution are subsequently averaged over 20 min to reduce the statistical uncertainty. The first two range gates are not shown because the corresponding measurements exhibit a substantial bias. This bias is most likely due to a difference in the overlap function between the ON and OFF laser pulses. This difference, which still needs to be investigated, may have several origins. It could arise from a difference in the pointing of the ON and OFF pulses or from a difference in transmission through the interference filter caused by larger angles of incidence during the overlap region. The measurements are compared with observations from an instrumented tower belonging to the ICOS (Integrated Carbon Observation System) network (https://meta.icos-cp.eu/resources/stations/AS_SAC, last access: July 2026), located 5 km west of the laboratory. This tower is equipped with in situ analyzers based on Cavity Ring-Down Spectroscopy (CRDS). Measurements are performed at three heights: 15, 60, and 100 m. Figure 6 (right) compares the lidar measurements at a range of 2100 m with the tower observations. This lidar range gate is also located approximately 5 km from the ICOS station. The uncertainty bars of the ICOS measurements represent the dispersion of the measurements within each hourly interval. Uncertainties in the lidar measurements arise from the linear fit used to determine the differential absorption coefficient. The differences in methane concentration between the ICOS measurements (at 100 m) and the lidar measurements averaged over one hour up to a range of 3.5 km remain below 50 ppb. A fire occurred at a waste-sorting facility located in the city of Paris on the evening of 7 April. This event generated an aerosol plume accompanied by an increase in atmospheric methane concentration. The methane plume was detected by the ICOS tower, with a maximum concentration observed around 08:00 LT at 15 m and around 09:00 LT at 60 and 100 m. Under the nocturnally stratified atmospheric conditions, methane concentrations at 15 m reached 2500 ppb, corresponding to an increase of approximately 25 %, with a measurement dispersion of 50 ppb. At 60 and 100 m, the concentration peak was lower, around 2200 ppb. The lidar observed the tail of the plume between 10:30 and 13:30 LT. The lidar measurements are in agreement with the tower observations within their respective errors bars and show a gradual decrease in methane concentration, indicating the end of the plume dispersion.
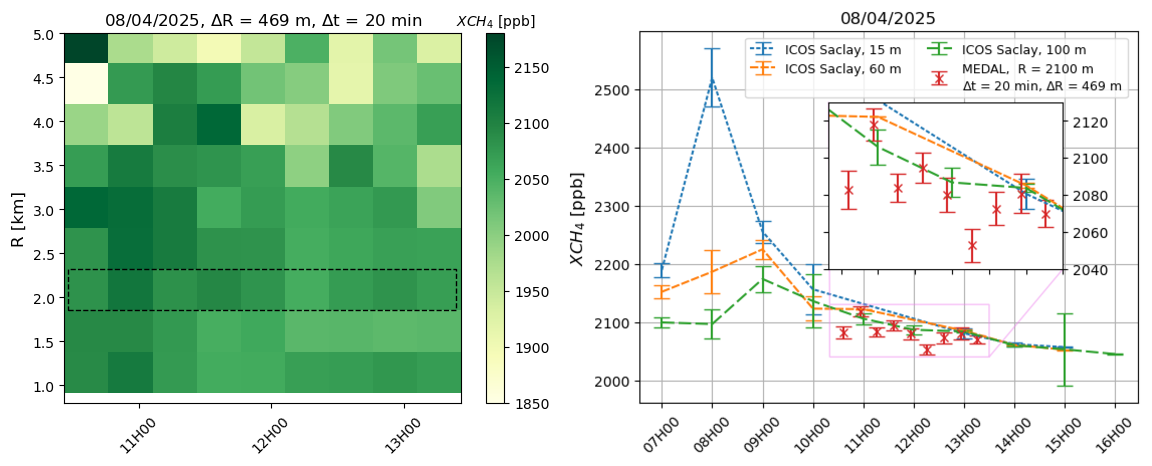
Figure 6Time series of methane concentration profiles measured by the lidar (left). The time series enclosed by the dashed outline is shown in the figure on the right. Comparison between ICOS tower measurements (heights: 15, 60, 100 m) and lidar measurements at a range of 2100 m (right).
5.1 Random error
From Eq. (2), the error propagation on the methane mixing ratio is given by the following expression:
5.1.1 Weighting function random error
The first term accounts for the error in the estimation of the weighting function arising from fluctuations of its parameters during the DIAL measurement. These parameters include temperature, atmospheric pressure, humidity, and the laser wavelength. It should be noted that temperature and pressure fluctuations affect both the dry air density and the absorption cross sections in Eq. (3). These fluctuations can be quantified using the Allan deviation computed over 2 min, corresponding to the temporal resolution of the DIAL measurement. The uncertainty in the weighting function associated with temperature, pressure, and wavelength variations involves absorption cross sections calculated from spectroscopic atlases. These uncertainties are therefore evaluated numerically, assuming linear error propagation for these small fluctuations. The uncertainty in the weighting function related to the water vapor mixing ratio only affects the air density and can be calculated analytically as:
Table 2 lists the 2 min fluctuations of temperature, pressure, humidity, and the ON and OFF wavelengths, together with the associated uncertainties in the calculation of the weighting function. The uncertainties are dominated by fluctuations of the ON wavelength. Uncertainties related to the absorption cross sections depend on the wavelength positioning. As shown in Fig. 7, the error induced in the weighting function by wavelength fluctuations is minimal at locations where the derivative of the absorption cross section with respect to wavelength is zero. If the ON wavelength is positioned on the flank of a methane multiplet, the relative error in the weighting function can exceed 1 %.
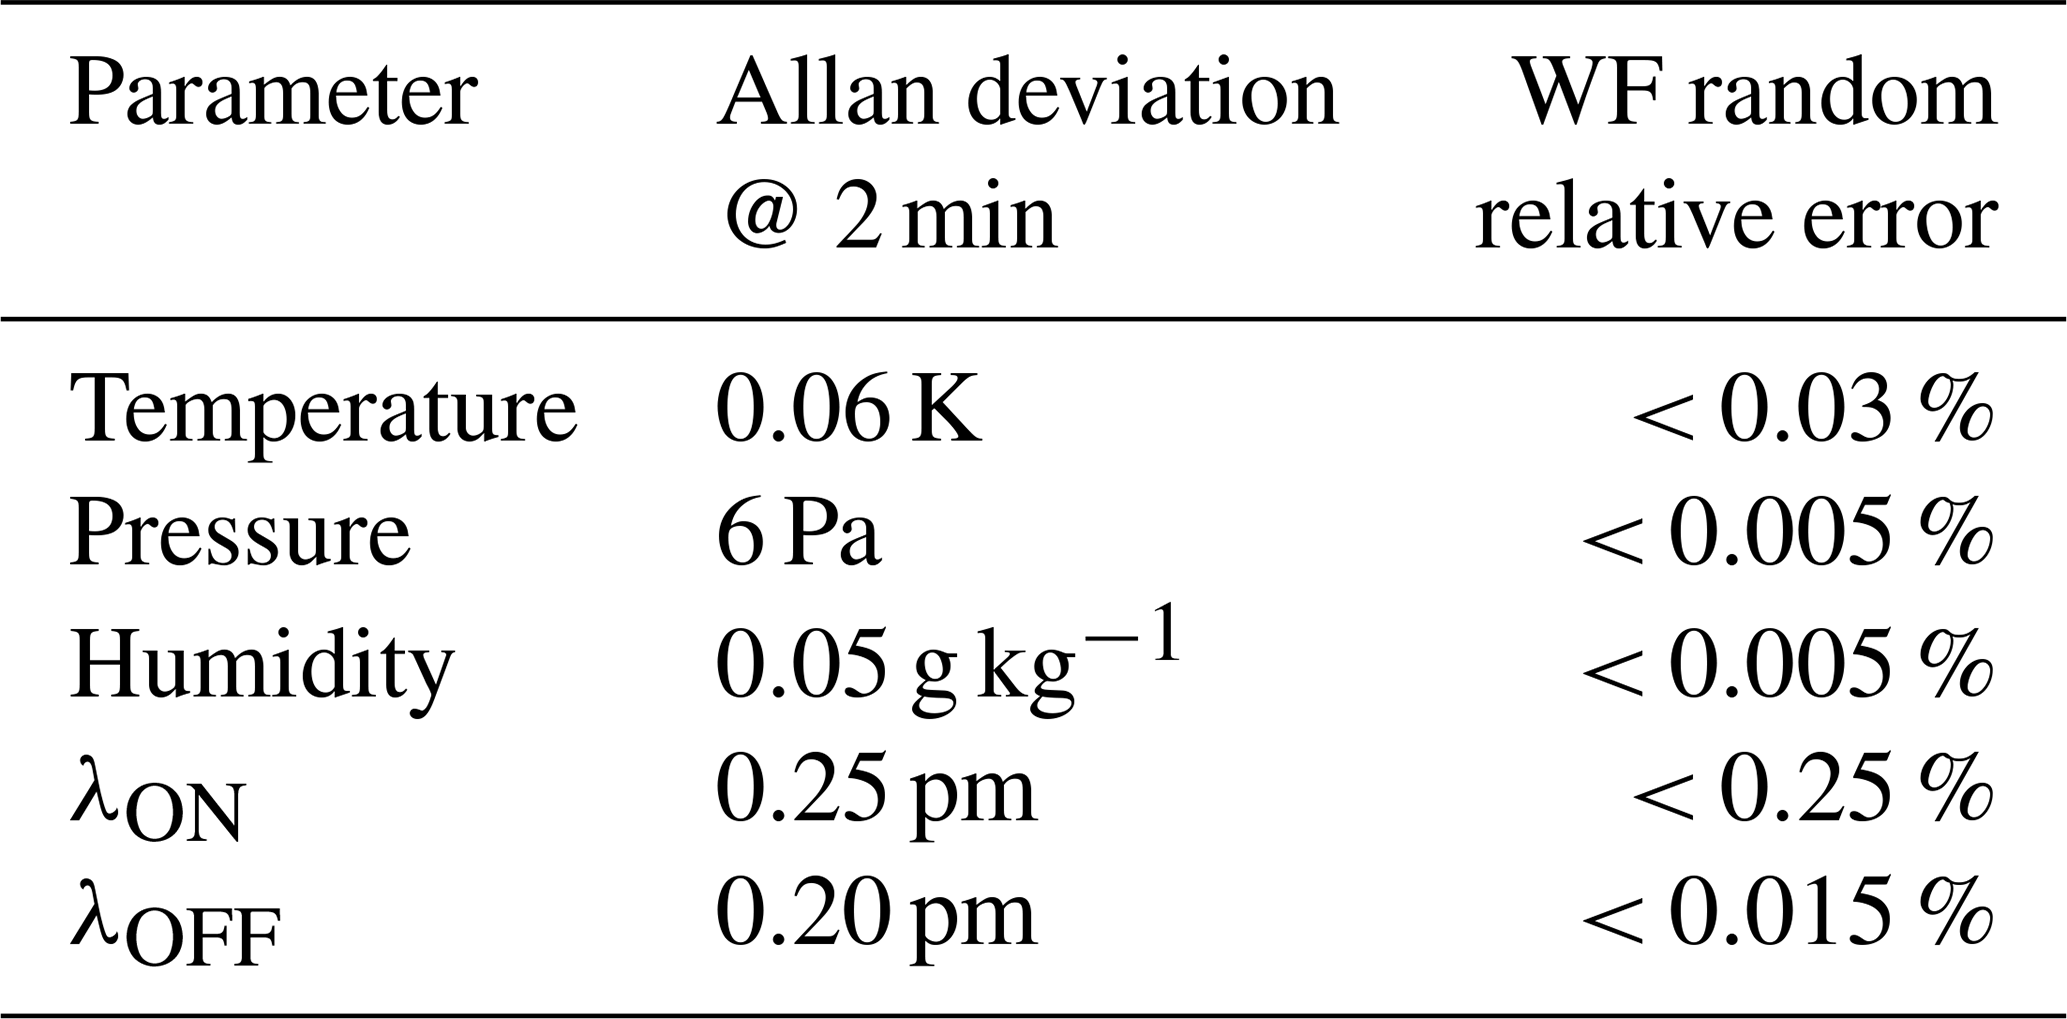
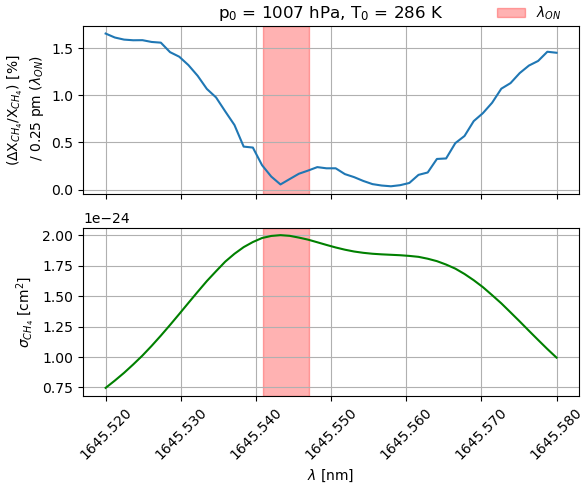
Figure 7Relative methane mixing ratio error induced by a 0.25 pm wavelength error as a function of the ON wavelength.
5.1.2 Differential absorption random error
The second term describes the error originating from the signal-to-noise ratio of the ON and OFF profiles. The uncertainty on the differential absorption coefficient corresponds to the uncertainty on the slope of the DAOD, determined using linear fits applied to each range gate. It can also be theoretically estimated from the SNR of the ON and OFF profiles (Bösenberg, 1998):
where ΔR is the length of the range gate used to compute the differential absorption coefficient, and the signal-to-noise ratio is defined as at the spatio-temporal resolution of the profiles. A radiometric budget shows that the noise affecting the ON and OFF signals resulting from aerosol scattering in the boundary layer is dominated by shot noise from the signal itself and from the solar background. The SNR of the ON and OFF signals for a single laser shot can therefore be expressed as:
where NS and Nbkg are the numbers of detected laser and solar photons, respectively, within the detection bandwidth. The number of detected photons can be derived from the digitized voltage as:
with Si the digitized voltage, e the electron charge, Rl the load resistance of the digitizer, G the PMT gain, and B the detection bandwidth. The SNR corresponding to the DIAL profile resolution to be used in Eq. (7) is computed assuming independent samples:
where nshot is the number of integrated laser shots required to reach the DIAL temporal resolution, ΔRDIAL is the DIAL spatial resolution, and ΔRRAW is the spatial resolution of the raw digitized profiles. Figure 8 shows a comparison between the theoretically calculated precision on the differential absorption coefficient derived from Eq. (7) and the precision computed using the uncertainties of the differential absorption coefficients obtained from linear fits applied to the DIAL range gates. Both precisions exhibit a similar dependence on range but differ by approximately a factor of five. In Fig. 6, the error bars of the ICOS measurements and those of the lidar measurements are nearly identical. The error bars of the ICOS measurements represent the dispersion over one hour of a time series of highly precise measurements (error < 1 ppb according to Hazan et al., 2016) and therefore reflect variations in atmospheric methane concentrations. At 11:00 LT, the relative dispersion of the methane concentrations measured by ICOS is 0.4 %. In Fig. 8, we observe that the methane fluctuations are larger than the theoretical lidar error. Consequently, the relative standard deviation measured by the lidar represents fluctuations in atmospheric methane concentrations.
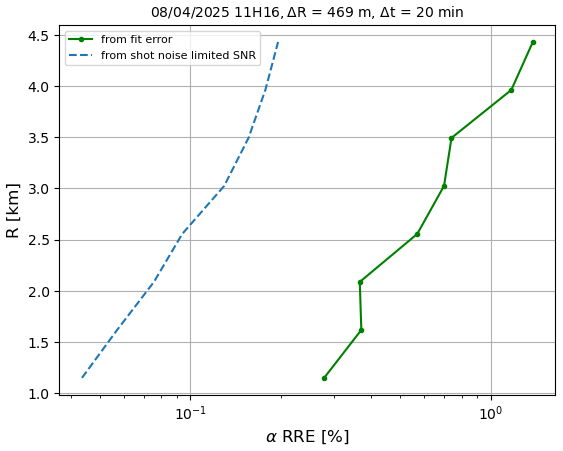
Figure 8Comparison of relative random errors on the differential absorption coefficient derived from linear-fit uncertainties and from Eq. (6) using shot-noise-limited SNRs.
5.2 Systematic error
A first source of bias arises from the accuracy of the laser spectral properties. The laser wavelength is measured using a wavemeter, whose manufacturer-specified wavelength accuracy is 0.2 ppm, corresponding to 0.3 pm at 1645 nm. This wavelength measurement uncertainty results in a 0.3 % bias in the retrieved methane mixing ratio, dominated by the bias on the ON wavelength. The spectral purity of the laser was measured to be greater than or equal to 0.996, leading to a bias of 0.03 % (Edouart et al., 2024). Spectroscopic data are known with a finite degree of accuracy. The R(6) multiplet of the 2ν3 methane band was studied in the framework of the MERLIN mission (Delahaye et al., 2016, 2019). The methane absorption cross section for the multiplet around the ON wavelength is known to within 0.1 %. For the OFF wavelength, the accuracy of the absorption cross section is 0.3 %. Since the ON absorption cross section is two orders of magnitude larger than the OFF absorption cross section, the uncertainty in the spectroscopic data is dominated by the uncertainty in the ON absorption cross section.
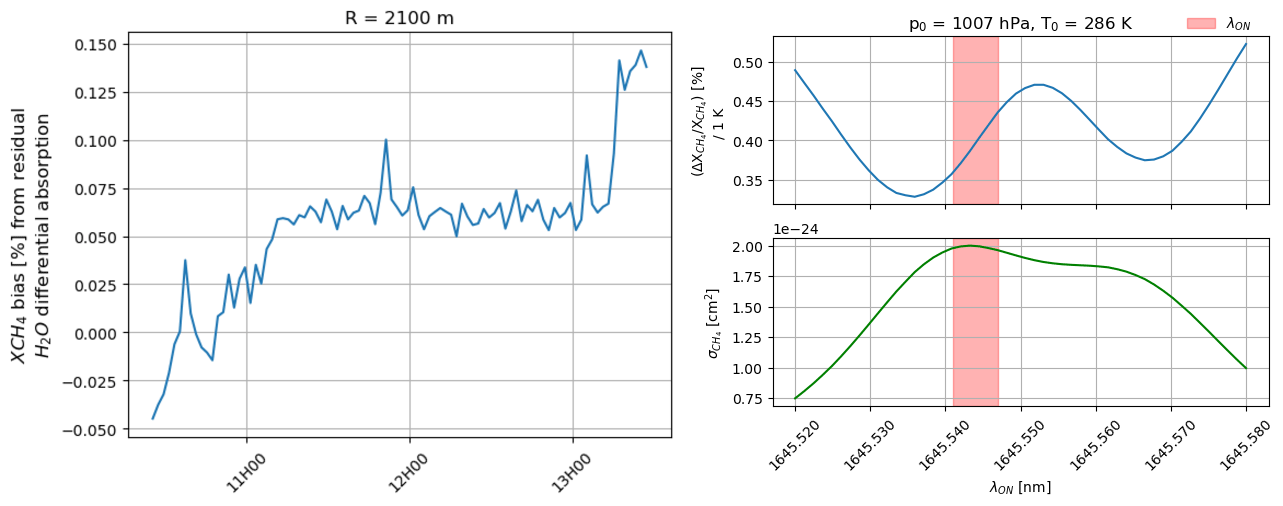
Figure 9Temporal evolution of the bias induced by residual water vapor absorption (left). Relative methane mixing ratio error induced by a 1 K temperature profile error as a function of the ON wavelength (right).
Another source of bias is the residual differential absorption by water vapor. The ON and OFF wavelengths defined in Fig. 2 are selected such that the differential absorption by water vapor is zero, thereby eliminating the corresponding bias. However, in the experimental setup used here, the laser wavelengths may experience small drifts, which can lead to residual differential water vapor absorption and introduce a bias:
where is the water vapor differential absorption, with the molecular number density of water vapor, the water vapor absorption cross section, and α the measured differential absorption. Figure 9 (left) shows the temporal evolution of this bias during the measurement for the range gate at 2100 m. Since the slope of the water vapor absorption cross section is steeper around the ON wavelength, this bias is more sensitive to drifts of the ON wavelength.
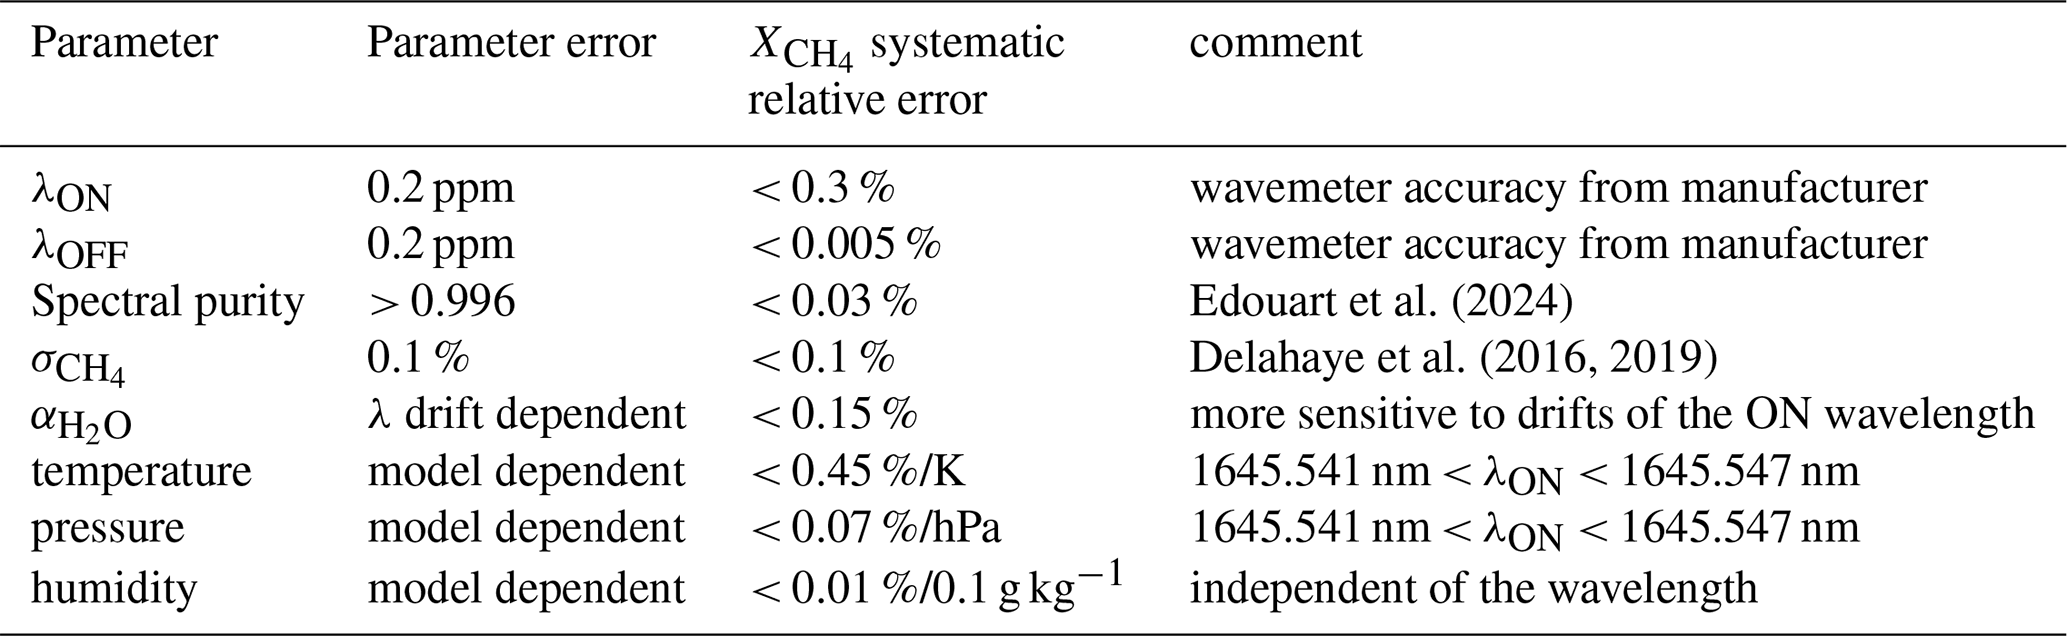
Table 3 summarizes the different biases and their sources. The largest instrument-related bias arises from the accuracy of the ON wavelength measurement provided by the wavemeter. The weighting function is computed using pressure, temperature, and humidity profiles. In most cases, these profiles are provided by models whose accuracy may vary. Table 3 shows that the error is highly sensitive to temperature. Figure 9 (right) illustrates the dependence of the temperature-induced error on the ON wavelength. This error is minimized near the edges of the multiplet lines and therefore does not correspond to the wavelengths for which the wavelength-induced error is minimal (see Fig. 7). This type of bias may explain the slight decrease in methane concentration observed at a range of approximately 1500 m. At this distance, the laser beam passes over a valley and therefore moves significantly away from the ground surface. As a result, the temperature used in the calculation of the weighting function is likely biased, leading to a bias in the retrieved methane concentration.
5.3 Discussion
A direct comparison of the performance of this lidar with other methane DIAL measurements reported in the literature is not straightforward, as the spatio-temporal resolutions and measurement ranges vary. In addition, performance can strongly depend on atmospheric conditions, in particular aerosol loading. Nevertheless, we attempted such a comparison by using Eq. (7) to scale the different precisions reported in the literature. The relative precision of the DIAL methane measurement follows the relation:
Assuming that the SNR is limited by shot noise of the signal, it is proportional to the square root of the signal. Since the signal scales as , the SNR ultimately varies as:
As a result, the relative random precision of the methane measurement can be expressed as:
This relation highlights that, for a DIAL measurement, increasing the range gate length (provided that the optical thickness allows it) is more advantageous than increasing the integration time. The above equation can be used to scale the performance measured by different lidars. Table 4 compares the performance obtained in this study with that reported in the only two publications providing a detailed evaluation of the precision of methane DIAL mixing ratio measurements.
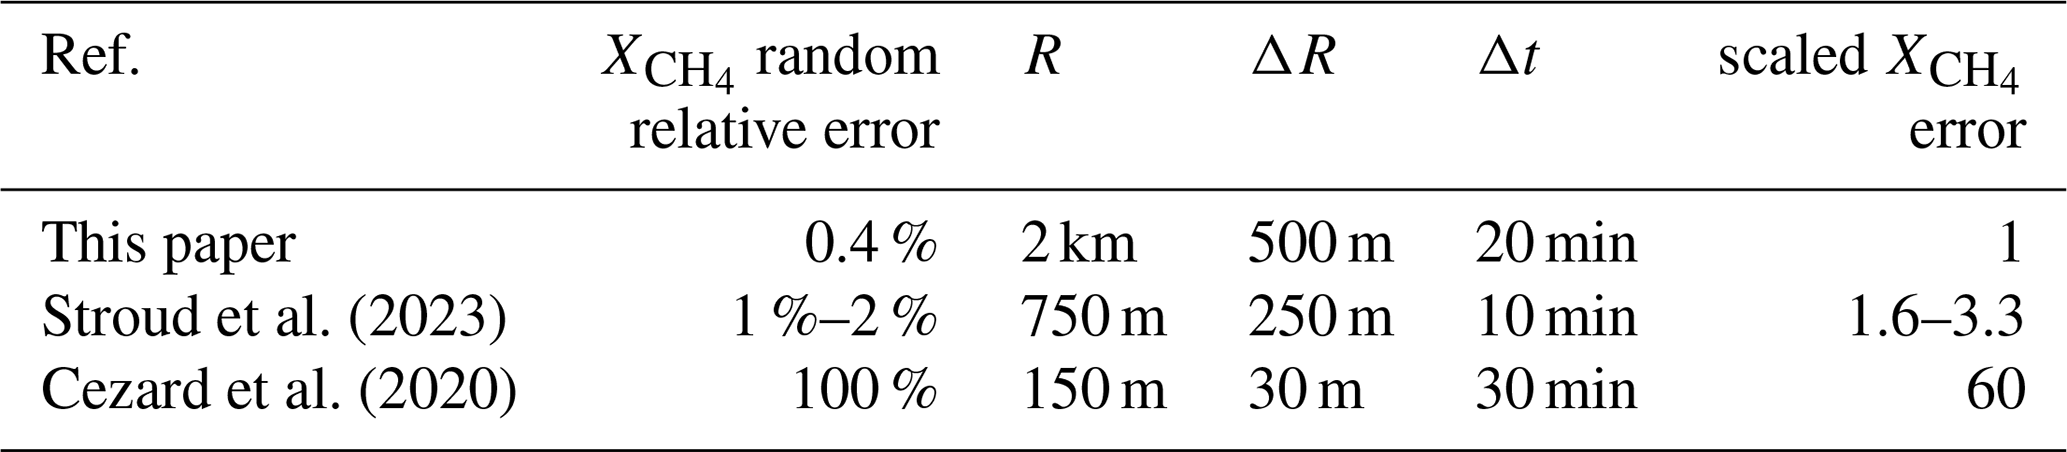
In Stroud et al. (2023), the reported performance is slightly lower, as the laser used here is more powerful (7 W versus 0.5 W) and the telescope collecting area is also slightly larger. The performance reported in Cezard et al. (2020) is largely exceeded, since their laser power is lower (0.2 W) and the heterodyne detection scheme used is affected by significant speckle noise.
An 1.65 µm DIAL was used to retrieve methane mixing ratio profiles within the atmospheric mixed layer along a near-horizontal line of sight (4° above the horizontal). The achieved precision reaches 0.4 % at a range of 2 km with a spatio-temporal resolution of 500 m per 20 min. This level of precision made it possible to measure the late stage of the dispersion of a methane plume. These measurements were confirmed by nearby CRDS sensors.
We have shown that the main instrument-related limitation on precision is the accuracy of the ON wavelength, which depends on its position within the methane absorption line. In the configuration presented here, the laser wavelength may drift if the laser temperature is not strictly stabilized. Such drift can rapidly limit the precision of the DIAL measurement. In addition, it may induce laser instabilities (cavity mode hopping or even loss of single-mode operation), which restrict the acquisition of long, high-quality time series. To address this issue, we plan to modify the laser operating scheme by actively locking the ON seeder to the methane absorption line using a setup similar to that described in Gibert et al. (2014). This will prevent drift of the ON wavelength. The seeders will also be replaced by external-cavity diode lasers (ECDLs), which offer narrower linewidths and better spectral stability than DFB diode lasers, and are expected to improve the stability and reliability of the laser injection seeding operation. Another limiting factor is the accuracy of the DIAL retrieval due to insufficient knowledge of the temperature profile. In future measurements, we will investigate the benefit of joint observations with a Raman lidar capable of providing temperature and water vapor profiles. These lidar-derived profiles should improve the accuracy of the weighting function calculation and thereby reduce biases in the retrieved methane mixing ratio profiles.
The data shown in this paper are available upon request.
DE and FG designed the DIAL system and carried out the experimental set-up. DE performed the atmospheric measurements and the data analysis. CC contributes to the electronics of the lidar. DE prepared the manuscript with contributions from FG.
The contact author has declared that none of the authors has any competing interests.
Publisher's note: Copernicus Publications remains neutral with regard to jurisdictional claims made in the text, published maps, institutional affiliations, or any other geographical representation in this paper. The authors bear the ultimate responsibility for providing appropriate place names. Views expressed in the text are those of the authors and do not necessarily reflect the views of the publisher.
We thank Frédéric Nahan (Magelium/LMD) for providing the spectroscopic atlases.
This research has been supported by the Centre National de la Recherche Scientifique, Institut national des sciences de l'Univers (grant no. Instrumentation Innovante Tranverse Program 2022).
This paper was edited by Dwayne Heard and reviewed by Jasper Stroud and two anonymous referees.
Barton-Grimley, R. A., Nehrir, A. R., Kooi, S. A., Collins, J. E., Harper, D. B., Notari, A., Lee, J., DiGangi, J. P., Choi, Y., and Davis, K. J.: Evaluation of the High Altitude Lidar Observatory (HALO) methane retrievals during the summer 2019 ACT-America campaign, Atmos. Meas. Tech., 15, 4623–4650, https://doi.org/10.5194/amt-15-4623-2022, 2022.
Bösenberg, J.: Ground-based differential absorption lidar for water-vapor and temperature profiling: methodology, Appl. Opt., 37, 3845–3860, https://doi.org/10.1364/AO.37.003845, 1998.
Buchwitz, M., Rozanov, V. V., and Burrows, J. P.: A near-infrared optimized DOAS method for the fast global retrieval of atmospheric CH4, CO, CO2, H2O, and N2O total column amounts from SCIAMACHY Envisat-1 nadir radiances, J. Geophys. Res., 105, 15231–15245, https://doi.org/10.1029/2000JD900191, 2000.
Butz, A., Guerlet, S., Hasekamp, O., Schepers, D., Galli, A., Aben, I., Frankenberg, C., Hartmann, J.-M., Tran, H., Kuze, A., Keppel-Aleks, G., Toon, G., Wunch, D., Wennberg, P., Deutscher, N., Griffith, D., Macatangay, R., Messerschmidt, J., Notholt, J., and Warneke, T.: Toward accurate CO2 and CH4 observations from GOSAT, Geophys. Res. Lett., 38, L14812, https://doi.org/10.1029/2011GL047888, 2011.
Cezard, N., Le Mehaute, N., Le Gouët, J., Valla, M., Goular, D., Fleury, D., Planchat, C., and Dolfi-Bouteyre, A., Performance assessment of a coherent DIAL-Doppler fiber lidar at 1645 nm for remote sensing of methane and wind, Opt. Express, 28, 22345–22357, https://doi.org/10.1364/OE.394553, 2020.
Clerbaux, C., Chazette, P., Hadji-Lazaro, J., Mégie, G., Müller, J.-F., and Clough, S. A.: Remote sensing of CO, CH4, and O3 using a spaceborne nadir-viewing interferometer, J. Geophys. Res., 103, 18999–19013, https://doi.org/10.1029/98JD01422, 1998.
Delahaye, T., Maxwell, S. E., Reed, Z. D., Lin, H., Hodges, J. T., Sung, K., Devi, V., Warneke, T., and Tran, H.: Precise methane absorption measurements in the 1.64 µm spectral region for the MERLIN mission, J. Geophys. Res.-Atmos., 121, 7360–7370, https://doi.org/10.1002/2016JD025024, 2016.
Delahaye, T., Ghysels, M., Hodges, J. T., Sung, K., Armante, R., and Tran, H.: Measurement and modeling of air‐broadened methane absorption in the MERLIN spectral region at low temperatures, J. Geophys. Res.-Atmos., 124, 3556–3564, https://doi.org/10.1029/2018JD028917, 2019.
Edouart, D., Gibert, F., and Cenac, C.: 1.645 µm Er:YAG single-mode dual-wavelength emitter for CH4 differential absorption lidar, Opt. Lett., 49, https://doi.org/10.1364/OL.538254, 2024.
Ehret, G., Bousquet, P., Pierangelo, C., Alpers, M., Millet, B., Abshire, J. B., Bovensmann, H., Burrows, J. P., Chevallier, F., Ciais, P., Crevoisier, C., Fix, A., Flamant, P., Frankenberg, C., Gibert, F., Heim, B., Heimann, M., Houweling, S., Hubberten, H. W., Jöckel, P., Law, K., Marshall. J., Agusti-Panareda, A., Payan, S., Prigent, C., Rairoux, P., Sachs, T., Scholze, M., and Wirth, M.: MERLIN: A French-German Space Lidar Mission Dedicated to Atmospheric Methane, Remote Sens., 9, 1052, https://doi.org/10.3390/rs9101052, 2017.
Gibert, F., Edouart, D., Cenac, C., and le Mounier, F.: 2-µm high-power multiple-frequency single-mode Q-switched Ho:YLF laser for DIAL application, Appl. Phys. B, 116, 967–976, https://doi.org/10.1007/s00340-014-5784-3, 2014.
Gibert, F., Edouart, D., Cénac, C., Le Mounier, F., and Dumas, A.: 2-µm Ho emitter-based coherent DIAL for CO2 profiling in the atmosphere, Opt. Lett., 40, 3093–3096, https://doi.org/10.1364/OL.40.003093, 2015.
Gibert, F., Edouart, D., Monnier, P., Collignan, J., and Lopez, J.: Scalar turbulent fluxes and variances in the interfacial layer from lidar observations and assessment of Lagrangian Stochastic Models, Q. J. Roy. Meteor. Soc., e70016, https://doi.org/10.1002/qj.70016, 2025.
Gordon, I. E., Rothman, L. S., Hargreaves, R. J., Hashemi, R., Karlovets, E. V., Skinner, F. M., Conway, E. K., Hill, C., Kochanov, R. V., Tan, Y., Wcisło, P., Finenko, A. A., Nelson, K., Bernath, P. F., Birk, M., Boudon, V., Campargue, A., Chance, K. V., Coustenis, A., Drouin, B. J., Flaud, J.-M., Gamache, R. R., Hodges, J. T., Jacquemart, D., Mlawer, E. J., Nikitin, A. V., Perevalov, V. I., Rotger, M., Tennyson, J., Toon, G. C., Tran, H., Tyuterev, V. G., Adkins, E. M., Baker, A., Barbe, A., Canè, E., Császár, A. G., Dudaryonok, A., Egorov, O., Fleisher, A. J., Fleurbaey, H., Foltynowicz, A., Furtenbacher, T., Harrison, J. J., Hartmann, J.-M., Horneman, V.-M., Huang, X., Karman, T., Karns, J., Kassi, S., Kleiner, I., Kofman, V., Kwabia-Tchana, F., Lavrentieva, N. N., Lee, T. J., Long, D. A., Lukashevskaya, A. A., Lyulin, O. M., Makhnev, V. Yu., Matt, W., Massie, S. T., Melosso, M., Mikhailenko, S. N., Mondelain, D., Müller, H. S. P., Naumenko, O. V., Perrin, A., Polyansky, O. L., Raddaoui, E., Raston, P. L., Reed, Z. D., Rey, M., Richard, C., Tóbiás, R., Sadiek, I., Schwenke, D. W., Starikova, E., Sung, K., Tamassia, F., Tashkun, S. A., Vander Auwera, J., Vasilenko, I. A., Vigasin, A. A., Villanueva, G. L., Vispoel, B., Wagner, G., Yachmenev, A., and Yurchenko, S. N.: The HITRAN2020 Molecular Spectroscopic Database, J. Quant. Spectrosc. Ra., 277, 107949, https://doi.org/10.1016/j.jqsrt.2021.107949, 2022.
Hazan, L., Tarniewicz, J., Ramonet, M., Laurent, O., and Abbaris, A.: Automatic processing of atmospheric CO2 and CH4 mole fractions at the ICOS Atmosphere Thematic Centre, Atmos. Meas. Tech., 9, 4719–4736, https://doi.org/10.5194/amt-9-4719-2016, 2016.
Ikuta, K., Yoshikane, N., Vasa, N., Oki, Y., Maeda, M., Uchiumi, M., Tsumura, Y., Nakagawa, J., and Kawada, N.: Differential absorption lidar at 1.67 µm for remote sensing of methane leakage, Jpn. J. Appl. Phys., 38, 110, https://doi.org/10.1143/JJAP.38.110, 1999.
Innocenti, F., Robinson, R., Gardiner, T., Finlayson, A., and Connor, A.: Differential Absorption Lidar (DIAL) Measurements of Landfill Methane Emissions, Remote Sens., 9, 953, https://doi.org/10.3390/rs9090953, 2017.
Lorente, A., Borsdorff, T., Butz, A., Hasekamp, O., aan de Brugh, J., Schneider, A., Wu, L., Hase, F., Kivi, R., Wunch, D., Pollard, D. F., Shiomi, K., Deutscher, N. M., Velazco, V. A., Roehl, C. M., Wennberg, P. O., Warneke, T., and Landgraf, J.: Methane retrieved from TROPOMI: improvement of the data product and validation of the first 2 years of measurements, Atmos. Meas. Tech., 14, 665–684, https://doi.org/10.5194/amt-14-665-2021, 2021.
Membrive, O., Crevoisier, C., Sweeney, C., Danis, F., Hertzog, A., Engel, A., Bönisch, H., and Picon, L.: AirCore-HR: a high-resolution column sampling to enhance the vertical description of CH4 and CO2, Atmos. Meas. Tech., 10, 2163–2181, https://doi.org/10.5194/amt-10-2163-2017, 2017.
Meng, L., Fix, A., Wirth, M., Høgstedt, L., Tidemand-Lichtenberg, P., Pedersen, C., and Rodrigo, P. J.: Upconversion detector for range-resolved DIAL measurement of atmospheric CH4, Opt. Express, 26, 3850–3860, https://doi.org/10.1364/OE.26.003850, 2018.
Nemitz, E., Mannarella, I., Ibrom, A., Aurela, M., Burba, G. G., Dengel, S., Gielen, B., Grelle, A., Heinesch, B. Herbst, M., Hörtnagl, L., Klemedtsson, L., Lindroth, A., Lohila, A., McDermitt, D. K., Meier, P., Merbold, L., Nelson, D., Nicolini, G., and Zahniser, M.: Standardisation of eddy-covariance flux measurements of methane and nitrous oxide, Int. Agrophys., 32, 517–549, https://doi.org/10.1515/intag-2017-0042, 2018.
Ngo, N. H., Lisak, D., Tran, H., and Hartmann, J.‐M.: An isolated line‐shape model to go beyond the Voigt profile in spectroscopic databases and radiative transfer codes, J. Quant. Spectrosc. Ra., 129, 89–100, https://doi.org/10.1016/j.jqsrt.2013.05.034, 2013.
Refaat, T. F., Singh, U. N., Yu, J., Petros, M., Ismail, S., Kavaya, M. J., and Davis, K. J.: Evaluation of an airborne triple-pulsed 2 µm IPDA lidar for simultaneous and independent atmospheric water vapor and carbon dioxide measurements, Appl. Opt., 54, 1387–1398, https://doi.org/10.1364/AO.54.001387, 2015.
Saboya, E., Zazzeri, G., Graven, H., Manning, A. J., and Englund Michel, S.: Continuous CH4 and δ13CH4 measurements in London demonstrate under-reported natural gas leakage, Atmos. Chem. Phys., 22, 3595–3613, https://doi.org/10.5194/acp-22-3595-2022, 2022.
Saunois, M., Stavert, A. R., Poulter, B., Bousquet, P., Canadell, J. G., Jackson, R. B., Raymond, P. A., Dlugokencky, E. J., Houweling, S., Patra, P. K., Ciais, P., Arora, V. K., Bastviken, D., Bergamaschi, P., Blake, D. R., Brailsford, G., Bruhwiler, L., Carlson, K. M., Carrol, M., Castaldi, S., Chandra, N., Crevoisier, C., Crill, P. M., Covey, K., Curry, C. L., Etiope, G., Frankenberg, C., Gedney, N., Hegglin, M. I., Höglund-Isaksson, L., Hugelius, G., Ishizawa, M., Ito, A., Janssens-Maenhout, G., Jensen, K. M., Joos, F., Kleinen, T., Krummel, P. B., Langenfelds, R. L., Laruelle, G. G., Liu, L., Machida, T., Maksyutov, S., McDonald, K. C., McNorton, J., Miller, P. A., Melton, J. R., Morino, I., Müller, J., Murguia-Flores, F., Naik, V., Niwa, Y., Noce, S., O'Doherty, S., Parker, R. J., Peng, C., Peng, S., Peters, G. P., Prigent, C., Prinn, R., Ramonet, M., Regnier, P., Riley, W. J., Rosentreter, J. A., Segers, A., Simpson, I. J., Shi, H., Smith, S. J., Steele, L. P., Thornton, B. F., Tian, H., Tohjima, Y., Tubiello, F. N., Tsuruta, A., Viovy, N., Voulgarakis, A., Weber, T. S., van Weele, M., van der Werf, G. R., Weiss, R. F., Worthy, D., Wunch, D., Yin, Y., Yoshida, Y., Zhang, W., Zhang, Z., Zhao, Y., Zheng, B., Zhu, Q., Zhu, Q., and Zhuang, Q.: The Global Methane Budget 2000–2017, Earth Syst. Sci. Data, 12, 1561–1623, https://doi.org/10.5194/essd-12-1561-2020, 2020.
Stroud, J. R., Wagner, G. A., and Plusquellic, D. F.: Multi-Frequency Differential Absorption LIDAR (DIAL) System for Aerosol and Cloud Retrievals of CO2/H2O and CH4/H2O, Remote Sens., 15, 5595, https://doi.org/10.3390/rs15235595, 2023.
Veselovskii, I., Goloub, P., Hu, Q., Podvin, T., Whiteman, D. N., Korenskiy, M., and Landulfo, E.: Profiling of CH4 background mixing ratio in the lower troposphere with Raman lidar: a feasibility experiment, Atmos. Meas. Tech., 12, 119–128, https://doi.org/10.5194/amt-12-119-2019, 2019.
Zhou, M., Langerock, B., Sha, M. K., Kumps, N., Hermans, C., Petri, C., Warneke, T., Chen, H., Metzger, J.-M., Kivi, R., Heikkinen, P., Ramonet, M., and De Mazière, M.: Retrieval of atmospheric CH4 vertical information from ground-based FTS near-infrared spectra, Atmos. Meas. Tech., 12, 6125–6141, https://doi.org/10.5194/amt-12-6125-2019, 2019.