
the Creative Commons Attribution 4.0 License.
the Creative Commons Attribution 4.0 License.
 | 29 Jul 2026

The mineral aerosol profiling from infrared radiances version 5.1 algorithm and its evaluation
Sophie Vandenbussche
Christodoulos Biskas
Maria-Elissavet Koukouli
Stelios Kazadzis
Martine De Mazière
Mineral (desert) dust aerosols are small sand/dust particles entrained by winds from bare areas and possibly transported over long distances. These aerosols are climate forcers and affect human health and many socio-economic sectors. They are therefore important to monitor both in near-real time and on the long term. In this work, the Infrared Atmospheric Sounding Interferometer (IASI) instrument is used to retrieve vertical profiles of mineral dust aerosols concentration, from which a 10 µm aerosol optical depth (AOD) and a mean aerosol altitude are obtained. In addition, the dust AOD is converted to 550 nm using the same aerosol optical properties as in the retrieval. The theoretically calculated conversion factor is 1.78 (the 550 nm AOD being larger than the 10 µm AOD). This conversion step adds significant uncertainties due to different sensitivity at the different wavelengths. Specifically, we present here the new version 5.1 of the Mineral Aerosol Profiling from Infrared Radiances (MAPIR) algorithm and its changes with respect to previous versions. MAPIR v5.1 was used to produce a consistent time series of dust profiles since the start of the IASI observations in 2007 and until now, using data from IASI onboard Metop-A and Metop-C. The capabilities of the instrument and retrieval are illustrated, showing good event detection, expected AOD seasonal cycles, good profiling capabilities and reasonable mean aerosol altitude, good time and cross-platform consistency. A true validation exercise is not possible as there exist no reference aerosols data from thermal infrared measurements (around 10 µm). Therefore, the absolute value of the obtained AOD can not be validated, although the best possible evaluation is provided using data obtained in the visible spectral range. The evaluation shows a strong correlation of respectively about 0.8 and 0.7 between MAPIR dust AOD and AERONET 550 nm coarse mode AOD solar and lunar observations. The MAPIR converted 550 nm AOD shows a small median bias with respect to AERONET, but this bias varies with the AOD, suggesting an underestimation of the AOD conversion factor.
- Article
(10082 KB) - Full-text XML
- BibTeX
- EndNote


Mineral dust, commonly referred to as desert dust, constitutes the most abundant atmospheric aerosol in dry mass (e.g. Textor et al., 2006), consisting of particles from arid and semi-arid regions. These particles are lofted into the atmosphere by strong winds and can travel vast distances across continents and oceans. Their size ranges from less than 1 nm to more than 100 µm (e.g. Mahowald et al., 2014). The main sources of mineral dust include the Sahara Desert in Africa, the Gobi Desert in Asia, and other dry regions worldwide. The global emission of mineral dust is estimated to be between 1 and 3 Gt yr−1, and its average atmospheric dust load ranges from 8 to 35 Mt yr−1 (e.g. Zender et al., 2004).
The impact of mineral dust on Earth's climate is multifaceted. First, it influences the radiative balance by (back)scattering and absorbing sunlight in the short-wave spectral range, while absorbing, scattering, and emitting radiation in the infrared spectral range. This is called the direct radiative effect. Those interactions with light depend on different aerosol properties in different spectral ranges (e.g. Adebiyi et al., 2023; Di Biagio et al., 2017, 2019; Koepke et al., 2015). They result in atmospheric and/or surface heating or cooling, depending on the dust layer height, the atmospheric and surface temperatures, the surface albedo and emissivity, the presence of clouds or other aerosols, the presence of sunlight, etc. Finally, these changes in surface and atmospheric temperatures also affect surface energy exchanges and local wind speed (e.g. Choobari et al., 2014). Mineral dust can also modify cloud cover, cloud properties and precipitation processes by acting as cloud condensation and ice nuclei (CCN and IN) (e.g. Choobari et al., 2014). These are called the semi-direct (cloud impact due to atmospheric heating) and indirect radiative effects (cloud impact due to microphysics). The deposition of dust can stimulate biogeochemical activity in ecosystems (both marine and terrestrial) by providing essential nutrients such as iron and phosphorus (e.g. Jickells et al., 2005). This deposition may also locally modify the visible surface albedo resulting in increased snow melt (Xie et al., 2018).
Beyond its climatic effects, mineral dust has significant implications for human health, affecting the respiratory and circulatory systems (e.g. Zhang et al., 2016). Finally, dust aerosols also affect human activities in many ways (e.g. Middleton, 2017; Monteiro et al., 2022; Mona et al., 2023): they disrupt transportation, damage infrastructure, reduce agricultural productivity, reduce photovoltaic energy production, etc.
To monitor the dust impacts on the climate and analyse changes, one needs long-term consistent data sets to be able to extract trends in different variables such as the dust load, vertical distribution, transport paths, source areas. To develop mitigation strategies related to the dust impact on human health and activities, and to correctly forecast temperatures, clouds and rain, near-real-time (NRT) data of dust atmospheric distribution and properties are required. Those may be used as input in aerosol forecast or weather models. For both types of analyses, data should be global (or almost), possibly cover day and night and, in the case of forecast models, data should have the highest feasible temporal resolution. This can be reached using satellite remote sensing. Different types of instruments deliver different information on the dust aerosols, with different time resolutions and ground coverage. A comprehensive recent review on the dust observation from satellites (and also all other observations) can be found in Mona et al. (2023) and references therein.
The algorithm presented here falls within the effort to improve the current dust observation capabilities from thermal infrared (TIR) satellite observations by the Infrared Atmospheric Sounding Interferometer (IASI) instrument. This algorithm is called Mineral Aerosol Profiling from Infrared Radiances (MAPIR) version 5.1 while the previous version was described in detail in Callewaert et al. (2019). MAPIR uses IASI radiance data, with additional information on the surface and atmospheric state, to retrieve vertical profiles of coarse mineral dust aerosol concentrations. Those profiles may then be used to calculate the integrated aerosol optical depth (AOD) at a TIR wavelength (which is usually 10 µm) and converted to the visible (VIS) wavelength most commonly used to report AOD, 550 nm. The profiles can also be used to calculate a mean altitude of the aerosol layer.
This manuscript describes in details the new version 5.1 of the algorithm, with several modifications from the previous version. The algorithm exists in two slightly different versions, depending on the need to produce long-term consistent data (climate version) or the best possible data in near-real-time (NRT version). This work presents and evaluates the data produced with the MAPIR-climate version, while the MAPIR-NRT version will be assessed later on, when enough data will have been produced in NRT mode.
The manuscript is organised as follows. First, the MAPIR retrievals are fully described (Sect. 2), starting with the data it requires, continuing with the detailed algorithm description and changes with respect to the previous version, and ending with a general assessment of its performances. Section 3 demonstrates the capabilities of MAPIR and shows comparisons with data from other instruments. The section begins with the description of the data sets used in this evaluation, continues with a detailed discussion of the challenges of evaluating TIR-observed aerosol information, then shows the evaluation of the integrated dust AOD against reference measurements by the Aerosol Robotic Network (AERONET), discusses some properties of the profile data and shows example comparisons with Cloud–Aerosol lidar with Orthogonal Polarization (CALIOP) observations and with European Aerosol Research Lidar Network (EARLINET) data. The section ends with a discussion of MAPIR uncertainties, long-term stability and IASI-A versus C continuity. Finally, we wrap the paper up and propose some conclusions and future perspectives.
2.1 Instruments, models and data used in the MAPIR retrievals
2.1.1 IASI
IASI is a Michelson Interferometer developed by the Centre National d'Études Spatiales (CNES) in collaboration with the European Organisation for the Exploitation of Meteorological Satellites (EUMETSAT). Mounted on the MetOp series of polar-orbiting satellites, IASI is designed to measure atmospheric temperature and humidity profiles with high accuracy and resolution, for use in weather forecast models. Its data has in addition been used to retrieve numerous other atmospheric gases such as carbon dioxide, methane, nitrous oxide, ozone, carbon monoxide and many other traces gases (e.g. Clerbaux et al., 2009; Clarisse et al., 2011; Hilton et al., 2012; Vandenbussche et al., 2022; De Wachter et al., 2017). Finally, IASI is also used to retrieve mineral aerosol (desert dust and volcanic ash) atmospheric load, mean altitude or vertical profile, particle composition and size (e.g. Callewaert et al., 2019; Clarisse et al., 2019; Capelle et al., 2018; Klüser et al., 2015; Maes et al., 2016).
The IASI instruments fly onboard the Metop satellite platforms on a polar sun-synchronous orbit approximately 817 km above Earth, with Equator crossing times at 09:30 (descending mode) and 21:30 (ascending mode) mean local solar time, allowing for nearly global coverage twice daily per instrument. IASI operates as a nadir-viewing instrument with a swath width of 2200 km, capable of off-nadir measurements up to a 48.3° viewing angle on either side of the satellite track. It scans 30 elementary fields of view, each consisting of four circular pixels with a 12 km ground diameter at nadir, which extends to an ellipse of 39 km by 20 km at the swath's edges. IASI measures radiances across a spectral range from 645 to 2760 cm−1, with a spectral resolution of 0.5 cm−1 after apodization and a radiometric noise of about 0.2 K in the TIR atmospheric window (Clerbaux et al., 2009), used in MAPIR retrievals. Each spectrum is sampled every 0.25 cm−1, yielding a total of 8461 radiance channels.
IASI data is perfectly suited for both long-term and NRT monitoring of the atmosphere, with continuous data since 2007 through three identical very stable IASI instruments launched in 2006, 2012 and 2018, one new generation instrument (IASI-NG) launched in summer 2025 and two others planned for further continuation of the observations until at least 2040 (CNES, 2026).
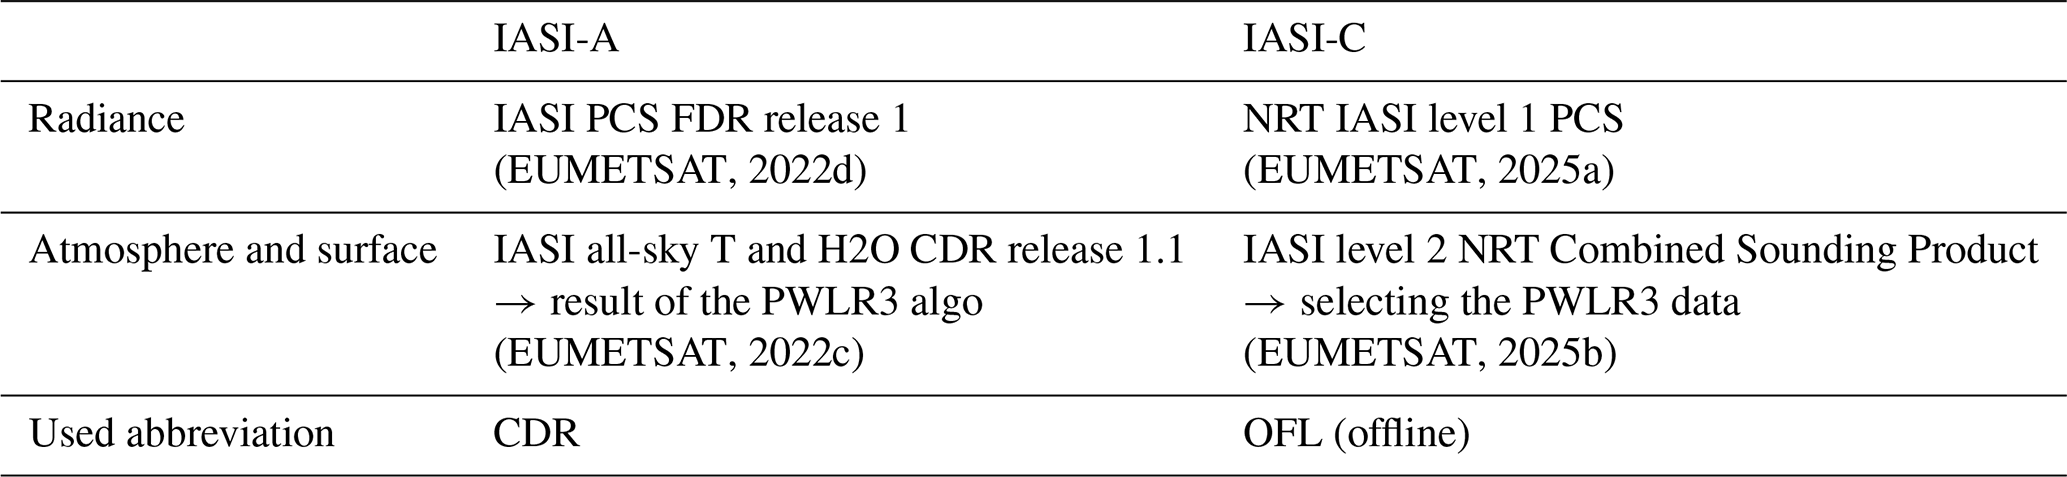
In this work, we use data from IASI/Metop-A (in short, IASI-A, data from July 2007 to September 2021) and IASI/Metop-C (in short, IASI-C, data since October 2019, including almost 2 years overlap with IASI-A). For computing time mitigation, we do not use data from IASI/Metop-B which overlaps with the other instruments. For IASI-A we use level 1c radiance from the IASI Principal Components Scores (PCS) Fundamental Data Record (FDR) Release 1 (EUMETSAT, 2022d), and surface temperature, atmospheric temperature and humidity profiles, land flag and surface elevation from the IASI All Sky Temperature and Humidity Profiles – Climate Data Record (CDR) Release 1.1 (EUMETSAT, 2022c). For IASI-C, we use the similar level 1c PCS from the NRT data (EUMETSAT, 2025a) and surface temperature, atmospheric temperature and humidity profiles, land flag and surface elevation from the NRT Combined Sounding product, both in the “native” file format, delivered with a small delay through the EUMETSAT Data Store (EUMETSAT, 2025b). Those will further be referred to as OFL (“offline”) for shortness. From that data, we select surface temperature and atmospheric temperature and humidity obtained with the Piece Wise Linear Regression version 3 (PWLR3) algorithm. This ensures consistency with IASI-A, as the PWLR3 algorithm was used for reprocessing the IASI-A CDR. Table 1 summarizes all this information.
(EUMETSAT, 2022d)(EUMETSAT, 2025a)(EUMETSAT, 2022c)(EUMETSAT, 2025b)Table 1IASI level 1 and level 2 input data for MAPIR v5.1 retrievals.
There has been an update on 30 March 2023 in the NRT PCS, with the use of a new eigenvector basis, improved noise filtering and the launch of the hybrid PCS (now including local PCS and eigenvectors to better catch unexpected local spectral signatures not well represented in the global PCS and eigenvectors). We currently do not use those additional local PCS as the dust signature is well represented in the global eigenvector basis. This update on 30 March 2023 represents the only discontinuity in the complete processing chain for the new MAPIR version 5.1, and bears no detectable impact (see Sect. 3.8).
The setup described above refers to the MAPIR-climate setup, which is analysed and validated in this work. The MAPIR-NRT setup is based on the same algorithm, but uses the NRT-distributed IASI data, in which the level 2 is slightly different from the OFL data. Indeed, in the OFL data both the PWLR3 and OEM results are provided, while in NRT only one set of data is provided: the OEM if it succeeded, and the PWLR3 if the OEM failed. The MAPIR-NRT data are therefore slightly different from the MAPIR-climate data, and will contain inconsistencies when the IASI OEM is modified. The MAPIR-NRT data is planned for NRT distribution through the EUMETCast system, within work from the EUMETSAT Atmospheric Composition Satellite Application Facility (AC SAF), and will be validated in that context when enough data will have been generated.
2.1.2 Dust optical properties
The dust aerosol properties are fixed throughout time and space in MAPIR retrievals. The algorithm uses spherical particles, with the GEISA-HITRAN dust-like Refractive Index (RI) (Jacquinet-Husson et al., 2011) and a mono-modal log-normal Particle Size Distribution (PSD) with mean radius of 0.6 µm, geometric standard deviation of 2 (corresponding to an effective particle size of 2 µm). Those properties are used in a Mie code to calculate the particle properties required for the radiative transfer code (see Sect. 2.1.4) and for conversion between TIR and VIS (see Sect. 2.1.3 and 3.2). The impact of the spherical assumption is expected to be minimal in the TIR, while known significant in VIS and therefore also in any comparison or conversion between TIR and VIS obtained dust properties/amounts. This is discussed in more details in Sect. 3.2.
2.1.3 LIVAS
The LIVAS (LIdar climatology of Vertical Aerosol Structure for space-based lidar simulation studies) database utilizes data from the CALIOP instrument aboard the CALIPSO (Cloud-Aerosol Lidar and Infrared Pathfinder Satellite Observations) satellite, to provide a monthly average of high-resolution (60 m) vertical profiles of dust extinction at visible wavelengths, globally on a 1° × 1° horizontal grid, from 2007 to 2014 (Amiridis et al., 2013, 2015).
This data is used as a priori for MAPIR dust profile retrievals, after some pre-treatment. First, the high-resolution extinction profiles are regridded to the low resolution MAPIR retrieval vertical grid (10 layers, 1 km thick, from 0 to 10 km altitude). Second, the monthly data are averaged over the 8 years to obtain a mean monthly data set. Then, to assure having data in each grid cell and continuity between adjacent cells, a running mean of the data set is calculated along 5° × 5°. Finally, the extinction at 532 nm is converted to concentration (particles cm−3) using a Mie code and the same dust particle optical properties used in the retrieval (see Sect. 2.1.2) and the obtained concentrations in each layer are clipped to the minimum value of 2 particle cm−3 and a maximum value of 100 particles cm−3. This minimal concentration is new in MAPIR version 5.1 and its justification is provided in Sect. 2.2.4.
2.1.4 RTTOV
Radiative Transfer for TOVS (TIROS Operational Vertical Sounder) or RTTOV is a fast radiative transfer model (RTM) developed by the European Centre for Medium-Range Weather Forecasts (ECMWF) and the EUMETSAT Satellite Application Facility on Numerical Weather Prediction (NWP SAF) (Saunders et al., 2018). It is designed to simulate satellite radiances for various atmospheric, surface, and cloud conditions in the infrared, visible, and microwave spectral regions. RTTOV uses pre-computed transmittance coefficients to efficiently calculate radiative transfer. The model also allows computing derivatives of the radiance with respect to some atmospheric gases. Finally, the model allows including aerosols with user-defined optical properties, and computing derivatives of the radiance with respect to the aerosol concentration.
In this work, RTTOV version 13 is used for all radiative transfer computations, with the corresponding IASI version 13 predictor coefficients calculated on 101 levels (Saunders et al., 2020). Only water vapour is set as variable gas (mandatory) and its vertical profiles originate from the IASI level 2 data described in Sect. 2.1.1 and interpolated on the internal RTTOV grid. All other gases have only low absorption in the MAPIR spectral bands (e.g. Clerbaux et al., 2009) and are modelled with fixed concentrations using the RTTOV defaults values as described in Saunders et al. (2017)). The specific aerosol properties used in this work are described in Sect. 2.1.2. No solar sources are included (irrelevant in the TIR). Scattering is computed using the Discrete Ordinate Method (DOM) with 4 streams. The plane parallel approximation is used and the surface is modelled as lambertian, as both are mandatory for using the DOM in RTTOV. Vertical profile interpolation, if needed, is done using the RTTOV default method. All input data are tested before running RTTOV. When needed, profiles are extrapolated up to top of atmosphere by maintaining the ratio to the default RTTOV profile instead of repeating the last known value. Concentrations are clipped to limits for the coefficient regression. All other RTTOV options are left to their default value.
2.1.5 Surface emissivity
In this work, we use surface emissivity internally available in RTTOV version 13 (Saunders et al., 2020): (1) the IREMIS model for sea surfaces with surface wind speed set to 0 because the data is not available (impact on dust retrievals is below 0.01 AOD at 10 µm for a wind speed up to 100 km h−1), and (2) the Combined ASTER (Advanced Spaceborne Thermal Emission and Reflection Radiometer) MODIS (Moderate Resolution Imaging Spectroradiometer) Emissivity over Land (CAMEL) climatology version 2 for land surfaces, with snow fraction set to 0 because the information is not contained in IASI data. Even with such a snow fraction forced to 0, the climatology outputs an emissivity spectrum containing the snow component in areas where and periods when snow is expected. This assumption would therefore only be wrong for dust clouds over occasional snow cover. There is an automatic satellite viewing angle correction in IREMIS (turned on). For land surface emissivity, there is a possibility in RTTOV to correct for the satellite viewing angle, but it is the output of one short study and it leads to spurious retrieval results, therefore it is not turned on in MAPIR. The sea versus land discrimination is done using the corresponding flag available in the IASI level 2 data.
2.2 The MAPIR algorithm
The MAPIR algorithm comprises pre-treatment/filtering of the input data (simple quality control, QC), the retrieval itself, and post-treatment/QC of the retrieved parameters. The retrieval algorithm is based on the OEM Rodgers (2000), which provides a maximum a posteriori solution by iteratively adjusting a state vector (the retrieved variables: here, the vertical profile of dust aerosol concentration and the surface temperature) to minimize a cost function. The latter contains both a measure of the difference between the observed (here, with the IASI instrument) and simulated (with a RTM, here RTTOV v13) spectra, and a constraint on the possible values of the state vector (the “prior knowledge”, usually a climatological mean and covariance of the retrieved parameters, here the LIVAS climatology with an assumed fixed 50 % standard deviation). The need for an iterative method comes from the high non-linearity of the RTM with respect to the retrieved parameters. The OEM also allows estimating the information content of the retrieved data (the number of independent information pieces), and to propagate uncertainties from observation noise, model and input variables uncertainties, to retrieved parameters uncertainties. The biggest (maybe only) drawback of the OEM is that it is computationally very demanding, due to its iterative nature and the subsequent need for multiple calls to the RTM.
The MAPIR version 5.1 algorithm is improved from MAPIR version 4.1 (Callewaert et al., 2019). The next subsections present the full description of the new version, and end with a description of the differences, in order to highlight them and shortly explain their impact on the results. Fig. 1 shows a schematic representation of all data flow and algorithm parts, with the reference to the section where each is discussed.
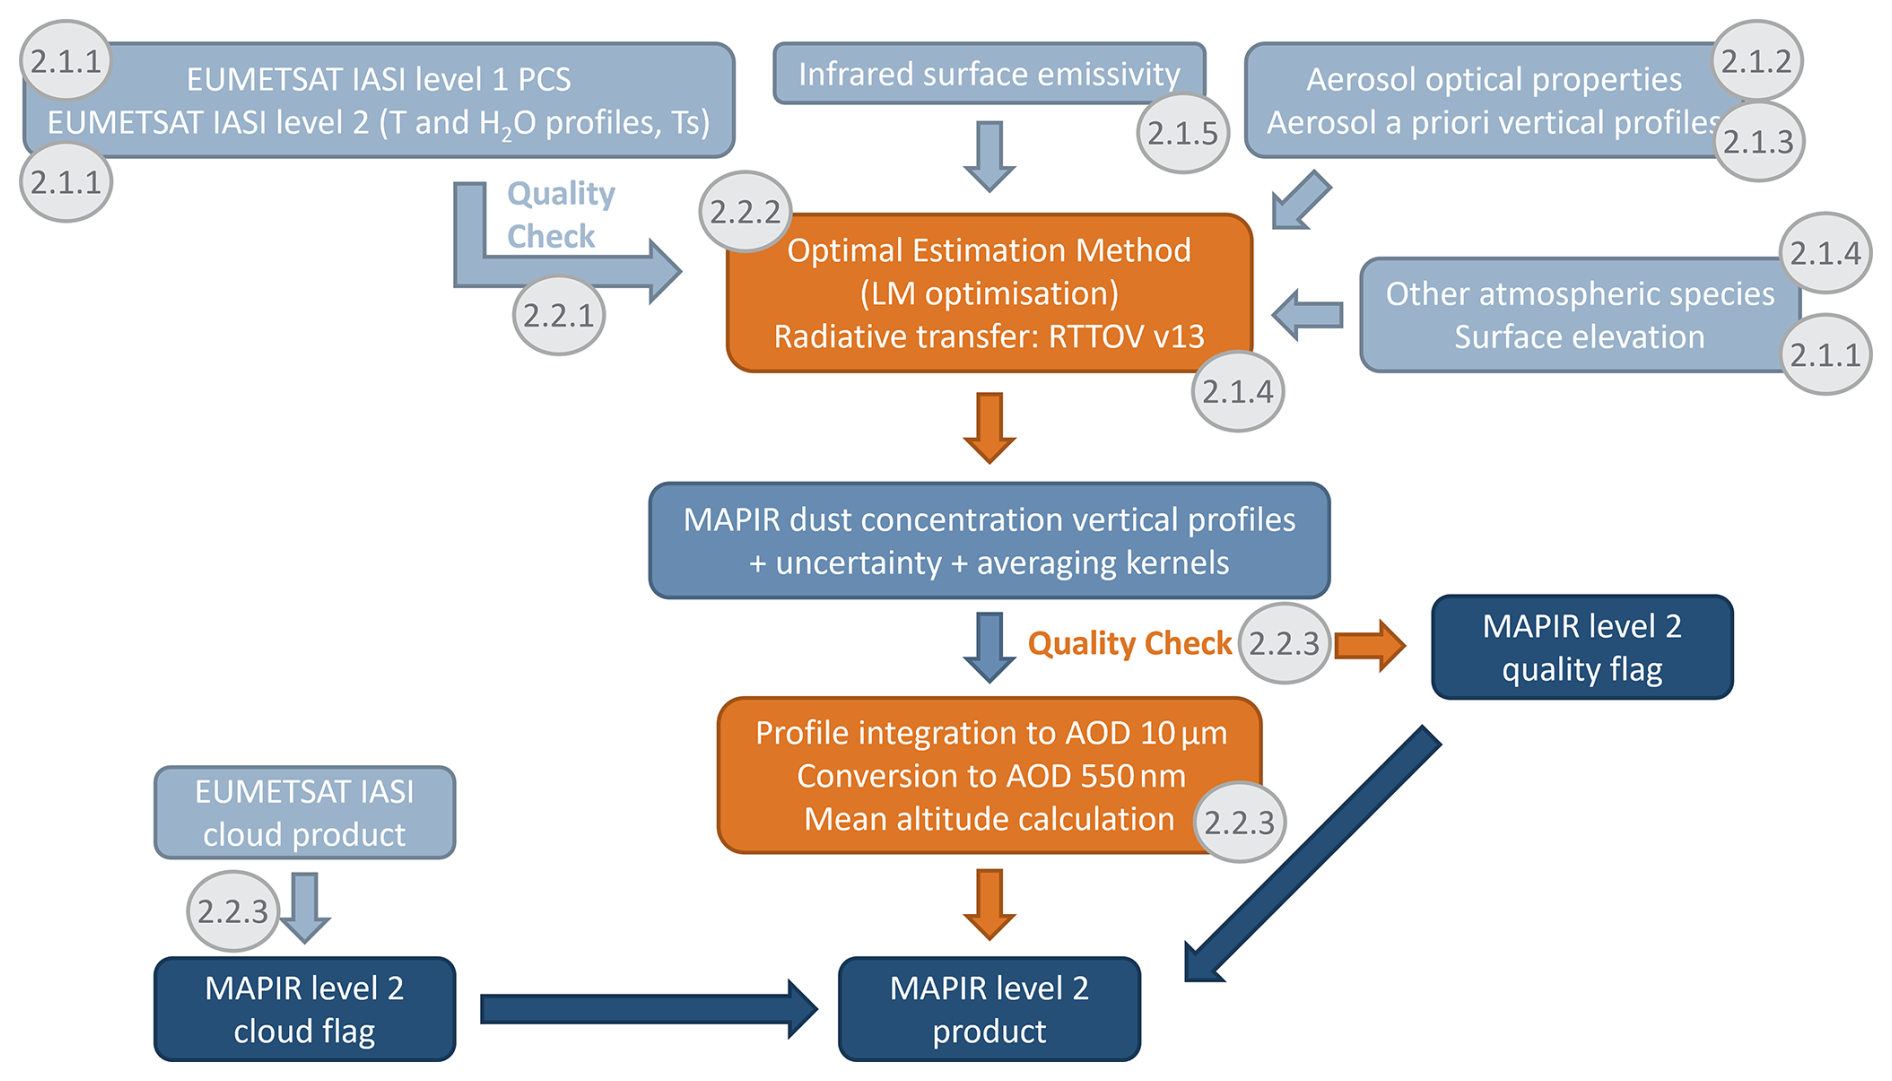
Figure 1Schematic representation of MAPIR v5.1 data flow and algorithm parts; the numbers in the grey circles refer to the section where each is discussed.
2.2.1 Pre-processing algorithm
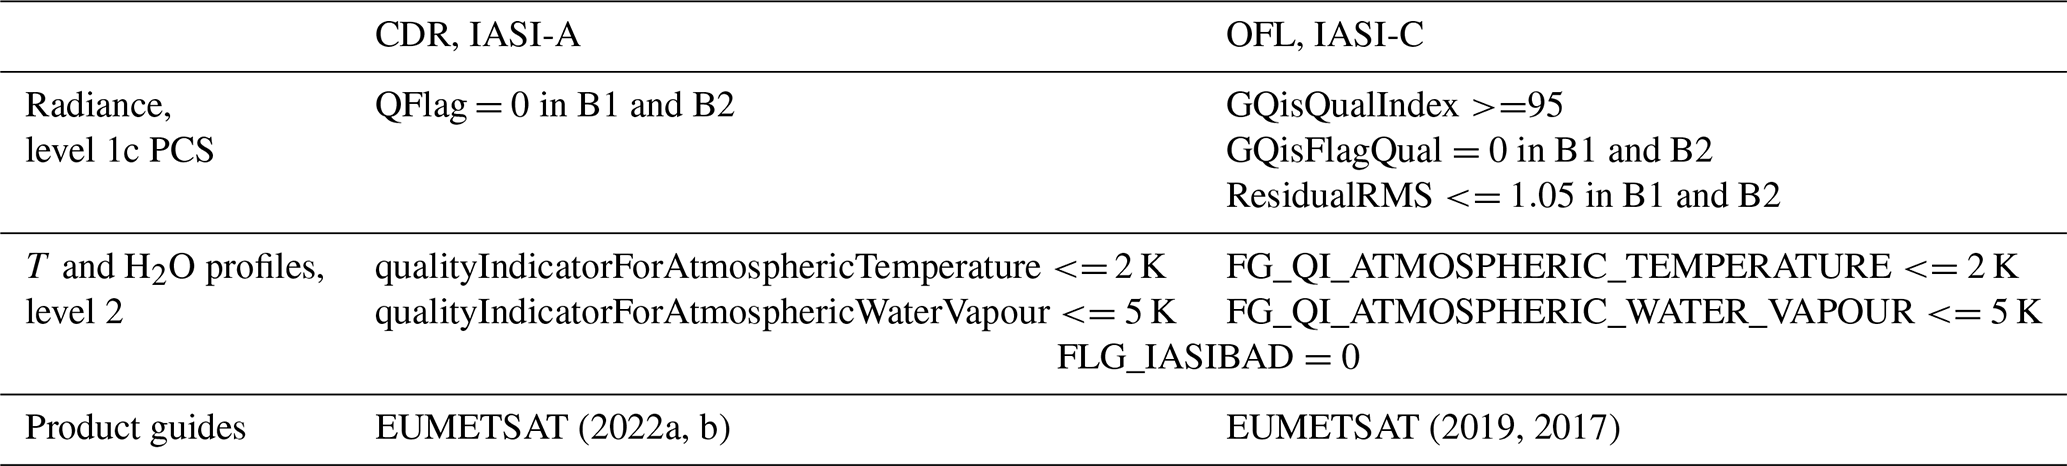
The pre-processing of MAPIR v5.1 consists in reading the IASI radiances, surface temperature and atmospheric temperature and humidity profiles (described in Sect. 2.1.1), then screening them using the available quality indicators or RTTOV internal boundaries. The quality indicators are slightly different depending on the source of the data (CDR for IASI-A or OFL for IASI-C). All criteria are listed in Table 2. All of them need to be met for a IASI observation to enter the retrieval. It is rare that observations are rejected due to these criteria (see further Sect. 2.3).
EUMETSAT (2022a, b)EUMETSAT (2019, 2017)Table 2IASI level 1 and level 2 QC before use in MAPIR v5.1 retrievals. B1 and B2 refer to the respective spectral bands of the IASI instrument, among 3 in total. The MAPIR spectral windows are contained in B1 and B2.
In addition, the surface temperature and pressure and all atmospheric profiles (pressure, temperature, water vapour) must be within the acceptable boundaries for RTTOV v13 (Saunders et al., 2020). Therefore, the surface temperature and the atmospheric profile of water vapour are internally clipped (within RTTOV – this is an input parameter) to acceptable values. On the other hand, the surface pressure and atmospheric profiles of pressure and temperature cannot be corrected with sufficient certainty and are not retrieved in MAPIR. Given their impact on the retrieval results, if one of those values exceeds the RTTOV boundaries, the IASI observation is rejected.
2.2.2 Retrieval scheme
The retrieval scheme is based on the OEM (Rodgers, 2000). The state vector, containing the retrieved parameters, is composed of the vertical profile of the logarithm of the dust aerosol concentration in 10 layers centred from 0.5 to 9.5 km altitude above sea level (by steps of 1 km) and of the surface temperature. Using the logarithmic space ensures that a negative concentration is never obtained, as such unphysical conditions would not be acceptable for RTTOV. The starting value of the state vector is the same as the a priori, which comes from the LIVAS climatology for the dust concentration profile (see Sect. 2.1.3), and from the IASI PWLR3 level 2 data for the surface temperature (see Sect. 2.1.1).
MAPIR uses three spectral windows, on both sides of the well-known “V-shape” signature of minerals in the TIR (e.g. Sokolik, 2002). The first two spectral windows are highly sensitive to mineral aerosols, and also bear sensitivity to surface temperature. They range from 905 to 927 cm−1 and from 1098 to 1123 cm−1. The third spectral window ranges from 1202.75 to 1204.75 cm−1, and is mostly sensitive to the surface temperature, with still a small sensitivity to mineral aerosols. The spectral noise is set to 0.5 K in the first two windows and 0.2 K in the third window. This is a small noise inflation with respect to the instrument spectral noise reported to be 0.2 K in the first two windows, 0.03 K in the third by Clerbaux et al. (2009) or 0.25, 0.33 and 0.07 K respectively by Hilton et al. (2012). This so-called “noise inflation” consists of setting up the OEM with a larger spectral noise than the reported instrument noise, allowing to take into account the errors/uncertainties that can not be quantified otherwise (e.g. those related to the RTM, or to surface emissivity). The precise value is determined empirically, aiming at the lowest possible value (but never below the reported instrument noise) that allows most retrievals to converge to physically realistic values.
All radiative transfer computations are performed with RTTOV (see Sect. 2.1.4). The radiance derivatives with respect to the state parameters are calculated during each retrieval main loop, to account for their non-linearity. Those derivatives are used to compute the state vector for the next iteration, following the OEM formalism.
Because of the high non-linearity of the radiative transfer with respect to the retrieved parameters, the Levenberg-Marquardt (Levenberg, 1944; Marquardt, 1963) modification of the Gauss-Newton iterative method is adopted, with a γ dumping factor starting at 1, increased by a factor of 10 when the cost function has increased during an iteration, and decreased by a factor of 2 if the cost function has decreased during an iteration. The retrieval convergence is tested using the standard OEM formalism, with a threshold of 0.1 both in the state vector and the observation spaces. Most retrievals converge in less than 6 iterations, and the maximum allowed is set to 20.
Finally, averaging kernels and uncertainties are provided, following the OEM formalism and the Levenberg-Marquard modification, using equations from Ceccherini and Ridolfi (2010), as in the previous version of MAPIR (Callewaert et al., 2019). The result covariance matrix is computed separately for the uncertainties linked to the spectral noise, to the smoothing error, and to the input temperature and humidity profiles. The information content of the retrievals (degrees of freedom or DOF) is the trace of the averaging kernel matrix, and reports the number of independent pieces of information present in each single profile. In good cases (strong event and/or large temperature contrast between the surface and the dust layer), the retrievals may reach up to 2.5 DOF. They are distributed in the vertical range depending on the surface and atmospheric temperature, but also depend on the dust concentration profile because the retrieval is performed in the logarithmic space (e.g. Deeter et al., 2007; Callewaert et al., 2019).
2.2.3 Post-processing algorithm: quality flag and additional variables
The post-processing consists in computing the dust AOD with associated uncertainty and the dust mean altitude, both from the full vertical profile. Uncertainty covariance matrices are computed, and finally quality and cloud flags are added.
The calculation of the dust AOD from the concentration profile Cdust is simply a vertical summation of the dust layers to a dust column, which is then multiplied by the cross-section obtained from the dust PSD and RI used for the retrieval (see Sect. 2.1.2). This can be formalised using the transformation operator L: a row of the same size as the vertical profile, containing a repetition of the cross-section value, multiplied by the layer height (which is currently constant in MAPIR). The AOD is then simply Cdust⋅L. The cross-section depends on the wavelength, and the dust AOD is reported both at 10 µm (close to the retrieval spectral windows, although 10 µm is not in those windows) and at 550 nm (a standard wavelength for AOD reporting). The ratio between the AOD at 550 nm and that at 10 µm is 1.78. A discussion of that conversion takes place in Sect. 3.2.
The dust AOD uncertainty UAOD is calculated from the OEM-obtained uncertainty covariance matrix S on the profile, using the transformation operator L: . In addition, an evaluation of the AOD uncertainty due to surface emissivity uncertainty is provided in Sect. 3.7, however this added uncertainty would be very costly to quantify for each retrieval and is therefore not part of the pixel-wise reported uncertainty.
The mean altitude of the dust is calculated as the altitude for which half the dust particles are below and half are above. Obviously, this parameter is meaningless when multiple dust layers are present. In addition, the mean altitude is only reported when the dust AOD exceeds 0.05 and the information content is larger than 1.25. Lower information content means that there is not enough information in the vertical range to provide more than just an integrated vertical column, and the mean altitude usually ends up being the middle of the retrieval range, i.e. about 5 km.
The data used to build the cloud flag is again slightly different for the CDR IASI-A and the OFL IASI-C data. In the first case, only the cloud fraction is available (from the level 1 data) and the cloud-free criterion is that the fraction is less than 10 %. In the second case, the same holds true and in addition, the level 2 cloud flag must be 1 or 2 (respectively clear sky and cloud free with small contamination possible; EUMETSAT, 2017). This cloud flag is not used during pre- or post-processing and is only added for information.
The MAPIR data quality flag should be used to filter the retrieved data, before using them. The goal is to remove the spurious results, either due to non-convergence (reaching 20 iterations) or converging but with large spectral residuals (root-mean-square of the residuals larger than 0.75 K) or unreasonable values of the retrieved parameters (surface temperature below 200 K or above 350 K, dust AOD at 10 µm larger than 5). Those underline a high probability that even though mathematically the convergence is reached, something is wrong (which can be any of the input data, or the presence of a cloud), and the retrieval result does not reasonably reflect the reality.
Finally, a test has been added to further remove thin clouds. The dust aerosol retrieval converges on most cloudy observations, even though the spectral signature is different. If the cloud is thick, the aerosol retrieval provides a very high concentration, leading to saturation of the signal in the TIR, together with a very low surface temperature. At that point, the dust signal would be similar to a cloud. This is easy to filter out, as the retrieved parameters are unrealistic. If the cloud is thin, the retrieval provides a small dust concentration, together with a surface temperature slightly biased low. This is more complex to filter out. In the current setup, we exploit the fact that the EUMETSAT PWLR3 surface temperature (used as a priori in our retrievals, see Sect. 2.1.1) is an all-sky statistical product, with good performances even under a cloud or aerosols (EUMETSAT, 2018). The MAPIR-retrieved surface temperature will on the other hand be biased low in most cloud cases (as clouds reduce the observed radiance and are not modelled in MAPIR retrievals), and should bear no bias in the dust aerosol cases (as those are correctly modelled in MAPIR retrievals). The criteria used for filtering thin clouds is therefore that the retrieved surface temperature can not be more than 2.5 K lower than the a priori surface temperature. Obviously, this filter is far from perfect and has not been validated due to the lack of required reference data. It removes some thin dust observations, while retaining some thin cloud observations. However, it performs better in that discrimination than using the IASI cloud fraction (and flag), which were wrongly flagging intense dust plumes. The latter is easily seen when analysing IASI cloud data for example during the June 2020 extreme Godzilla event (Saharan emissions transported towards America) and comparing with any so-called True Colour imagery from other satellite sensors.
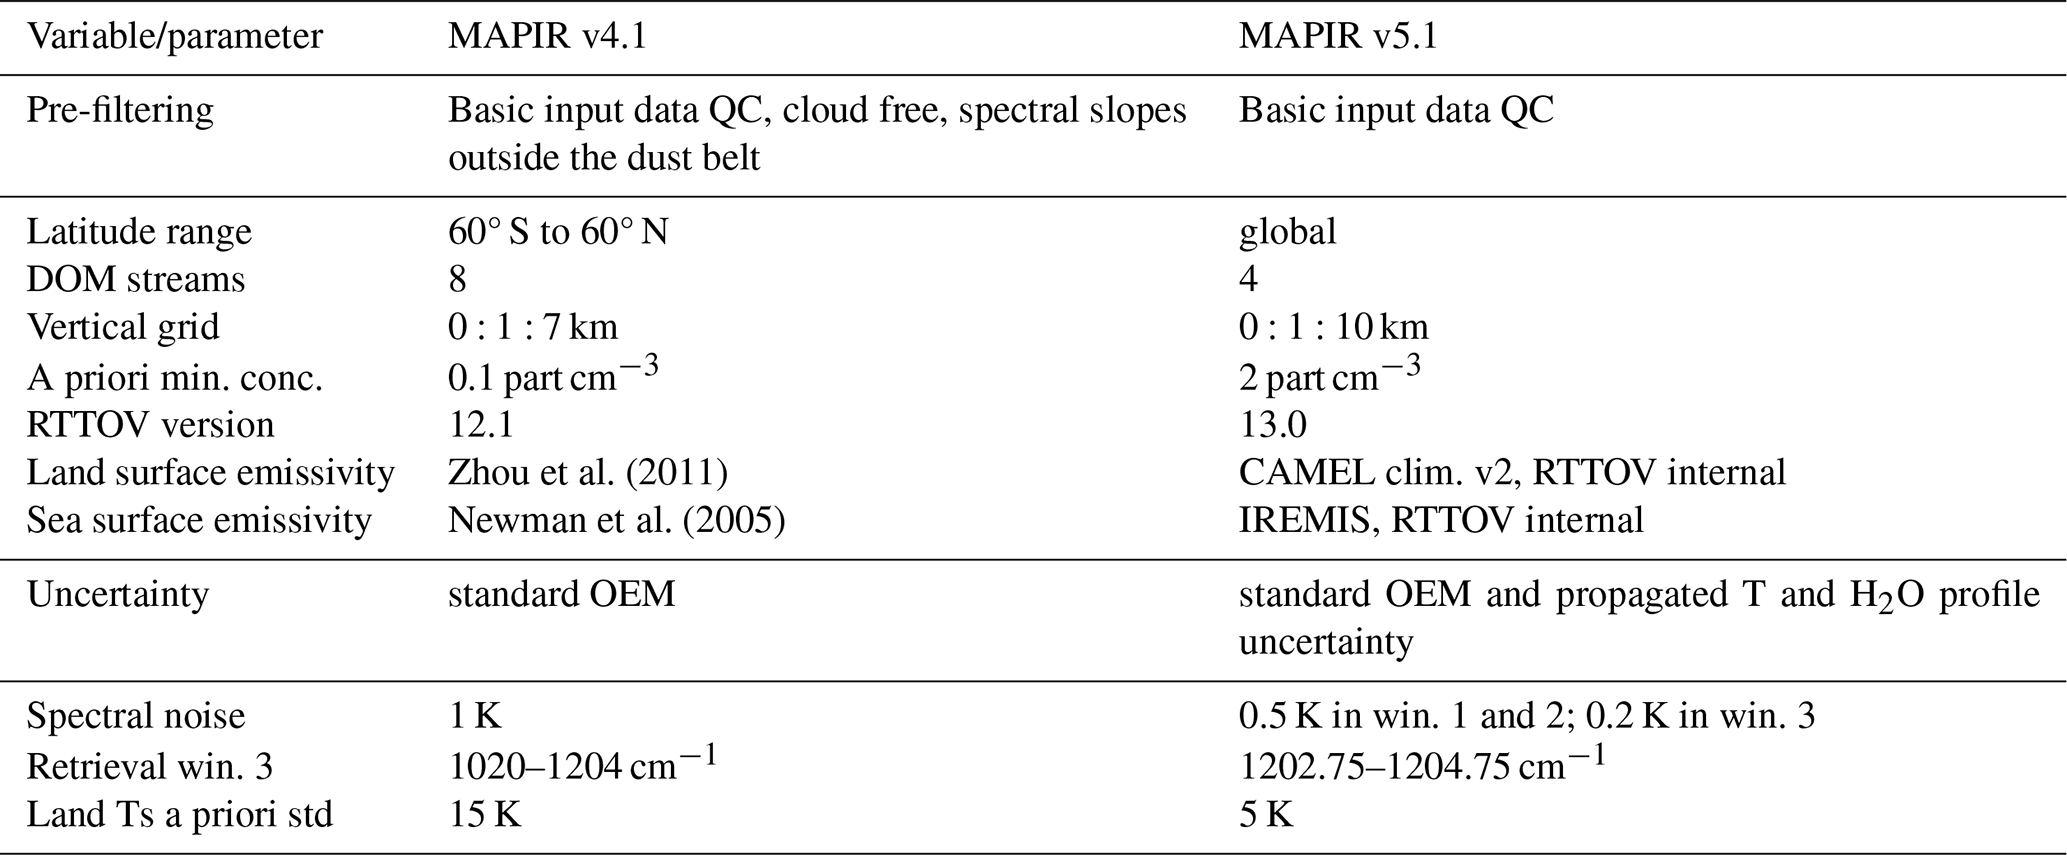
2.2.4 MAPIR v5.1 changes with respect to MAPIR v4.1
A first set of changes impacts the amount of data treated by the retrieval, through the removal of almost all prefilters. This also drives other changes to reduce single retrieval computational time and improve post-retrieval filtering. In MAPIR v5.1, we have removed the pre-filtering for the presence of dust outside the dust belt, which was previously performed by looking at brightness temperature differences to detect the dust V-shaped spectral signature. This filtering was found to miss most of the low intensity events, where the spectral slopes are low, as well as special conditions where the spectral V-shaped signature is inverted (when the dust layer is hotter than the surface). In addition, the cloud filtering prior to running the retrieval has been removed because the EUMETSAT IASI cloud flag is wrongly categorizing intense or unusual dust events as clouds. It was decided to run the retrieval on all IASI observations and remove the cloud-contaminated scenes as post-processing, as detailed in Sect. 2.2.3. Finally, the retrieval is now running globally instead of only up to 60° latitude for version 4.1.
All these changes increase the number of retrievals to be run by an order of magnitude. To mitigate the impact on processing costs, different ways to reduce the retrieval duration were investigated. The number of streams in the multiple scattering DOM was reduced from 8 to 4, gaining about a factor of 4 in computing time. This reduction also led to slight changes in the retrieved dust AOD, which is smaller by a maximum of 0.015 at 10 µm in the performed tests. Such a small impact of the number of streams is explained by the minor contribution of scattering to the total radiative impact of dust in the TIR, largely dominated by absorption and emission. An additional upgrade leading to a slight gain computation time is a technical improvement to the whole processing chain, in particular in the pre-processing part of reading, colocating and quality filtering the IASI level 1 spectra and level 2 data. At the end, MAPIR v5.1 treats about 11 times more data, requiring only about 2.5 times more computing resources.
Further changes include:
-
The new algorithm version extends the vertical range of the retrieval up to 10 km altitude (it was 7 km for version 4.1), allowing to better represent the dust distribution over high altitude areas such as the Tibetan Plateau, where dust is often found (e.g. Ge et al., 2014; Hu et al., 2020).
-
The retrieval minimal a priori dust concentration was increased from 0.1 to 2 particles cm−3, which corresponds to a minimal a priori dust AOD of about 0.07 at 10 µm. This change affects areas and altitudes where dust is rarely present and the LIVAS climatology usually shows a very low dust extinction. Deviation from a very low a priori concentration to the much higher concentration expected during an event is costly in the minimization cost function, even more with a retrieval in the logarithmic mode (Deeter et al., 2007; Callewaert et al., 2019). With the previous setup (minimal a priori value of 0.1 particle cm−3), retrievals for rare dust events in unusual areas either failed to converge or wrongly modified mostly the surface temperature. Those cases were then rejected by QC because of the large gap between observed and modelled spectra. However, this higher minimum a priori value tends to create a small positive bias for low-load dust events. This happens especially when sensitivity is low, where the retrieval output stays only slightly lower than the a priori value, leading to a dust AOD of about 0.05 at 10 µm. A solution to this bias will be investigated for the next version, however tackling this without increasing computation time will be challenging.
-
The version of the radiative transfer tool used, RTTOV, was updated, from version 12.1 to version 13.0 (Saunders et al., 2020), including the use the new version 13 of the RTTOV coefficients with updated gas line parameters and a new optical depth parameterization. This has very minor impact on our simulations, such as slightly lower spectral residuals in some cases. The important new feature of RTTOV v13 for MAPIR is the availability of a new land surface emissivity database: the CAMEL climatology version 2 (Loveless et al., 2021), based on 16 years of data, which is now used in MAPIR v5.1. This is a significant change with respect to MAPIR v4.1, where the land surface emissivity from Zhou et al. (2011) was used. The latter data set has been used since the beginning of the MAPIR retrievals, as the only relevant data with the necessary spectral coverage and resolution. However, this data suffers from a significant bias in the areas where dust is present almost every day during some months (e.g. the Sahara during summer), due to the way the emissivity is retrieved. On the other hand, the CAMEL climatology shows a more reasonable seasonal cycle, and is similar to the EUMETSAT IASI emissivity when available. Using the EUMETSAT IASI emissivity, distributed in NRT as 12 principal component scores, was also investigated. Its quality appears to be affected by the presence of clouds and dust, as one could expect. In addition, as this is a single spectrum retrieval, it contains an unreasonable variability (e.g. up to 5 % over deserts within a month), with also unexplained year-to-year large differences that hinder the production of a proper climatology. As a conclusion, the CAMEL v2.0 climatology seems the most adequate choice for land emissivity in MAPIR, at the current state-of-the-art. This modification leads to some significant changes in the retrieved dust AOD and vertical profiles, in some cases and areas.
-
The sea surface emissivity was also changed from the Newman et al. (2005) data set (constant everywhere over sea) to using the RTTOV internally calculated emissivity, using the IREMIS model, which is the default RTTOV sea emissivity (Hocking et al., 2021).
-
One additional improvement to the algorithm is the inclusion of propagation of temperature and water vapour profiles uncertainties, to the uncertainty in the aerosol concentration and AOD, through Rodger's formalism (Rodgers, 2000). This requires the Jacobians (radiance derivatives) for those parameters, which comes with no additional computing costs in the case of RTTOV: the temperature and humidity Jacobians are always computed. The uncertainty in temperature and humidity input data are respectively set to 1 K and 10 % (at all altitudes) which are the target accuracy levels for the IASI datasets.
-
The spectral noise inflation in the retrieval has also been reduced with respect to the previous retrieval version, which used to have a strong noise inflation (Callewaert et al., 2019): the spectral noise used in the retrieval was much larger than the true instrumental spectral noise (1 K in all retrieval windows, while spectral noise is reported to be 0.2 K in the first two windows, 0.03 K in the third by Clerbaux et al. (2009) or 0.25, 0.33 and 0.07 K respectively by Hilton et al. (2012) as already mentioned in Sect. 2.2.2). Now in MAPIR v5.1 the OEM spectral noise is set to 0.5 K in the first two windows, and 0.2 K in the third window, much closer to the instrumental noise. This new set-up increases the weight of the constraint from the observation with respect to that from the a priori, and also increases the DOFs. The impact is mostly seen where the AOD is low: the retrieval may deviate more from the a priori and reach lower AOD values. No convergence issues have been noticed with this set-up, but they arise if the spectral noise is further reduced towards the instrument noise.
-
The third retrieval window, which was from 1202 to 1204 cm−1 was slightly shifted to 1202.75 to 1204.75 cm−1, to avoid some small methane absorption lines. This has no detectable impact on the retrieval results but is theoretically better and more robust.
-
Finally, the input IASI data has been selected to ensure consistency all along the IASI time series (for the climate version) or to ensure using the best available data (for the NRT version). This was already explained in details in Sect. 2.1.1. Furthermore, the processing chain was also modified to be more efficient and more flexible with respect to QC of the input data. One consequence of using the reprocessed IASI data is that the surface temperature a priori is now of better quality under dust storms, especially over deserts (where old IASI data versions produced highly biased data), allowing to reduce the surface temperature a priori standard deviation from 15 to 5 K over land. That means that in MAPIR v5.1 this standard deviation is set to 5 K everywhere.
2.3 Retrieval overall performance
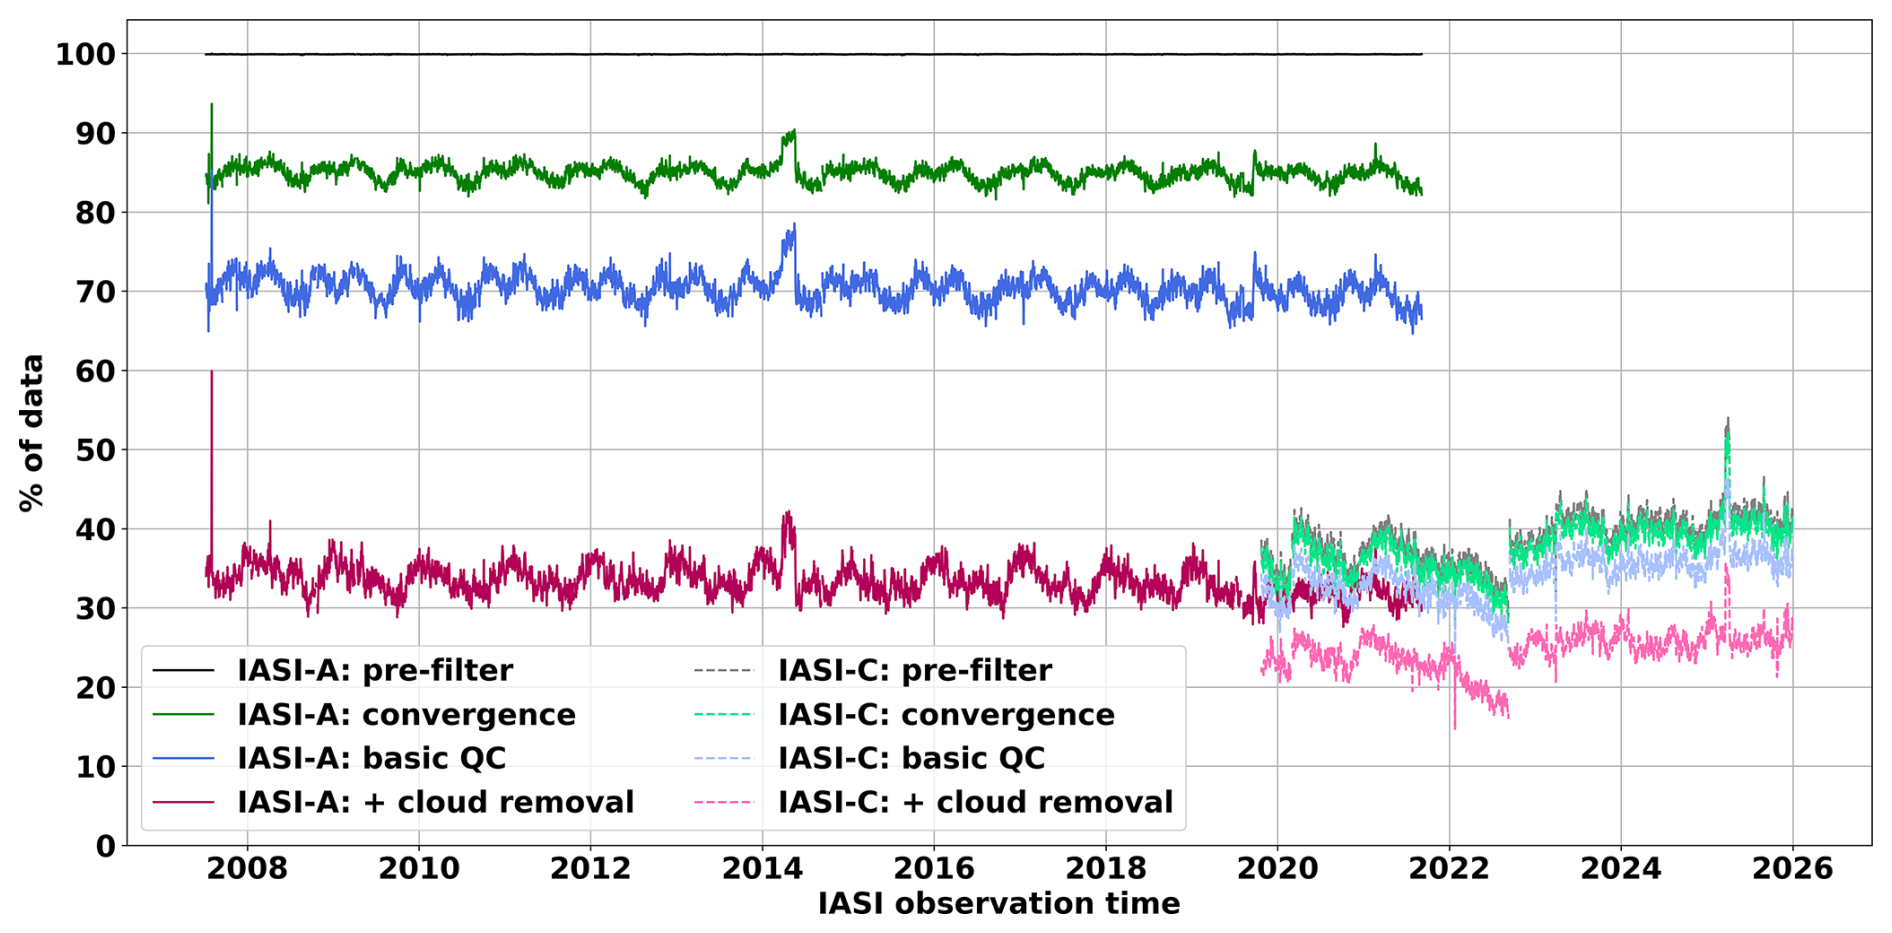
Figure 2 shows the statistics of the MAPIR IASI-A and IASI-C performance, in terms of pre-retrieval filtering, retrieval convergence rate and post-retrieval quality filtering (basic and including the cloud filtering).
For IASI-A, almost all observations are accepted for launching the retrieval (grey line in Fig. 2) and MAPIR v5.1 convergence rate is about 85 % (green line), relatively low because the retrieval is run on all spectra, including those containing very thick clouds, which often lead to non-convergence. A total of about 70 % cases pass the first set of quality filters (blue line, filtered on spectral residuals, reasonable surface temperature and AOD as detailed in Sect. 2.2.3). Finally, about 35 % (of the total) pass the final quality test aimed at removing residual clouds (dark pink line). These numbers are stable along time, except a slight decreasing trend towards the end of the IASI-A life span. This reflects the long-term consistency of the EUMETSAT level 1 and level 2 IASI-A CDR, and most probably the small impact of the orbital drift towards the end of the instrument's life. The small spike of good quality data in April and May 2014 could be linked to several orbital manoeuvres occurring in that period (EUMETSAT, 2025c).
For IASI-C, even though everything was expected to be consistent with IASI-A, after the processing a technical issue was discovered in the OFL IASI-C 1 data. The surface altitude was not provided for a significant portion of the pixels reported as cloudy and mostly those with a cloud flag value of 3 which represents partial cloud coverage in the pixel or a cloud flag of 4 which represents high or full cloud coverage of the pixel. The absence of that parameter causes the MAPIR retrieval crash. For the next (re)processing, the surface altitude in MAPIR will be provided from a separate digital elevation model to avoid such issues. For this work, this issue leads to retrieving dust parameter for only 35 % to 40 % of the IASI-C observations, and then almost all those retrievals converge. After the full QC process is applied, about 25 % to 30 % of the observation remain. This is significantly lower than for IASI-A, and a quick comparison of the data clearly shows that with IASI-C some of the highly dusty pixels are missing. In addition, the statistics demonstrate at least one strong discontinuity in the QC between 9 and 15 September 2022, that seems to correct for a decreasing trend in the year before, and corresponds to an instrument decontamination (EUMETSAT, 2025c).
This section contains a demonstration of the capabilities of MAPIR v5.1, and an evaluation of the IASI MAPIR dust profiles and integrated AOD quality against different reference data sets.
3.1 Instruments, models and data used for evaluation of the MAPIR retrievals
3.1.1 AERONET | AOD evaluation
AERONET is a globally distributed network of ground-based remote sensing aerosol monitoring stations established by NASA (National Aeronautics and Space Administration) and PHOTONS (PHOtométrie pour le Traitement Opérationnel de Normalisation Satellitaire) in collaboration with numerous international partners (e.g. Holben et al., 1998). Utilizing sun photometers, AERONET provides continuous, high-quality, and standardized measurements of aerosol optical properties, including AOD, size distribution, and refractive index (e.g. Dubovik et al., 2002; Eck et al., 1999).
In this work, AERONET data is used as ground-based “truth” for comparison with the IASI MAPIR dust AOD. We used the AERONET version 3 (Giles et al., 2019; Sinyuk et al., 2020) solar and lunar level 2 (cloud screened and quality assured) Spectral Deconvolution Algorithm (SDA) version 4.1 (O'Neill et al., 2003). From this data, we select the coarse mode total AOD at 500 nm (further referred to as CAOD, containing dust coarse mode aerosols and when present sea salt/marine aerosols) for comparison with the MAPIR dust AOD converted to 550 nm. All AERONET stations with median CAOD of at least 0.05 were considered in this analysis. This avoids comparing data from areas with very little dust or with mostly marine aerosols, which would then mostly be comparing noise levels.
The AERONET data is filtered to remove events for which the reported uncertainty is large, following the method initially described in Capelle et al. (2018): we keep only data with a reported root-mean square error lower than . That filtering removes about of the comparison points overall, especially in East Asia, but does not change the comparison statistics on a global scale. The correlation between MAPIR and AERONET improves at Asian stations (where most of the “bad” data is removed), and slightly worsens at some “transport” stations, where the variability is low, because the filtering removes a significant number of high dust load events, lowering the variability even more. Finally, the AERONET data is filtered to remove mixed events of dust and fine aerosols such as those linked to biomass burning. Indeed, when two different aerosol types are mixed the partitioning between fine and coarse mode in the SDA algorithm is more difficult and the resulting CAOD is plausibly of lower quality. The filtering is performed using the AERONET Fine Mode Fraction: when this fraction exceeds 0.5 the data is rejected. That results, for example, in about 45 % of the IASI-A against AERONET solar comparison points being rejected, mostly of low AOD. Again the global statistics of the comparisons do not change significantly with this additional filtering. Figure 3 shows the impact of both data filters on the number of MAPIR-AERONET colocations per station, for the IASI-A full time series: from 4 % data removed at Ragged Point (Barbados) to 90 % data removed at Silpakorn University (Thailand).
Finally, stations were used only if at least 100 co-locations were found (the method is described in detail in Sect. 3.3.1), leading to using the 74 stations listed in Table A1.
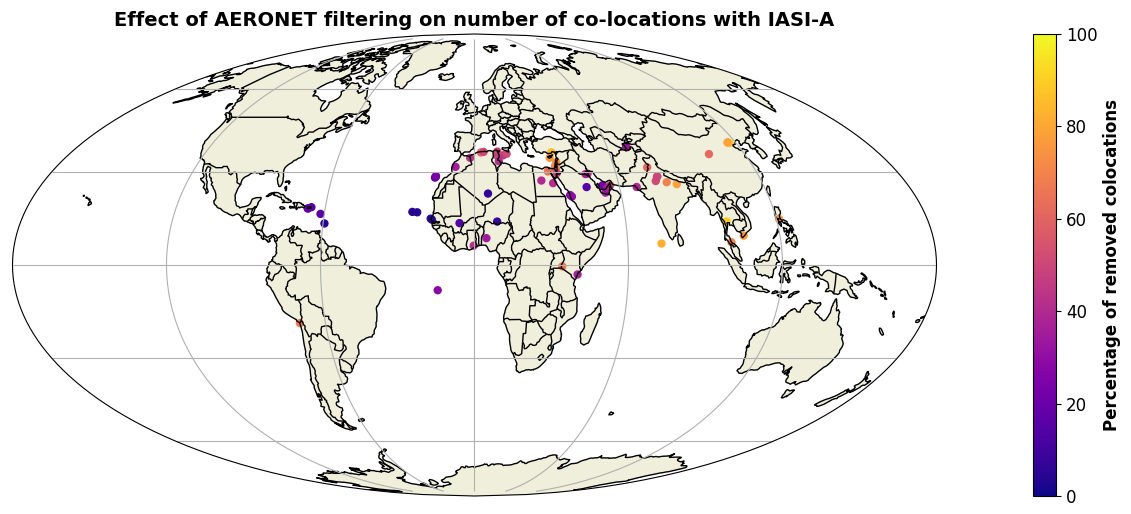
Figure 3Reduction (in %) of AERONET – MAPIR IASI-A colocation pairs due to AERONET filtering.
3.1.2 EARLINET | Vertical profiles evaluation
Lidar (Light Detection and Ranging) is an active remote sensing technique widely used to study the vertical distribution of atmospheric aerosols. By measuring the backscattered signals from emitted laser pulses at certain wavelengths, it can acquire information on the shape, size and concentration of atmospheric particles. When ground-based, the signal may reach altitudes up to the lower levels of the stratosphere. Lidar is the most accurate means of studying the vertical resolution of aerosols, making it an excellent tool in mineral dust (e.g. De Rosa et al., 2025), satellite instrument evaluation (e.g. Michailidis et al., 2023) and aerosol classification studies (e.g. Voudouri et al., 2019). The European Aerosol Research Lidar Network, EARLINET, consists of more than 30 ground-based lidar stations distributed across Europe (e.g. Pappalardo et al., 2014) providing harmonized and quality-assured datasets. The network ensures data consistency through the application of the Single Calculus Chain algorithm (e.g. D'Amico et al., 2015), an automated processing framework that standardizes lidar data analysis. In the present study, Level 1 data from the EARLINET station of Limassol, Cyprus (CYC, 34.68° N, 33.04° E, 11 m) (e.g. Mamouri et al., 2016) were used, a site strategically located in the Eastern Mediterranean, frequently affected by long-range transported mineral dust originating from the Sahara Desert and the Middle-East. The CYC station consists of a multiwavelength PollyXT lidar (e.g. Engelmann et al., 2016) which performs continuous automated measurements under diverse atmospheric conditions, rendering it optimal for evaluation of polar-orbiting satellite data.
3.1.3 CALIOP | Vertical profiles demonstration
CALIOP is a nadir-pointing, dual-wavelength elastic backscatter lidar onboard the CALIPSO satellite, launched in April 2006 as part of the A-Train constellation with equator crossing time of 13:30 and 01:30 local solar time. CALIOP provides global, vertically resolved observations of aerosols by measuring backscattered laser radiation at 532 and 1064 nm (Winker et al., 2009). At 532 nm, CALIOP measures both parallel and perpendicular polarized backscatter, enabling the computation of particulate depolarization ratios and supporting aerosol type discrimination, while the 1064 nm channel measures total attenuated backscatter. The instrument has a nominal horizontal sampling of 333 m along track and a vertical resolution of 30–60 m in the troposphere.
This study uses CALIOP Version 4.2 Level 2 aerosol profile products. Aerosol backscatter and extinction coefficients are retrieved from calibrated attenuated backscatter profiles by removing the molecular contribution and applying aerosol-type-dependent lidar ratios. Aerosol subtyping (e.g. dust, smoke, polluted continental) in Version 4.2 is based on an improved classification algorithm that exploits layer-integrated backscatter, depolarization ratio, spectral dependence, and layer altitude (Kim et al., 2018). We use the CALIOP aerosol type and 532 nm extinction profiles, to qualitatively compare with IASI MAPIR dust concentration profiles. The data is quality-controlled as advised in Winker et al. (2013): only data with Cloud Aerosol Discrimination (CAD) score between −100 and −20 (avoiding detection artefacts) and with extinction quality flag pertaining to successful retrievals (value of 0, 1, 16 or 18) are kept (e.g. Song et al., 2021; Ridley et al., 2012; Mielonen et al., 2009; Gkikas et al., 2016).
3.2 Evaluation Challenges
The main challenge arises from the absence of reference aerosol data in the TIR. Therefore MAPIR results can only be compared with data gathered in the VIS or near-infrared (NIR) spectral ranges, using very different types of instruments. In the case of aerosols, the implications are even wider because the spectral sensitivity to aerosols is largely different in the VIS and TIR.
In a nutshell, TIR allows observations of (almost) only coarse mineral aerosols, while VIS bears the radiative impact of all aerosol types and all sizes. The aerosol effect on radiation is the combination of scattering, absorption and TIR emission. The latter depend on the particle size, composition and absorption/emission features, while the former depends on the ratio between the particle size and the wavelength. Both are significantly different in VIS and TIR.
Absorption in the TIR is due only to mineral aerosols, while VIS absorption is mostly due to black carbon, with some contribution of dust and organic carbon (e.g. Li et al., 2022). Even within the dust absorption, sensitivity differs: in VIS it mostly depends on the iron oxide content, while in TIR it is due to clays, quartz, calcite, kaolinite and felsdspar (e.g., Di Biagio et al., 2019, 2017; Li et al., 2021). The coarse particles obviously absorb significantly more than fine particles (for the same number of particles).
As for the scattering, in TIR it is due to coarse particles only, while in VIS, there is also a significant fine-mode scattering contribution (e.g. Dufresne et al., 2002; Li et al., 2022).
There are however ways to mitigate those differences and perform meaningful comparisons between TIR aerosol information and VIS reference aerosol data. From VIS observations, it is possible to separate the fine and coarse modes (e.g. for AERONET O'Neill et al., 2003). The main assumption here is that the spectral variation of the coarse mode is neutral (within the VIS range). The VIS coarse mode data obtained this way may also contain thin cloud contamination, for which a removal is attempted based on the temporal variability. It also contains contributions from sea salt particles and volcanic ash when present. The VIS CAOD is, to our knowledge, the best parameter to be compared with the TIR-obtained dust AOD. However, obviously, the separation is not perfect, in particular when there is a mixture of aerosols.
Finally, in addition to selecting the VIS AOD that best matches the types of particles observed in the TIR, there is a need to convert the AOD obtained in the TIR (standard is at 10 µm) to a VIS AOD (for example 550 nm). Theoretically, the conversion is simple, using the particle cross-sections at the two wavelengths (Eq. 1). The cross-sections are obtained using the particle optical properties used in the retrieval (see Sect. 2.1.2) and a Mie code (spherical assumption, as in MAPIR retrievals).
After conversion, the reported AOD at 550 nm is the CAOD, representing particles that are observable in the TIR. The conversion adds a significant uncertainty linked to the difference in sensitivity at both wavelengths and to the fact that the cross-sections are calculated using a Mie code, with the approximation of spherical particles. It is well-known that mineral dust particles are not spherical (e.g. Kandler et al., 2007). The shape of the particles impacts scattering phase functions, with only a small effect in TIR where the particle size is smaller than the light wavelength (e.g. Koepke et al., 2015). However, non-sphericity has a significant impact in VIS and especially in conversions between VIS and TIR (e.g. Song et al., 2018; Saito et al., 2021).
Clarisse et al. (2019) made a literature review of the different conversion factors for mineral dust AOD, from 10 µm to 550 nm and highlighted that they range from 0.9 to 3.5, the VIS AOD being usually larger than the TIR AOD. Our conversion factor of 1.78 falls in that range, a bit lower than the average value of 2.2. Recently, Zheng et al. (2026) confirmed an expected dependency of the conversion factor to the PSD and RI, with TIR to VIS factors of 1.25 to 5 for effective radius from 3 to 1.5 µm and RI assigned during the retrieval, depending on source region and using the database from Di Biagio et al. (2017).
Finally, in TIR particle thermal emission occurs, with the same spectral dependency as the absorption and with an intensity depending on the particle temperature, hence on its altitude. The AOD, on the other hand, does not contain any altitude information, and is simply the vertically integrated aerosol number concentration multiplied by the extinction coefficient at the desired wavelength. That means that the same TIR AOD with a different underlying vertical profile actually produces a different impact on radiance. It also means that in a TIR aerosol retrieval the altitude of the aerosols is highly important and any bias in it directly leads to a bias in the retrieved TIR AOD.
All these considerations are highly important and need to be kept in mind when comparing TIR retrievals to data obtained from VIS instruments. Failing to do so would lead to erroneous conclusions and a wrong evaluation of the TIR dust observation and capabilities.
3.3 Integrated AOD comparison against AERONET
3.3.1 Co-location method
The method used to co-locate the ground-based reference and satellite observations may have a strong influence on the comparison results. Ideally, one would wish for the smallest time and space differences, but one also requires sufficient comparison data for a reasonable statistical analysis. Finally, one can compare each single pair of co-located data (maximising the number of comparisons) or averaged data (reducing the noise in the comparisons). A short literature survey shows (Table 4) different approaches in different publications/analyses.
Proestakis et al. (2024)Capelle et al. (2018)Clarisse et al. (2019)Callewaert et al. (2019)Bernard et al. (2011)Gkikas et al. (2021)Table 4Literature survey of co-location methods between different satellite instruments and AERONET.
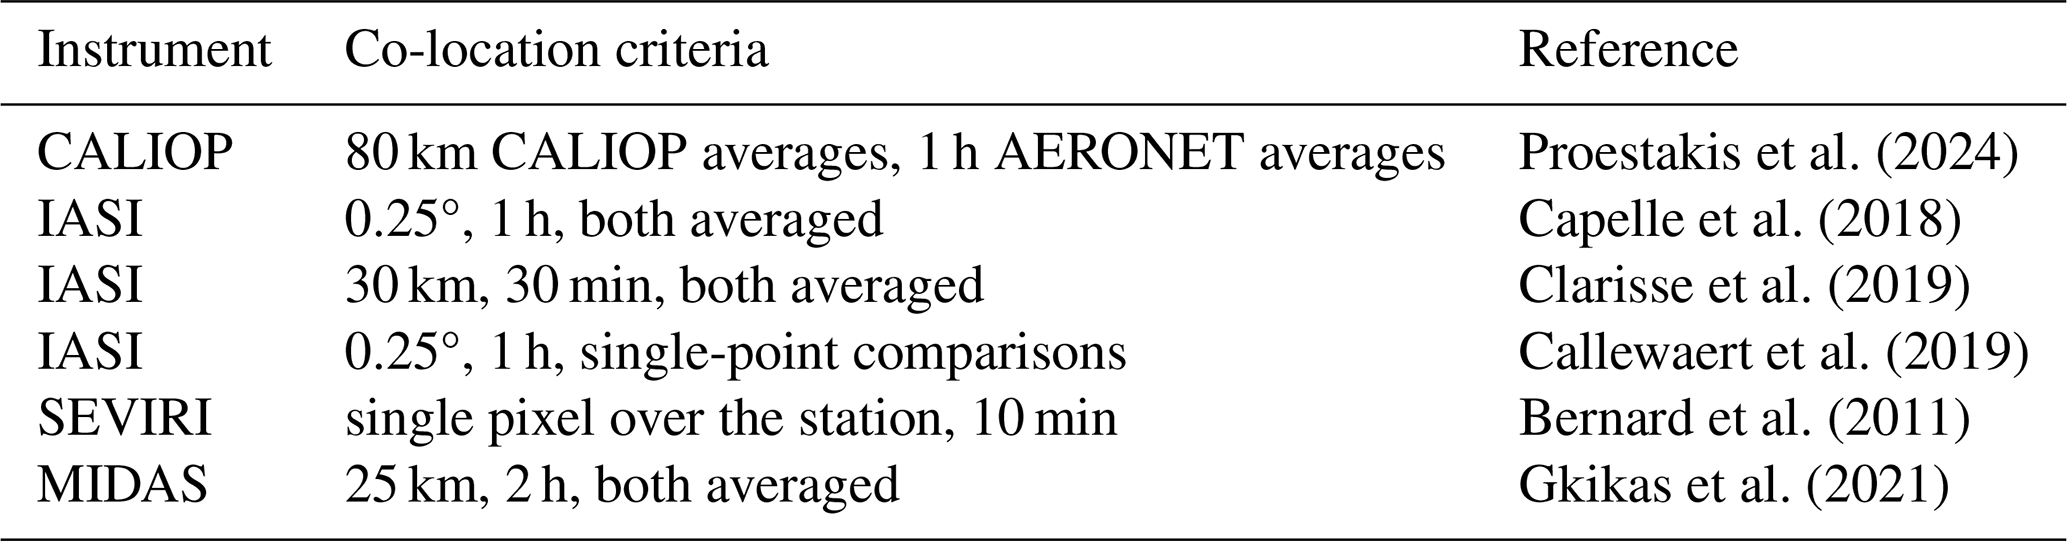
In this work, we have tested different criteria and compared the results: co-locations distances from 25 to 150 km and times from 15 min to 1 h, single point comparisons or averages within the co-location criteria, with and without outlier removal. General conclusions remain very similar for all these. Differences are seen at some stations, with usually an obvious explanation. First, at stations located close to sources, the correlation coefficient tends to decrease when loosening the co-location constraints, attributed to the high horizontal variability of the atmospheric dust in those areas. Second, at stations with only few data, loosening the co-location constraints allows more data to enter the comparisons, leading to different statistics (sometimes better and sometimes worse). Third, at stations with little variability in the dust/coarse aerosol load, far from sources, loosening the co-location constraints improves the statistics as more events are included in the comparisons, enhancing slightly the variability and leading to a slightly better correlation coefficient.
Using mean values in the comparisons instead of comparing single observations smooths the local variability (in time and space), and might lead to misinterpretation when using loose co-location criteria. Indeed, single observation comparisons with loose criteria show a large spread of both MAPIR and AERONET data for a single event (especially close to sources where the variability is larger), while using averaged values only shows a slight correlation coefficient reduction. Having performed comparisons with all types of co-location criteria allows a better understanding of both data sets, and therefore also a better interpretation of the comparison results.
The results shown and discussed here are for maximum 25 km distance between the IASI pixel centre and the AERONET station, maximum 15 min between the observations, and single comparisons (no time or space average). This assumes that the dust aerosol field is homogenous within 25 km and 15 min. Finally, the worst 3% of the comparisons are removed from the statistics for each station, as probable outliers (due to limitations in satellite versus ground-based comparison, considering the high spatiotemporal variability of dust AOD) or cloud misclassification. However, this only minimally affects comparison statistics (e.g. MAPIR IASI-A versus AERONET solar data median bias is 0.011 or 0.012 respectively without and with the outlier removal). The correlation coefficient is reduced when not removing outlier (0.71 versus 0.78), which is expected due to the presence of additional noise in the data. The same comparisons are performed using both solar and lunar AERONET data, but statistics are computed separately as the AERONET data quality might differ between solar and lunar measurements acquired under very different circumstances and with different sensitivity. Stations for which there is less than 100 colocations are removed from the analysis.
3.3.2 Global statistics
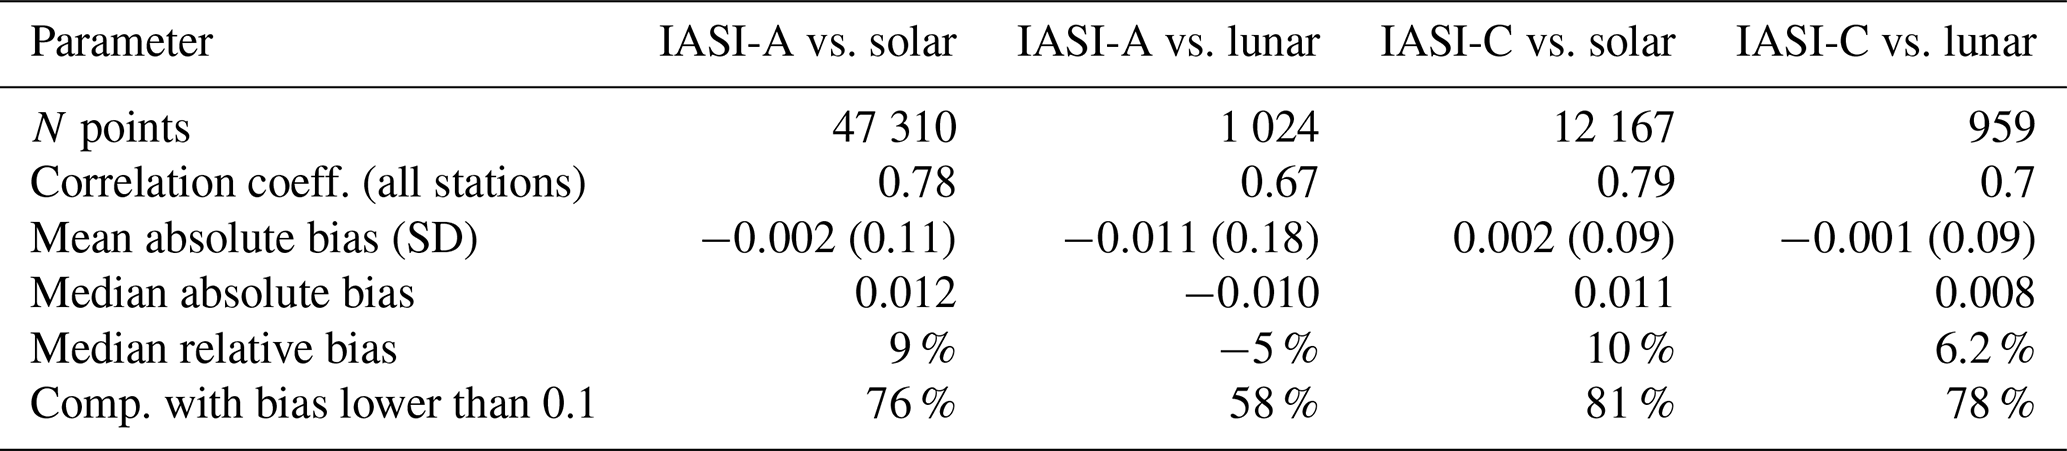
In this section, we analyse the comparisons globally, all co-locations from all-stations grouped together. Table 5 provides the comparison statistics for MAPIR IASI-A and C separately (dust AOD converted from 10 µm to 550 nm), and for solar and lunar AERONET observations separately (SDA CAOD). The overall correlation coefficient is almost 0.8 between both IASI and AERONET solar observations, and almost 0.7 for comparisons with AERONET lunar observations, which shows very good capability of IASI and MAPIR to observe dust events and follow their seasonal cycles. The mean absolute bias is close to 0 with a standard deviation of about 0.1, except for IASI-A against lunar AERONET where bias is larger (0.011) and with about twice the standard deviation. The median absolute bias is of about 0.01, positive for all groups except again for IASI-A against AERONET lunar where it is negative. The median relative bias is about 10 % for both IASI instruments against AERONET solar, and about 5 % against AERONET lunar. The median absolute bias is positive in all cases except IASI-A against AERONET lunar. The ratio of comparisons with a bias lower than 0.1 lies between 76 % and 81 % except again for IASI-A against AERONET lunar, where it is only 58 %. We recall here the important considerations from Sect. 3.2, which have a strong impact on absolute value comparisons while mostly not affecting correlation.
Table 5Statistics of MAPIR v5.1 AOD converted to 550 nm versus AERONET SDA CAOD.
Figures 4 and 5 show graphically the comparison results of MAPIR converted 550 nm AOD (IASI-A and C separately) versus AERONET (solar and lunar separately). Panels (a, d) show the density plot of MAPIR against AERONET AOD, with its linear regression line and equation. Panels (b, e) show scatter plots of MAPIR bias versus AERONET and data bins with constant number of points (median and interquartile (IQR) are shown). Finally, panels (c, f) show histograms of the MAPIR bias, together with its median and quartiles. These figures show that even though the correlation, mean and median bias highlight very good performance of MAPIR v5.1, there is a clear overestimation by MAPIR v5.1 of the low 550 nm AOD values, and a linear dependence of the MAPIR 550 nm AOD bias with the AOD, the bias being positive for small AOD and becoming negative from AOD of about 0.1. The histograms also show almost Gaussian distributions of the bias, with a maximum skewed towards positive values while the median is close to zero.
The overestimation of low AOD is clearly linked to the lack of IASI sensitivity for very low AOD and therefore also exists in the 10 µm AOD data. In those cases, the deviation from the a priori during the retrieval is difficult. The a priori minimal value was set to 2 particles cm−3 all over the retrieval range, corresponding to a dust AOD of about 0.08 at 10 µm, or about 0.14 at 550 nm. The retrieval manages to deviate to lower values in absence of dust, but as will be seen more precisely in Sect. 3.3.3 there is a lower threshold that the retrieval does not seem to be able to pass.
The underestimation of high 550 nm AOD, could be linked to an underestimated AOD conversion factor from TIR to VIS (see Sect. 3.2), and the linear dependence of the bias with the AOD aligns with such a possibility. Indeed, using a TIR to VIS conversion factor of 2.85 (instead of the theoretically calculated 1.78) leads to a constant bias (0.1±0.05) of MAPIR 550 nm AOD compared to AERONET solar CAOD. Following the finding from Zheng et al. (2026), only a small difference in effective particle size is enough to explain such a difference in conversion factors (e.g. a conversion factor of respectively 1.78 and 2.85, in their work, corresponds to a Reff of respectively about 1.9 and 1.75 µm). Future work should include investigating variable PSD and RI in the retrieval and/or in the conversion. To validate the absolute value of the IASI dust TIR AOD and conversion factor to VIS, it would be necessary to have some reference data directly at 10 µm, which is currently not available. Therefore, these AOD comparisons are interesting as they help understand the product (and are requested by users), but the absolute value of the bias is not truly a product quality assessment. The correlation is however relevant, as it assesses relative changes and not the absolute values.
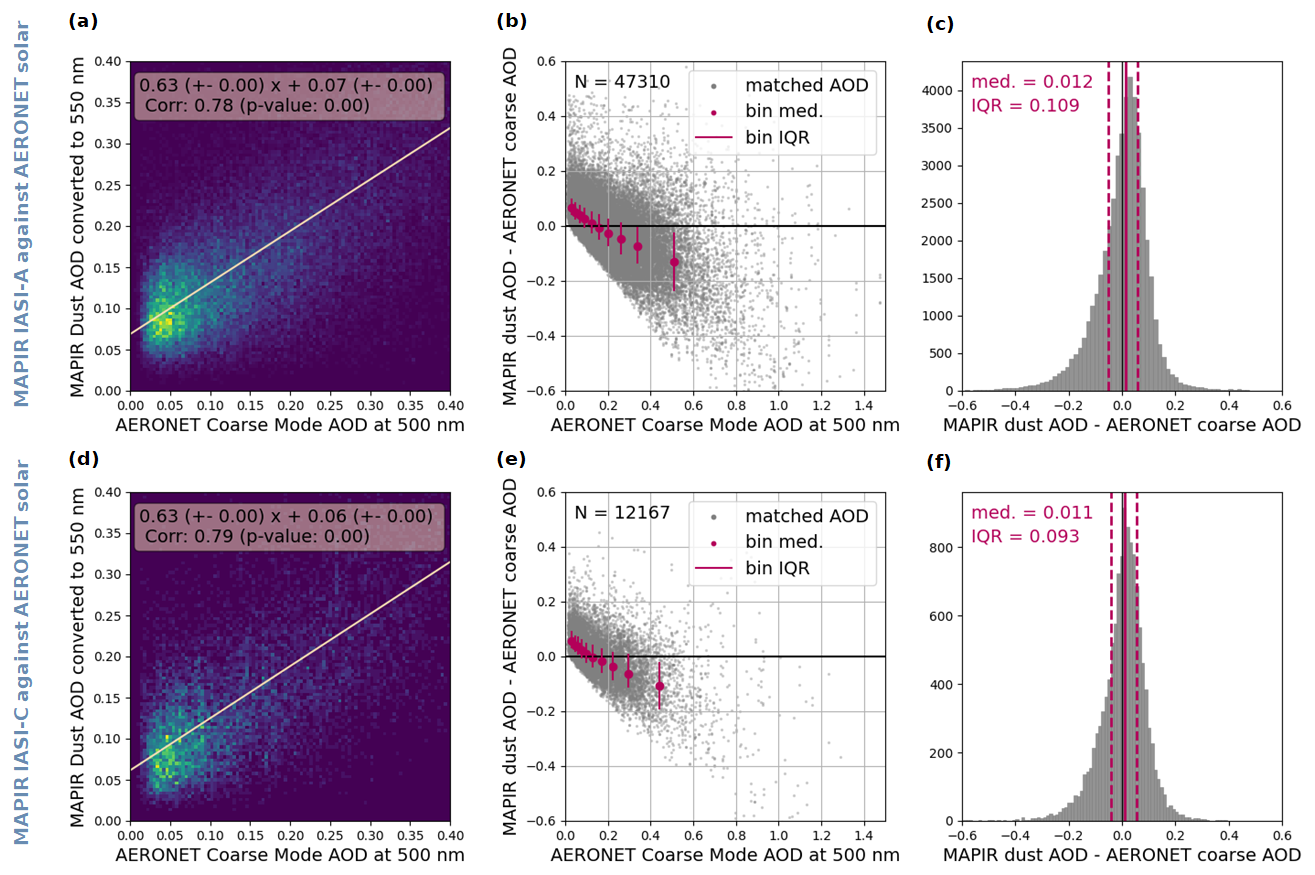
Figure 4MAPIR v5.1 comparisons for IASI-A (a, b, c) and IASI-C (d, e, f) dust AOD converted to 550 nm against AERONET solar SDA CAOD at 500 nm. (a, d) Density plot of AOD, MAPIR versus AERONET, with its linear regression and equation; (b, e) Scatter plot of the MAPIR AOD bias versus the AERONET AOD, with bins of equal number of points. (c, f) Histograms of the MAPIR AOD bias.
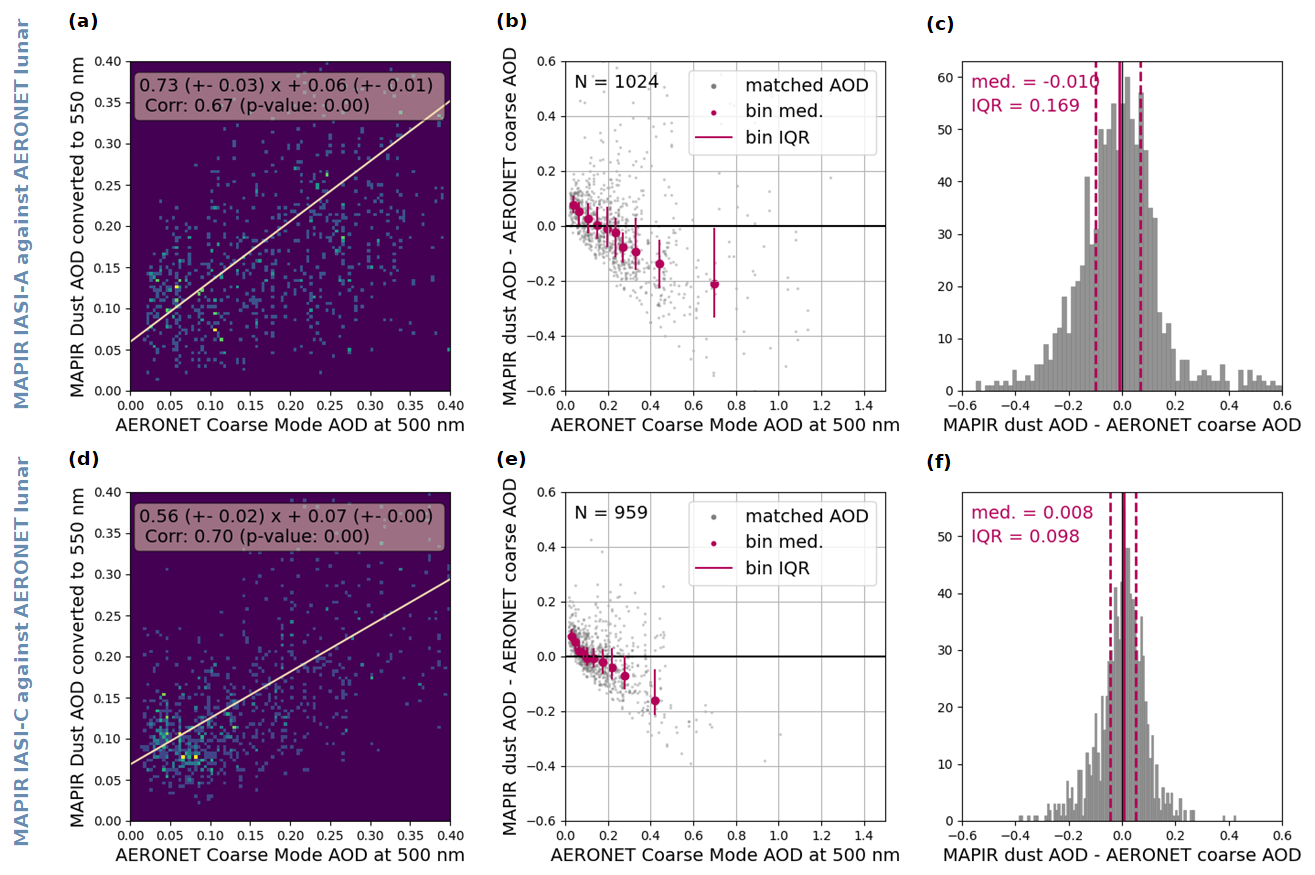
Comparisons with lunar AERONET data show similar results as for solar for IASI-C (although with much fewer points, and at much fewer stations) but significantly more noise for IASI-A, especially for high AOD. This is most probably due to unfiltered thin clouds, leading to artificially high dust MAPIR AOD in some cases even though these should not appear in the colocations with AERONET data as the latter also undergo a cloud filtering. The absence of such issues for IASI-C comparisons with lunar AERONET highlights that the IASI-C data was partially cloud-filtered before the retrieval, due to the absence of the surface altitude data for most of the cloudy pixels (see Sect. 2.3). This unwanted filtering however also clearly removed some of the high AOD dust cases, as seen on both IASI-C comparison plots for which the last equal number bin (black, in panel c) occurs for a significantly lower AOD than for IASI-A.
3.3.3 Stations
Figure 6 shows the Pearson correlation coefficient between the MAPIR IASI-A dust AOD converted to 550 nm and solar AERONET SDA CAOD at 500 nm, for the 68 stations passing the criteria detailed in Sect. 3.1.1. The corresponding map for IASI-C comparisons is very similar, with some different stations due to the different time frame, and a total of 41 stations. The comparisons with AERONET lunar data contain only 8 stations for IASI-A and 7 for IASI-C and the correlation coefficients are again similar, slightly lower for IASI-A as already seen in the global statistics. The limited number of lunar stations in these comparisons arises from the strong constraint of at least 100 colocations at a station to keep it in the analysis. Table A1 summarizes all these statistics by station.
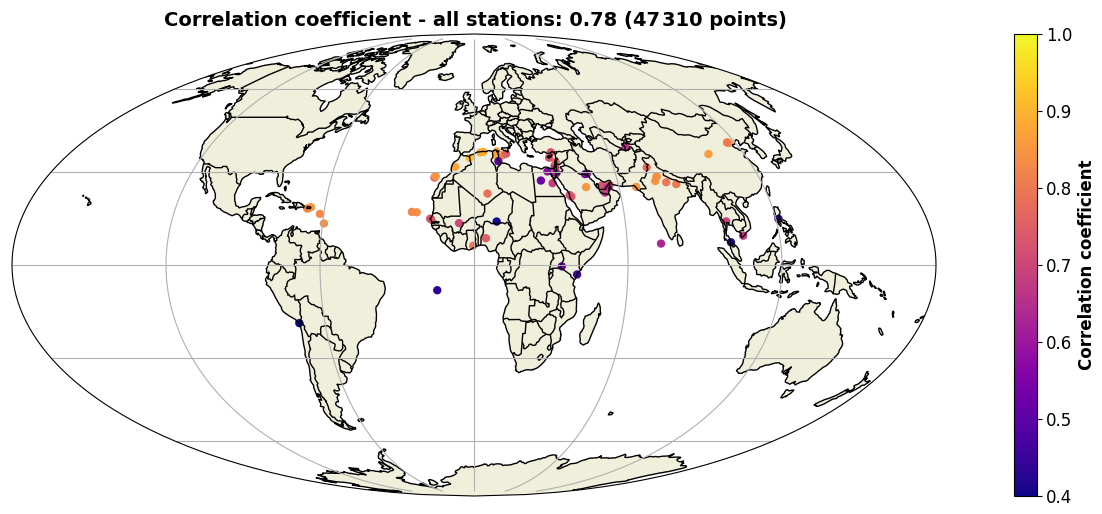
Figure 6Correlation coefficient between MAPIR v5.1 comparisons for IASI-A dust AOD converted to 550 nm and AERONET solar SDA CAOD at 500 nm, for all stations with at least 100 colocations
For most stations, the correlation coefficient is about 0.8, including close to sources and after long-range transport towards the Caribbean. This shows the good capability of MAPIR/IASI to identify the dust events, their relative intensity and seasonal cycles. The stations with the worst correlation coefficient (below 0.5, e.g. in Ascension Island, Arica or Manila) show very little AOD variability, and highly discontinuous time series, rendering the statistical analysis unfit in terms of correlation. The same occurs for Zinder airport lying in the Sahara but reporting very episodic data, only for strong events, rendering it again statistically unfit for extraction of a correlation coefficient. There is also a group of stations with a correlation coefficient around 0.6–0.7, lying mostly in the Middle-East. Most of them lack full seasonal cycle observations, and therefore again lack a part of the natural variability, reducing the capability to get a good correlation coefficient from noisy data.
Figure 7 shows the time series of AERONET solar and lunar data, and of IASI-A and IASI-C data split between daytime and night-time, for two AERONET stations: Dakar Belair and Ragged Point. Those stations were selected from the few stations containing solar and lunar AERONET observations, and during the IASI-A and IASI-C overlap time, one relatively close to sources and the other after long-range transport. We emphasize that in those plots, all data are plotted and not only the colocations. This provides a lot of useful information. First, one can see a continuity and consistency between AERONET solar and lunar data, between IASI daytime and nighttime data, and between IASI-A and IASI-C. Second, MAPIR gets the seasonal cycles very well, even after long-range transport. Third, there is a minimal AOD (about 0.05 at 550 nm) under which the MAPIR algorithm does not seem to be able to go, as seen in Sect. 3.3.2. Fourth, for each dust event, the AERONET data contains numerous observations, spanning a range of AODs in a short time range (the vertical lines of grey points/black crosses). This obviously renders noisy the comparisons with the twice-per-day satellite data, unless a very strong time constraint is applied – and this was observed when testing the different colocation criteria. And finally, one can also see in those plots some plausible remaining unfiltered cloudy cases in the MAPIR data: the isolated high MAPIR AOD when AERONET does not show an event.
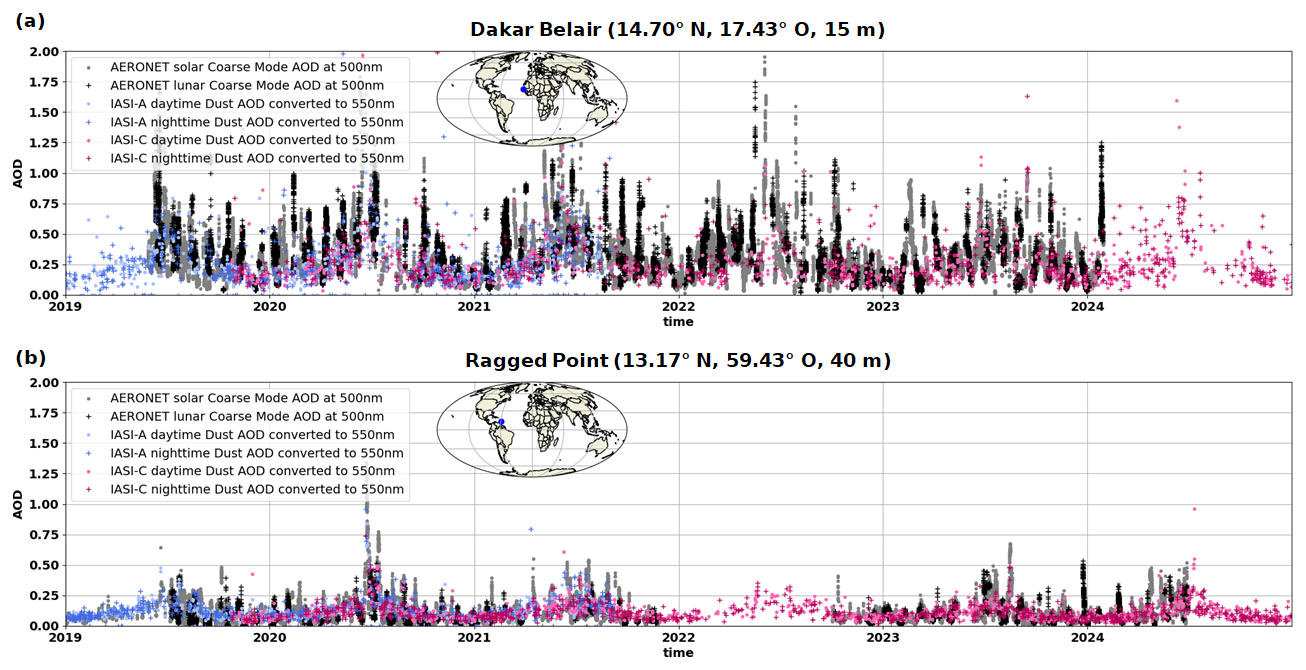
Figure 7Time series of all AERONET (solar and lunar) SDA CAOD at 500 nm and of MAPIR IASI-A and IASI-C dust AOD converted to 550 nm (separated day and night) for the time span with available AERONET data, at (a) the Dakar Belair AERONET station and (b) the Ragged Point station. Note that these are full data series, not only colocations.
Figure 8 shows the time series of colocations for the two same stations, separately for IASI-A and IASI-C. For Ragged Point, there are not enough lunar colocations for IASI-A, therefore only IASI-C is shown. Those plots clearly show again the nice continuity in all data sets, and the good capability of IASI-MAPIR to observe seasonal cycles. They also show the MAPIR underestimation of the 550 nm AOD larger than 0.1 and increasing underestimation when the AOD increases, as already discussed in Sect. 3.3.2. However, we do not see here any possible unfiltered clouds in the IASI data. This is due to the strong colocation criteria and the fact that AERONET data is also cloud-cleared, therefore the remaining cloudy MAPIR should not have any colocated AERONET data.
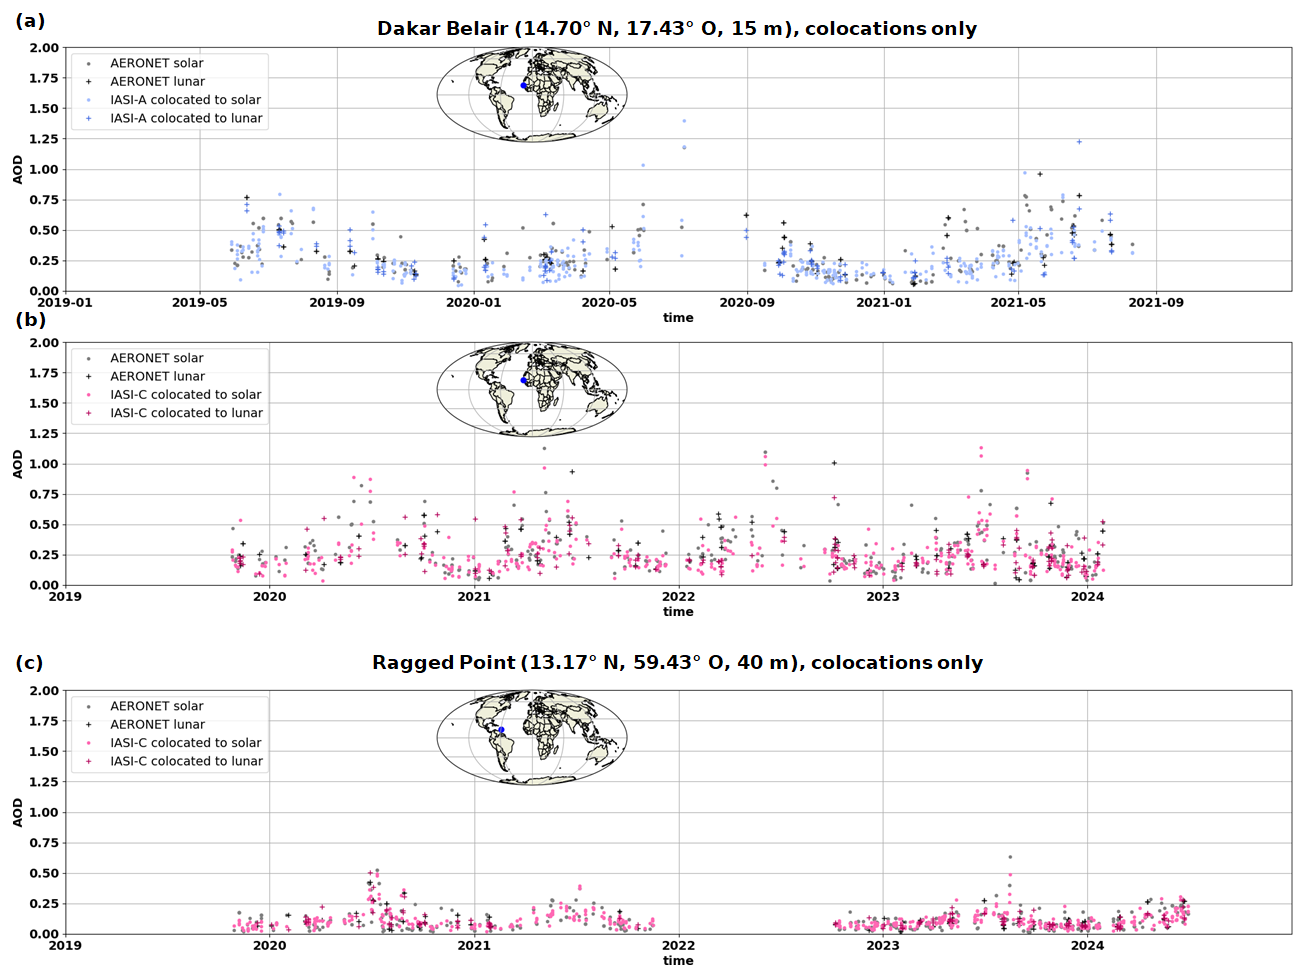
Figure 8Time series of colocated AERONET (solar and lunar) SDA CAOD at 500 nm and of MAPIR (a) IASI-A and (b) IASI-C dust AOD converted to 550 nm (separated day and night), at the Dakar Belair AERONET station, and (c) IASI-C at the Ragged Point station.
3.4 Degrees of freedom
The number of DOF are the number of distinct information pieces one can extract from the vertical profile. The DOF considers the instrument/retrieval pair sensitivity to the true atmospheric state, and is extracted from the averaging kernel matrix as its diagonal. For the specific case of TIR observations, the DOF will largely depend on the difference between the surface temperature and the target species' temperature, which relates to its altitude. With MAPIR, the DOF reaches about 2.5 for the best cases (large AOD, large temperature contrast). Figure 9 shows the dust AOD at 10 µm (a) and the DOF (b) for 19 June 2020, during a huge Saharan dust outflow towards America. The figure shows the MAPIR IASI-A data separately for the morning and evening overpasses. One can clearly see the DOF being around 1 or even lower in areas without dust, while the DOF may reach up to 2.5 where there is a large dust AOD and expected large temperature contrast, such as above the desert. As was detailed for the previous MAPIR version 4.1 in (Callewaert et al., 2019), when performing the retrieval in the logarithmic mode the averaging kernels tend to peak at altitudes and locations where there is dust, explaining partly the low DOF in absence of dust.
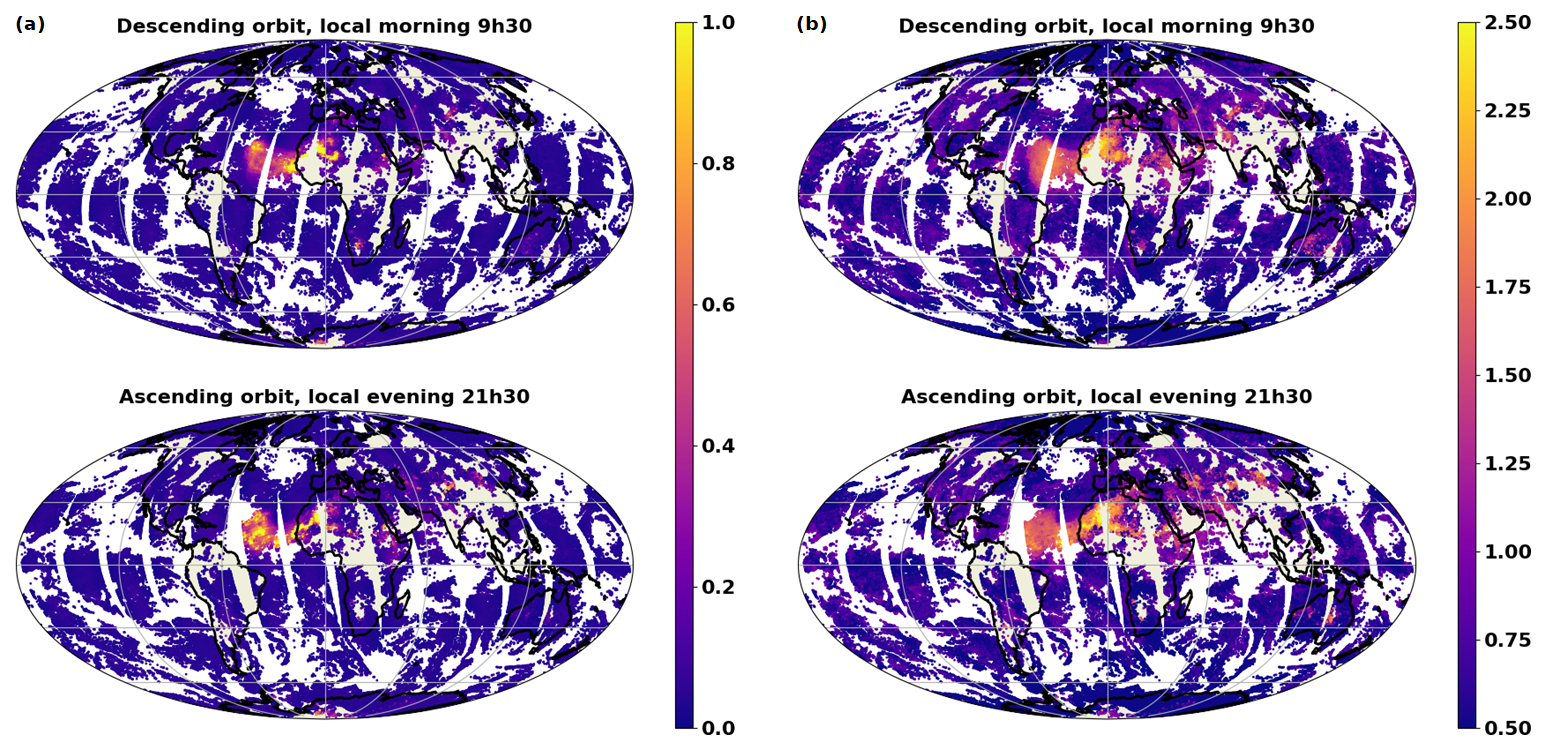
Figure 9Dust 10 µm AOD (a) and number of DOF (b) for MAPIR IASI-A, 19 June 2020. Morning and evening overpass data are plotted separately
3.5 Mean altitude
As detailed in Sect. 2.3, the MAPIR data also contains a mean altitude (above sea level), provided when the dust AOD exceeds 0.05 and the information content exceeds 1.25, the latter being the strictest criterion. The mean altitude represents the median of the dust concentration profile.
It is important for the user to understand that even though the mean altitude is provided only when there is a reasonable vertical sensitivity, there still remain cases where the mean altitude is simply about half the total vertical range (i.e. about 5 km). Those cases are difficult to filter out without extremely strict filters, which would also reject many reasonable results, reducing usefulness. Figure 10 shows the mean altitude from MAPIR IASI-A dust profiles for 19 June 2020 (the same day as in Fig. 9 showing AOD and DOF), separately for morning and evening overpass. One can see that for this huge event the transport towards America occurred (as often) at about 2.5 to 3 km altitude, and one can spot the plausible source area as the location in the central Sahara with very low mean altitude. There were also other smaller dust events that day throughout the dust belt as well as in Australia. The highest mean altitudes (of about 5 km) at the edges of the Saharan part of the plume occur in parts of the plume with lower sensitivity, at the limit of the criterion to provide the mean altitude, and are close to the middle of the profile vertical range. This kind of “artefacts” occur at different places, for a limited number of IASI observations. When aggregating the data at monthly (Fig. 11a) or yearly (Fig. 11b) scale, one can see some areas popping out with an unreasonable high mean altitude (even above 6 km), mostly in South Africa and South America in areas where there usually is no dust. Therefore, it is safe to assume that these averages result from a limited number of artefact events. On the other hand, one can nicely see for example a mean dust altitude of more than 5 km over the Tibetan Plateau, which is expected.
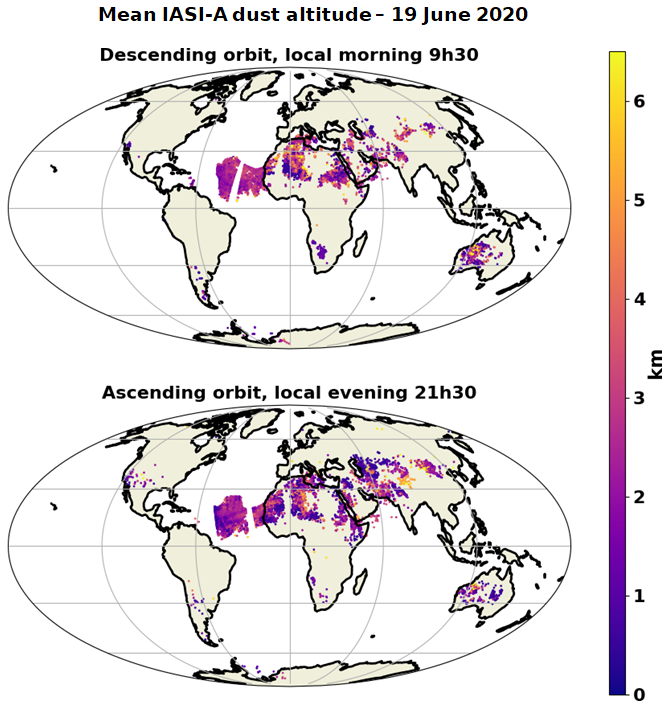
Figure 10Mean altitude (km above sea level) for MAPIR IASI-A, 19 June 2020.
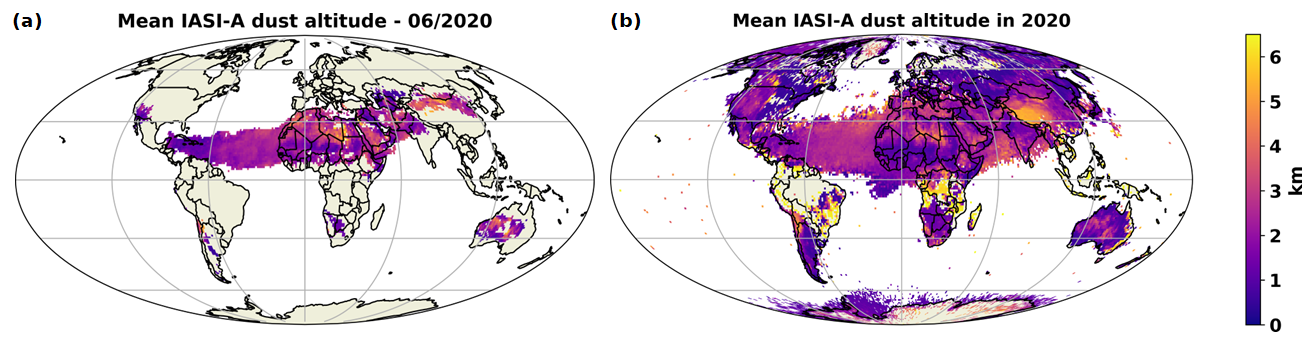
Figure 11Mean altitude for MAPIR IASI-A averaged over the month of June 2020 (a) and the whole year 2020 (b). Morning and evening overpasses are included.
3.6 Profiles
We show here some qualitative comparisons to illustrate vertical profiling capabilities of MAPIR v5.1, while a full profile validation will be presented in a separate manuscript. The latter represents significant work in developing a new comparative methodology.
3.6.1 Qualitative comparisons with CALIOP
This section shows qualitative illustrations of the IASI MAPIR dust concentration profiles compared to the CALIOP high resolution extinction profiles. The IASI MAPIR data is averaged around every 5 CALIOP observations along its track, with a maximum 50 km distance and 6 h time difference. The second criterion ensures comparing day-time or night-time observations separately. IASI and CALIOP observations always bear a time difference of 3 to 5 h due to their respectively mid-morning (09:30) and mid-afternoon (13:30) orbits, and depending on the IASI pixel position within the cross-path swath.
On Figs. 12 to 14, the CALIOP data is plotted along its track for selected relevant orbit parts, first as aerosol type (all types included), then as extinction at 532 nm for only the “dust”, “dusty marine” and “polluted dust” types. Then the IASI MAPIR data is also plotted as concentration profiles (the main retrieval output), and a daily MAPIR 10 µm AOD map is provided with the CALIOP track plotted in teal.
For the first example (Fig. 12), we look at a night-time Middle-East dust plume on 28 October 2018, with MAPIR IASI-A. One can see a significant dust plume between 50 and 20° N along the selected CALIOP track, with the most intense dust extinction and concentration at about 30° N (Afghanistan/Iran border)), between 1 and 2 km altitude, with smaller dust amounts up to 4 km altitude. The IASI MAPIR dust profiles place the dust at the same location as observed with CALIOP, both horizontally and vertically. With MAPIR, dust is also observed right above the surface at about 45° N along that track, where CALIOP typing determined the presence of continental aerosols. As IASI observations are not sensitive to other aerosol types, it is well plausible that the observed aerosols are a small amount of dust, maybe with different properties than the usual desert dust.
The second example (Fig. 13) is the next orbit, on the same day, showing dust over Syria, Jordan, then Egypt and the Sudan and finally in the South of the African continent. A first plume is detected with both CALIOP and MAPIR as most intense around 30° N (in Jordan), again at 1 to 2 km altitude. The plume extension towards 20° N (towards the Red Sea then Egypt and the Sudan) is more intensely observed with MAPIR than with CALIOP, which could be due to the time difference and plausibly looking at the source area. There is a second dust plume detected with MAPIR at 20–30° S (in Botswana and South Africa), for which CALIOP type is “polluted dust”, with a very low extinction, while MAPIR shows significant dust amounts.
The third example (Fig. 14) is selected during an unusually intense Atlantic dust transport case, the Godzilla event in June 2020 (the same event already used for some other illustrations). The figure shows that during the event, even after long-range transport, the dust column is very intense and reaches high altitudes with respect to the usual transport altitude. Indeed, CALIOP and MAPIR concur in placing large amounts of dust up to 3–4 km altitude all across the plume's head, close to the Antillas. The CALIOP signal is even saturated and does not provide information below 2 km altitude.
These examples all show the good dust profiling capabilities with IASI data and the MAPIR algorithm, even over land or in unusual situations.
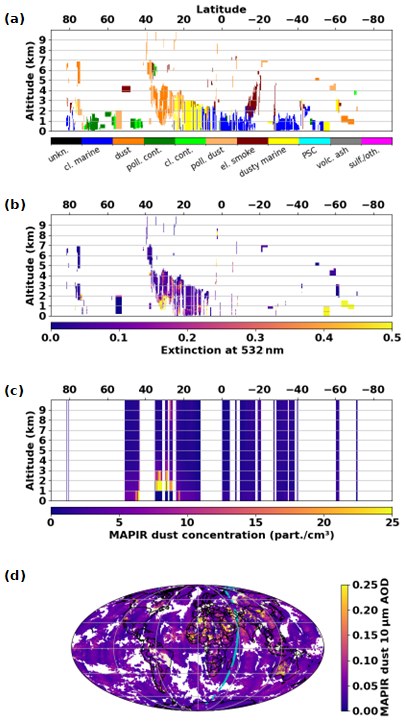
Figure 12Comparison of CALIOP and IASI-A MAPIR for 28 October 2018, night-time. (a) CALIOP aerosol type; (b) CALIOP 532 nm extinction for the aerosol types “dust”, “polluted dust” and “dusty marine”; (c) IASI-A MAPIR dust concentration profile along the selected CALIOP orbit part; (d) IASI-A MAPIR dust AOD (daily average), with the track of CALIOP for the selected orbit part.
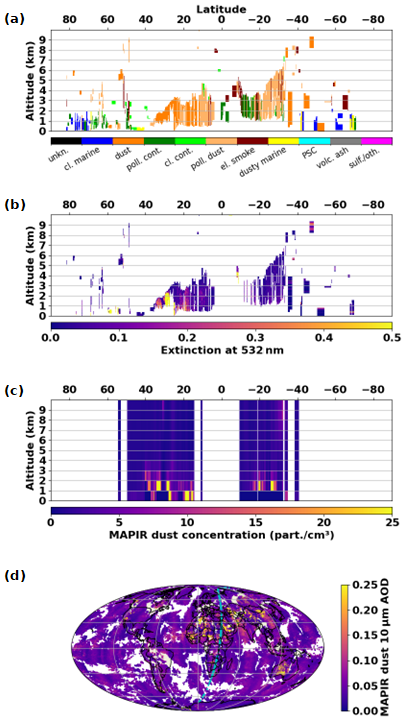
Figure 13Same as Fig. 12, for a different CALIOP orbit of the same day.
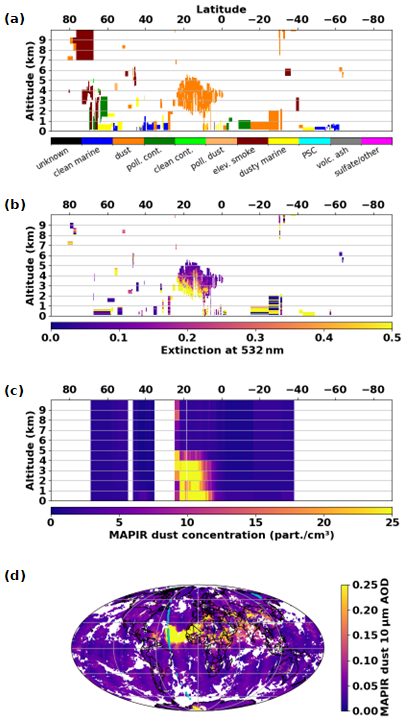
Figure 14Same as Fig. 12, for an orbit of 19 June 2020 day-time and using IASI-C MAPIR data.
3.6.2 Assessment against ground-based lidars
To evaluate the MAPIR dust concentration profile and altitude, the EARLINET lidar measurements are processed through a dedicated retrieval chain. First, the two-step POLIPHON (POlarization LIdar PHOtometer Networking) (Mamouri and Ansmann, 2014) method is implemented in order to separate the contribution of coarse dust particles from the lidar signal at 532 nm, to best match the TIR sensitivity to coarse particles. The threshold particle depolarization values, which are an essential component of the technique, are derived from the literature (Tesche et al., 2009). The retrieved lidar dust backscatter profiles are then regridded from the instrument’s native vertical resolution of 7.5 m to 1 km to ensure consistency with the IASI dust profile vertical grid. Lastly, the dust concentration (particles cm−3) is calculated using the following equation, proposed by (Mamouri and Ansmann, 2014):
where is the POLIPHON conversion factor for the site of Potenza, v is the volume concentration of dust, τ is the aerosol optical depth at 532 nm, βd is the coarse dust backscatter coefficient derived from POLIPHON, Sd is the lidar ratio, and Vd is the volume of a spherical dust particle with an effective radius of 1.7 µm, a value calculated from AERONET (Aerosol Robotic Network) inversion data for the Potenza site. The lidar ratio of dust is derived from nighttime Raman measurements. The dust mean altitude from the lidar observation is calculated as the median altitude of the profile, implying the altitude at which half of the dust particles are located above and the other half below, following the same approach as implemented within the MAPIR product. It should be noted that an overlap correction is also applied to the lidar data, meaning that when dust is detected at the lowest provided altitude, the concentration is assumed to remain constant down to the surface level.
In this work, two dust transport cases over the EARLINET lidar station at Potenza, Italy (40.6° N, 17.72° E, 760 m a.s.l.) (Madonna et al., 2011), occurring during 20 June 2023 and 19 June 2024, are presented, while a more extensive analysis is currently under preparation. This station regularly receives mineral dust aerosols transported from the Sahara Desert (De Rosa et al., 2025). The specific cases presented here were identified through a synergistic approach combining lidar and AERONET observations with forecast and back-trajectory models such as the NOAA hybrid single-particle Lagrangian integrated trajectory (HYSPLIT) model (e.g. Stein et al., 2015). For the first case, the distance between the nearest IASI pixel and the lidar station was 7.8 km, with a temporal difference of 155 min between the measurements. For the second case, the corresponding values were 10.4 km and 70 min. These spatial and temporal mismatches are considered acceptable for satellite validation studies when the reference observations do not occur at high frequency. Additionally, the MAPIR retrievals are characterized by a DOF value of 1.79 and a 550 nm dust optical depth value of 0.58 for the first case, and a DOF of 1.38 and a dust optical depth of 0.21 for the second case, both indicative of substantial dust loading.
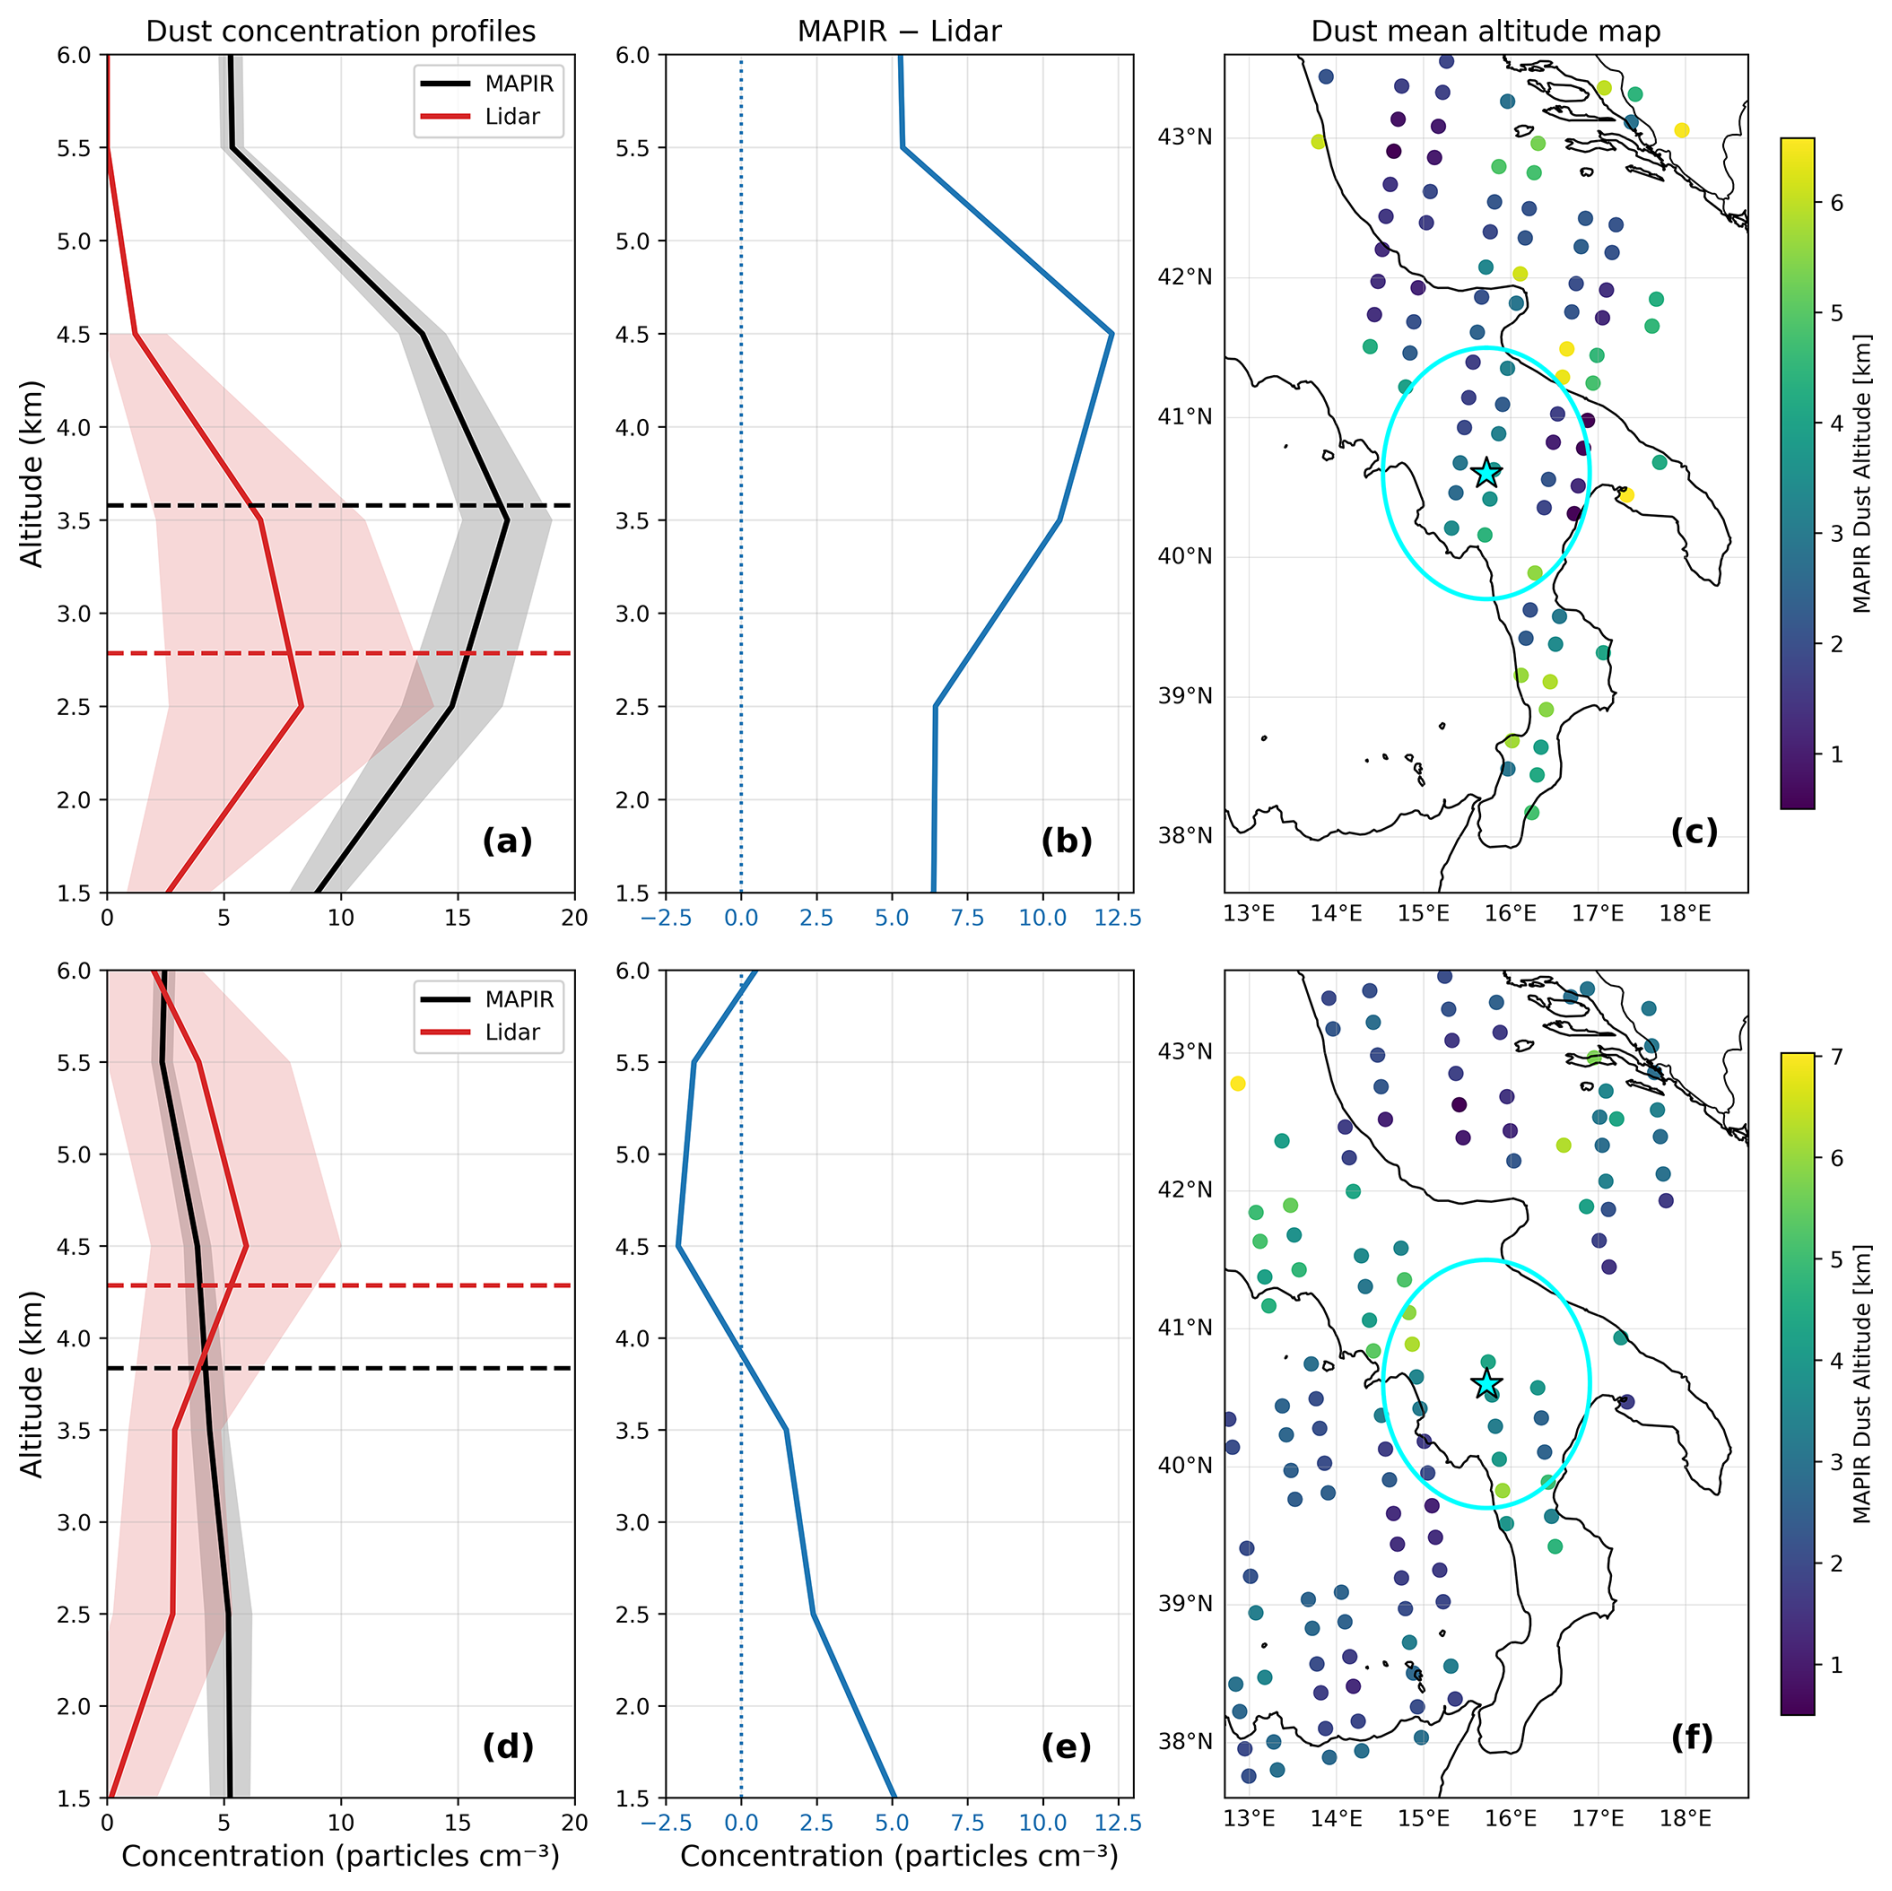
Figure 15Case study comparison of dust retrievals for Potenza, Italy, on 19 June 2024 (top row; a–c) and 20 June 2023 (bottom row; d–f). Panels (a, d) show vertical dust concentration profiles and mean dust altitude derived from lidar and MAPIR, panels (b, e) show the absolute difference between MAPIR and lidar retrievals, while panels (c, f) show the spatial distribution of MAPIR-derived mean dust altitude.
In Fig. 15a, the dust concentration profiles retrieved from both instruments are shown for altitudes between 1.5 and 6 km, with the respective errors. The lidar retrieval indicates generally lower concentrations, reaching approximately 5 particles cm−3, with a well-defined dust layer extending from about 1.5 to 4.5 km and concentrations approaching zero above this altitude range. In contrast, MAPIR retrieves a broader vertical distribution, extending from near the surface up to approximately 5.5 km. Peak concentrations are roughly twice those observed by the lidar, exceeding 15 particles cm−3. The dust mean altitudes estimated from both datasets are also displayed as horizontal dashed lines. For this event, the difference between the retrieved mean altitudes is approximately 0.7 km. Overall, MAPIR reproduces the main structure of the observed dust layer reasonably well, although an overestimation of particle concentration is evident. Figure 15b presents the vertical profile of the absolute difference between MAPIR and lidar concentrations. The largest discrepancy occurs near 4.5 km, where differences reach approximately 12 particles cm−3, while smaller deviations are observed throughout the remaining profile, suggesting a generally consistent representation of the dust vertical distribution. Finally, Fig. 15c shows the spatial distribution of MAPIR dust mean altitude over central Italy. The location of the Potenza lidar station is marked with a star, together with a surrounding radius of 100 km. The IASI pixels are coloured according to the retrieved MAPIR dust mean altitude. Within the selected radius, most pixels report mean altitudes between approximately 1.5 and 5 km, revealing noticeable spatial variability in the vertical placement of the dust layer, thus indicating that both the spatial separation and the temporal mismatch between the two measurements may play a non-negligible role in the observed discrepancies.
Similar plots are presented in Fig. 15d–f. In this case, the lidar-derived coarse dust layer is less well defined, exhibiting relatively uniform dust concentrations between approximately 1.5 and 6 km altitude. The MAPIR retrievals show a similar vertical distribution, although the dust layer is less distinct than that observed by the lidar. The differences in both mean dust altitude (Fig. 15d) and dust concentration (Fig. 15e) are noticeably smaller than those observed in the first case. The spatial variability of the MAPIR-derived mean dust altitude around the station is comparable between the two cases.
Overall, these examples suggest that MAPIR is able to accurately reproduce vertical profiles with a structure similar to the ground-truth lidar observations. A slight overestimation of dust particle concentrations is observed in one case, while substantially better agreement is found in the second. Regarding mean dust altitude, both instruments provide similar values in both cases, with differences of 0.64 km and 0.8 km, respectively. Finally, it should be noted that a comprehensive multi-station validation effort is currently in preparation, which will extend the findings presented here and provide statistically robust results (Biskas et al., 2026).
3.7 Uncertainties
As described respectively in Sect. 2.2.2 and 2.2.3, the retrieval provides the uncertainty on the dust concentration profile, which is then used to compute the uncertainty on the dust AOD. That uncertainty, based on the OEM formalism, contains separately the uncertainty linked to the (inflated) spectral noise, to the vertical smoothing, and to the propagated uncertainty of the vertical profiles of temperature and humidity. Table 6 gives an indication of the median and inter-percentile (IP) of 68 (i.e. ±1-sigma) for the different uncertainty components. The statistics were calculated for the dust 10 µm AOD, by latitude bands and by month. Here only a summarized overview is provided, to simplify the complex information.
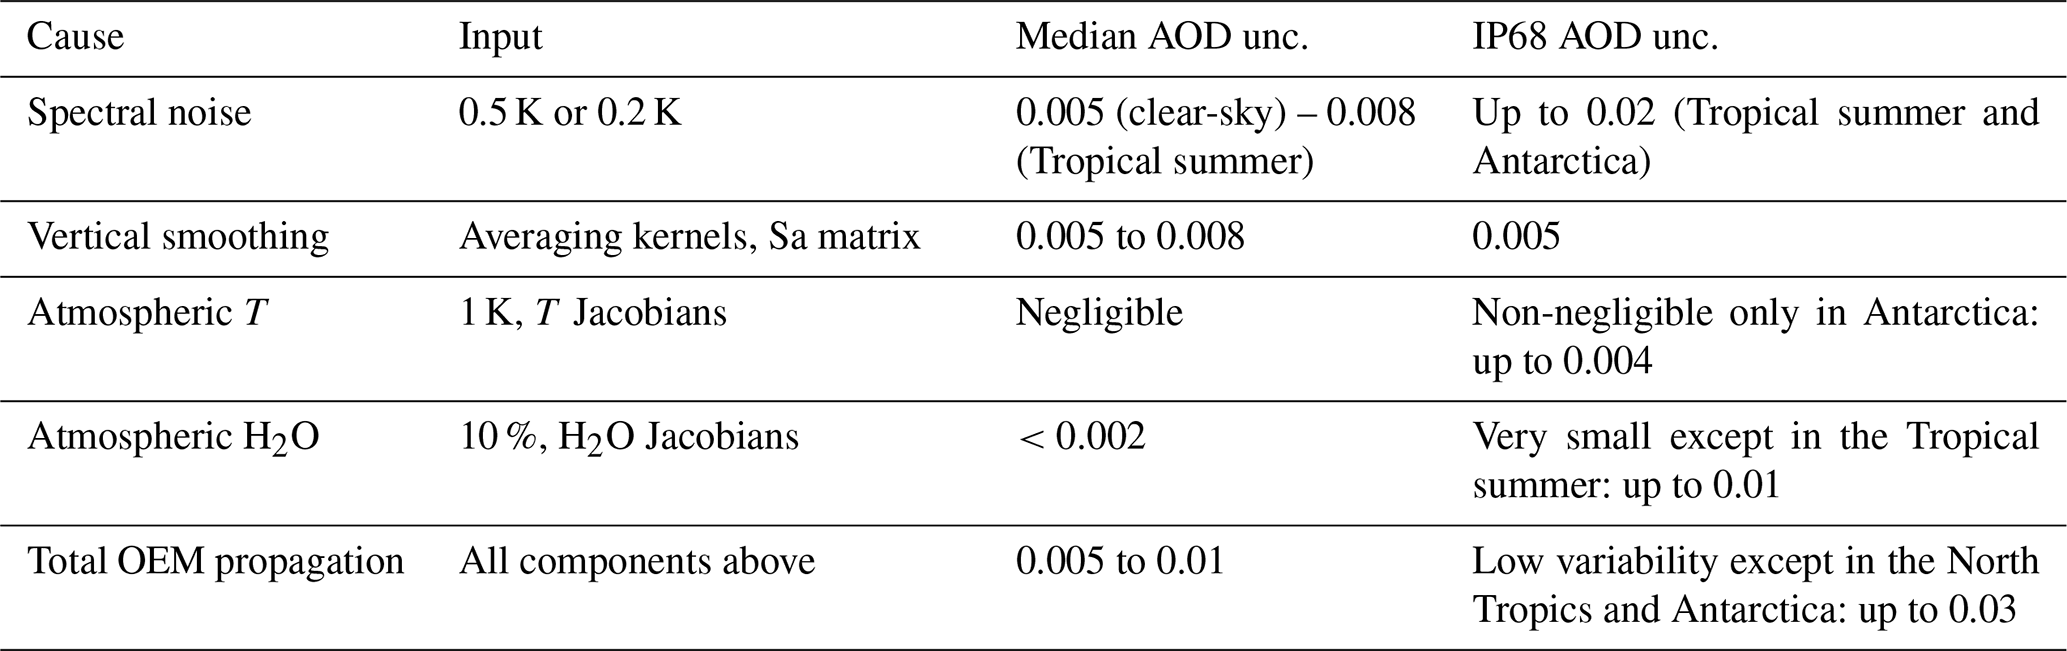
In addition, a short sensitivity study was undertaken to evaluate the impact of the surface emissivity uncertainty on the dust retrieval results. It is not possible to properly propagate such an uncertainty through the OEM, because RTTOV does not provide emissivity Jacobians and their numerical calculation for each retrieval would be highly computationally costly. The study was therefore undertaken by modifying the surface emissivity manually (5 % reduction), and analysing the impact it has on the retrieval results. This impact depends, among others, on the dust AOD, on the satellite viewing angle, on the surface type and temperature. The only clear conclusion is that 5 % uncertainty in the surface emissivity leads to minimum 0.015 AOD uncertainty in absence of dust, and maximum 0.05 AOD uncertainty in presence of a high dust load. It also leads to a mean altitude uncertainty of about 0.5 km.
Combining both analyses leads to an important conclusion for the users: any dust AOD 10 µm below 0.02 should be considered as noise, and any dust AOD 10 µm below 0.06 should be considered with a highly critical eye, especially over land where the surface emissivity uncertainty is larger. As the uncertainty clearly depends on the precise case, the user is advised to read the calculated OEM uncertainty for each retrieval, provided in the data (only the total OEM uncertainty is provided in the data, to spare storage space), and to keep in mind the additional plausible uncertainty due to the surface emissivity uncertainty, of up to 0.05.
3.8 Long-term stability
The long-term stability was assessed with 2 different exercises. First, the AERONET comparisons were used, looking for potential drifts in the MAPIR IASI bias. Second, the full IASI MAPIR data (both instruments) was used to plot time series of daily averages within large areas, looking for any discontinuity or unexpected feature.
For the first analysis, a simple linear regression analysis was performed on time series of MAPIR bias versus AERONET solar data. We kept only stations for which the AERONET data spans at least 5 years, and contains at least 50 points per year on average (meaning there can be gaps – otherwise almost all stations are rejected). The same analysis was attempted using AERONET lunar data but no station passed those criteria. The p-value was used to consider only the trends/drifts that are significant at the 95 % confidence interval. Figure 16 shows the results of this analysis for IASI-A, with in grey the stations for which the analysis was run without significant trend/drift (representing 19 over the 33 stations analysed). It shows that only very small significant drifts are detected, below the absolute value of 0.006 (for the 550 nm AOD bias) per year except at Medenine where it reaches 0.009. Medenine provides data only for a year from mid 2014 to mid 2015, and 1.5 year from end 2018 to early 2020. The other stations close to it show either a non-significant drift (Tunis-Carthage) or a negative drift (Gozo). In general, the sign of the drifts is inconsistent between the different stations. We performed the same analysis using the Theil-Senn robust linear fit and, although some stations shift between significant and non-significant drift (both ways), the general conclusions remain the same. We consider these results as indication that there is no drift in the MAPIR IASI-A data, as would be expected considering that all inputs are consistent in time, to the best of our knowledge.
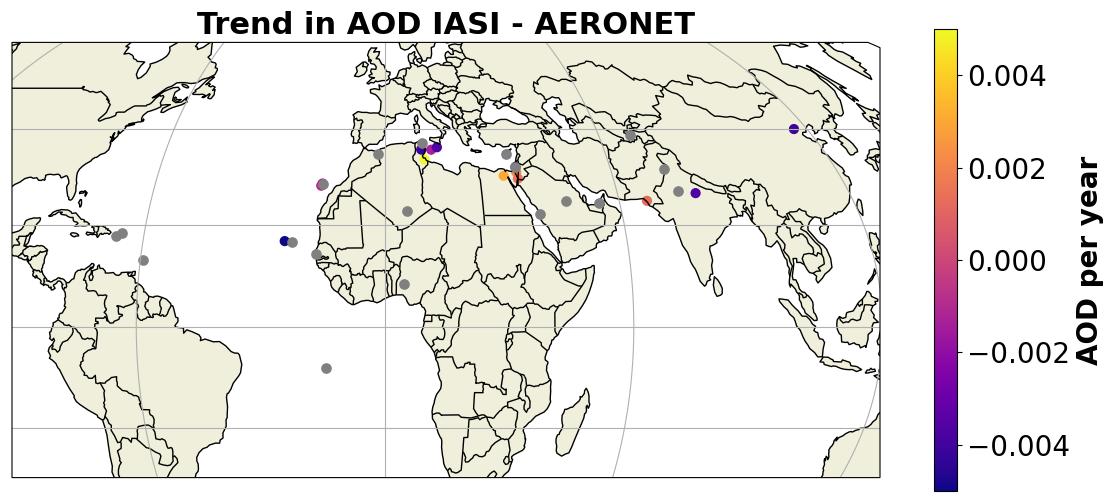
Figure 16Linear trend in the bias of MAPIR IASI-A versus AERONET solar (AOD 550 nm per year). Stations plotted in grey are those included in the analysis but without significant trend at the 95 % confidence (p value larger than 0.05).
The same analysis was run for IASI-C, and shows only one significant drift over the 8 stations analysed: at Medenine, with −0.01 550 nm AOD per year (while it was positive for IASI-A). The data at this station has again a long gap between early 2020 and early 2022, meaning that the 5 years time span constraint is met, but at the beginning of the series there are only a few months of data, followed by 2 years without data. In addition, for the 2 stations very close to Medenine (Gozo and Ben Salem), no significant drift is detected in MAPIR. Therefore we conclude that there is currently no indication of a drift in the MAPIR IASI-C data. There does not seem to be any impact of the discontinuities pinpointed in the QC (Sect. 2), or of the change of the PCS eigenvector basis on 30 March 2023.
For the second exercise, we plotted MAPIR IASI-A and C dust AOD 10 µm daily averages (morning and evening data combined) for selected large areas, looking for any discontinuity or unexpected feature. Figure 17 shows those for the North Atlantic area (latitude 15 to 35° N, longitude 20 to 60° W), the large Saharan desert (latitude 9.5 to 36.5° N, longitude 17.5° W to 37.5° E) and the large Asia (latitude 20 to 45° N, longitude 70 to 120° E) respectively. All time series (including for different areas not shown here) look perfectly reasonable and do not bear any clear discontinuity. The consistency between MAPIR data for IASI-A and C will be discussed in the next Sect. 3.9.
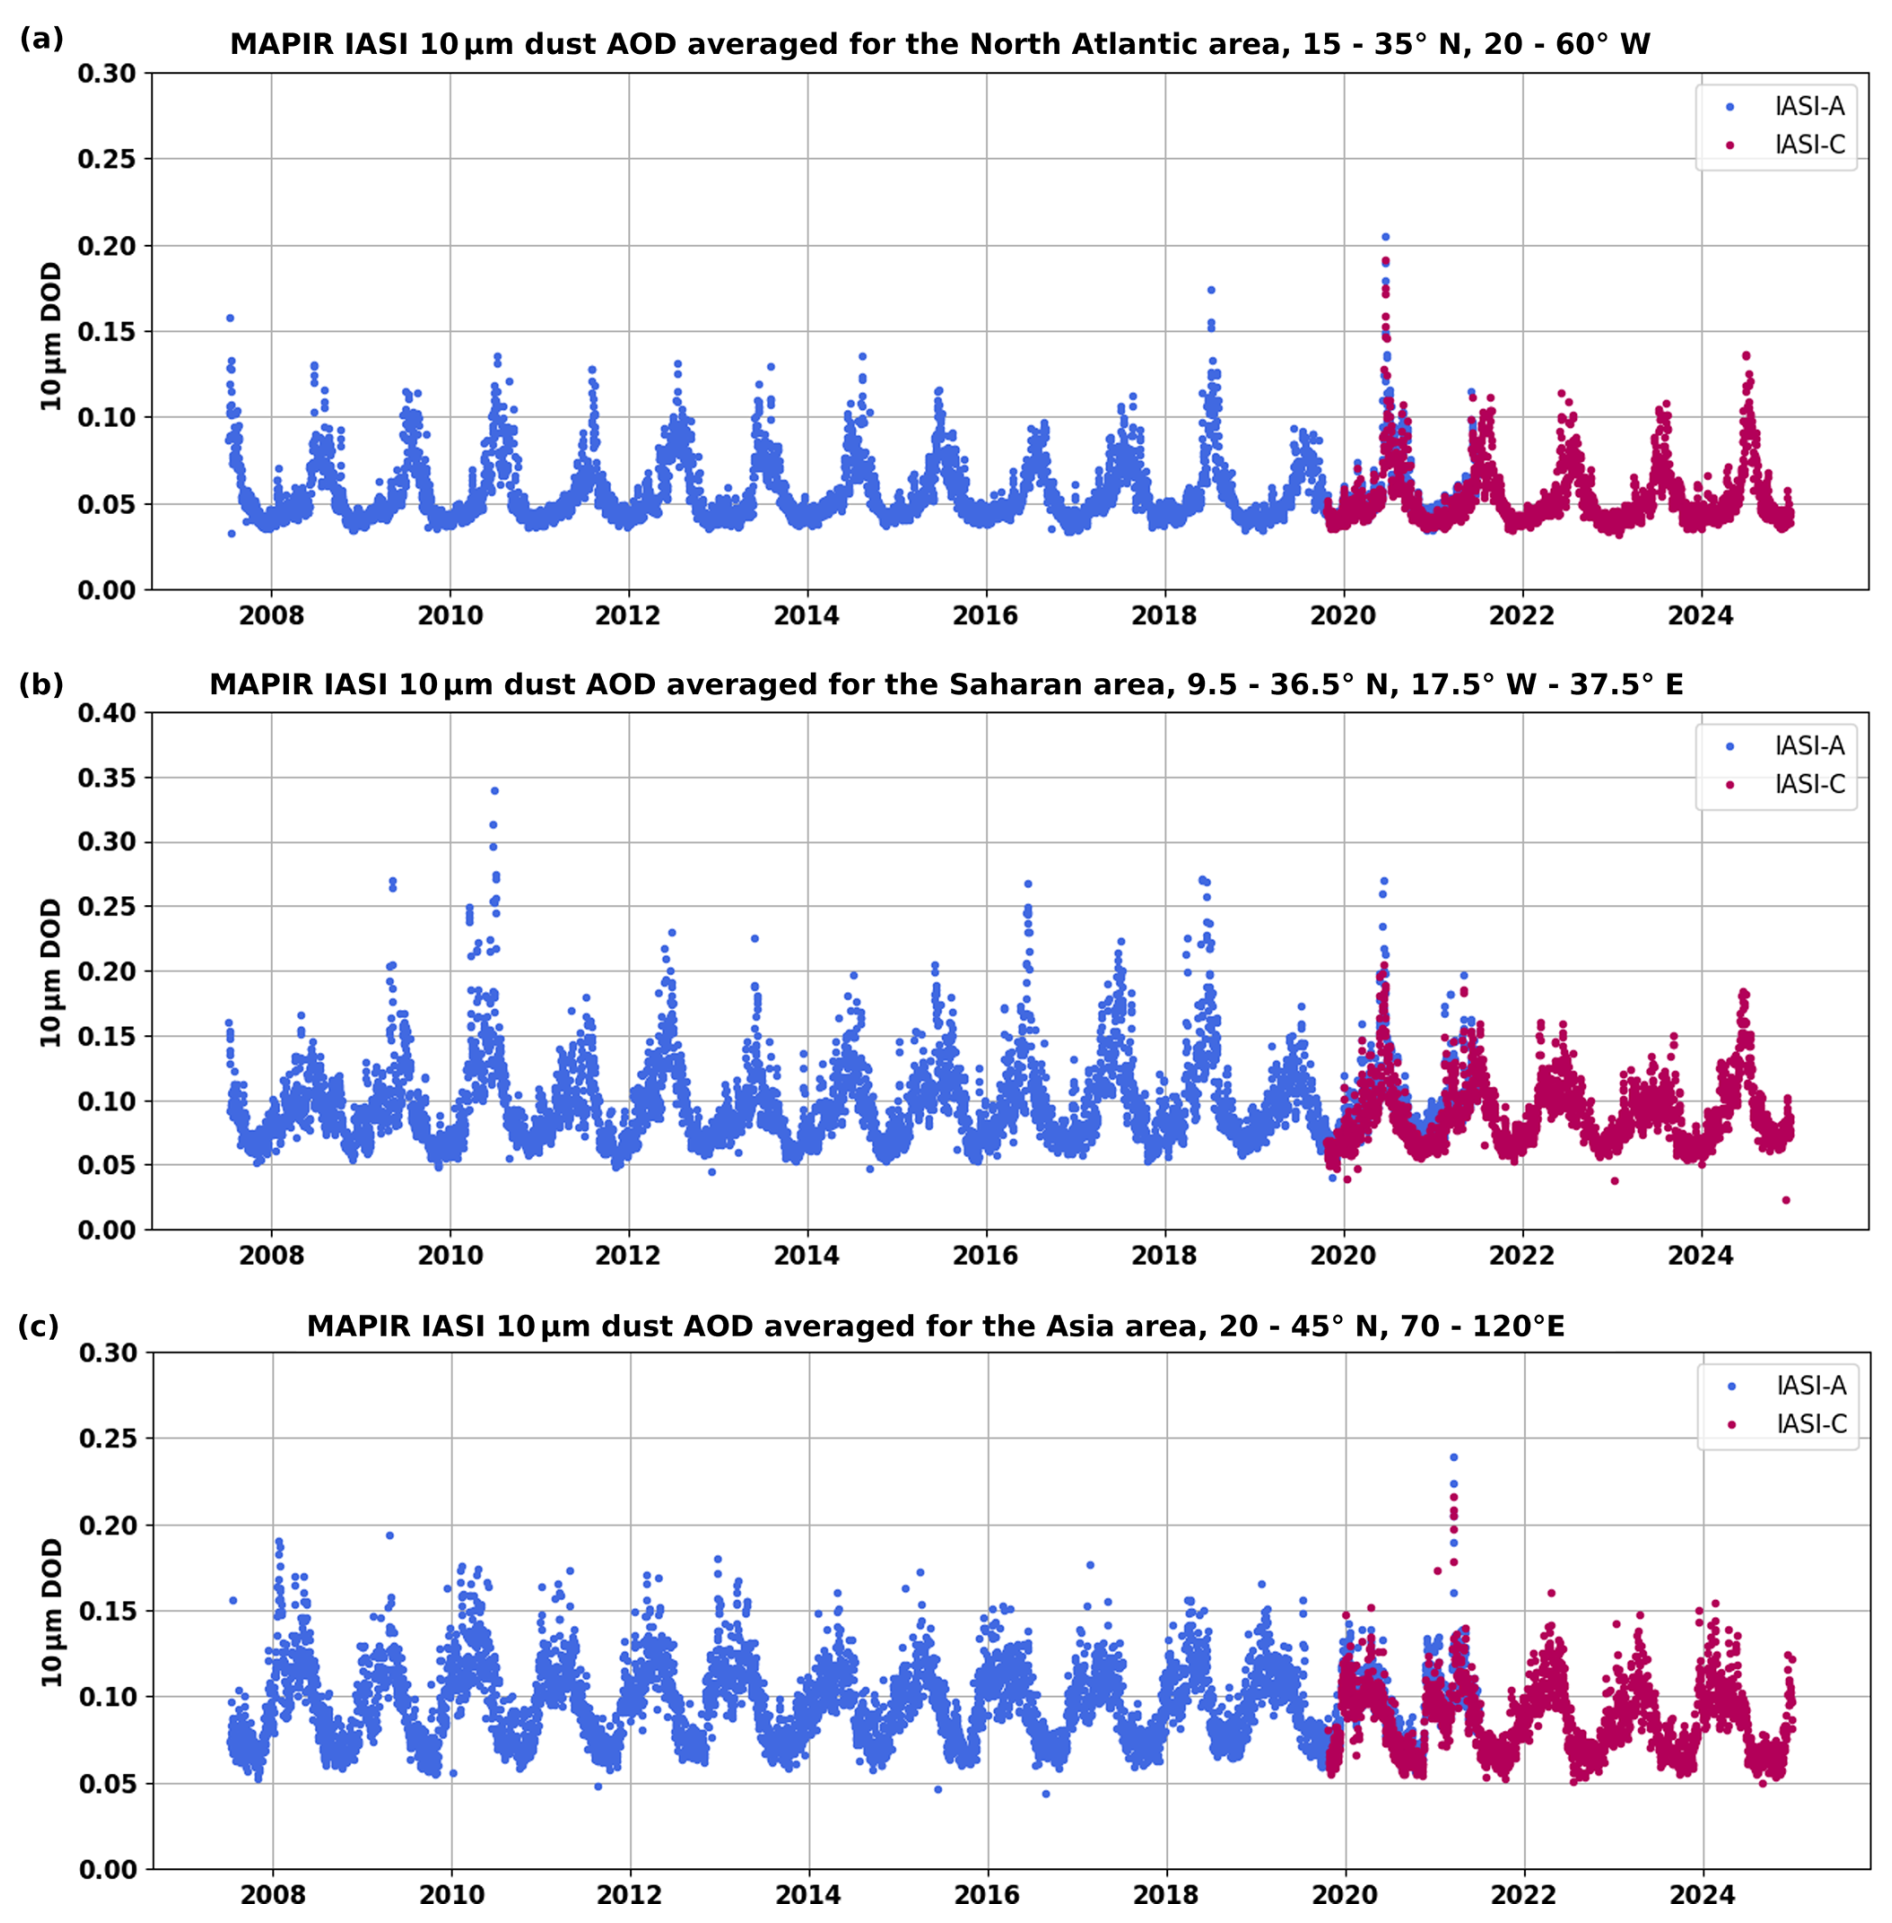
Figure 17Time series of MAPIR IASI-A and IASI-C dust AOD at 10 µm, averaged daily (combined morning and evening overpasses) for (a) the North Atlantic area, latitude 15 to 35° N, longitude 20 to 60° W, (b) the Sahara area, latitude 9.5 to 36.5° N, longitude 17.5° W to 37.5° E, (c) for Asia, latitude 20 to 45° N, longitude 70 to 120° E.
3.9 IASI-A vs IASI-C
In this section, we discuss the potential and definite differences between IASI-A and IASI-C MAPIR dust products. First, it was shown in Sect. 2.3 that there is an issue in the OFL data used for IASI-C, in which the surface altitude was not provided in the files for a significant part of the cloudy observations. That results in less retrievals run for IASI-C. Most of them are cloudy (then excluded anyway by the QC after the retrieval) but some of them are dusty cases mis-classified as cloudy. This leads to smaller coverage of some events with IASI-C (without quality loss for the retrieved data), but it does not seem to lead to an inconsistency between IASI-A and IASI-C in general. Figure 18 illustrates this for one day during the huge Godzilla dust event. One can clearly observe a significant number of missing pixels in the IASI-C retrieval results, with respect to IASI-A. This does not occur specifically for the highest AOD only, therefore it would seem that it impacts mostly the coverage, and not the representativeness of the daily AOD. Figure 19 illustrates this with the 2020 yearly average dust 10 µm AOD. There are some small differences, mostly for the Sahara and Australia, where the time difference between the satellites is most plausibly responsible, as addressed in the next paragraph.
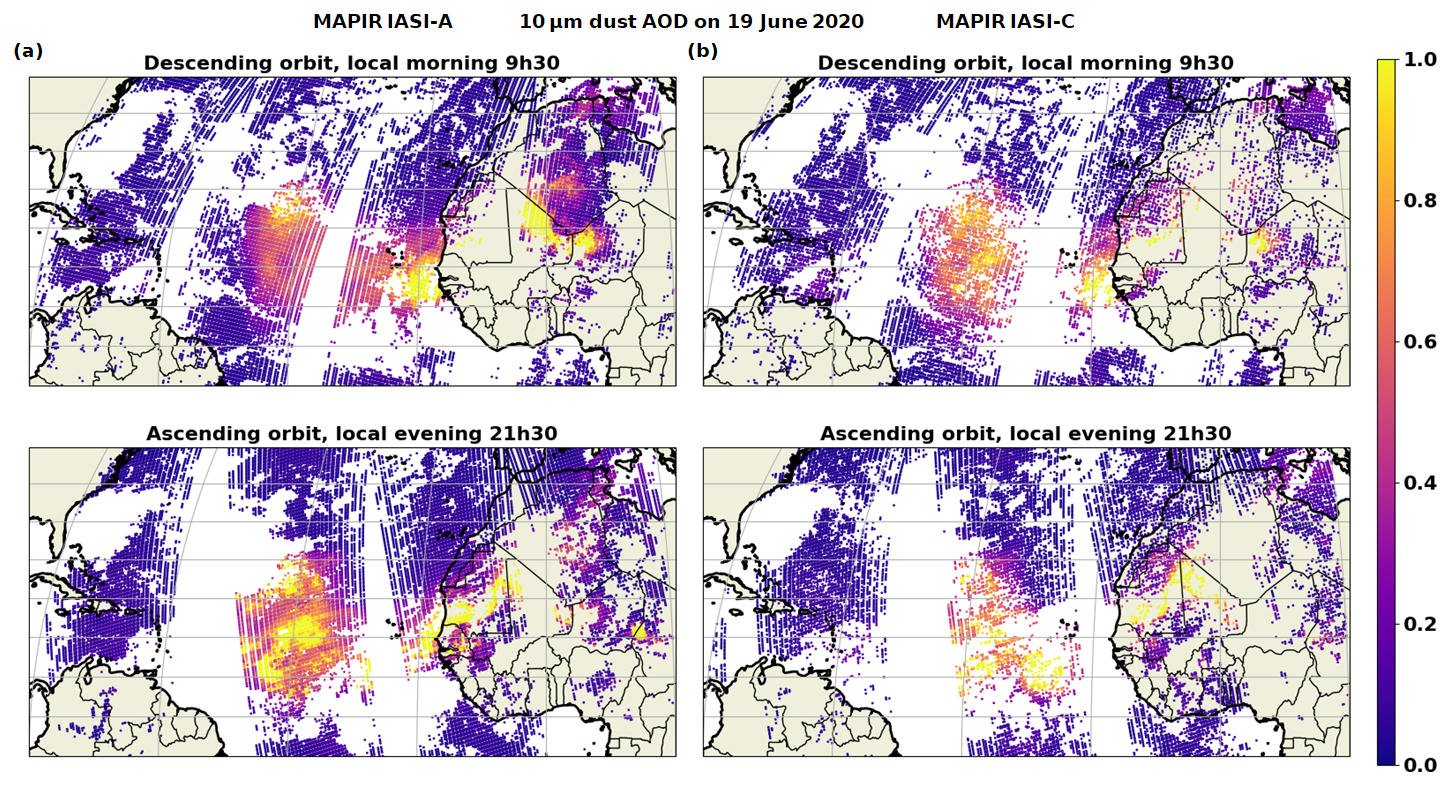
Figure 18MAPIR IASI-A (a) and IASI-C (b) dust AOD 10 µm for 19 June 2020, morning and overpass separately.
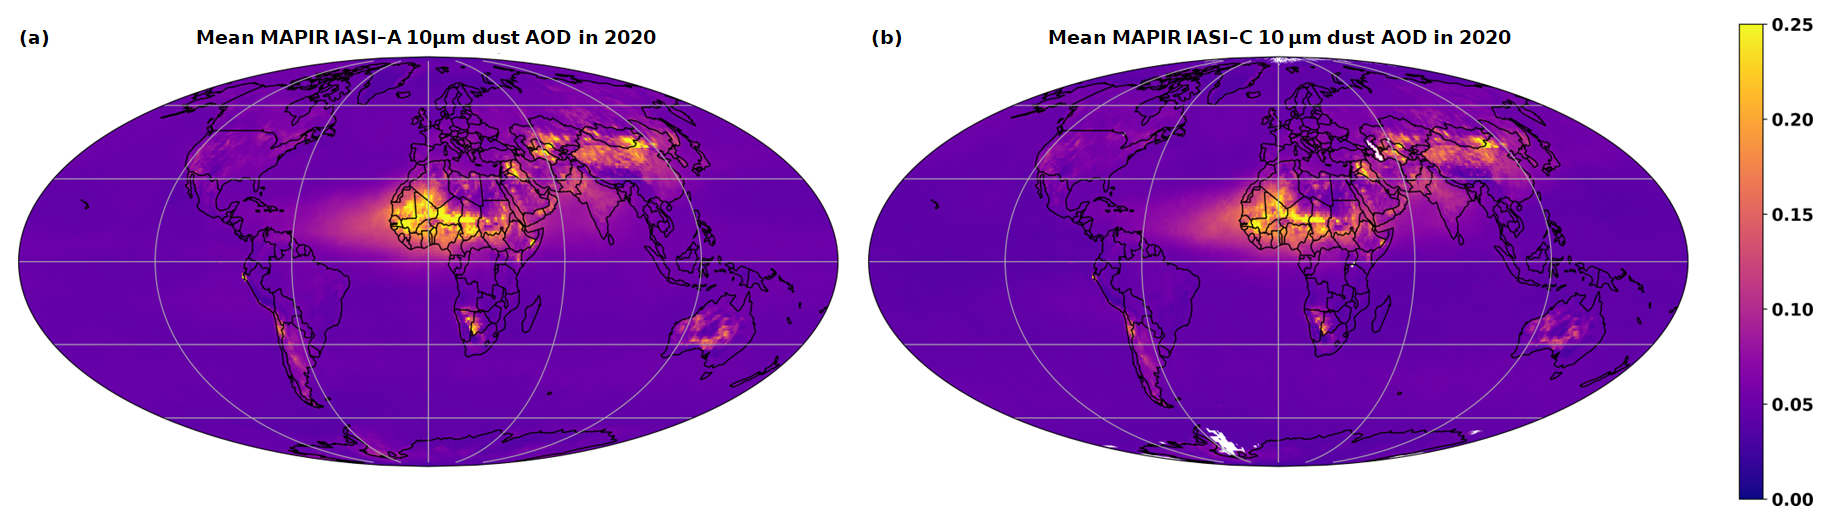
Figure 19Yearly average of MAPIR IASI-A (a) and IASI-C (b) dust AOD 10 µm for 2020.
Secondly, even though both Metop-A and C are in the mid-morning orbit 09:30 equator crossing time (descending node), this is only valid during their operational time. Metop-A has started drifting from this reference orbit in August 2016, after its last manoeuvre. This drift remains very small until 2018 (equator crossing time is about 09:15 at the end of that year), but starts to be significant during the year 2019, with the equator crossing time of about 08:50 at the end of the year, then about 08:25 at the end of 2020 and about 08:00 when IASI-A was decommissioned. This may have an impact on the MAPIR IASI-A versus IASI-C consistency, especially in some dust source area with diurnal cycle. We have analysed time series of MAPIR IASI-A and IASI-C dust 10 µm AOD daily averages (morning and evening data combined), zooming on the years with data from both instruments, for different large source (Sahara, Taklamakan, Gobi, Middle East, Australia) or transport area (North Atlantic or Indian oceans). This analysis was done for morning observations, evening observations, or both combined. From all this, the only area where there is a clear difference between MAPIR IASI-A and IASI-C are the Sahara and Australia (Fig. 20). In both cases, the differences mostly arise from the morning observations, which highlights the plausible cause of the time difference and the morning emission mechanisms. Indeed, part of the dust emitted right after sunrise (06:00–07:00 in the Tropics) and observed with IASI-A could have settled down when IASI-C passes, explaining slightly lower dust AOD with the latter.
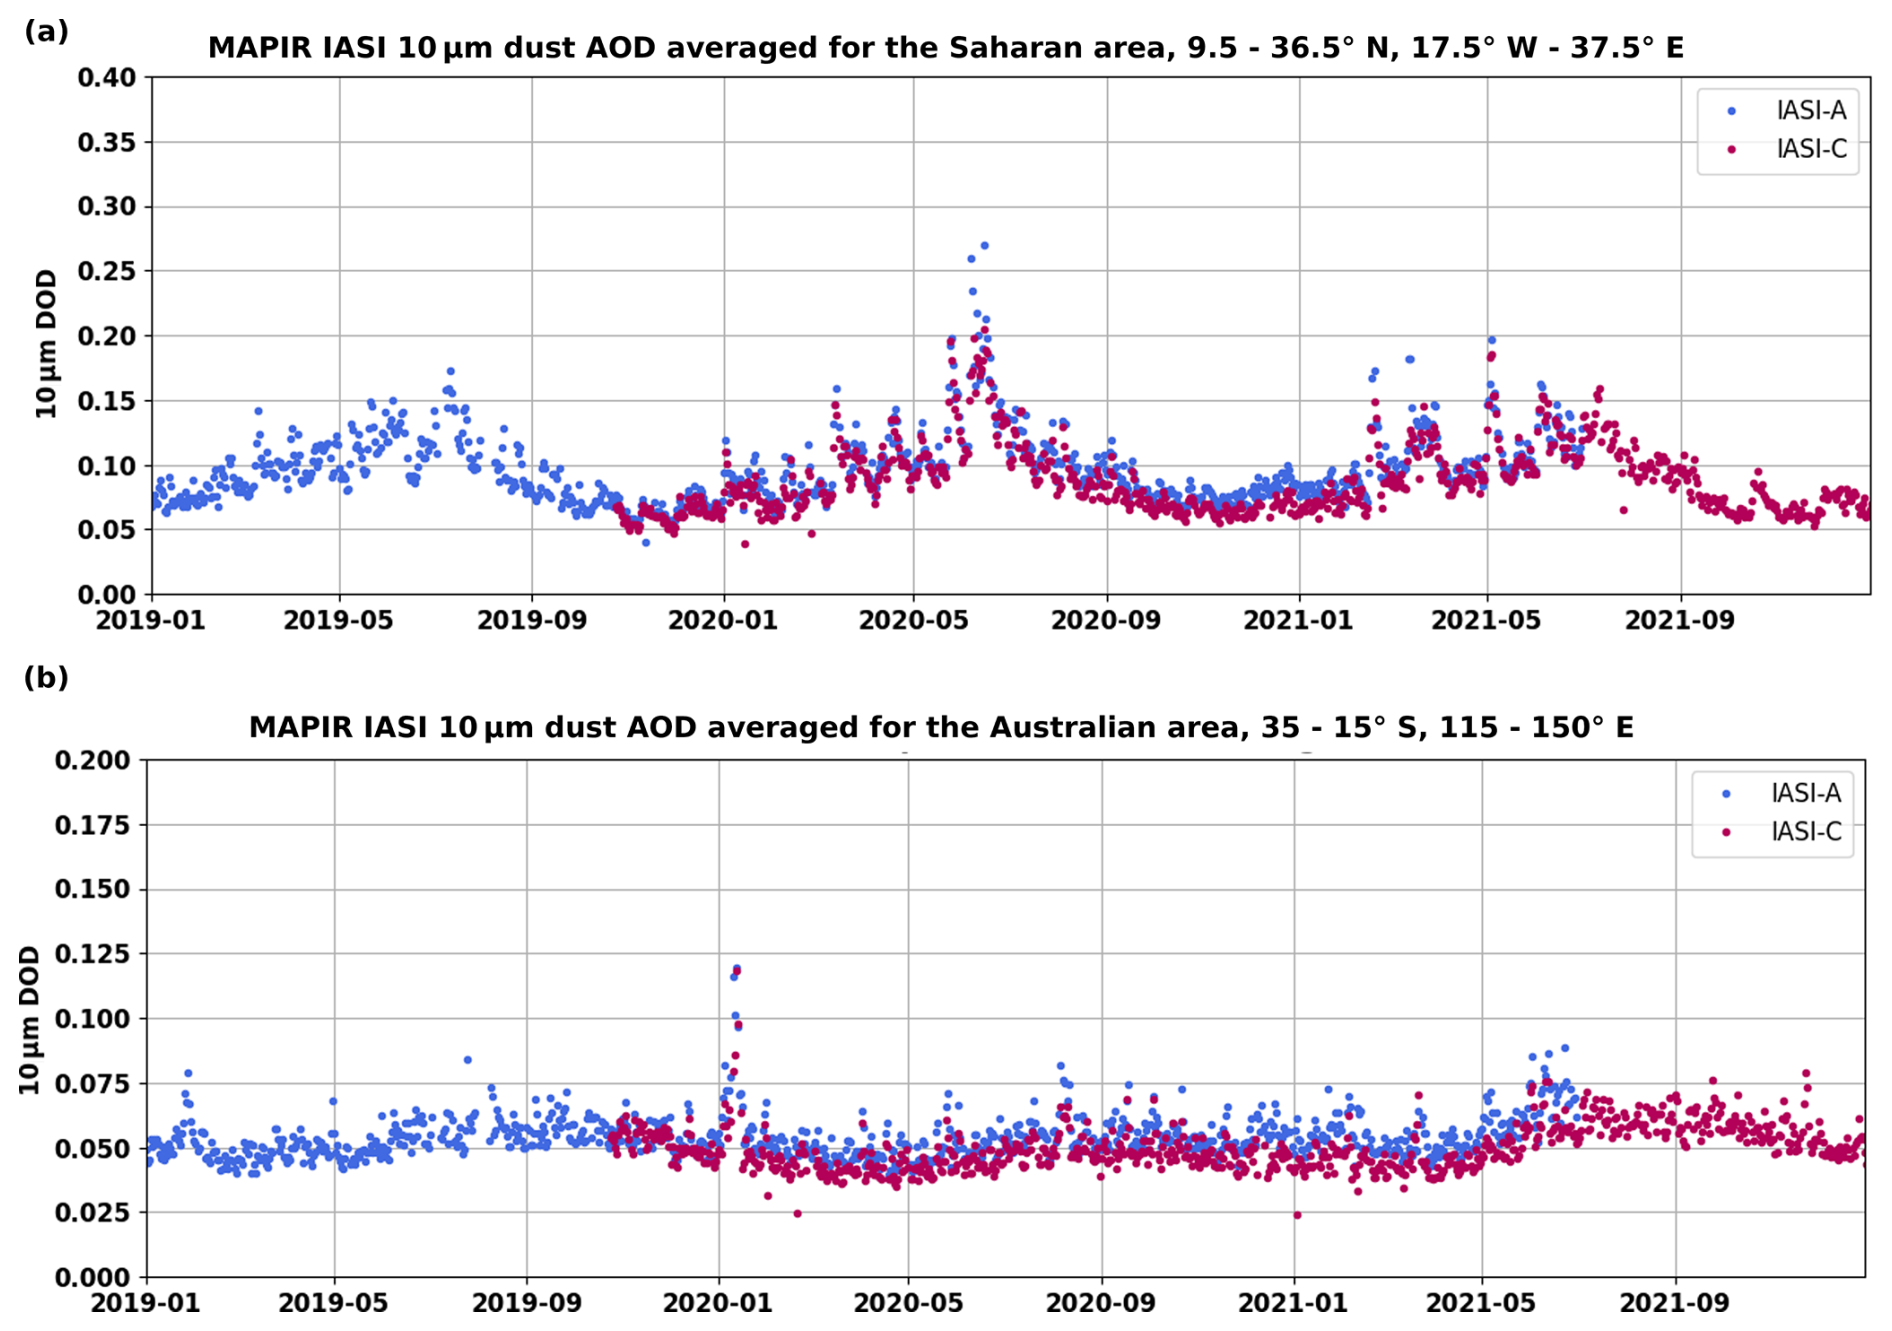
Figure 20Same as Fig. 17, zoomed on the 2019–2021 years, for (a) the Sahara area, latitude 9.5 to 36.5° N, longitude 17.5° W to 37.5° E, and (b) the Australian area, latitude 35 to 15° S, longitude 115 to 150° E.
Considering the existence of these shifts in the time series, which seem to be due to the Metop-A drift, we recommend for long-term analyses to use MAPIR IASI-A only until IASI-C data comes up in October 2019. At that moment there is already about 30 min time difference between both satellites, but the dust data seems to be reasonably continuous.
Mineral dust is a dominant tropospheric aerosol, with impacts on climate, health and many socio-economical spheres. It is therefore important to monitor it both on the long term and in NRT. The MAPIR v5.1 algorithm and its application to IASI observations since their beginning in 2007 provide an important contribution to this monitoring.
In this manuscript, the MAPIR version 5.1 was presented in detail, highlighting the improvements and changes since the last published version 4.1. MAPIR v5.1 retrieves dust aerosol concentration profiles from ground to 10 km altitude (above sea level), in 1 km thick layers, from which the integrated AOD is obtained together with a mean dust altitude. MAPIR is based on the OEM with Levenberg-Marquardt optimisation, and uses RTTOV for all radiative transfer computations, using the DOM for scattering modelisation. The algorithm was used to produce a fully consistent time series of MAPIR IASI-A dust profile data (July 2007 to September 2021), using the reprocessed IASI spectra and atmospheric profiles, and MAPIR IASI-C dust profile time series (since October 2019) as consistent as possible with the IASI-A data. The data product also contains the uncertainties, both as the full profile covariance matrix and as AOD uncertainty. Finally, averaging kernels and a quality flag are also provided.
The retrieval shows a very good capability to retrieve dust aerosols distributions, correctly reproducing seasonal cycles at all analysed locations, and ability to detect unusual events. The vertically integrated AOD, converted from 10 µm to 550 nm, was compared against AERONET sun/moon-photometer observations, showing overall a very low median bias of about 0.01, and a good correlation of almost 0.8 when comparing to solar data, and 0.7 for lunar comparisons. The MAPIR bias however varies with the 550 nm AOD (positive bias for low AOD, decreasing towards a negative bias for high AOD) in a quasi linear relationship that suggests the underestimation of the current 10 µm to 550 nm conversion. This conversion and also the challenges of the comparison of TIR based retrievals with VIS observations are discussed in detail in the manuscript, highlighting the need for reference data directly in the TIR and the fact that the absolute value of the TIR retrieved AOD currently cannot be truly validated. On the other hand, the good correlation between the compared data sets shows the good capabilities of MAPIR to reproduce the variability of the dust AOD, and does not depend on the absolute AOD values. The low AOD positive bias arises from the low sensitivity in the presence of only small amounts of aerosols, rendering the deviation from the a priori very costly for the retrieval. This bias is also seen at 10 µm: the minimal dust AOD in absence of dust events is about 0.06. MAPIR 10 µm AOD below that threshold should be considered non-significant and, depending on applications, could be removed from the data or considered as indication of the absence of dust.
In addition to the good capabilities to reproduce the total column dust load, MAPIR also shows good capabilities to provide vertical information. The information content is however relatively low (maximum about 2.5 DOF, when the dust load is relatively high and the thermal contrast with the surface is clear), and the 10 retrieved layers are not at all independent. Examples of comparisons with CALIOP show the good capability of MAPIR to retrieve the dust in the correct vertical range(s) even when multiple layers are present. One example of profile comparisons between MAPIR/IASI and EARLINET lidar data at the Potenza station also highlights the potential of MAPIR for providing vertical information. This exercise will be expanded, which will be the subject of a separate publication containing a large comparison data set and statistical analysis.
The mean altitude obtained from the profiles also shows to be reasonable. It is provided only when the sensitivity is acceptable (1.25 DOF, 0.05 AOD at 10 µm). When the sensitivity is too low, the middle of the vertical range is mostly obtained as mean altitude, which is not physically meaningful. Those cases are mostly filtered out (and the mean altitude not provided), but some still pass the filters and appear as artefacts in the data. This effect stands out when averaging for long time periods, in areas where there is typically only rarely dust.
Finally, the MAPIR data shows long-term stability along both IASI-A and C time series, and a very good potential for merging if taking into account the orbital drift of IASI-A. Indeed, we show that for merging the best moment to switch from IASI-A to IASI-C is at the start of the IASI-C data series (i.e. October 2019), reducing to the minimum the time difference between both instruments. This is especially important close to source areas, where a time difference between instruments also means a potentially large difference in the observed scene. In the current MAPIR IASI-C time series, some observations are rejected from the data because they lack the surface altitude information. This occurs mostly for cloudy cases, but also for some dusty cases. That issue will be solved in the next processing, using another source for the surface altitude. This issue only causes missing some data, but does not affect the retrieval results. Our analysis also indicates that it does not impact long-term analyses, or large area averages.
The cloud filtering remains a challenging step. In the current version, no filtering is done prior to the retrieval, to avoid the removal of some dust events (which occurs with every currently existing cloud flag, as far as we are aware and have analysed). The cloud filtering forms part of the post-retrieval QC, and leads to much better dust/cloud discrimination than any attempted pre-filtering. However, it is obviously still not perfect and it happens that a thin cloud is kept in the dust data, as an artificial relatively large AOD.
The uncertainty calculation also remains a challenge with respect to the inclusion of all relevant uncertainties. In the current version, in addition to the basic OEM uncertainty calculation we have added the propagation of uncertainties in temperature and humidity profiles. Future work should also aim at including the propagation of uncertainties on the surface emissivity, and on the dust optical properties. Managing this at a pixel level without strong increase in computational time is challenging.
Future work on IASI dust retrievals should also include research on using a variable dust PSD and RI, the latter for example considering recent laboratory measurements such as those from Di Biagio et al. (2017). The definition of the aerosol model indeed impacts the dust retrieval itself and the conversion to VIS AOD.
MAPIR v5.1 presented here was used to produce full data time series, which are analysed in this manuscript, but is also in preparation for delivering NRT observations through the EUMETSAT AC SAF and the EumetCast system. The two data streams will be maintained in parallel, the “climate” version aiming at the most consistent long-term data series, and the “NRT” version aiming at the best data at production time, for use in forecast models.
Looking towards the future, the MAPIR algorithm will be implemented on data from the newly launched IASI-NG (new generation) instrument onboard Metop-SG (second generation) platform. This is expected to be relatively straightforward, given the similar instrument properties and spectral range. No particular improvement is expected for MAPIR retrievals from the increased spectral resolution and reduced spectral noise: the dust aerosol signature is broad. However, the atmospheric temperature profile is expected to be of improved quality with IASI-NG, which will indirectly reflect on the quality of the dust profiles. Another new instrument has been recently launched, with TIR hyperspectral capabilities: the InfraRed Sounder (IRS) onboard Meteosat Third Generation (MTG), a geostationary platform. Application of a MAPIR-like algorithm to that instrument is planned, and bears serious challenges such as the enormous data amount and the large viewing angles. It is however expected to bring extremely useful information with the high temporal resolution, allowing to better follow the diurnal cycle and to provide more regular input to weather and aerosol forecast models.
Table A1AERONET SDA CAOD 550 nm vs. MAPIR IASI dust AOD converted to 550 nm correlations by station (sorted by latitude, North to South).
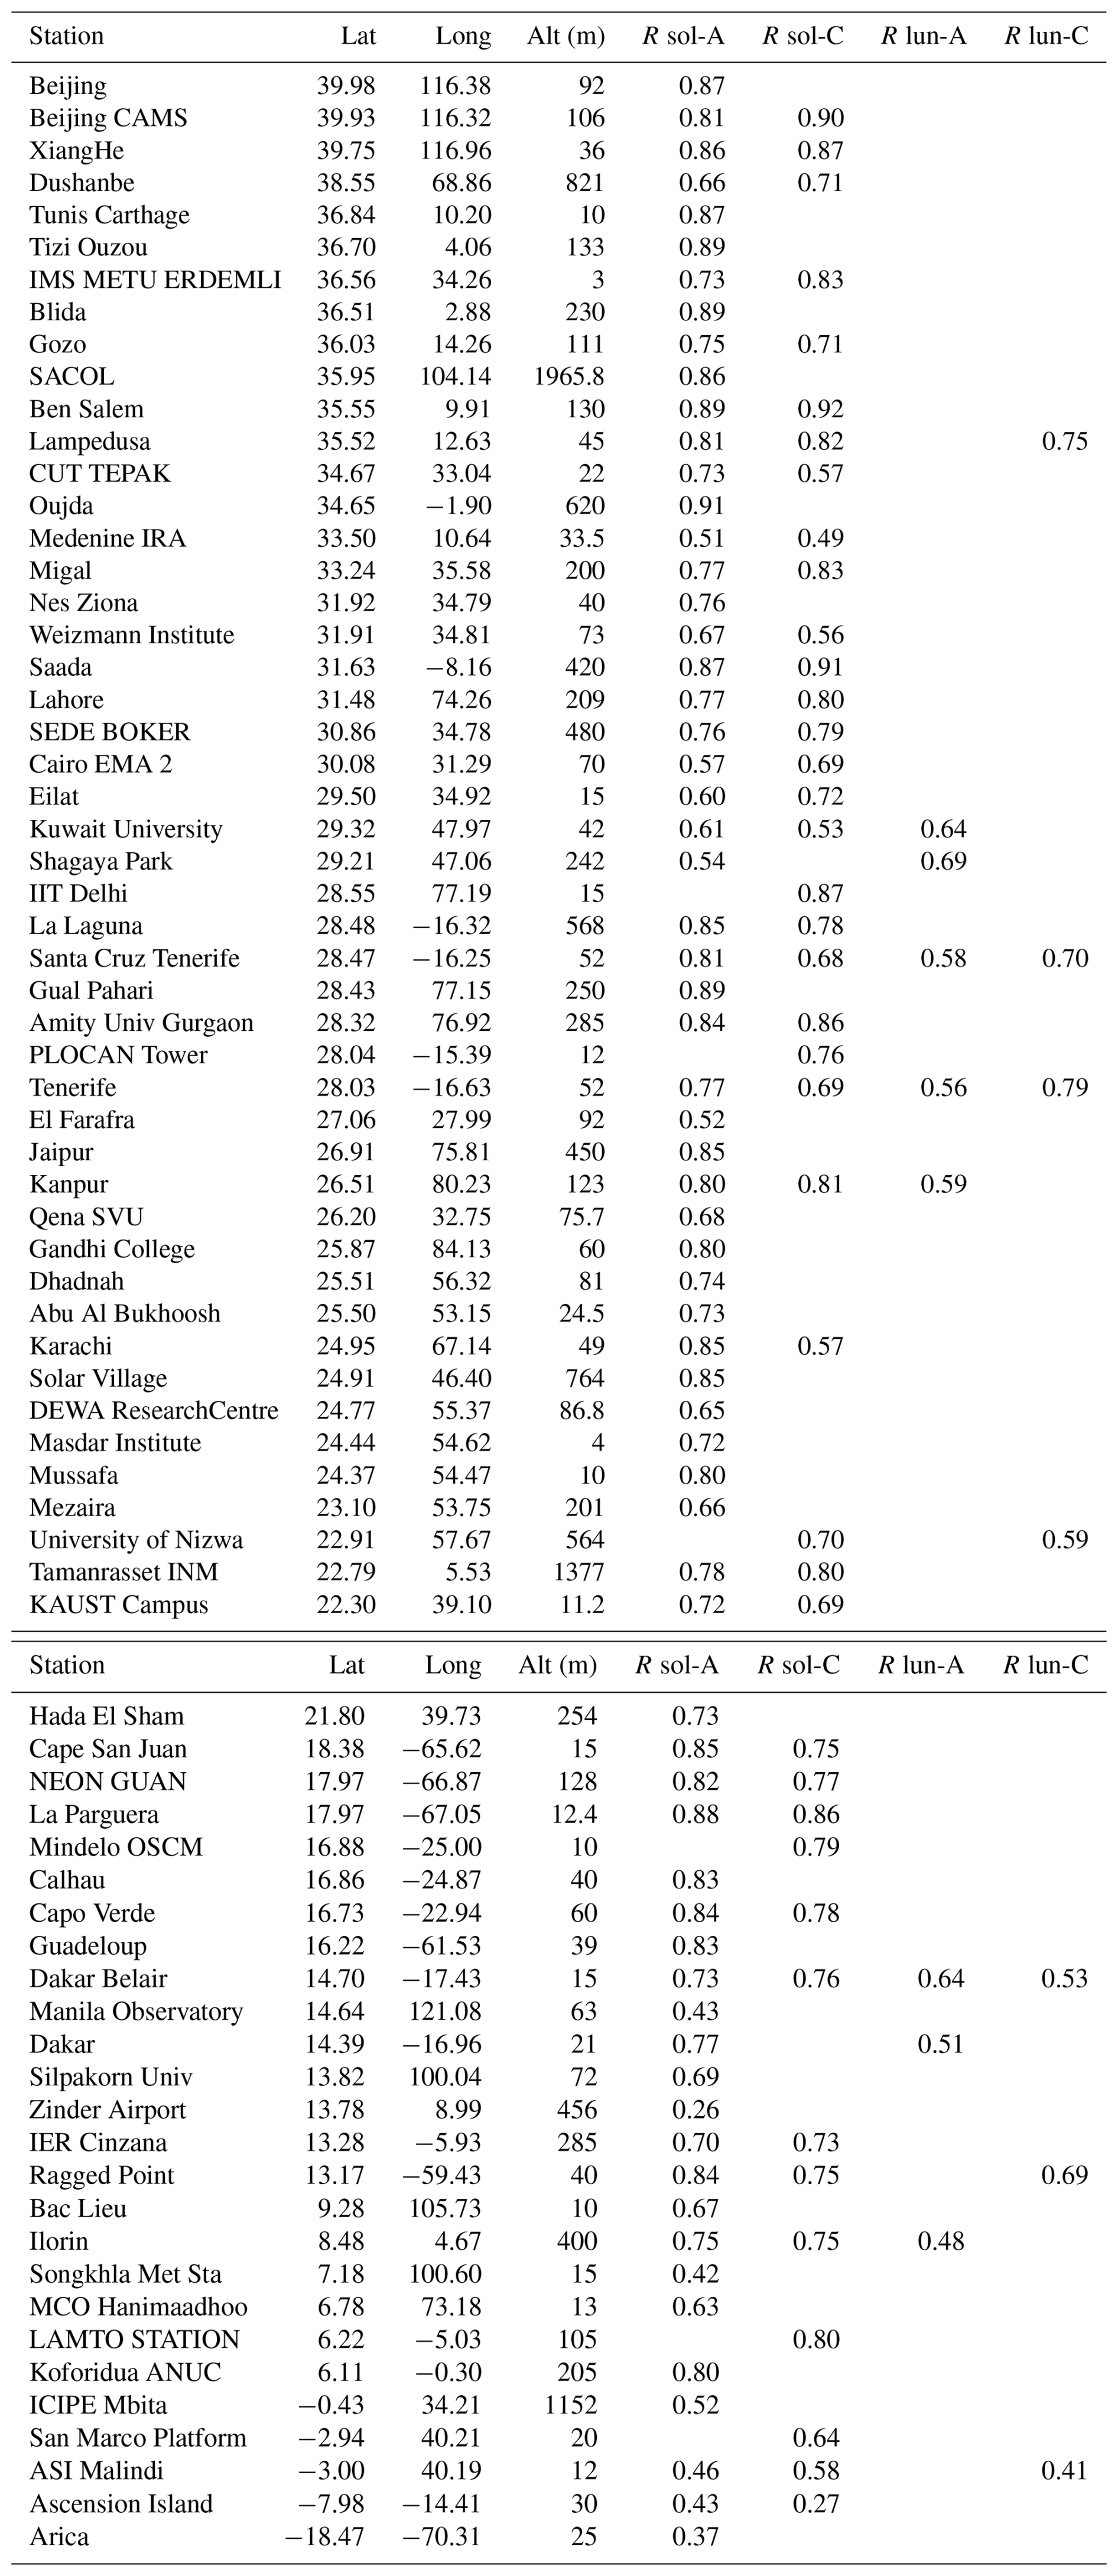
The MAPIR v5.1 climate time series received a DOI (https://doi.org/10.18758/f7el2zbr, Vandenbussche and De Mazière, 2025), and is also available through the https://iasi.aeronomie.be (last access: 17 July 2026) website, with data completion at least twice per year. Furthermore, the data is produced as level 3 daily and monthly files, containing only the dust AOD and mean altitude. This level 3 data is distributed through the Copernicus Climate Data Store (https://doi.org/10.24381/cds.239d815c, Copernicus Climate Change Service, Climate Data Store, 2025), together with a series of other aerosol data from different satellite instruments.
SV performed the algorithm work and most of data analysis and evaluation, and is the main writer of the paper. CB performed the comparisons with the EARLINET lidar data and wrote the corresponding sections. MEK provided guidance for the validation in general and a thorough review of the whole manuscript. SK contributed to the AERONET validation setup and discussion. MDM participated in all scientific discussions, providing guidance along the project, properly secured the funding and thoroughly reviewed the manuscript.
At least one of the (co-)authors is a guest member of the editorial board of Atmospheric Measurement Techniques for the special issue “Sun-photometric measurements of aerosols: harmonization, comparisons, synergies, effects, and applications”. The peer-review process was guided by an independent editor, and the authors also have no other competing interests to declare.
Publisher's note: Copernicus Publications remains neutral with regard to jurisdictional claims made in the text, published maps, institutional affiliations, or any other geographical representation in this paper. The authors bear the ultimate responsibility for providing appropriate place names. Views expressed in the text are those of the authors and do not necessarily reflect the views of the publisher.
This article is part of the special issue “Sun-photometric measurements of aerosols: harmonization, comparisons, synergies, effects, and applications”. It is not associated with a conference.
The authors thank the EUMETSAT for operating the IASI instrument and providing its data, including consistent reprocessing. The authors thank the AERONET PI(s) and Co-I(s) and their staff for establishing and maintaining the 74 sites used in this investigation. The authors also thank the CALIOP team at National Aeronautics and Space Administration (NASA) for the instrument exploitation and data provision. We also thank the LIVAS team for provision of the CALIOP pure dust profile data, and the NWP SAF for providing the RTTOV tool. The authors acknowledge EARLINET for providing aerosol lidar profiles available from the EARLINET database.
SV thanks James Hocking for useful discussions regarding correct configuration and use of RTTOV. SK and SV acknowledges Harmonia Cost Action CA21119 supported by the European Cooperation in Science and Technology (https://harmonia-cost.eu/, last access: 17 July 2026).
Part of the results presented in this work have been produced using the Aristotle University of Thessaloniki (AUTh) High Performance Computing Infrastructure and Resources. The authors would like to acknowledge the support provided by the Digital Governance Unit of the Aristotle University of Thessaloniki (AUTh) throughout the progress of this research work.
The publication was financially supported by HARMONIA cost action CA21119.
Funding for MAPIR algorithm development has been provided (including historical first development) by Belspo Supplem Researcher grant nos. WE/35/Q07, R07 and S07, European Space Agency Climate Change Initiative (ESA CCI) aerosols phase 2 (2013–2016) grant no. 4000109874/14/I-NB and Belspo/ESA PRODEX IASI.flow (2016–2020) PEA 4000111402 and HIRS (2021–2026) PEAs 4000134591 and 4000144088.
Additional funding for current version data processing and delivery to Copernicus Climate Change Services was provided by European Center for Medium-Range Weather Forecast (ECMWF) Copernicus Climate Change Services 2 (C3S2) 312a and 313a Lot2 Atmospheric Composition.
This paper was edited by Zhao-Cheng Zeng and reviewed by two anonymous referees.
Adebiyi, A., Kok, J. F., Murray, B. J., Ryder, C. L., Stuut, J.-B. W., Kahn, R. A., Knippertz, P., Formenti, P., Mahowald, N. M., Pérez García-Pando, C., Klose, M., Ansmann, A., Samset, B. H., Ito, A., Balkanski, Y., Di Biagio, C., Romanias, M. N., Huang, Y., and Meng, J.: A review of coarse mineral dust in the Earth system, Aeolian Res., 60, 100849, https://doi.org/10.1016/j.aeolia.2022.100849, 2023. a
Amiridis, V., Wandinger, U., Marinou, E., Giannakaki, E., Tsekeri, A., Basart, S., Kazadzis, S., Gkikas, A., Taylor, M., Baldasano, J., and Ansmann, A.: Optimizing CALIPSO Saharan dust retrievals, Atmos. Chem. Phys., 13, 12089–12106, https://doi.org/10.5194/acp-13-12089-2013, 2013. a
Amiridis, V., Marinou, E., Tsekeri, A., Wandinger, U., Schwarz, A., Giannakaki, E., Mamouri, R., Kokkalis, P., Binietoglou, I., Solomos, S., Herekakis, T., Kazadzis, S., Gerasopoulos, E., Proestakis, E., Kottas, M., Balis, D., Papayannis, A., Kontoes, C., Kourtidis, K., Papagiannopoulos, N., Mona, L., Pappalardo, G., Le Rille, O., and Ansmann, A.: LIVAS: a 3-D multi-wavelength aerosol/cloud database based on CALIPSO and EARLINET, Atmos. Chem. Phys., 15, 7127–7153, https://doi.org/10.5194/acp-15-7127-2015, 2015. a
Bernard, E., Moulin, C., Ramon, D., Jolivet, D., Riedi, J., and Nicolas, J.-M.: Description and validation of an AOT product over land at the 0.6 µm channel of the SEVIRI sensor onboard MSG, Atmos. Meas. Tech., 4, 2543–2565, https://doi.org/10.5194/amt-4-2543-2011, 2011. a
Biskas, C., Michailidis, K., Koukouli, M.-E., Voudouri, K.-A., Peletidou, G., Vandenbussche, S., and Balis, D.: Evaluation of IASI MAPIR v5.1 Dust Concentration Profiles using ACTRIS/EARLINET Lidar data, in preparation, 2026. a
Callewaert, S., Vandenbussche, S., Kumps, N., Kylling, A., Shang, X., Komppula, M., Goloub, P., and De Mazière, M.: The Mineral Aerosol Profiling from Infrared Radiances (MAPIR) algorithm: version 4.1 description and evaluation, Atmos. Meas. Tech., 12, 3673–3698, https://doi.org/10.5194/amt-12-3673-2019, 2019. a, b, c, d, e, f, g, h, i
Capelle, V., Chédin, A., Pondrom, M., Crevoisier, C., Armante, R., Crepeau, L., and Scott, N.: Infrared dust aerosol optical depth retrieved daily from IASI and comparison with AERONET over the period 2007–2016, Remote Sens. Environ., 206, 15–32, https://doi.org/10.1016/j.rse.2017.12.008, 2018. a, b, c
Ceccherini, S. and Ridolfi, M.: Technical Note: Variance-covariance matrix and averaging kernels for the Levenberg-Marquardt solution of the retrieval of atmospheric vertical profiles, Atmos. Chem. Phys., 10, 3131–3139, https://doi.org/10.5194/acp-10-3131-2010, 2010. a
Choobari, O. A., Zawar-Reza, P., and Sturman, A.: The global distribution of mineral dust and its impacts on the climate system: A review, Atmos. Res., 138, 152–165, https://doi.org/10.1016/j.atmosres.2013.11.007, 2014. a, b
Clarisse, L., R'Honi, Y., Coheur, P.-F., Hurtmans, D., and Clerbaux, C.: Thermal infrared nadir observations of 24 atmospheric gases, Geophys. Res. Lett., 38, https://doi.org/10.1029/2011GL047271, 2011. a
Clarisse, L., Clerbaux, C., Franco, B., Hadji-Lazaro, J., Whitburn, S., Kopp, A. K., Hurtmans, D., and Coheur, P.-F.: A Decadal Data Set of Global Atmospheric Dust Retrieved From IASI Satellite Measurements, J. Geophys. Res.-Atmos., 124, 1618–1647, https://doi.org/10.1029/2018JD029701, 2019. a, b, c
Clerbaux, C., Boynard, A., Clarisse, L., George, M., Hadji-Lazaro, J., Herbin, H., Hurtmans, D., Pommier, M., Razavi, A., Turquety, S., Wespes, C., and Coheur, P.-F.: Monitoring of atmospheric composition using the thermal infrared IASI/MetOp sounder, Atmos. Chem. Phys., 9, 6041–6054, https://doi.org/10.5194/acp-9-6041-2009, 2009. a, b, c, d, e
CNES: IASI-NG, https://cnes.fr/projets/iasi-ng (last access: 20 January 2026), 2026. a
Copernicus Climate Change Service, Climate Data Store: Aerosol properties gridded data from 1995 to present derived from satellite observation, Copernicus Climate Change Service (C3S) Climate Data Store (CDS) [data set], https://doi.org/10.24381/cds.239d815c, 2025. a
D'Amico, G., Amodeo, A., Baars, H., Binietoglou, I., Freudenthaler, V., Mattis, I., Wandinger, U., and Pappalardo, G.: EARLINET Single Calculus Chain – overview on methodology and strategy, Atmos. Meas. Tech., 8, 4891–4916, https://doi.org/10.5194/amt-8-4891-2015, 2015. a
Deeter, M. N., Edwards, D. P., and Gille, J. C.: Retrievals of carbon monoxide profiles from MOPITT observations using lognormal a priori statistics, J. Geophys. Res.-Atmos., 112, https://doi.org/10.1029/2006JD007999, 2007. a, b
De Rosa, B., Mytilinaios, M., Amodeo, A., Colangelo, C., D’Amico, G., Dema, C., Gandolfi, I., Giunta, A., Gumà-Claramunt, P., Laurita, T., Lolli, S., Papagiannopoulos, N., Papanikolaou, C.-A., Rosoldi, M., Summa, D., and Mona, L.: Observations of Saharan Dust Intrusions over Potenza, Southern Italy, During 13 Years of Lidar Measurements: Seasonal Variability of Optical Properties and Radiative Impact, Remote Sens., 17, https://doi.org/10.3390/rs17030453, 2025. a, b
De Wachter, E., Kumps, N., Vandaele, A. C., Langerock, B., and De Mazière, M.: Retrieval and validation of MetOp/IASI methane, Atmos. Meas. Tech., 10, 4623–4638, https://doi.org/10.5194/amt-10-4623-2017, 2017. a
Di Biagio, C., Formenti, P., Balkanski, Y., Caponi, L., Cazaunau, M., Pangui, E., Journet, E., Nowak, S., Caquineau, S., Andreae, M. O., Kandler, K., Saeed, T., Piketh, S., Seibert, D., Williams, E., and Doussin, J.-F.: Global scale variability of the mineral dust long-wave refractive index: a new dataset of in situ measurements for climate modeling and remote sensing, Atmos. Chem. Phys., 17, 1901–1929, https://doi.org/10.5194/acp-17-1901-2017, 2017. a, b, c, d
Di Biagio, C., Formenti, P., Balkanski, Y., Caponi, L., Cazaunau, M., Pangui, E., Journet, E., Nowak, S., Andreae, M. O., Kandler, K., Saeed, T., Piketh, S., Seibert, D., Williams, E., and Doussin, J.-F.: Complex refractive indices and single-scattering albedo of global dust aerosols in the shortwave spectrum and relationship to size and iron content, Atmos. Chem. Phys., 19, 15503–15531, https://doi.org/10.5194/acp-19-15503-2019, 2019. a, b
Dubovik, O., Holben, B., Eck, T., Smirnov, A., Kaufman, Y., King, M., Tanré, D., and Slutsker, I.: Variability of Absorption and Optical Properties of Key Aerosol Types Observed in Worldwide Locations, J. Atmos. Sci., 59, 590–608, https://doi.org/10.1175/1520-0469(2002)059<0590:VOAAOP>2.0.CO;2, 2002. a
Dufresne, J.-L., Gautier, C., Ricchiazzi, P., and Fouquart, Y.: Longwave Scattering Effects of Mineral Aerosols, J. Atmos. Sci., 59, 1959–1966, https://doi.org/10.1175/1520-0469(2002)059<1959:LSEOMA>2.0.CO;2, 2002. a
Eck, T., Holben, b., Reid, J., Dubovik, O., Smirnov, A., Neill, Slutsker, I., and Kinne, S.: Wavelength dependence of the optical depth of biomass burning, urban, and desert dust aerosols, J. Geophys. Res., 104, 31333–31349, https://doi.org/10.1029/1999JD900923, 1999. a
Engelmann, R., Kanitz, T., Baars, H., Heese, B., Althausen, D., Skupin, A., Wandinger, U., Komppula, M., Stachlewska, I. S., Amiridis, V., Marinou, E., Mattis, I., Linné, H., and Ansmann, A.: The automated multiwavelength Raman polarization and water-vapor lidar PollyXT: the neXT generation, Atmos. Meas. Tech., 9, 1767–1784, https://doi.org/10.5194/amt-9-1767-2016, 2016. a
EUMETSAT: IASI Level 2 Product Guide v3E (EUM/OPS-EPS/MAN/04/0033), EUMETSAT, https://user.eumetsat.int/s3/eup-strapi-media/IASI_Level_2_Product_Guide_8f61a2369f.pdf (last access 17 July 2026), 2017. a, b
EUMETSAT: IASI Level 2 PPF v6.4 validation report | EUMETSAT (EUM/RSP/REP/18/974859), EUMETSAT, https://user.eumetsat.int/s3/eup-strapi-media/IASI_L2_PPF_v6_4_validation_report_096053f786.pdf (last access: 17 July 2026), 2018. a
EUMETSAT: IASI Level 1 Product Guide v5 (EUM/OPS-EPS/MAN/04/0032), EUMETSAT, https://user.eumetsat.int/s3/eup-strapi-media/pdf_iasi_pg_487c765315.pdf (last access 17 July 2026), 2019. a
EUMETSAT: CDR IASI Level 1 PCC release 1 Product User Guide, EUMETSAT, https://user.eumetsat.int/s3/eup-strapi-media/Product_User_Guide_IASI_PCS_release_1_382d1df483.pdf (last access 27 July 2026), 2022a. a
EUMETSAT: CDR IASI Level 2 TS, T, Q release 1.1 Product User Guide, EUMETSAT, https://user.eumetsat.int/s3/eup-strapi-media/Product_User_Guide_IASI_level2_TS_T_Q_bb33631ebf.pdf (last access 27 July 2026), 2022b. a
EUMETSAT: IASI All Sky Temperature and Humidity Profiles - Climate Data Record Release 1.1 – Metop-A and -B, EUMETSAT [data set], https://doi.org/10.15770/EUM_SEC_CLM_0063, 2022c. a, b
EUMETSAT: IASI Principal Components Scores Fundamental Data Record Release 1 – Metop-A and -B, EUMETSAT [data set], https://doi.org/10.15770/EUM_SEC_CLM_0084, 2022d. a, b
EUMETSAT: IASI Level 1 Principal Component Scores – Metop – Global – collection id EO:EUM:DAT:METOP:IASPCS01, EUMETSAT [data set], https://user.eumetsat.int/catalogue/EO:EUM:DAT:METOP:IASPCS01 (last access: 17 July 2026), 2025a. a, b
EUMETSAT: IASI Combined Sounding Products – Metop – collection id EO:EUM:DAT:METOP:IASSND02, EUMETSAT [data set], https://data.eumetsat.int/product/EO:EUM:DAT:METOP:IASSND02 (last access: 17 July 2026), 2025b. a, b
EUMETSAT: User Notification Service (UNS), https://uns.eumetsat.int/uns/ (last access: 29 May 2026), 2025c. a, b
Ge, J. M., Huang, J. P., Xu, C. P., Qi, Y. L., and Liu, H. Y.: Characteristics of Taklimakan dust emission and distribution: A satellite and reanalysis field perspective: Taklimakan dust Characteristics, J. Geophys. Res.-Atmos., 119, 11772–11783, https://doi.org/10.1002/2014JD022280, 2014. a
Giles, D. M., Sinyuk, A., Sorokin, M. G., Schafer, J. S., Smirnov, A., Slutsker, I., Eck, T. F., Holben, B. N., Lewis, J. R., Campbell, J. R., Welton, E. J., Korkin, S. V., and Lyapustin, A. I.: Advancements in the Aerosol Robotic Network (AERONET) Version 3 database – automated near-real-time quality control algorithm with improved cloud screening for Sun photometer aerosol optical depth (AOD) measurements, Atmos. Meas. Tech., 12, 169–209, https://doi.org/10.5194/amt-12-169-2019, 2019. a
Gkikas, A., Basart, S., Hatzianastassiou, N., Marinou, E., Amiridis, V., Kazadzis, S., Pey, J., Querol, X., Jorba, O., Gassó, S., and Baldasano, J. M.: Mediterranean intense desert dust outbreaks and their vertical structure based on remote sensing data, Atmos. Chem. Phys., 16, 8609–8642, https://doi.org/10.5194/acp-16-8609-2016, 2016. a
Gkikas, A., Proestakis, E., Amiridis, V., Kazadzis, S., Di Tomaso, E., Tsekeri, A., Marinou, E., Hatzianastassiou, N., and Pérez García-Pando, C.: ModIs Dust AeroSol (MIDAS): a global fine-resolution dust optical depth data set, Atmos. Meas. Tech., 14, 309–334, https://doi.org/10.5194/amt-14-309-2021, 2021. a
Hilton, F., Armante, R., August, T., Barnet, C., Bouchard, A., Camy-Peyret, C., Capelle, V., Clarisse, L., Clerbaux, C., Coheur, P.-F., Collard, A., Crevoisier, C., Dufour, G., Edwards, D., Faijan, F., Fourrié, N., Gambacorta, A., Goldberg, M., Guidard, V., Hurtmans, D., Illingworth, S., Jacquinet-Husson, N., Kerzenmacher, T., Klaes, D., Lavanant, L., Masiello, G., Matricardi, M., McNally, A., Newman, S., Pavelin, E., Payan, S., Péquignot, E., Peyridieu, S., Phulpin, T., Remedios, J., Schlüssel, P., Serio, C., Strow, L., Stubenrauch, C., Taylor, J., Tobin, D., Wolf, W., and Zhou, D.: Hyperspectral Earth Observation from IASI: Five Years of Accomplishments, B. Am. Meteorol. Soc., 93, 347–370, https://doi.org/10.1175/BAMS-D-11-00027.1, 2012. a, b, c
Hocking, J., Saunders, R., Geer, A., and Vidot, J.: RTTOV v13 Users Guide (NWPSAF-MO-UD-046), NWP SAF, https://nwp-saf.eumetsat.int/site/download/documentation/rtm/docs_rttov13/users_guide_rttov13_v1.2.pdf (last access 17 July 2026), 2021. a
Holben, B. N., Eck, T. F., Slutsker, I., Tanré, D., Buis, J. P., Setzer, A., Vermote, E., Reagan, J. A., Kaufman, Y. J., Nakajima, T., Lavenu, F., Jankowiak, I., and Smirnov, A.: AERONET – A Federated Instrument Network and Data Archive for Aerosol Characterization, Remote Sens. Environ., 66, 1–16, https://doi.org/10.1016/S0034-4257(98)00031-5, 1998. a
Hu, Z., Huang, J., Zhao, C., Jin, Q., Ma, Y., and Yang, B.: Modeling dust sources, transport, and radiative effects at different altitudes over the Tibetan Plateau, Atmos. Chem. Phys., 20, 1507–1529, https://doi.org/10.5194/acp-20-1507-2020, 2020. a
Jacquinet-Husson, N., Crepeau, L., Armante, R., Boutammine, C., Chédin, A., Scott, N., Crevoisier, C., Capelle, V., Boone, C., Poulet-Crovisier, N., Barbe, A., Campargue, A., Chris Benner, D., Benilan, Y., Bézard, B., Boudon, V., Brown, L., Coudert, L., Coustenis, A., Dana, V., Devi, V., Fally, S., Fayt, A., Flaud, J.-M., Goldman, A., Herman, M., Harris, G., Jacquemart, D., Jolly, A., Kleiner, I., Kleinböhl, A., Kwabia-Tchana, F., Lavrentieva, N., Lacome, N., Xu, L.-H., Lyulin, O., Mandin, J.-Y., Maki, A., Mikhailenko, S., Miller, C., Mishina, T., Moazzen-Ahmadi, N., Müller, H., Nikitin, A., Orphal, J., Perevalov, V., Perrin, A., Petkie, D., Predoi-Cross, A., Rinsland, C., Remedios, J., Rotger, M., Smith, M., Sung, K., Tashkun, S., Tennyson, J., Toth, R., Vandaele, A.-C., and Vander Auwera, J.: The 2009 edition of the GEISA spectroscopic database, J. Quant. Spectrosc. Ra., 112, 2395–2445, https://doi.org/10.1016/j.jqsrt.2011.06.004, 2011. a
Jickells, T. D., An, Z. S., Andersen, K. K., Baker, A. R., Bergametti, G., Brooks, N., Cao, J. J., Boyd, P. W., Duce, R. A., Hunter, K. A., Kawahata, H., Kubilay, N., laRoche, J., Liss, P. S., Mahowald, N., Prospero, J. M., Ridgwell, A. J., Tegen, I., and Torres, R.: Global Iron Connections Between Desert Dust, Ocean Biogeochemistry, and Climate, Science, 308, 67–71, https://doi.org/10.1126/science.1105959, 2005. a
Kandler, K., Benker, N., Bundke, U., Cuevas, E., Ebert, M., Knippertz, P., Rodríguez, S., Schütz, L., and Weinbruch, S.: Chemical composition and complex refractive index of Saharan Mineral Dust at Izaña, Tenerife (Spain) derived by electron microscopy, Atmos. Environ., 41, 8058–8074, https://doi.org/10.1016/j.atmosenv.2007.06.047, 2007. a
Kim, M.-H., Omar, A. H., Tackett, J. L., Vaughan, M. A., Winker, D. M., Trepte, C. R., Hu, Y., Liu, Z., Poole, L. R., Pitts, M. C., Kar, J., and Magill, B. E.: The CALIPSO version 4 automated aerosol classification and lidar ratio selection algorithm, Atmos. Meas. Tech., 11, 6107–6135, https://doi.org/10.5194/amt-11-6107-2018, 2018. a
Klüser, L., Banks, J., Martynenko, D., Bergemann, C., Brindley, H., and Holzer-Popp, T.: Information content of space-borne hyperspectral infrared observations with respect to mineral dust properties, Remote Sens. Environ., 156, 294–309, https://doi.org/10.1016/j.rse.2014.09.036, 2015. a
Koepke, P., Gasteiger, J., and Hess, M.: Technical Note: Optical properties of desert aerosol with non-spherical mineral particles: data incorporated to OPAC, Atmos. Chem. Phys., 15, 5947–5956, https://doi.org/10.5194/acp-15-5947-2015, 2015. a, b
Levenberg, K.: A Method for the Solution of Certain Non-Linear Problems in Least Squares, Q. Appl. Math., 2, 164–168, 1944. a
Li, J., Carlson, B. E., Yung, Y. L., Lv, D., Hansen, J., Penner, J. E., Liao, H., Ramaswamy, V., Kahn, R. A., Zhang, P., Dubovik, O., Ding, A., Lacis, A. A., Zhang, L., and Dong, Y.: Scattering and absorbing aerosols in the climate system, Nat. Rev. Earth Environ., 3, 363–379, https://doi.org/10.1038/s43017-022-00296-7, 2022. a, b
Li, L., Mahowald, N. M., Miller, R. L., Pérez García-Pando, C., Klose, M., Hamilton, D. S., Gonçalves Ageitos, M., Ginoux, P., Balkanski, Y., Green, R. O., Kalashnikova, O., Kok, J. F., Obiso, V., Paynter, D., and Thompson, D. R.: Quantifying the range of the dust direct radiative effect due to source mineralogy uncertainty, Atmos. Chem. Phys., 21, 3973–4005, https://doi.org/10.5194/acp-21-3973-2021, 2021. a
Loveless, M., Borbas, E. E., Knuteson, R., Cawse-Nicholson, K., Hulley, G., and Hook, S.: Climatology of the Combined ASTER MODIS Emissivity over Land (CAMEL) Version 2, Remote Sens., 13, 111, https://doi.org/10.3390/rs13010111, 2021. a
Madonna, F., Amodeo, A., Boselli, A., Cornacchia, C., Cuomo, V., D'Amico, G., Giunta, A., Mona, L., and Pappalardo, G.: CIAO: the CNR-IMAA advanced observatory for atmospheric research, Atmos. Meas. Tech., 4, 1191–1208, https://doi.org/10.5194/amt-4-1191-2011, 2011. a
Maes, K., Vandenbussche, S., Klüser, L., Kumps, N., and de Mazière, M.: Vertical Profiling of Volcanic Ash from the 2011 Puyehue Cordón Caulle Eruption Using IASI, Remote Sens., 8, 103, https://doi.org/10.3390/rs8020103, 2016. a
Mahowald, N., Albani, S., Kok, J. F., Engelstaeder, S., Scanza, R., Ward, D. S., and Flanner, M. G.: The size distribution of desert dust aerosols and its impact on the Earth system, Aeolian Res., 15, 53–71, https://doi.org/10.1016/j.aeolia.2013.09.002, 2014. a
Mamouri, R. E. and Ansmann, A.: Fine and coarse dust separation with polarization lidar, Atmos. Meas. Tech., 7, 3717–3735, https://doi.org/10.5194/amt-7-3717-2014, 2014. a, b
Mamouri, R.-E., Ansmann, A., Nisantzi, A., Solomos, S., Kallos, G., and Hadjimitsis, D. G.: Extreme dust storm over the eastern Mediterranean in September 2015: satellite, lidar, and surface observations in the Cyprus region, Atmos. Chem. Phys., 16, 13711–13724, https://doi.org/10.5194/acp-16-13711-2016, 2016. a
Marquardt, D. W.: An Algorithm for Least-Squares Estimation of Nonlinear Parameters, J. Soc. Indust. Appl. Math., 11, 431–441, https://doi.org/10.1137/0111030, 1963. a
Michailidis, K., Koukouli, M.-E., Balis, D., Veefkind, J. P., de Graaf, M., Mona, L., Papagianopoulos, N., Pappalardo, G., Tsikoudi, I., Amiridis, V., Marinou, E., Gialitaki, A., Mamouri, R.-E., Nisantzi, A., Bortoli, D., João Costa, M., Salgueiro, V., Papayannis, A., Mylonaki, M., Alados-Arboledas, L., Romano, S., Perrone, M. R., and Baars, H.: Validation of the TROPOMI/S5P aerosol layer height using EARLINET lidars, Atmos. Chem. Phys., 23, 1919–1940, https://doi.org/10.5194/acp-23-1919-2023, 2023. a
Middleton, N.: Desert dust hazards: A global review, Aeolian Res., 24, 53–63, https://doi.org/10.1016/j.aeolia.2016.12.001, 2017. a
Mielonen, T., Arola, A., Komppula, M., Kukkonen, J., Koskinen, J., de Leeuw, G., and Lehtinen, K.: Comparison of CALIOP Level 2 aerosol subtypes to aerosol types derived from AERONET inversion data, Geophys. Res. Lett., 38, https://doi.org/10.1029/2009GL039609, 2009. a
Mona, L., Amiridis, V., Cuevas, E., Gkikas, A., Trippetta, S., Vandenbussche, S., Benedetti, A., Dagsson-Waldhauserova, P., Formenti, P., Haefele, A., Kazadzis, S., Knippertz, P., Laurent, B., Madonna, F., Nickovic, S., Papagiannopoulos, N., Pappalardo, G., García-Pando, C. P., Popp, T., Rodríguez, S., Sealy, A., Sugimoto, N., Terradellas, E., Vimic, A. V., Weinzierl, B., and Basart, S.: Observing Mineral Dust in Northern Africa, the Middle East, and Europe: Current Capabilities and Challenges ahead for the Development of Dust Services, B. Am. Meteorol. Soc., 104, E2223–E2264, https://doi.org/10.1175/BAMS-D-23-0005.1, 2023. a, b
Monteiro, A., Basart, S., Kazadzis, S., Votsis, A., Gkikas, A., Vandenbussche, S., Tobias, A., Gama, C., García-Pando, C. P., Terradellas, E., Notas, G., Middleton, N., Kushta, J., Amiridis, V., Lagouvardos, K., Kosmopoulos, P., Kotroni, V., Kanakidou, M., Mihalopoulos, N., Kalivitis, N., Dagsson-Waldhauserová, P., El-Askary, H., Sievers, K., Giannaros, T., Mona, L., Hirtl, M., Skomorowski, P., Virtanen, T. H., Christoudias, T., Di Mauro, B., Trippetta, S., Kutuzov, S., Meinander, O., and Nickovic, S.: Multi-sectoral impact assessment of an extreme African dust episode in the Eastern Mediterranean in March 2018, Sci. Total Environ., 843, 156861, https://doi.org/10.1016/j.scitotenv.2022.156861, 2022. a
Newman, S. M., Smith, J. A., Glew, M. D., Rogers, S. M., and Taylor, J. P.: Temperature and salinity dependence of sea surface emissivity in the thermal infrared, Q. J. Roy. Meteorol. Soc., 131, 2539–2557, https://doi.org/10.1256/qj.04.150, 2005. a, b
O'Neill, N. T., Eck, T. F., Smirnov, A., Holben, B. N., and Thulasiraman, S.: Spectral discrimination of coarse and fine mode optical depth, J. Geophys. Res.-Atmos., 108, https://doi.org/10.1029/2002JD002975, 2003. a, b
Pappalardo, G., Amodeo, A., Apituley, A., Comeron, A., Freudenthaler, V., Linné, H., Ansmann, A., Bösenberg, J., D'Amico, G., Mattis, I., Mona, L., Wandinger, U., Amiridis, V., Alados-Arboledas, L., Nicolae, D., and Wiegner, M.: EARLINET: towards an advanced sustainable European aerosol lidar network, Atmos. Meas. Tech., 7, 2389–2409, https://doi.org/10.5194/amt-7-2389-2014, 2014. a
Proestakis, E., Gkikas, A., Georgiou, T., Kampouri, A., Drakaki, E., Ryder, C. L., Marenco, F., Marinou, E., and Amiridis, V.: A near-global multiyear climate data record of the fine-mode and coarse-mode components of atmospheric pure dust, Atmos. Meas. Tech., 17, 3625–3667, https://doi.org/10.5194/amt-17-3625-2024, 2024. a
Ridley, D., Heald, C., and Ford, B.: North African dust export and deposition: A satellite and model perspective, J. Geophys. Res., 117, D02202, https://doi.org/10.1029/2011JD016794, 2012. a
Rodgers, C. D.: Inverse Methods for Atmospheric Sounding: Theory and Practice, Vol. 2 of Series on Atmospheric, Oceanic and Planetary Physics, WORLD SCIENTIFIC, ISBN 978-981-02-2740-1, 978-981-281-371-8, https://doi.org/10.1142/3171, 2000. a, b, c
Saito, M., Yang, P., Ding, J., and Liu, X.: A Comprehensive Database of the Optical Properties of Irregular Aerosol Particles for Radiative Transfer Simulations, J. Atmos. Sci., 78, 2089–2111, https://doi.org/10.1175/JAS-D-20-0338.1, 2021. a
Saunders, R., Hocking, J., Rundle, D., Rayer, P., Havemann, S., Matricardi, M., Geer, A., Lupu, C., Brunel, P., and Vidot, J.: RTTOV-12 SCIENCE AND VALIDATION REPORT (NWPSAF-MO-TV-41), https://nwp-saf.eumetsat.int/site/download/documentation/rtm/docs_rttov12/rttov12_svr.pdf (last access: 17 July 2026), 2017. a
Saunders, R., Hocking, J., Turner, E., Rayer, P., Rundle, D., Brunel, P., Vidot, J., Roquet, P., Matricardi, M., Geer, A., Bormann, N., and Lupu, C.: An update on the RTTOV fast radiative transfer model (currently at version 12), Geosci. Model Dev., 11, 2717–2737, https://doi.org/10.5194/gmd-11-2717-2018, 2018. a
Saunders, R., Hocking, J., Turner, E., Geer, A., Lupu, C., and Vidot, J.: RTTOV-13 SCIENCE AND VALIDATION REPORT, Tech. rep., EUMETSAT Satellite Application Facility on Numerical Weather Prediction (NWP SAF), https://nwp-saf.eumetsat.int/site/download/documentation/rtm/docs_rttov13/rttov13_svr.pdf (last access: 17 July 2026), 2020. a, b, c, d
Sinyuk, A., Holben, B. N., Eck, T. F., Giles, D. M., Slutsker, I., Korkin, S., Schafer, J. S., Smirnov, A., Sorokin, M., and Lyapustin, A.: The AERONET Version 3 aerosol retrieval algorithm, associated uncertainties and comparisons to Version 2, Atmos. Meas. Tech., 13, 3375–3411, https://doi.org/10.5194/amt-13-3375-2020, 2020. a
Sokolik, I. N.: The spectral radiative signature of wind-blown mineral dust: Implications for remote sensing in the thermal IR region, Geophys. Res. Lett., 29, 71–74, https://doi.org/10.1029/2002GL015910, 2002. a
Song, Q., Zhang, Z., Yu, H., Kato, S., Yang, P., Colarco, P., Remer, L. A., and Ryder, C. L.: Net radiative effects of dust in the tropical North Atlantic based on integrated satellite observations and in situ measurements, Atmos. Chem. Phys., 18, 11303–11322, https://doi.org/10.5194/acp-18-11303-2018, 2018. a
Song, Q., Zhang, Z., Yu, H., Ginoux, P., and Shen, J.: Global dust optical depth climatology derived from CALIOP and MODIS aerosol retrievals on decadal timescales: regional and interannual variability, Atmos. Chem. Phys., 21, 13369–13395, https://doi.org/10.5194/acp-21-13369-2021, 2021. a
Stein, A. F., Draxler, R. R., Rolph, G. D., Stunder, B. J. B., Cohen, M. D., and Ngan, F.: NOAA’s HYSPLIT Atmospheric Transport and Dispersion Modeling System, B. Am. Meteorol. Soc., 96, 2059–2077, https://doi.org/10.1175/BAMS-D-14-00110.1, 2015. a
Tesche, M., Ansmann, A., Müller, D., Althausen, D., Engelmann, R., Freudenthaler, V., and Groß, S.: Vertically resolved separation of dust and smoke over Cape Verde using multiwavelength Raman and polarization lidars during Saharan Mineral Dust Experiment 2008, J. Geophys. Res.-Atmos., 114, https://doi.org/10.1029/2009JD011862, 2009. a
Textor, C., Schulz, M., Guibert, S., Kinne, S., Balkanski, Y., Bauer, S., Berntsen, T., Berglen, T., Boucher, O., Chin, M., Dentener, F., Diehl, T., Easter, R., Feichter, H., Fillmore, D., Ghan, S., Ginoux, P., Gong, S., Grini, A., Hendricks, J., Horowitz, L., Huang, P., Isaksen, I., Iversen, I., Kloster, S., Koch, D., Kirkevåg, A., Kristjansson, J. E., Krol, M., Lauer, A., Lamarque, J. F., Liu, X., Montanaro, V., Myhre, G., Penner, J., Pitari, G., Reddy, S., Seland, Ø., Stier, P., Takemura, T., and Tie, X.: Analysis and quantification of the diversities of aerosol life cycles within AeroCom, Atmos. Chem. Phys., 6, 1777–1813, https://doi.org/10.5194/acp-6-1777-2006, 2006. a
Vandenbussche, S. and De Mazière, M.: Vertical Profiles of Mineral Dust Aerosols from IASI (MAPIR algorithm version 5.11), Royal Belgian Institute for Space Aeronomy [data set], https://doi.org/10.18758/f7el2zbr, 2025. a
Vandenbussche, S., Langerock, B., Vigouroux, C., Buschmann, M., Deutscher, N. M., Feist, D. G., García, O., Hannigan, J. W., Hase, F., Kivi, R., Kumps, N., Makarova, M., Millet, D. B., Morino, I., Nagahama, T., Notholt, J., Ohyama, H., Ortega, I., Petri, C., Rettinger, M., Schneider, M., Servais, C. P., Sha, M. K., Shiomi, K., Smale, D., Strong, K., Sussmann, R., Té, Y., Velazco, V. A., Vrekoussis, M., Warneke, T., Wells, K. C., Wunch, D., Zhou, M., and Mazière, M. D.: Nitrous Oxide Profiling from Infrared Radiances (NOPIR): Algorithm Description, Application to 10 Years of IASI Observations and Quality Assessment, Remote Sensing, 14, 1810, https://doi.org/10.3390/rs14081810, 2022. a
Voudouri, K. A., Siomos, N., Michailidis, K., Papagiannopoulos, N., Mona, L., Cornacchia, C., Nicolae, D., and Balis, D.: Comparison of two automated aerosol typing methods and their application to an EARLINET station, Atmos. Chem. Phys., 19, 10961–10980, https://doi.org/10.5194/acp-19-10961-2019, 2019. a
Winker, D. M., Vaughan, M. A., Omar, A., Hu, Y., Powell, K. A., Liu, Z., Hunt, W. H., and Young, S. A.: Overview of the CALIPSO Mission and CALIOP Data Processing Algorithms, J. Atmos. Ocean. Technol., 26, 2310–2323, https://doi.org/10.1175/2009JTECHA1281.1, 2009. a
Winker, D. M., Tackett, J. L., Getzewich, B. J., Liu, Z., Vaughan, M. A., and Rogers, R. R.: The global 3-D distribution of tropospheric aerosols as characterized by CALIOP, Atmos. Chem. Phys., 13, 3345–3361, https://doi.org/10.5194/acp-13-3345-2013, 2013. a
Xie, X., Liu, X., Che, H., Xie, X., Li, X., Shi, Z., Wang, H., Zhao, T., and Liu, Y.: Radiative feedbacks of dust in snow over eastern Asia in CAM4-BAM, Atmos. Chem. Phys., 18, 12683–12698, https://doi.org/10.5194/acp-18-12683-2018, 2018. a
Zender, C. S., Miller, R. L. L., and Tegen, I.: Quantifying mineral dust mass budgets:Terminology, constraints, and current estimates, Eos, T. Am. Geophys. Union, 85, 509–512, https://doi.org/10.1029/2004EO480002, 2004. a
Zhang, X., Zhao, L., Tong, D., Wu, G., Dan, M., and Teng, B.: A Systematic Review of Global Desert Dust and Associated Human Health Effects, Atmosphere, 7, 158, https://doi.org/10.3390/atmos7120158, 2016. a
Zheng, J., Yu, H., Zhou, Y., Shi, Y., Zhang, Z., Di Biagio, C., Formenti, P., and Smirnov, A.: A novel retrieval of global dust optical depth and effective diameter based on MODIS thermal infrared observations, Remote Sens. Environ., 332, 115083, https://doi.org/10.1016/j.rse.2025.115083, 2026. a, b
Zhou, D. K., Larar, A. M., Liu, X., Smith, W. L., Strow, L. L., Yang, P., Schlussel, P., and Calbet, X.: Global Land Surface Emissivity Retrieved From Satellite Ultraspectral IR Measurements, IEEE T. Geosci. Remote Sens., 49, 1277–1290, https://doi.org/10.1109/TGRS.2010.2051036, 2011. a, b
- Abstract
- Introduction
- MAPIR retrievals
- Capability demonstration and evaluation
- Conclusions
- Appendix A: List of used AERONET stations and correlation coefficient with MAPIR IASI
- Data availability
- Author contributions
- Competing interests
- Disclaimer
- Special issue statement
- Acknowledgements
- Financial support
- Review statement
- References
- Abstract
- Introduction
- MAPIR retrievals
- Capability demonstration and evaluation
- Conclusions
- Appendix A: List of used AERONET stations and correlation coefficient with MAPIR IASI
- Data availability
- Author contributions
- Competing interests
- Disclaimer
- Special issue statement
- Acknowledgements
- Financial support
- Review statement
- References