the Creative Commons Attribution 4.0 License.
the Creative Commons Attribution 4.0 License.
 | 21 Jan 2026
Validation of SNPP OMPS limb profiler version 2.6 ozone profile retrievals against correlative satellite and ground based measurements
Nigel A. D. Richards
Natalya A. Kramarova
Stacey M. Frith
Sean M. Davis
The Ozone Mapping and Profiler Suite Limb Profiler (OMPS LP) was launched onboard the Suomi National Polar-orbiting Partnership (SNPP) satellite in 2011 and began routine science operations in April 2012. The OMPS LP uses measurements of scattered solar radiation in the ultraviolet, visible and near infrared wavelengths to retrieve high vertical resolution profiles of ozone from 12 km (or cloud tops) up to 57 km. In mid-2023, version 2.6 of the OMPS LP ozone profile retrievals was released, featuring improvements in calibration, retrieval algorithm, and data quality. We evaluate OMPS LP version 2.6 ozone retrievals using correlative data from other satellite instruments and ground based data for the period April 2012 to April 2024. Our results show agreement between OMPS LP and all correlative data sources between 20 and 50 km at all latitudes with differences of less than 10 %, with OMPS generally exhibiting a negative bias, except between 32 and 38 km in the tropics and southern mid-latitudes, where the bias is positive. In the tropics and southern mid-latitudes the differences between OMPS LP and MLS, and OMPS LP and SAGE III/ISS are less than ±5 % between 20 and 45 km. Above 50 km, the agreement with MLS is still on the order of −5 % or better. Larger positive biases, up to ∼ 35 %, are seen in the upper troposphere lower stratosphere layer (∼ 15 to 20 km) between approximately 40° S and 40° N. We find that OMPS version 2.6 ozone exhibits the same seasonal cycle as compared to all correlative measurement sources and our analysis shows that there is no significant seasonal bias in OMPS LP. We find drifts relative to correlative observations at all latitude bands of less than ±2 % per decade (±1 % per decade) between 25 and 50 km for the 2012–2024 period, with larger drifts above 50 km and below 20 km. These drifts vary between correlative measurements and straddle the zero line, we therefore conclude that there is no significant systematic drift in OMPS LP version 2.6 ozone for the period 2012 to 2024. The drift results represent an improvement in the long term stability of version 2.6 ozone over that of version 2.5.
- Article
(8030 KB) - Full-text XML
-
Supplement
(2029 KB) - BibTeX
- EndNote


Stratospheric ozone is crucial for life on Earth as it acts as a protective layer absorbing harmful UV radiation. In 1985, the discovery of the Antarctic ozone hole (Farman et al., 1985) caused global public safety concerns, ultimately leading to the establishment of the Montreal Protocol in 1987. The regulations imposed by the Montreal Protocol have led to a slow recovery in upper stratospheric ozone over the 2000–2020 period. Measurements show a positive trend in upper stratospheric ozone in the range of 1.5 % per decade to 2.2 % per decade outside of the polar regions at mid-latitudes in both hemispheres and 1.1 % per decade 1.6 % per decade in the tropics (WMO, 2022b; Godin-Beekmann et al., 2022; SPARC/IO3C/GAW, 2019). These increases are consistent with model simulations showing that they arise from a combination of decreasing ozone-depleting substances concentrations and upper-stratospheric temperatures, driven by increasing CO2 (WMO, 2022b). Conversely, there has been an observed decrease in lower stratospheric ozone in the mid-latitudes since 1998 which is mainly driven by natural atmospheric variability and transport processes (Benito-Barca et al., 2025), this leads to insignificant trends in total column ozone in some regions such as the northern mid-latitudes. There is also evidence from both observations and models for a small decrease in tropical lower stratospheric ozone over the same period of 1 % per decade to 2 % per decade. This decrease has a large uncertainty of ±5 % per decade, but is consistent with climate change-driven acceleration of the large-scale circulation and has a small impact on total column ozone (WMO, 2022b).
In order to detect such ozone changes, and to continue to monitor the health of the ozone layer, long term, vertically resolved, global observations of stratospheric ozone are needed. The NOAA/NASA Ozone Mapping and Profiler Suite (OMPS) sensors are a series of satellite instruments that are designed to meet this need by providing both total ozone and profile measurements (Flynn et al., 2006). The OMPS consists of three different sensors: a nadir mapper (OMPS NM), a nadir profiler (OMPS NP) and a limb profiler (OMPS LP). The first OMPS was launched onboard the Suomi National Polar-orbiting Partnership (SNPP) satellite in 2011 and consisted of all three OMPS sensors (Kramarova et al., 2014). The second was launched onboard NOAA-20 in 2017 with just the NM and NP on board, and the third, which again consisted of all three sensors, was launched onboard NOAA-21 in 2022. Two more OMPS containing all 3 sensors will be launched in the next decade providing decades of continuous ozone observations.
The validation of remotely sensed observations is crucial, not only to give confidence in scientific conclusions drawn from their use, but to also build community trust in the data and thus encourage their wider use. For this reason, we need to compare the retrieved data to as many different sources of correlative observations as are available to us. In this study we validate OMPS LP version 2.6 ozone retrievals against ozone profile data from two solar occultation satellite instruments (SAGE III/ISS and ACE-FTS), limb emission satellite Aura MLS, the nadir viewing satellite OMPS NP, a set of ground-based ozonesondes, and the lidar at Mauna-Loa.
The Ozone Mapping and Profiler Suite Limb Profiler (OMPS LP) is a series of satellite sensors that perform limb measurements of scattered solar radiation in the ultraviolet, visible and near infrared wavelengths (290 to 1000 nm) (Kramarova et al., 2014) which allow for the retrieval of ozone profiles from the top of clouds up to 57 km. In order to increase the cross-track coverage, the OMPS LP instrument has three observation slits separated horizontally by 4.25° (∼ 250 km), but in this study, we only consider measurements from the center (nadir) slit, as this is the data that is currently released to the public (Kramarova, 2023). The first OMPS LP was launched onboard the SNPP satellite in October 2011 and began operational observations in April 2012, it is this instrument that will be the focus of this paper.
OMPS LP ozone profile retrievals are described in Rault and Loughman (2013) and Kramarova et al. (2018). Recently the retrieval algorithm was updated from version 2.5 to version 2.6. Several incremental improvements were made, as detailed in Kramarova et al. (2024), which include updated level 1 calibrations, an updated level 2 retrieval algorithm (including combining the UV and visible channels into a single retrieval) and improved data quality for OMPS LP version 2.6 ozone profile retrievals over version 2.5. A filter was also introduced to remove profiles affected by the Hunga Tonga eruption in 2022-2023. This filter is based on retrieved aerosol extinction and results in gaps in OMPS LP ozone observations in the lower stratosphere (12.5–22.5 km) in the southern midlatitudes and tropics (45° S–20° N) that persist for several months after the eruption.
Validation of version 2.5 showed mean differences with correlative measurements of less than ±10 % between 18 and 42 km, with a negative bias above 43 km and larger biases in the lower stratosphere and upper troposphere; there was also a positive drift of ∼ 0.5 % yr−1 which was more pronounced above 35 km (Kramarova et al., 2018). Comparisons of version 2.6 retrievals with Aura MLS by Kramarova et al. (2024) found that the algorithm improvements have helped to reduce vertical oscillation seen in version 2.5 and negative biases above 45 km have been reduced. Mean biases compared to MLS are within ±10 % above 20 km and in many places less than ±5 %; there has also been a reduction in the relative drifts between OMPS LP and MLS to less than 0.2 % yr−1 in the upper stratosphere above 35 km (Kramarova et al., 2024).
This study focuses on the validation of OMPS LP version 2.6 ozone profile retrievals for the period April 2012 to April 2024. All OMPS LP data have been filtered using the suggested quality flags as described in the dataset readme document (Kramarova and DeLand, 2023).
SNPP OMPS LP version 2.6 profiles have previously been compared to MLS (Kramarova et al., 2024). Since MLS will be decommissioned in the coming year we need to investigate alternative sources of correlative data with which to validate OMPS LP ozone profiles. This study builds on Kramarova et al. (2024) which compared OMPS LP version 2.6 to MLS for the period 2012–2021 to include other sources of correlative data and extends the evaluation period to April 2024. Ozonesonde observations offer one such dataset, however the geographical, temporal and vertical (up to 30 km) extent of the data is limited. Other satellite data are available, and although solar occultation instruments such as ACE-FTS and SAGE III/ISS may not provide such extensive spatial coverage as MLS, they are able to provide high vertical resolution ozone profiles at different latitude bands throughout the year, providing the opportunity for near global seasonal validation of OMPS LP ozone profiles.
3.1 Ozonesondes
Ozonesondes provide high accuracy, in situ, ozone profile observations from the surface up to approximately 30 km altitude, however the data are spatiotemporally sparse. In this study we use data from 31 ozonesondes sites distributed throughout the globe; Fig. 1 shows a map of sites used and Table S1 in the Supplement lists the site names, data sources, principal investigator names and affiliations. Ozonesonde sites were selected for use based on continuity of data for the OMPS LP measurement evaluation period of April 2012 to April 2024. A recent study by Stauffer et al. (2022), which compared data from a network of 60 ozonesonde stations with satellite data, showed that when compared to Aura OMI, total column ozone was stable to within about ±2 % over an 18-year period, with similar results when compared to three other total column satellite instruments. When compared to MLS, stratospheric ozone from sondes agreed to within ±5 % from 50 to 10 hPa. The study concluded that overall, global ozonesondes network data are of high quality and stability.
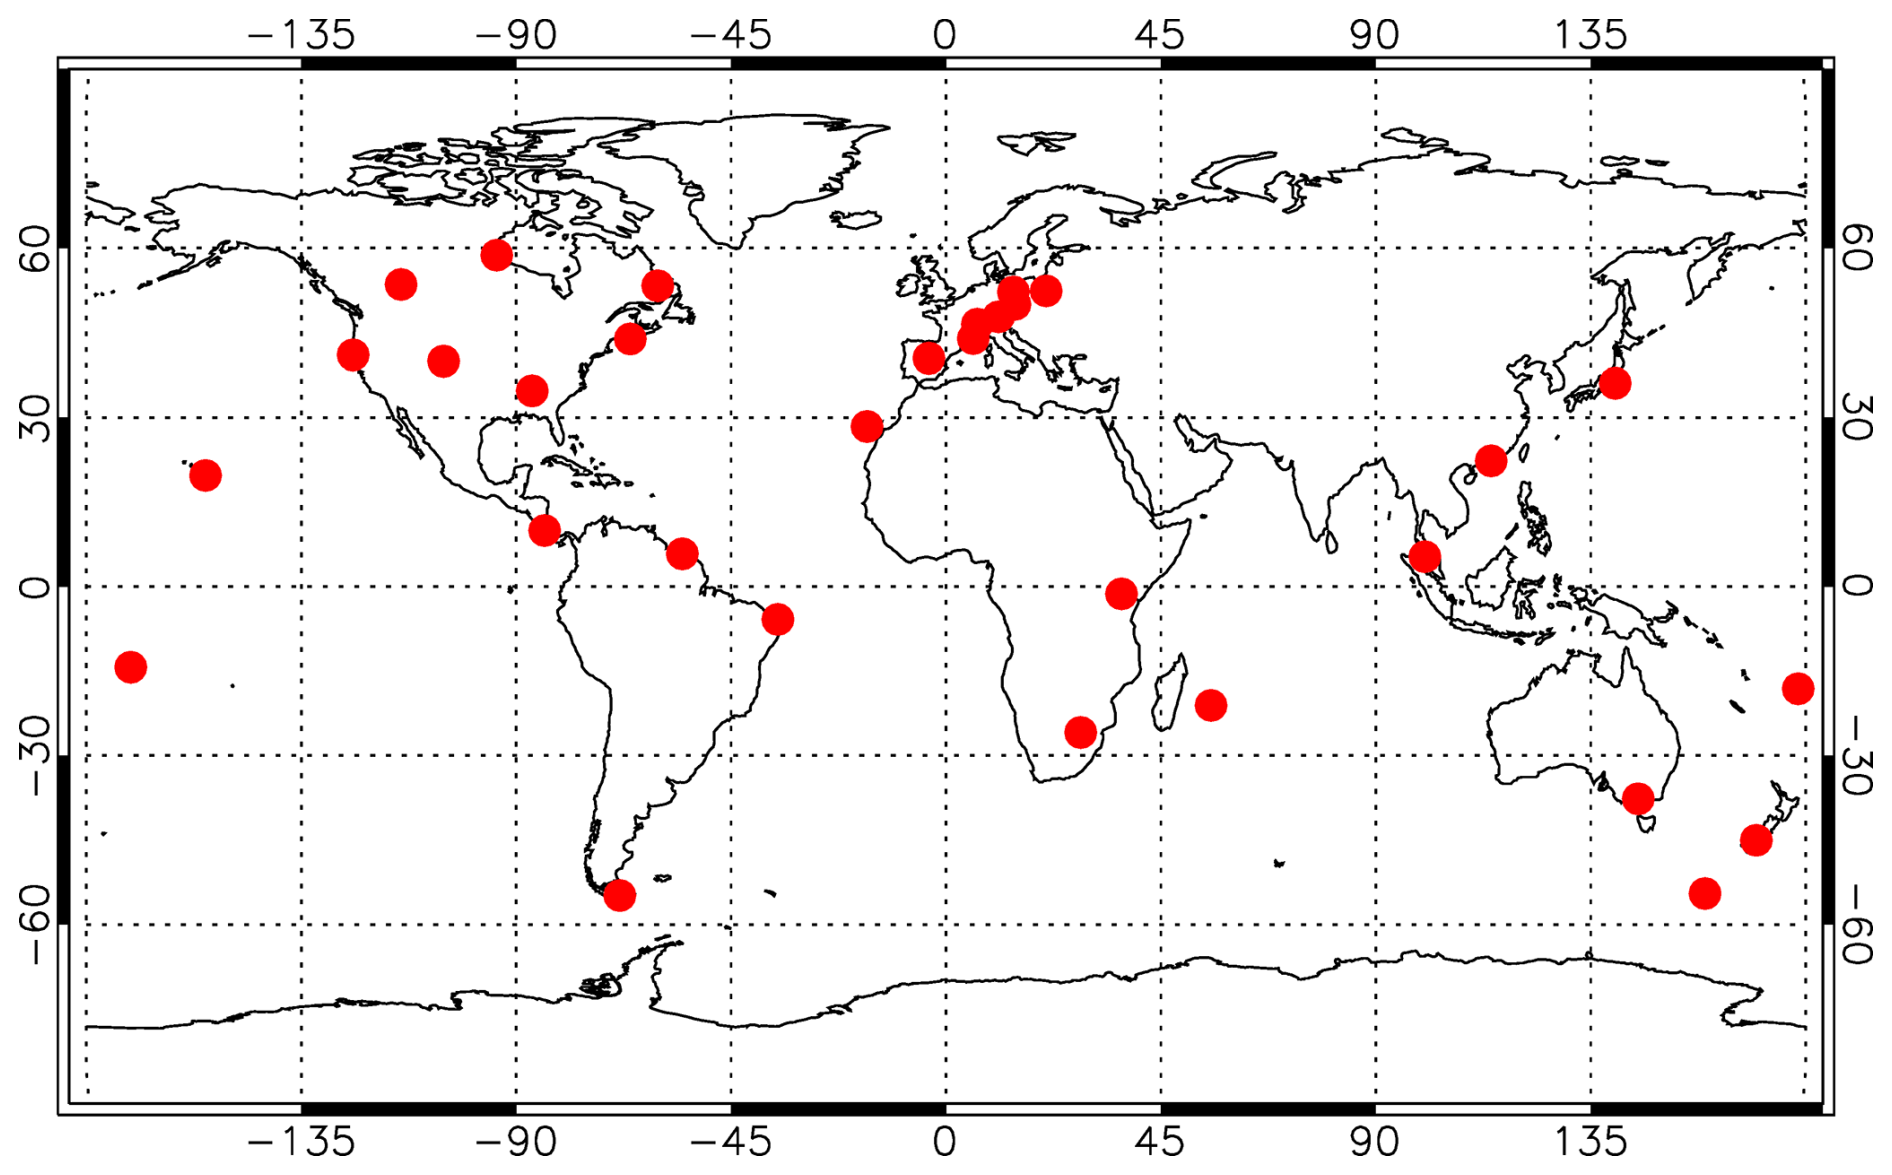
Figure 1Location of ozonesondes sites used for validation of SNPP OMPS LP version 2.6 ozone retrievals.
3.2 ACE-FTS
The Atmospheric Chemistry Experiment-Fourier Transform Spectrometer (ACE-FTS), is a solar occultation satellite instrument that makes measurements of ozone and other trace gases at sunrise and sunset (Bernath et al., 2005; Bernath, 2017). ACE-FTS was launched onboard the Canadian Space Agency's SCISAT-1 satellite in 2003 and therefore provides correlative data for the entire SNPP OMPS LP record. In this study we use ACE-FTS data version 5.2 (Bernath et al., 2025) and apply the quality flags of Sheese and Walker (2023). We only use observations co-located with OMPS measurements (see Sect. 4), and since ACE-FTS only measures at sunset and sunrise, and its orbit is optimized to provide coverage over polar mid and high latitudes, there are a limited number of co-located profiles to use for the comparison with global OMPS LP observations, see Fig. 2. ACE-FTS version 5.2 ozone retrievals have been validated against ozonesonde observations in a study by Zuo et al. (2024). These results show that ACE-FTS ozone profiles have a general high bias in the stratosphere increasing with altitude up to ∼ 10 % at ∼ 30 km, with generally small insignificant drifts in the stratosphere (0 % per decade to 3 % per decade). Comparisons with ozonesondes only extend up to ∼ 30 km, for higher altitudes, only previous versions have been validated against other satellite instruments. Validation of ACE-FTS version 4.1 profiles shows that ACE-FTS ozone has a positive bias of 2 %–9 % in the middle stratosphere that is stable to ±0.5 % per decade, and a positive bias in the upper stratosphere that increases with altitude up to ∼ 15 % and is stable to within ±1 % per decade (Sheese et al., 2022). The estimated precision for version 4.1 ozone retrievals is on the order of ∼ 5 %–10 % (Sheese et al., 2022).
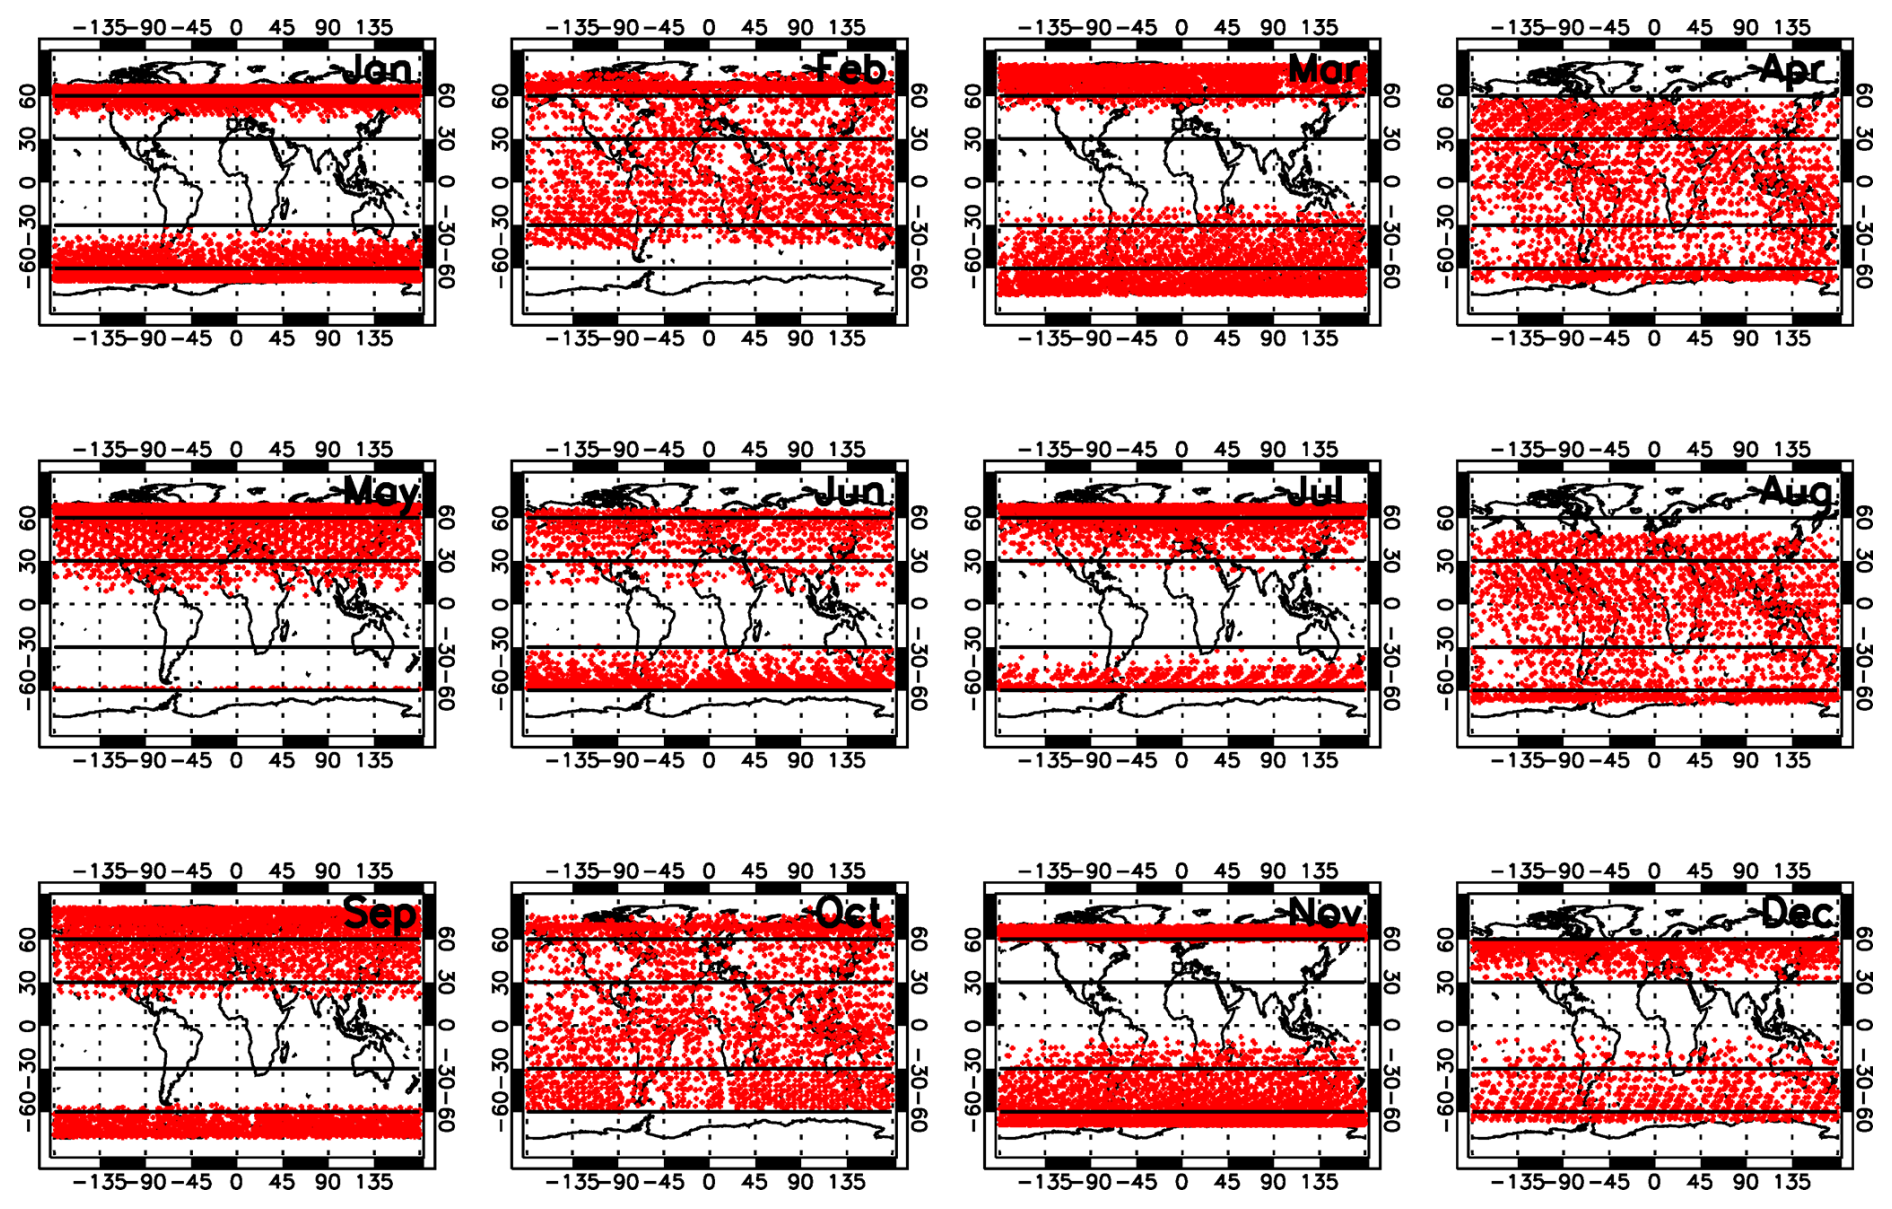
Figure 2Co-located ACE-FTS observations by month for the period 2012–2024.
3.3 SAGE III/ISS
Like ACE-FTS, the Stratospheric Aerosol and Gas Experiment (SAGE) III, is a solar occultation instrument that makes measurements of ozone profiles at sunrise and sunset (Cisewski et al., 2014). SAGE III/ISS was docked to the International Space Station (ISS) in 2017 and began collecting data in June, thus providing nearly 8 years of correlative data to compare with OMPS LP. In this study we use SAGE III/ISS ozone data version 6.0 (SAGE III/ISS Data Products User's Guide, 2025). Owing to the fact that SAGE III/ISS is a solar occultation instrument and is on board the ISS, it provides limited global coverage which varies seasonally, does not extend north/south of approximately 70° latitude, and has more frequent sampling of the tropics. Again we only use observations co-located with OMPS measurements (see Sect. 4), therefore, as with ACE-FTS there are a limited number of co-located global profiles with which to compare with OMPS LP, see Fig. 3. The last version of SAGE III/ISS ozone to be validated was v5.1 (Wang et al., 2020). Those results showed that SAGE III/ISS ozone has a precision of ∼ 3 % in the 20–40 km altitude range which degrades due to lower signal-to-noise ratios at higher and lower altitudes, reaching ∼ 10 %–15 % in the upper stratosphere/lower mesosphere (∼ 55 km) and ∼ 20 %–30 % near the tropopause. The mean biases when compared to ozonesondes, lidars and other satellite correlative measurements are less than 5 % for ∼ 15–55 km in the mid-latitudes and ∼ 20–55 km in the tropics, increasing to 10 % near the tropopause and to 15 % at 60 km. Subsequent changes applied in version 5.3 to the ozone retrievals have led to degraded precision (5 % in the mid/lower stratosphere), but increased vertical resolution, a reduction in low-altitude biases and a slight reduction in random noise. Changes made to version 6 have led to an increase in retrieved ozone of around 3 % due to switching to the new ozone absorption coefficients (SAGE III/ISS Data Products User's Guide, 2025).
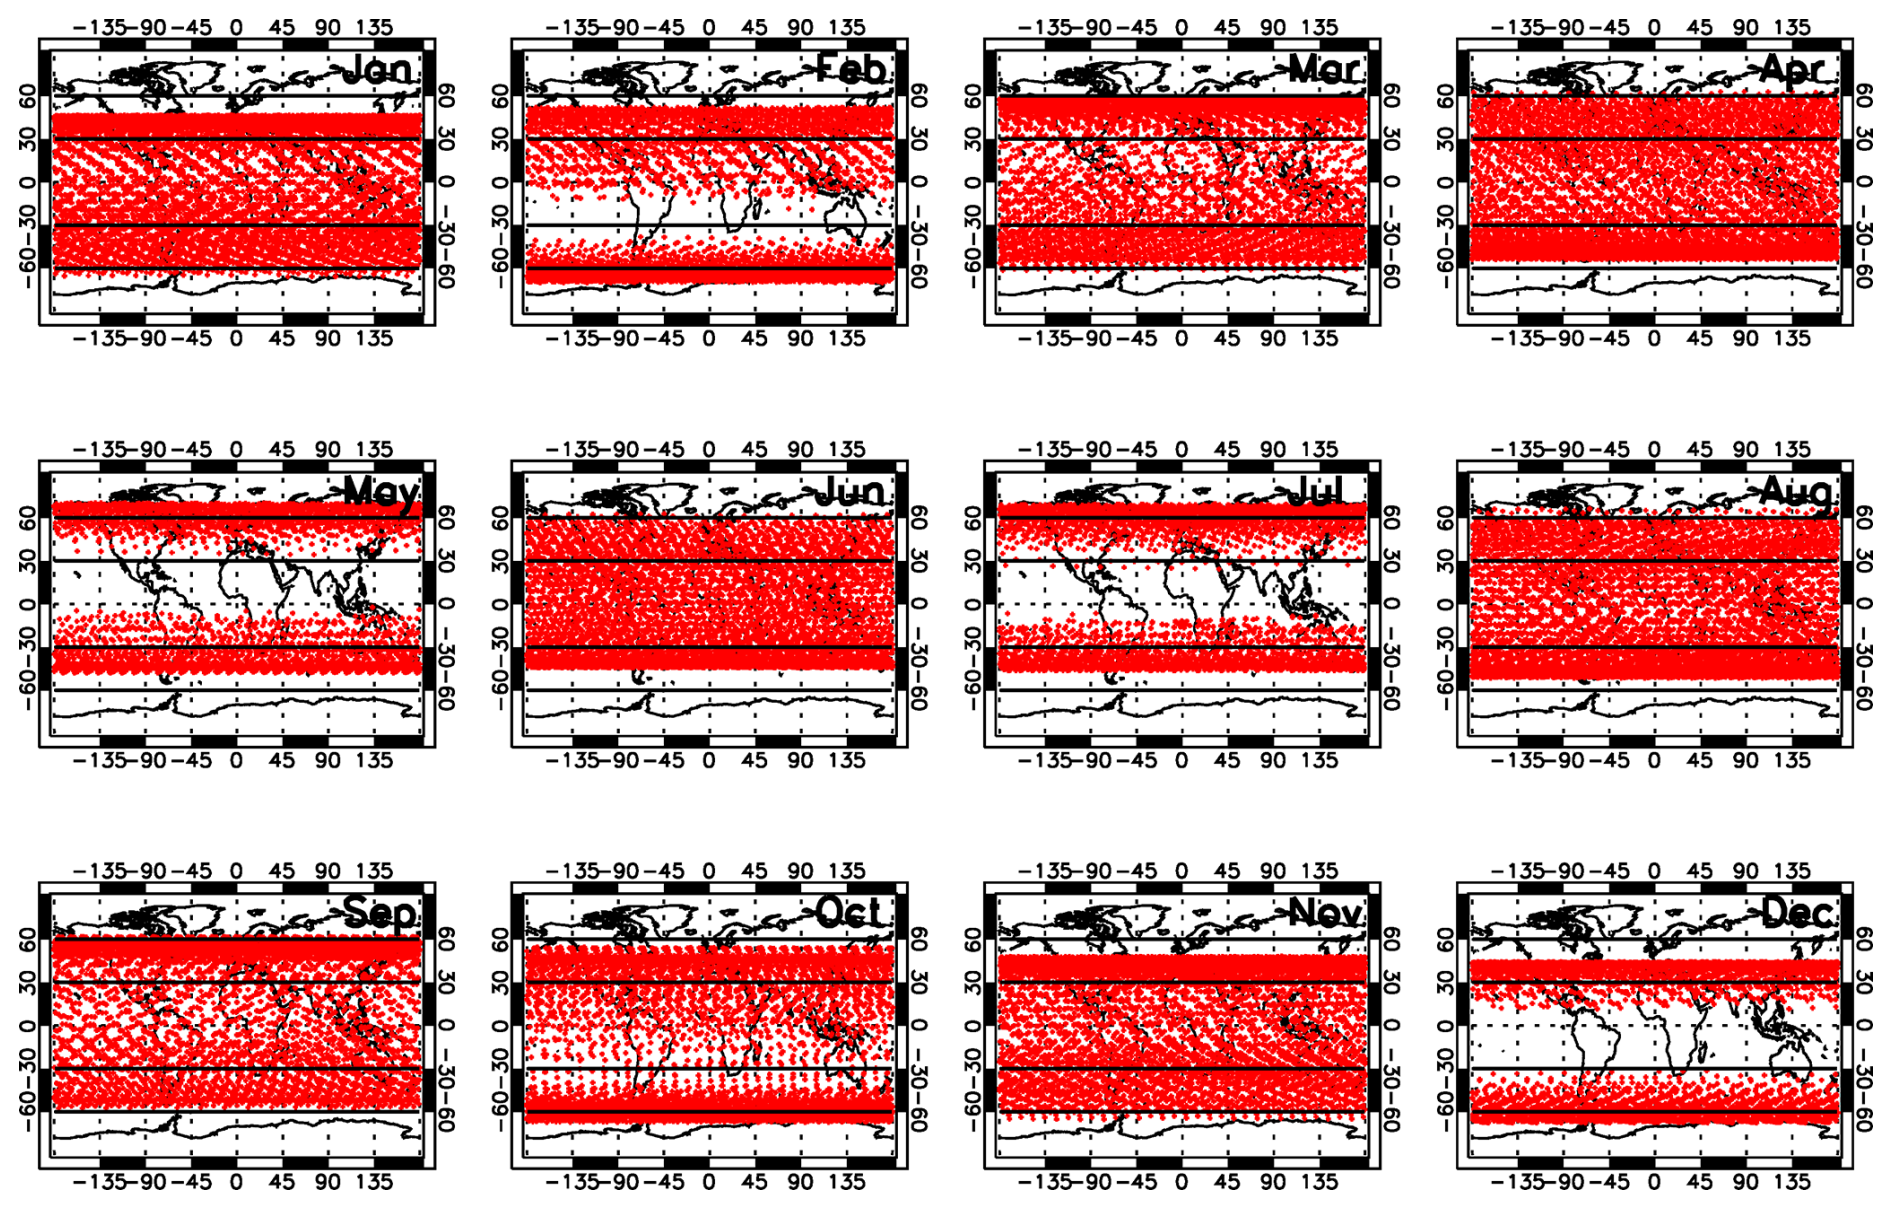
Figure 3Co-located SAGE III/ISS observations by month for the period 2017–2024.
3.4 MLS
The Microwave Limb Sounder (MLS, Waters et al., 2006) provides global profile observations of ozone and other trace species. MLS was launched on board the Aura satellite in 2004 and so provides correlative data for the entire OMPS LP record to date. In this study we use version 5 of MLS data (Livesey et al., 2022). Since OMPS LP only measures during the day, we only use MLS daytime observations, we also filter MLS data using criteria recommended by the MLS Team. Both SNPP and Aura are in similar orbits with very similar equator crossing times and so MLS provides excellent co-located profiles for global comparisons with OMPS LP. MLS ozone profiles have a precision of 2 %–4 % in the 18–43 km altitude range and this rapidly degrades outside of this altitude range (Livesey et al., 2022). The accuracy of MLS ozone profiles ranges from 5 % to 10 % in the 12–57 km altitude range (Livesey et al., 2022), which is the altitude range of interest in this study. MLS exhibits drifts with respect to ground-based networks of 1.5 %–2 % per decade but with zero drift encompassed by the error bars, at least in the middle stratosphere, and so is not statistically significant (Livesey et al., 2022).
In this study we apply common coincidence criteria to all correlative data to match OMPS LP profile sampling. Our spatial coincidence criteria require profiles to be within ±2° latitude and less than 1000 km distance from the OMPS profile. In order to maximise the number of comparison profiles, the only time criterion is that the profiles be on the same day. If more than one profile matches these criteria then the spatially closest profile is used. We analyse all profiles on the native OMPS LP coordinate system (number density/altitude), and do not account for the small differences in the vertical resolution of the different measurement systems. Both MLS and ACE report ozone concentrations in volume mixing ratio, in order to convert this to number density for comparison to OMPS we need temperature and pressure information. For MLS, we use GEOS-FPIT temperature and pressure, and for ACE we use temperature and pressure retrieved by ACE itself. No transformation is needed for SAGE III/ISS or ozonesonde data as these data are provided as ozone number density profiles, however these data are provided on different altitude grids to OMPS LP. Ozonesonde data are converted, where necessary, from volume mixing ratio to number density, and from pressure grids to altitude grids, using the pressures and temperatures reported in the original data files, these are then transformed onto the OMPS LP vertical grid via log-linear interpolation. SAGE III/ISS data are provided on a 0.5 km vertical grid and so no interpolation is needed, we simply select matching altitudes for comparison profiles.
Stratospheric ozone exhibits diurnal variability, particularly above 30 km, which is both seasonally and latitudinally dependent. The OMPS LP is a solar scattering instrument with a 13:30 equatorial crossing time that makes observations in the sunlit portion of the Earth, whereas both ACE-FTS and SAGE III/ISS are solar occultation instruments that measure ozone only at sunrise and sunset. We must therefore take into account the effects of any diurnal changes in ozone between the OMPS LP observations and those of ACE-FTS and SAGE III/ISS. This is achieved through the use of the Goddard Diurnal Ozone Climatology (GDOC) which is used to adjust both ACE-FTS and SAGE III/ISS observations to the measurement time of OMPS LP. Diurnal adjustment using this climatology has been shown to reduce biases above 30 km (Frith et al., 2020).
Initially matched profiles were averaged into 5 degree zonal means for comparison. In addition, owing to limited data coverage from correlative solar occultation satellite observations (see Figs. 2 and 3), the data were further averaged into 3 wide latitude bands to increase the number of observations in each bin for comparison statistics. These bands are 30–60° S, 30° S–30° N and 30–60° N and exclude the polar regions.
5.1 Global profile comparisons
The mean biases for SNPP OMPS LP ozone retrievals compared to matched correlative measurements are shown in Fig. 4. Figure 4a–c show zonal mean biases (5° latitude bins) between OMPS LP, ACE-FTS and MLS as a function of altitude for the period 2012–2024 (2017–2024 for SAGE III/ISS). Figure 4d–f show the mean biases for OMPS LP compared to all correlative measurement sources (ACE-FTS, SAGE III/ISS, MLS and ozonesondes) as a function of altitude for 3 wide latitude bands, averaged over the period 2012–2024 (except SAGE III/ISS, which is 2017–2024). The standard error of the mean for each comparison is also shown as horizontal bars, standard deviations for these comparisons are shown in Fig. S1 in the Supplement. SNPP OMPS LP version 2.6 ozone shows very good agreement with all correlative data sources between ∼ 20 and 50 km at all latitudes, with differences of less than ±10 %, and between 20 and 45 km the differences between OMPS and MLS, and OMPS and SAGE III/ISS are less than 5 % in the tropics and southern mid-latitudes. Above 50 km, at all latitudes, the agreement is still on the order of 10 % or better, but differences with SAGE III/ISS and ACE-FTS start to increase with increasing altitude above 55 km. This is consistent with the SAGE III/ISS and ACE-FTS validation results which show that both instruments have an increasing positive bias in the upper stratosphere (Wang et al., 2020; Sheese et al., 2022). It is worth noting that without applying a diurnal correction to the ACE-FTS and SAGE III/ISS data the biases relative to these datasets are even larger by up to 10 %.
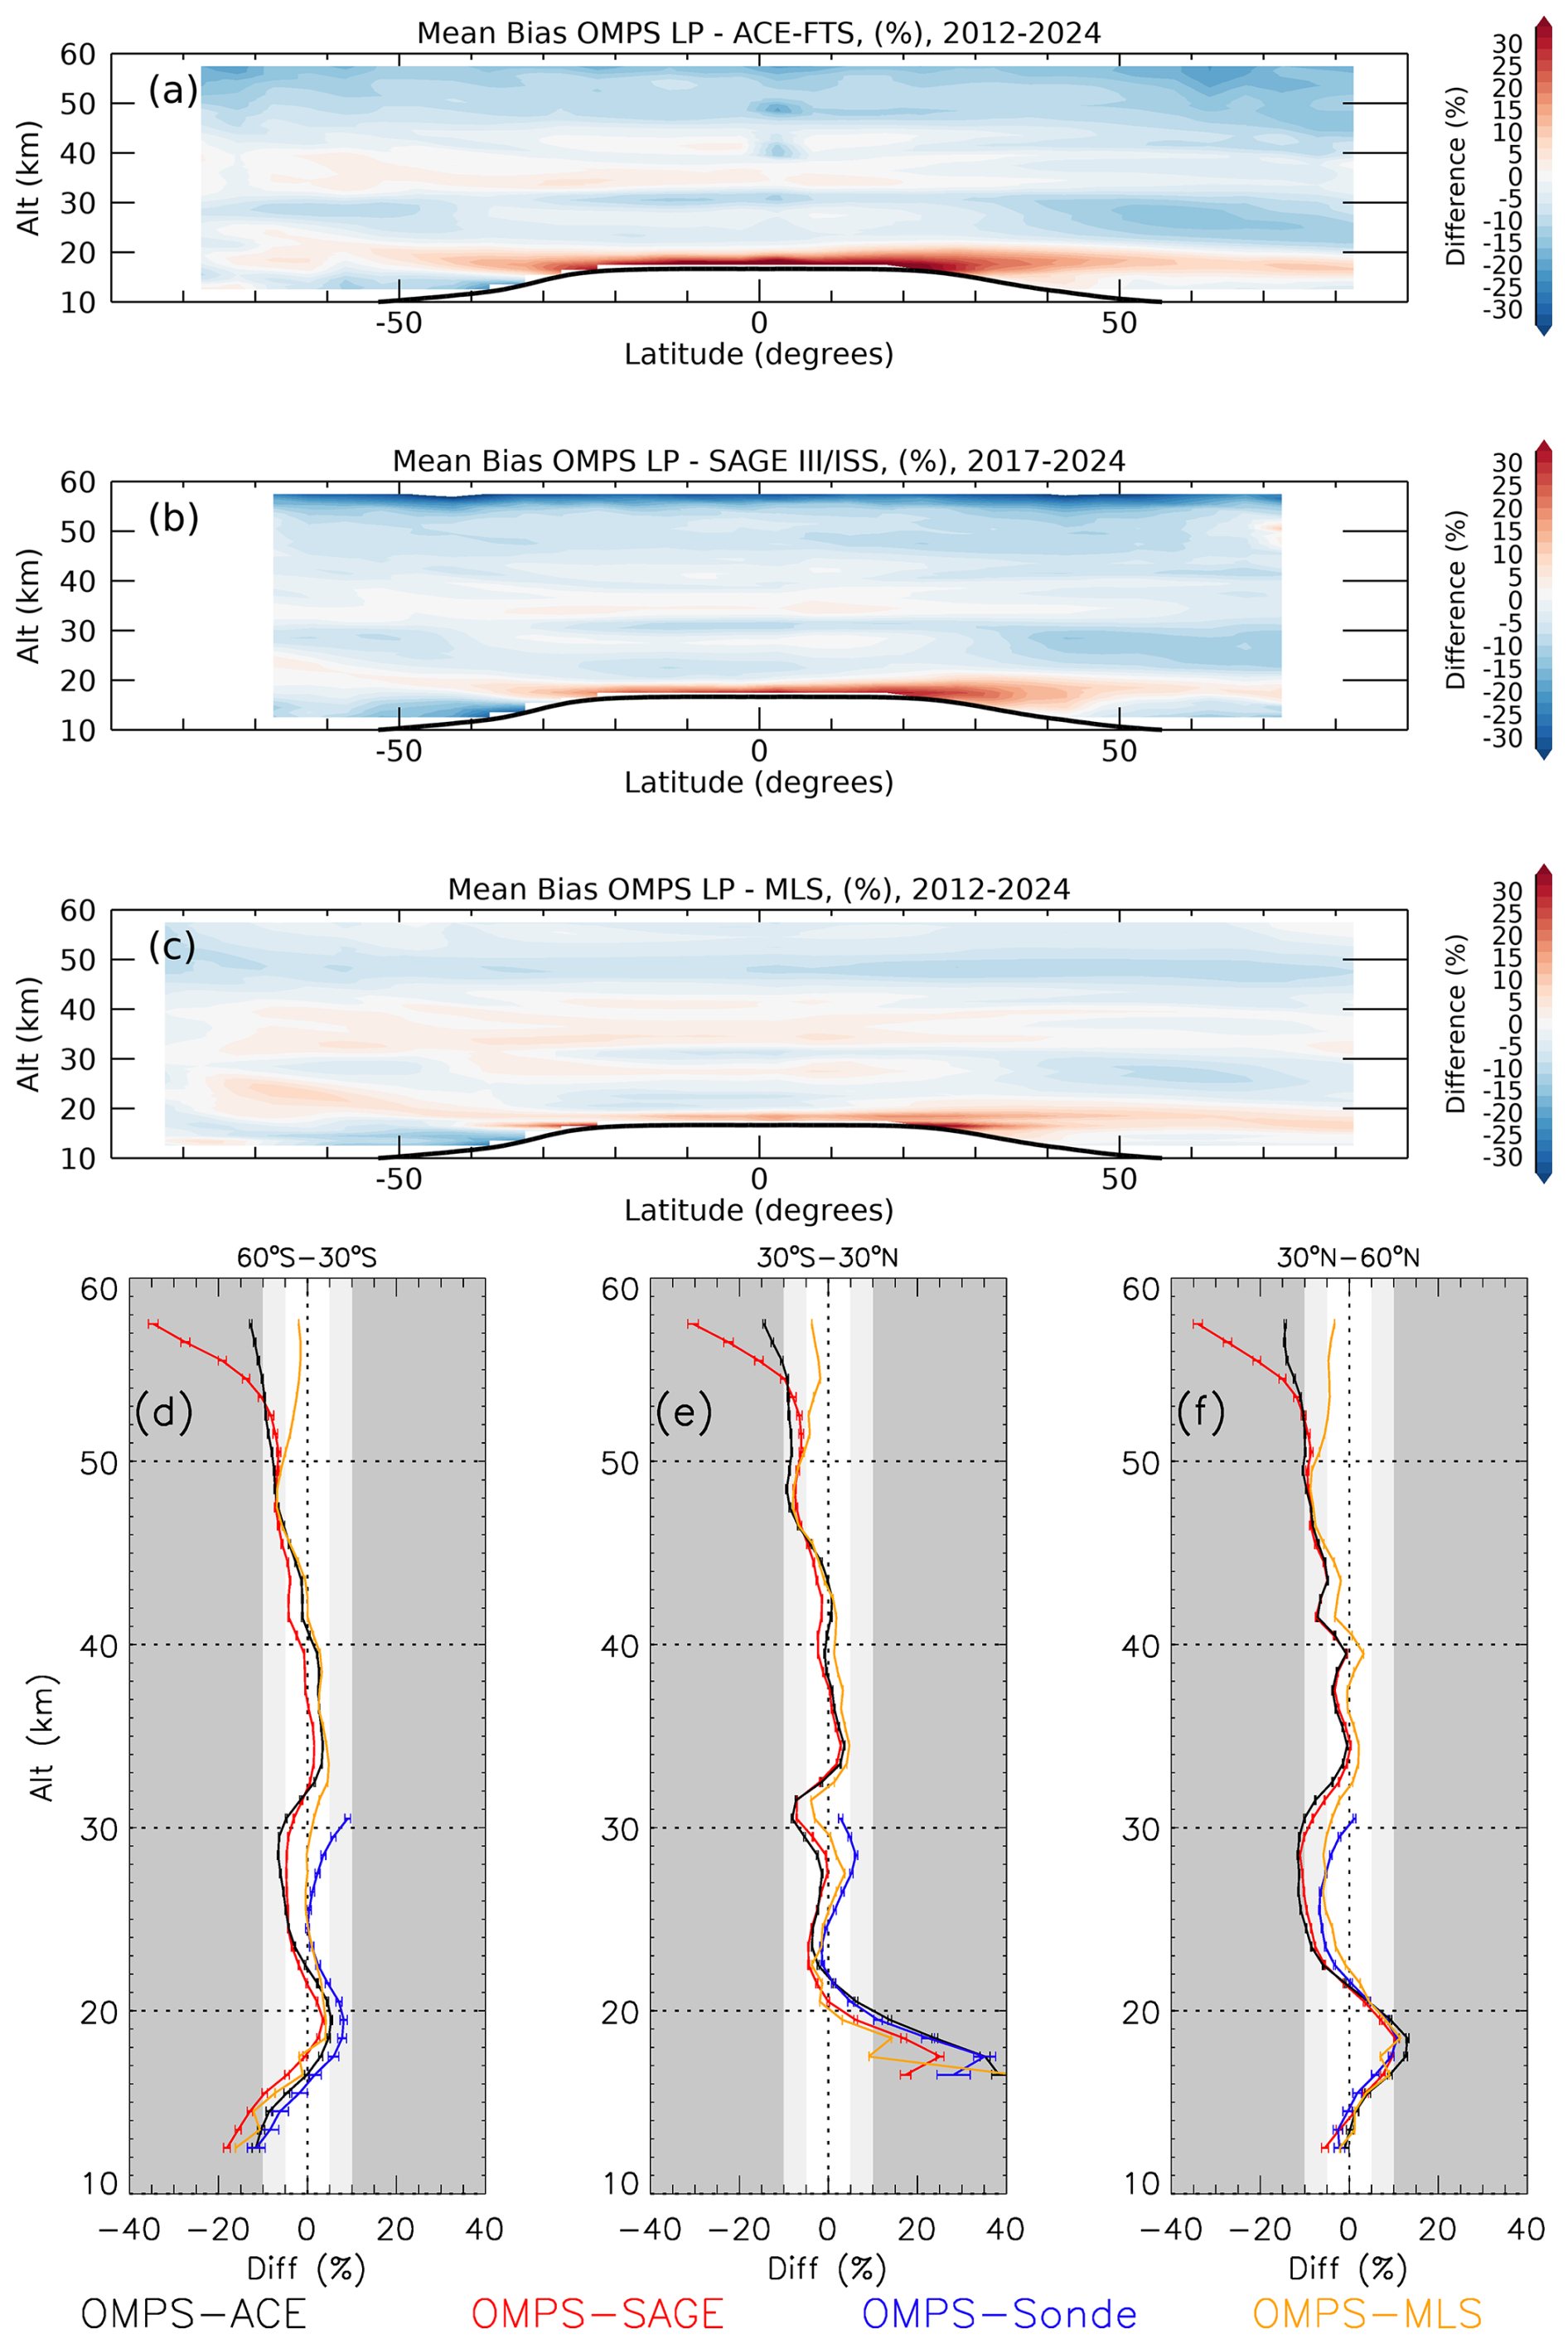
Figure 4Profile differences between OMPS LP and matched correlative satellite and ground-based observations. Panels (a)–(c) show zonal mean differences between OMPS LP and ACE-FTS, OMPS LP and SAGE III/ISS and OMPS LP and MLS on a 5° latitude grid. Panels (d)–(f) show mean profile differences between OMPS LP and ACE-FTS (black), OMPS LP and SAGE III/ISS, OMPS LP and ozonesondes (blue) and OMPS LP and MLS (Orange) for 3 wide latitude bands, the horizontal bars show 2 times the standard error of the mean (SEM), the white area indicates differences less than 5 %, the light grey area 5 %–10 % and the dark grey area represents differences greater than 10 %, only data above the tropopause are shown.
Below 20 km, the agreement between OMPS LP and correlative measurements varies by latitude, with larger positive biases in the Upper Troposphere Lower Stratosphere (UTLS) layer (∼ 15 to 20 km) between approximately 40° S and 40° N. In the southern mid-latitudes OMPS LP agrees to within ∼ 12 % between 12 and 20 km when compared to ACE-FTS, MLS and sondes, but shows slightly larger differences with SAGE III/ISS below 15 km. Below 20 km in the northern mid-latitudes, the biases between OMPS LP and all correlative measurements are comparable, and range from a positive bias of ∼ 10 % at 18 km down to a small negative bias of < 5 % at 12 km.
Overall, SNPP OMPS LP version 2.6 ozone profile biases do exhibit some vertical structure, with negative biases in the lowest part of the profile (< 15 km), followed by a positive bias up to ∼ 20 km, then a negative bias again up to ∼ 32 km, then a positive bias up to 40 km and then negative again above 40 km. This vertical pattern is somewhat latitude dependent, with the low altitude negative bias being stronger in the tropics and southern hemisphere, and the positive bias observed between ∼ 32 and 40 km not present at latitudes north of 40° N. However, almost all the biases when compared to correlative data from other satellite instruments (ACE-FTS, SAGE III/ISS and MLS) fall within the reported biases and precisions of those instruments. These biases represent an improvement over those observed between OMPS LP version 2.5 and MLS, with the largest reduction in biases seen below 31 km, where LP retrievals primarily rely on the visible triplet (Kramarova et al., 2024), there is also a reduction in vertical oscillations seen in version 2.6 compared to version 2.5, particularly where the retrieval switches between UV and visible wavelengths (approximately 28–32 km).
Figure 5 shows vertical profiles of correlation coefficients between OMPS LP and matched correlative observations for 3 wide latitude bands. In the mid-latitudes correlations of approximately 0.9 are seen between OMPS LP and ACE-FTS and OMPS LP and MLS at most altitudes, and approximately 0.8 between OMPS LP and SAGE III/ISS between 15 and 40 km. Above 40 km the correlation with SAGE III/ISS drops rapidly reaching less than 0.5 at around 50 km, indicating a spread in the biases at higher altitudes, this is also evident in the standard deviations of the profile comparisons shown in Fig. S1. This is consistent with degraded precision and increased noise for SAGE III/ISS measurements above 40 km as noted by Wang et al., (2020). It should be noted that, although we interpolate SAGE III/ISS observations from a 0.5 to a 1 km vertical grid, we have not degraded the SAGE III/ISS profiles down to the resolution of OMPS LP, and this may also contribute to the lower correlations at higher altitudes.
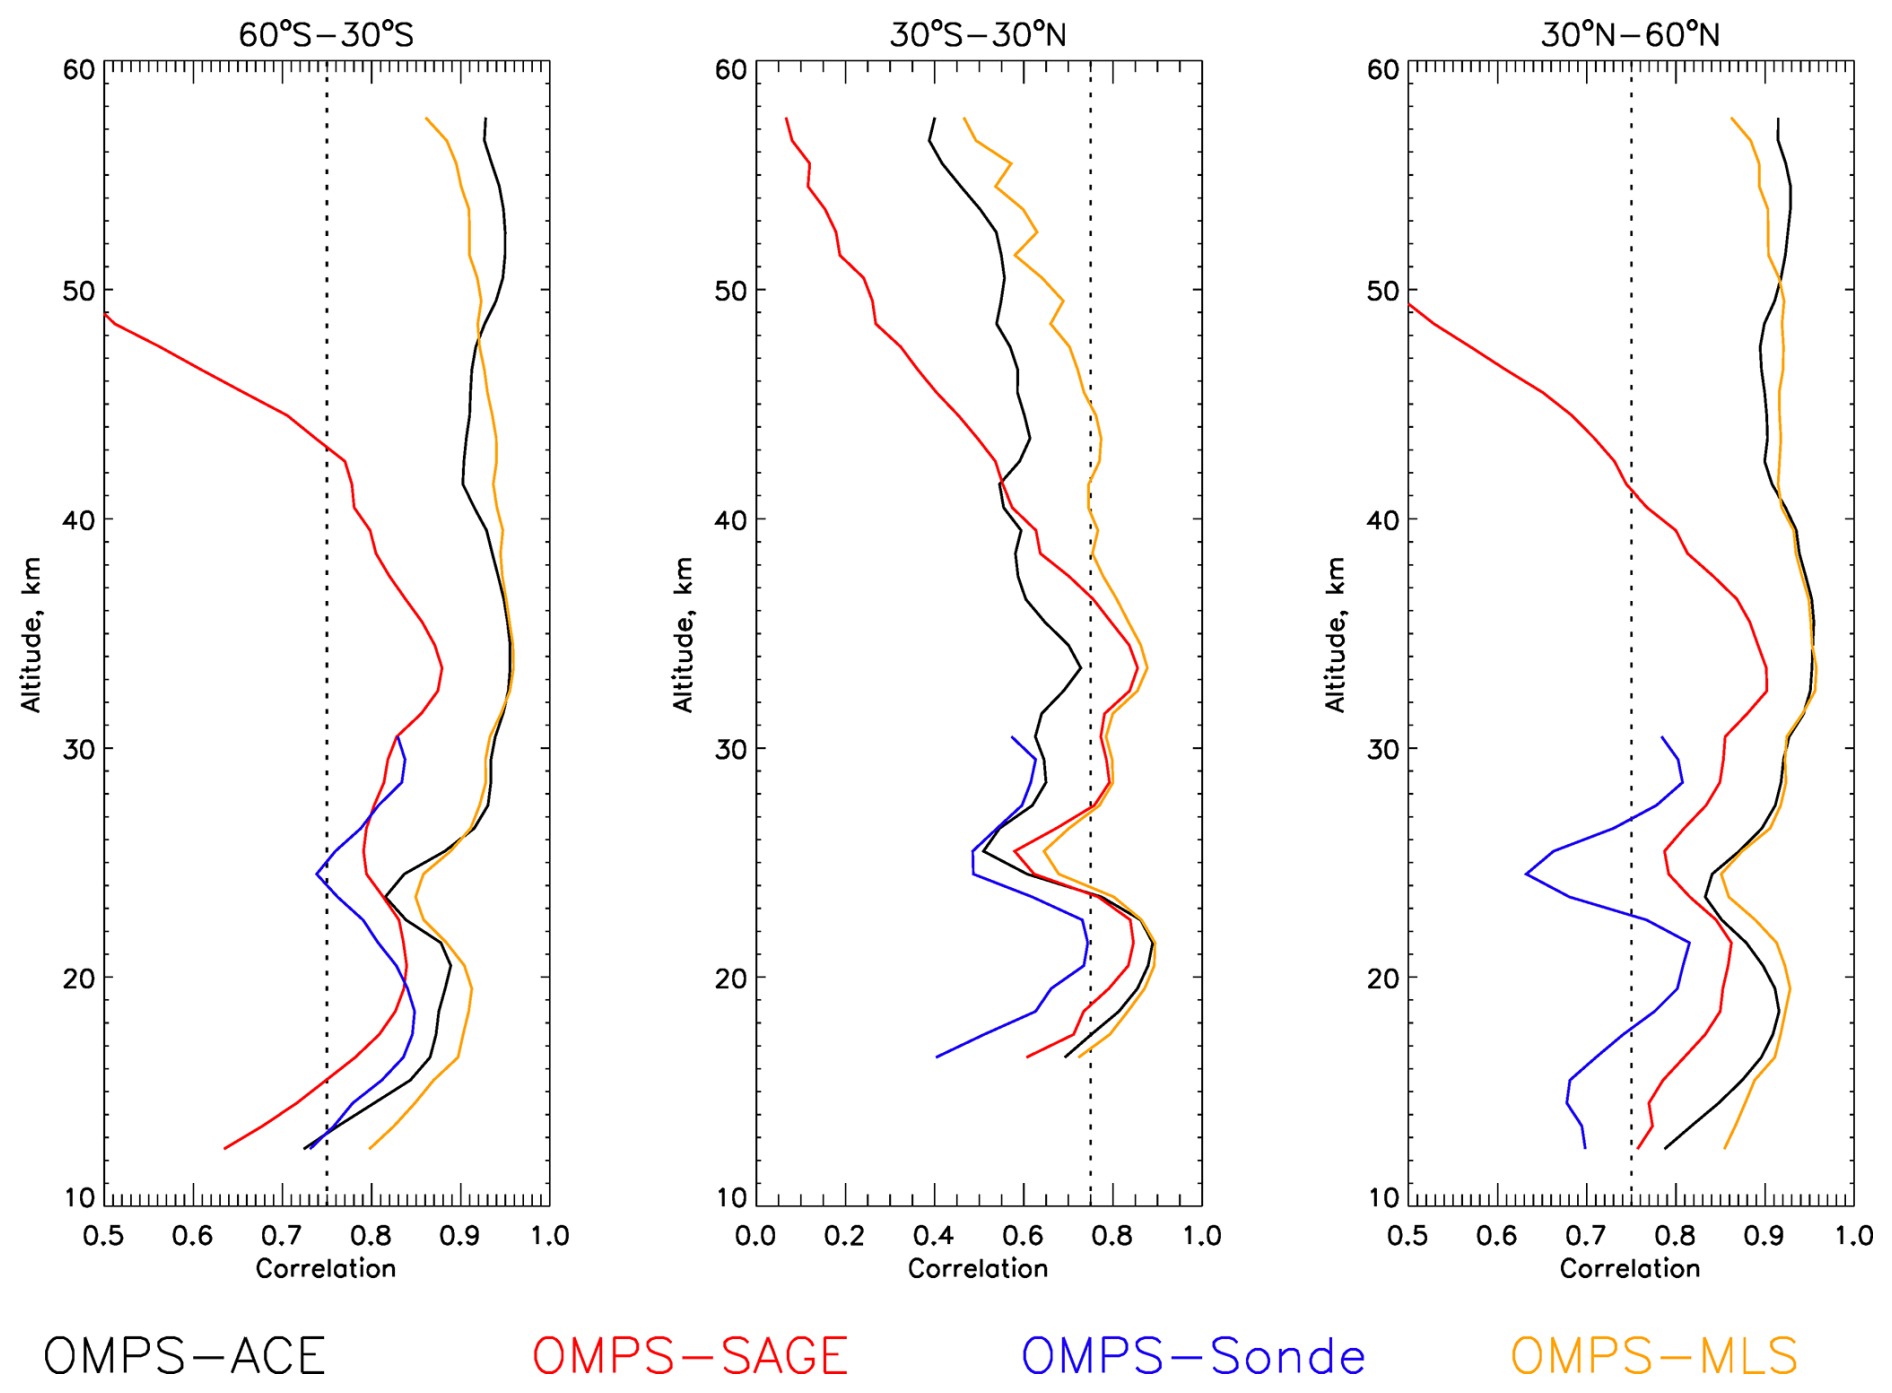
Figure 5Vertical profiles of correlation coefficients between OMPS LP and matched correlative observations for 3 wide latitude bands.
In the tropics, correlations between OMPS LP and MLS are around 0.8 up to 45 km dropping with increasing altitude to 0.5 at 57 km, correlations with SAGE III/ISS are approximately 0.8 up to 37 km and then drop with increasing altitude to 0.1 at 57 km. Correlations with ACE-FTS are between 0.4 and 0.8 throughout the entire vertical range with a stronger correlation below 25 km. The drop in correlations seen at around 25 km at all latitudes and against all correlative sources is likely because this is where ozone density peaks and it's variability is lower leading to weaker correlations. The correlations between OMPS LP and MLS and OMPS LP and ACE-FTS are improved at all altitudes and latitudes for version 2.6 over version 2.5, with the largest improvement seen in the tropical lower stratosphere where correlations between version 2.6 and MLS and ACE-FTS are greater than 0.8, whereas version 2.5 correlations were less than 0.7 compared to ACE-FTS and peaked at 0.8 compared to MLS (Kramarova et al., 2018).
5.2 Seasonal cycle
To evaluate how well OMPS LP captures the seasonal cycle in ozone we compare the ozone seasonal cycle for each correlative dataset to co-located OMPS LP observations in 3 wide latitude bands as used previously. The seasonal cycle is calculated by taking each set of co-located OMPS LP and correlative data and subtracting the long-term mean from the monthly mean (for all years) for each latitude band. Figure 6 shows seasonal cycle comparisons between OMPS LP and all correlative measurements (ACE-FTS, SAGE III/ISS, MLS and sondes) at 4 altitudes (20,30, 40 and 50 km), the dashed lines represent the correlative observations seasonal cycles and the solid lines represent the co-located OMPS LP seasonal cycles. The shape of the seasonal cycle is generally consistent between OMPS LP and all 3 correlative observation sources at all altitudes and latitudes. The seasonal cycle seen in ACE-FTS differs from the other instruments in the Southern Hemisphere at 30 km and above, this is likely due to the differences in sampling between ACE-FTS and the other instruments (see Figs. S2 and S3) as the OMPS LP co-located seasonal cycle has also changed from those for the dense coverage satellites (e.g., OMPS-MLS matches).
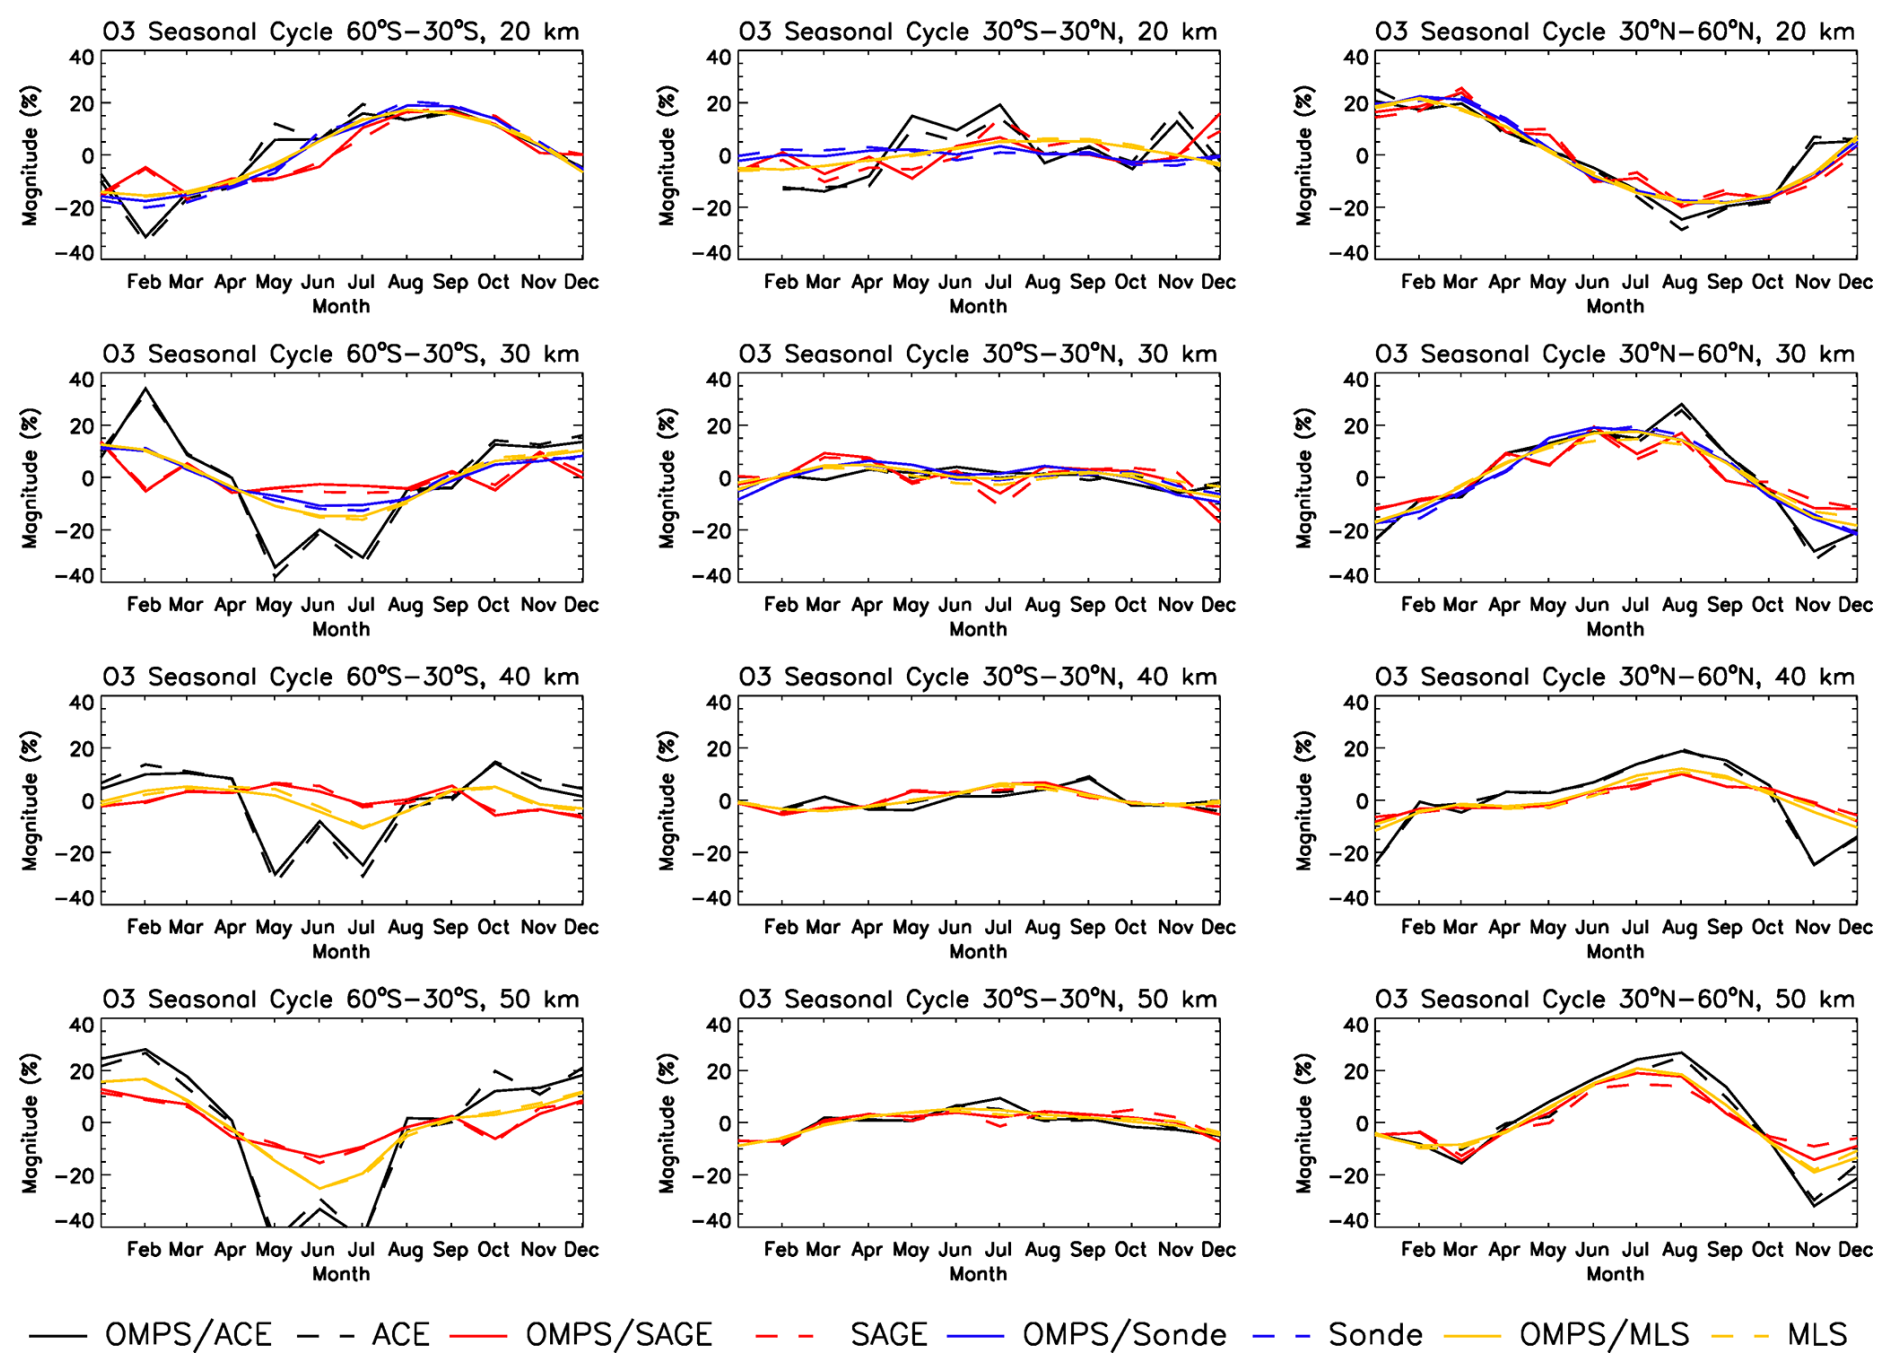
Figure 6Seasonal cycle in co-located OMPS LP (solid lines) and correlative observations (dashed lines) calculated as monthly mean deviations from the long-term annual mean in percent calculated for each instrument independently. OMPS seasonal cycles are calculated using a sub-set of matching profiles for each correlative instrument.
Figure 7 shows the seasonal cycle biases between OMPS LP and the correlative datasets (difference between solid and dashed lines in Fig. 6). There are small biases evident between the OMPS LP seasonal cycles and the seasonal cycles of correlate observations that vary by altitude and latitude, generally the biases are larger and noisier compared to ACE-FTS and SAGE III/ISS and are smaller and smoother compared to MLS, which may be a consequence of sampling differences. Below 20 km in the mid-latitudes there is a pattern to the seasonal biases that is consistent across all correlative datasets, with a high bias seen in the early part of the year (January–March), followed by a negative bias in the middle of the year (April–September) and then a positive bias towards the end of the year (October–December). Despite the pattern, although not the magnitude, of these biases being consistent across all correlative sources they are, however not statistically significant, as indicated by the absence of black contour lines in Fig. 7. At 30 km a consistent small positive bias is seen between April and September in the northern mid-latitudes when compared to all correlative sources that is not present at other latitudes, this bias is significantly smaller than a similar bias observed in OMPS LP version 2.5 which was attributed to an unexpected thermal sensitivity issue with OMPS LP (Kramarova et al., 2018; Jaross et al., 2014). However, in version 2.6 this bias is not statistically significant. Above 50 km larger biases are seen relative to ACE-FTS and SAGE III/ISS in the mid-latitudes with negative biases observed in the spring/summer months and positive biases in the fall/winter months, some of which are statistically significant as indicated by the black contours in Fig. 7. However, these biases are not seen when compared to MLS. These results show that there are no significant biases in the OMPS LP seasonal cycle.
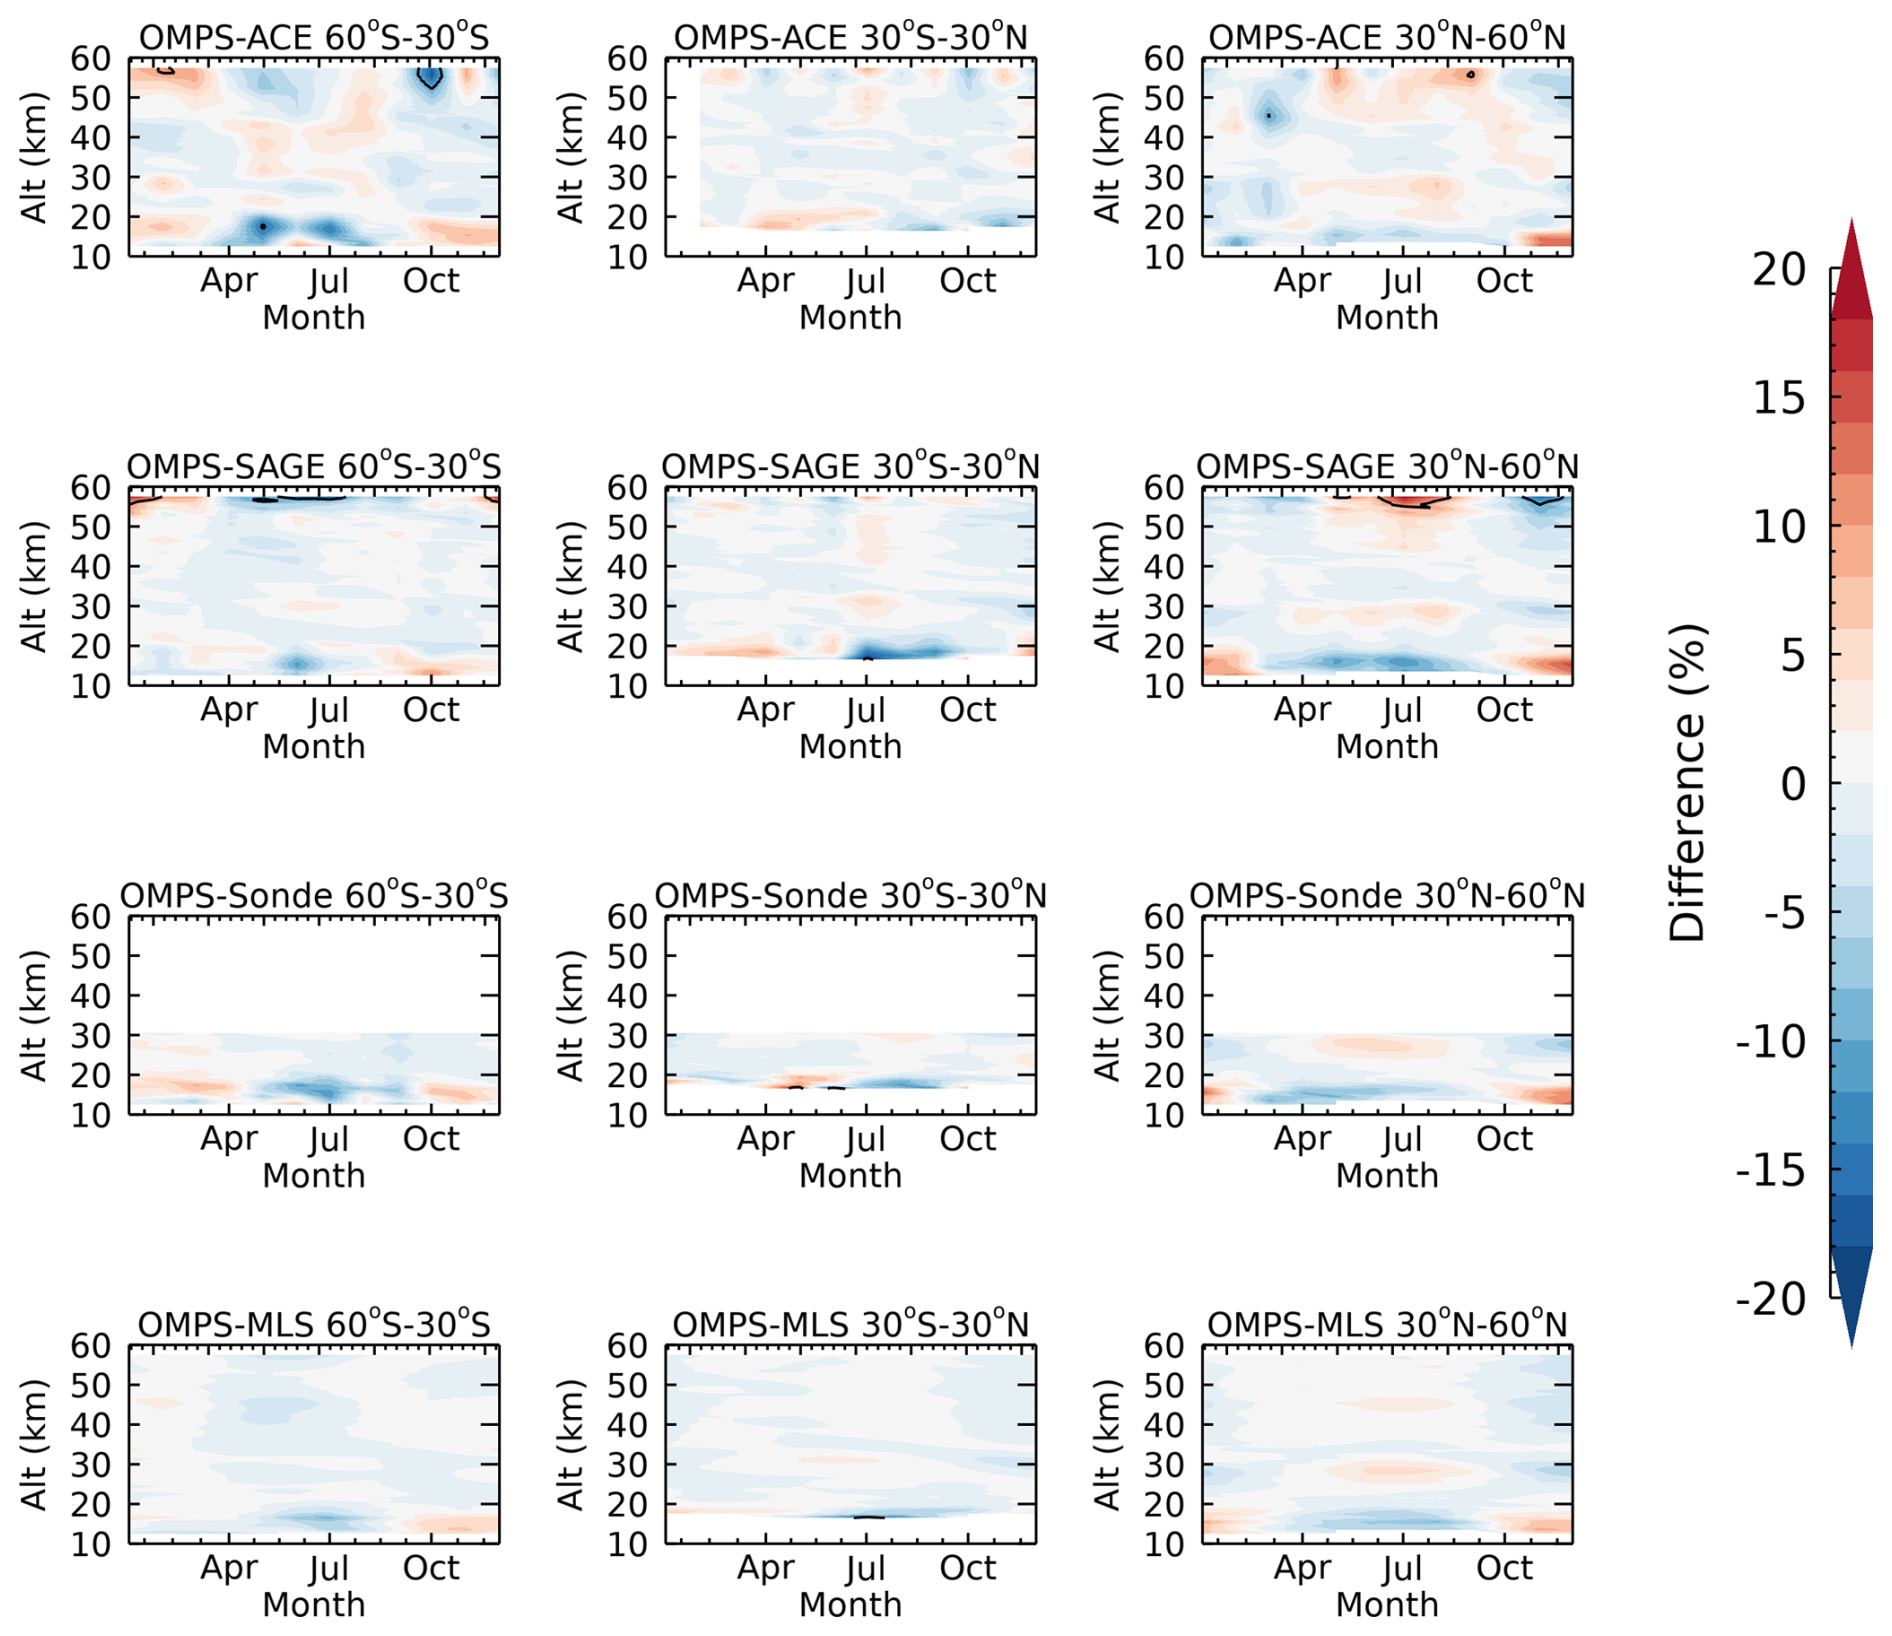
Figure 7Seasonal cycle biases between OMPS LP and correlative observations, calculated as the differences between the co-located OMPS LP seasonal cycle and the correlative observation seasonal cycle, black contours encompass biases that are larger than 2 standard deviations.
5.3 Long term stability of OMPS LP ozone
In order to assess the stability of OMPS LP version 2.6 ozone retrievals over time we calculate their drift with respect to correlative measurements. Drifts are determined by calculating a linear fit for monthly mean deseasonalized co-located differences between OMPS LP and each correlative dataset within each latitude band. Figure 8 shows the calculated drifts in OMPS LP version 2.6 ozone relative to correlative measurements as a function of altitude above the tropopause; the shaded areas represent 2σ for the linear fit.
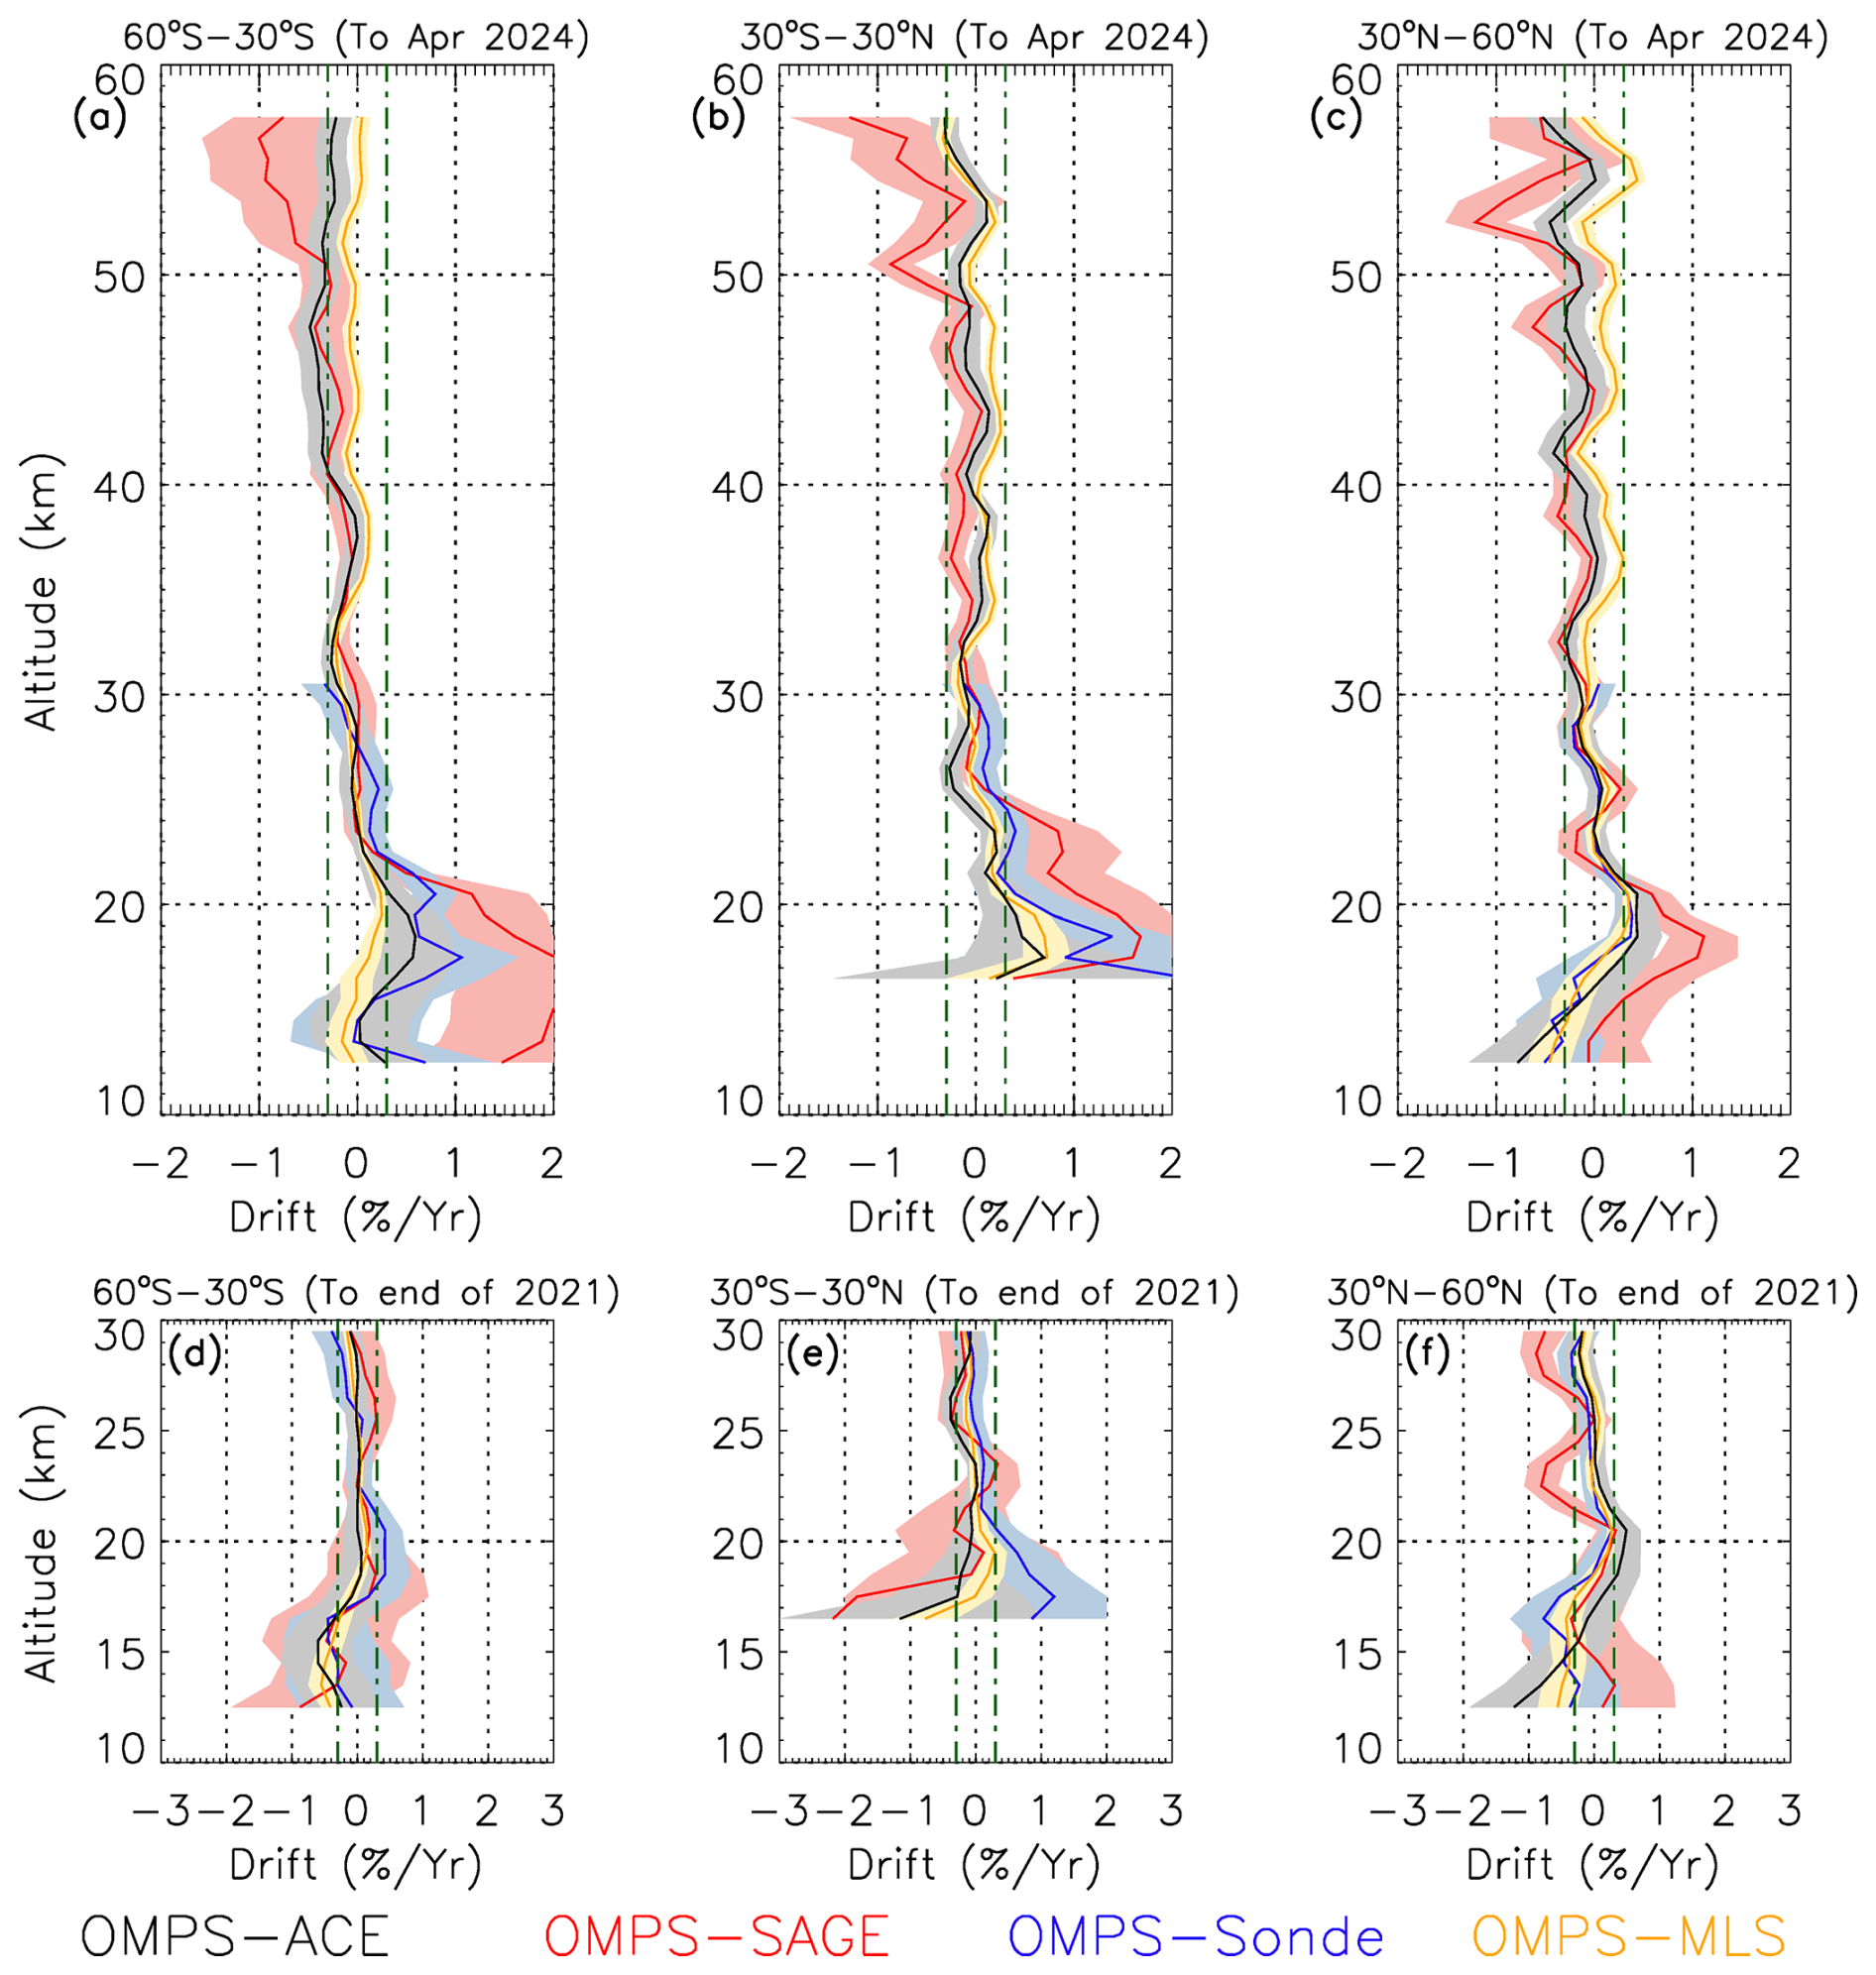
Figure 8Relative drifts for OMPS LP version 2.6 ozone in percent per year relative to correlative observations, calculated using deseasonalized data from April 2012 to April 2024 for panels (a)–(c) and April 2012 to December 2021 for panels (d)–(f), except for SAGE III/ISS for which data starts in June 2017. Shaded areas show 2σ for the linear fit, only data above the tropopause is shown. The vertical dashed-dotted lines indicate a drifts of 0.3 % yr−1, the WMO stability threshold for stratospheric ozone trend studies (WMO, 2022a).
Between 25 and 50 km OMPS LP exhibits a drift over the 2012–2024 period relative to MLS of less than 0.2 % yr−1, which is positive in the tropics and northern mid-latitudes (Fig. 8b–c), and negative in the southern mid-latitudes (Fig. 8a). The drifts relative to ACE-FTS and SAGE III/ISS at these altitudes remain predominantly negative at all latitude bands and rise from less than −0.1 % yr−1 at 25 km to −0.3 % yr−1 at 50 km (Fig. 8a–c), except for the tropics where SAGE III/ISS has a much larger drift at 50 km (−0.8 % yr−1) than the other data sources (Fig. 8b), this is due to the shorter time period where SAGE III/ISS and OMPS overlap (see discussion below). The drift relative to sondes appears consistent with MLS and ACE-FTS in the mid-latitudes (Fig. 8a and c), but diverges in the tropics between 12 and 20 km (Fig. 8b), exhibiting a positive relative drift of up to +0.2 % yr−1 whereas the satellite observations show a small negative drift of up to −0.2 % yr−1. The drifts of opposing signs observed between the different data sources indicate that OMPS LP exhibits no significant systematic drift between 25 and 50 km for the period 2012 to 2024.
Above 50 km, in the tropics and southern mid-latitudes (Fig. 8a–b), drifts relative to MLS and ACE-FTS remain less than 0.2 % yr−1. In the northern mid-latitudes (Fig. 8c), the drift relative to MLS increases slightly and is positive (up to +0.4 % yr−1) whereas the drift relative to ACE-FTS is negative (up to −0.4 % yr−1). Again, the fact that the drifts relative to MLS and ACE-FTS are either close to or straddle the zero line, suggests that there is no significant systematic drift in OMPS LP at these altitudes over the 2012–2024 period.
The eruption of the Hunga volcano in January 2022 caused problems for OMPS LP ozone retrievals because of high aerosol loading at 25 km and below, leading to anomalously high ozone being reported. A filter based on aerosol optical depth was implemented for OMPS LP ozone (Kramarova et al., 2024), this dramatically reduced the number of OMPS LP observations at altitudes below 25 km in the tropical and southern mid-latitude regions in the months following the eruption. However, even after this filter is applied, a higher than normal bias is still observed with respect to correlative observations in these regions that persists throughout 2022 and well into 2023. This positive anomaly is small when compared to MLS, but is larger when compared to ACE-FTS and is largest when compared to SAGE III/ISS as shown in Fig. S2 that demonstrates the time series of differences over the 2020–2025 period. Both SAGE III/ISS and ACE-FTS already had a limited number of observations in these latitude bands depending on the season, and with the reduction of OMPS LP observations the remaining number of matches in the low stratosphere for these two instruments is severely reduced from early 2022 to mid to late 2023 as shown in Fig. S3. The resulting drifts relative to ACE-FTS and particularly SAGE III/ISS below 25 km when calculated up to April 2024 appear to be erroneously large, especially in the tropics and southern mid-latitudes. For these reasons, for altitudes below 25 km, we will focus on drifts calculated up to the end of 2021 only, which can be found in Fig. 8d–f.
Between 20 and 25 km OMPS LP exhibits a drift of less than ±0.3 % yr−1 relative to ACE, MLS and sondes over the period 2012–2021 (Fig. 8d–f), with the largest drifts seen at 25 km in the tropics relative to ACE (Fig. 8e) and at 20 km in the southern mid-latitudes relative to sondes (Fig. 8d). In the tropics and southern mid-latitudes (Fig. 8d–e) the drifts relative to different data sources straddle the zero line indicating no systematic drift for the time period 2012–2021, in the northern mid-latitudes the drifts are generally all less than 0.3 % yr−1 and positive. Below 20 km, for the period 2012–2021, in the mid-latitudes (Fig. 8d and f) the drifts relative to all data sources shows the same structure and start out positive (∼ +0.2 % yr−1), but then show an increasing negative trend with decreasing altitude which peaks at ∼ −0.6 % yr−1 at around 15 km before improving at the bottom of the profile (except for ACE-FTS in the northern hemisphere), with larger drifts seen at lower altitudes in the northern hemisphere. In the tropics there is a large spread in the drifts relative to the four different data sources. The drifts relative to ACE-FTS and MLS are similar and those relative to SAGE III/ISS and sondes have larger errors at these altitudes. ACE-FTS, SAGE III/ISS and MLS all show a negative drift whereas the drift relative to sondes is positive.
These results represent an improvement in the long-term stability of OMPS LP ozone retrievals for version 2.6 over version 2.5, with a reduction in drifts at all altitudes, particularly in the upper stratosphere where version 2.5 exhibited drifts of 0.5–1 % yr−1 (Kramarova et al., 2018). The observed drifts and the spread in drifts relative to different correlative data sources indicates that there is no significant systematic drift in OMPS LP version 2.6 above 20 km.
The drifts relative to SAGE III/ISS have larger magnitudes, sigmas, and different vertical structures to those of other correlative measurements, particularly above 50 km and below 25 km. This is due to the shorter time period available for OMPS LP-SAGE III/ISS comparisons. Once recalculated, the drifts relative to ACE-FTS and MLS above 50 km and below 25 km exhibit similar magnitudes and vertical structures to that of SAGE III/ISS (Fig. S5). Analysis of the time series of differences between OMPS LP and MLS in the 30–60° N latitude band for several altitudes over the time period 2012 to 2024 (Fig. S6) show low frequency changes in ozone differences. Because of this the drifts for the periods 2012–2024 and 2017–2024 are quite different with mostly negative drifts for the period 2017–2024, however when we estimate the drift for the whole time period of 2012-2024 the drifts are much smaller. These time-dependent changes in LP ozone are being investigated by the OMPS LP team, who also see time dependent changes in radiance residuals (differences between calculated and measured radiances) at wavelengths that are not used in the ozone retrieval that coincide with observed changes in ozone. Investigation of this behavior in other LP slits (not shown here) suggest that this is not related to a drift in altitude registration. One possible explanation under investigation is a potential shift in wavelength registration.
In the future we will not be able to rely on having correlative satellite data with either both high vertical resolution and dense global sampling such as MLS, or high vertical resolution and limited global sampling such as SAGE III/ISS or ACE-FTS, as both MLS and SAGE III/ISS are scheduled to end operations in the near future and ACE-FTS is already long past its original planned mission lifetime. With no replacement missions for these instruments likely in the near future we will need to use other sources of correlative data with which to validate OMPS LP ozone retrievals in addition to ozonesondes. Here we investigate the use of lidar data and lower vertical resolution nadir satellite data.
6.1 Mauna Loa Lidar
One other source of high vertical resolution ozone profile measurements is ground-based lidar observations, of which there are a limited number of stations located around the globe. Although the global coverage gained from lidar observations is significantly lower than that of ozonesondes, lidars are able to observe ozone up to higher altitudes than sondes (up to 50 km), therefore a combination of lidars and ozonesondes may provide a useful dataset for validation of OMPS LP high vertical resolution ozone profile retrievals, albeit with limited global coverage. Here we will compare to the Mauna Loa lidar station (MLO). The MLO lidar measures vertical ozone profiles from 15–50 km at night, several times a week, with a vertical resolution of ∼ 1 km near the ozone peak (∼ 25 km) which decreases to ∼ 3 km at the bottom of the profiles and to 8–10 km at the top of the profiles (Leblanc and McDermid, 2000). The typical instrumental error is a few percent at the ozone peak and increases to 10 %–15 % at ∼ 15 km and to more than 40 % above 45 km (Leblanc and McDermid, 2000).
In this study we utilize MLO lidar ozone data for the period April 2012 to December 2022 to evaluate OMPS LP version 2.6 ozone retrievals and compare these results to those of coincident MLS and ozonesonde comparisons to OMPS LP at this location. Figure 9 shows mean profile differences between OMPS LP and MLO lidar data together with collocated differences between OMPS LP and MLS and between OMPS LP and ozonesondes launches from the Hilo station. Between 20 and 45 km OMPS LP exhibits the same vertical structure in biases compared to both the MLO lidar and MLS, with biases near zero between 20 and 25 km and between 40 and 45 km for both data sources. Between 25 and 40 km the bias compared to the MLO lidar (∼ 5 %–10 %) is larger than that with MLS (< 5 %), however between 23 and 30 km the biases with MLO and ozonesondes agree almost perfectly. Below 20 km the bias compared to the MLO lidar is less than 10 %, which is much smaller than the bias compared to both MLS and ozonesondes, however the standard deviation of the MLO biases increases dramatically at these altitudes (see Fig. S4), likely as a result of increased measurement error, and encompass the observed MLS and ozonesondes biases. Above 45 km, again the MLO lidar and MLS biases differ, with the MLO biases being much smaller than MLS. This is also a region where the MLO lidar measurement error increases dramatically and so does the standard deviation of the mean differences, which again encompass the MLS biases.
Figure 9Mean profile differences and drifts between OMPS LP and Mauna Loa lidar observations. Panel (a) shows the mean profile differences between OMPS LP and lidar (black line), OMPS LP and MLS (yellow line), and OMPS LP and ozone sonde launches from Hilo (blue line), the horizontal bars show 2 times the standard error of the mean (SEM), the white area indicates differences less than 5 %, the light grey area 5 %–10 % and the dark grey area represents differences greater than 10 %. Panel (b) shows the relative drift in percent per year relative to lidar observations, calculated using deseasonalized data from 2012 to 2021. Shaded area shows 1σ for the linear fit, only data above the tropopause is shown.
Figure 9b shows a profile of the relative drift of OMPS LP compared to the MLO lidar. This is determined by calculating a linear fit for monthly mean deseasonalized co-located differences for the time period of April 2012 up to the end of 2021. Between 20 and 40 km the drift in OMPS LP relative to the MLO lidar is very close to zero (< ±0.1 % yr−1), with the exception of a positive drift of less than 0.4 % yr−1 between 20 and 24 km and a negative drift of less than −0.3 % yr−1 at 32 km. Above 40 km the drift steadily increases with altitude reaching +1.2 % yr−1 at 45 km and +1.8 % yr−1 at 50 km, however as previously noted the lidar measurement error increases dramatically above 40 km as does the standard deviation of the differences, the vertical resolution of the lidar observations is also degraded to ∼ 8–10 km at these altitudes and so any observed trends in OMPS LP with fine vertical structure, natural or otherwise, would likely lead to large drifts in the differences. Below 20 km drifts become increasingly negative increasing from ∼ 0 % yr−1 at 20 km to ∼ 3 % yr−1 at 16 km, again this is an altitude range with increased variability in the differences between the two datasets and increased lidar measurement error.
The results are broadly consistent with MLS and sonde comparisons in the same location, although the existence of some differences at higher and lower altitudes together with lidar observation error estimates, variability of differences and changes in vertical resolution lead us to conclude that such data is most useful for evaluation of OMPS LP ozone between 20 and 40 km. These results show that lidars can provide a useful dataset with which to evaluate OMPS LP high vertical resolution ozone profile retrievals once MLS data is no longer available.
6.2 OMPS Nadir Profiler (NP)
The OMPS nadir profiler (OMPS NP) is a nadir viewing instrument that is part of the OMPS suite of instruments and measures vertical profiles of ozone (McPeters et al., 2019) with limited vertical resolution (6–8 km). Despite the limited vertical resolution, it has a number of advantages as a correlative data source for the evaluation of OMPS LP ozone profiles. It is on board the same spacecraft as OMPS LP, and so its observations are near coincident with LP observations in both space and time, it is able to provide the same global coverage as OMPS LP (every 3–4 d), although its profiles are of low vertical resolution they do cover the full vertical range of OMPS LP ozone retrievals, and there will always be an NP instrument as part of the OMPS to provide data with which to compare. Ozone profile retrievals from SNPP OMPS NP have been demonstrated to agree with observations from NOAA-19 SBUV-2 to within ±3 % with an average bias of −1.1 % in the upper stratosphere and +1.1 % in the lower stratosphere (McPeters et al., 2019).
In this study we utilize SNPP OMPS NP ozone profile for the period April 2012 to December 2024 to evaluate OMPS LP version 2.6 ozone retrievals. In order to compare OMPS LP and OMPS NP, OMPS LP profiles were first converted into partial ozone columns according to the OMPS NP pressure grid, the OMPS NP averaging kernels were then applied to the OMPS LP profiles to degrade them to the OMPS NP vertical resolution. Figure 10 shows mean profile differences between OMPS LP and OMPS NP averaged over the whole measurement time period for 3 wide latitude bands. In general, the biases relative to OMPS NP are less than 5 % at all altitudes and all locations, with the exception of the tropical lower stratosphere (below 25 km). The biases for all locations show the same vertical oscillatory structure which is stronger in the tropics and northern mid-latitudes. This manifests as positive biases below ∼ 28 km, negative biases between ∼ 28 and ∼ 36 km, positive biases between ∼ 36 and ∼ 46 km and negative biases above ∼ 46 km for these two regions. Also shown in Fig. 10 are the mean profile differences between MLS and OMPS NP for the same latitude bands (yellow lines). Since the differences between MLS and OMPS NP exhibit the same oscillatory vertical structure as the differences between OMPS LP and OMPS NP, we can conclude that this vertical structure is an artifact of the OMPS NP measurements and not OMPS LP. With this in mind, the biases observed between OMPS LP and OMPS NP are consistent with those seen between OMPS LP and other correlative observations.
Figure 10Mean profile differences between OMPS LP and OMPS NP (black) for 3 wide latitude bands, the horizontal shading show 2 times the standard error of the mean (SEM), the white area indicates differences less than 5 %, the light grey area 5 %–10 %. Also shown in yellow are mean profile differences between MLS and OMPS-NP. Only data above the tropopause are shown.
Figure 11 shows the drift of OMPS LP relative to OMPS NP. This is determined by calculating a linear fit for monthly mean deseasonalized differences for the time period of April 2012 up to the end of 2024 for altitudes above 25 km and up to the end of 2021 for altitudes below 25 km. Between ∼ 13 and ∼ 35 km the drift relative to OMPS NP is < ±0.1 % yr−1 in the mid-latitudes, and < ±0.2 % yr−1 in the tropics. Above 35 km the drift becomes positive in all latitude bands and increases up to 0.3 % yr−1. These drifts fall within the range of drifts seen when comparing OMPS LP with other correlative measurements.
Figure 11Relative drifts for OMPS LP version 2.6 ozone in percent per year relative to OMPS NP, calculated using deseasonalized data from April 2012 to December 2021. Shaded areas show 2σ for the linear fit, only data above the tropopause is shown.
These results suggest that OMPS NP is able to provide a useful dataset with which to globally evaluate OMPS LP ozone profiles, albeit with limited vertical fidelity. Bias calculations with OMPS NP introduce some oscillatory vertical structures which are a characteristic of the OMPS NP measurements and not OMPS LP. This should be taken into consideration when using OMPS NP to evaluate OMPS LP vertical profiles.
Previously, we limited our comparisons geographically to exclude polar regions (latitudes greater than 60°) owing to sparse data in this region from all correlative data sources. However, MLS and OMPS NP have sufficient data coverage that extends to latitudes greater than 60° to evaluate OMPS LP ozone retrievals in these important regions.
Figure 12 shows mean profile differences between OMPS LP and correlative observations in two wide polar latitude bands, 82–60° S and 60–82° N. The biases relative to MLS are generally less than ±5 % except between 45 and 55 km in the southern hemisphere where biases peak at −8 % at 48 km, in the northern hemisphere there are 3 altitude regions where the bias relative to MLS exceeds ±5 %, 15–20 km, 23–30 km and 45–50 km, but those biases are still less than ±10 %. Compared to OMPS NP, LP biases are generally less than ±5 % except for approximately 25 to 30 km in the southern hemisphere, and above ∼ 52 km in the northern hemisphere.
Figure 12Mean profile differences between OMPS LP and correlative datasets in two polar latitude bands, 60–90° S and 60–90° N. Panels (a) and (b) show the mean profile differences between OMPS LP and MLS, the horizontal bars show 2 times the standard error of the mean (SEM). Panels (c) and (d) show the mean profile differences between OMPS LP and OMPS NP, the horizontal shading show 2 times the standard error of the mean (SEM). The white area indicates differences less than 5 %, the light grey area 5 %–10 % and the dark grey area represents differences greater than 10 %, only data above the tropopause are shown.
Figure 13 shows relative drift profiles between OMPS LP and correlative observations for the two polar regions. The drift relative to MLS is less than ±0.2 % yr−1 at all altitudes in the polar regions except in the northern hemisphere at 18 km and between ∼ 53 and 55 km. Drifts of less than ±0.3 % yr−1 are seen relative to OMPS NP at all altitudes in both polar regions, with drifts less than ±0.1 % yr−1 above 25 km in the southern hemisphere, and less than ±0.2 % yr−1 between 25 and 45 km in the northern hemisphere.
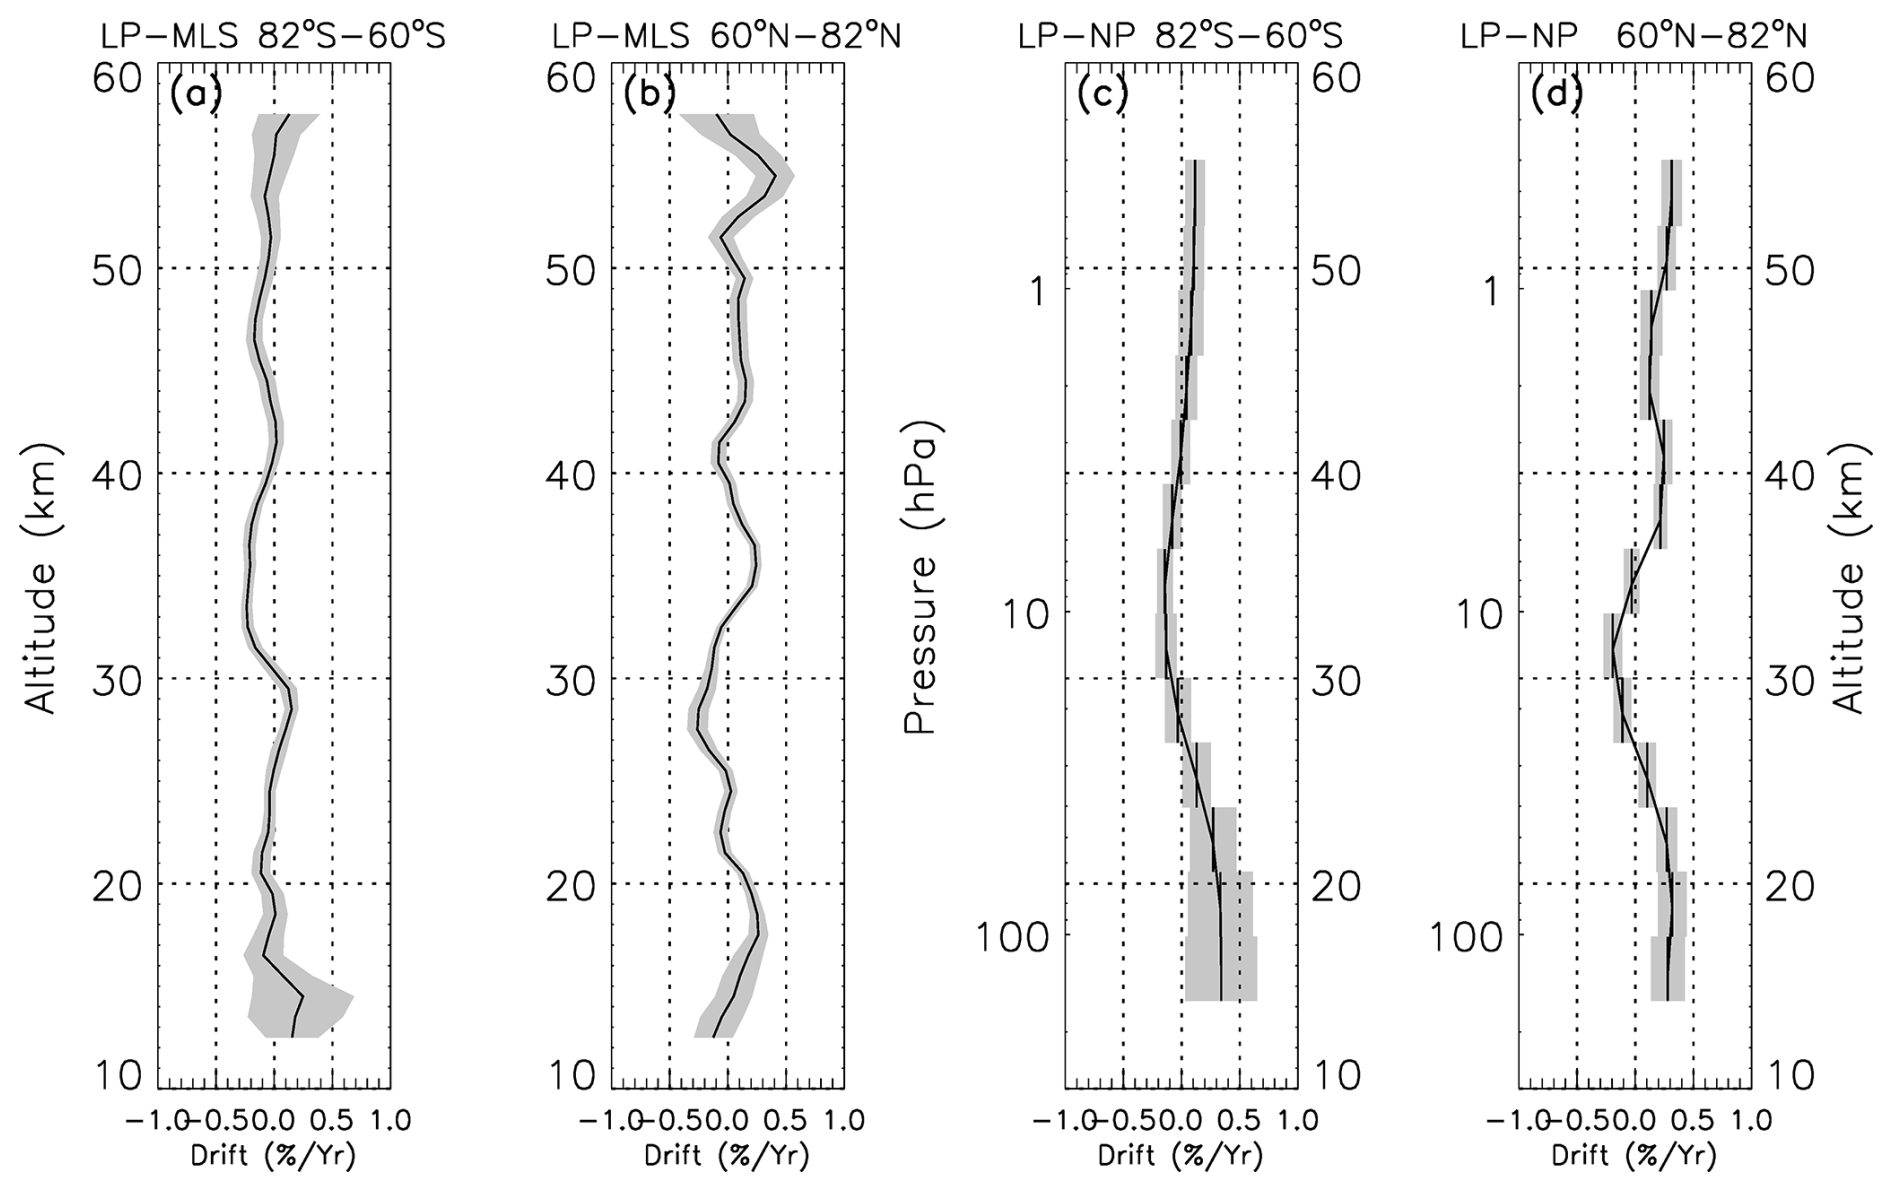
Figure 13Relative drifts for OMPS LP version 2.6 ozone in percent per year, calculated using deseasonalized data from April 2012 to December 2024 for two polar latitude bands, 60–90° S and 60–90° N. Panels (a) and σ show drifts relative to MLS. Panels (c) and (d) show drifts relative to OMPS NP. Shaded areas show 2σ for the linear fit, only data above the tropopause is shown.
In mid-2023 a new version of OMPS LP ozone profile retrievals, version 2.6, was released. Version 2.6 includes a number of incremental improvements in calibration, the retrieval algorithm and data quality. In order to evaluate this latest version of OMPS LP ozone profile data, we compared OMPS LP version 2.6 ozone retrievals against correlative data from other satellite instruments (MLS, ACE-FTS and SAGE III/ISS) and ozonesondes for the time period 2012–2024 in three wide latitude bands from 60° S to 60° N. Table 1 summarizes our results showing mean biases and drifts for 3 wide latitude bands (30–60° S, 30° S–30° N and 30–60° N) at 5 km altitude intervals.
Table 1Mean biases and relative drifts at 9 specified altitudes for 3 wide latitude bands. The mean biases were derived by using the relative biases between OMPS LP and all high vertical resolution observations (Ozonesondes, MLS, ACE-FTS and SAGE III/ISS) for the period April 2012 to April 2024 (2017–2024 for SAGE III/ISS). The mean drifts were calculated using only the relative drifts for which there were data for the whole OMPS LP time period (2012–2024) and therefore exclude SAGE III/ISS data. The numbers in brackets represent the unbiased estimator of the standard error of the mean as described in Eq. (5.1) in the 2018 LOTUS report (SPARC/IO3C/GAW, 2019).
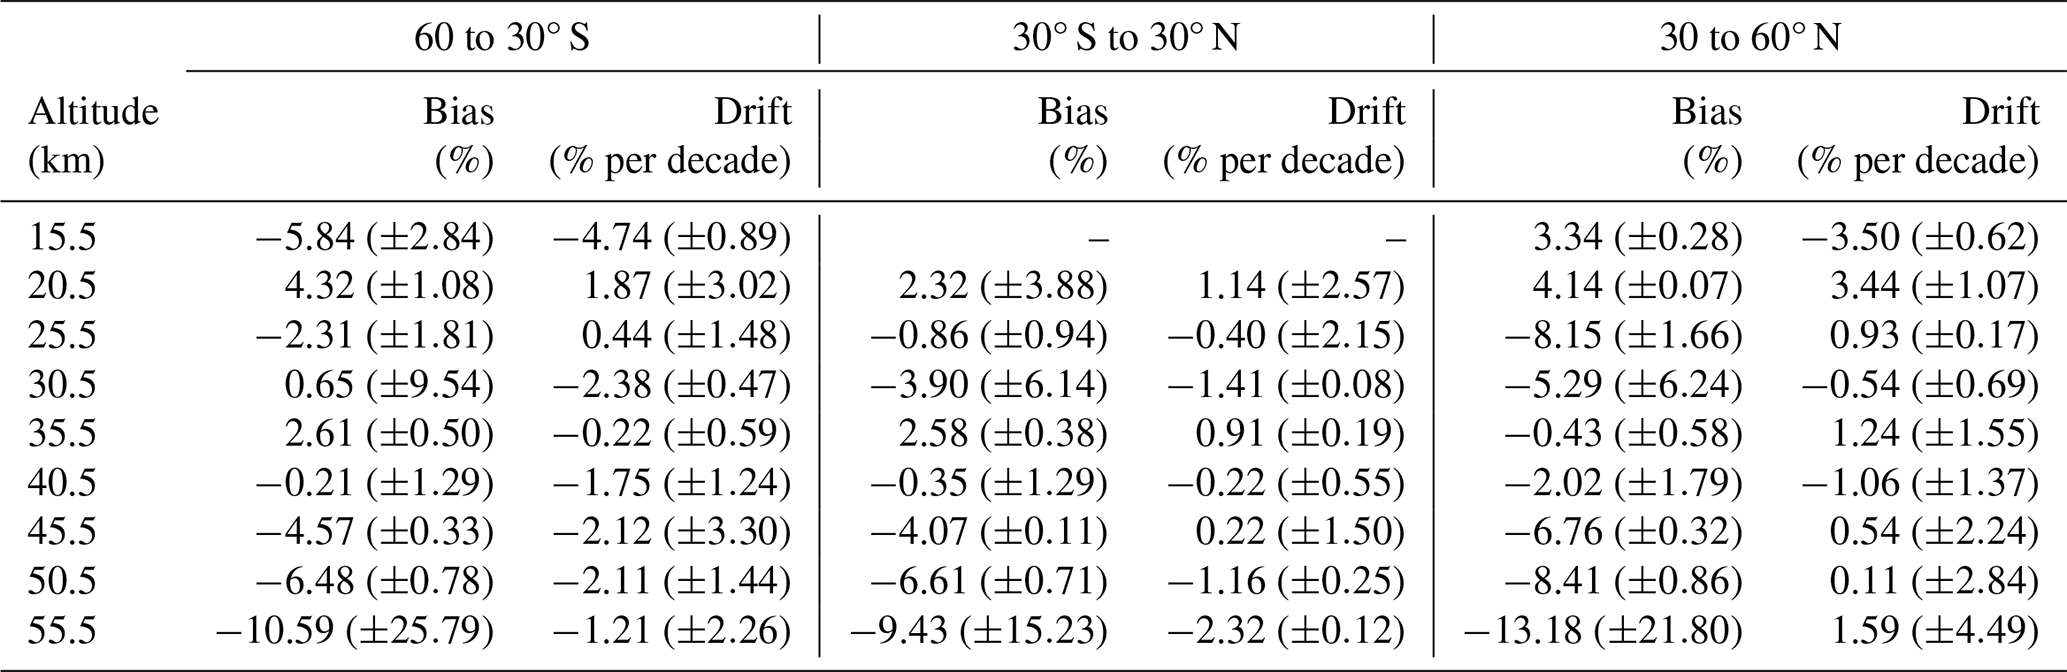
Our results show very good agreement between OMPS LP and all correlative data sources between 15 and 50 km at all latitudes with differences of less than 10 %, with OMPS generally exhibiting a negative bias, except between 32 and 38 km in the tropics and southern mid-latitudes, where the bias is positive. Between 20 and 45 km in the tropics and southern mid-latitudes the differences between OMPS LP and MLS, and OMPS LP and SAGE III/ISS are less than ±5 %. Above 50 km, the agreement with MLS is still on the order of −5 % or better, but differences with SAGE III/ISS and ACE-FTS start to increase with increasing altitude, which is consistent with the SAGE III/ISS and ACE-FTS validation results which show that both instruments have an increasing positive bias in the upper stratosphere. Below 20 km, larger positive biases, up to ∼ 35 %, are seen in the tropical tropopause layer (∼ 15 to 20 km) between approximately 40° S and 40° N. In the southern mid-latitudes OMPS LP agrees to within ∼ 12 % between 12 and 20 km when compared to ACE-FTS and sondes, but shows slightly larger differences with MLS and SAGE III/ISS below 15 km. Below 20 km in the northern mid-latitudes, the biases between OMPS LP and all correlative measurements are comparable, and range from a positive bias of ∼ 10 % at 18 km down to a small negative bias of < 5 % at 12 km. Almost all of the observed biases when compared to correlative satellite data fall within the reported biases and precisions of those instruments, particularly in the 20 to 45 km altitude range.
We now have more than 12 years of OMPS LP ozone retrievals, and this allows us to evaluate both the seasonal cycle and the long-term stability of the data, which we have done by comparing to satellite and ozonesonde data. We find that OMPS version 2.6 ozone exhibits the same seasonal cycle as compared to all correlative measurement sources and our analysis shows that there is no significant seasonal bias in the OMPS LP.
To evaluate the long term stability of OMPS LP ozone we calculate the drifts between OMPS LP and correlative data sources using deseasonalized monthly mean differences, see table 1. We find mean relative drifts at all latitude bands of less than ±2 % per decade between 25 and 55 km, with larger drifts of up to ±5 % per decade below 20 km, these represent an improvement over OMPS LP version 2.5 ozone. However, there is a spread in these drifts between correlative sources that often straddles the zero line. In order to confidently detect long-term ozone trends in the stratosphere, a threshold stability requirement of 3 % per decade for ozone stratospheric profiles has been set by the World Meteorological Organisation (WMO, 2022a). We therefore conclude that there is no significant systematic drift in OMPS LP version 2.6 ozone for the period 2012 to 2024 and that OMPS LP data meets current WMO requirements for long-term stratospheric ozone trend studies. Whilst relative drifts calculated over shorter time periods can be larger, as demonstrated here for the period 2017–2024, analysis of ozone difference time series does not show any clear, consistent drifts in OMPS LP ozone over the entire record.
Currently the best source of correlative data with which to evaluate OMPS LP ozone profile retrievals is Aura MLS as it is able to provide high vertical resolution profiles with dense geospatial sampling. However, MLS is scheduled to be decommissioned within the next year, and so other sources of data must be found. In this paper, in addition to MLS, we have used solar occultation satellite instrument data from ACE-FTS and SAGE III/ISS to evaluate OMPS LP ozone profiles. Although solar occultation instruments are able to provide high vertical resolution ozone profiles the number of profiles observed per day by these instruments is very small compared to OMPS LP, and their spatial coverage is very limited and varies seasonally. The limited number of observations and lack of spatial coverage means that in order to make meaningful global comparisons one must average over wide latitude bands and longer time scales. It also means that longer time periods are needed in order to calculate reliable drifts. Ozonesondes and lidar observations are able to provide high vertical resolution ozone profiles with which to evaluate OMPS LP profiles, however they lack the geospatial coverage afforded by a satellite instrument such as MLS. Together, independent solar occultation and ozonesonde measurements can be used to continuously monitor for potential drifts in OMPS LP, while LP provides the near global coverage necessary to ensure geographically representative trends. Finally, the OMPS NP series of instruments, which is able to provide full global coverage coincident with OMPS LP, but with limited vertical resolution, offers a source of data with which to evaluate OMPS LP ozone profiles, and there will always be an OMPS NP instrument on the same satellite platform as all future OMPS LP instruments. Therefore, in the future when MLS data is no longer available, a combination of ozonesondes, lidars and OMPS NPs will be needed in order to globally evaluate OMPS LP ozone profiles, with OMPS NP providing the global coverage and ozonesondes and lidars providing the high vertical resolution information needed to interpret any vertical structure seen in the OMPS LP/NP comparisons. There will also be some overlap between successive OMPS LP instruments which we can exploit in order to cross-calibrate/validate them, this will enable us to determine any bias offsets between them.
With the potential upcoming “data desert” in satellite observations of atmospheric composition with high vertical resolution (Salawitch et al., 2025), the OMPS LP series of instruments will serve as a critical bridge connecting records from Aura MLS and SAGE III with future missions, like the ESA's Atmospheric Limb Tracker for Investigation of the Upcoming Stratosphere (ALTIUS). ALTIUS will be launched in 2027 and will carry a high-resolution spectral imager that measures in UV, VIS and NIR ranges. ALTIUS will acquire observations in 3 modes – limb scattering, solar and stellar occultation – to retrieve profiles of ozone, aerosol and other trace gases in the stratosphere and mesosphere.
SNPP OMPS LP version 2.6 ozone profile data are available at the NASA Goddard Earth Sciences Data and Information Services Center (GES DISC): https://disc.gsfc.nasa.gov/ (last access: 1 July 2025).
MLS data are available at the NASA Goddard Earth Sciences Data and Information Services Center (GES DISC): https://disc.gsfc.nasa.gov/ (last access: 1 July 2025).
ACE-FTS data are available via the ACE/SCISAT database: https://databace.scisat.ca/ (last access: 1 July 2025).
SAGE III/ISS data are available at the NASA Langley Atmospheric Science Data Center (ASDC): https://asdc.larc.nasa.gov/ (last access: 1 July 2025).
Ozone sonde data are available at the NASA Goddard Atmospheric composition Validation Data Center (AVDC): https://avdc.gsfc.nasa.gov/ (last access: 1 July 2025).
Mauna Loa lidar data are available via the Network for the Detection of Atmospheric Composition Change (NDACC): https://ndacc.larc.nasa.gov/ (last access: 1 July 2025).
OMPS NP data are available at the NASA Goddard Earth Sciences Data and Information Services Center (GES DISC): https://disc.gsfc.nasa.gov/ (last access: 1 July 2025).
The supplement related to this article is available online at https://doi.org/10.5194/amt-19-529-2026-supplement.
NAK directed the work, NADR and NAK devised the comparison methodology, NADR carried out the work and NAK and NADR analyzed the results. SMD and YJ performed the comparisons between OMPS LP and the MLO lidar station. NADR prepared the manuscript with contributions from all co-authors.
At least one of the (co-)authors is a member of the editorial board of Atmospheric Measurement Techniques. The peer-review process was guided by an independent editor, and the authors also have no other competing interests to declare.
Publisher's note: Copernicus Publications remains neutral with regard to jurisdictional claims made in the text, published maps, institutional affiliations, or any other geographical representation in this paper. The authors bear the ultimate responsibility for providing appropriate place names. Views expressed in the text are those of the authors and do not necessarily reflect the views of the publisher.
This work was funded under the NASA project 20‐SNPPSP20‐0019 “Synergistic use of Limb and Nadir Measurements to continue the NASA Standard Ozone Products from OMPS on Suomi NPP and NOAA‐20”.
This paper was edited by Mark Weber and reviewed by two anonymous referees.
Benito-Barca, S., Abalos, M., Calvo, M., Garny, H., Birner, T., Abraham, N. L., Akiyoshi, H., Dennison, F., Jöckel, P., Josse, B., Keeble, J., Kinnison, D., Marchand, M., Morgenstern, O., Plummer, D., Rozanov, E., Strode, S., Sukhodolov, T., Watanabe, S., and Yamashita, Y.: Recent lower stratospheric ozone trends in CCMI-2022 models: Role of natural variability and transport, J. Geophys. Res.-Atmos., 130, e2024JD042412, https://doi.org/10.1029/2024JD042412, 2025.
Bernath, P. F.: The Atmospheric Chemistry Experiment (ACE), J. Quant. Spectrosc. Ra., 186, 3–16, https://doi.org/10.1016/j.jqsrt.2016.04.006, 2017.
Bernath, P. F., McElroy, C. T., Abrams, M. C., Boone, C. D., Butler, M., Camy-Peyret, C., Carleer, M., Clerbaux, C., Coheur, P.-F., Colin, R., DeCola, P., DeMazière, M., Drummond, J. R., Dufour, D., Evans, W. F. J., Fast, H., Fussen, D., Gilbert, K., Jennings, D. E., Llewellyn, E. J., Lowe, R. P., Mahieu, E., McConnell, J. C., McHugh, M., McLeod, S. D., Michaud, R., Midwinter, C., Nassar, R., Nichitiu, F., Nowlan, C., Rinsland, C. P., Rochon, Y. J., Rowlands, N., Semeniuk, K., Simon, P., Skelton, R., Sloan, J. J., Soucy, M.-A., Strong, K., Tremblay, P., Turnbull, D., Walker, K. A., Walkty, I., Wardle, D. A., Wehrle, V., Zander, R., and Zou, J.: Atmospheric Chemistry Experiment (ACE): Mission overview, Geophys. Res. Lett., 32, L15S01, https://doi.org/10.1029/2005GL022386, 2005.
Bernath, P., Boone, C., Lecours, M., Crouse, J., Steffen, J., and Schmidt, M.: Global Satellite-Based Atmospheric Profiles from Atmospheric Chemistry Experiment SciSat Level 2 Processed Data, v5.2, 2004–2024, Federated Research Data Repository [data set], https://doi.org/10.20383/103.01245, 2025.
Cisewski, M., Zawodny, J., Gasbarre, J., Eckman, R., Topiwala, N., Rodriguez-Alvarez, O., Cheek, D., and Hall, S.: The Stratospheric Aerosol and Gas Experiment (SAGE III) on the International Space Station (ISS) Mission, Proc. SPIE 9241, Sensors, Systems, and Next-Generation Satellites XVIII, 924107, https://doi.org/10.1117/12.2073131, 2014.
Farman, J. C., Gardiner, B. G., and Shanklin, J. D.: Large losses of ozone in Antarctica reveal seasonal ClOx/NOx interaction, Nature, 315, 207–210, https://doi.org/10.1038/315207a0, 1985.
Flynn, L. E., Seftor, C. J., Larsen, J. C., and Xu, P.: The ozone mapping and profiler suite, in: Earth science satellite remote sensing, edited by: Qu, J. J.. Gao, W., Kafatos, M., Murphy, R. E., and Salomonson, V. V., Springer, 279–296, https://doi.org/10.1007/978-3-540-37293-6_15, 2006.
Frith, S. M., Bhartia, P. K., Oman, L. D., Kramarova, N. A., McPeters, R. D., and Labow, G. J.: Model-based climatology of diurnal variability in stratospheric ozone as a data analysis tool, Atmos. Meas. Tech., 13, 2733–2749, https://doi.org/10.5194/amt-13-2733-2020, 2020.
Godin-Beekmann, S., Azouz, N., Sofieva, V. F., Hubert, D., Petropavlovskikh, I., Effertz, P., Ancellet, G., Degenstein, D. A., Zawada, D., Froidevaux, L., Frith, S., Wild, J., Davis, S., Steinbrecht, W., Leblanc, T., Querel, R., Tourpali, K., Damadeo, R., Maillard Barras, E., Stübi, R., Vigouroux, C., Arosio, C., Nedoluha, G., Boyd, I., Van Malderen, R., Mahieu, E., Smale, D., and Sussmann, R.: Updated trends of the stratospheric ozone vertical distribution in the 60° S–60° N latitude range based on the LOTUS regression model , Atmos. Chem. Phys., 22, 11657–11673, https://doi.org/10.5194/acp-22-11657-2022, 2022.
Jaross, G., Bhartia, P. K., Chen, G., Kowitt, M., Haken, M., Chen, Z., Xu, P., Warner, J., and Kelly, T.: OMPS LimbProfiler instrument performance assessment, J. Geophys. Res.-Atmos., 119, 4399–4412, https://doi.org/10.1002/2013JD020482, 2014.
Kramarova, N. A., Nash, E. R., Newman, P. A., Bhartia, P. K., McPeters, R. D., Rault, D. F., Seftor, C. J., Xu, P. Q., and Labow, G. J.: Measuring the Antarctic ozone hole with the new Ozone Mapping and Profiler Suite (OMPS), Atmos. Chem. Phys., 14, 2353–2361, https://doi.org/10.5194/acp-14-2353-2014, 2014.
Kramarova, N. A., Bhartia, P. K., Jaross, G., Moy, L., Xu, P., Chen, Z., DeLand, M., Froidevaux, L., Livesey, N., Degenstein, D., Bourassa, A., Walker, K. A., and Sheese, P.: Validation of ozone profile retrievals derived from the OMPS LP version 2.5 algorithm against correlative satellite measurements, Atmos. Meas. Tech., 11, 2837–2861, https://doi.org/10.5194/amt-11-2837-2018, 2018.
Kramarova, N. A.: OMPS-NPP L2 LP ozone (O3) vertical profile swath daily center slit V2.6, Goddard Earth Sciences Data and Information Services Center (GES DISC) [data set], Greenbelt, MD, USA, https://doi.org/10.5067/8MO7DEDYTBH7, 2023.
Kramarova, N. A. and DeLand, M.: README document for the Suomi-NPP OMPS LP L2 O3 daily product, Version 2.6, Goddard Earth Sciences Data and Information Services Center (GES DISC), 36 pp., https://disc.gsfc.nasa.gov/datasets/OMPS_NPP_LP_L2_O3_DAILY_2.6/summary?keywords=OMPS (last access: 1 July 2025), 2023.
Kramarova, N. A., Xu, P., Mok, J., Bhartia, P. K., Jaross, G., Moy, L., Chen, Z., Frith, S., DeLand, M., Kahn, D., Labow, G., Li, J., Nyaku, E., Weaver, C., Ziemke, J., Davis, S., and Jia, Y.: Decade-long ozone profile record from Suomi NPP OMPS Limb Profiler: Assessment of version 2.6 data, Earth and Space Science, 11, e2024EA003707, https://doi.org/10.1029/2024EA003707, 2024.
Leblanc, T. and McDermid, I. S.: Stratospheric ozone climatology from lidar measurements at Table Mountain (34.4° N, 117.7° W) and Mauna Loa (19.5° N, 155.6° W), J. Geophys. Res., 105, 14613–14623, https://doi.org/10.1029/2000JD900030, 2000.
Livesey, N. J., Read, W. G., Wagner, P. A., Froidevaux, L., Santee, M. L., Schwartz, M. J., Lambert, A., Millán Valle, L. F., Pumphrey, H. C., Manney, G. L., Fuller, R. A., Jarnot, R. F., Knosp, B. W., and Lay, R. R.: Version 5.0x Level 2 and 3 data quality and description document, Jet Propulsion Laboratory, Tech. Rep. No. JPL D-105336 Rev. B, https://mls.jpl.nasa.gov/data/v5-0_data_quality_document.pdf (last access: 1 July 2025), 2022.
McPeters, R., Frith, S., Kramarova, N., Ziemke, J., and Labow, G.: Trend quality ozone from NPP OMPS: the version 2 processing, Atmos. Meas. Tech., 12, 977–985, https://doi.org/10.5194/amt-12-977-2019, 2019.
Rault, D. F. and Loughman, R. P.: The OMPS limb profiler environmental data record algorithm theoretical basis document and expected performance, IEEE T. Geosci. Remote, 51, 2505–2527, https://doi.org/10.1109/TGRS.2012.2213093, 2013.
SAGE III/ISS Data Products User's Guide, Version 6.0, https://asdc.larc.nasa.gov/documents/sageiii-iss/guide/data_product_users_guide_6.0.pdf (last access: 1 July 2025), 2025.
Salawitch, R. J., Smith, J. B., Selkirk, H., Wargen, K., Chipperfield, M. P., Hossaini, R., Levelt, P. F., Livesey, N. J., McBride, L. A., Millán, L. F., Moyer, E., Santee, M. L., Schoeberl, M. R., Solomon, S., Stone, K., and Worden, H.: The Imminent Data Desert: The Future of Stratospheric Monitoring in a Changing Climate, B. Am. Meteorol. Soc., 106, E540–E563, https://doi.org/10.1175/BAMS-D-23-0281.1, 2025.
Sheese, P. and Walker, K.,: Data Quality Flags for ACE-FTS Level 2 Version 5.2 Data Set, Version 16, Borealis [data set], https://doi.org/10.5683/SP3/NAYNFE, 2023.
Sheese, P. E., Walker, K. A., Boone, C. D., Bourassa, A. E., Degenstein, D. A., Froidevaux, L., McElroy, C. T., Murtagh, D., Russell III, J. M., and Zou, J.: Assessment of the quality of ACE-FTS stratospheric ozone data, Atmos. Meas. Tech., 15, 1233–1249, https://doi.org/10.5194/amt-15-1233-2022, 2022.
SPARC/IO3C/GAW: SPARC/IO3C/GAW Report on Long-term Ozone Trends and Uncertainties in the Stratosphere, edited by: Petropavlovskikh, I., Godin-Beekmann, S., Hubert, D., Damadeo, R., Hassler, B., and Sofieva, V., SPARC Report No. 9, GAW Report No. 241, WCRP-17/2018, https://doi.org/10.17874/f899e57a20b, 2019.
Stauffer, R. M., Thompson, A. M., Kollonige, D. E., Tarasick, D. W., van Malderen, R., Smit, H. G. J., Vömel, H., Morris, G. A., Johnson, B. J., Cullis, P. D., Stübi, R., Davis, J., and Yan, M. M.: An examination of the recent stability of ozonesonde global network data, Earth and Space Science, 9, e2022EA002459, https://doi.org/10.1029/2022EA002459, 2022.
Wang, H. J. R., Damadeo, R., Flittner, D., Kramarova, N., Taha, G., Davis, S., Thompson, A. M., Strahan, S., Wang, Y., Froidevaux, L., Degenstein, D., Bourassa, A., Steinbrecht, W., Walker, K. A., Querel, R., Leblanc, T., Godin-Beekmann, S., Hurst, D., and Hall, E.: Validation of SAGE III/ISS solar occultation ozone products with correlative satellite and ground based measurements, J. Geophys. Res.-Atmos., 125, e2020JD032430, https://doi.org/10.1029/2020JD032430, 2020.
Waters, J. W., Froidevaux, L., Harwood, R. S., Jarnot, R. F., Pickett, H. M., Read, W. G., Siegel, P. H., Cofield, R. E., Filipiak, M. J., Flower, D. A., Holden, J. R., Lau, G. K., Livesey, N. J., Manney, G. L., Pumphrey, H. C., Santee, M. L., Wu, D. L., Cuddy, D. T., Lay, R. R., Loo, M. S., Perun, V. S., Schwartz, M. J., Stek, P. C., Thurstans, R. P., Boyles, M. A., Chandra, K. M., Chavez, M. C., Chen, G-., Chudasama, B. V., Dodge, R., Fuller, R. A., Girard, M. A., Jiang, J. H., Jiang, Y., Knosp, B. W., LaBelle, R. C., Lam, J. C., Lee, K. A., Miller, D., Oswald, J. E., Patel, N. C., Pukala, D. M., Quintero, O., Scaff, D. M., Van Snyder, W., Tope, M. C., Wagner, P. A., and Walch, M. J.: The Earth observing system microwave limb sounder (EOS MLS) on the aura Satellite, IEEE T. Geosci. Remote, 44, 1075–1092, https://doi.org/10.1109/TGRS.2006.873771, 2006.
WMO (World Meteorological Organization): GCOS-22: The 2022 GCOS ECVs Requirements, WMO GCOS-245, WMO, https://library.wmo.int/idurl/4/58111 (last access: 1 December 2025), 2022a.
WMO (World Meteorological Organization): Scientific assessment of ozone depletion: 2022, GAW report No. 278, 509 pp., WMO, https://ozone.unep.org/science/assessment/sap (last access: 1 December 2025), 2022b.
Zou, J., Walker, K. A., Sheese, P. E., Boone, C. D., Stauffer, R. M., Thompson, A. M., and Tarasick, D. W.: Validation of ACE-FTS version 5.2 ozone data with ozonesonde measurements, Atmos. Meas. Tech., 17, 6983–7005, https://doi.org/10.5194/amt-17-6983-2024, 2024.
- Abstract
- Introduction
- The OMPS Limb Profiler and retrieval description
- Correlative satellite and ground-based datasets
- Comparison methodology
- Results
- Comparisons with other data sources
- Comparisons in polar regions
- Conclusions
- Data availability
- Author contributions
- Competing interests
- Disclaimer
- Financial support
- Review statement
- References
- Supplement