
the Creative Commons Attribution 4.0 License.
the Creative Commons Attribution 4.0 License.
 | 27 Aug 2026
Impact of ROMEX Radio Occultation bending angle assimilation on mesoscale weather prediction over the Indian Region
Randhir Singh
Satya P. Ojha
Kudilil Faisal Muhammed
Richard Anthes
Data assimilation experiments were conducted for September 2022 at 9 km horizontal resolution using a cyclic three-dimensional variational (3D-Var) assimilation system. These experiments were designed to assess the impact of a large number of Global Navigation Satellite System (GNSS) radio occultation (RO) bending-angle observations on mesoscale weather prediction over the Indian region during the Indian summer monsoon. To enable this, a bending-angle observation operator was implemented within the WRF (Weather Research and Forecasting) data assimilation system.
Two experiments were performed: a control experiment (CNTL), in which only conventional observations (surface observations from synoptic and METAR stations, upper-air observations from radiosondes, pilot balloons, wind profilers, aircraft measurements, winds derived from geostationary satellites and scatterometers, and marine observations from ships and buoys) were assimilated, and a second experiment (RMX-BA), in which RO bending angle observations from the Radio Occultation Modelling Experiment (ROMEX) were assimilated along with conventional data. A 6 h assimilation cycle was performed throughout September 2022. From the 00:00 and 12:00 UTC analyses, 72 h forecasts were generated daily, resulting in approximately 60 forecast cases.
Forecasts from both experiments were verified against ERA5 reanalysis for water vapor, temperature, and wind, while rainfall forecasts were compared against Integrated Multi-satellite Retrievals for GPM (IMERG) rainfall estimates. The results show that assimilating RO data improves both the analyses and forecasts of specific humidity, temperature, wind, and rainfall compared to the CNTL experiment. The rainfall forecast skill improved significantly, mainly due to more accurate water vapor in the model's initial conditions. The moist total energy norm (TE), which accounts for forecast errors in water vapor, wind, temperature, and pressure, was reduced by about 20 % at the analysis time and by approximately 8.5 % in the 72 h forecast.
Overall, the study demonstrated that assimilation of RO bending angle data significantly improved mesoscale weather forecasts over the Indian region.
- Article
(15926 KB) - Full-text XML
- BibTeX
- EndNote


Satellite observations play a critical role in improving the initial conditions of mesoscale numerical weather prediction (NWP), particularly over regions such as the Indian subcontinent and the surrounding oceanic areas where in situ observations are sparse. High-resolution forecasts are especially sensitive to errors in thermodynamic variables, including temperature and water vapor, which strongly influence convective instability and precipitation processes during the monsoon season. In the absence of dense in situ measurements, satellite observations play a crucial role in constraining the atmospheric state over data-sparse regions and have become one of the most important data sources for NWP, significantly improving forecast skill when assimilated into operational models (Geer et al., 2018).
Among the various satellite observing systems currently available, GNSS-RO has emerged as one of the most impactful sources of high-vertical-resolution atmospheric information in NWP (Cardinali and Healy, 2014; Anthes et al., 2024) with long-term stability and minimal bias (Kursinski et al., 1997; Anthes et al., 2000, 2008). RO observations are obtained by measuring the phase delay and bending of GNSS signals as they propagate through Earth's atmosphere, from which atmospheric refractivity profiles can be derived. These refractivity profiles are directly related to temperature, pressure, and water vapour through well-established physical relationships.
Early RO missions such as CHAMP, GRACE, and FORMOSAT-3/COSMIC demonstrated the utility of RO observations in improving large-scale atmospheric analyses and NWP forecast skill (Anthes et al., 2008). Subsequent operational RO missions, including the MetOp series carrying the GRAS (GNSS Receiver for Atmospheric Sounding) instrument and the COSMIC-2 (FORMOSAT-7) constellation launched in 2019, have significantly increased the availability of RO observations for operational weather forecasting (Schreiner et al., 2020). The COSMIC-2 mission alone consists of six low-Earth-orbit satellites capable of providing more than 5000 high-quality atmospheric profiles per day within ±40° latitude for NWP applications.
Assimilation of RO observations in global NWP systems has been shown to improve temperature analyses in the upper troposphere and lower stratosphere and enhance forecast skill in both medium-range and short-range prediction (Healy and Thepaut, 2006; Cucurull et al., 2007; Poli et al., 2010; Cardinali and Healy, 2014; Bowler, 2020; Hong et al., 2023; Anthes et al., 2024). Many studies have also demonstrated that assimilation of RO observations in regional NWP models improves mid-tropospheric water vapor fields and reduces forecast errors, leading to enhanced precipitation and improved tropical cyclone forecasts (Chen et al., 2009; Huang et al., 2010; Liu and Xue, 2014; Miller et al., 2023, 2026; Johnston et al., 2025; Xuan et al., 2025). Lonitz et al. (2025) showed that RO observations are useful for improving sub seasonal forecasts, with their positive impact remaining evident up to 3–4 weeks. Purwar et al. (2025) demonstrated the positive impact of both ground-based and space-based GNSS observations on extreme rainfall events over Karnataka, India.
Traditionally, refractivity profiles derived from RO measurements have been assimilated into limited-area NWP systems. However, refractivity retrieval involves inversion procedures that introduce background-dependent assumptions and smoothing effects. In contrast, bending angle observations are closer to the original occultation measurements and therefore retain higher information content (Healy et al., 2007; Healy and Thepaut, 2006; Healy, 2001; Cucurull et al., 2007, 2013). Several studies have demonstrated that assimilation of bending angles can provide improved thermodynamic analyses compared to refractivity assimilation, particularly in data-sparse regions (Healy and Thepaut, 2006; Cucurull et al., 2007). Therefore, most operational centers assimilate bending angles rather than refractivity.
In recent years, the availability of RO observations has increased substantially due to the emergence of commercial missions. Private satellite constellations operated by companies such as Spire Global and PlanetiQ provide large volumes of RO observations using low-cost CubeSat platforms. The increasing number of commercial RO satellites has led to a significant growth in the global availability of atmospheric profiles, and today commercial and government RO constellations can collectively provide more than 20,000 atmospheric soundings per day for weather forecasting applications.
Furthermore, observations disseminated through the Global Telecommunication System (GTS) for operational NWP systems typically represent only a subset of the available RO observations. The Radio Occultation Modeling Experiment (ROMEX) provides a significantly higher density of RO profiles (Anthes et al., 2024) for a three-month period (September–November 2022). ROMEX is an international collaborative initiative aimed at assessing the scientific and operational benefits of substantially increasing the number of RO observations for NWP and climate applications well beyond current operational availability. During ROMEX, RO observations from both government-funded missions and commercial satellite constellations were collected, processed, archived, and made available for research and data assimilation experiments. This combined dataset consisted of approximately 30 000–35 000 RO profiles per day, nearly three times the number of profiles typically available in operational NWP systems during the same period. Anthes et al. (2025) evaluated the biases and uncertainties of ROMEX data and confirmed the quality and compatibility of these high-volume observations for NWP assimilation.
Several recent global assimilation studies within the framework of ROMEX have demonstrated that increasing the number of assimilated RO profiles leads to improved forecast skill across key atmospheric variables such as temperature, humidity, geopotential height, and wind speed. For example, Zhang et al. (2025) showed that assimilating larger numbers of RO observations in the NOAA Global Forecast System (GFS) significantly reduces forecast errors and enhances verification metrics against both observations and analyses compared to experiments with fewer RO profiles, with benefits persisting up to 5 d of forecast. Other studies have shown that assimilating ROMEX observations improves forecasts of tropical cyclones (Johnston et al., 2025) and atmospheric rivers (Lin et al., 2026). These studies confirm that forecast improvements generally scale with the number of RO profiles assimilated, with little evidence of saturation even at densities (35 000 profiles per day) much higher than typical operational levels.
The objective of the present study is to evaluate the impact of assimilating ROMEX bending angle observations on mesoscale NWP over the Indian region. Data assimilation experiments were conducted using the WRF model and its data assimilation system during the end of the summer monsoon period, September 2022. The Indian summer monsoon extends from June to September; however, the ROMEX data are available only from September to December 2022. Therefore, only September overlaps with the monsoon season, and hence this month was used to assess the impact of the ROMEX data. This study is the first to assimilate ROMEX bending angle observations into the WRF model to evaluate their impact on regional weather prediction over the Indian region.
2.1 WRF model
The Advanced Research Weather Research and Forecasting (WRF-ARW) model was used to conduct the numerical experiments (Skamarock et al., 2019). The model domain covers the Indian region and adjoining oceans with a horizontal grid spacing of 9 km and consists of 600 × 600 grid points, with the domain centre located at 20° N, 80° E (Fig. 1).
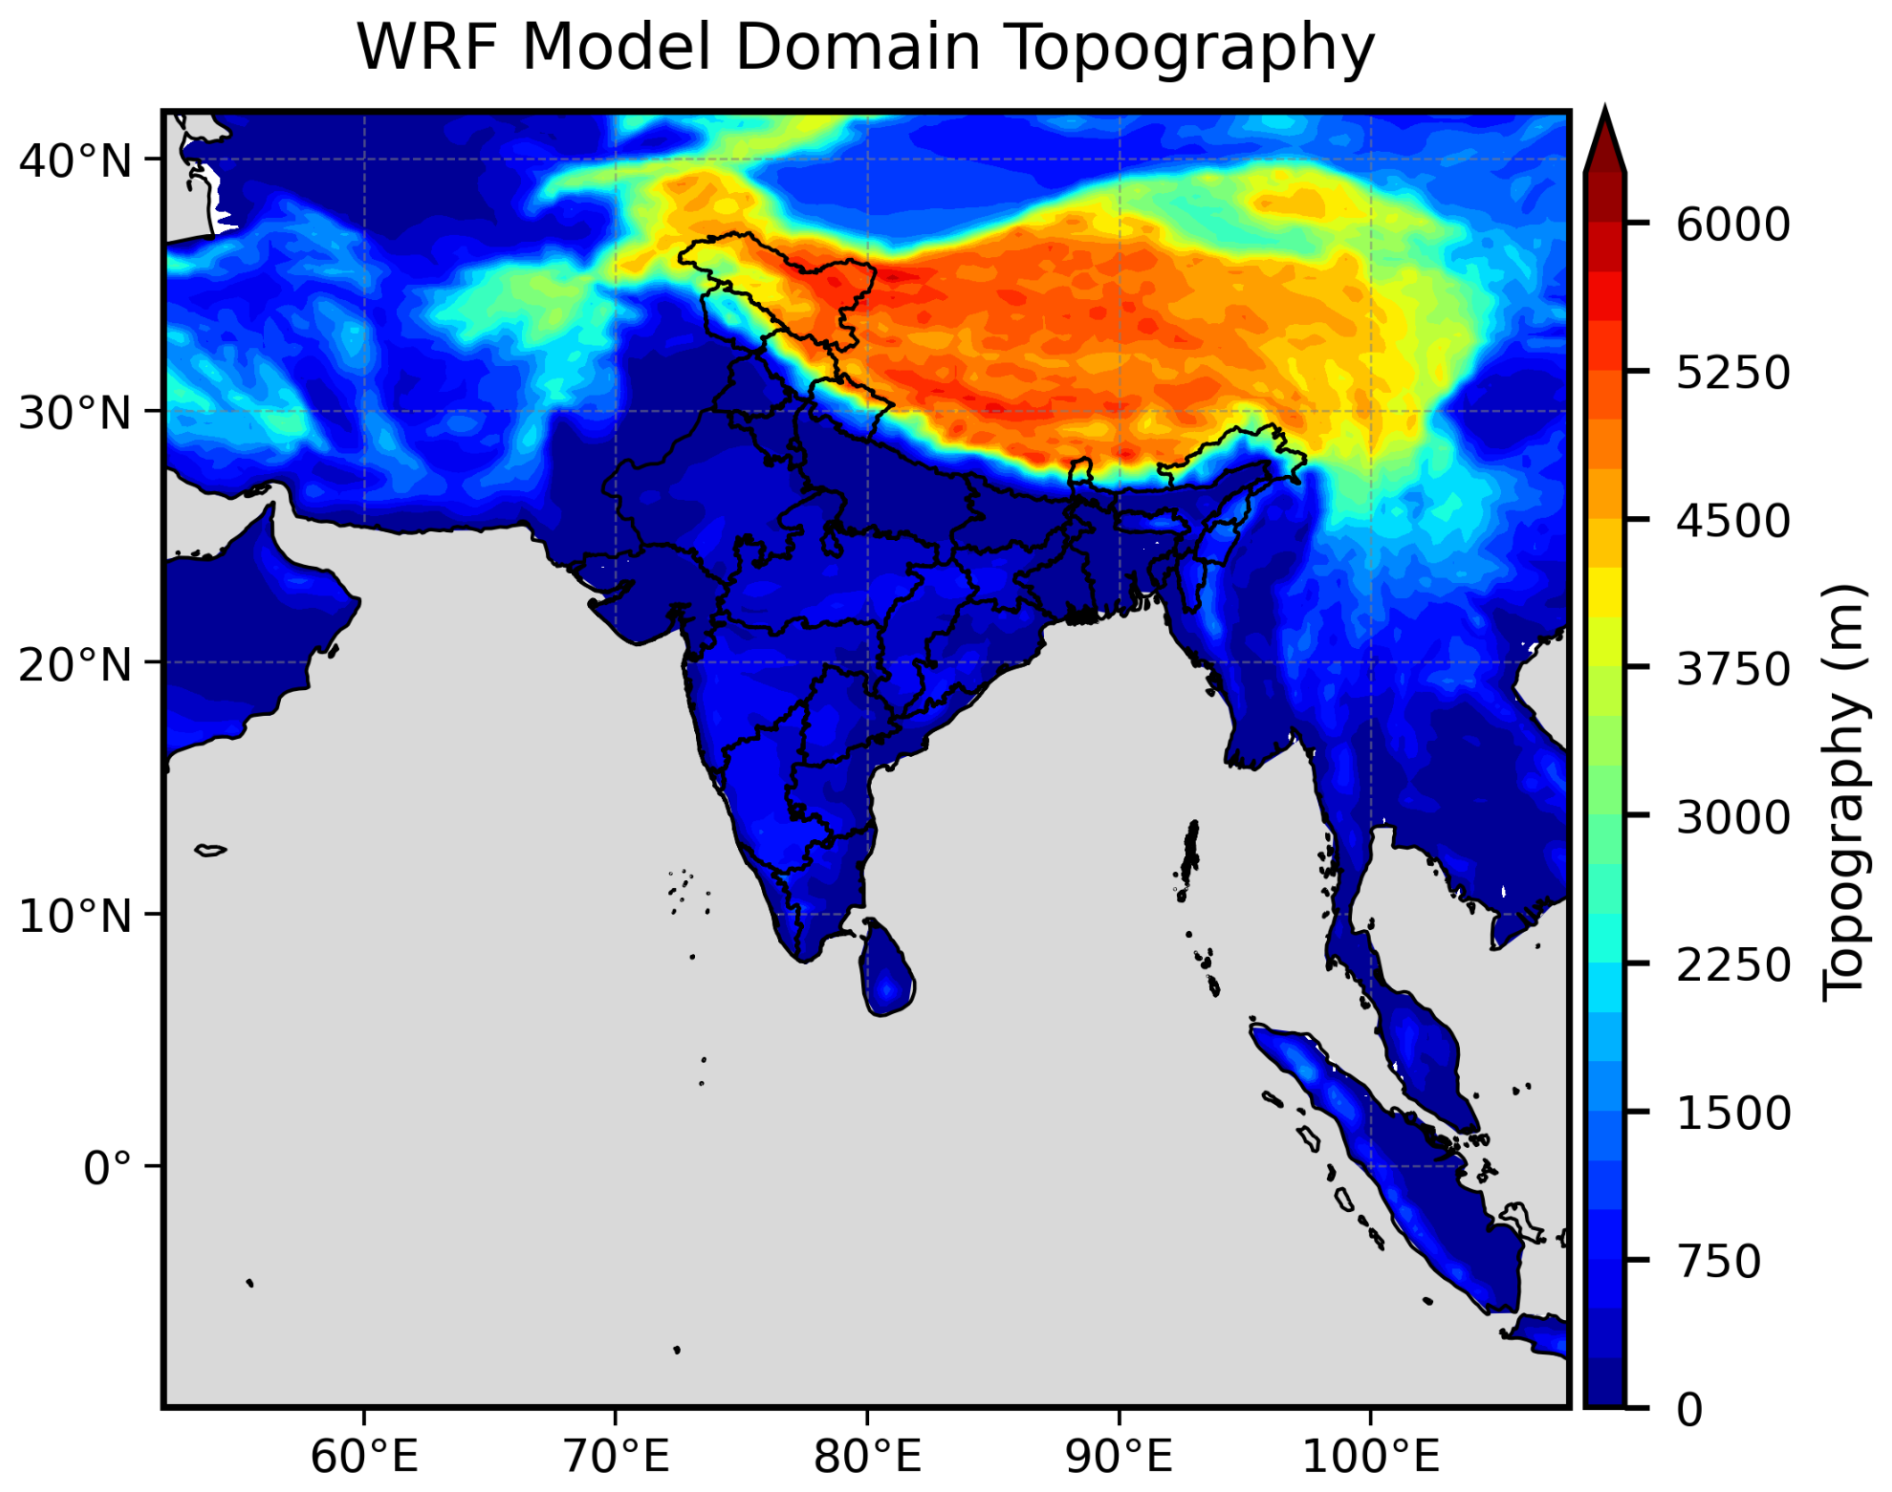
Figure 1WRF model domain and topography used in this study. The domain covers the Indian region and adjoining oceanic areas at 9 km horizontal resolution.
The model configuration includes 41 vertical levels extending from the surface to a model-top pressure of 10 hPa. The physical parameterization schemes employed include the WSM6 graupel microphysics scheme, the Kain–Fritsch (new Eta) cumulus parameterization, the Yonsei University (YSU) planetary boundary layer scheme, the Noah land surface model, and the Dudhia shortwave and longwave radiation schemes.
2.2 WRF data assimilation (WRF-DA)
Data assimilation was performed using the WRF-DA system employing the three-dimensional variational (3D-Var) technique (Barker et al., 2012). The background error covariance matrix was generated using the NMC (National Meteorological Center) method (Parrish and Derber, 1992), based on differences between 48 and 24 h WRF forecasts. Bending angle observations from ROMEX were assimilated using the WRF-DA radio occultation forward operator, which computes model-equivalent bending angles. By default, WRF-DA can directly assimilate only refractivity observations, and a bending angle observation operator is not available in the standard WRF-DA system. Since ROMEX provides bending angle measurements rather than refractivity, a bending angle observation operator was integrated into the WRF-DA system for this study. The bending angle operator formulation proposed by the ROM SAF was adopted and implemented within the WRF-DA system. Details of the bending angle observation operator implemented in WRF-DA are described in Sect. 2.4.
2.3 Experimental design
First, a control (CNTL) experiment was performed in which only conventional observations (surface observations from synoptic and METAR stations, upper-air observations from radiosondes, pilot balloons, wind profilers, aircraft measurements, winds derived from geostationary satellites and scatterometers, and marine observations from ships and buoys) were assimilated. In the second experiment (RMX-DA), conventional observations were assimilated together with bending angle observations from ROMEX. The only difference between the two experiments was the use of RO bending angle observations. It should be noted that the RO data provided by ROMEX are in the ECMWF BUFR format, whereas WRFDA requires the observations in the NCEP BUFR format. Therefore, a format conversion utility was developed to convert the ROMEX BUFR files into the NCEP BUFR format prior to data assimilation. To better isolate and assess the maximum potential of ROMEX data, radiance observations were intentionally excluded from the assimilation in this study. All observations assimilated in the model underwent a quality-control procedure in which observations differing from the background by more than five times the specified observation error were rejected. This is the default quality-control procedure implemented in WRF-DA. The same criterion was applied to RO observations. For conventional observations, the observation error information is included in the BUFR data. Therefore, the observation errors were taken directly from the BUFR data. However, for GNSS-RO observations, the bending-angle error is estimated using an approach similar to that adopted in the NCEP GFS (GSI data assimilation) operational system (Cucurull et al., 2007, 2013; Kleist et al., 2009). It should be noted that in the operational GFS configuration, RO assimilation is implemented conservatively with relatively larger observation error assumptions. In this study, the same quality control procedures and error specifications as those used in GFS were adopted, and no additional experiments with alternative quality control criteria or error settings were conducted.
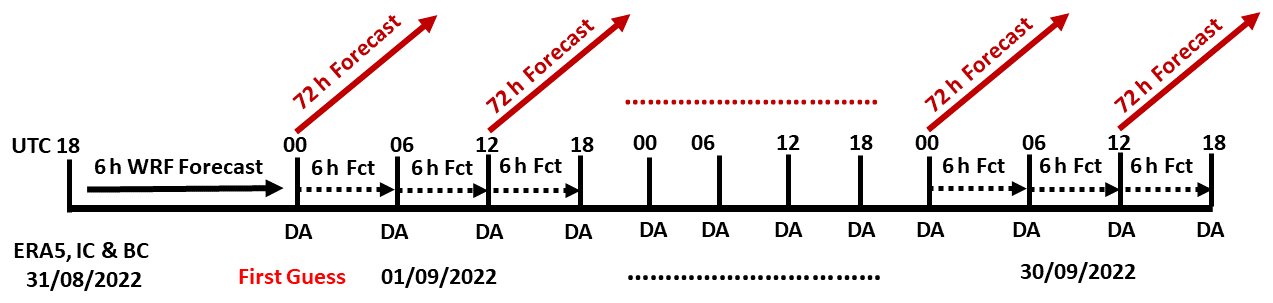
Figure 2Cyclic data assimilation framework and forecast design used in this study. Analyses were produced every 6 h, and 72 h forecasts were launched from the 00:00 and 12:00 UTC analyses.
A 6-hourly data assimilation cycling was performed in which analyses were produced at synoptic hours (00:00, 06:00, 12:00, and 18:00 UTC) using an assimilation window of ±3 h. The first assimilation was performed at 00:00 UTC on 1 September 2022, using a 6 h WRF forecast initialized from the ERA5 reanalysis (Hersbach et al., 2020) at 18:00 UTC on 31 August 2022. A total of 120 analyses were produced over the entire month. The 6-hourly ERA5 reanalysis was used to provide the model boundary conditions. A 72 h forecast was generated daily at 00:00 and 12:00 UTC throughout September 2022. All experiments were conducted at 9 km resolution over identical periods and with the same forecast lengths to isolate the impact of RO assimilation. Figure 2 shows the data assimilation framework adopted in this study.
2.4 RO bending-angle forward observation operator
RO refractivity profiles assimilated in NWP systems are typically obtained through an Abel inversion of bending angle measurements. However, refractivity retrieval involves smoothing and background-dependent assumptions that can introduce representativeness errors and reduce the effective information content of the observations, as discussed by Healy and Thepaut (2006). In contrast, bending angle observations represent a more direct measurement derived from the phase delay of GNSS signals as they traverse the atmosphere. Assimilation of bending angle measurements therefore enables the use of higher-information-content observations while avoiding the additional assumptions introduced during refractivity retrieval.
In most operational NWP systems, a 1D forward operator is used for RO bending angle assimilation because it is computationally efficient and simple to implement. The 1D operator assumes that the atmosphere is horizontally uniform around the tangent point (spherically symmetric) and computes bending angles from a single vertical refractivity profile using the Abel transform. However, this assumption ignores horizontal gradients and can introduce errors in regions with strong horizontal variability, such as fronts, convection, monsoon systems, and tropical cyclones (Kursinski et al., 1997; Healy, 2001). Therefore, in this study we use a 2D forward operator, which accounts for horizontal variability in the vertical plane of the occultation and performs ray tracing through a two-dimensional refractivity field. This approach provides a more realistic representation of the atmosphere and helps reduce forward-model errors, especially in dynamically active mesoscale regions (Zou et al., 1999; Syndergaard, 2012). Although the 2D operator is computationally more expensive, it is better suited for studies focusing on mesoscale processes and regions with strong horizontal gradients.
The two-dimensional (2D) bending angle forward operator was integrated into the WRF-DA system, enabling the direct assimilation of RO bending angle observations. The two-dimensional (2D) bending angle observation operator used in this study was originally developed at ECMWF (Eyre, 1994; Healy et al., 2007). It comprises the forward (FWD), tangent linear (TL), and adjoint (AD) operators required for variational data assimilation. This operator is implemented within the Radio Occultation Processing Package (ROPP) (Culverwell et al., 2015), which is maintained under the EUMETSAT Radio Occultation Meteorology Satellite Application Facility (ROM SAF). A detailed technical description of the operator is provided in the official ROPP user guide (ROM SAF, 2021).
In brief, the 2D operator requires meteorological variables defined along the occultation plane for each ray path (Fig. 3).
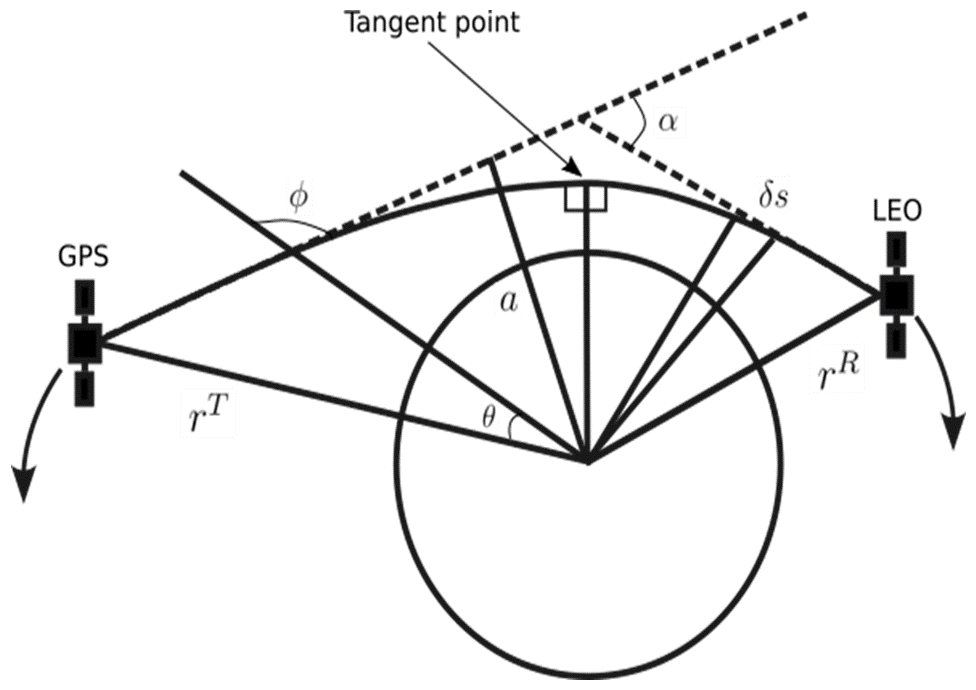
Figure 3Geometry of GNSS radio occultation and the occultation plane used by the two-dimensional bending-angle forward operator.
The occultation plane is constructed using 31 vertical profiles extracted at equally spaced locations, with an angular separation of radians, corresponding to a horizontal spacing of approximately 40 km at the Earth's surface. These configuration settings follow Healy et al. (2007). The parameters required to define the occultation plane – such as geolocation, impact parameter, and azimuth angle at the tangent point – are directly obtained from the observation files.
Refractivity (N) at model levels is calculated from vertical profiles of air pressure (P), water vapor pressure (e), and temperature (T) using the two-term empirical formula proposed by Smith and Weintraub (1953).
The calculation is performed without considering the effects of non-ideal gas compressibility (Aparicio and Deblonde, 2009). The refractive-index radius product, nr, is pre-computed at the model levels and used as a two-dimensional input field for the ray tracer. We assume a single occultation point for each bending angle within a profile; therefore, tangent point drift is neglected. The bending angle is calculated by numerically solving the differential equations that describe the ray path in circular polar (r, θ) coordinates (Rodgers, 2000).
Here, s represents the distance along the ray path, n is the atmospheric refractive index at a given point along the ray, and ϕ is the angle between the local radius vector and the tangent to the ray path. These equations are solved using a fourth-order Runge–Kutta method with an adaptive step size. It is assumed that refractivity varies exponentially with height between model levels. The analytical formula proposed by Healy and Thepaut (2006) was used to calculate the bending angle above the model top using a 1D approach. The model variables used in this formulation are extrapolated using variables at the top of the model.
3.1 Assimilated GNSS-RO observations
Figure 4 shows the temporal variation in the number of RO profiles assimilated in RMX-BA experiment at each 6 h assimilation cycle throughout the study period.
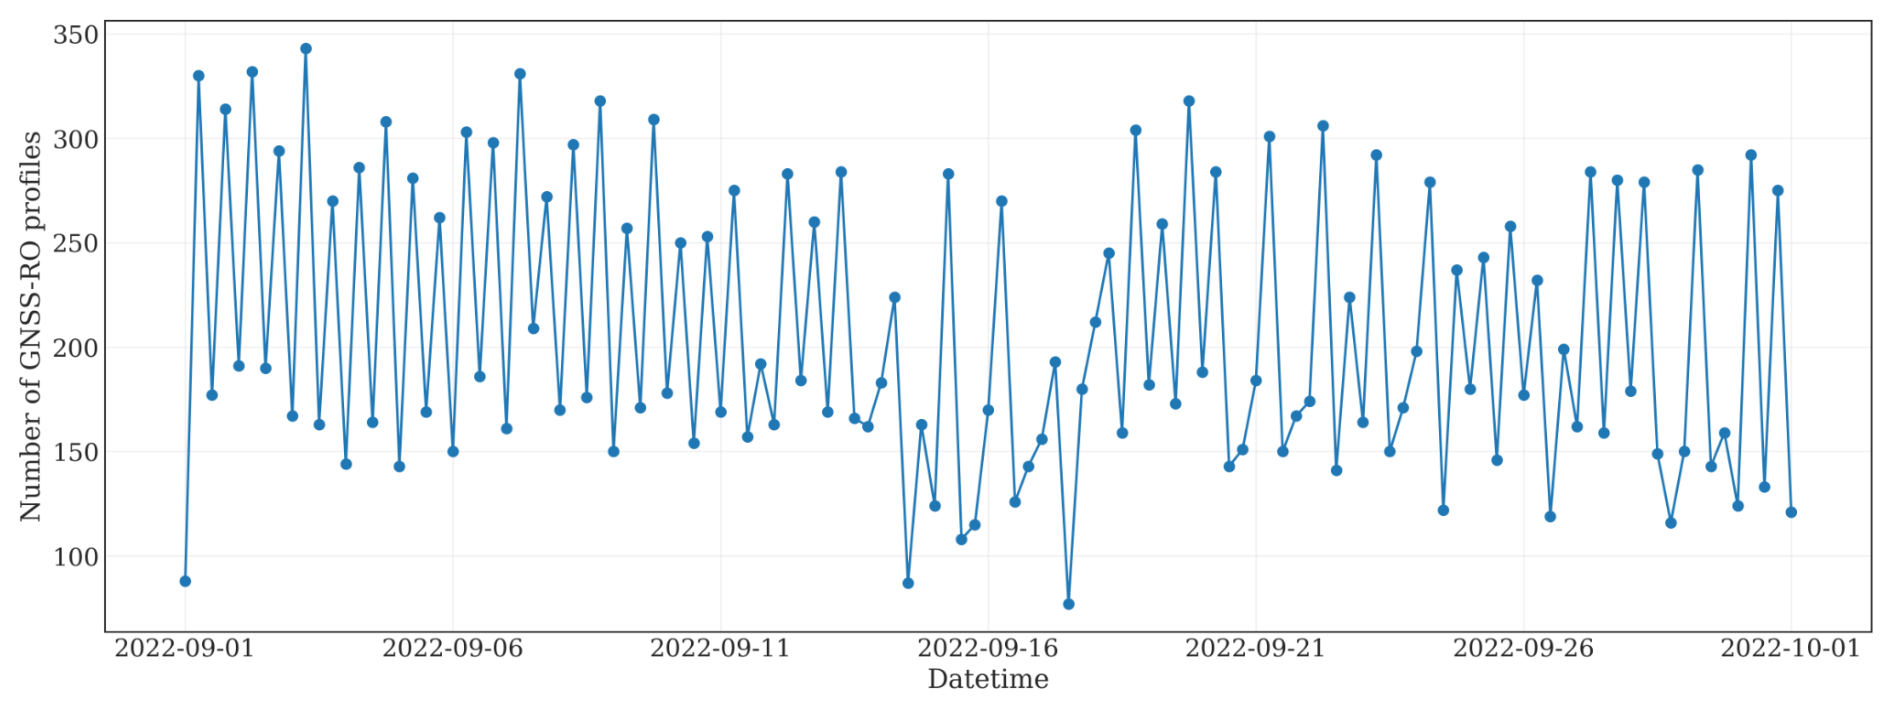
Figure 4Temporal variation in the number of GNSS-RO profiles assimilated in the RMX-BA experiment for each 6 h analysis cycle during September 2022.
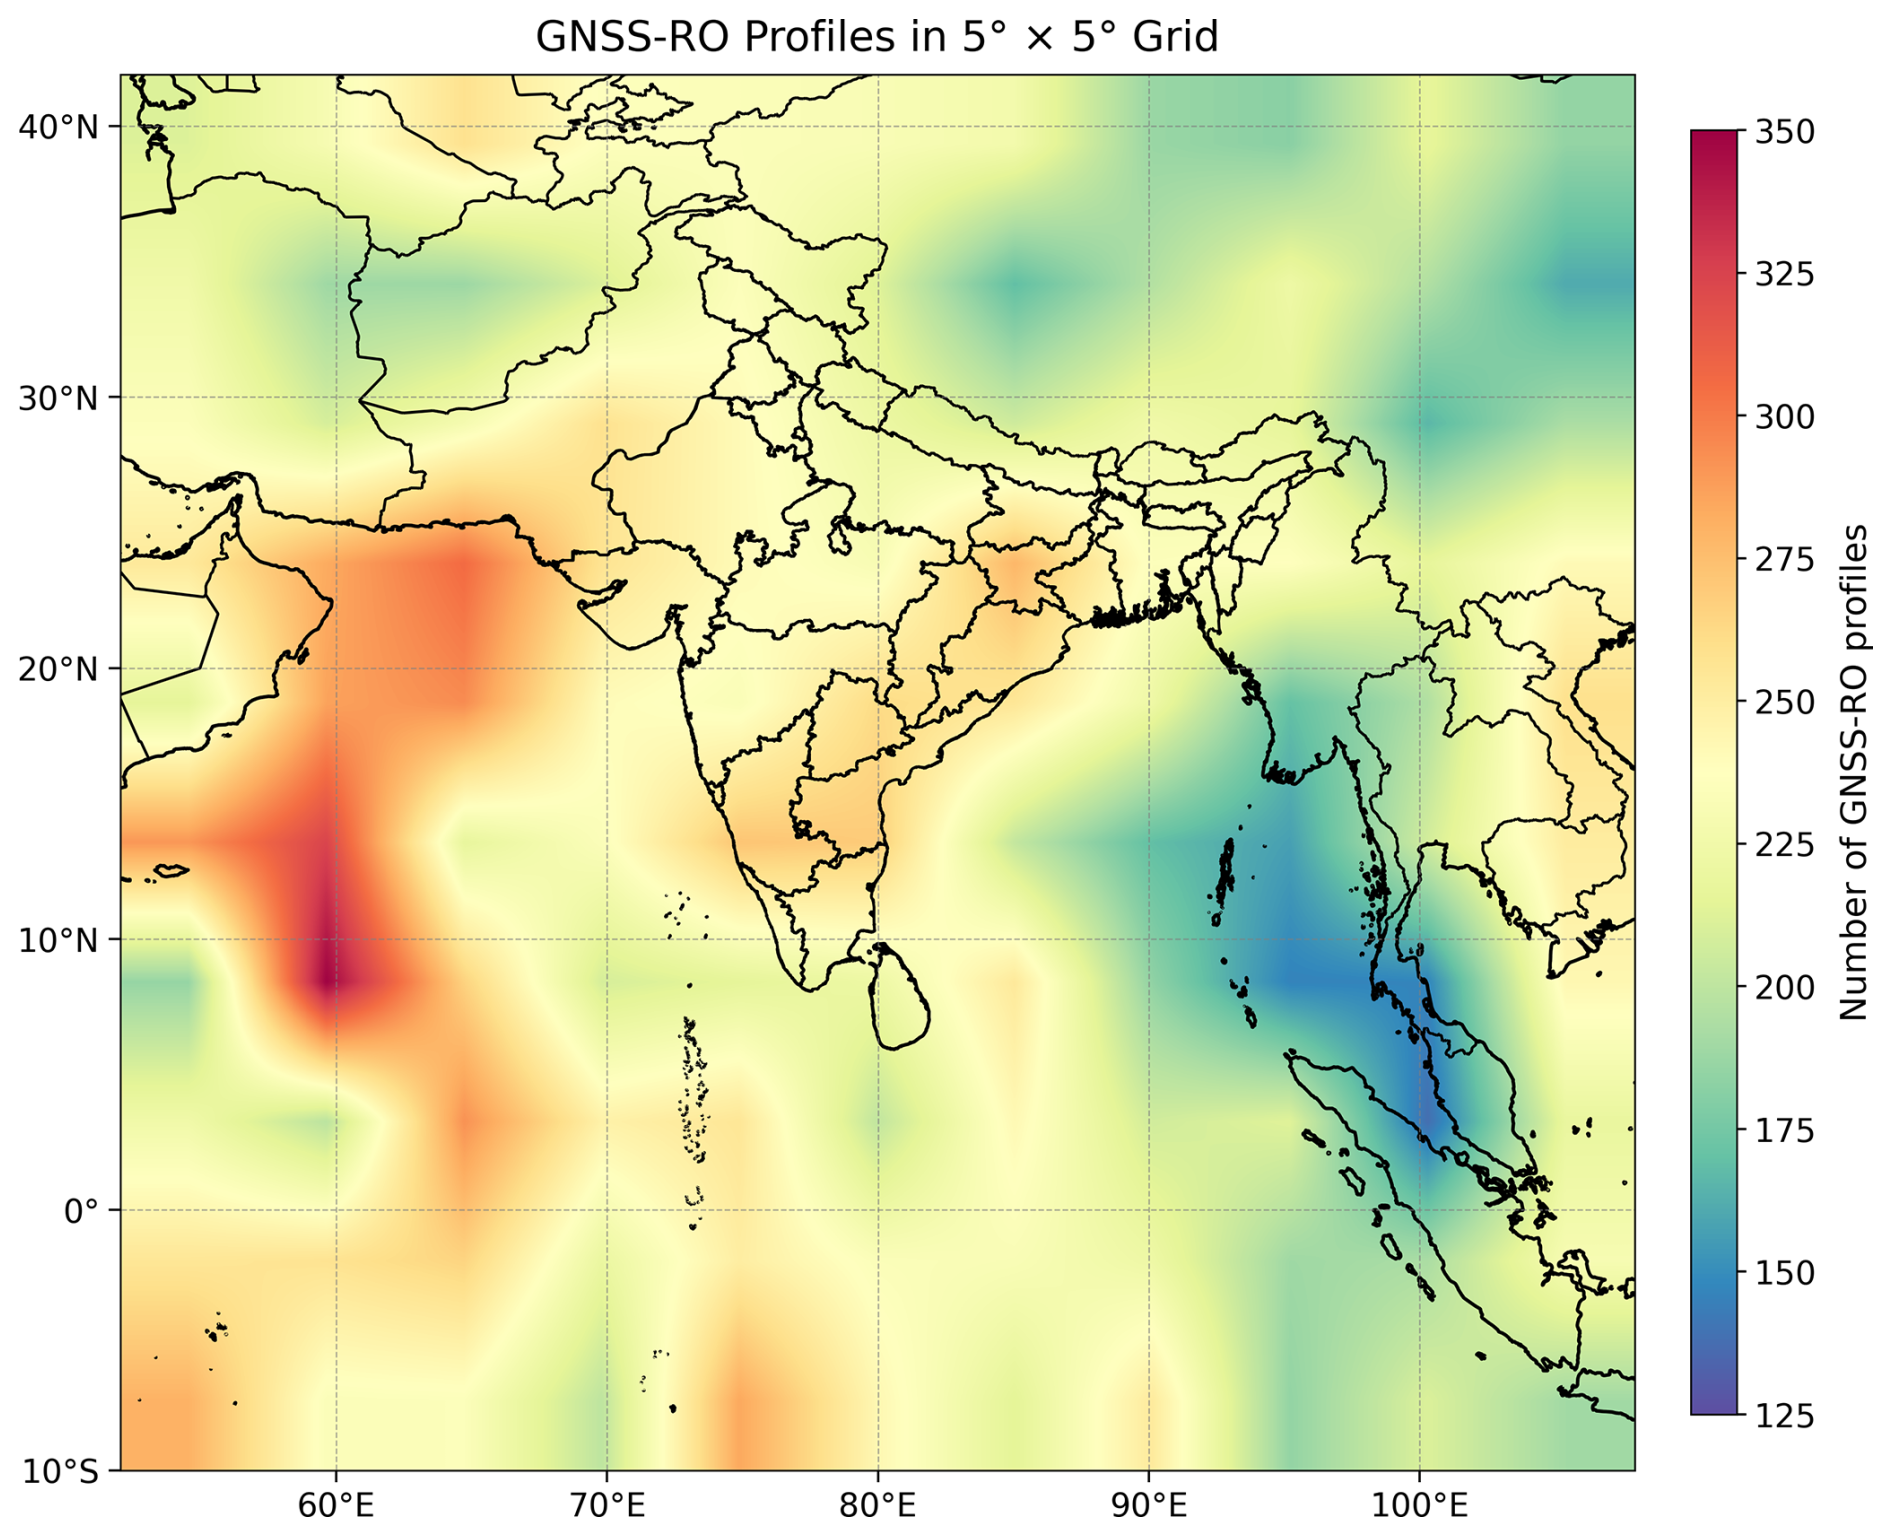
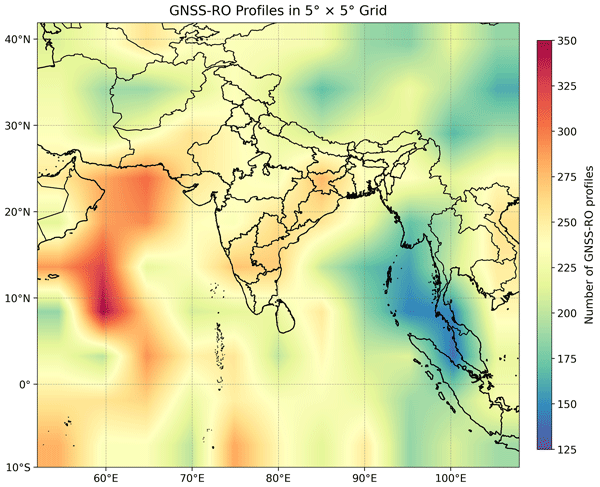
Figure 5Spatial distribution of assimilated GNSS-RO profiles accumulated over the study period on a 5° × 5° grid.
The number of assimilated profiles ranges from 90 to 345. Figure 5 presents the spatial distribution of assimilated profiles on a 5° × 5° grid for each experiment, accumulated over the entire period.
Relatively higher counts are observed over the Arabian Sea and along the east coast of India, where values reach about 300–350 profiles per 5° × 5° grid box. Over most other regions, the number of profiles ranges between about 150 and 250 per 5° × 5° grid box.
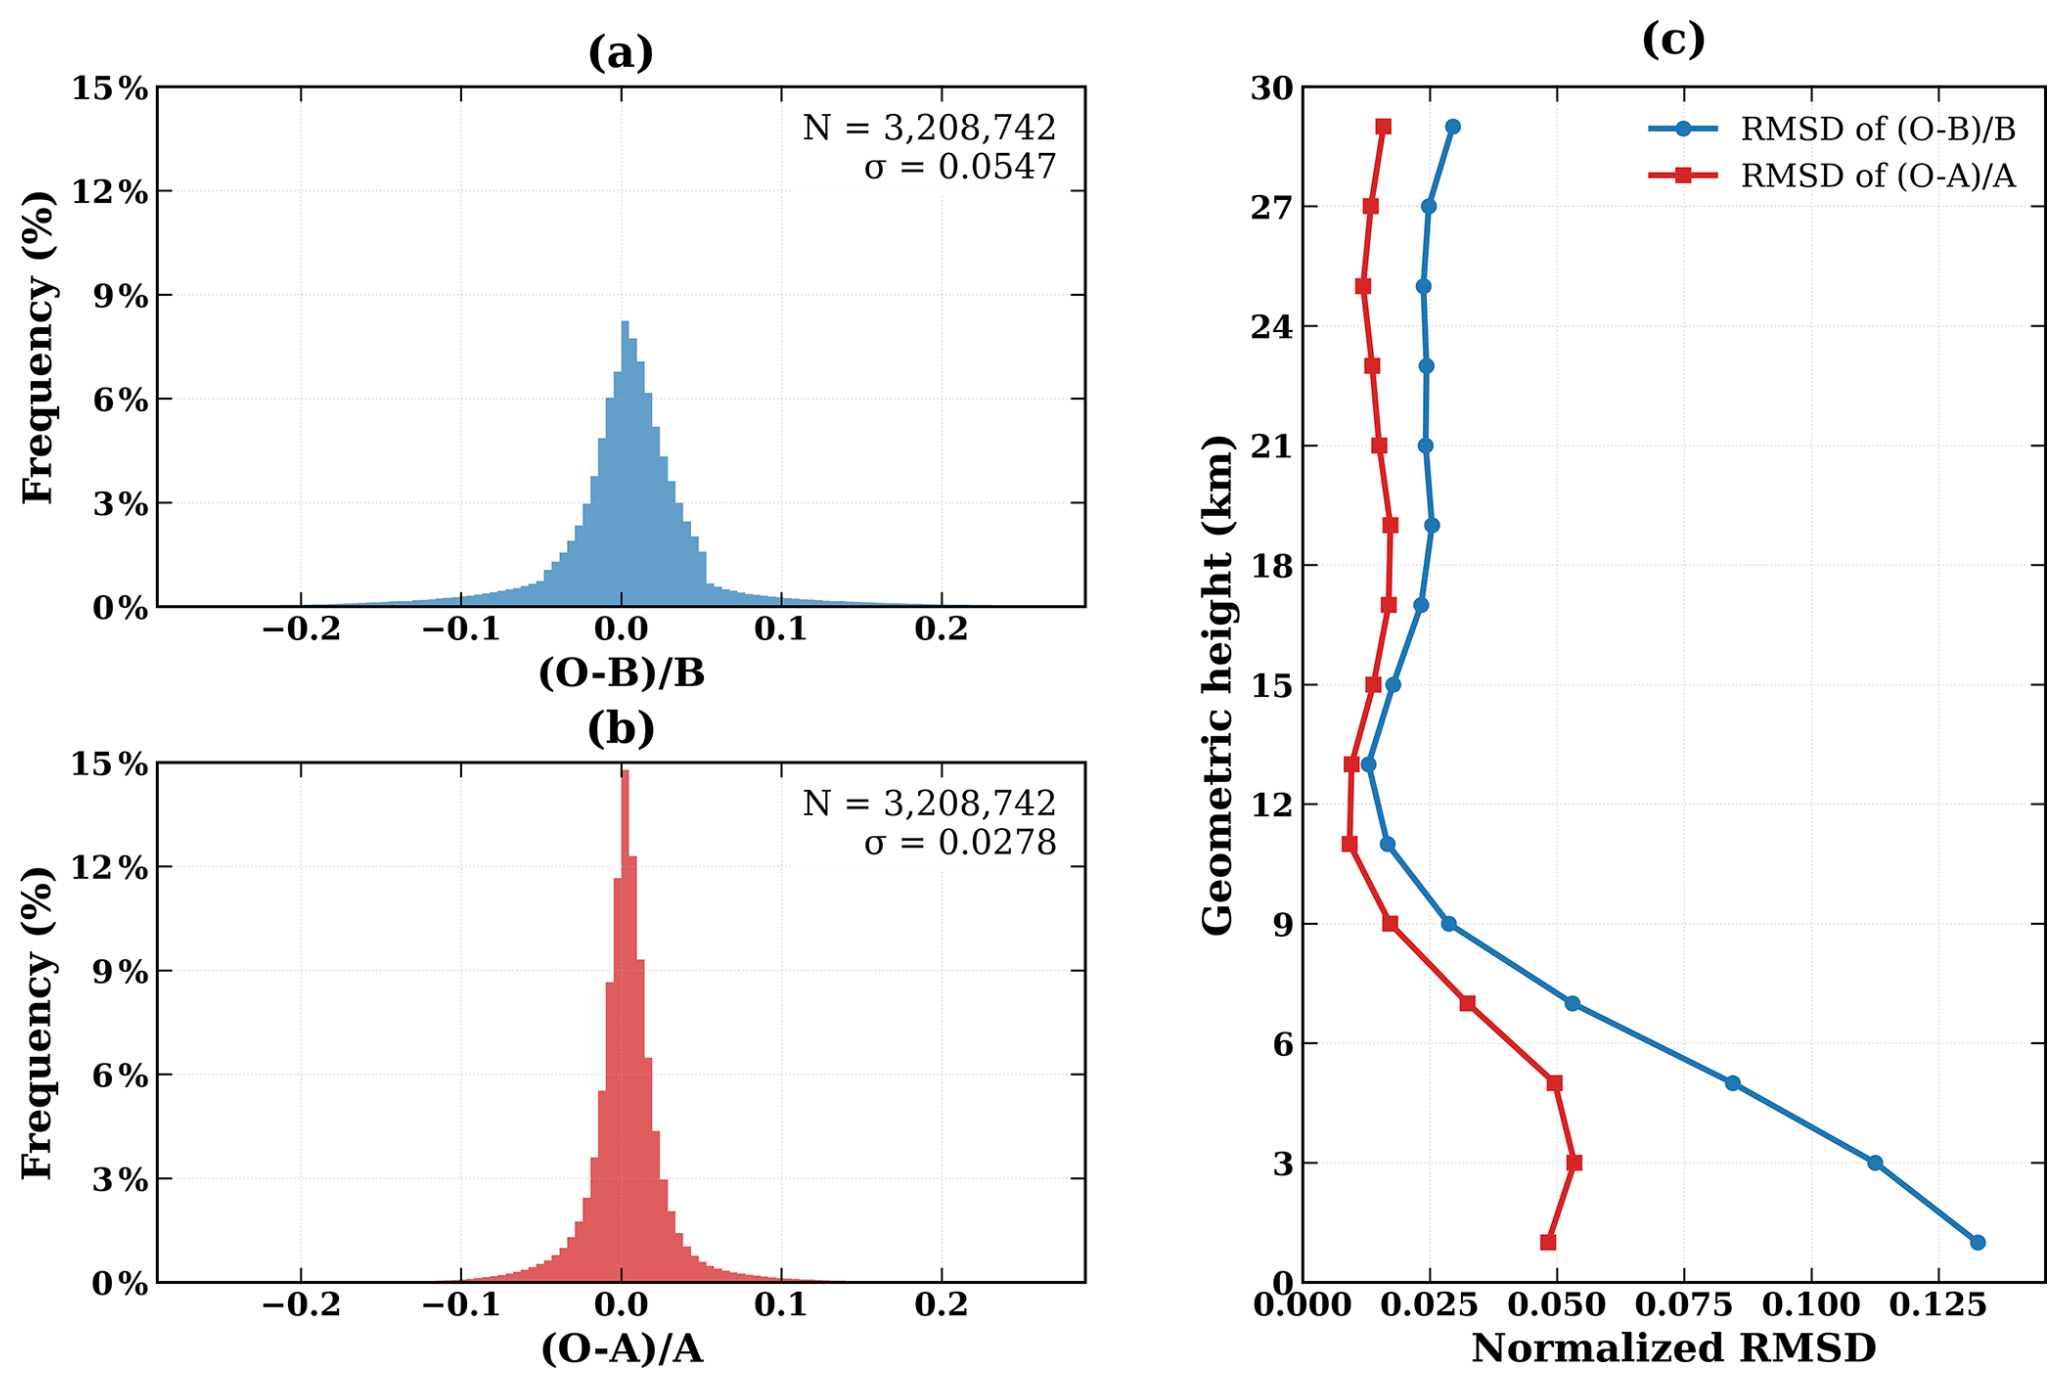
Figure 6Histograms of the normalized (a) observation-minus-background (O−B) and (b) observation-minus-analysis (O−A) departures, and (c) vertical profiles of the corresponding normalized RMSD for the RMX-BA experiment.
Figure 6 shows the histograms of the normalized observation-minus-background (O−B) and observation-minus-analysis (O−A) departures, together with the vertical profiles of their normalized RMSD for the RMX-BA experiment as a function of geometric height.
The total number of assimilated bending angle observations is about 3.2 million. The figure shows that the normalized O−A departures are more tightly distributed around zero than the normalized O−B departures, indicating that the analysis is closer to the assimilated bending-angle observations. The standard deviation decreases from 0.0547 for normalized O−B to 0.0278 for normalized O−A, showing a clear reduction in the spread of departures after assimilation. The vertical profiles also show that the normalized RMSD of O−A is lower than that of O−B at almost all height levels. The improvement is particularly evident in the lower troposphere, where the background RMSD is relatively large and is substantially reduced in the analysis. Above about 12 km, both RMSD profiles become smaller, but the O−A RMSD remains consistently lower than O−B, indicating a positive impact of the RMX-BA assimilation throughout the vertical column.
3.2 Assessment of RO assimilation performance
During September 2022, a total of 120 analyses were produced in each experiment at 6 h intervals. The model was integrated to generate 72 h forecasts daily from the 00:00 and 12:00 UTC analyses. Thus, a total of 60 forecasts of 72 h period were used to compute the error statistics.
To assess the impact of RO bending angle assimilation, the quality of the WRF analyses and subsequent forecasts of water vapor, temperature, and wind from both experiments was evaluated by comparison with ERA5 reanalysis, while precipitation forecasts were verified against Integrated Multi-satellite Retrievals for GPM (IMERG) rainfall estimates (Huffman et al., 2020; Prakash et al., 2016). Although ERA5 assimilates a limited subset of the ROMEX observations, most of the available ROMEX data were not assimilated; ERA5 can therefore be regarded as a largely, though not fully, independent reference for verification. Standard verification metrics, including bias, root-mean-square difference (RMSD), and standard deviation differences (SD), were computed for wind, temperature, and specific humidity at different pressure levels and forecast lead times. For rainfall, standard skill scores were calculated at various rainfall thresholds and forecast hours. In addition to these metrics, the moist total energy norm (TE) was used as an error measure. The TE is a vertically integrated metric that combines contributions from pressure, temperature, wind, and water vapor, and is considered one of the most comprehensive single metrics for evaluating overall model performance (Ehrendorfer et al., 1999).
3.2.1 Evaluation using moist total energy norms
The domain-averaged moist total energy (TE) norm, computed by comparing the analyses and forecasts against the ERA5 reanalysis, is presented in Fig. 7.
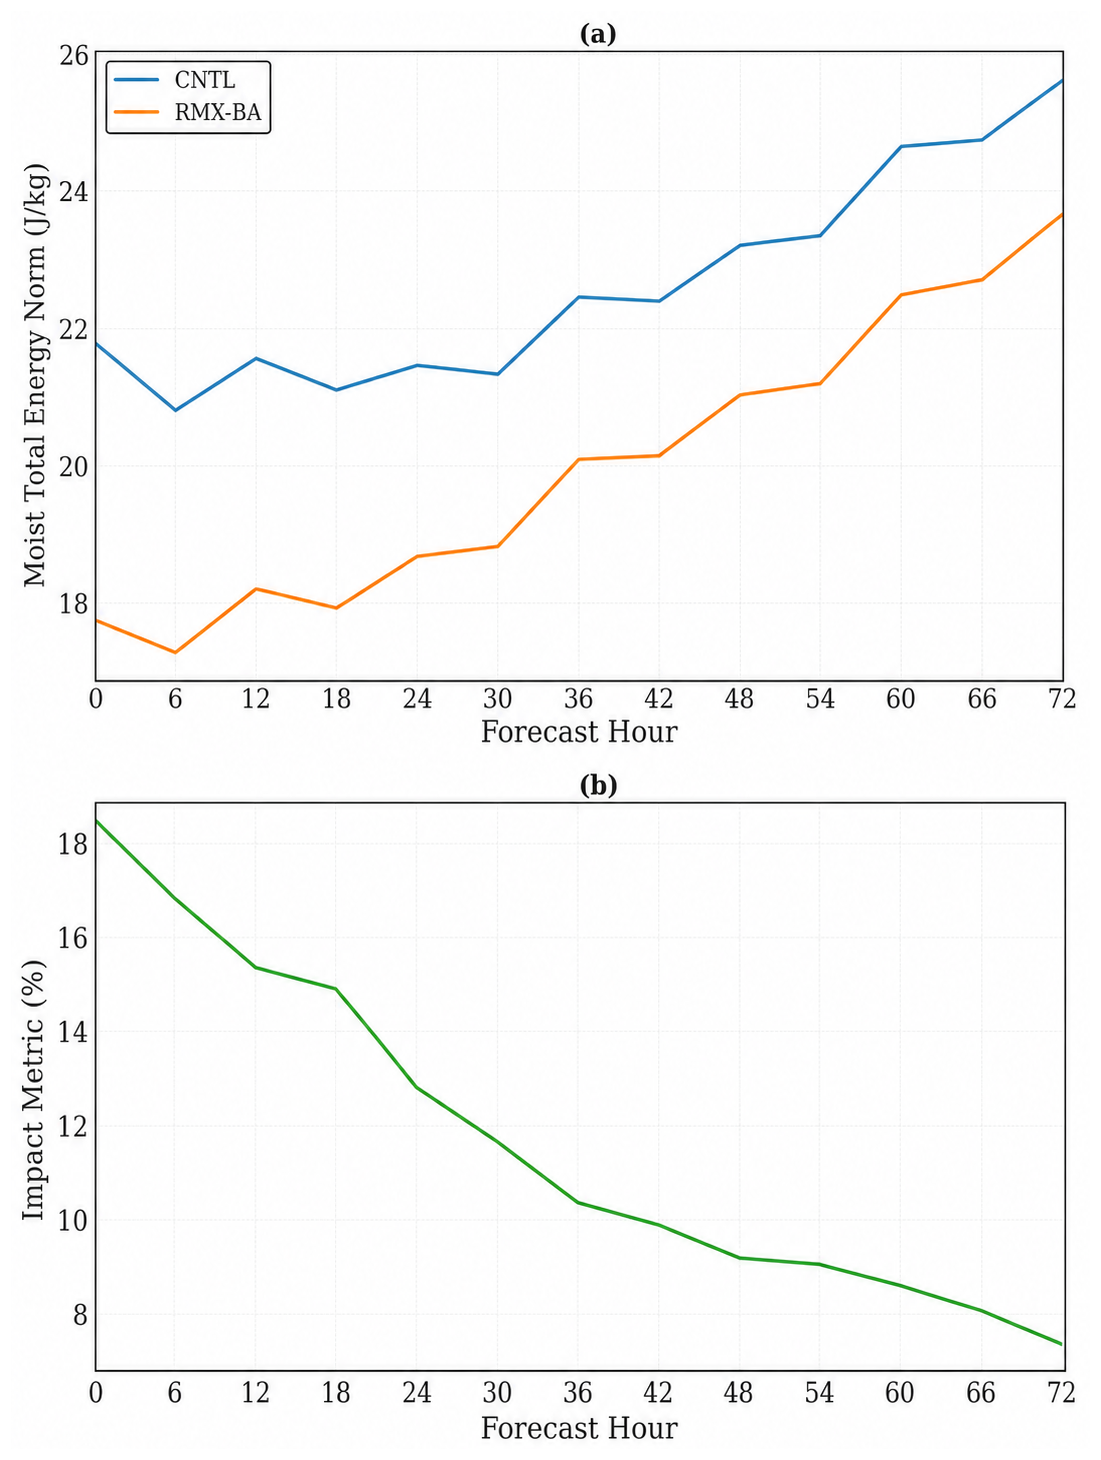
Figure 7Domain-averaged moist total energy norm for CNTL and RMX-BA as a function of forecast lead time, together with the corresponding impact metric derived from the total-energy norm.
Lower TE values correspond to smaller forecast errors. In the CNTL experiment, TE ranges between 21.8 and 27 J kg−1, whereas in the RMX-BA experiment it varies from 17.5 to 24.5 J kg−1. As expected, TE exhibits a systematic increase with forecast lead-time, with the minimum error observed at the analysis time (0 h forecast) and the maximum error at the 72 h forecast (Fig. 7a).
To assess the impact of RO assimilation, an Impact Metric (IM) is defined (Eq. 5), representing the reduction in total energy (TE) error attributable to the inclusion of RO observations. Positive IM values denote a favourable impact of the RO data, while negative values indicate a deterioration of the forecast resulting from their assimilation.
TECNTL and TERMX-BA denote the total moist energy (TE) values in the CNTL and RMX-BA, respectively. The assimilation of RO observations leads to a consistent reduction in forecast errors across all lead times, with maximum improvements of 20 % at analysis time, 15 % at 24 h, 10.5 % at 48 h, and 8.5 % at 72 h (Fig. 7b).
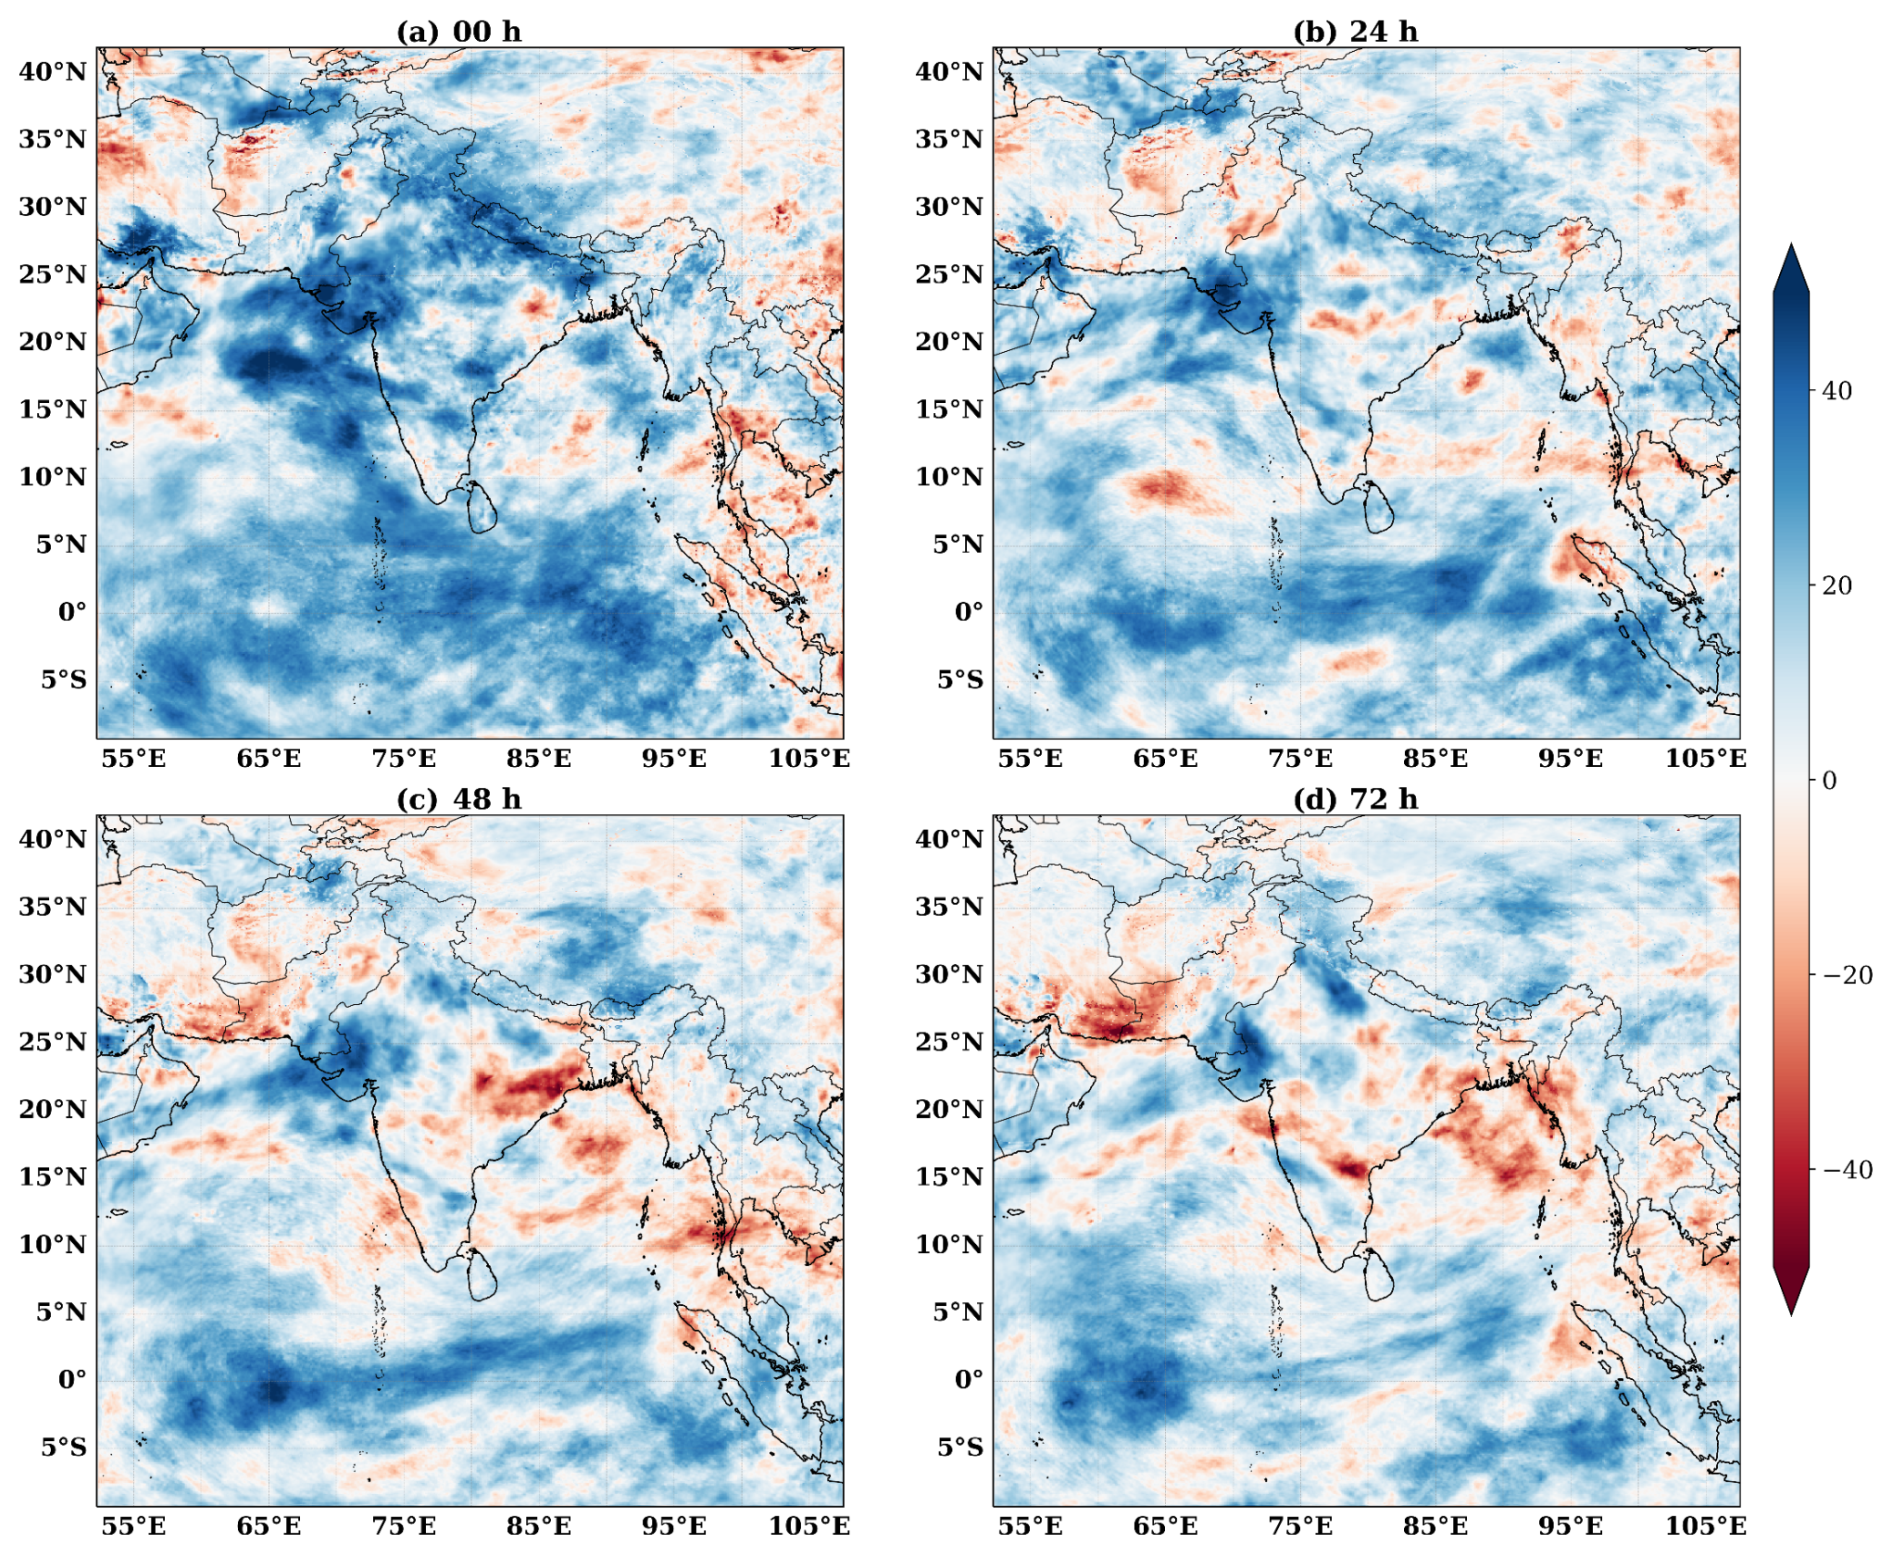
Figure 8Spatial distribution of the TE impact metric at forecast lead times of 00, 24, 48, and 72 h. Positive values indicate improvement due to RO assimilation.
Figure 8 presents the spatial distribution of the TE Impact Metric (IM) at various forecast lead times, with positive values indicating improvement or benefit from the addition of RO observations.
The results indicate that a substantial portion of the domain exhibits positive IM values, with magnitudes reaching up to 40 %–50 %, thereby demonstrating the beneficial impact of RO assimilation. The most pronounced reductions in TE are observed over the equatorial Indian Ocean, the northern Arabian Sea, parts of northwest India, and the Himalayan foothills. The degradation, ranging from 20 %–30 %, is largest and most prevalent over the Bay of Bengal and at isolated locations in the eastern and western parts of the domain, with the largest values and most occurrences observed during the later forecast hours.
3.2.2 Evaluation based on bias and error standard deviation
The impact of RO data assimilation on forecast accuracy was quantified using an impact metric (IM) defined as the percentage reduction in standard deviation of errors between the CNTL and RMX-DA experiments, with ERA5 taken as the reference for verification.
Where SDCNTL and SDRMX-DA represent standard deviations of the forecast error for the CNTL and RMX-DA experiments, respectively, computed with respect to the ERA5 analysis. Positive values of IM indicate an improvement (reduction in error) due to RO assimilation, while negative values indicate degradation.
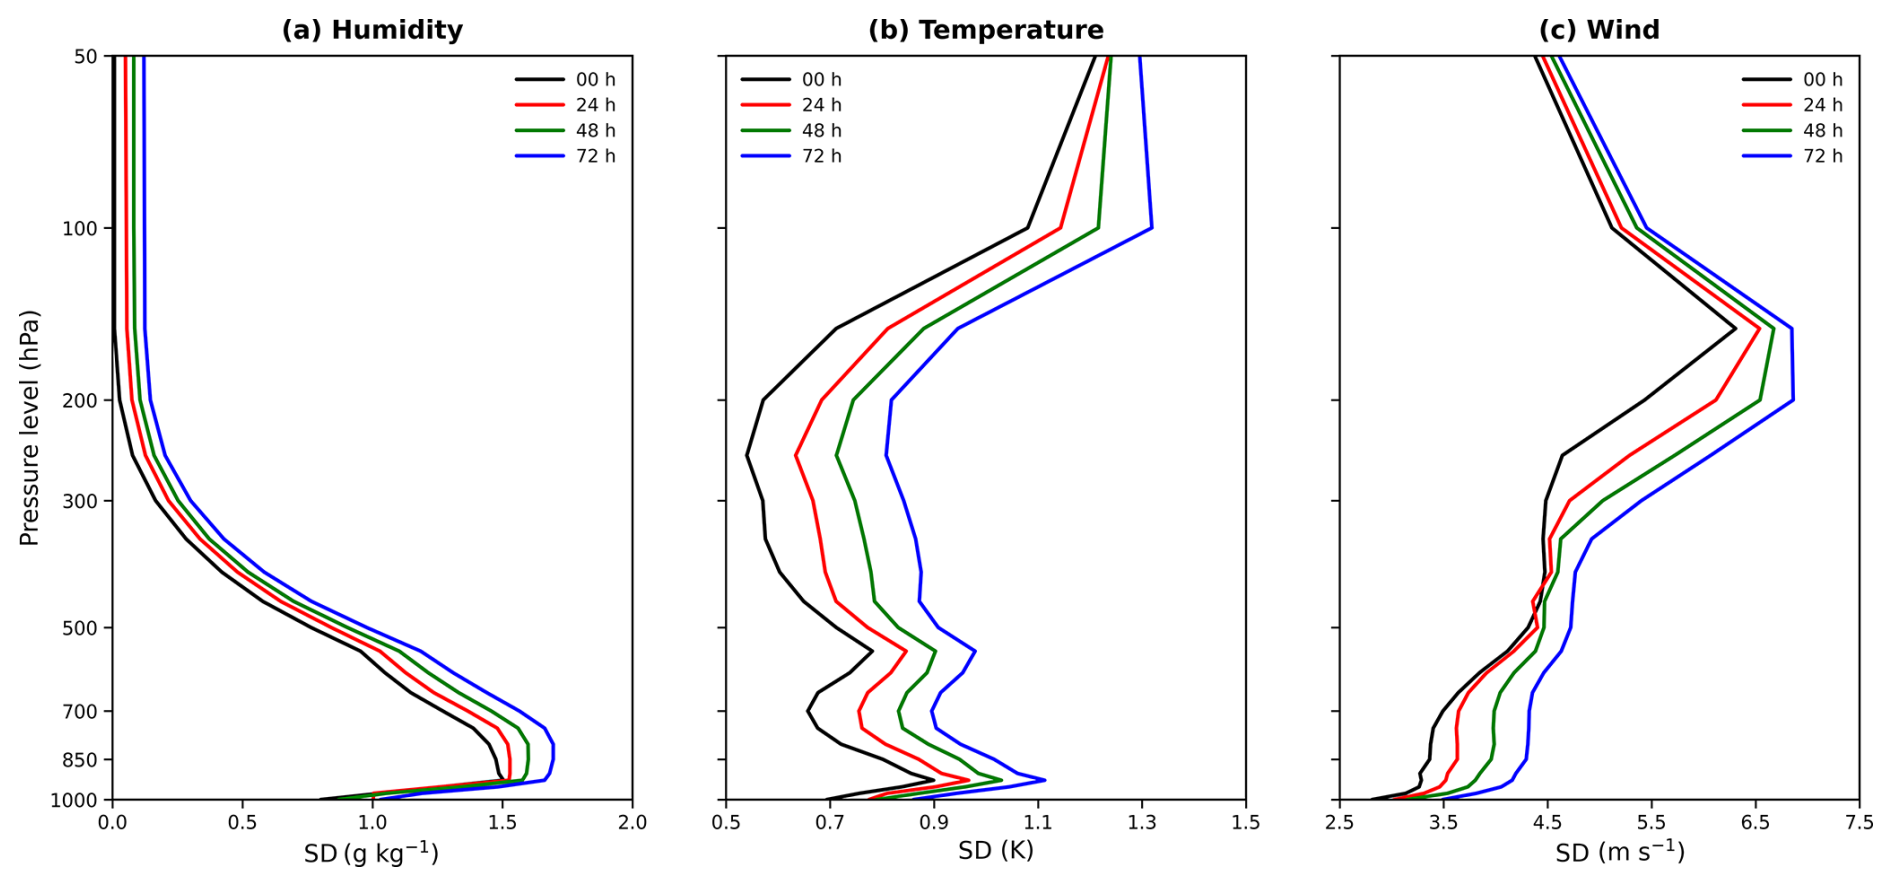
Figure 9Domain-averaged forecast-error standard deviation in CNTL for specific humidity, temperature, and wind at 00, 24, 48, and 72 h.
Figure 9 shows the domain-averaged forecast error from the control experiment (SDCNTL) at 0, 24, 48 and 72 h, evaluated across different vertical levels for specific humidity, temperature and wind.
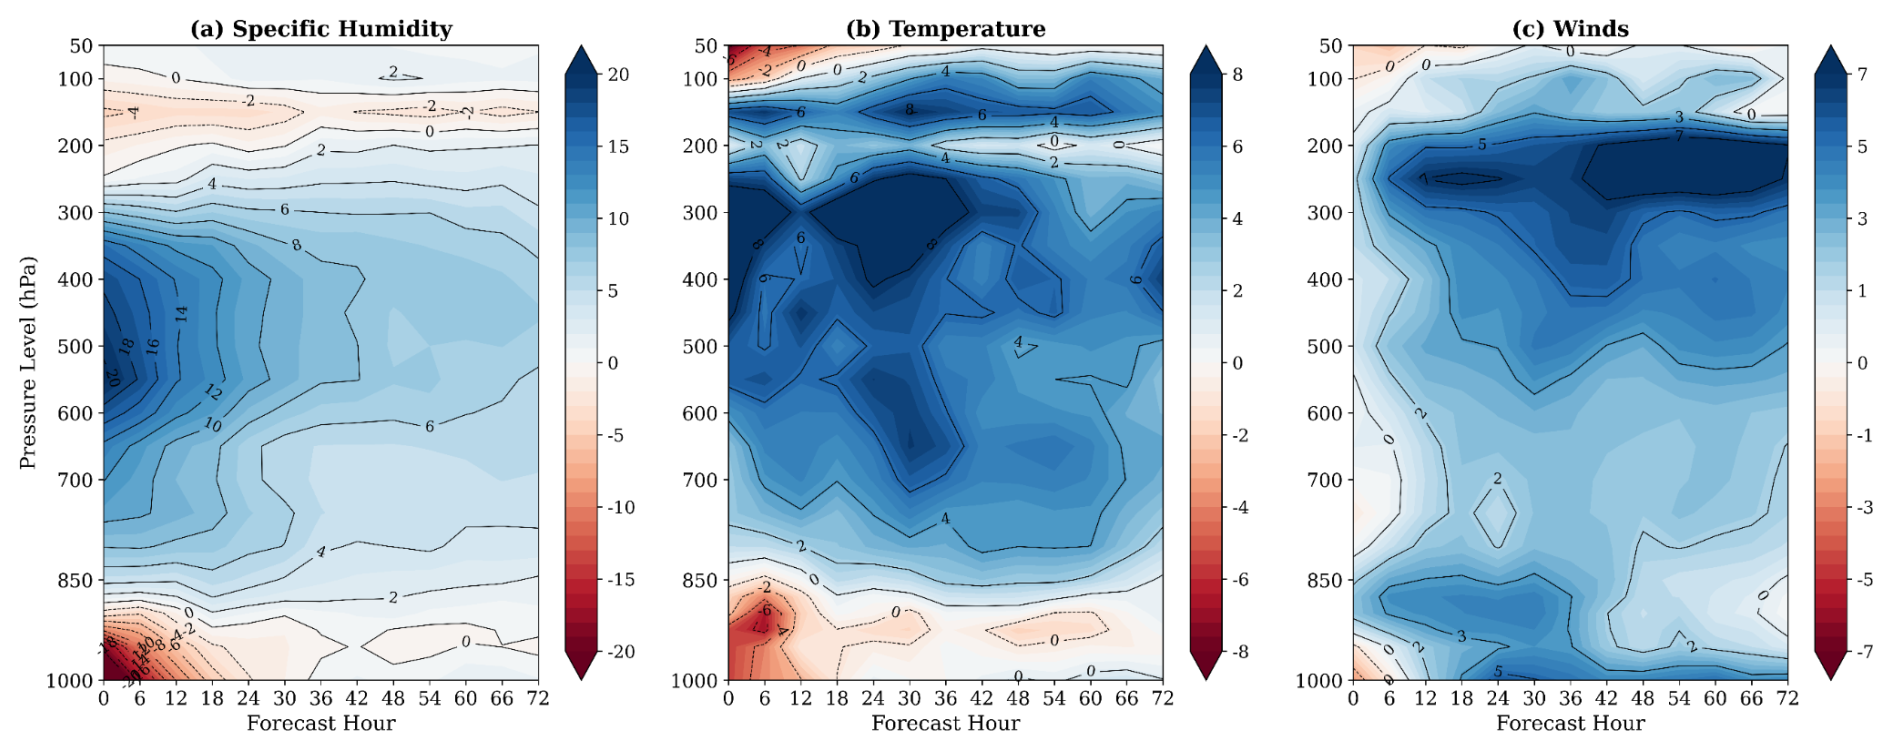
Figure 10Domain-averaged impact metric based on error standard deviation for specific humidity, temperature, and wind as a function of pressure level and forecast lead time.
The specific humidity error is maximum (1–1.7 g kg−1) near the surface and around 850 hPa. Temperature errors range from 0.6 to 1.2 K, with maximum errors observed at 100 hPa and near the surface. Wind errors vary between 3 and 6.8 m s−1, with the largest errors occurring at 100 hPa. The errors of all variables increase with forecast length. Figure 10 presents the domain-averaged IM for specific humidity (Fig. 10a), temperature (Fig. 10b), and wind (Fig. 10c) at different pressure levels and forecast lead times.
A positive impact of up to 15 %–20 % in specific humidity and about 8 %–12 % in temperature and winds is evident with the assimilation of RO data. For specific humidity, the impact is largest during the initial forecast hours and decreases to about 10 % by the end of the 72 h forecast. The greatest impact on specific humidity is observed in the 850–300 hPa layer. For temperature, the impact is strongest in the middle and upper troposphere and remains fairly consistent, generally in the range of 6 %–12 %. In the case of winds, the maximum impact is found near 250 hPa, and the impact tends to increase with forecast lead time. The forecast improvements are larger in magnitude than those in the analysis. It should be noted that the assimilation of RO observations can improve winds in data assimilation and NWP through several physical and dynamical mechanisms. Two primary mechanisms contribute to this improvement. First, through geostrophic adjustment, changes in pressure and temperature fields resulting from RO observations can lead to adjustments in the wind fields. Second, water vapor changes induced by RO observations can influence precipitation and convection through latent heat release. Improved representation of water vapor leads to better simulation of precipitation processes, and the associated latent heat release modifies atmospheric stability and vertical motion. These changes can alter pressure gradients, which in turn influence wind fields.
Overall, the impact remains positive for most variables across the majority of pressure levels. However, degradation of a magnitude comparable to the improvement is observed near the surface and during the initial forecast lead times, mainly for specific humidity and temperature. A negative impact is also noted in upper-tropospheric specific humidity around 150 hPa. The higher error during the first 6 h may be attributed to model spin-up issues, which are commonly observed in regional models. Another possible explanation is that near-surface bending angle observations are associated with more complex observation errors due to sharp refractivity gradients and frequent super-refraction, particularly in regions with high atmospheric moisture, such as the Indian Summer Monsoon (ISM) region. Consequently, the observation errors assigned to GNSS-RO bending angle observations may not accurately represent the true uncertainties in this region, which could result in a suboptimal analysis.
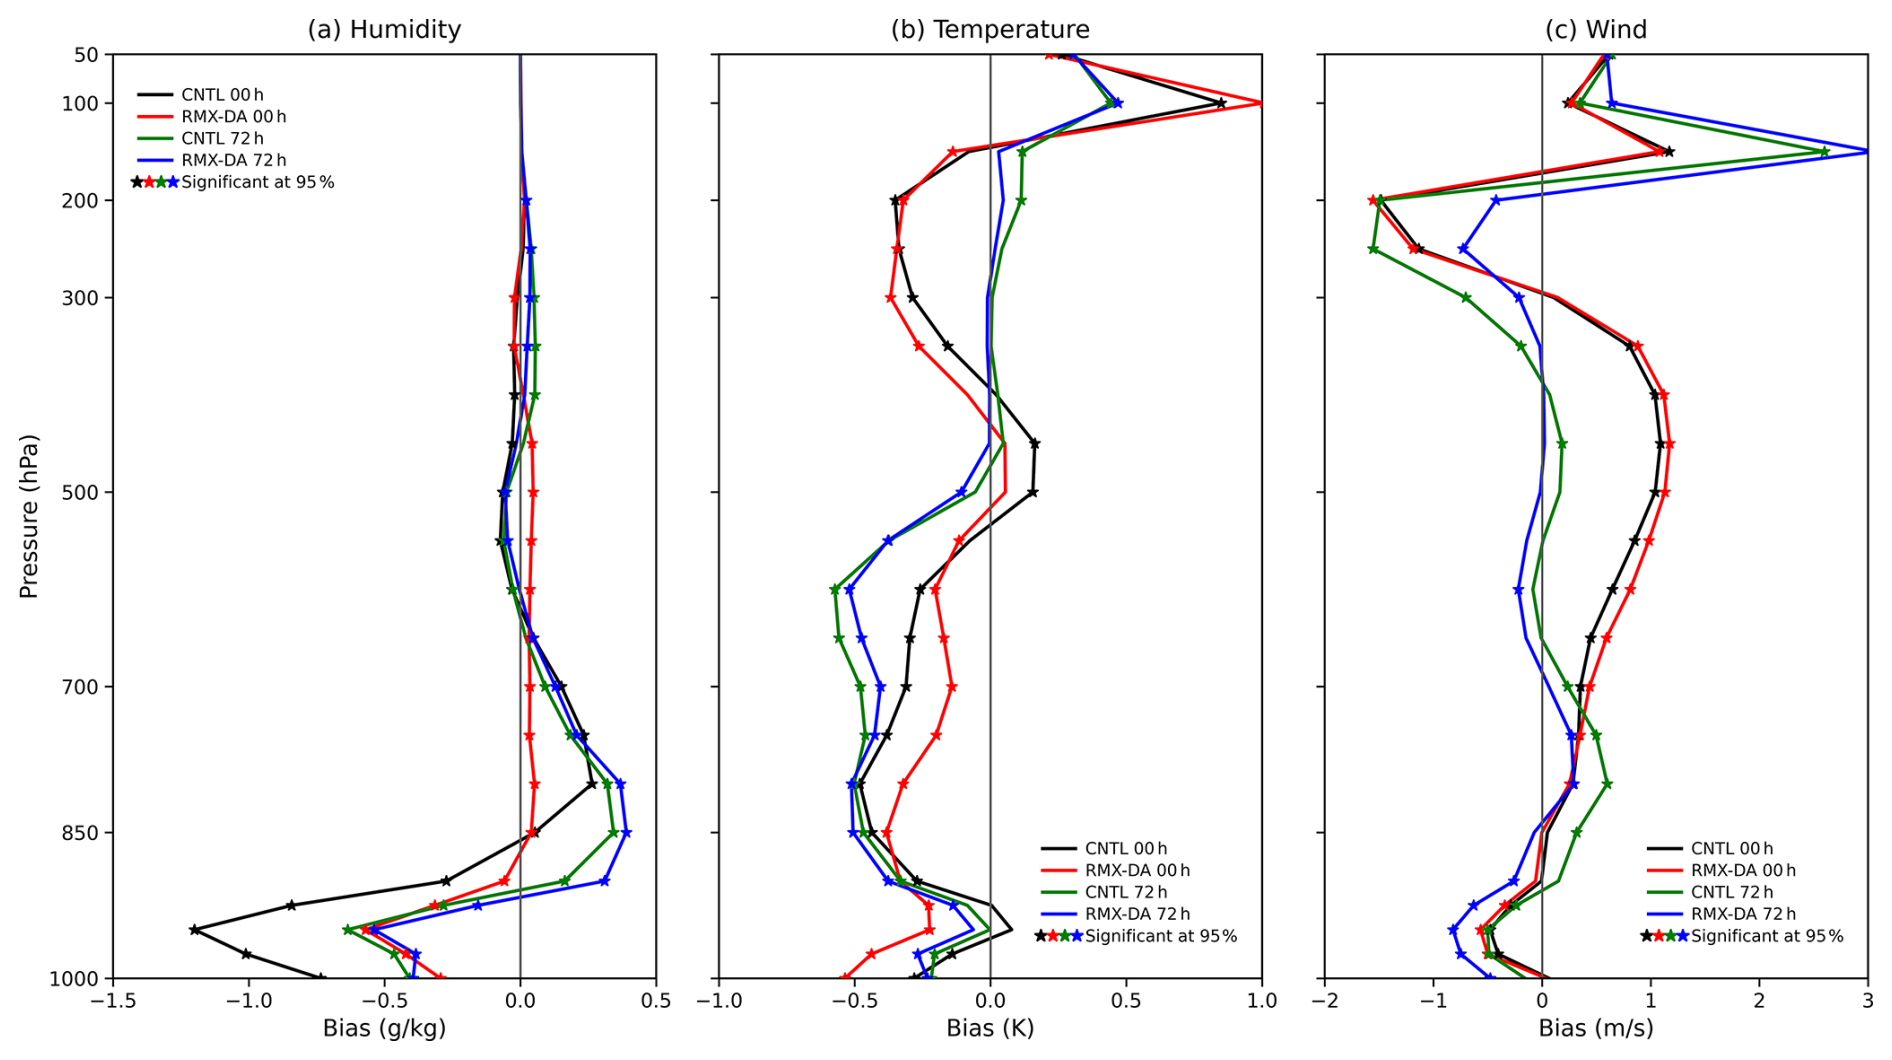
Figure 11Vertical profiles of domain-averaged bias relative to ERA5 for CNTL and RMX-BA at analysis time and 72 h forecast time for specific humidity, temperature, and wind. Asterisks indicate that the differences are statistically significant at the 95 % confidence level.
Figure 11 illustrates the vertical variation in the domain-averaged bias of the WRF model forecasts relative to ERA5 for specific humidity, temperature, and winds at the analysis time and at the 72 h forecast lead time (Fig. 11a).
The domain-averaged bias in specific humidity (Fig. 11a) shows that, at the analysis time, the CNTL experiment exhibits a pronounced overestimation in the lower troposphere, reaching up to 1.4 g kg−1, while an underestimation of approximately 0.5 g kg−1 is observed between 850 and 700 hPa. The assimilation of RO data in the RMX-BA experiment leads to a substantial reduction in these biases. Following assimilation, the mean bias is reduced to within ±0.5 g kg−1 across most of the troposphere. The positive impact on bias is evident up to the 24 h forecast lead time; beyond this range, the biases in both the CNTL and RO assimilation experiments become broadly comparable. At longer forecast lead times, the RMX-BA experiment exhibits slightly higher biases near 850 hPa and marginally lower biases in the lower and middle troposphere relative to the CNTL experiment
The temperature biases range between −0.5 and 1.1 K and appear broadly similar in both the CNTL and RMX-BA experiments (Fig. 11b). At some pressure levels, the RMX-BA experiment demonstrates improved performance, whereas at others, the control run exhibits marginally lower biases. This pattern remains similar across all forecast lead times; however, the overall magnitude of the biases decreases with increasing lead time, reducing to ±0.66 K at the 72 h forecast.
The wind biases vary between −1.5 and 1.5 m s−1 and are largely comparable in both the control and RO assimilation experiments (Fig. 11c). As the forecast lead time increases, the magnitude of the biases also increases, reaching values between −3 and 3 m s−1. Furthermore, the biases in the RO assimilation experiment are slightly higher than those in the control run at most levels, except at 800 and 150 hPa, during the later forecast hours.
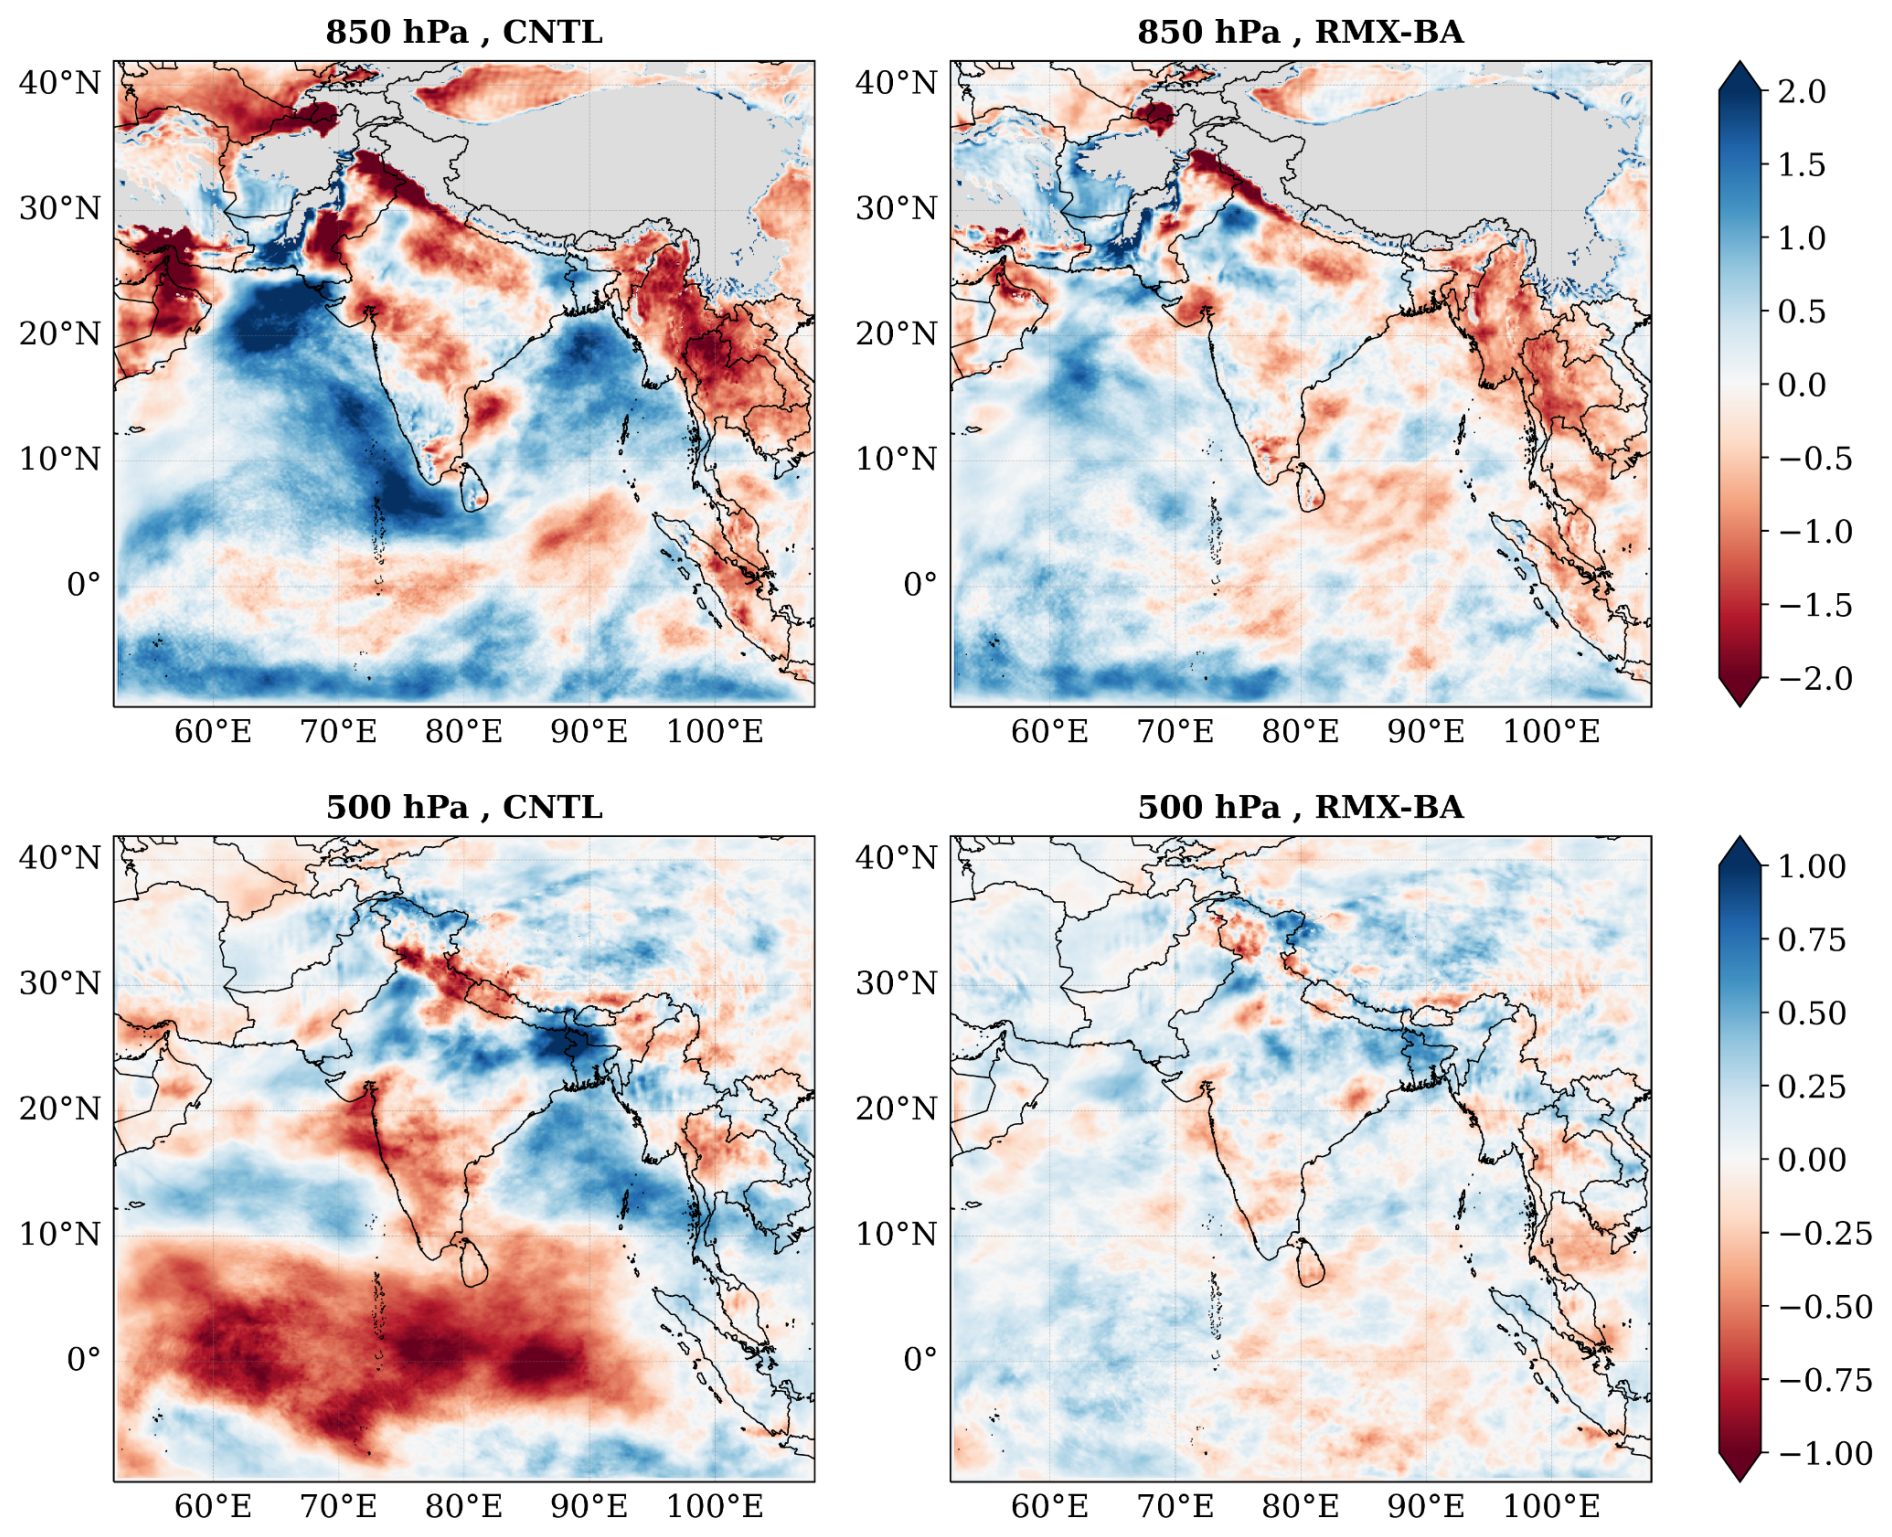
Figure 12Spatial distribution of specific-humidity bias relative to ERA5 at 850 and 500 hPa for CNTL and RMX-BA.
Figure 11a clearly demonstrates a substantial reduction in the specific humidity bias of the analysis following the assimilation of RO bending angle observations. To identify the regions where this reduction is most pronounced, the spatial distribution of humidity biases at 850 and 500 hPa for both the CNTL and RMX-BA experiments is presented in Fig. 12. Figure 12 indicates that the CNTL experiment strongly underestimates lower-tropospheric specific humidity over large parts of the Arabian Sea, the Bay of Bengal, and the southern Indian Ocean, while overestimating specific humidity over several land regions.
The underestimation and overestimation in CNTL ranges from ±2 g kg−1 at 850 hPa and from ±1 g kg−1 at 500 hPa. The assimilation of RO data substantially reduces these biases in the 850 hPa specific humidity field. At 500 hPa, the CNTL experiment exhibits a marked overestimation of specific humidity over the equatorial Indian Ocean and an underestimation over the Bay of Bengal, eastern India, and northwestern India. The assimilation of RO data significantly mitigates these biases. In the RO assimilation experiment, the magnitude of the bias remains within ±1 g kg−1 at 850 hPa and ±0.5 g kg−1 at 500 hPa.
3.2.3 Evaluation of rainfall prediction skill
Figure 13 shows the spatial distribution of the monthly-accumulated rainfall for September 2022 based on 24 h forecasts from the CNTL experiment (Fig. 13a).
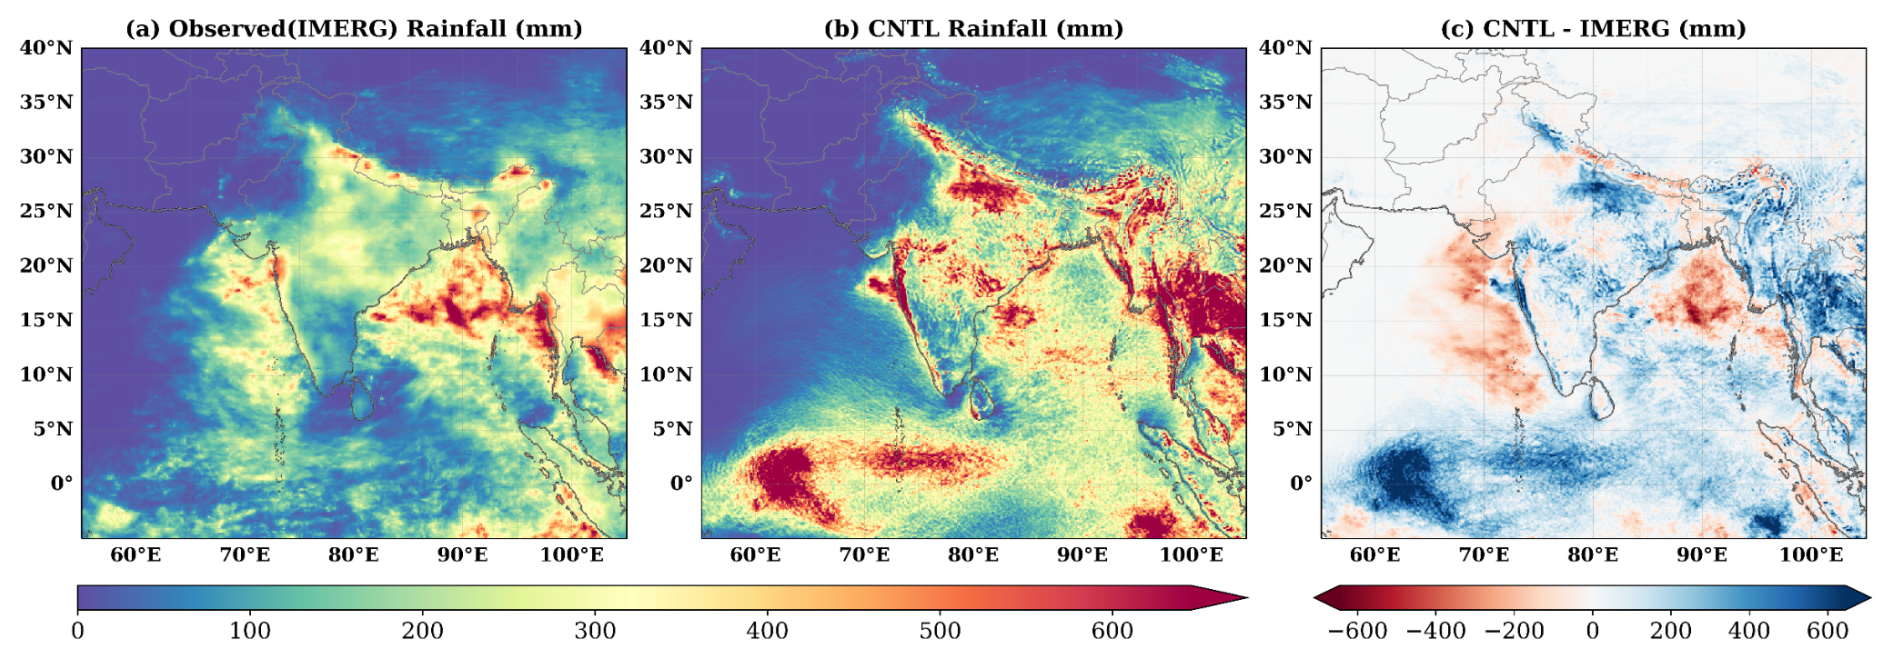
Figure 13September 2022 monthly accumulated rainfall from IMERG, from CNTL 24 h forecasts, and the corresponding CNTL minus IMERG difference.
Model-predicted rainfall is verified against rainfall estimates from the Integrated Multi-Retrievals for GPM (IMERG) product (Huffman et al., 2020) (Fig. 13b). Figure 13 indicates that the model underestimates rainfall, by as much as 200–500 mm, over the Bay of Bengal, the eastern Arabian Sea, and along the west coast of India (Fig. 13c). In contrast, rainfall is strongly overestimated, by as much as 200–600 mm, over the equatorial Indian Ocean, particularly the western equatorial Indian Ocean, as well as over some parts of India and the eastern portion of the domain (Fig. 13c). These large discrepancies in rainfall prediction correspond well with the regions of substantial humidity biases at 850 and 500 hPa, as noted in Fig. 12. The impact of RO data assimilation on the rainfall forecast is quantified by computing the Impact Metric (IM), as given below.
RainCNTL and RainRMX-BA represent the model-predicted rainfall in the control and RO assimilation experiments, respectively, while RainIMERG provides the observed rainfall. Figure 14 presents the spatial distribution of the impact metric (IM).
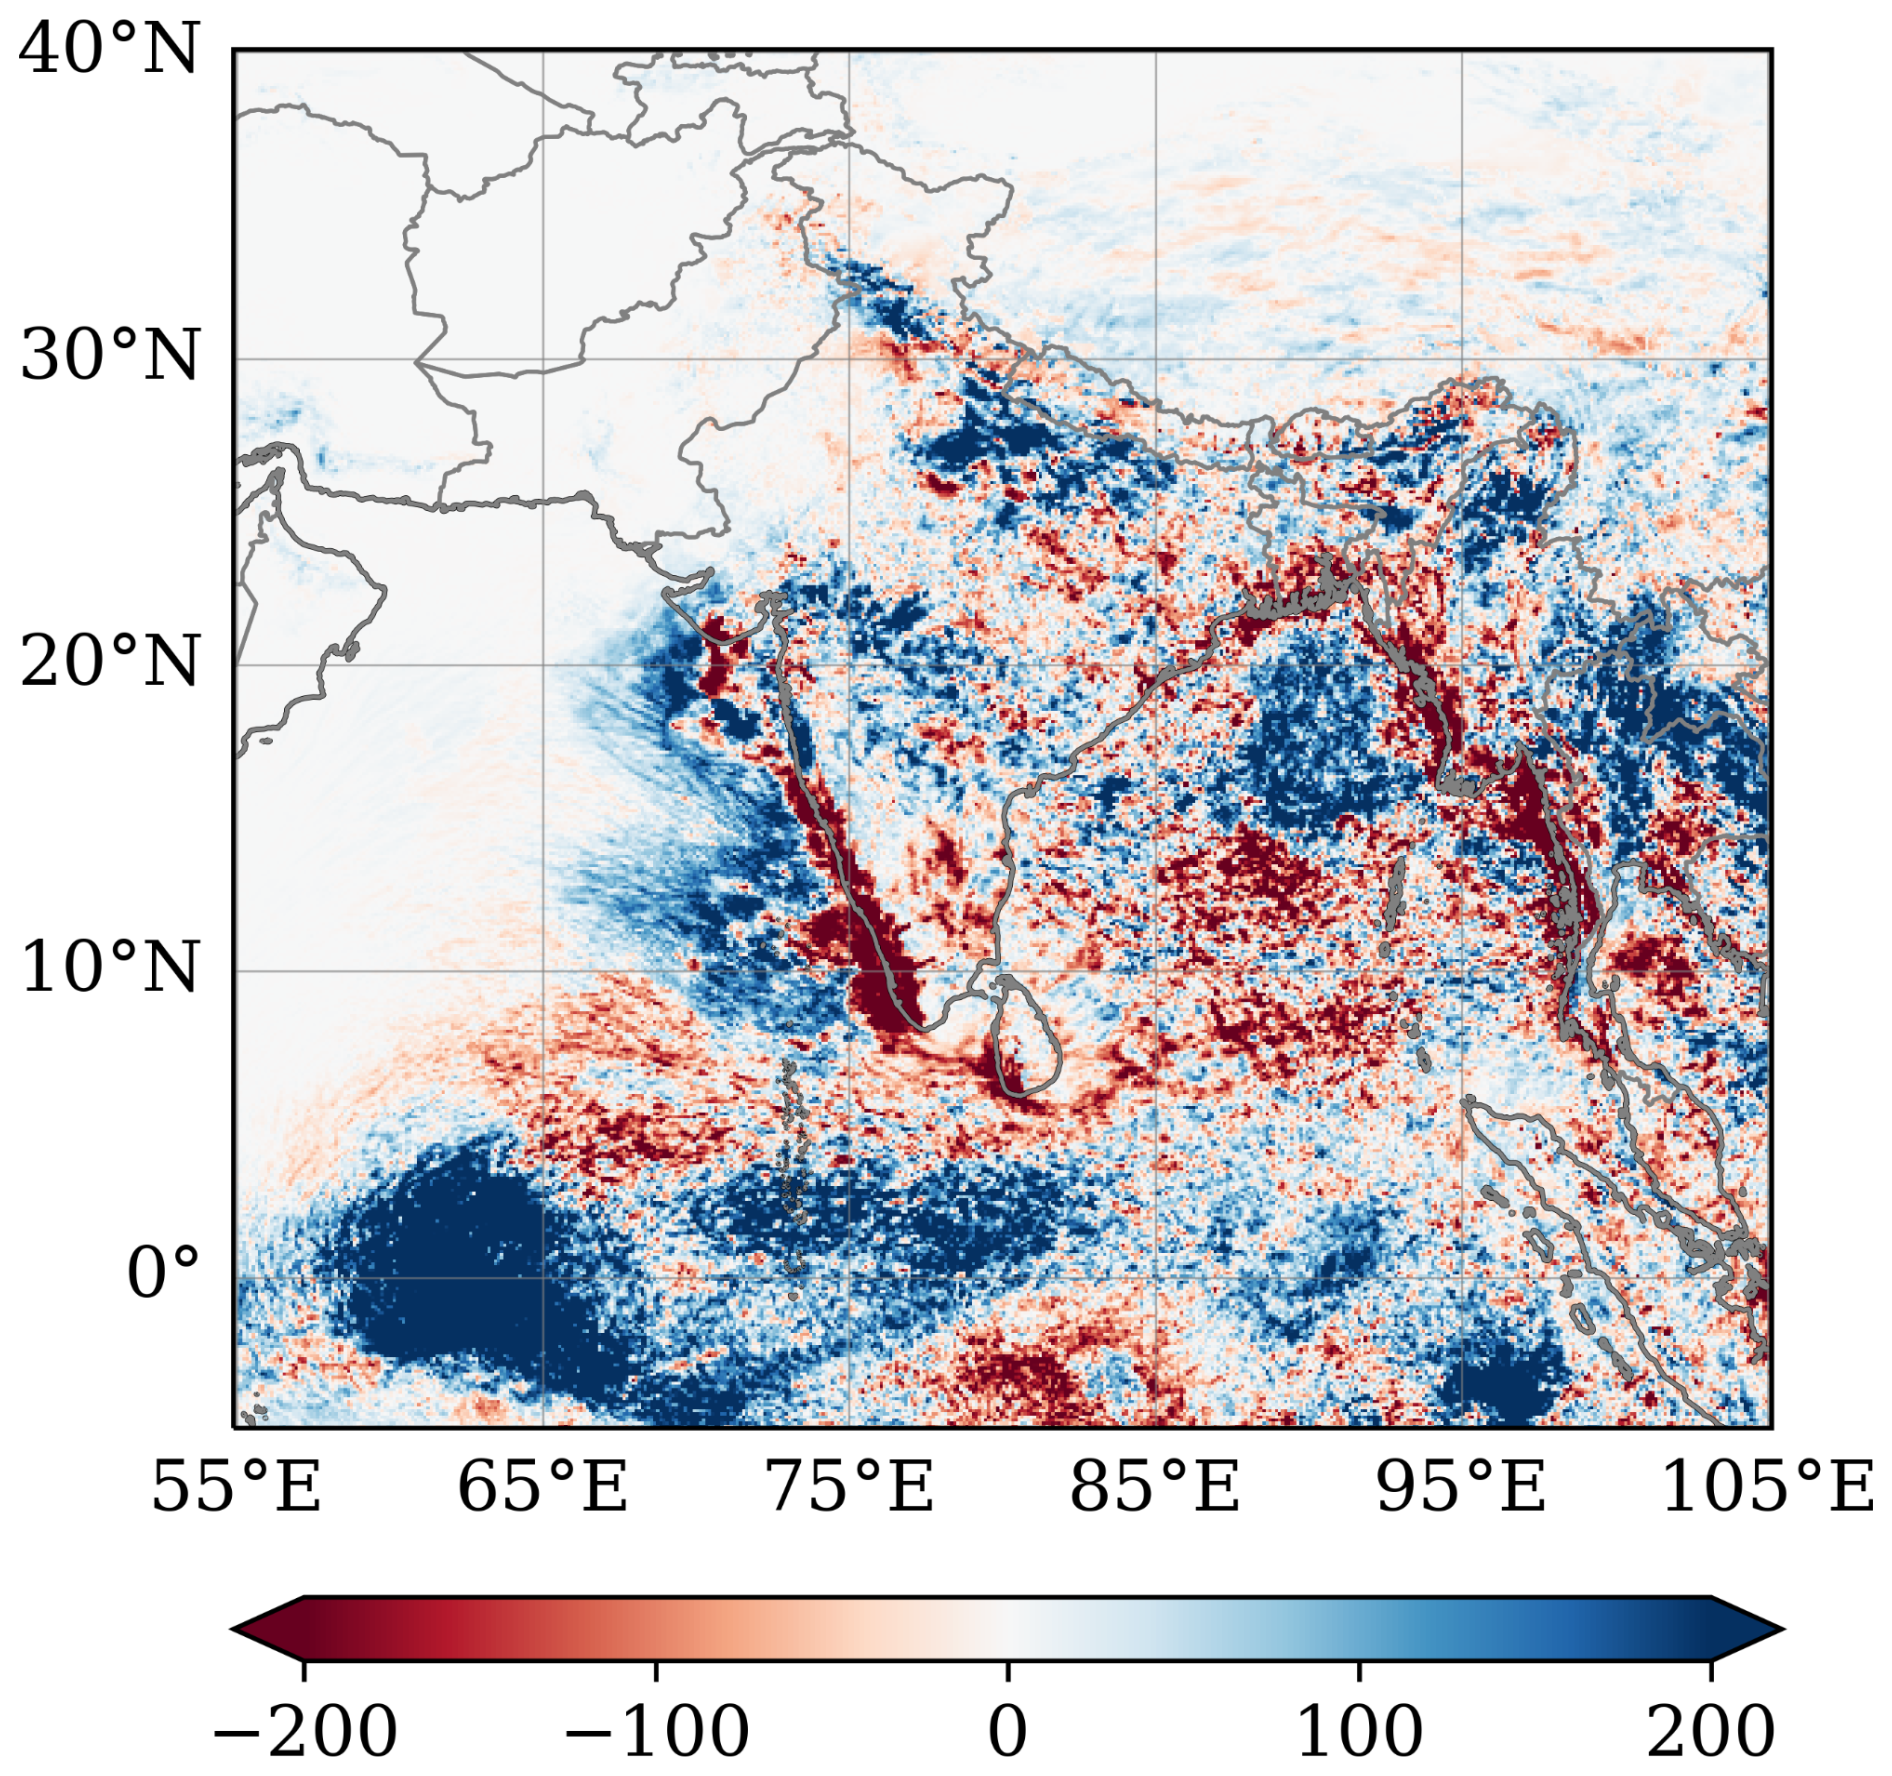
Figure 14Spatial distribution of the rainfall impact metric (mm). Positive values denote reduced rainfall error due to RO assimilation.
Positive values of IM indicate improved rainfall prediction due to RO assimilation, whereas negative values indicate degradation. Most of the domain is characterized by positive IM values, indicating an overall improvement in rainfall prediction with RO assimilation. Significant improvements are observed over the equatorial Indian Ocean, the Arabian Sea, the Bay of Bengal, and much of the Indian landmass. The underestimation/overestimation of rainfall is reduced by as much as 200–300 mm with the assimilation of RO observations. This improvement is likely associated with enhanced water vapor analysis resulting from the assimilation of RO observations.
However, some localised regions exhibit degradation in rainfall prediction following RO assimilation, primarily over the Western Ghats and along the eastern Bay of Bengal, with a few isolated pockets over adjacent oceanic areas. IMERG rainfall estimates are generally less reliable over complex terrain, particularly mountainous regions such as the Western Ghats, as well as over coastal and convectively active regions such as the eastern Bay of Bengal (Prakash et al., 2016; Prakash and Srinivasan, 2021; Tan et al., 2017), which may partly account for the apparent degradation associated with RO assimilation. Overall, RO assimilation leads to a substantial improvement in rainfall prediction, especially in regions where the CNTL exhibited the largest errors.
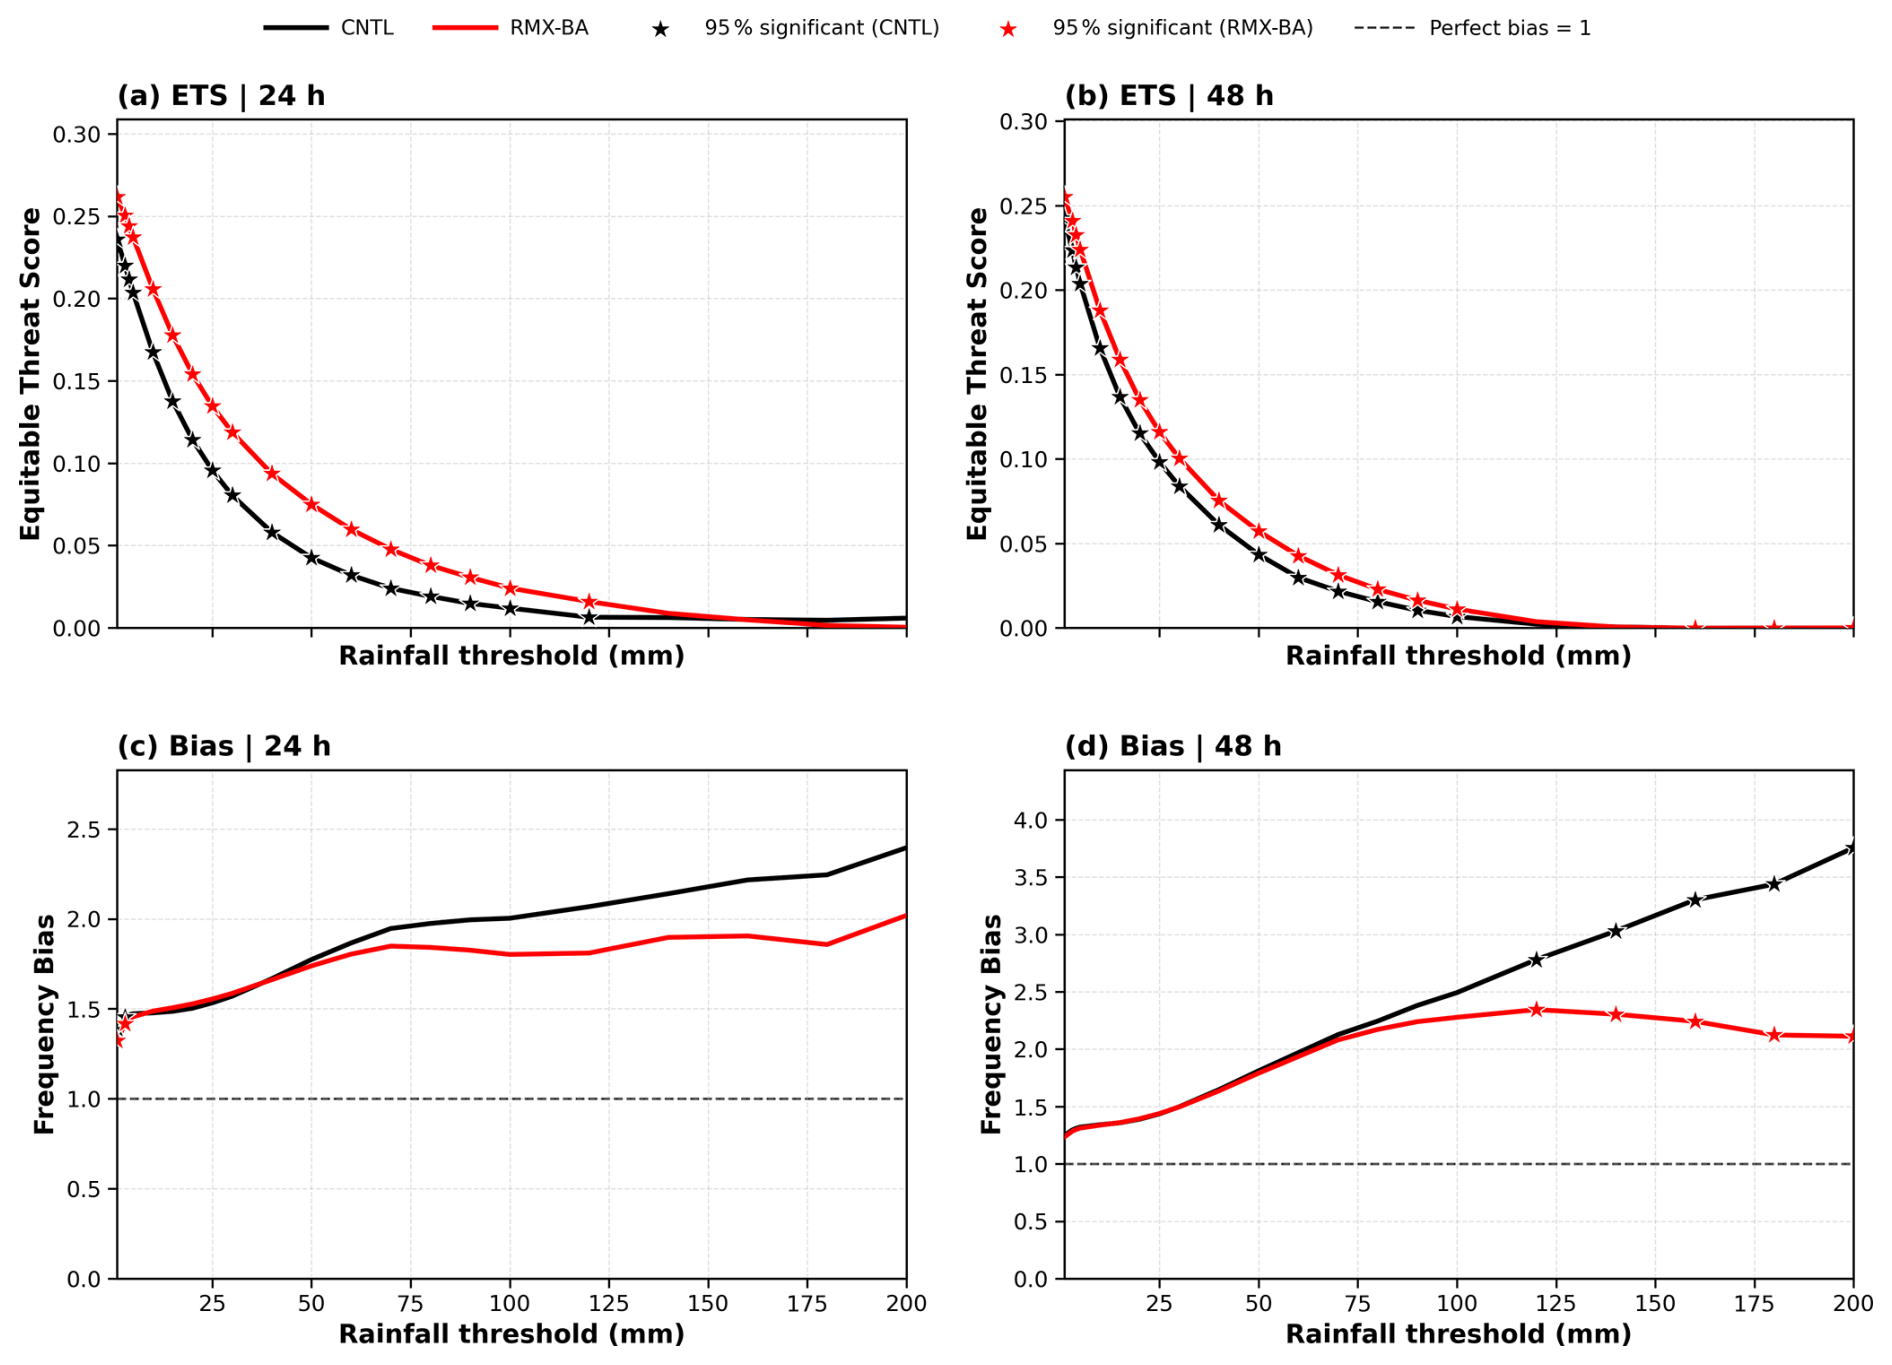
Figure 15Equitable threat score (ETS) and bias score for 24 and 48 h accumulated rainfall as a function of rainfall threshold for CNTL and RMX-BA. Asterisks indicate that the differences are statistically significant at the 95 % confidence level.
Furthermore, the rainfall forecast skill was evaluated using categorical verification metrics, including the bias score and equitable threat score (ETS), following Colle et al. (2000). The ETS and bias are calculated for 24 and 48 h model predicted rainfall using IMERG rainfall as the reference dataset. Figure 15 presents the ETS and bias scores for 24 and 48 h accumulated rainfall at various rainfall thresholds.
Both ETS and bias scores should be close to 1 for a perfect forecast. A bias score greater than 1 indicates that the model overestimates rainfall occurrence, while a bias score less than 1 indicates an underestimation of rainfall occurrence. The results clearly show that both ETS and bias scores improve with the assimilation of RO data. The ETS exhibits a substantial improvement for 24 h accumulated rainfall forecasts. The bias scores also show improvement, with the largest improvement observed in the 48 h forecasts. The differences in rainfall skill scores are also significant, except for the bias differences during the first 24 h forecast.
This study evaluated the impact of assimilating RO bending angle observations from the ROMEX dataset on mesoscale weather prediction over the Indian region during September 2022. The data assimilation and forecast experiments were conducted using the WRF model and its three-dimensional variational (3D-Var) data assimilation system. A bending angle observation operator was integrated into the WRF data assimilation system, enabling the direct assimilation of bending angle observations and improved use of RO measurement information.
Cycling 3D-Var experiments were conducted at 9 km horizontal resolution using the WRF model to assess the impact of ROMEX RO bending angle assimilation. The results indicate that the assimilation of RO data leads to consistent improvements in both the analysis fields and subsequent forecasts. These improvements are evident in the representation of thermodynamical and dynamical variables, highlighting the added value of RO observations in improving model performance.
RO assimilation leads to a clear reduction in both analysis and forecast errors, as reflected in the verification metrics. Moist Total Energy (TE) error reductions of about 20 % at analysis time indicate that bending angle observations effectively constrain the model's initial state. Although the impact decreases with forecast lead time, improvements of about 8 %–9 % remain up to 72 h.
RO assimilation improves the analysis and forecasts of specific humidity in the middle troposphere for up to 3 d, with the largest improvement (10 %–15 %) occurring during the first day. Specific humidity biases are reduced, especially over the oceans where conventional observations are sparse. The assimilation corrects both moist and dry biases, resulting in a more realistic representation of the water vapor distribution. Temperature and wind fields also show improvements (10 % to 12 %) over the three day forecasts, with the most noticeable impact on winds occurring in the upper troposphere.
Rainfall forecasts show substantial improvement with the assimilation of RO data. Regions exhibiting reduced rainfall error closely corresponds to areas where humidity biases are reduced, underscoring the importance of accurate water vapor initialisation. Skill-score verification indicates improvements in both ETS and bias.
The results highlight the significant value of high-density RO observations for mesoscale forecasting over the Indian monsoon region, where conventional observations are sparse. Overall, the findings demonstrate that the assimilation of a large number of RO bending angle observations can significantly improve regional weather prediction.
The WRF model and WRF-DA system used in this study are publicly available from the NCAR repository (https://github.com/wrf-model/wrf, last access: 5 August 2026). The Radio Occultation Processing Package (ROPP) is available from ROM SAF (https://rom-saf.eumetsat.int/ropp, last access: 5 August 2026). The code modifications used to couple the bending-angle operator with WRF-DA are not publicly archived but can be provided by the corresponding author upon request.
The datasets used in this study are publicly available. GNSS radio occultation (GNSS-RO) observations from the ROMEX mission were obtained from the EUMETSAT ROM SAF (https://rom-saf.eumetsat.int, last access: 5 August 2026). Meteorological reanalysis data were taken from the ERA5 dataset provided by the Copernicus Climate Data Store (CDS) (https://cds.climate.copernicus.eu, last access: 5 August 2026). Conventional (in situ) PREPBUFR observational data were obtained from the Data Support Section (DSS) of the National Center for Atmospheric Research (NCAR), managed by UCAR (https://gdex.ucar.edu/, last access: 5 August 2026). IMERG rainfall data were obtained from NASA's Global Precipitation Measurement (GPM) mission (https://gpm.nasa.gov/data/imerg, last access: 5 August 2026).
Randhir Singh led the study, carried out the data assimilation experiments, and prepared the initial manuscript draft. Satya P. Ojha and Kudilil Faisal Muhammed contributed to the methodology, analysis, and manuscript revision. Richard Anthes contributed to the scientific interpretation of the ROMEX experiment and manuscript revision. All authors discussed the results and approved the manuscript.
The contact author has declared that none of the authors has any competing interests.
Publisher's note: Copernicus Publications remains neutral with regard to jurisdictional claims made in the text, published maps, institutional affiliations, or any other geographical representation in this paper. The authors bear the ultimate responsibility for providing appropriate place names. Views expressed in the text are those of the authors and do not necessarily reflect the views of the publisher.
This article is part of the special issue “The Radio Occultation Modeling EXperiment (ROMEX): observational quality, processing, and numerical weather prediction (NWP) applications”. It is not associated with a conference.
The authors sincerely acknowledge the encouragement and support provided by the Group Director, AOSG/EPSA/SAC; the Deputy Director, EPSA/SAC; and the Director, Space Applications Centre (SAC). We sincerely thank the reviewers and the Editor for their constructive comments and suggestions, which have helped improve the quality of the manuscript. The use of the WRF model is gratefully acknowledged. The ROPP software was obtained from the EUMETSAT Radio Occultation Meteorology Satellite Application Facility (ROM SAF).
This paper was edited by Benjamin Ruston and reviewed by two anonymous referees.
Anthes, R. A., Rocken, C., and Kuo, Y.-H.: Applications of COSMIC to meteorology and climate, Terr. Atmos. Ocean. Sci., 11, 115–156, https://doi.org/10.3319/TAO.2000.11.1.115(COSMIC), 2000. a
Anthes, R. A., Bernhardt, P. A., Chen, Y., Cucurull, L., Dymond, K. F., Ector, D., Healy, S. B., Ho, S.-P., Hunt, D. C., Kuo, Y.-H., Liu, H., Manning, K., McCormick, C., Meehan, T. K., Randel, W. J., Rocken, C., Schreiner, W. S., Sokolovskiy, S. V., Syndergaard, S., Thompson, D. C., Trenberth, K. E., Wee, T.-K., Yen, N. L., and Zeng, Z.: The COSMIC/FORMOSAT-3 mission: Early results, Bull. Am. Meteorol. Soc., 89, 313–334, https://doi.org/10.1175/BAMS-89-3-313, 2008. a, b
Anthes, R. A., Marquardt, C., Ruston, B., and Shao, H.: Radio Occultation Modelling Experiment (ROMEX) – Determining the impact of radio occultation observations on numerical weather prediction, Bull. Am. Meteorol. Soc., 105, https://doi.org/10.1175/BAMS-D-23-0326.1, 2024. a, b, c
Anthes, R., Sjoberg, J., Starr, J., and Zeng, Z.: Evaluation of biases and uncertainties in ROMEX radio occultation observations, Atmos. Meas. Tech., 18, 6997–7019, https://doi.org/10.5194/amt-18-6997-2025, 2025. a
Aparicio, J. M. and Deblonde, G.: Signature of the atmospheric compressibility factor in COSMIC, CHAMP, and GRACE radio occultation data, J. Geophys. Res.-Atmos., 114, D16114, https://doi.org/10.1029/2008JD011156, 2009. a
Barker, D., Huang, X.-Y., Liu, Z., Auligné, T., Zhang, X., Rugg, S., Ajjaji, R., Bourgeois, A., Bray, J., Chen, Y., Demirtas, M., Guo, Y.-R., Henderson, T., Huang, W., Lin, H.-C., Michalakes, J., Rizvi, S., and Zhang, X.: The Weather Research and Forecasting Model's Community Variational/Ensemble Data Assimilation System: WRFDA, Bull. Am. Meteorol. Soc., 93, 831–843, https://doi.org/10.1175/BAMS-D-11-00167.1, 2012. a
Bowler, N. E.: An assessment of GNSS radio occultation data produced by Spire, Q. J. Roy. Meteor. Soc., 146, 3772–3788, https://doi.org/10.1002/qj.3872, 2020. a
Cardinali, C. and Healy, S.: Impact of GPS radio occultation measurements in the ECMWF system, Q. J. Roy. Meteor. Soc., 140, 2315–2320, https://doi.org/10.1002/qj.2300, 2014. a, b
Chen, S. Y., Huang, C. Y., Kuo, Y. H., Guo, Y. R., and Sokolovskiy, S.: Assimilation of GPS refractivity from FORMOSAT-3/COSMIC using a nonlocal operator with WRF 3DVAR and its impact on typhoon prediction, Terr. Atmos. Ocean. Sci., 20, 133–154, https://doi.org/10.3319/TAO.2007.11.29.01(F3C), 2009. a
Colle, B. A., Mass, C. F., and Westrick, K. J.: MM5 precipitation verification over the Pacific Northwest during the 1997–99 cool seasons, Weather Forecast., 15, 730–744, https://doi.org/10.1175/1520-0434(2000)015<0730:MPVOTP>2.0.CO;2, 2000. a
Cucurull, L., Derber, J. C., Treadon, R., and Purser, R. J.: Assimilation of Global Positioning System radio occultation observations into NCEP's Global Data Assimilation System, Mon. Weather Rev., 135, 3174–3193, https://doi.org/10.1175/MWR3461.1, 2007. a, b, c, d
Cucurull, L., Derber, J. C., and Purser, R. J.: A bending angle forward operator for GPS radio occultation measurements, J. Geophys. Res.-Atmos., 118, 14–28, https://doi.org/10.1029/2012JD017782, 2013. a, b
Culverwell, I. D., Lewis, H. W., Offiler, D., Marquardt, C., and Burrows, C. P.: The Radio Occultation Processing Package, ROPP, Atmos. Meas. Tech., 8, 1887–1899, https://doi.org/10.5194/amt-8-1887-2015, 2015. a
Ehrendorfer, M., Errico, R. M., and Raeder, K. D.: Singular vector perturbation growth in a primitive equation model with moist physics, J. Atmos. Sci., 56, 1627–1648, https://doi.org/10.1175/1520-0469(1999)056<1627:SVPGIA>2.0.CO;2, 1999. a
Eyre, J. R.: Assimilation of radio occultation measurements into a numerical weather prediction system, ECMWF Tech. Memo., 199, ECMWF, Reading, UK, https://www.ecmwf.int/en/elibrary/74433-assimilation-radio-occultation-measurements-numerical-weather-predictionsystem (last access: 5 August 2026), 1994. a
Geer, A. J., Lonitz, K., Weston, P., Kazumori, M., Okamoto, K., Zhu, Y., Liu, E. H., Collard, A., Bell, W., Migliorini, S., Chambon, P., Fourrie, N., Kopken-Watts, C., and Schraff, C.: All-sky satellite data assimilation at operational weather forecasting centres, Q. J. Roy. Meteor. Soc., 144, 1191–1217, https://doi.org/10.1002/qj.3202, 2018. a
Healy, S. B.: Radio occultation bending angle and impact parameter errors caused by horizontal refractive index gradients in the troposphere: A simulation study, J. Geophys. Res.-Atmos., 106, 11875–11889, https://doi.org/10.1029/2001JD900050, 2001. a, b
Healy, S. B. and Thepaut, J.-N.: Assimilation experiments with CHAMP GPS radio occultation measurements, Q. J. Roy. Meteor. Soc., 132, 605–623, https://doi.org/10.1256/qj.04.182, 2006. a, b, c, d, e
Healy, S. B., Eyre, J. R., Hamrud, M., and Thepaut, J.-N.: Assimilating GPS radio occultation measurements with two-dimensional bending angle observation operators, Q. J. Roy. Meteor. Soc., 133, 1213–1227, https://doi.org/10.1002/qj.63, 2007. a, b, c
Hersbach, H., Bell, B., Berrisford, P., Hirahara, S., Horányi, A., Muñoz-Sabater, J., Nicolas, J., Peubey, C., Radu, R., Schepers, D., Simmons, A., Soci, C., Abdalla, S., Abellan, X., Balsamo, G., Bechtold, P., Biavati, G., Bidlot, J., Bonavita, M., De Chiara, G., Dahlgren, P., Dee, D., Diamantakis, M., Dragani, R., Flemming, J., Forbes, R., Fuentes, M., Geer, A., Haimberger, L., Healy, S., Hogan, R. J., Hólm, E., Janisková, M., Keeley, S., Laloyaux, P., Lopez, P., Lupu, C., Radnoti, G., de Rosnay, P., Rozum, I., Vamborg, F., Villaume, S., and Thépaut, J.-N.: The ERA5 global reanalysis, Q. J. Roy. Meteor. Soc., 146, 1999–2049, https://doi.org/10.1002/qj.3803, 2020. a
Hong, T.-X., Huang, C.-Y., Lin, C.-Y., Lien, G.-Y., Huang, Z.-M., and Chen, S.-Y.: Impacts of GNSS RO data on typhoon forecasts using global FV3GFS with GSI 4DEnVar, Atmosphere, 14, 735, https://doi.org/10.3390/atmos14040735, 2023. a
Huang, C.-Y., Kuo, Y.-H., Chen, S.-Y., Terng, C. T., Chien, F. C., Lin, P. L., Kueh, M. T., Chen, S. H., Yang, M. J., and Wang, C. J.: Impact of GPS radio occultation data assimilation on regional weather predictions, GPS Solut., 14, 35–49, https://doi.org/10.1007/s10291-009-0144-1, 2010. a
Huffman, G. J., Stocker, E. F., Bolvin, D. T., Nelkin, E. J., and Tan, J.: Integrated multi-satellite retrievals for the Global Precipitation Measurement (GPM) mission (IMERG), in: Satellite Precipitation Measurement, Springer, https://doi.org/10.1007/978-3-030-24568-9_19, 2020. a, b
Johnston, B. R., Cucurull, L., Anthes, R., Mueller, M. J., and Lim, A. H. N.: The impact of assimilating GNSS-RO observations on HAFS tropical cyclone forecasts from the 2022 Atlantic hurricane season, Weather Forecast., 40, 2539–2559, https://doi.org/10.1175/WAF-D-25-0045.1, 2025. a, b
Kleist, D. T., Parrish, D. F., Derber, J. C., Treadon, R., Wu, W.-S., and Lord, S.: Introduction of the Gridpoint Statistical Interpolation (GSI) into the NCEP Global Data Assimilation System, Weather Forecast., 24, 1691–1705, https://doi.org/10.1175/2009WAF2222201.1, 2009. a
Kursinski, E. R., Hajj, G. A., Schofield, J. T., Linfield, R. P., and Hardy, K. R.: Observing Earth's atmosphere with radio occultation measurements using the Global Positioning System, J. Geophys. Res., 102, 23429–23465, https://doi.org/10.1029/97JD01569, 1997. a, b
Lin, H., Kuo, Y., Zhang, H., Braun, J., and Liu, Z.: Impact of GNSS RO data on the prediction of atmospheric river events: A ROMEX experiment, Weather Forecast., 41, 519–539, https://doi.org/10.1175/WAF-D-25-0151.1, 2026. a
Liu, Y. and Xue, J.: Assimilation of GNSS radio occultation observations in GRAPES, Atmos. Meas. Tech., 7, 3935–3946, https://doi.org/10.5194/amt-7-3935-2014, 2014. a
Lonitz, K., Vitart, F., Healy, S. B., and Fu, Q.: Sub-seasonal impact of GNSS radio occultation data, Geophys. Res. Lett., 52, e2025GL116068, https://doi.org/10.1029/2025GL116068, 2025. a
Miller, W. J., Chen, Y., Ho, S.-P., and Shao, X.: Evaluating the impacts of COSMIC-2 GNSS RO bending angle assimilation on Atlantic hurricane forecasts using the HWRF model, Mon. Weather Rev., 151, 1821–1847, https://doi.org/10.1175/MWR-D-22-0198.1, 2023. a
Miller, W. J., Chen, Y., Ho, S.-P., and Shao, X.: How does assimilating a large commercial GNSS RO dataset impact HAFS hurricane forecasts? An evaluation in support of the ROMEX experiment, Atmos. Meas. Tech., 19, 4833–4851, https://doi.org/10.5194/amt-19-4833-2026, 2026. a
Parrish, D. F. and Derber, J. C.: The NMC method for estimating forecast error covariances using operational forecast data, Mon. Weather Rev., 120, 1747–1763, https://doi.org/10.1175/1520-0493(1992)120<1747:TNMCSS>2.0.CO;2, 1992. a
Poli, P., Healy, S. B., and Dee, D. P.: Assimilation of Global Positioning System radio occultation data in the ECMWF ERA-Interim reanalysis, Q. J. Roy. Meteor. Soc., 136, 1972–1990, https://doi.org/10.1002/qj.722, 2010. a
Prakash, S. and Srinivasan, J.: A comprehensive evaluation of near real-time and research products of IMERG precipitation over India for the southwest monsoon period, Remote Sens., 13, 3676, https://doi.org/10.3390/rs13183676, 2021. a
Prakash, S., Mitra, A. K., Pai, D. S., and AghaKouchak, A.: From TRMM to GPM: How well can heavy rainfall be detected from space?, Adv. Water Resour., 88, 1–7, https://doi.org/10.1016/j.advwatres.2015.11.008, 2016. a, b
Purwar, S., Bankar, A., Rakesh, V., Choy, S., Li, H., Mohapatra, G., and Kuleshov, Y.: Impact of assimilating GNSS ground-based and space-based observations on extreme rainfall prediction over Karnataka, India, Int. J. Remote Sens., 46, 7780–7823, https://doi.org/10.1080/01431161.2025.2559423, 2025. a
Rodgers, C. D.: Inverse Methods for Atmospheric Sounding: Theory and Practice, World Scientific, Singapore, https://doi.org/10.1142/3171, 2000. a
ROM SAF: The Radio Occultation Processing Package (ROPP) Pre-processor Module User Guide, Tech. Rep. SAF/ROM/METO/UG/ROPP/004, Version 11.0, EUMETSAT ROM SAF, 2021. a
Schreiner, W. S., Weiss, J. P., Anthes, R. A., Braun, J., Chu, V., Fong, J., Hunt, D., Kuo, Y. H., Meehan, T., Serafino, W., Sjoberg, J., Sokolovskiy, S., Talaat, E., and Wee, T. K.: COSMIC-2 radio occultation constellation: First results, Geophys. Res. Lett., 47, e2019GL086841, https://doi.org/10.1029/2019GL086841, 2020. a
Skamarock, W. C., Klemp, J. B., Dudhia, J., Gill, D. O., Liu, Z., Berner, J., Wang, W., Powers, J. G., Duda, M. G., Barker, D. M., and Huang, X.-Y.: A description of the Advanced Research WRF Version 4, NCAR Tech. Note, NCAR/TN-556+STR, https://doi.org/10.5065/1dfh-6p97, 2019. a
Smith, E. K. and Weintraub, S.: The constants in the equation for atmospheric refractive index at radio frequencies, Proc. IRE, 41, 1035–1037, https://doi.org/10.1109/JRPROC.1953.274297, 1953. a
Syndergaard, S.: Assessment of the structural uncertainty of GRAS products from level 1B (bending angles) up to level 2 (temperatures), Danish Meteorological Institute Technical Report under EUMETSAT Contract No. EUM/CO/10/4600:000745/AvE, 2012. a
Tan, J., Petersen, W. A., Kirstetter, P. E., and Tian, Y.: Performance of IMERG as a function of spatiotemporal scale, J. Hydrometeorol., 18, 307–319, https://doi.org/10.1175/JHM-D-16-0174.1, 2017. a
Xuan, Q. P., Chen, S.-Y., Huang, C.-Y., and Kuo, Y.-H.: Tropical cyclogenesis in the western North Pacific improved by GNSS RO data assimilation using hybrid 3DEnVar with a nonlocal excess phase operator, Weather Forecast., 40, 2255–2271, https://doi.org/10.1175/WAF-D-25-0010.1, 2025. a
Zhang, H., Shao, H., Ruston, B., and Braun, J. J.: Impact Study of Increased Radio Occultation Observations during the ROMEX Period Using JEDI and the GFS Atmospheric Model, Atmos. Meas. Tech., 18, 6167–6184, https://doi.org/10.5194/amt-18-6167-2025, 2025. a
Zou, X., Vandenberghe, F., Wang, B., Gorbunov, M. E., Kuo, Y.-H., Sokolovskiy, S., Chang, J. C., Sela, J. G., and Anthes, R. A.: A ray-tracing operator and its adjoint for the use of GPS/MET refraction angle measurements, J. Geophys. Res., 104, 22301–22318, https://doi.org/10.1029/1999JD900450, 1999. a