
the Creative Commons Attribution 4.0 License.
the Creative Commons Attribution 4.0 License.
 | 04 Sep 2026
Observation modes of EarthCARE/CPR with different Doppler measurement accuracy: evaluation of their applicability

Shunsuke Aoki
Takuji Kubota
Hirotaka Nakatsuka
Yuichi Ohno
Hajime Okamoto
An accurate characterization of cloud vertical motion is essential for understanding cloud microphysical and dynamical processes. The Cloud Profiling Radar (CPR) onboard the Earth Cloud Aerosol and Radiation Explorer (EarthCARE) satellite, launched in May 2024, enables the first global measurements of Doppler velocity from space. The nadir-looking CPR operates in three observation modes – 16, 18, and 20 km modes – each characterized by a distinct pulse repetition frequency (PRF), which determines the Doppler velocity data quality, the maximum observable altitude, and the likelihood of spurious high-altitude echoes known as second-trip echo from mirror images and multi-scattering tails. This study quantitatively evaluates the applicability of these three modes using actual CPR observations, focusing on these three aspects. The standard deviation (SD) of Doppler velocity, used as an indicator of measurement noise, indicated that the 16 and 18 km modes provide more accurate Doppler measurements than the 20 km mode, with comparable SD values between the former two. Clouds above 16 km were primarily observed between 0 and 40° latitude, while clouds exceeding 18 km were rare, suggesting that the 18 or 20 km modes are suitable for observation in these regions. The risk of overlap between genuine cloud echoes and second-trip echoes at high altitudes was highest in the 16 and 18 km modes but was largely confined to low-latitude regions (approximately 0–40°). Accordingly, without considering second-trip echo-related risks, the 16 km mode is preferable at latitudes above 40°, where high clouds are infrequent and Doppler measurement accuracy is highest. In contrast, the 18 km mode provides an optimal balance between Doppler accuracy and vertical coverage at lower latitudes. It should be noted, however, that high-PRF modes inherently increase the likelihood of second-trip echo contamination. These results demonstrate, for the first time using actual EarthCARE observations, the trade-offs among Doppler measurement accuracy, observation height, and spurious echo contamination across CPR operational modes. Future work should involve continuous assessments of the balance between Doppler accuracy and second-trip echo contamination to determine the optimal implementation of each mode as a function of latitude.
- Article
(2416 KB) - Full-text XML
- BibTeX
- EndNote


Cloud and atmospheric vertical motions are closely linked through both microphysical processes and the surrounding dynamical environment. From a microphysical perspective, variations in cloud particle properties, such as size, density, and phase (liquid or ice), lead to differences in terminal fall velocities, which in turn influence cloud optical properties and radiative heating rates (Albrecht, 1989; Mitchell and Heymsfield, 2005). From a dynamical perspective, updrafts enhance condensation and latent heat release, thereby modulating local atmospheric stability and subsequent cloud development (Betts and Miller, 1986; Houze, 1993; Tao et al., 2022). Information on vertical motions is also essential for accurately simulating cloud processes in weather and climate models, because many numerical models have traditionally treated hydrometeor fall velocity as a tuning parameter, which can substantially influence atmospheric circulation and cloud processes (Hourdin et al., 2017; Couvreux et al., 2021). Cloud Doppler velocity, which represents the sum of the reflectivity weighted terminal fall velocity of cloud particles and ambient vertical air motion, is therefore one of the key parameters governing cloud development processes (Radenz et al., 2018; von Terzi et al., 2022). Traditionally, Doppler velocity has been measured using ground-based, ship-based and airborne vertical pointing radars to investigate cloud microphysical properties (e.g., Okamoto et al., 2003; Shupe et al., 2008; Sato et al., 2010; Protat and Williams, 2011; Lamer et al., 2014; Ewald et al., 2019). Doppler fall speed velocity with radar reflectivity measurements turns out to be effective to derive cloud microphysics (Heymsfield et al., 2008; Sato et al., 2009). However, these observations are spatially and temporally limited, making it difficult to statistically characterize vertical cloud processes across diverse regions over long periods of time. To capture global cloud vertical motion and investigate associated aerosol–cloud–radiation interactions, the Earth Cloud Aerosol and Radiation Explorer (EarthCARE; Illingworth et al., 2015; Wehr et al., 2023) satellite was launched in May 2024. EarthCARE carries four state-of-the-art instruments: the Cloud Profiling Radar (CPR), the Atmospheric Lidar (ATLID), the Multi-Spectral Imager (MSI), and the Broad-Band Radiometer (BBR). The CPR, developed by the Japan Aerospace Exploration Agency (JAXA) and the National Institute of Information and Communications Technology (NICT), enables the world's first spaceborne measurements of Doppler velocity from space. This capability provides spatially and temporally uniform data on the vertical structure of clouds, offering valuable insights into the global characteristics of cloud vertical motion.
The CPR, a W-band nadir-pointing radar onboard EarthCARE, measures Doppler velocity using a pulse-pair processing technique, in which Doppler velocities are derived from the coherent detection of phase shifts between successive transmitted pulses. When the CPR observes from a fast-moving satellite platform, the correlation between successive pulses is reduced, leading to increased random noise in the Doppler measurements (referred to as Doppler broadening: Kobayashi et al., 2002, 2003; Kollias et al., 2023; Hagihara et al., 2023). To mitigate this effect, a higher pulse repetition frequency (PRF) is required, allowing a larger number of pulse samples to be acquired within the medium's decorrelation time, thereby reducing random noise and improving Doppler velocity accuracy (Doviak and Zrnic, 1993; Ruzanski et al., 2008; Kollias et al., 2014). A higher PRF also increases the Nyquist velocity, thereby reducing the likelihood of velocity folding. These advantages associated with higher PRF provide the fundamental motivation for employing high-PRF observation modes in the CPR.
However, increasing the PRF imposes limitations on the CPR's maximum unambiguous range. The unambiguous range ru, defined as ) (where c is the speed of light), becomes shorter as PRF increases, which in turn restricts the observation window and increases susceptibility to second-trip echoes (a phenomenon known as the “Doppler dilemma”; Doviak and Zrnic, 1993). When a transmitted pulse reflects off the ground and, on its return path to the CPR antenna, encounters a cloud that scatters it back toward the surface, the return signal is delayed. As a result, this second-trip echo appears as a false high-altitude feature, referred to as a mirror image (Meneghini and Atlas, 1986; Li and Nakamura, 2002). Similarly, in optically thick clouds such as tropical convective systems, multiple scattering (MS) can generate spurious high-altitude echoes, commonly referred to as MS tails (Battaglia and Simmer, 2008; Battaglia, 2021; Battaglia et al., 2010, 2011, 2014, 2016). These spurious echoes tend to appear more frequently in high-PRF modes owing to the shorter unambiguous range.
This trade-off between Doppler accuracy and unambiguous range motivated the implementation of three CPR observation modes: 16, 18, and 20 km modes (Imura et al., 2025a, b). These modes are characterized by different PRFs and corresponding maximum observation height. The relationships between latitude, nominal EarthCARE orbit altitude, and PRF are illustrated in Fig. 1. The 16 km mode, which employs the highest PRF range of 7150–7500 Hz, provides the most accurate Doppler velocity measurements. However, its maximum observation height of 16 km is insufficient to fully capture very high-level clouds, such as cirrus or tropical deep convective clouds that extend above this altitude. The 18 km mode, with PRF values ranging from 6800 to 7150 Hz, also achieves relatively high Doppler accuracy, comparable to that of the 16 km mode (as indicated by the green line in Fig. 1), extending the observation range up to 18 km. In contrast, the 20 km mode employs the lowest PRF (6100–6800 Hz), which results in lower Doppler measurement accuracy but allows coverage of very high-level clouds beyond the reach of the 16 and 18 km modes.
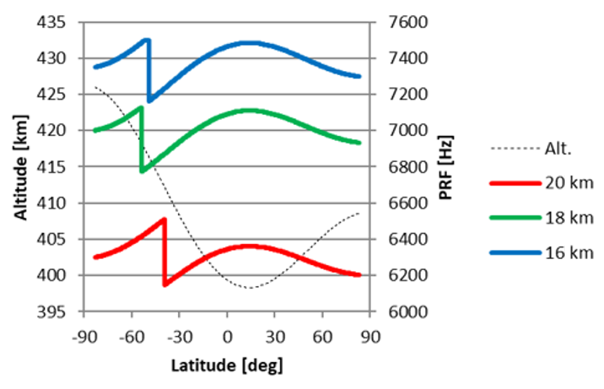
Figure 1PRF values for each EarthCARE/CPR observation mode as a function of latitude. The 16, 18, and 20 km modes are shown by blue, green, and red lines, respectively. The black dashed line indicates the nominal EarthCARE orbit altitude.
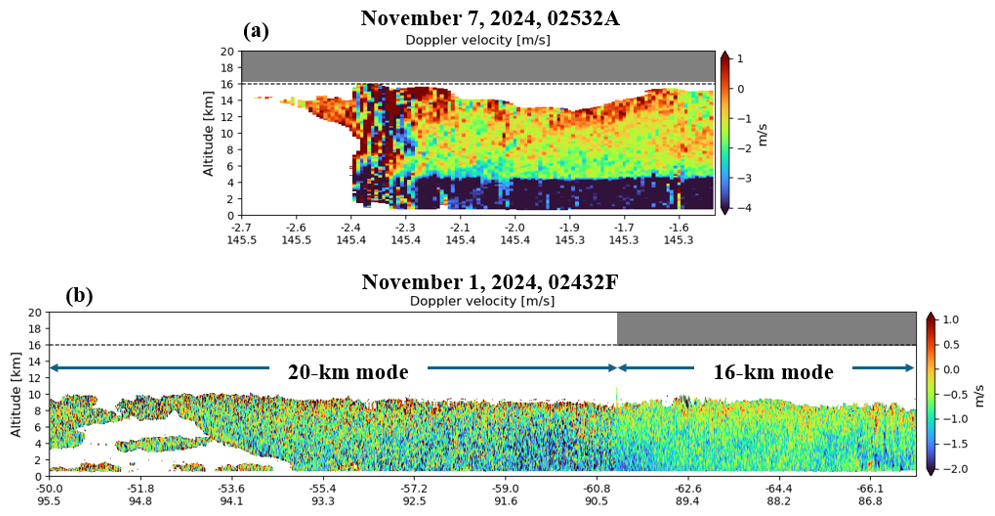
Figure 2Doppler velocity (m s−1) obtained by EarthCARE/CPR for (a) Frame 02532A acquired on 7 November 2024, and (b) Frame 02432F acquired on 1 November 2024. The upper tick marks on the horizontal axis indicate latitude, while the lower tick marks correspond to longitude. Panel (a) represents a case in which the CPR operated in the 16 km mode, whereas panel (b) shows a case with MIX-mode operation, involving a combination of the 20 and 16 km modes. In panel (b), cloud regions with reflectivity greater than −20dBZ are displayed, and the regions where the CPR operated in the 20 and 16 km modes are indicated by two-way arrows. The horizontal dashed lines denote an altitude of 16 km.
To illustrate the trade-off between Doppler velocity measurement accuracy and observation height, Fig. 2 presents two case studies based on actual CPR observations. Figure 2a shows a time–height cross-section of Doppler velocity observed on 7 November 2024, when CPR operated in the 16 km mode. Figure 2b corresponds to 1 November 2024, during which the CPR operated at latitudes lower than 60° and the 16 km mode at latitudes higher than 60° (see Sect. 2.2 for details). In Fig. 2a, cloud tops extending above 16 km are truncated due to the altitude limit of the 16 km mode, indicating that this mode is insufficient for capturing the full vertical extent of some high clouds. In contrast, regarding Doppler velocity measurement accuracy, the 16 km mode offers a notable advantage: Fig. 2b demonstrates that it yields a smoother Doppler velocity field than the 20 km mode. This suggests that the 16 km mode is subject to lower noise contamination, likely due to its higher PRF. Consequently, the 16 km mode can provide high-quality Doppler velocity measurements at the expense of reduced vertical coverage, whereas the 20 km mode offers greater observation height at the cost of increased measurement noise.
Therefore, when implementing high-PRF modes such as the 16 and 18 km modes, it is essential to quantitatively assess the trade-off between the advantages of enhanced Doppler measurement accuracy and the disadvantages associated with reduced maximum observation height and increased contamination from spurious echoes. To evaluate the benefits of enhanced Doppler accuracy, previous studies have examined the standard deviation of Doppler velocity as a reliable indicator of Doppler noise levels (Kollias et al., 2014; Burns et al., 2016; Hagihara et al., 2022, 2023). However, these studies relied primarily on simulated data, and only a limited number have analyzed actual measurements from the EarthCARE/CPR. In this study, we quantified the standard deviation of Doppler velocity derived from different PRF observation modes using actual CPR observations. Furthermore, to assess the drawbacks associated with limited observation height and the occurrence of spurious cloud echoes, we analyzed the global distributions of cloud fraction and the occurrence of mirror images and MS tails. Through these quantitative evaluations, this study discussed the optimal PRF mode configuration for different latitude bands, an issue that remains under active discussion.
The remainder of this paper is organized as follows. Section 2 describes the data and the methods used in this study. Section 3 presents the trade-off analysis among Doppler measurement accuracy, maximum observation height, and spurious cloud echoes. Section 4 summarizes the main conclusions and discusses the applicability of each CPR operational mode across different latitude bands.
2.1 Utilized datasets and methodologies
Science datasets in the EarthCARE mission are summarized in Eisinger et al. (2024). This study employs the CPR L2a one-sensor ECO product, version Ba (JAXA, 2024b), which provides radar reflectivity and Doppler velocity data with horizontal integration lengths of 1 and 10 km. In JAXA (2024b), Doppler velocity was processed using both bias correction and unfolding correction. The raw Doppler velocity measured by the CPR contains a small bias that exhibits a periodic variation along the satellite's orbit, likely resulting from CPR antenna mispointing or satellite attitude errors (Tanelli et al., 2005; Puigdomènech Treserras et al., 2025). This bias is estimated under the assumption that the horizontally averaged Doppler velocity at the surface bin over a 100 km along track distance should be zero. In addition, the CPR-measured Doppler velocity has uncertainty due to folding or aliasing, and is folded into the range from −Vmax to Vmax, where
where λ denotes the wavelength of CPR. To mitigate this folding effect, an unfolding correction is applied following the method of Hagihara et al. (2022), which assumes that velocities exceeding 3 m s−1 in regions above 0 °C correspond to upward-folded rainfall.
The measured Doppler velocity variance, , includes several uncertainty components and can be expressed as
Here, σrandom represents the random noise within the radar beam width and is estimated using the perturbation approximation (Doviak and Zrnic, 1993) as
where M is the number of pulse pairs within the integration length, ρ is the correlation function, and is the signal-to-noise ratio (SNR). Note that the difference between integration lengths of 1 and 10 km affects the value of M, resulting in changes in σrandom. The correlation coefficient ρ is given by
where σv is the total Doppler velocity spectral width. According to Eqs. (3) and (4), higher PRF and SNR reduce random noise, resulting in smaller . Based on these equations, the theoretical relationship between PRF and σrandom is calculated, as shown in Fig. 3. In this calculation, the parameter values listed in Table 1 are used. The SNR is set to 2.2 dB at −19 dBZ and is assumed to vary relative to this reference value. When comparing σrandom at −19 dBZ using the minimum PRFs of the 20, 18, and 16 km modes (6100, 6800, and 7150 Hz, respectively), the resulting values are 0.60, 0.33, and 0.26 m s−1. These results indicate that the difference in σrandom between the 20 km mode and the 18 and 16 km modes is relatively large, whereas thevalues for the 18 and 16 km modes are comparatively similar. This relationship corresponds well to the differences in PRF values shown in Fig. 1. The term σnatural represents natural variability, encompassing perturbations in vertical air motion and variations in fall speeds arising from differences in hydrometeor size and density. The standard deviation of Doppler velocity is calculated as described in Sect. 3.1; however, it should be noted that these values include contributions from both random noise and natural variability.
Table 1Values used for the calculation shown in Fig. 3. Note that one data frame is defined as a basic Doppler processing unit and consists of 24 transmit–receive windows. Doppler velocity is estimated by integrating the returned signals within one data frame. The number of pulses, NB, is set to 22 because two or three pulses are not transmitted for noise sampling or calibration.
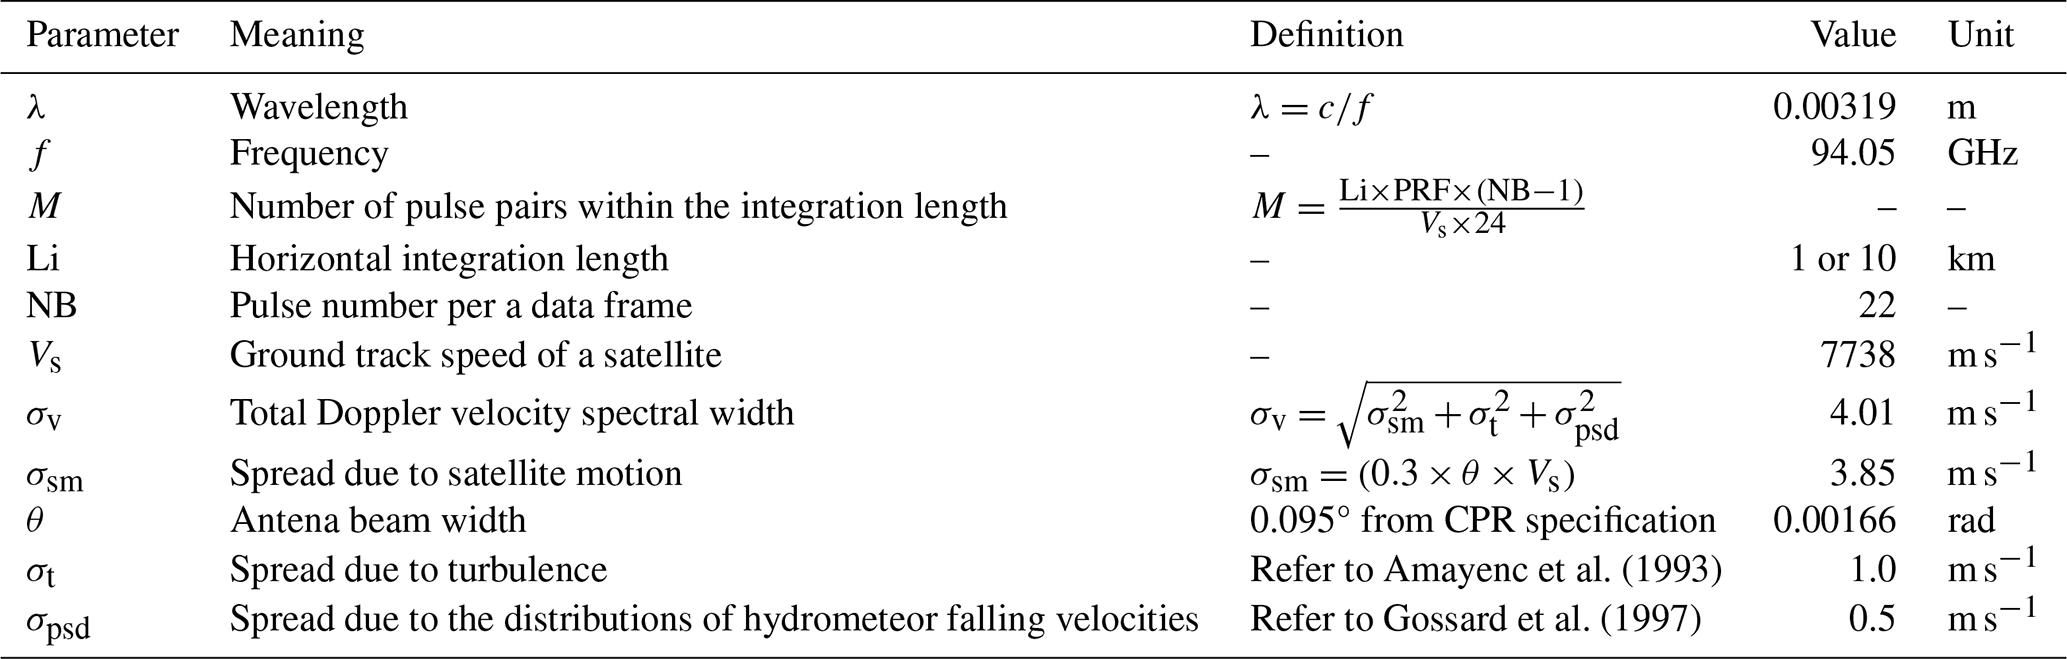
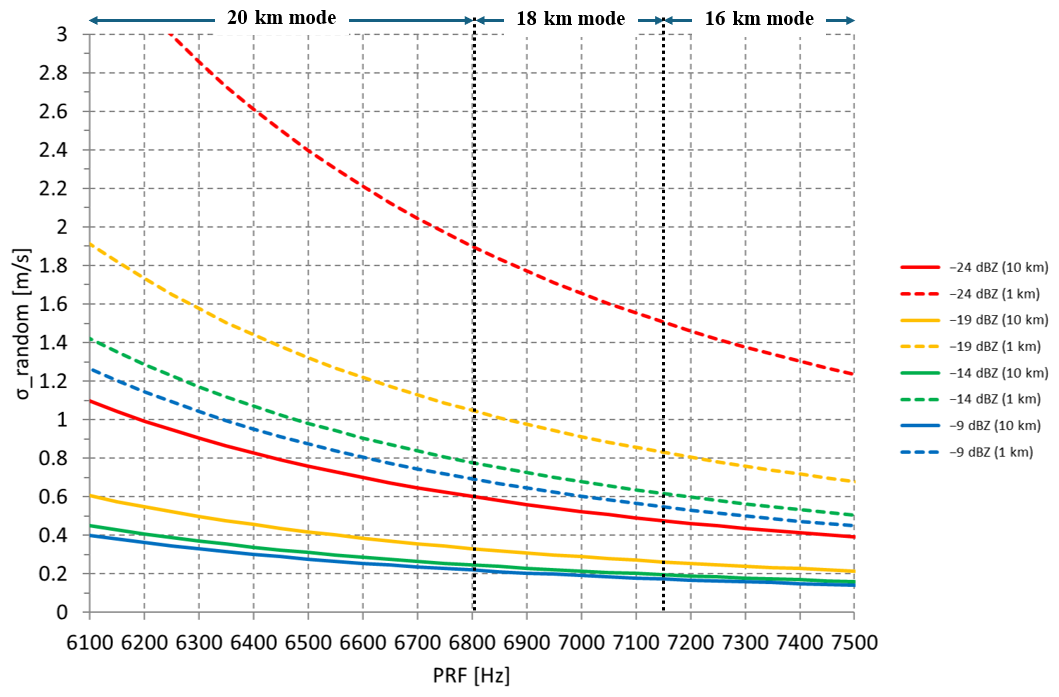
Figure 3The theoretical relationship between PRF and σrandom, calculated using Eqs. (3) and (4) and the parameters listed in Table 1. The PRFs corresponding to the 20, 18, and 16 km modes are indicated at the top of the figure. The 1 and 10 km integrations are shown by dashed and solid lines, respectively.
For the identification of cloud areas, the CPR L2a one-sensor CLP product, version Bb (JAXA, 2024c), was utilized (Sato et al., 2025). Cloud areas were defined as regions where the cloud mask value in the product was 30 or 40, corresponding to good or strong cloud echoes, respectively, and cloud fraction was defined as the proportion of observations in which clouds were detected relative to the total number of observations. In Sect. 3.3, the frequency of second-trip echo occurrence was calculated using the mirror echo flag in the CPR L2a ECO product, which identifies second-trip echoes associated with both mirror images and MS tails at two confidence levels, possible and certain. As described in the Algorithm Theoretical Basis Document (ATBD) for the JAXA's Level 2 product (JAXA, 2025), this identification method is based on Battaglia (2021). Here, we used mirror echo flag values greater than zero, i.e., cases in which either mirror images or MS tails were identified with at least possible confidence. Because of uncertainties in estimating second-trip echo reflectivity, a small fraction of mirror echoes and MS signals may remain undetected (Aoki et al., 2025). However, this issue is minor and outside the scope of the present study. Note that second-trip echoes identified by the mirror echo flag in the CPR L2a ECO product have already been removed from the cloud mask in the CPR L2a CLP product.
To further reduce the possibility of such undetected echoes, information from the ATLID sensor was incorporated. ATLID observes the atmosphere simultaneously with the CPR and has higher sensitivity to optically thin clouds. The ATLID L2a one-sensor CLA product, version Ba (JAXA, 2024d), provides a feature mask, which we used to estimate the cloud-top height (Nishizawa et al., 2026). Using this information, CPR-detected clouds were constrained such that their upper boundaries did not exceed the cloud-top height detected by ATLID, thereby more effectively removing second-trip echo artifacts. This correction is based on the assumption that lidar generally has higher sensitivity to high-level ice cloud particles than cloud radar. It is also noted that joint analysis of cloud top heights from CloudSat and CALIPSO revealed that the global mean fraction of clouds where CloudSat-determined cloud top altitude was higher than that determined by CALIPSO was relatively small (10 %) for high-level clouds, though such fractions in low- and mid-level clouds were 26 % and 39 %, respectively (Hagihara et al., 2014). This tendency can be attributed to pulse stretching effects inherent in radar observations, which can lead to an overestimation of cloud top heights by CloudSat, as discussed in Xu et al. (2026).
2.2 MIX-mode configuration and special operation of the CPR
In this study, we analyzed CPR observations over a 14-month period from August 2024 to September 2025. During this period, several changes in CPR operating modes occurred, including a major reconfiguration of the MIX-mode in July 2025 and a special observation campaign in November 2024. Because these mode transitions affect the achievable Doppler velocity accuracy, we summarize the relevant operational context here before describing the analysis results in Sect. 3.
At the beginning of the analysis period, the CPR was operated in the so-called MIX-mode, in which the radar employed the 20 km mode at latitudes lower than 60° and the 16 km mode at latitudes higher than 60°. This configuration reflects the fact that deep convective clouds can develop to much higher altitudes in low-latitude regions, while such high clouds are generally absent at high latitudes. The MIX-mode operation continued until 8 July 2025.
On 8 July 2025, the observation mode for latitudes below 60° was switched from the 20 km mode to the 18 km mode to improve Doppler velocity measurement accuracy in low-latitude regions. To evaluate the impact of this change, this study analyzed data from August–September 2024 and August–September 2025 and compared Doppler accuracy before and after the MIX-mode modification (see Sect. 3.1 for details).
In addition, CPR conducted a special global observation campaign in November 2024. During this period, the CPR operated globally in the 16 km mode from 5 November 2024 21:00:02 to 9 November 2024 00:00:02 UTC, and in the 18 km mode from 9 November 2024 00:00:03 to 12 November 2024 11:50:48 UTC. These operations were preceded by a MIX-mode period, during which the 20 km mode was active at latitudes lower than 60° from 1 November 2024 00:00:00 to 5 November 2024 21:00:01 UTC. Together, these observations enable a direct comparison of Doppler velocity measurement accuracy among the 16, 18, and 20 km modes over the same geographic regions and during the same season. Therefore, in our comparative analysis of Doppler accuracy and second-trip echo characteristics, we focused on latitudes lower than 60° (see Sect. 3.1 and 3.3) and used CPR data from all three operational modes, including the special operation period described above.
2.3 Influence of IQ offset on Doppler velocity measurements
In Doppler radar systems, the IQ offset refers to a direct current (DC) bias added to the in-phase (I) and quadrature (Q) baseband signals due to receiver imperfections, such as mixer imbalance and analog circuit offsets. This offset shifts the I/Q constellation away from the origin and can influence Doppler velocity measurements, particularly in low-reflectivity regions with a low ratio.
CPR is equipped with a nominal and a redundant Signal Processing Unit (SPU-B and SPU-A, respectively), which exhibit different IQ offset characteristics. It is known that the IQ offset of SPU-A, which was refurbished from the engineering model, is larger than that of SPU-B. From the start of observations on 18 June until 22 June 2024, CPR operated using SPU-B. Due to an operational issue, the active unit was switched from SPU-B to SPU-A on 24 July 2024. The system was then switched back to SPU-B on 26 November 2024, and SPU-B has been in operation since then. The Doppler velocity analysis using data from November 2024, which is the primary focus of this study, corresponds to the period during which CPR was operating with SPU-A. Therefore, to mitigate the impact of IQ offset on Doppler velocity measurements, particularly in noisy low-reflectivity regions, this study focuses on higher-reflectivity regions (greater than −20 dBZ), where radar echoes are more reliable.
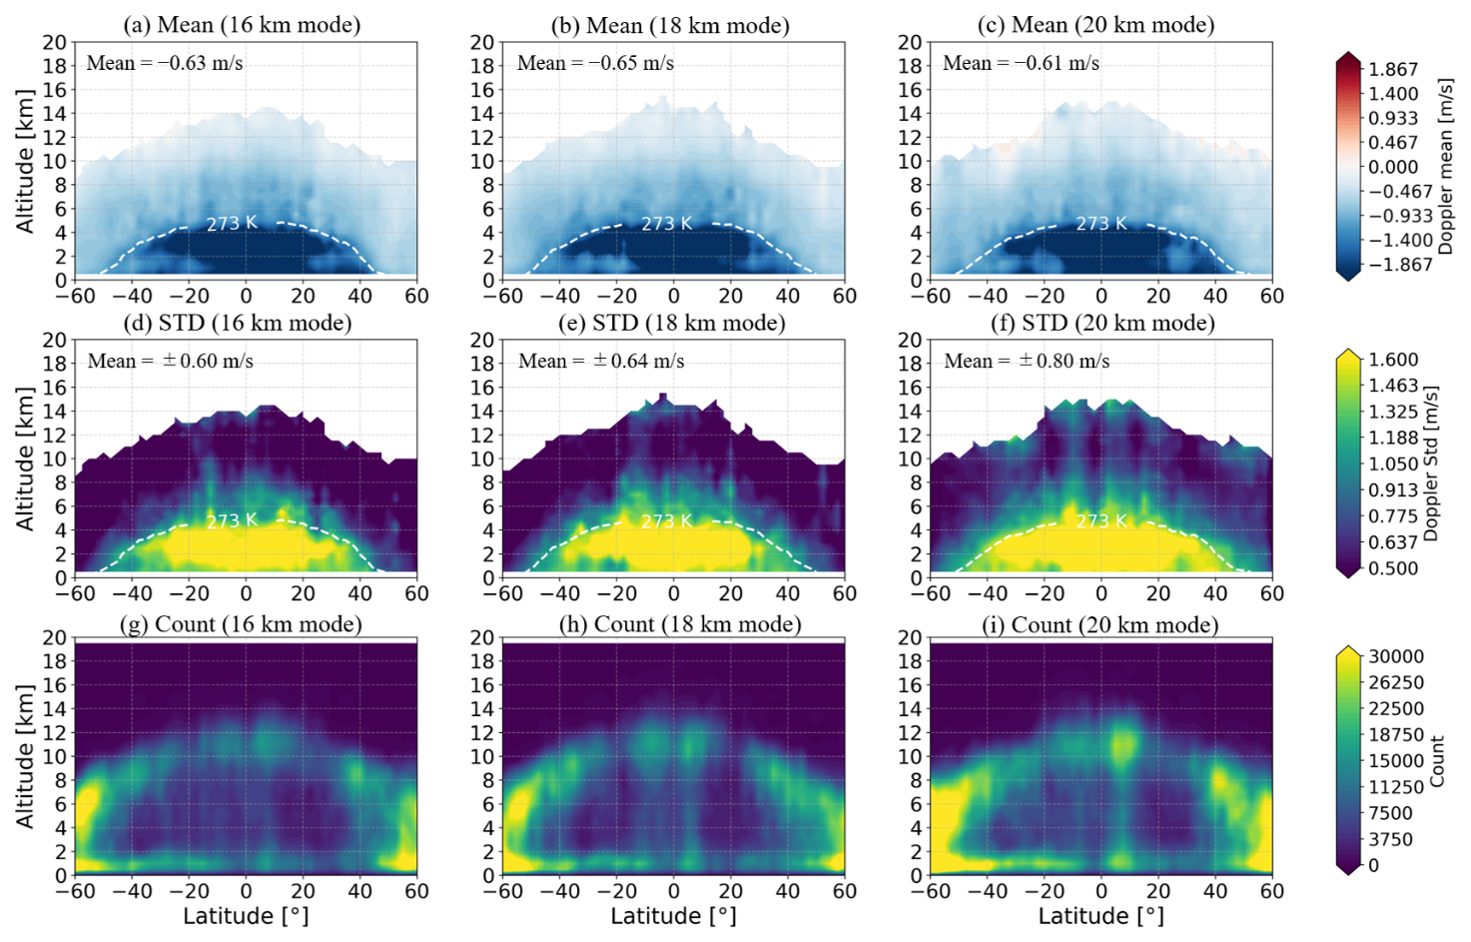
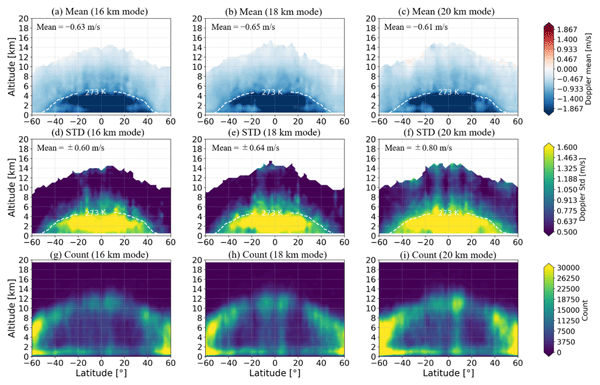
Figure 4Latitude-altitude cross sections of (a–c) mean Doppler velocity, (d–f) standard deviation of Doppler velocity, and (g–i) cloud sample counts for radar reflectivities between −20 and 0 dBZ. The 10 km integration Doppler data were used. The mean values of Doppler velocity and its standard deviation at temperatures below 273 K are shown at the top of each panel. The 16, 18, and 20 km modes are shown from left to right. The white dashed line in panels (a)–(f) indicates the 273.15 K isotherm. Data acquired from 1 to 12 November 2024 were used, and only latitudes within 60° S–60° N are shown. Cloud echoes above the cloud-top heights detected by ATLID were excluded from the analysis. The mean Doppler velocity and SD are masked where the sample count is less than 1000.
3.1 Standard deviation of Doppler velocity from CPR
To quantify differences in Doppler velocity data quality among the CPR operational modes, this study calculated the standard deviation (SD) of Doppler velocity, which serves as a useful proxy for sum of Doppler measurement accuracy and natural variabilities of Doppler velocity. The standard deviation was calculated from all samples within each latitude–height bin for radar reflectivities between −20 and 0 dBZ. The 10 km integration Doppler data were used. This analysis focuses on the latitudinal band from 60° S to 60° N and the period from 1 to 12 November 2024, during which the 16 and 18 km modes were globally fixed. Figure 4a–c show the latitude-altitude cross sections of the mean Doppler velocity for each operational mode, while Fig. 4d–f show the corresponding STDs. Figure 4 is intended primarily to provide a qualitative overview of the spatial distribution of Doppler velocity variability among the operational modes. The latitude–altitude cross sections also help assess whether the differences among operational modes are spatially localized or systematically present across a wide range of cloud conditions. We focus on reflectivity between −20 and 0 dBZ in order to exclude regions with low ratios at very low reflectivity, where the influence of the IQ offset in SPU-A on Doppler velocity measurements is significant, as described in Sect. 2.3, as well as regions strongly affected by attenuation at very high reflectivity. In addition, the mean and SD of Doppler velocity were masked where the sample count was less than 1000 to exclude noisy Doppler velocity values associated with small sample sizes near cloud-top edges. Figure 4a–c indicate that the mean Doppler velocity is generally positive at higher altitudes and negative from the middle to lower troposphere. The large negative Doppler velocities at temperatures above 273 K correspond to rain regions. In Fig. 4d–f, the large STDs at temperatures above 273 K correspond to rain regions, where a wide range of hydrometeors, from drizzle to raindrops, exhibits a broad spectrum of fall velocities. In contrast, the enhanced STDs near cloud-top altitudes are primarily attributed to the limited number of available cloud samples, as indicated in Fig. 4g–i. When comparing across operational modes, in cloud regions at temperatures below 273 K, the 20 km mode exhibits relatively large STDs (Fig. 4f; mean SD of 0.80 m s−1), whereas the 16 and 18 km modes (Fig. 4d and e; mean STDs of 0.60 and 0.64 m s−1, respectively) show smaller and comparable SD values when SD values are compared at the same latitude and altitude between the two modes. These differences are consistent with the corresponding PRF differences among the modes: the 16 km mode, with the highest PRF, provides more accurate Doppler measurements and thus smaller STDs, while the 20 km mode, with the lowest PRF, exhibits degraded Doppler performance and larger STDs. The spatially coherent enhancement of SD in the low PRF mode across most cloud regions suggests that the larger STDs are not driven by a particular latitude or altitude range but represent a systematic characteristic of the lower-PRF configuration.
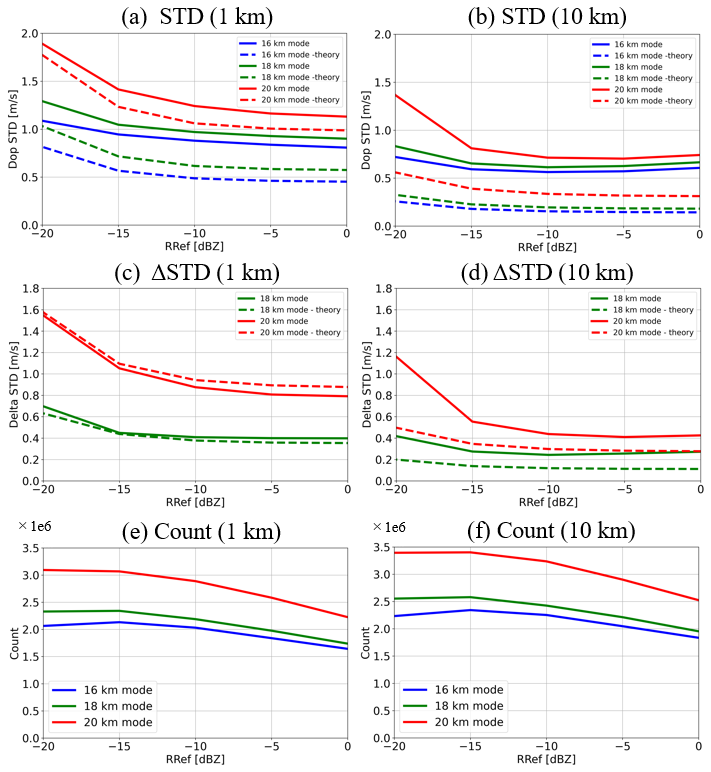
Figure 5(a, b) STDs of Doppler velocity (m s−1) as a function of radar reflectivity; (c, d) SD differences (m s−1) of the 18 and 20 km modes relative to the 16 km mode; and (e, f) sample counts for each radar reflectivity bin. The left and right panels correspond to the 1 and 10 km integrations, respectively. The second row shows ΔSD, defined as Eqs. (5) and (6), which represent the difference in random Doppler velocity uncertainty relative to the 16 km mode, removing the common contribution from natural variability. The 16, 18, and 20 km modes are indicated by blue, green, and red lines, respectively. In panels (a)–(d), the solid and dashed lines represent observed values and theoretical estimates, respectively. The observed data from 1–12 November 2024 were used, and the analysis region is limited to latitudes within 60° and temperatures below 273 K. To ensure a consistent comparison among the modes, only clouds below 16 km were analyzed.
To further examine how Doppler measurement accuracy depends on the ratio, the dependency of the Doppler velocity SD on radar reflectivity was analyzed. Figure 5a and b show the Doppler velocity STDs as a function of radar reflectivity for the 16 km (solid blue line; SD16 km), 18 km (solid green line; SD18 km), and 20 km (solid red line; SD20 km) operational modes. To investigate the dependence of SD on the integration length, results from 1 and 10 km integrations are compared. This analysis focuses on the latitudinal band from 60° S to 60° N during the special operation of the CPR from 1 to 12 November 2024. To ensure consistency across modes, only clouds below 16 km were considered, because clouds detectable by the 18 and 20 km modes above this altitude are not observable by the 16 km mode. Furthermore, to avoid signal degradation caused by strong attenuation from precipitation, cloud regions below the melting layer were excluded. The standard deviation was calculated from all samples within each reflectivity bin between −2 and 0 dBZ. Note that the observed Doppler STDs include contributions from both random errors and natural variability, as described in Eq. (2).
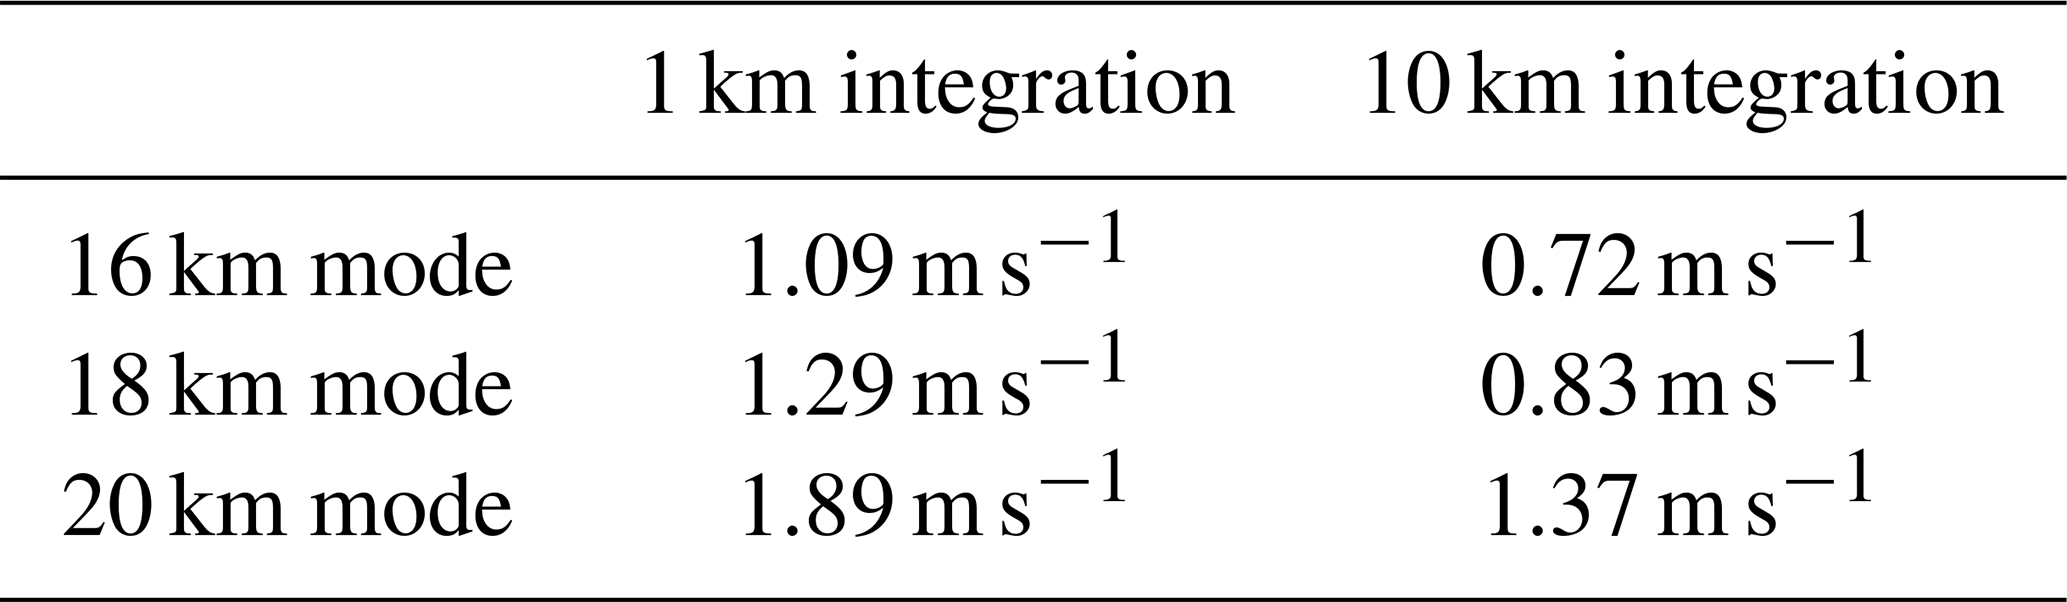
Figure 5e and f show the corresponding sample counts for each radar reflectivity bin. The sample counts for each operational mode are comparable in magnitude (on the order of 106), thereby ensuring a fair comparison of Doppler velocity STDs. Figure 5a and b show a clear decreasing trend in SD with increasing radar reflectivity, which is attributable to improved SNR at higher reflectivity values, as described in Eq. (3). A comparison between integration lengths indicates that the 10 km integration produces smaller STDs than the 1 km integration, reflecting the noise-reduction benefit of temporal and spatial averaging. Across operational modes, the 20 km mode exhibits the largest STDs, whereas the 16 km mode consistently shows the smallest values (see Table 2), indicating that the 16 km mode, which employs the highest PRF, provides the best Doppler measurement performance. The 18 km mode yields STDs comparable to those of the 16 km mode, with only slightly larger values, indicating nearly equivalent Doppler measurement performance.
The dashed lines in Fig. 5 show the theoretical calculation of Doppler velocity measurement, derived from Eq. (3) following Doviak and Zrnic (1993). For these theoretical calculations, the PRF used in the calculation was based on the actual operational values recorded in the CPR L1b one-sensor NOM product, version Da (JAXA, 2024a). The findings from Fig. 5a and b are fully consistent with the theoretical estimates of random Doppler velocity error; however, when focusing on the absolute SD values, the observed SD is generally larger than the theoretical value. This is because the observed Doppler velocity contains not only random measurement error but also components associated with natural variability. In addition, the use of SPU-A, which represents poorer Doppler velocity measurement performance compared to SPU-B, also contributes to the larger observed SD.
Figure 5c and d present the differences in Doppler STDs between the 20 km (ΔSD20 km) or 18 km modes (ΔSD18 km) and the 16 km mode (in m s−1). Based on Eq. (2) and under the assumption that the natural variability component is common among the modes within each reflectivity bin, these differences can be expressed as
These metrics, defined in Eqs. (5) and (6), quantify the degradation in Doppler observation performance of the 20 and 18 km modes relative to the 16 km mode, which employs the highest PRF, provided that natural variabilities of clouds/drizzle/precipitation are similar at same radar reflectivity among the three modes and it is expected that these differences between the 20 or 18 km and the 16 km modes correspond solely to the Doppler velocity measurement accuracy. Furthermore, Eqs. (5) and (6) effectively represent the differences in random error between the modes by removing the natural variability component and can be compared with theoretical random error estimates derived from Eqs. (3) and (4).
Figure 5c and d show that the 20 km mode produces substantially larger SD differences (1.54 and 1.17 m s−1 at −20 dBZ for 1 and 10 km integrations, respectively), whereas the 18 km mode exhibits much smaller SD differences (0.69 and 0.41 m s−1 at −20 dBZ for 1 and 10 km integrations, respectively). These differences tend to decrease with increasing radar reflectivity because of the improvement in ; however, the decreasing trend becomes obscure approximately above −15 dBZ. This behavior is consistent with the theoretical results shown in Fig. 3. Overall, these results demonstrate that the 16 and 18 km modes provide higher Doppler data quality than the 20 km mode and exhibit similar overall Doppler measurement performance. In addition, the theoretical differences in STDs shown in Fig. 5c and d are in good agreement with the observations, both exhibiting decreasing trends with increasing reflectivity, and the 20 km mode consistently shows larger values than the 18 km mode. In particular, the theoretical and observed SD differences show very close agreement at the 1 km integration. The slight discrepancies between the observed and theoretical values likely arise from the aforementioned use of SPU-A, the use of a fixed PRF, and the possibility that the natural variability component is not completely removed.
Table 2Doppler standard deviation values at −20 dBZ for 1 and 10 km integrations shown in Fig. 5a and b.
3.2 Evaluation of high-level cloud coverage
As mentioned, the high-PRF modes such as the 16 and 18 km modes offer significant advantages in terms of Doppler measurement accuracy. However, their maximum observation altitudes are lower than that of the 20 km mode, which can detect clouds up to 20 km. This limitation may lead to missed detections of high-level clouds. To assess the feasibility of implementing the 16 or 18 km modes depending on latitudes, the zonal-mean cloud coverage was examined to identify the latitudinal bands where these operational modes are appropriate.
Figure 6 shows the zonal-mean cloud fractions derived from CPR, averaged over a one-year period from August 2024 to July 2025. The results are displayed on a logarithmic colour scale to emphasize regions of low cloud fraction, and to enhance the visibility of the vertical and latitudinal distributions of cloud occurrence. To avoid contamination by second-trip echoes at high altitudes, as described in Sect. 2.1, the cloud fractions were corrected such that they do not extend above the cloud-top heights detected by ATLID.
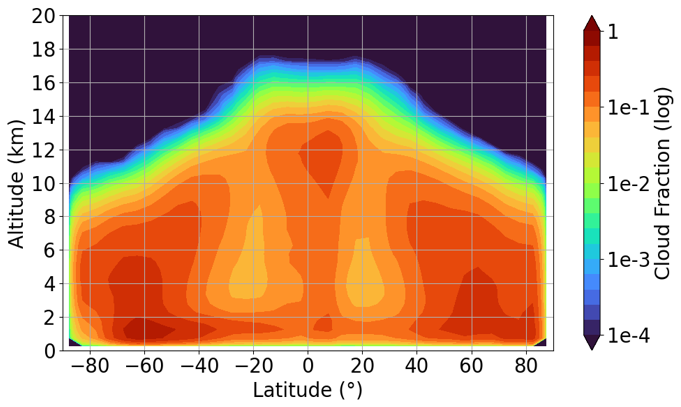
Figure 6Zonal-mean cloud fraction derived from CPR observations, averaged over a one-year period from August 2024 to July 2025. Values are displayed on a logarithmic scale to highlight regions of low cloud fraction and to emphasize the presence of clouds at high altitudes. Clouds above the cloud-top heights detected by ATLID are excluded from this analysis.
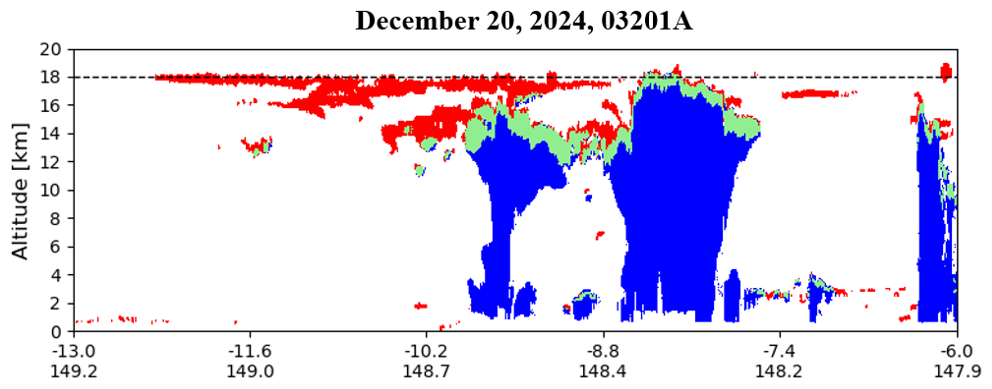
Figure 7Cloud regions detected by CPR and ATLID for Frame 03201A acquired on 20 December 2024. Red, blue, and green indicate cloud regions detected by ATLID, CPR, and their overlap, respectively. The upper and lower ticks on the horizontal axis denote latitude and longitude, respectively. The dashed line indicates an altitude of 18 km.
Focusing on the maximum altitude of cloud occurrence, clouds extending above 16 km are primarily observed between latitudes 0 and 40°, suggesting that the 16 km mode can be implemented in the latitude bands of 40–90°. At lower latitudes, however, high-level convective clouds in the tropics frequently extend above 16 km, rendering the 16 km mode unsuitable in these regions. The globally averaged cloud fractions above 16 and 18 km are and , respectively. Given the extremely small cloud fraction above 18 km, the 18 km mode can be applied even in low-latitude regions. Nevertheless, in rare cases, clouds may extend beyond 18 km, such as overshooting tropical convective clouds (Iwasaki et al., 2010; Bedka et al., 2012; Takahashi and Luo, 2014; Takahashi et al., 2017). Figure 7 provides an example of such an event, showing cloud tops exceeding 18 km as detected by CPR and ATLID. In these instances, the 18 km mode may fail to capture the uppermost portions of the clouds, and this limitation should be considered when applying the mode in low-latitude regions.
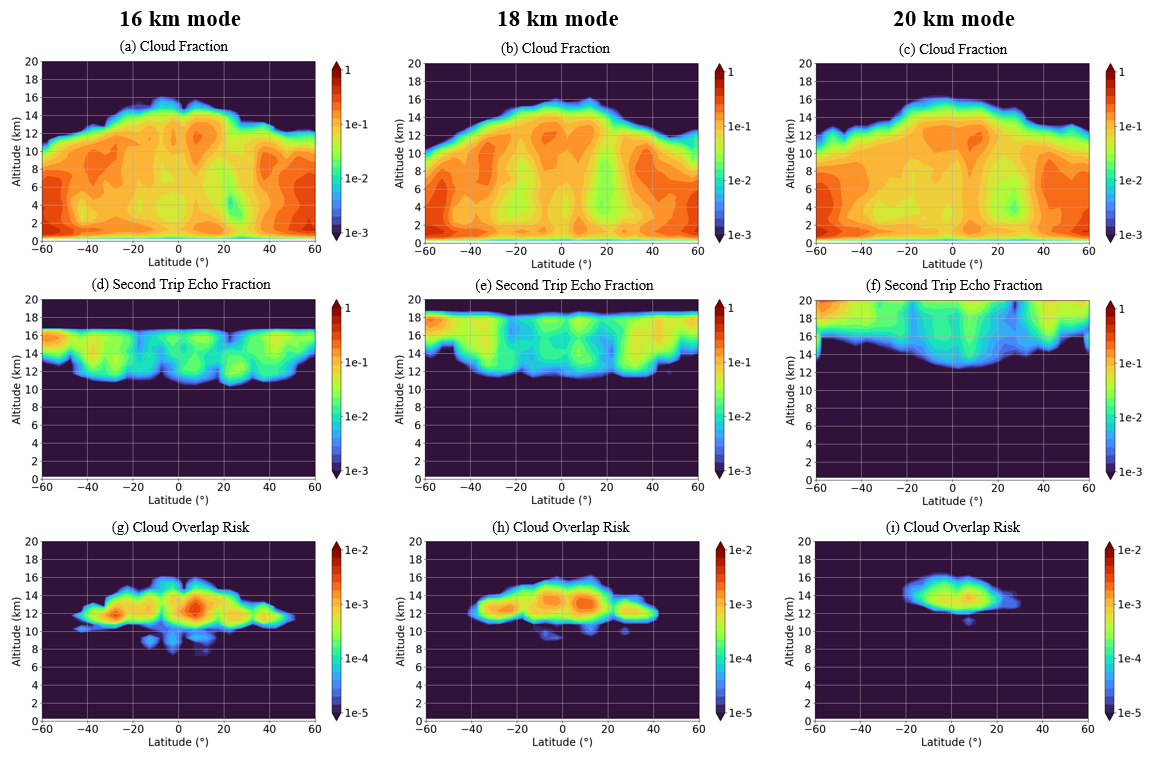
Figure 8Zonal-mean (a–c) cloud fraction derived from CPR observations, (d–f) second-trip echo occurrence frequency, and (g–i) overlap risk between cloud echoes and second-trip echoes, defined as the product of the cloud fraction and second-trip echo fraction. Panels (a)–(c) show the mean cloud fractions averaged over the respective observation periods of the 16, 18, and 20 km modes. Clouds above the cloud-top heights detected by ATLID are excluded in panels (a)–(c). Data from 1–12 November 2024 were used, and the analysis region is limited to latitudes within 60°. All quantities are displayed on a logarithmic scale.
3.3 Evaluation of second-trip contamination
In the 16 and 18 km modes, which use higher PRFs, second-trip echoes, including mirror images, are more likely to occur, as discussed in Sect. 3.1. Although the CPR L2a ECO product provides information on the probable locations of second-trip echoes, second-trip echo reflectivity values are not provided because of uncertainties in their estimation. As a result, it is difficult to directly quantify cases in which real clouds overlap with second-trip echoes. Therefore, this study estimates the overlap risk for each operational mode by using the statistical occurrence frequencies of real clouds and second-trip echoes.
Figure 8 shows zonal-mean cloud fraction, second-trip echo fraction, and the resulting overlap risk between real clouds and second-trip echoes for each operational mode, based on data from November 2024. The overlap risk is defined as the product of the cloud fraction and the second-trip echo fraction, implying that the risk increases when either component is large. Note that this metric is not intended to represent the true joint probability of second-trip echoes and cloud occurrence, because the two events are not statistically independent. Specifically, as cloud-top heights increase, the altitude at which second-trip echoes from mirror images appear becomes lower, leading to a higher likelihood of overlap with actual cloud echoes when high clouds are present. MS tails also tend to occur in association with deep convection, in which case second-trip echoes are likewise more likely to overlap with real cloud echoes. Rather, it is introduced as a risk index that combines the occurrence frequencies of real clouds and second-trip contamination. The spatial distribution of clouds is generally consistent across the operational modes (Fig. 8a–c). In contrast, the occurrence characteristics of second-trip echoes differ substantially among the modes: second-trip echoes tend to occur at lower altitudes in the 16 km mode, whereas they appear preferentially at higher altitudes in the 20 km mode (Fig. 8d–f). Regarding the overlap risk, it is lowest in the 20 km mode, with a global-mean value of , and larger in both the 16 and 18 km modes ( for each; Fig. 8g–i), corresponding to an increase by a factor of approximately 3.6 relative to the 20 km mode. Focusing on the latitudinal extent of the overlapping regions, these areas extend up to approximately 40° latitude in the 16 and 18 km modes (Fig. 8g and h), whereas they are confined to about 20° latitude in the 20 km mode (Fig. 8i). This result indicates that the 16 and 18 km modes carry an increased risk of overlap between real cloud echoes and second-trip echoes within roughly 0–40°, while in the 20 km mode, this potential overlap is largely restricted to approximately 0–20°.
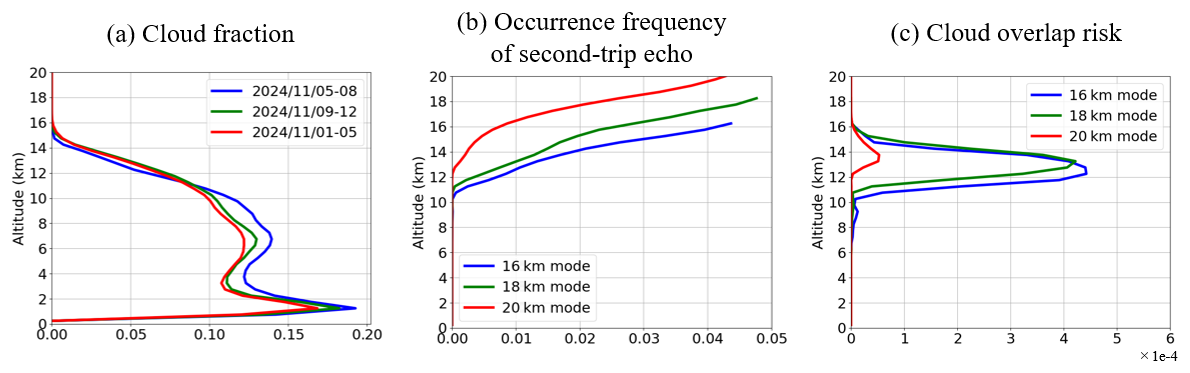
Figure 9Vertical profiles of (a) cloud fraction, (b) occurrence frequency of second-trip echo, and (c) overlap risk between cloud and second-trip echoes, defined as the product of the cloud fraction and second-trip echo fraction shown in panels (a) and (b). The 16, 18, and 20 km modes are indicated by blue, green, and red lines, respectively. In panel (a), the coloured lines represent the mean cloud fractions over the respective observation periods of each operational mode. Clouds above the cloud-top heights detected by ATLID are excluded in panel (a). The analysis region is limited to latitudes within 60°.
Figure 9 shows the corresponding vertical profiles of these quantities. Clouds are predominantly observed up to approximately 16 km (Fig. 9a), while second-trip echoes begin to occur at altitudes around 10 km in the 16 and 18 km modes, and around 12 km in the 20 km mode (Fig. 9b). As a result, cloud and second-trip echo signals overlap primarily between altitudes of roughly 10 and 16 km, as indicated by the overlap risk profile in Fig. 9c. The overlap risk for the 20 km mode peaks at an altitude of approximately 13.75 km, reaching values of , whereas the corresponding overlap risks in the 16 and 18 km modes at the same altitude are and , respectively, which are approximately 6.3 and 6.8 times larger than that of the 20 km mode. These results indicate that the high-PRF modes carry a substantially higher risk of overlap between real cloud echoes and second-trip echoes. It should also be noted that the mirror echo flag information used in this analysis is incomplete and may occasionally fail to identify second-trip echoes, suggesting that the actual overlap risk may be underestimated in the present results.
This study investigated the applicability of the 16, 18, and 20 km observation modes of the CPR, each characterized by different PRFs and maximum observation altitudes, based on actual CPR observation data, extending earlier simulation-based evaluations. To quantitatively assess and compare the advantages and disadvantages of these three modes, the analysis focused on three key aspects: (1) Doppler velocity measurement accuracy, (2) high-level cloud fraction, and (3) the occurrence frequency of second-trip echoes.
Regarding Doppler measurement accuracy, the SD of Doppler velocity was used as an indicator within the latitudinal range of 60° S–60° N. The largest SD values were found in the 20 km mode, whereas the 16 and 18 km modes exhibited smaller and comparable STDs (Figs. 4–5). Provided that natural variabilities of cloud contributions in STDs are similar at the same reflectivity among the three modes, the differences in SD between two modes, such as 18 and 16 km modes, correspond to the differences in Doppler measurement accuracy as a function of radar reflectivity (Fig. 5). These results demonstrate that the 16 and 18 km modes provide more accurate Doppler velocity measurements than the 20 km mode, with the 18 km mode achieving Doppler accuracy comparable to that of the 16 km mode. Although this performance hierarchy has been theoretically suggested by previous simulation studies, this study confirms it for the first time using actual CPR observation data.
In terms of high-level cloud coverage, clouds exceeding above an altitude of 16 km were primarily observed between approximately 0 and 40° latitude, whereas clouds extended above 18 km were rare within this latitude range (Fig. 6). Accordingly, the 18 or 20 km mode is appropriate for implementation within the 0–40° latitude range. In contrast, at higher latitudes, the 16 km mode or 18 km mode is more suitable for ensuring high Doppler measurement accuracy, given the limited occurrence of very high clouds. Regarding second-trip echo occurrence, the potential overlap between real cloud and second-trip echoes was more frequent in the 16 and 18 km modes than in the 20 km mode (Figs. 8–9). Such overlap events were largely confined to altitudes between 10 and 16 km and latitudes between approximately 0 and 40°, indicating that the 16 and 18 km modes remain applicable at latitudes above 40°, where overlap risk is minimal.
In summary, for latitudes between 0 and 40°, both the 18 and 20 km modes can be used, as the cloud fraction above 16 km is relatively high, whereas that above 18 km is extremely small in these regions. When the 18 km mode is employed within this latitude band, it provides higher-quality Doppler velocity measurements but entails a greater risk of overlap between real clouds and second-trip echoes compared with the 20 km mode. For latitudes above 40°, all observation modes are suitable in terms of cloud vertical extent; however, the 16 km mode is preferable because it offers the highest Doppler velocity accuracy, cloud occurrence is generally sparse, and the risk of cloud–mirror overlap is low.
Currently, the operational concept of the CPR prioritizes higher Doppler velocity measurement accuracy at the expense of an increased risk of cloud–second-trip echo overlap. Accordingly, the 20 km mode was replaced by the 18 km mode between 0 and 60° during the nominal MIX-mode operation since 8 July 2025. In addition, a further modification to the MIX-mode was implemented on 26 November 2025, whereby the latitude boundary for switching between the 16 and 18 km modes was shifted from 60 to 40° in order to enhance Doppler data quality in the 40–60° latitude band. In both cases, the risk of cloud–second-trip echo overlap is expected to increase. In particular, when real cloud echoes and second-trip echoes overlap, it is difficult for the mirror echo flag used to identify second-trip echoes to distinguish between them, potentially leading to an underestimation of the overlap risk evaluated in this study. Therefore, continuous and careful quantification of the overlap risk is required in future work. Regarding the evaluation of Doppler measurement accuracy, the Doppler STDs calculated in this study include contributions from natural variability and thus do not represent pure random errors. To better interpret Doppler STDs, future studies should further validate the CPR Doppler measurements using independent observations, such as ground-based or aircraft-borne radars operating in coordination with EarthCARE underflights (e.g., HG-SPIDER; Horie et al., 2000, HALO/HAMP; Mech et al., 2014; Ewald et al., 2019). Furthermore, in the tropics, rare overshooting convective clouds can exceed altitudes of 18 km. In such cases, the 18 km mode cannot fully capture the uppermost portions of these clouds. Thus, a statistical analysis of cloud fractions above 18 km in the tropics, based on ATLID observations, should be conducted in future studies.
Overall, the findings of this study highlight the inherent trade-off between Doppler measurement accuracy and the risk of second-trip echo occurrence across the three CPR observation modes. Discussions on the optimal implementation of observation modes for each latitude band are currently ongoing.
All EarthCARE products (https://doi.org/10.57746/EO.01jdvcydwjf63vpdbjp0vz6v64, JAXA, 2024a; https://doi.org/10.57746/EO.01jdvd0xm10ema4rxwbpcd0dn1, JAXA, 2024b; https://doi.org/10.57746/EO.01jdvd2gqq34e6yz9p8kfe68x5, JAXA, 2024c; https://doi.org/10.57746/EO.01jkwjk45jrx9frz6c11x4rs8e, JAXA, 2024d; https://www.eorc.jaxa.jp/EARTHCARE/document/JAXAL2Product, JAXA, 2025) used in this study can be downloaded from the JAXA G-Portal.
YI analyzed the satellite data and prepared the initial draft of the manuscript. SA provided the dataset necessary for evaluating the second-trip echo. TK advised on the study direction and provided helpful comments. HN, YO, and HO provided technical suggestions, interpretation of physical meaning and valuable feedback for the analysis.
At least one of the (co-)authors is a guest member of the editorial board of Atmospheric Measurement Techniques for the special issue “Early results from EarthCARE (AMT/ACP/GMD inter-journal SI)”. The peer-review process was guided by an independent editor, and the authors also have no other competing interests to declare.
Publisher's note: Copernicus Publications remains neutral with regard to jurisdictional claims made in the text, published maps, institutional affiliations, or any other geographical representation in this paper. The authors bear the ultimate responsibility for providing appropriate place names. Views expressed in the text are those of the authors and do not necessarily reflect the views of the publisher.
This article is part of the special issue “Early results from EarthCARE (AMT/ACP/GMD inter-journal SI)”. It is not associated with a conference.
The authors would like to thank the scientists at ESA-JAXA EarthCARE Joint Mission Advisory Group (JMAG) and Quality Working Group (QWG) for their helpful comments and advice. In particular, the authors greatly appreciate Hiroaki Horie for providing insightful comments on the analyses.
This paper was edited for English language quality using an AI-based tool.
Hajime Okamoto was supported in part by the Japan Aerospace Exploration Agency (JAXA) for the EarthCARE Mission (EORA3 and EORA4), in part by JSPS KAKENHI (grant no. JP24H00275), and by the Collaborative Research Program of the Research Institute for Applied Mechanics, Kyushu University.
This paper was edited by Robin Hogan and reviewed by two anonymous referees.
Albrecht, B. A.: Aerosols, cloud microphysics, and fractional cloudiness, Science, 245, 1227–1230, https://doi.org/10.1126/science.245.4923.1227, 1989.
Amayenc, P., Testud, J., and Marzoug, M.: Proposal for a Spaceborne Dual-Beam Rain Radar with Doppler Capability, J. Atmos. Ocean. Tech., 10, 262–276, https://doi.org/10.1175/1520-0426(1993)010<0262:PFASDB>2.0.CO;2, 1993.
Aoki, S., Kubota, T., and Horie, H.: Second-trip echoes appeared in EarthCARE/CPR: Characteristics and mitigation performances in JAXA CPR L2a Product, 2nd ESA-JAXA EarthCARE In-Orbit Validation Workshop Frascati, Italy, 17–20 March 2025, https://airdrive.eventsair.com/eventsairwesteuprod/production-nikal-public/2d6d6bd6fc524b5082cf2c8b0855c7bc (last access: 6 January 2026), 2025.
Battaglia, A.: Impact of second-trip echoes for space-borne high-pulse-repetition-frequency nadir-looking W-band cloud radars, Atmos. Meas. Tech., 14, 7809–7820, https://doi.org/10.5194/amt-14-7809-2021, 2021.
Battaglia, A. and Simmer, C.: How Does Multiple Scattering Affect the Spaceborne W-Band Radar Measurements at Ranges Close to and Crossing the Sea-Surface Range?, IEEE T. Geosci. Remote, 46, 1644–1651, https://doi.org/10.1109/TGRS.2008.916085, 2008.
Battaglia, A., Tanelli, S., Kobayashi, S., Zrnic, D., Hogan, R. J., and Simmer, C.: Multiple-scattering in radar systems: A review, J. Quant. Spectrosc. Ra., 111, 917–947, https://doi.org/10.1016/j.jqsrt.2009.11.024, 2010.
Battaglia, A., Augustynek, T., Tanelli, S., and Kollias, P.: Multiple scattering identification in spaceborne W-band radar measurements of deep convective cores, J. Geophys. Res., 116, D19201, https://doi.org/10.1029/2011JD016142, 2011.
Battaglia, A., Tanelli, S., Heymsfield, G. M., and Tian, L.: The Dual Wavelength Ratio Knee: A Signature of Multiple Scattering in Airborne Ku–Ka Observations, J. Appl. Meteorol. Clim., 53, 1790–1808, https://doi.org/10.1175/JAMC-D-13-0341.1, 2014.
Battaglia, A., Mroz, K., Tanelli, S., Tridon, F., and Kirstetter, P.-E.: Multiple-Scattering-Induced “Ghost Echoes” in GPM DPR Observations of a Tornadic Supercell, J. Appl. Meteorol. Clim., 55, 1653–1666, https://doi.org/10.1175/JAMC-D-15-0136.1, 2016.
Bedka, K. M., Dworak, R., Brunner, J., and Feltz, W.: Validation of Satellite-Based Objective Overshooting Cloud-Top Detection Methods Using CloudSat Cloud Profiling Radar Observations, J. Appl. Meteorol. Climatol., 51, 1811–1822, https://doi.org/10.1175/JAMC-D-11-0131.1, 2012.
Betts, A. K. and Miller, M. J.: A new convective adjustment scheme. Part 11: Single column tests using GATE wave, BOMEX, ATEX and arctic air-mass data sets, Q. J. Roy. Meteor. Soc., 112, 693–709, https://doi.org/10.1002/qj.49711247308, 1986.
Burns, D., Kollias, P., Tatarevic, A., Battaglia, A., and Tanelli, S.: The performance of the EarthCARE Cloud Profiling Radar in marine stratiform clouds, J. Geophys. Res.-Atmos., 121, 14525–14537, https://doi.org/10.1002/2016JD025090, 2016.
Couvreux, F., Hourdin, F., Williamson, D., Roehrig, R., Volodina, V., Villefranque, N., Rio, C., Audouin, O., Salter, J., Bazile, E., Brient, F., Favot, F., Honnert, R., Lefebvre, M.-P., Madeleine, J.-B., Rodier, Q., and Xu, W.: Process-based climate model development harnessing machine learning: I. Acalibration tool for parameterization improvement. J. Adv. Model. Earth Sy., 13, e2020MS002217, https://doi.org/10.1029/2020MS002217, 2021.
Doviak, R. J. and Zrnic, D. S.: Doppler Radar and Weather Observations, Academic Press, San Diego, CA, 2nd edn., 592 pp., ISBN 978-0-12-221422-6, 1993.
Eisinger, M., Marnas, F., Wallace, K., Kubota, T., Tomiyama, N., Ohno, Y., Tanaka, T., Tomita, E., Wehr, T., and Bernaerts, D.: The EarthCARE mission: science data processing chain overview, Atmos. Meas. Tech., 17, 839–862, https://doi.org/10.5194/amt-17-839-2024, 2024.
Ewald, F., Groß, S., Hagen, M., Hirsch, L., Delanoë, J., and Bauer-Pfundstein, M.: Calibration of a 35 GHz airborne cloud radar: lessons learned and intercomparisons with 94 GHz cloud radars, Atmos. Meas. Tech., 12, 1815–1839, https://doi.org/10.5194/amt-12-1815-2019, 2019.
Gossard, E. E., Snider, J. B., Clothiaux, E. E., Martner, B., Gibson, J. S., Kropfli, R. A., and Frisch, A. S.: The potential of 8-mm radars for remotely sensing cloud drop size distributions, J. Atmos. Ocean. Tech., 14, 76–87, https://doi.org/10.1175/1520-0426(1997)014<0076:TPOMRF>2.0.CO;2, 1997.
Hagihara, Y., Okamoto, H., and Luo Z. J.: Joint analysis of cloud top heights from CloudSat and CALIPSO: New insights into cloud top microphysics, J. Geophys. Res.-Atmos., 119, 4087–4106, https://doi.org/10.1002/2013JD020919, 2014.
Hagihara, Y., Ohno, Y., Horie, H., Roh, W., Satoh, M., Kubota, T., and Oki, R.: Assessments of Doppler velocity errors of EarthCARE cloud profiling radar using global cloud system resolving simulations: Effects of Doppler broadening and folding, IEEE T. Geosci. Remote, 60, 1–9, https://doi.org/10.1109/TGRS.2021.3060828, 2022.
Hagihara, Y., Ohno, Y., Horie, H., Roh, W., Satoh, M., and Kubota, T.: Global evaluation of Doppler velocity errors of EarthCARE cloud-profiling radar using a global storm-resolving simulation, Atmos. Meas. Tech., 16, 3211–3219, https://doi.org/10.5194/amt-16-3211-2023, 2023.
Heymsfield, A. J., Bansemer, A., Matrosov, S., and Tian, L.: The 94-GHz radar dim band: Relevance to ice cloud properties and CloudSat, Geophys. Res. Lett., 35, L03802, https://doi.org/10.1029/2007GL031361, 2008.
Horie, H., Iguchi, T., Hanado, H., Kuroiwa, H., Okamoto, H., and Kumagai, H.: Development of a 95-GHz Airborne Cloud Profiling Radar (SPIDER) – Technical Aspects, IEICE T. Commun., E83-B, 2010–2020, 2000.
Hourdin, F., Mauritsen, T., Gettelman, A., Golaz, J., Balaji, V., Duan, Q., Folini, D., Ji, D., Klocke, D., Qian, Y., Rauser, F., Rio C., Tomassini, L., Watanabe, M., and Williamson, D.: The Art and Science of Climate Model Tuning, B. Am. Meteor. Soc., 98, 589–602, https://doi.org/10.1175/BAMS-D-15-00135.1, 2017.
Houze, R. A.: Cloud Dynamics, Academic Press, San Diego, CA, USA, 573 pp., ISBN-10 0123568803, 1993.
Illingworth, A. J., Barker, H. W., Beljaars, A., Ceccaldi, M., Chepfer, H., Clerbaux, N., Cole, J., Delanoë, J., Domenech, C., Donovan, D. P., Fukuda, S., Hirakata, M., Hogan, R. J., Huenerbein, A., Kollias, P., Kubota, T., Nakajima, T., Nakajima, T. Y., Nishizawa, T., Ohno, Y., Okamoto, H., Oki, R., Sato, K., Satoh, M., Shephard, M. W., Velázquez-Blázquez, A., Wandinger, U., Wehr, T., and van Zadelhoff, G.-J.: The EarthCARE satellite: The next step forward in global measurements of clouds, aerosols, precipitation, and radiation, B. Am. Meteor. Soc., 96, 1311–1332, https://doi.org/10.1175/BAMS-D-12-00227.1, 2015.
Imura, Y., Tomita, E., Nio, T., Okada, K., Maruyama, K., Nakatsuka, H., Tomiyama, N., Aida, Y., Haze, K., Ochiai, S., Konoue, K., Kubota, T., Tanaka, T., Muto, M., Aoki, S., Horie, H., Ohno, Y., and Sato, K.: EarthCARE/CPR current conditions and preliminary results from scientific views, Remote Sensing of the Atmosphere, Clouds, and Precipitation VIII, 13262, SPIE, https://doi.org/10.1117/12.3045833, 2025a.
Imura, Y., Aoki, S., Kubota, T., and Nakatsuka, H.: Doppler Velocity Measured by the World's First Spaceborne Doppler Radar: Evaluations of Observation Modes in EarthCARE/CPR, IGARSS 2025–2025 IEEE International Geoscience and Remote Sensing Symposium, Brisbane, Australia, 1528–1531, https://doi.org/10.1109/IGARSS55030.2025.11244044, 2025b.
Iwasaki, S., Shibata, T., Nakamoto, J., Okamoto, H., Ishimoto, H., and Kubota, H.: Characteristics of deep convection measured by using the A-train constellation, J. Geophys. Res., 115, D06207, https://doi.org/10.1029/2009JD013000, 2010.
JAXA: EarthCARE/CPR L1B CPR one-sensor Received Echo Power Products and Doppler Product, JAXA Official DOI Landing Pages for the Earth Observation Data [data set], https://doi.org/10.57746/EO.01jdvcydwjf63vpdbjp0vz6v64, 2024a.
JAXA: EarthCARE/CPR L2a CPR one-sensor Echo Product, JAXA Official DOI Landing Pages for the Earth Observation Data [data set], https://doi.org/10.57746/EO.01jdvd0xm10ema4rxwbpcd0dn1, 2024b.
JAXA: EarthCARE/CPR L2a CPR one-sensor Cloud Products, JAXA Official DOI Landing Pages for the Earth Observation Data [data set], https://doi.org/10.57746/EO.01jdvd2gqq34e6yz9p8kfe68x5, 2024c.
JAXA: EarthCARE/ATLID L2a ATLID one-sensor Cloud Aerosol Products, JAXA Official DOI Landing Pages for the Earth Observation Data [data set], https://doi.org/10.57746/EO.01jkwjk45jrx9frz6c11x4rs8e, 2024d.
JAXA: EarthCARE JAXA Level-2 Algorithm Theoretical Basis Document, [data set], https://www.eorc.jaxa.jp/EARTHCARE/document/JAXAL2ProductList/ATBD/EarthCARE_JAXA_L2_ATBD_verN_Dec2025.pdf (last access: 16 March 2026), 2025.
Kobayashi, S., Kumagai, H., and Kuroiwa, H.: A proposal of pulse-pair operation on a spaceborne cloud-profiling radar in the W band, J. Atmos. Ocean. Tech., 19, 1294–1306, https://doi.org/10.1175/1520-0426(2002)019<1294:APOPPD>2.0.CO;2 2002.
Kobayashi, S., Kumagai, H., and Iguchi, T.: Accuracy Evaluation of Doppler Velocity on a Spaceborne Weather Radar through a Random Signal Simulation, J. Atmos. Ocean. Tech., 20, 944–949, https://doi.org/10.1175/1520-0426(2003)020<0944:AEODVO>2.0.CO;2, 2003.
Kollias, P., Tanelli, S., Battaglia, A., and Tatarevic, A.: Evaluation of EarthCARE Cloud Profiling Radar Doppler Velocity Measurements in Particle Sedimentation Regimes, J. Atmos. Ocean. Tech., 31, 366–386, https://doi.org/10.1175/JTECH-D-11-00202.1, 2014.
Kollias, P., Puidgomènech Treserras, B., Battaglia, A., Borque, P. C., and Tatarevic, A.: Processing reflectivity and Doppler velocity from EarthCARE's cloud-profiling radar: the C-FMR, C-CD and C-APC products, Atmos. Meas. Tech., 16, 1901–1914, https://doi.org/10.5194/amt-16-1901-2023, 2023.
Lamer, K., Tatarevic, A., Jo, I., and Kollias, P.: Evaluation of gridded scanning ARM cloud radar reflectivity observations and vertical doppler velocity retrievals, Atmos. Meas. Tech., 7, 1089–1103, https://doi.org/10.5194/amt-7-1089-2014, 2014.
Li, J. and Nakamura, K.: Characteristics of the Mirror Image of Precipitation Observed by the TRMM Precipitation Radar, J. Atmos. Ocean. Tech., 19, 145–158, https://doi.org/10.1175/1520-0426(2002)019, 2002.
Mech, M., Orlandi, E., Crewell, S., Ament, F., Hirsch, L., Hagen, M., Peters, G., and Stevens, B.: HAMP – the microwave package on the High Altitude and LOng range research aircraft (HALO), Atmos. Meas. Tech., 7, 4539–4553, https://doi.org/10.5194/amt-7-4539-2014, 2014.
Meneghini, R. and Atlas, D.: Simultaneous Ocean Cross Section and Rainfall Measurements from Space with a Nadir-Looking Radar, J. Atmos. Ocean. Tech., 3, 400–413, https://doi.org/10.1175/1520-0426(1986)003<0400:SOCSAR>2.0.CO;2, 1986.
Mitchell, D. L. and Heymsfield A. J.: Refinements in the Treatment of Ice Particle Terminal Velocities, Highlighting Aggregates, J. Atmos. Sci., 1637–1644, 62, https://doi.org/10.1175/JAS3413.1, 2005.
Nishizawa, T., Kudo, R., Oikawa, E., Higurashi, A., Jin, Y., Sugimoto, N., Sato, K., and Okamoto, H.: Algorithms to retrieve aerosol optical properties using lidar measurements on board the EarthCARE satellite, Atmos. Meas. Tech., 19, 729–744, https://doi.org/10.5194/amt-19-729-2026, 2026.
Okamoto, H., Iwasaki, S., Yasui, M., Horie, H., Kuroiwa, H., and Kumagai, H.: An algorithm for retrieval of cloud microphysics using 95-GHz cloud radar and lidar, J. Geophys. Res., 108, 4226, https://doi.org/10.1029/2001JD001225, 2003.
Protat, A. and Williams R. C.: The Accuracy of Radar Estimates of Ice Terminal Fall Speed from Vertically Pointing Doppler Radar Measurements, J. Appl. Meteorol. Clim., 50, 2120–2138, https://doi.org/10.1175/JAMC-D-10-05031.1, 2011.
Puigdomènech Treserras, B., Kollias, P., Battaglia, A., Tanelli, S., and Nakatsuka, H.: EarthCARE's cloud profiling radar antenna pointing correction using surface Doppler measurements, Atmos. Meas. Tech., 18, 5607–5618, https://doi.org/10.5194/amt-18-5607-2025, 2025.
Radenz, M., Bühl, J., Lehmann, V., Görsdorf, U., and Leinweber, R.: Combining cloud radar and radar wind profiler for a value added estimate of vertical air motion and particle terminal velocity within clouds, Atmos. Meas. Tech., 11, 5925–5940, https://doi.org/10.5194/amt-11-5925-2018, 2018.
Ruzanski, E., Hubbert, C. J., and Chandrasekar, V.: Evaluation of the Simultaneous Multiple Pulse Repetition Frequency Algorithm for Weather Radar, J. Atmos. Ocean. Tech., 25, 1166–1181, https://doi.org/10.1175/2007JTECHA1042.1, 2008.
Sato, K., Okamoto, H., Yamamoto, K. M., Fukao, S., Kumagai, H., Ohno, Y., Horie, H., and Abo, M.: 95-GHz Doppler radar and lidar synergy for simultaneous ice microphysics and in-cloud vertical air motion retrieval, J. Geophys. Res.-Atmos., 114, D03203-1–D03203-17, https://doi.org/10.1029/2008JD010222, 2009.
Sato, K., Okamoto, H., Takemura, T., Kumagai, H., and Sugimoto, N.: Characterization of ice cloud properties obtained by shipborne radar/lidar over the tropical western Pacific Ocean for evaluation of an atmospheric general circulation model, J. Geophys. Res., 115, D15203, https://doi.org/10.1029/2009JD012944, 2010.
Sato, K., Okamoto, H., Nishizawa, T., Jin, Y., Nakajima, T. Y., Wang, M., Satoh, M., Roh, W., Ishimoto, H., and Kudo, R.: JAXA Level 2 cloud and precipitation microphysics retrievals based on EarthCARE radar, lidar, and imager: the CPR_CLP, AC_CLP, and ACM_CLP products, Atmos. Meas. Tech., 18, 1325–1338, https://doi.org/10.5194/amt-18-1325-2025, 2025.
Shupe, M. D., Kollias, P., Matrosov, S. Y., and Schneider, T. L.: Deriving mixed-phase cloud properties from Doppler radar spectra, J. Atmos. Ocean. Tech., 25, 556–573, https://doi.org/10.1175/2007JTECHA1007.1, 2008
Takahashi, H. and Luo, Z. J.: Characterizing tropical overshooting deep convection from joint analysis of CloudSat and geostationary satellite observations, J. Geophys. Res.-Atmos., 119, 112–121, https://doi.org/10.1002/2013JD020972, 2014.
Takahashi, H., Luo Z. J., and Stephens, G. L.: Level of neutral buoyancy, deep convective outflow, and convective core: New perspectives based on 5 years of CloudSat data, J. Geophys. Res.-Atmos., 122, 2958–2969, https://doi.org/10.1002/2016JD025969, 2017.
Tanelli, S., Im, E., Kobayashi, S., Mascelloni, R., and Facheris, L.: Spaceborne Doppler radar measurements of rainfall: Correction of errors induced by pointing uncertainties, J. Atmos. Ocean. Tech., 22, 1676–1690, 2005.
Tao, W.-K., Iguchi, T., Lang, S., Li, X., Mohr, K., Matsui, T., van den Heever, S. C., and Braun, S.: Relating Vertical Velocity and Cloud/Precipitation Properties: A Numerical Cloud Ensemble Modeling Study of Tropical Convection, J. Adv. Model. Earth Sy., 14, e2021MS002677, https://doi.org/10.1029/2021MS002677, 2022.
von Terzi, L., Dias Neto, J., Ori, D., Myagkov, A., and Kneifel, S.: Ice microphysical processes in the dendritic growth layer: a statistical analysis combining multi-frequency and polarimetric Doppler cloud radar observations, Atmos. Chem. Phys., 22, 11795–11821, https://doi.org/10.5194/acp-22-11795-2022, 2022.
Wehr, T., Kubota, T., Tzeremes, G., Wallace, K., Nakatsuka, H., Ohno, Y., Koopman, R., Rusli, S., Kikuchi, M., Eisinger, M., Tanaka, T., Taga, M., Deghaye, P., Tomita, E., and Bernaerts, D.: The EarthCARE mission – science and system overview, Atmos. Meas. Tech., 16, 3581–3608, https://doi.org/10.5194/amt-16-3581-2023, 2023.
Xu, Z., Kollias, P., Sasikumar, S., Battaglia, A., Puigdomènech Treserras, B., and McLinden, M. L. W.: EarthCARE Cloud Profiling Radar observations of the vertical structure of marine stratocumulus clouds, Atmos. Chem. Phys., 26, 4619–4632, https://doi.org/10.5194/acp-26-4619-2026, 2026.