
the Creative Commons Attribution 4.0 License.
the Creative Commons Attribution 4.0 License.
 | 08 Sep 2026
Long-term open-path dual-comb spectroscopy for urban CO2 monitoring
Tobias D. Schmitt

Romain Dubroeucq
Moritz Sindram
André Butz
Thomas Pfeifer
Markus K. Oberthaler
Accurate quantification of urban greenhouse gas (GHG) emissions can benefit from path-averaged, high-precision, high-temporal-resolution measurements that complement point sensors and passive remote sensing. Among open-path techniques, dual-comb spectroscopy (DCS) stands out as a particularly capable candidate, offering simultaneous broadband coverage, an absolute SI-traceable frequency axis, and sufficient spectral radiance for multi-kilometer paths. Here we present an open-path dual-comb spectrometer using two commercial, self-referenced, turn-key frequency combs operated continuously in Heidelberg, Germany, over an urban landscape. The instrument allows to infer column-averaged dry-air mole fractions of CO2 along a 3.1 km absorption path. Within the evaluation period from September 2025 to February 2026 the system achieved a data coverage of 76 %, with losses primarily attributable to visibility-limiting weather conditions such as fog and heavy rain. The instrument precision, characterized by the overlapping Allan deviation under stable atmospheric conditions, reaches 6.13 ppm for CO2, equivalent to 0.35 ppm at 5 min averaging time. These values are on par with or better than previous open-path DCS experiments and represent roughly one order of magnitude improvement over a co-deployed open-path Fourier transform spectrometer operating on the same path. The two instruments differ by a small bias of 0.50 ppm for CO2. These results demonstrate that commercial frequency-comb technology has matured enough to turn open-path DCS into an accessible tool for the broader atmospheric science community, without sacrificing performance: built exclusively from commercially available components, our instrument remains fully competitive with custom-built dual-comb spectrometers. This establishes a foundation for distributed path-averaged observations, from urban emission monitoring and network-scale deployments to the validation of spectroscopic databases.
- Article
(1058 KB) - Full-text XML
-
Supplement
(1388 KB) - BibTeX
- EndNote


Carbon dioxide emissions from urban areas account for up to 70 % of the global total, making urban emissions critical to climate change mitigation. Yet the urban emission landscape is inherently heterogeneous (Park et al., 2022; Hong et al., 2023), inducing large inventory uncertainties that typically increase with finer spatial and temporal resolutions (Gately and Hutyra, 2017; Oda et al., 2019; Super et al., 2020; Gurney et al., 2021). This heterogeneity also drives large spatial and temporal variability in urban CO2 concentration fields (Zhu et al., 2022; Estruch et al., 2024; Mitchell et al., 2018). Atmospheric concentration measurements can verify and improve emission inventories from a top-down perspective (Lauvaux et al., 2020; Mueller et al., 2021). However, the heterogeneity poses a significant challenge to models and measurements, which must either resolve or correctly average the induced variability, while being sensitive to urban emissions.
Point sensors provide local atmospheric CO2 records but suffer from representativeness biases at urban scales due to spatial heterogeneity (e.g., Kaminski et al., 2001). Vertical column measurements from satellites and ground-based sun-viewing spectrometers lack sensitivity to local urban emissions and suffer from limited temporal coverage due to weather conditions and daytime-only availability. In contrast, open-path measurements that average over kilometer-scale horizontal paths provide representativeness at typical model grid scales while maintaining sufficient sensitivity to detect urban emissions. Open-path techniques may also serve as calibration references for emerging dense low-cost sensor networks (e.g., Shusterman et al., 2016; Kim et al., 2025; Asimow et al., 2025; Patel et al., 2026).
The core difficulty of open-path CO2 measurements lies in detecting small relative signals (∼1 ppm enhancements against ∼420 ppm background abundance). In the near-infrared, this difficulty is compounded by intrinsically weak absorption. This combination of small relative signal and weak absorption demands spectrometers with high signal-to-noise ratio. Multiple technological approaches have been explored for kilometer-scale open-path CO2 measurements. Early techniques adapted differential optical absorption spectroscopy (DOAS), originally developed in the visible and ultraviolet, to the near-infrared using grating spectrometers paired with thermal light sources (e.g., Saito et al., 2015). Open-path Fourier transform infrared (FTIR) spectrometers later improved upon this approach, achieving broader spectral coverage and enabling simultaneous retrieval of multiple species (Griffith et al., 2018; Deutscher et al., 2021; Schmitt et al., 2023). Both approaches, however, are fundamentally constrained by the limited spectral radiance of thermal sources, which severely restricts achievable signal-to-noise ratio. Consequently, both typically suffer from limited precision, achieving only a few ppm on minute timescales, although under optimized instrumental configurations and near-ideal conditions, precision of sub-ppm levels has been demonstrated (Deutscher et al., 2021). Replacing the thermal source with a super-continuum source (a free running frequency comb) yields higher spectral radiance, but at the price of much higher source noise. Custom built Fourier transform spectrometer using balanced detection (Krebbers et al., 2024) can address this problem, but have only demonstrated open-path operations below 100 m to this date (Krebbers et al., 2025). Finally, the limited spectral resolution of these techniques introduces accuracy problems due to instrument line shape effects.
Laser-based approaches can overcome these limitations and achieve high sensitivity and high spectral resolution at the same time. The simplest laser-based approach uses on-band-off-band measurements, meaning two fixed-wavelength lasers with one tuned to a CO2 absorption line and one offset. It was the first method deployed at scale for urban emissions inference (Dobler et al., 2013, 2017; Lian et al., 2019). However, this approach suffers from temperature-dependent biases of tens of ppm, especially when the lasers are not actively stabilized to the absorption feature (Zaccheo et al., 2019).
Tunable diode laser absorption spectrometers (TDLAS) improve upon this approach by measuring across full absorption features, enhancing stability to changes in environmental conditions. Nevertheless, TDLAS faces fundamental limitations: temperature-concentration degeneracy and insufficient spectral information to resolve interfering species complicate the retrieval of unambiguous CO2 column amounts (Plant et al., 2015; Bailey et al., 2017). Broad spectral coverage spanning multiple ro-vibrational bands is required to resolve these limitations and simultaneously measure multiple interfering species.
Dual-comb spectroscopy (DCS, e.g., Coddington et al., 2016; Picqué and Hänsch, 2019) is a natural candidate for filling this role (Cossel et al., 2021). It offers simultaneous broadband spectral coverage enabling multi-species detection in a single measurement; an absolute, SI-traceable frequency axis that requires no wavelength calibration and provides direct spectroscopic accuracy; and high spatial coherence that maintains adequate signal-to-noise ratios over multi-kilometer paths even with µW-level return signals. The first open-path DCS demonstration for atmospheric GHG sensing was reported by Rieker et al. (2014), followed by a quantitative intercomparison (Waxman et al., 2017) and the first applications to emission quantification in urban (Waxman et al., 2019) and agricultural (Herman et al., 2021) settings. Giorgetta et al. (2021) and Mead et al. (2023) demonstrated open-path DCS operation in the mid infrared. Most recently, a DCS open-path system was deployed near the background station at Mauna Loa Observatory in an attempt to verify cross-section databases, leveraging the superior accuracy DCS can achieve relative to other open-path methods (Malarich et al., 2025). These km-scale open-path field deployments were pioneered predominantly by NIST, Boulder, Colorado, and collaborating institutions, drawing on their deep expertise in custom frequency-comb development.
Building on this foundation, open-path DCS was commercialized for methane detection in oil and gas infrastructure (Coburn et al., 2018; Alden et al., 2019, 2020), with systems deployed for continuous monitoring. However, these commercial deployments remain focused on a single analyte (methane) and a specialized application domain, and the technology has remained within the expertise ecosystem of its original developers.
In parallel, different extensions to the concept were demonstrated: drone based reflectors (Cossel et al., 2017, 2023) as well as extending open-path DCS sensing into the visible (Eber et al., 2024) and into the mid-infrared domain (Westberg et al., 2023). Further, Han et al. (2024) demonstrated DCS operation over distances exceeding 100 km. While many of these DCS deployments were based on custom-built hardware and operation required a high level of metrology expertise, the recent maturation of commercial, self-referenced, turn-key frequency comb systems (e.g., Quatrevalet et al., 2025) and the here reported results take DCS usage closer to routine use within the atmospheric measurement community.
Here we present an open-path dual-comb spectrometer using commercial, turn-key, self-referenced combs, operating over a 3.1 km urban path in Heidelberg, Germany. The system measures column-averaged dry-air mole fractions of CO2 (XCO2) continuously. We validate its performance through comparison with a co-located FTIR that operates along the same light path (Schmitt et al., 2023). The remainder of this paper is structured as follows: Sect. 2 describes the experimental setup; Sect. 3 details the data evaluation and spectral retrieval; Sect. 4 presents results and validation.
Two frequency combs (SmartCombs from MenloSystems) with a comb mode spacing of 100 MHz (100 MHz–50 Hz for the second comb) and a central wavelength of about 1560 nm at a full-width-half-maximum of 30 nm (45 nm for the second comb) form the core of the spectrometer. The lasers provide five outputs at 5 mW each, and one output which is amplified and then broadened in a highly nonlinear fiber (HNLF), with a total output power up to 100 mW and a spectral coverage spanning up to an octave from 1 to 2 µm. Further, the lasers are self-referenced, turn-key systems, which provide a radio-frequency-lock of the repetition rate frep and offset frequency fceo to either an internal or external 10 MHz reference out of the box. Both combs are then referenced to an external 10 MHz Rubidium clock (FE-5680A, FEI Communications). Locking the repetition rate of each comb to a common external optical reference improves the mutual coherence of the two combs. To this end, our combs are also configured with a beat detection unit (BDU) at 1542.14 nm, which accepts an optical reference at the correct wavelength via a fiber port. Our external reference laser is a continuous-wave narrow-linewidth (<100 Hz) distributed-feedback laser from NKT Photonics (Koheras Basik X15). The internal frequency counter of the frequency combs measures the fceo and frep frequencies, as well as the beat-note to the reference laser in 1s intervals. This enables the reconstruction of the frequency axis with respect to the Rubidium clock.
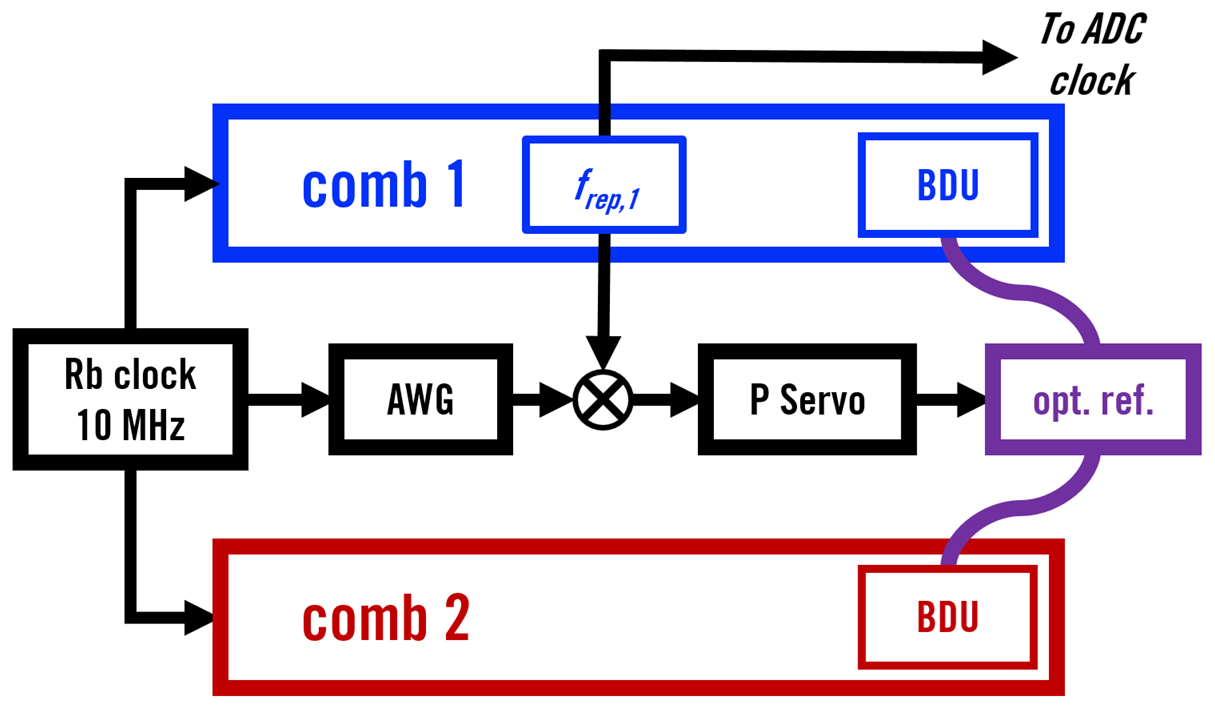
Figure 1Locking scheme of the dual comb setup. The blue and red boxes indicate the SmartCombs and their internal modules. Black lines are electronic connections, colored lines optical fibers. The carrier-envelope offset (CEO) of each comb is radio-frequency locked to a mutual 10 MHz frequency standard, provided by a Rubidium clock. The repetition rates are locked to an optical reference (opt. ref.) at 1542.14 nm, via a beat detection unit (BDU) within the comb package. To compensate for long term drifts the repetition rate of comb 1 is locked to exactly 100 MHz by slowly acting on the optical reference.
Figure 1 shows the complete locking scheme, with the two frequency combs indicated by the blue and red boxes. Both combs are referenced to the Rubidium clock and locked to the external optical reference via their BDU. The offset frequencies of both combs are stabilized to the 10 MHz reference. The integrated single-sideband phase noise (100 Hz–2 MHz) amounts to 70 and 76 mrad for the two carrier-envelope offset (CEO) locks and 41 mrad for each optical beat lock. Since the detection band lies close to the mutual optical reference, the CEO contribution is suppressed to the few-mrad level, and the mutual phase noise of the comb pair is dominated by the two uncorrelated beat-lock residuals, .
A bootstrapped approach is used to further stabilize the system (e.g., Truong et al., 2016): the first comb's frep is actively locked to exactly 100 MHz through feedback on the optical reference. The lock error signal is generated by mixing frep with a reference signal from an arbitrary waveform generator (AWG, Siglent SDG6022X), referenced to the 10 MHz clock. The mixer output is low-pass filtered and fed to a digital servo controller (DSC1, Thorlabs) with proportional-only gain, whose output drives the frequency control of the optical reference. This feedback loop, combined with the internal integration in the reference laser module, stabilizes both the optical reference and the locked repetition rates over extended timescales, eliminating long term drifts and allowing averaging times of minutes or longer.
We employ a DCS scheme where we overlap the two frequency combs HNLF outputs in free-space using a wedged 50:50 non-polarizing beam-splitter (BSW18, Thorlabs), before we transmit the light through the atmosphere. The beam-splitter may be replaced by a 2×2 50:50 fiber coupler (PN1550R5A2, Thorlabs) for a more compact setup, but at the cost of a narrower spectral bandwidth. Either fiber or free-space coupler induce a 3 dB loss on the input power, due to the use of a non-polarizing beam-splitter. Currently we use the second output of the beam-splitter to monitor the spectral envelope with a grating spectrometer (waveScan Extended IR spectrometer, APE), but in principle it can supply a second light path to the open-path system.
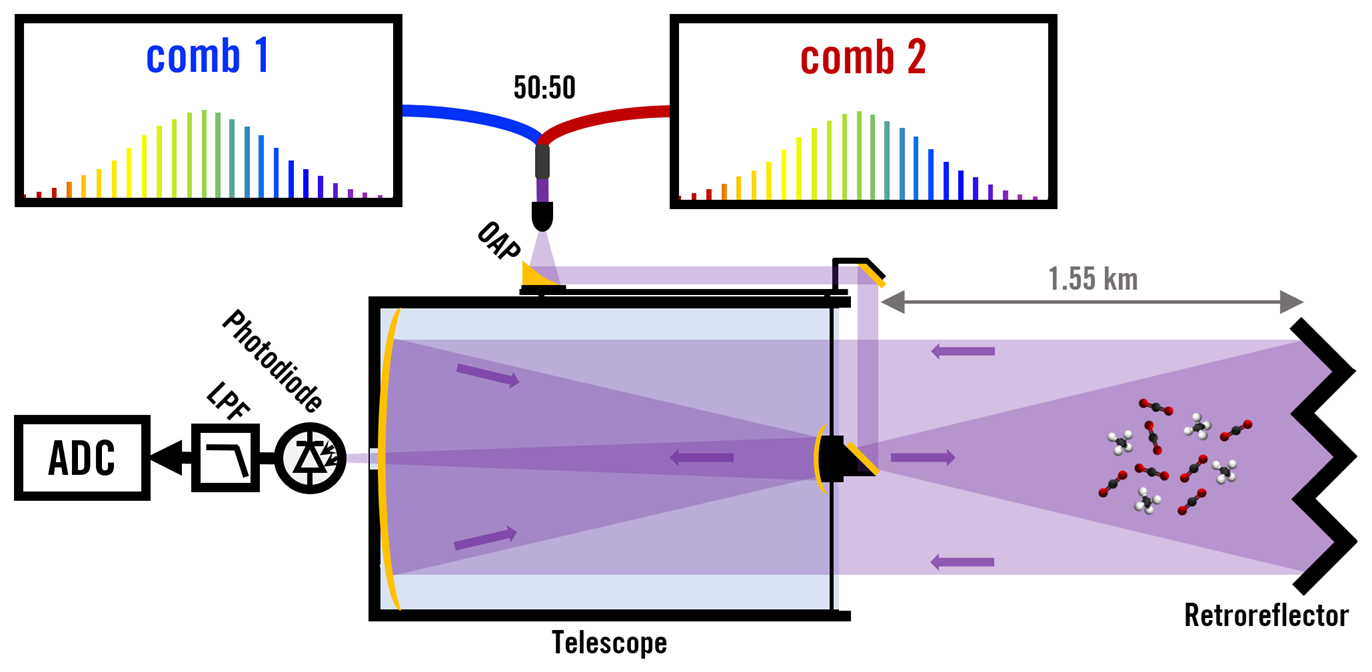
Figure 2Open path DCS setup. After mixing the light of the two frequency combs, it is launched as a collimated beam to an array of retro reflectors. A larger, co-aligned telescope collects the return light (which is expanded to a larger diameter by divergence and atmospheric turbulence) and images it on a detector. The electrical signal is filtered, digitized, averaged and transmitted to a PC for long term averaging and further analysis. OAP, off-axis parabolic mirror; LPF, low-pass filter, ADC, analog-to-digital converter.
Figure 2 sketches the transceiver setup for the atmospheric open-path measurements: The employed design consists of a smaller transmitting telescope concentric within a larger receiving telescope. The transmitting telescope does not cause additional obstruction of the return light, since it is smaller than the secondary mirror of the receiving telescope (GSO 8′′ Ritchey-Chretien Pro mm, TS-Optics). The main optic of the transmitting telescope is a 50.8 mm off-axis parabolic mirror with a focal length of 190.5 mm, which is mounted on top of the tube of the receiving telescope to form a compact package. The receiving telescope images directly onto the detector (PDA05CF2, Thorlabs). This transceiver telescope package accepts a fiber input of the already mixed dual-comb light and outputs the electronic signal from the detector. We initially tested telescope designs using a shared main mirror with a beam-splitter to separate transmit and receive paths. This design suffered from additional etalons and multi-reflections in the beam-splitter, resulting in substantial signal contamination from light that never traveled the atmospheric path. This is consistent with the observations by Waxman et al. (2017). The transceiver is located within a lab environment, which is temperature stabilized on the level of about 2 K and we are currently not using any active alignment to the reflector array.
The reflector array is currently the same as in Schmitt et al. (2023) and consists of solid glass cube-corners relying on total internal reflection. Their reflectivity is in the range of 70 % at 1.6 µm and the array has a geometric loss of roughly 50 % due to the spacing and housing of the circular reflector modules. In total we receive on average about 55 µW of the 7.2 mW launched by the telescope, putting the total system transmission at 0.8 %. This is comparable to the results by Waxman et al. (2017).
The electronic signal is low-pass filtered (SLP-44+, Mini-Circuits) to ensure it stays below our Nyquist limit of 50 MHz, and attenuated (−3 dB) to reliably match the dynamic range of our analog-to-digital converter (ADC). We digitize the signal using a RedPitaya board (SDRlab 122-16 External Clock, RedPitaya), which includes an onboard ADC and an input for an external clock. We provide a 100 MHz clock signal, which we derive from the first frequency comb's frep, to ensure synchronized sampling. In a first step we acquire 1 s of data with deep memory acquisition directly into the RAM of the RedPitaya, using the available high level Python API. Next, we locate the individual interferograms (IFGs) and add them up, overlapping and centering them at the maximum point of the IFG.
This simple averaging algorithm is enabled by the high mutual coherence of the two combs together with the fact that both CEO frequencies are locked to the same value. The relative phase between carrier and envelope is the same for consecutive interferograms and the carrier position remains fixed with respect to the envelope, independently of the exact value of Δfrep. Centering on the interferogram maximum therefore also acts as a first-order carrier-phase correction. The accuracy of this correction is limited by the sampling interval, since the shift is applied in whole samples. With about 13 samples per carrier period, one sample corresponds to of carrier phase. As the length of the interferogram does not correspond to an exact integer number of samples, the position of the centre burst within a sampling interval varies between interferograms. Conservatively assuming a uniform distribution for the exact interferogram peak within the sampling interval yields an RMS residual phase error of . Added in quadrature with the mutual phase noise of the comb pair, this gives about 150 mrad, corresponding to a modulation efficiency of approximately 99 %. This is a marginal loss and an order of magnitude below the phase error of about 1.4 rad at which the fringe contrast would drop to , the commonly quoted coherence limit.
After averaging these 1 s intervals on the RedPitaya, we transfer the averaged IFG via an ethernet connection to a PC, where we average them further to match the desired time resolution. The whole process of acquiring the 1 s of data, averaging it and sending it to the PC takes about 4.2 s. As a result our duty cycle is around 24 %, i.e. a factor of in SNR. In the future, the implementation of real-time averaging at the hardware level will allow us to recover this factor (e.g., Roy et al., 2012; Eber et al., 2025).
Finally, we also collect auxiliary data, which we need to process the measured spectra. For temperature measurements, we use either the information provided by a local meteorological weather station or auxiliary output from our pressure sensor. The exact source is not critical, since the path-averaged temperature is fitted in the retrieval (see Sect. 3 for details) and only requires a reasonable first guess. The most relevant environmental parameter is pressure, since it impacts the later retrieved mole fractions linearly. While we can fit pressure from our spectra (approximately 2.6 hPa precision in 1 min measurements), measuring pressure allows us to essentially remove the pressure measurement precision from the equation, since it is two orders of magnitudes lower than retrieving it, and, unlike temperature, it should not experience relevant horizontal gradients on the km scale. For this, we are using a PTB330-A sensor (from Vaisala), which is accurate to ∼0.1 hPa, and corrected for average path height above the sensor (4.5 m).
After receiving the frequency combs in mid-September 2024, the system is operational in the presented configuration since early August 2025. After running multiple tests in August and improving our data storage strategy, we acquired the dataset shown in this work, starting 2 September 2025. Table 1 gives a full list of the above mentioned equipment making up our open-path DCS observatory.
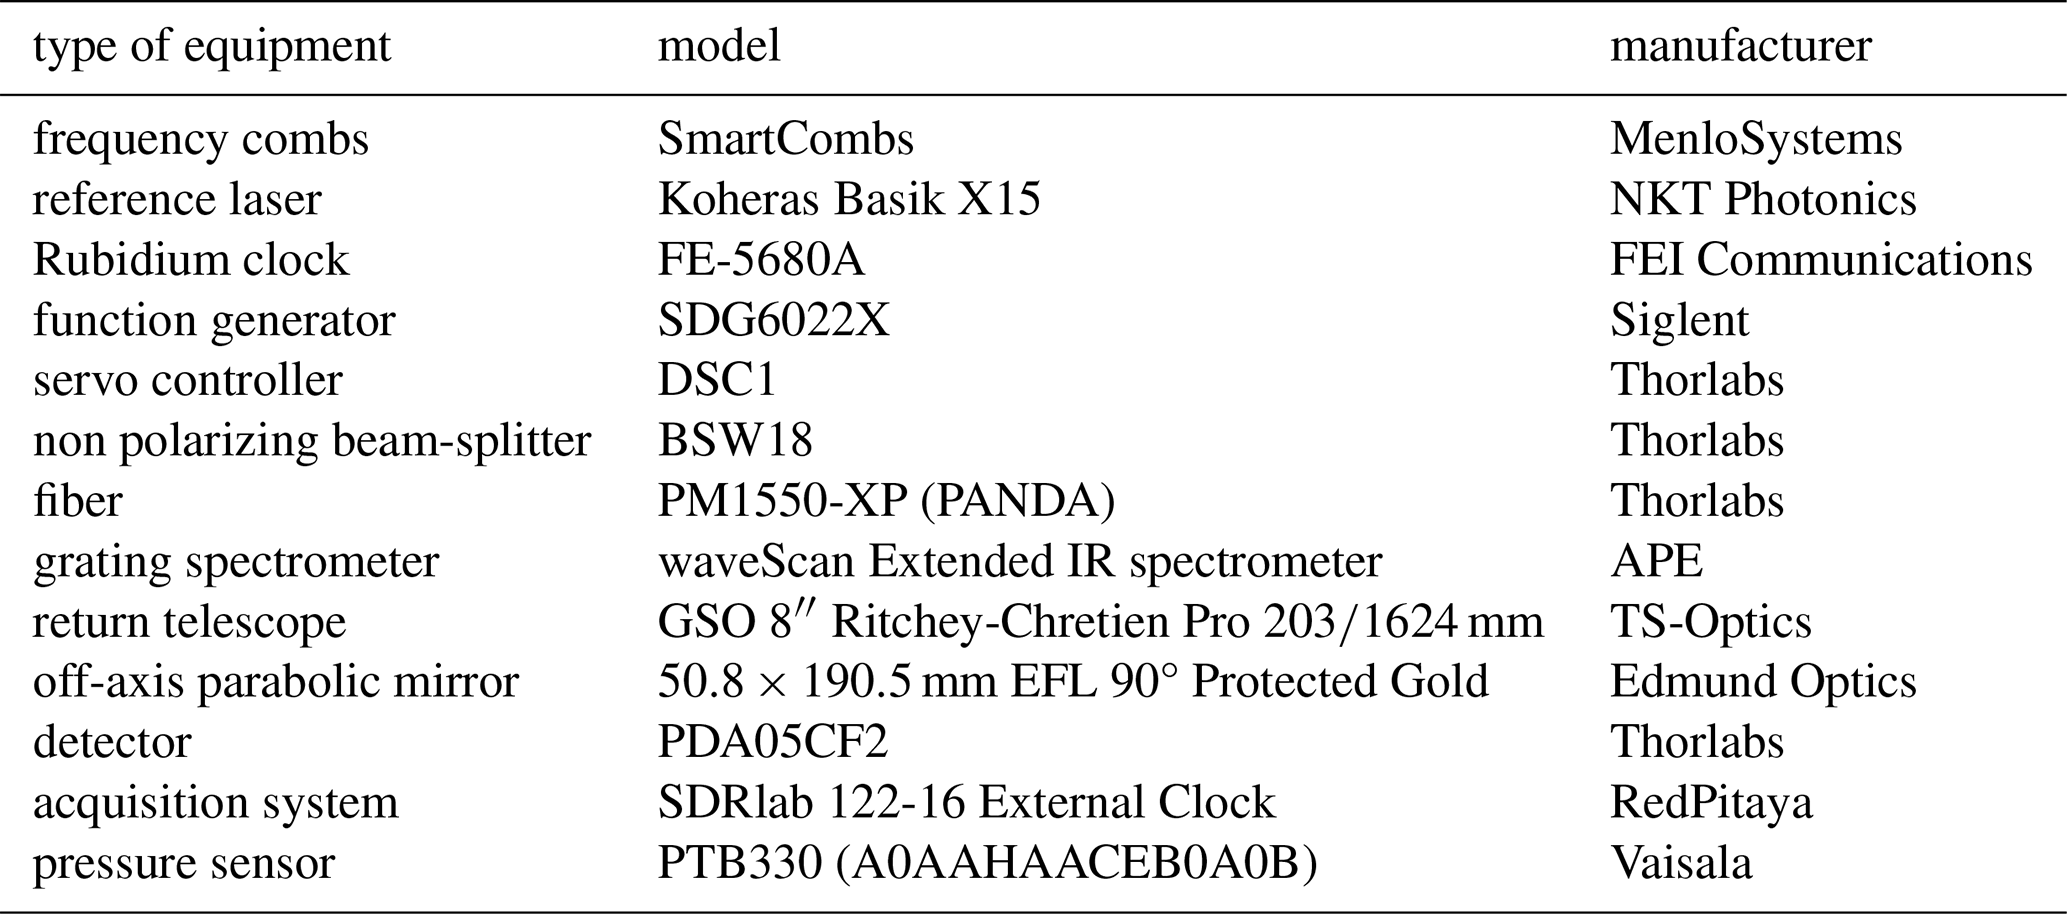
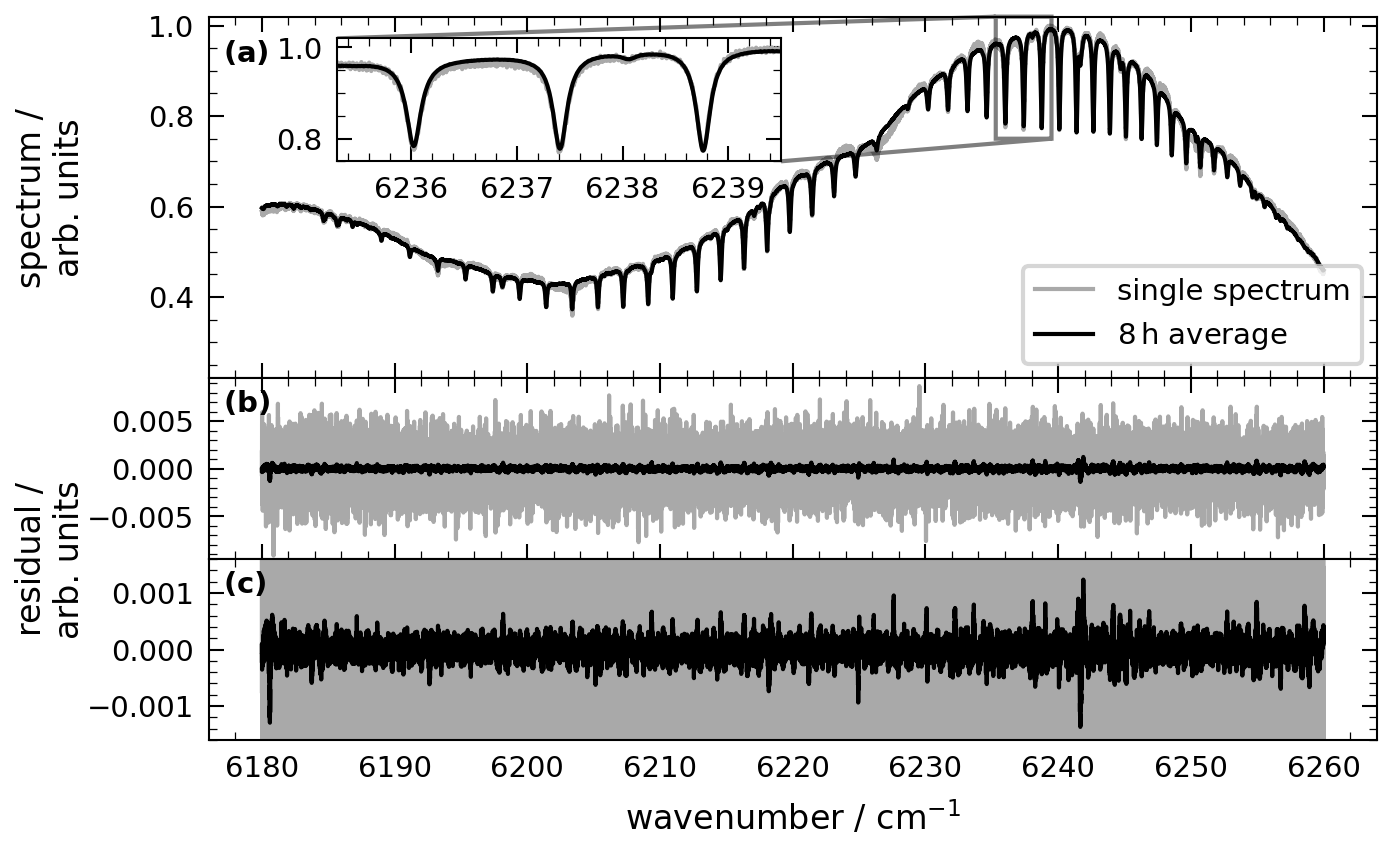
Figure 3Panel (a): Single spectrum (1 min acquisition time) in comparison to 8 h average, along the open path of 3106 m total length. Inset shows a zoom into three CO2 absorption lines. Panels (b) and (c): fit residuals, with different levels of zoom. Spectral sampling of . The single spectrum was measured on 30 October 2025, 14:27 UTC. The average was acquired on 30 October 2025, from 08:30 to 16:30 UTC.
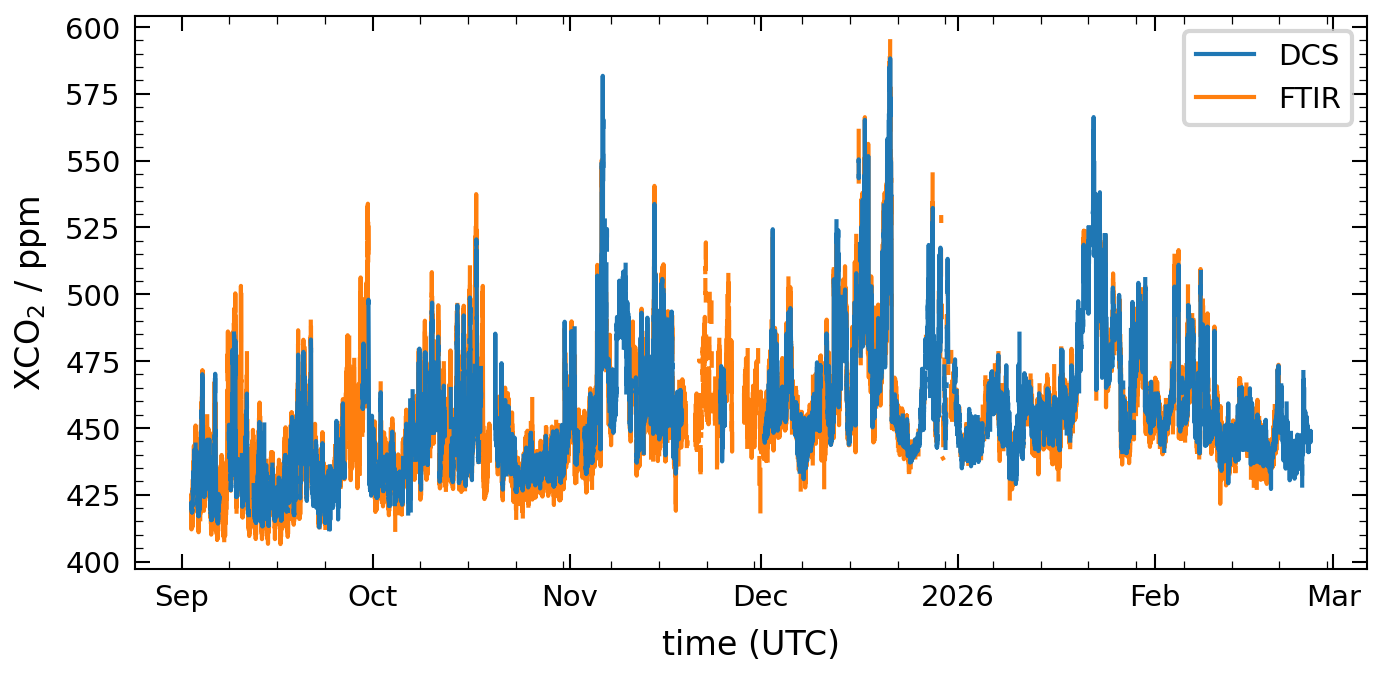
Figure 4Timeseries of XCO2 for the DCS instrument (this work) and a co-deployed FTIR instrument (Schmitt et al., 2023) for the full reported period. Time resolution of 5 min.
To retrieve trace gas information from the measurements, we Fourier transform the IFGs and reconstruct the optical frequency axis from recorded comb parameters. The result is a spectrum as depicted in Fig. 3. We fit the baseline using a cepstral approach (Cole et al., 2019), implemented similar to Malarich et al. (2025). In each optimization step, we treat the residual of all times below 38 ps, which also includes the main etalon of the lab window, as contribution of the baseline. We further include narrow regions from 793 to 800 ps, 880 to 895 ps, and 899 to 906 ps in this baseline treatment, since these regions contain spurious noise which likely results from the lasers themselves. Otherwise, the spectral fit contains only Beer-Lambert's law and is derived from the algorithm described in Schmitt et al. (2023), but adapted and improved for higher spectral resolution and faster runtime.
We follow the recent HITRAN recommendation for CO2 remote sensing applications (Gordon et al., 2026, p. 12) and use the results from Birk et al. (2024a) (dataset: Birk et al., 2024b), which include pressure depletion and continuum absorption, as well as water-vapor broadening, all from the same set of measurements. Their published pre-computed absorption-cross-section database (Birk et al., 2025) also contains information on interfering H2O lines. We use a modified version of this data product on a different temperature and pressure grid, to better fit our parameter space of lower troposphere conditions, which we received through private communications. We use the HITRAN standard mixture of isotopologues for CO2 and H2O. For the evaluation of the FTIR measurements, we used the same cross-section information, where available and defaulted to HITRAN2024 for the 2 µm band of CO2. For the O2 delta band at 1.35 µm, we used HITRAN2020 (Gordon et al., 2022), including collision induced absorption (Karman et al., 2019). In these cases we processed the line-by-line data using the HITRAN Application Programming Interface (HAPI, Kochanov et al., 2016). We operated the FTIR at an optical path difference of 4.5 cm, resulting in a resolution of about 0.2 cm−1.
We fit individual spectra averaged over a duration of 1 min, using pressure information on one end of the path and correcting it for the average height of the path above the sensor position (4.5 m). We use locally measured temperature as an initial guess, but fit a path averaged temperature from the spectrum (precision of approximately 0.5 K for an averaging time of 1 min). We evaluate the spectrum from 6180 to 6260 cm−1 (Fig. 3a), where we have a strong CO2 absorption signal and CO2 is the main absorber. Finally, we convert the fitted total absorber columns to dry-air mole-fractions by using the measured pressure, the fitted path-averaged temperature, and the fitted water column to calculate the dry-air column.
The residuals are dominated by statistical noise for averaging times of 1 min, as Fig. 3b illustrates. The noise level is typically below 1 % of the maximal signal intensity and mostly independent of the signal strength. This is expected from a system mostly limited by detector-noise. Averaging consecutive residuals over 8 h reveals a systematic residual (Fig. 3c). It is still partially defined by random noise together with a few clear line residuals, e.g., the strongest one at 6241.7 cm−1, which we could attribute to water lines.
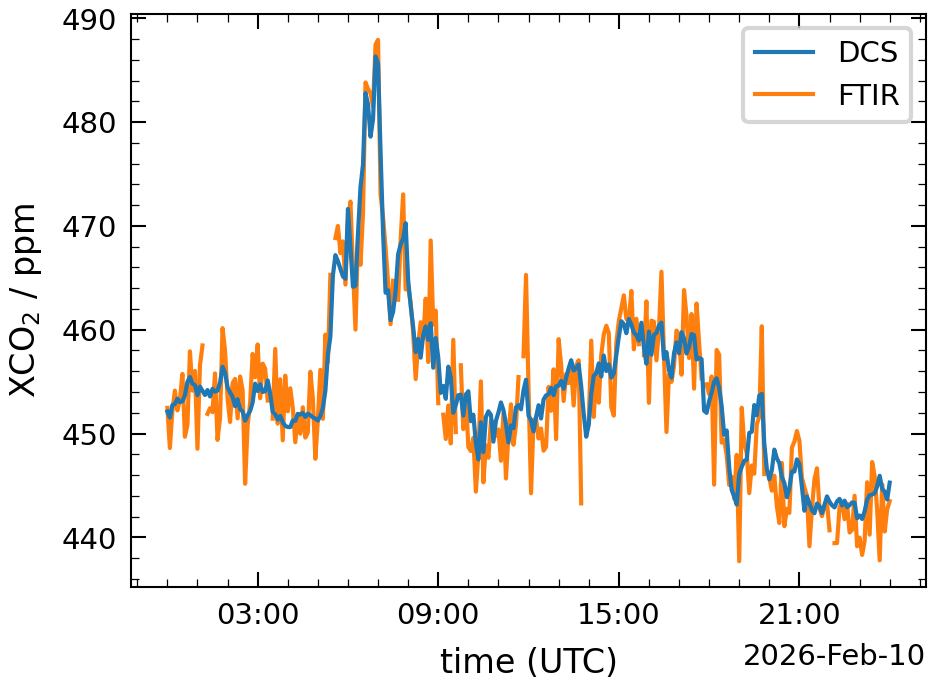
Figure 5Timeseries of XCO2 for the DCS instrument (this work) and a co-deployed FTIR instrument (Schmitt et al., 2023) for 24 h. Time resolution of 5 min.
The evaluation period spans from 2 September 2025 to 25 February 2026. Figure 4 shows the retrieved dry-air mole fraction of CO2 (XCO2) for the DCS open-path instrument in comparison with a FTIR open-path instrument (Schmitt et al., 2023). To address the different acquisition times of individual measurements for each instrument, the measurements are binned and averaged on a time grid of 5 min. The DCS instrument demonstrates a coverage of 76 % of the 5 min bins, after filtering the DCS data for measurements of extremely low signal of less than 5 %, typically resulting from strong rain or fog, and conservatively for unexpectedly high of the spectral fit. The two major data gaps from mid to end of November result from benchmarking tests for different modes of operation, which are not covered here. In the following months, the system shows up times of about 85 %. Both instruments show the same long-term trends like the typical annual cycle of increased CO2 in the northern-hemisphere winter and agree well along the full timeseries. While the better precision of the DCS system over the FTIR is already visible on this time scale, it becomes substantially clearer when zooming into a single day (Fig. 5). Both instruments are in good agreement within their respective precision throughout the day, where the diurnal cycle is dominated by boundary layer dynamics, with the FTIR instrument showing a substantially higher scatter. This reduced scatter in the DCS measurements makes it substantially easier to discern actual temporal variations of the CO2 concentration from measurement noise compared to the FTIR data.
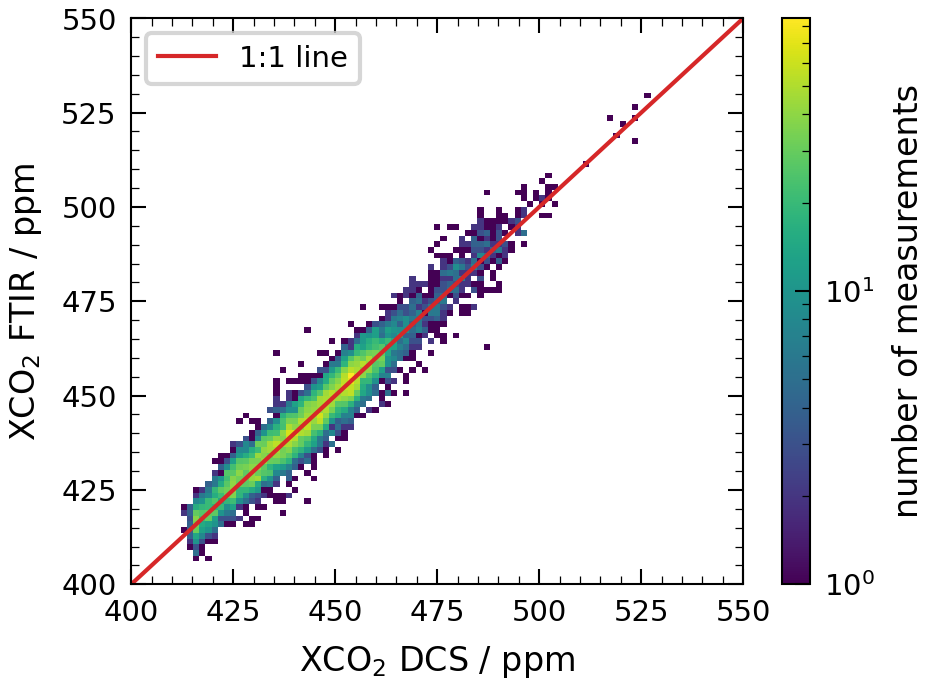
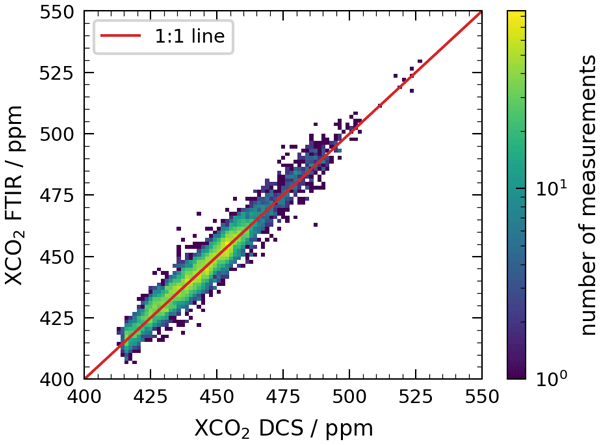
Figure 6Correlation of XCO2 measurements between the two instruments in a 2D-histogram. A simple fit reveals a high bias of 0.50 ppm for the FTIR instrument.
The correlation of the XCO2 values between the two instruments is close to a one-to-one line as Fig. 6 shows, further attesting to the good performance of both open-path spectrometers. A fit reveals only a minimal bias of 0.50 ppm between them, with the FTIR high-biased versus the DCS instrument. This bias does not show a temperature dependency over the analyzed time period, where we have strong statistics from 270 to 300 K.
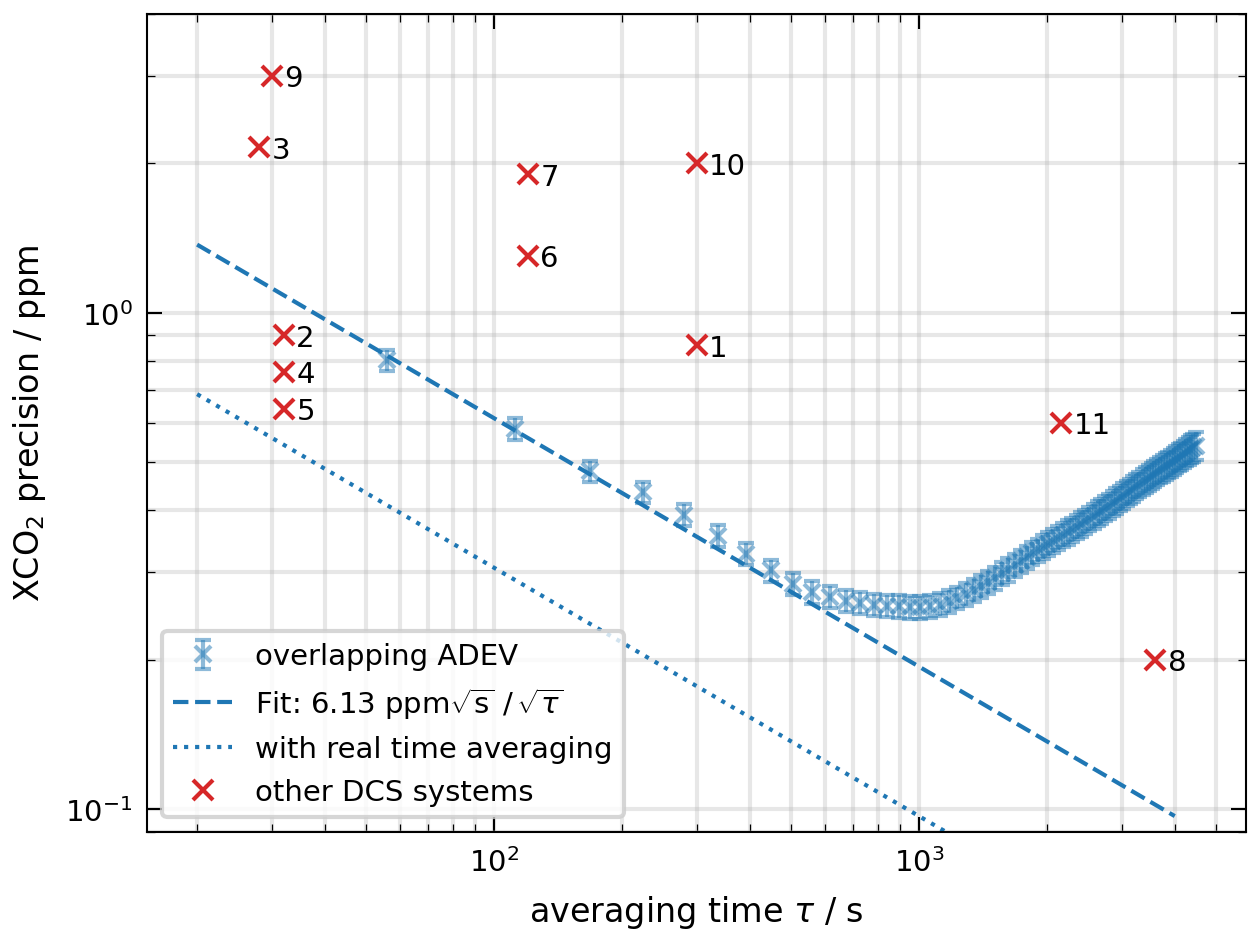
Figure 7Overlapping Allan deviation for DCS XCO2 measurements. The time between individual datapoints of the original timeseries is 55 s. The fit shows the expected scaling of Gaussian noise for low averaging times, where the measurement noise dominates the real atmospheric variability. The dotted line corresponds to the same performance extrapolated under the assumption of real time averaging. Previously reported precisions are marked in the plot for reference and numbered. The corresponding references are: (1) Rieker et al. (2014), (2) DCS A of Waxman et al. (2017), (3) DCS B of Waxman et al. (2017), (4) 2 km path of Waxman et al. (2019), (5) 6.7 km path of Waxman et al. (2019), (6) 0.6 km path of Giorgetta et al. (2021), (7) 2 km path of Giorgetta et al. (2021), (8) Malarich et al. (2025), (9) Chen et al. (2023), (10) Han et al. (2024) at 5 min averaging time, (11) Han et al. (2024) at 1 h averaging time.
Finally, we quantify the performance of the instrument by calculating the overlapping Allan deviation for 400 consecutive datapoints, measured 12 September 2025 from 10:04:12 to 16:16:26 UTC, during relatively stable atmospheric conditions. Figure 7 shows the expected scaling for averaging times τ below approximately 400 s, where atmospheric variability starts to dominate the measurement uncertainty. From fitting a function of type to the first three datapoints, we determine the instrument performance from the proportionality factor a to . This is equivalent to a precision of 0.35 ppm at an averaging time of 5 min for the DCS instrument, outperforming the FTIR instrument by an order of magnitude (2.7 ppm, Schmitt et al., 2023). Figure 7 also shows, that the performance compares well to previous DCS open-path experiments: The fit of the averaging characteristic demonstrates better precision than most other setups, with the notable exception of Waxman et al. (2019) and one instrument from Waxman et al. (2017). The implementation of real time averaging should improve the performance at least by another factor of two, resulting in a record precision. Please note that the good precision value of Malarich et al. (2025) of 0.2 ppm at long averaging time of 1 h is to a large part the result of the local conditions of the respective measurement, since it was taken far away from any sources and sinks at the Mauna Loa observatory under particularly stable conditions.
Redoing this evaluation for 8 h of data on 30 October 2025 by fitting the atmospheric pressure instead of measuring it results in the following changes: The more degrees of freedom result in a deterioration of the XCO2 precision by about 16 % to . Further, the fitted pressure results in a 0.28 % low bias compared to the fixed pressure evaluation scenario, but also a correlated 0.26 % low bias of the retrieved CO2 column. Together with a 0.10 % (0.28 K) low bias of the retrieved temperature, these correlated biases mostly cancel and result in a 0.09 % (0.36 ppm) low bias of the retrieved XCO2. The systematic residuals do not show any significant differences compared to those in Fig. 3. This encourages the use of fitted pressures, where an accurate pressure sensor is not available or regular recalibration is not possible.
Finally, providing additional information to the retrieval which constrains the temperature can also have the reverse effect: When also fitting CH4 in the 1.65 µm region, the precision of the retrieved XCO2 values improved by 22 % to . This also introduced a bias of 0.34 ppm via the temperature.
We presented an open-path dual-comb spectrometer using exclusively commercial, turn-key, self-referenced combs. It allows to retrieve column-averaged dry-air mole fractions of CO2 over a 3.1 km urban path in Heidelberg, Germany. Over the evaluation period from 2 September 2025 to 25 February 2026, the instrument achieved a data coverage of 76 %, with uptime of approximately 85 % during committed routine observations; data losses were primarily attributable to visibility-limiting weather conditions such as fog and heavy rain. The DCS instrument reaches a CO2 precision of , corresponding to 0.35 ppm at 5 min averaging time. This is on par with or better than previous open-path DCS experiments and represents roughly one order of magnitude improvement over the co-deployed open-path FTIR instrument (Schmitt et al., 2023). Please note, that this does not show a general advantage of that magnitude over FTIR instruments in terms of precision, since there are examples of FTIR setups with a substantially better precision than our comparison instrument (e.g., Deutscher et al., 2021, whose best configuration shows a precision similar to Waxman et al., 2019).
Direct comparison between the DCS and FTIR instruments reveals good agreement, with 0.50 ppm bias in XCO2 between the two instruments. Systematic fit residuals in the CO2 evaluation window are small and partially attributable to known water-vapor absorption lines, confirming the maturity of current spectroscopic databases for this region (Birk et al., 2024a).
We aim to update the current retrieval setup by adding CH4 to the list of retrieved gases and improving the CO2 performance as a by-product via a better constraint path averaged temperature. Since the recent updates to the HITRAN database (Gordon et al., 2026) addressed only some of the CH4 line manifolds in the 1.65 µm region and HITRAN2008 still tends to show the most accurate results for remote sensing applications (Gordon et al., 2026; Malarich et al., 2025), this is left for future work, to avoid the introduction of unintended biases into the CO2 data product.
The DCS system operates in the vicinity of a dense sensor network currently being deployed in Heidelberg, enabling three complementary scientific contributions: (1) characterization of sensor biases and drift through direct comparison with high-quality reference measurements; (2) gradient-based constraints on urban emissions through path-averaged measurements, which can complement or validate emission estimates derived from in-situ networks; and (3) combined interpretation of dense in-situ and path-averaged data to disentangle spatial heterogeneity in urban CO2 from measurement artifacts.
Beyond applications within the local metropolitan area, the high spectral resolution and signal-to-noise ratio make the DCS instrument valuable for validating absorption cross-section databases, addressing ongoing questions about, e.g., continuum absorption and water-vapor broadening parameterization of CO2 (Birk et al., 2024a; Malarich et al., 2025).
This work demonstrates that the maturation of commercial frequency-comb technology has fundamentally transformed open-path DCS from a specialized metrology technique into an accessible tool for the broader atmospheric science community. Crucially, this accessibility does not come at the expense of performance: built exclusively from commercially available components, our instrument is fully competitive with custom-built open-path dual-comb spectrometers. These advances establish a foundation for distributed, high-quality atmospheric observations spanning greenhouse gas monitoring and beyond, enabling diverse sensing solutions and broader applications in atmospheric chemistry and air quality assessment.
Code is available from the authors upon request. The evaluated data, regridded to a regular 5 min grid is available as Supplement.
The supplement related to this article is available online at https://doi.org/10.5194/amt-19-5717-2026-supplement.
All authors conceived and designed the instrument and contributed to the writing of the paper. TDS, RD and MS developed the instrument. TDS and MS carried out the formal data analysis. TDS prepared the manuscript.
At least one of the (co-)authors is a member of the editorial board of Atmospheric Measurement Techniques. The peer-review process was guided by an independent editor, and the authors also have no other competing interests to declare.
Publisher's note: Copernicus Publications remains neutral with regard to jurisdictional claims made in the text, published maps, institutional affiliations, or any other geographical representation in this paper. The authors bear the ultimate responsibility for providing appropriate place names. Views expressed in the text are those of the authors and do not necessarily reflect the views of the publisher.
The authors want to express gratitude to Ian Coddington, Nathalie Picqué, Birgitta Schultze-Bernhardt and her team, and Marcus Ossiander for the valuable scientific exchange at the beginning of this project. Many thanks go to Manfred Birk and Georg Wagner for providing their absorption-crosssection database on a custom grid. The authors utilized artificial intelligence tools in the generation of portions of manuscript text and figures. The authors take full responsibility for the accuracy and integrity of all content.
This research has been supported by the Ministry of Science, Research and the Arts Baden-Württemberg (MWK) and the German Research Foundation (DFG) through the data storage service SDS@hd (grant no. INST 35/1503-1 FUGG), through the computing resources of bwHPC (grant no. INST 35/1597-1 FUGG) and by funding the instrument (grant no. INST 35/1790-1 FUGG). Heidelberg University provided financial support for the publication fee.
This paper was edited by Haichao Wang and reviewed by Roderik Krebbers and two anonymous referees.
Alden, C. B., Coburn, S. C., Wright, R. J., Baumann, E., Cossel, K., Perez, E., Hoenig, E., Prasad, K., Coddington, I., and Rieker, G. B.: Single-Blind Quantification of Natural Gas Leaks from 1 Km Distance Using Frequency Combs, Environ. Sci. Technol., 53, 2908–2917, https://doi.org/10.1021/acs.est.8b06259, 2019. a
Alden, C. B., Wright, R. J., Coburn, S. C., Caputi, D., Wendland, G., Rybchuk, A., Conley, S., Faloona, I., and Rieker, G. B.: Temporal Variability of Emissions Revealed by Continuous, Long-Term Monitoring of an Underground Natural Gas Storage Facility, Environ. Sci. Technol., 54, 14589–14597, https://doi.org/10.1021/acs.est.0c03175, 2020. a
Asimow, N. G., Patel, M. Y., Zhu, Y., Winter, A. R., Gurney, K. R., Berelson, W. M., Turner, A. J., and Cohen, R. C.: Differences in Regional Home Heating Behavior in Three U.S. Cities Revealed by Ground-Based Sensor Network, Geophys. Res. Lett., 52, e2025GL115772, https://doi.org/10.1029/2025GL115772, 2025. a
Bailey, D. M., Adkins, E. M., and Miller, J. H.: An Open-Path Tunable Diode Laser Absorption Spectrometer for Detection of Carbon Dioxide at the Bonanza Creek Long-Term Ecological Research Site near Fairbanks, Alaska, Appl. Phys. B, 123, 245, https://doi.org/10.1007/s00340-017-6814-8, 2017. a
Birk, M., Röske, C., and Wagner, G.: The Pressure Dependence of the Experimentally-Determined Line Intensity and Continuum Absorption of Pure CO2 in the 1.6 µm Region, J. Quant. Spectrosc. Radiat. Transf., 324, 109055, https://doi.org/10.1016/j.jqsrt.2024.109055, 2024a. a, b, c
Birk, M., Wagner, G., and Roeske, C.: Measurement and Line Parameter Database CO2 5975–6575 Cm-1 Including Intensity Depletion and Continua, Zenodo, https://doi.org/10.5281/ZENODO.10727028, 2024b. a
Birk, M., Wagner, G., and Röske, C.: Absorption Cross Sections for Air- and H2O-broadened CO2 in the 1.6 µm and 2 µm Regions (Including Continuum) and Air- and Self-Broadened H2O in the 1.6 µm Region, Zenodo, https://doi.org/10.5281/ZENODO.16746358, 2025. a
Chen, X., Huang, C., Li, J., Lu, M., Li, Y., and Wei, H.: Phase-Sensitive Open-Path Dual-Comb Spectroscopy with Free-Running Combs, Phys. Rev. Appl., 19, 044016, https://doi.org/10.1103/PhysRevApplied.19.044016, 2023. a
Coburn, S., Alden, C. B., Wright, R., Cossel, K., Baumann, E., Truong, G.-W., Giorgetta, F., Sweeney, C., Newbury, N. R., Prasad, K., Coddington, I., and Rieker, G. B.: Regional Trace-Gas Source Attribution Using a Field-Deployed Dual Frequency Comb Spectrometer, Optica, 5, 320, https://doi.org/10.1364/OPTICA.5.000320, 2018. a
Coddington, I., Newbury, N., and Swann, W.: Dual-Comb Spectroscopy, Optica, 3, 414, https://doi.org/10.1364/OPTICA.3.000414, 2016. a
Cole, R. K., Makowiecki, A. S., Hoghooghi, N., and Rieker, G. B.: Baseline-Free Quantitative Absorption Spectroscopy Based on Cepstral Analysis, Opt. Express, 27, 37920, https://doi.org/10.1364/OE.27.037920, 2019. a
Cossel, K. C., Waxman, E. M., Giorgetta, F. R., Cermak, M., Coddington, I. R., Hesselius, D., Ruben, S., Swann, W. C., Truong, G.-W., Rieker, G. B., and Newbury, N. R.: Open-Path Dual-Comb Spectroscopy to an Airborne Retroreflector, Optica, 4, 724, https://doi.org/10.1364/OPTICA.4.000724, 2017. a
Cossel, K. C., Waxman, E. M., Baumann, E., Giorgetta, F. R., Coburn, S. C., Alden, C. B., and Washburn, B. R.: Remote Sensing Using Open-Path Dual-Comb Spectroscopy, in: Advances in Spectroscopic Monitoring of the Atmosphere, pp. 27–93, Elsevier, ISBN 978-0-12-815014-6, https://doi.org/10.1016/B978-0-12-815014-6.00008-7, 2021. a
Cossel, K. C., Waxman, E. M., Hoenig, E., Hesselius, D., Chaote, C., Coddington, I., and Newbury, N. R.: Ground-to-UAV, laser-based emissions quantification of methane and acetylene at long standoff distances, Atmos. Meas. Tech., 16, 5697–5707, https://doi.org/10.5194/amt-16-5697-2023, 2023. a
Deutscher, N. M., Naylor, T. A., Caldow, C. G. R., McDougall, H. L., Carter, A. G., and Griffith, D. W. T.: Performance of an open-path near-infrared measurement system for measurements of CO2 and CH4 during extended field trials, Atmos. Meas. Tech., 14, 3119–3130, https://doi.org/10.5194/amt-14-3119-2021, 2021. a, b, c
Dobler, J., Braun, M., Blume, N., and Zaccheo, T.: A New Laser Based Approach for Measuring Atmospheric Greenhouse Gases, Remote Sens., 5, 6284–6304, https://doi.org/10.3390/rs5126284, 2013. a
Dobler, J. T., Zaccheo, T. S., Pernini, T. G., Blume, N., Broquet, G., Vogel, F., Ramonet, M., Braun, M., Staufer, J., Ciais, P., and Botos, C.: Demonstration of Spatial Greenhouse Gas Mapping Using Laser Absorption Spectrometers on Local Scales, J. Appl. Remote Sens., 11, 014002, https://doi.org/10.1117/1.JRS.11.014002, 2017. a
Eber, A., Fürst, L., Siegrist, F., Kirchner, A., Tschofenig, B., Di Vora, R., Speletz, A., and Bernhardt, B.: Coherent Field Sensing of Nitrogen Dioxide, Opt. Express, 32, 6575, https://doi.org/10.1364/OE.513523, 2024. a
Eber, A., Gruber, C., Schultze, M., Bernhardt, B., and Ossiander, M.: Streaming Self-Corrected Dual-Comb Spectrometer, Opt. Express, 33, 35314, https://doi.org/10.1364/OE.569404, 2025. a
Estruch, C., Curcoll, R., Morguí, J.-A., Segura-Barrero, R., Vidal, V., Badia, A., Ventura, S., Gilabert, J., and Villalba, G.: Exploring How the Heterogeneous Urban Landscape Influences CO2 Concentrations: The Case Study of the Metropolitan Area of Barcelona, Urban For. Urban Green., 99, 128438, https://doi.org/10.1016/j.ufug.2024.128438, 2024. a
Gately, C. K. and Hutyra, L. R.: Large Uncertainties in Urban-Scale Carbon Emissions, J. Geophys. Res.-Atmos., 122, 11242–11260, https://doi.org/10.1002/2017JD027359, 2017. a
Giorgetta, F. R., Peischl, J., Herman, D. I., Ycas, G., Coddington, I., Newbury, N. R., and Cossel, K. C.: Open-Path Dual-Comb Spectroscopy for Multispecies Trace Gas Detection in the 4.5–5 µm Spectral Region, Laser Photonics Rev., 15, 2000583, https://doi.org/10.1002/lpor.202000583, 2021. a, b, c
Gordon, I., Rothman, L., Hargreaves, R., Hashemi, R., Karlovets, E., Skinner, F., Conway, E., Hill, C., Kochanov, R., Tan, Y., Wcisło, P., Finenko, A., Nelson, K., Bernath, P., Birk, M., Boudon, V., Campargue, A., Chance, K., Coustenis, A., Drouin, B., Flaud, J.-M., Gamache, R., Hodges, J., Jacquemart, D., Mlawer, E., Nikitin, A., Perevalov, V., Rotger, M., Tennyson, J., Toon, G., Tran, H., Tyuterev, V., Adkins, E., Baker, A., Barbe, A., Canè, E., Császár, A., Dudaryonok, A., Egorov, O., Fleisher, A., Fleurbaey, H., Foltynowicz, A., Furtenbacher, T., Harrison, J., Hartmann, J.-M., Horneman, V.-M., Huang, X., Karman, T., Karns, J., Kassi, S., Kleiner, I., Kofman, V., Kwabia–Tchana, F., Lavrentieva, N., Lee, T., Long, D., Lukashevskaya, A., Lyulin, O., Makhnev, V. Yu., Matt, W., Massie, S., Melosso, M., Mikhailenko, S., Mondelain, D., Müller, H., Naumenko, O., Perrin, A., Polyansky, O., Raddaoui, E., Raston, P., Reed, Z., Rey, M., Richard, C., Tóbiás, R., Sadiek, I., Schwenke, D., Starikova, E., Sung, K., Tamassia, F., Tashkun, S., Vander Auwera, J., Vasilenko, I., Vigasin, A., Villanueva, G., Vispoel, B., Wagner, G., Yachmenev, A., and Yurchenko, S.: The HITRAN2020 Molecular Spectroscopic Database, J. Quant. Spectrosc. Radiat. Transf., 277, 107949, https://doi.org/10.1016/j.jqsrt.2021.107949, 2022. a
Gordon, I., Rothman, L., Hargreaves, R., Gomez, F., Bertin, T., Hill, C., Kochanov, R., Tan, Y., Wcisło, P., Makhnev, V. Yu., Bernath, P., Birk, M., Boudon, V., Campargue, A., Coustenis, A., Drouin, B., Gamache, R., Hodges, J., Jacquemart, D., Mlawer, E., Nikitin, A., Perevalov, V., Rotger, M., Robert, S., Tennyson, J., Toon, G., Tran, H., Tyuterev, V., Adkins, E., Barbe, A., Bailey, D., Bielska, K., Bizzocchi, L., Blake, T., Bowesman, C., Cacciani, P., Čermák, P., Császár, A., Denis, L., Egbert, S., Egorov, O., Ermilov, A. Yu., Fleisher, A., Fleurbaey, H., Foltynowicz, A., Furtenbacher, T., Germann, M., Guest, E., Harrison, J., Hartmann, J.-M., Hjältén, A., Hu, S.-M., Huang, X., Johnson, T., Jóźwiak, H., Kassi, S., Khan, M., Kwabia-Tchana, F., Lee, T., Lisak, D., Liu, A.-W., Lyulin, O., Malarich, N., Manceron, L., Marinina, A., Massie, S., Mascio, J., Medvedev, E., Meshkov, V., Mellau, G. Ch., Melosso, M., Mikhailenko, S., Mondelain, D., Müller, H., O'Donnell, M., Owens, A., Perrin, A., Polyansky, O., Raston, P., Reed, Z., Rey, M., Richard, C., Rieker, G., Röske, C., Sharpe, S., Starikova, E., Stolarczyk, N., Stolyarov, A., Sung, K., Tamassia, F., Terragni, J., Ushakov, V., Vasilchenko, S., Vispoel, B., Vodopyanov, K., Wagner, G., Wójtewicz, S., Yurchenko, S., and Zobov, N.: The HITRAN2024 Molecular Spectroscopic Database, J. Quant. Spectrosc. Radiat. Transf., 353, 109807, https://doi.org/10.1016/j.jqsrt.2026.109807, 2026. a, b, c
Griffith, D. W. T., Pöhler, D., Schmitt, S., Hammer, S., Vardag, S. N., and Platt, U.: Long open-path measurements of greenhouse gases in air using near-infrared Fourier transform spectroscopy, Atmos. Meas. Tech., 11, 1549–1563, https://doi.org/10.5194/amt-11-1549-2018, 2018. a
Gurney, K. R., Liang, J., Roest, G., Song, Y., Mueller, K., and Lauvaux, T.: Under-Reporting of Greenhouse Gas Emissions in U.S. Cities, Nat. Commun., 12, 553, https://doi.org/10.1038/s41467-020-20871-0, 2021. a
Han, J.-J., Zhong, W., Zhao, R.-C., Zeng, T., Li, M., Lu, J., Peng, X.-X., Shi, X.-P., Yin, Q., Wang, Y., Esamdin, A., Shen, Q., Guan, J.-Y., Hou, L., Ren, J.-G., Jia, J.-J., Wang, Y., Jiang, H.-F., Xue, X.-H., Zhang, Q., Dou, X.-K., and Pan, J.-W.: Dual-Comb Spectroscopy over a 100 Km Open-Air Path, Nat. Photonics, 18, 1195–1202, https://doi.org/10.1038/s41566-024-01525-9, 2024. a, b, c
Herman, D. I., Weerasekara, C., Hutcherson, L. C., Giorgetta, F. R., Cossel, K. C., Waxman, E. M., Colacion, G. M., Newbury, N. R., Welch, S. M., DePaola, B. D., Coddington, I., Santos, E. A., and Washburn, B. R.: Precise Multispecies Agricultural Gas Flux Determined Using Broadband Open-Path Dual-Comb Spectroscopy, Sci. Adv., 7, eabe9765, https://doi.org/10.1126/sciadv.abe9765, 2021. a
Hong, S.-O., Kim, J., Byun, Y.-H., Hong, J., Hong, J.-W., Lee, K., Park, Y.-S., Lee, S.-S., and Kim, Y.-H.: Intra-Urban Variations of the CO2 Fluxes at the Surface-Atmosphere Interface in the Seoul Metropolitan Area, Asia-Pac. J. Atmos. Sci., 59, 417–431, https://doi.org/10.1007/s13143-023-00324-6, 2023. a
Kaminski, T., Rayner, P. J., Heimann, M., and Enting, I. G.: On Aggregation Errors in Atmospheric Transport Inversions, J. Geophys. Res.-Atmos., 106, 4703–4715, https://doi.org/10.1029/2000JD900581, 2001. a
Karman, T., Gordon, I. E., van der Avoird, A., Baranov, Y. I., Boulet, C., Drouin, B. J., Groenenboom, G. C., Gustafsson, M., Hartmann, J.-M., Kurucz, R. L., Rothman, L. S., Sun, K., Sung, K., Thalman, R., Tran, H., Wishnow, E. H., Wordsworth, R., Vigasin, A. A., Volkamer, R., and van der Zande, W. J.: Update of the HITRAN Collision-Induced Absorption Section, Icarus, 328, 160–175, https://doi.org/10.1016/j.icarus.2019.02.034, 2019. a
Kim, J., Berelson, W. M., Rollins, N. E., Asimow, N. G., Newman, C., Cohen, R. C., Miller, J. B., McDonald, B. C., Peischl, J., and Lehman, S. J.: Observing Anthropogenic and Biogenic CO2 Emissions in Los Angeles Using a Dense Sensor Network, Environ. Sci. Technol., 59, 3508–3517, https://doi.org/10.1021/acs.est.4c11392, 2025. a
Kochanov, R., Gordon, I., Rothman, L., Wcisło, P., Hill, C., and Wilzewski, J.: HITRAN Application Programming Interface (HAPI): A Comprehensive Approach to Working with Spectroscopic Data, J. Quant. Spectrosc. Radiat. Transf., 177, 15–30, https://doi.org/10.1016/j.jqsrt.2016.03.005, 2016. a
Krebbers, R., Van Kempen, K., Harren, F. J. M., Vasilyev, S., Peterse, I. F., Lücker, S., Khodabakhsh, A., and Cristescu, S. M.: Ultra-Broadband Spectroscopy Using a 2–11.5 µm IDFG-based Supercontinuum Source, Opt. Express, 32, 14506, https://doi.org/10.1364/OE.515914, 2024. a
Krebbers, R., van Kempen, K., Lin, Y., Meurs, J., Hendriks, L., Aben, R., Paranaiba, J. R., Fritz, C., Veraart, A. J., Khodabakhsh, A., and Cristescu, S. M.: Ultra-Broadband Coherent Open-Path Spectroscopy for Multi-Gas Monitoring in Wastewater Treatment, Environ. Sci. Ecotechnol, 25, 100554, https://doi.org/10.1016/j.ese.2025.100554, 2025. a
Lauvaux, T., Gurney, K. R., Miles, N. L., Davis, K. J., Richardson, S. J., Deng, A., Nathan, B. J., Oda, T., Wang, J. A., Hutyra, L., and Turnbull, J.: Policy-Relevant Assessment of Urban CO2 Emissions, Environ. Sci. Technol., 54, 10237–10245, https://doi.org/10.1021/acs.est.0c00343, 2020. a
Lian, J., Bréon, F.-M., Broquet, G., Zaccheo, T. S., Dobler, J., Ramonet, M., Staufer, J., Santaren, D., Xueref-Remy, I., and Ciais, P.: Analysis of temporal and spatial variability of atmospheric CO2 concentration within Paris from the GreenLITE™ laser imaging experiment, Atmos. Chem. Phys., 19, 13809–13825, https://doi.org/10.5194/acp-19-13809-2019, 2019. a
Malarich, N., Giorgetta, F. R., Mead, G., Baumann, E., Genest, J., Newbury, N. R., Coddington, I., and Cossel, K. C.: Evaluating CO2 and CH4 Absorption Models with Open-Path Dual-Comb Spectroscopy at the Mauna Loa Observatory, J. Quant. Spectrosc. Radiat. Transf., 345, 109567, https://doi.org/10.1016/j.jqsrt.2025.109567, 2025. a, b, c, d, e, f
Mead, G. J., Waxman, E. M., Bon, D., Herman, D. I., Baumann, E., Giorgetta, F. R., Friedlein, J. T., Ycas, G., Newbury, N. R., Coddington, I., and Cossel, K. C.: Open-Path Dual-Comb Spectroscopy of Methane and VOC Emissions from an Unconventional Oil Well Development in Northern Colorado, Front. Chem., 11, 1202255, https://doi.org/10.3389/fchem.2023.1202255, 2023. a
Mitchell, L. E., Lin, J. C., Bowling, D. R., Pataki, D. E., Strong, C., Schauer, A. J., Bares, R., Bush, S. E., Stephens, B. B., Mendoza, D., Mallia, D., Holland, L., Gurney, K. R., and Ehleringer, J. R.: Long-Term Urban Carbon Dioxide Observations Reveal Spatial and Temporal Dynamics Related to Urban Characteristics and Growth, Proc. Natl. Acad. Sci., 115, 2912–2917, https://doi.org/10.1073/pnas.1702393115, 2018. a
Mueller, K. L., Lauvaux, T., Gurney, K. R., Roest, G., Ghosh, S., Gourdji, S. M., Karion, A., DeCola, P., and Whetstone, J.: An Emerging GHG Estimation Approach Can Help Cities Achieve Their Climate and Sustainability Goals, Environ. Res. Lett., 16, 084003, https://doi.org/10.1088/1748-9326/ac0f25, 2021. a
Oda, T., Bun, R., Kinakh, V., Topylko, P., Halushchak, M., Marland, G., Lauvaux, T., Jonas, M., Maksyutov, S., Nahorski, Z., Lesiv, M., Danylo, O., and Horabik-Pyzel, J.: Errors and Uncertainties in a Gridded Carbon Dioxide Emissions Inventory, Mitig. Adapt. Strateg. Glob. Change, 24, 1007–1050, https://doi.org/10.1007/s11027-019-09877-2, 2019. a
Park, C., Jeong, S., Park, M.-S., Park, H., Yun, J., Lee, S.-S., and Park, S.-H.: Spatiotemporal Variations in Urban CO2 Flux with Land-Use Types in Seoul, Carbon Balance Manag., 17, 3, https://doi.org/10.1186/s13021-022-00206-w, 2022. a
Patel, M. Y., Asimow, N. G., Winter, A. R., Zhu, Y., and Cohen, R. C.: Using Network Observations to Constrain CO and CO2 Emissions From an Oil Refinery in the San Francisco Bay Area, J. Geophys. Res.-Atmos., 131, e2025JD045035, https://doi.org/10.1029/2025JD045035, 2026. a
Picqué, N. and Hänsch, T. W.: Frequency Comb Spectroscopy, Nat. Photonics, 13, 146–157, https://doi.org/10.1038/s41566-018-0347-5, 2019. a
Plant, G., Nikodem, M., Mulhall, P., Varner, R., Sonnenfroh, D., and Wysocki, G.: Field Test of a Remote Multi-Path CLaDS Methane Sensor, Sensors, 15, 21315–21326, https://doi.org/10.3390/s150921315, 2015. a
Quatrevalet, M., Wolferstetter, M., Sprenger, B., Fischer, M., Holzwarth, R., and Fix, A.: In-Flight Enhancement of the Optical Frequency Accuracy of an Integral-Path Differential Absorption Lidar Thanks to a Rugged, Airborne Self-Referenced Frequency Comb, Opt. Express, 33, 10165, https://doi.org/10.1364/OE.546616, 2025. a
Rieker, G. B., Giorgetta, F. R., Swann, W. C., Kofler, J., Zolot, A. M., Sinclair, L. C., Baumann, E., Cromer, C., Petron, G., Sweeney, C., Tans, P. P., Coddington, I., and Newbury, N. R.: Frequency-Comb-Based Remote Sensing of Greenhouse Gases over Kilometer Air Paths, Optica, 1, 290, https://doi.org/10.1364/OPTICA.1.000290, 2014. a, b
Roy, J., Deschênes, J.-D., Potvin, S., and Genest, J.: Continuous Real-Time Correction and Averaging for Frequency Comb Interferometry, Opt. Express, 20, 21932, https://doi.org/10.1364/OE.20.021932, 2012. a
Saito, H., Manago, N., Kuriyama, K., and Kuze, H.: Near-Infrared Open-Path Measurement of CO_2 Concentration in the Urban Atmosphere, Opt. Lett., 40, 2568, https://doi.org/10.1364/OL.40.002568, 2015. a
Schmitt, T. D., Kuhn, J., Kleinschek, R., Löw, B. A., Schmitt, S., Cranton, W., Schmidt, M., Vardag, S. N., Hase, F., Griffith, D. W. T., and Butz, A.: An open-path observatory for greenhouse gases based on near-infrared Fourier transform spectroscopy, Atmos. Meas. Tech., 16, 6097–6110, https://doi.org/10.5194/amt-16-6097-2023, 2023. a, b, c, d, e, f, g, h, i
Shusterman, A. A., Teige, V. E., Turner, A. J., Newman, C., Kim, J., and Cohen, R. C.: The BErkeley Atmospheric CO2 Observation Network: initial evaluation, Atmos. Chem. Phys., 16, 13449–13463, https://doi.org/10.5194/acp-16-13449-2016, 2016. a
Super, I., Dellaert, S. N. C., Visschedijk, A. J. H., and Denier van der Gon, H. A. C.: Uncertainty analysis of a European high-resolution emission inventory of CO2 and CO to support inverse modelling and network design, Atmos. Chem. Phys., 20, 1795–1816, https://doi.org/10.5194/acp-20-1795-2020, 2020. a
Truong, G.-W., Waxman, E. M., Cossel, K. C., Baumann, E., Klose, A., Giorgetta, F. R., Swann, W. C., Newbury, N. R., and Coddington, I.: Accurate Frequency Referencing for Fieldable Dual-Comb Spectroscopy, Opt. Express, 24, 30495, https://doi.org/10.1364/OE.24.030495, 2016. a
Waxman, E. M., Cossel, K. C., Truong, G.-W., Giorgetta, F. R., Swann, W. C., Coburn, S., Wright, R. J., Rieker, G. B., Coddington, I., and Newbury, N. R.: Intercomparison of open-path trace gas measurements with two dual-frequency-comb spectrometers, Atmos. Meas. Tech., 10, 3295–3311, https://doi.org/10.5194/amt-10-3295-2017, 2017. a, b, c, d, e, f
Waxman, E. M., Cossel, K. C., Giorgetta, F., Truong, G.-W., Swann, W. C., Coddington, I., and Newbury, N. R.: Estimating vehicle carbon dioxide emissions from Boulder, Colorado, using horizontal path-integrated column measurements, Atmos. Chem. Phys., 19, 4177–4192, https://doi.org/10.5194/acp-19-4177-2019, 2019. a, b, c, d, e
Westberg, J., Teng, C. C., Chen, Y., Liu, J., Patrick, L., Shen, L., Soskind, M., and Wysocki, G.: Urban Open-Air Chemical Sensing Using a Mobile Quantum Cascade Laser Dual-Comb Spectrometer, APL Photonics, 8, 120803, https://doi.org/10.1063/5.0163308, 2023. a
Zaccheo, T. S., Blume, N., Pernini, T., Dobler, J., and Lian, J.: Bias correction of long-path CO2 observations in a complex urban environment for carbon cycle model inter-comparison and data assimilation, Atmos. Meas. Tech., 12, 5791–5800, https://doi.org/10.5194/amt-12-5791-2019, 2019. a
Zhu, X.-H., Lu, K.-F., Peng, Z.-R., He, H.-D., and Xu, S.-Q.: Spatiotemporal Variations of Carbon Dioxide (CO2) at Urban Neighborhood Scale: Characterization of Distribution Patterns and Contributions of Emission Sources, Sustain. Cities Soc., 78, 103646, https://doi.org/10.1016/j.scs.2021.103646, 2022. a