
the Creative Commons Attribution 4.0 License.
the Creative Commons Attribution 4.0 License.
 | 13 Oct 2026
The proof-of-concept for raindrop size distribution retrieval using combined dual-frequency radar DFR
Liang Feng
Jiefan Yang

Zeyong Guo
Jiming Sun
Yue Sun
Huiling Yang
Xiangfeng Hu
Accurate retrieval of raindrop size distributions (DSDs) is essential for understanding cloud and precipitation microphysics. The dual-frequency ratio (DFR) measured by dual-frequency radars is independent of the normalized intercept parameter (Nw) and depends solely on the mass-weighted mean diameter (Dm). This characteristic makes DFR a powerful parameter for DSD retrieval. However, the DFR–Dm relationship is subject to a dual-solution ambiguity, particularly for smaller particles. This study demonstrates that W-band reflectivities obtained through scattering simulations based on measured raindrop size distributions, combined with the DFR(Ka, W) constraint, effectively mitigate the DFR(X, Ka)–Dm dual-solution ambiguity. The results demonstrate that incorporating the DFR(Ka, W) constraint substantially reduces the DFR–Dm ambiguity, raising the proportion of data with a unique Dm solution from 35.38 % (DFR(X, Ka) alone) to 87.5 %. The proposed framework shows potential advantages over conventional approaches, particularly for weak echoes (< 20 dBZ), where conventional methods fail but the proposed framework maintains robust accuracy. This proof-of-concept study provides a reference framework for future three-frequency radar DSD retrieval.
- Article
(17071 KB) - Full-text XML
- BibTeX
- EndNote


As a fundamental parameter in cloud and precipitation microphysics, the raindrop size distribution (DSD) characterizes the size distribution of precipitation particles (Marshall and Palmer, 1948; Ulbrich, 1983; Testud et al., 2001). Accurate retrieval of DSD is crucial for advancing research in cloud and precipitation microphysics, developing and evaluating cloud microphysics schemes in numerical models, supporting weather modification activities, and understanding cloud–climate interactions (Liu et al., 2021). Consequently, how to accurately retrieve DSD has always been an important research topic in radar meteorology. However, due to the variability in precipitation particle shape, density, size, orientation, and spectral characteristics, accurately quantifying the microphysical properties of cloud and precipitation systems using single-frequency radar remains a significant challenge (Li et al., 2023).
Numerous studies have demonstrated that the dual-frequency radar could retrieve DSD more accurately with the Dual-Frequency Ratio (DFR) (Seto et al., 2013; Liao and Meneghini, 2019a; Kubota et al., 2020). This technique employs two distinct wavelengths: one is chosen such that Rayleigh scattering dominates for most precipitation-sized particles, while the other is sufficiently short to trigger Mie scattering in the presence of large hydrometeors (Liao and Meneghini, 2019b). Since Mie scattering is more sensitive to particle size, an increase in particle diameter amplifies the difference in scattering characteristics between the two frequencies, resulting in a noticeable increase in DFR. This makes DFR a key diagnostic parameter for characterizing the DSD.
Another important advantage of the DFR is its independence on the normalized intercept parameter (Nw) when retrieving the DSD. Under the normalized gamma size distribution assumption with a fixed shape factor (μ), DFR depends only on the mass-weighted mean diameter (Dm). Meneghini et al. (2022) demonstrated that the retrieved DSD closely matches in situ observations when μ is set to 3. Most studies on DFR-based DSD retrieval have focused on the dual-frequency Ku/Ka-band radar aboard the Global Precipitation Measurement (GPM) satellite (Hou et al., 2014; Liao et al., 2014; Skofronick-Jackson et al., 2017, 2018; Iguchi et al., 2021; Seto et al., 2021; Iguchi and Meneghini, 2022; Ladino-Rincon et al., 2025).
A great challenge in DFR-based DSD retrieval is the DFR–Dm dual-solution. For example, when DFR≤0, a single DFR value corresponds to two Dm values (Meneghini et al., 1992, 1997; Mardiana et al., 2004; Liao and Meneghini, 2005; Rose and Chandrasekar, 2005). A commonly used approach is to select the large Dm value as the solution, which often introduces retrieval errors, particularly in light precipitation (Mardiana et al., 2004; Meneghini et al., 2022). Another method is to discard data with DFR≤0 and only use data with DFR>0 to retrieve Dm, which results in considerable data loss (Wang et al., 2020; Liu and Wang, 2020).
To address the DFR–Dm dual-solution, Liao and Meneghini (2019b) proposed a generalized dual-frequency ratio, denoted as DFR∗ (, where ). Although DFR∗ successfully avoids the ambiguity inherent in the original DFR formulation, it is no longer a function solely of Dm and introduces a dependence on Nw. Iguchi and Meneghini (2022) further introduced a retrieval approach based on the differential form of the dual-frequency radar equation, investigating the stability of Dm retrievals with respect to variations in initial conditions. However, this method primarily mitigates the dual-solution under conditions of strong attenuation (i.e., intense precipitation). Meneghini et al. (2022) also noted that it is not always possible to identify the correct solution among multiple candidates although the DFR–Dm dual-solution can be addressed analytically. Given that the dual-solution in the DFR–Dm relationship has not been adequately resolved, the GPM currently employs the R–Dm relationship to retrieve Dm (Seto et al., 2021).
This paper is structured as follows. Section 2 introduces the theoretical background of the DFR–Dm relationship, the overall DSD retrieval strategy, and a step-by-step retrieval framework. Section 3 presents the preprocessing steps, including attenuation correction, sensitivity analysis, and the construction of the retrieval algorithm based on scattering simulation. Section 4 provides a comprehensive evaluation of the proposed framework using case studies, ground-based disdrometer validation, and an independent validation strategy. Section 5 discusses the limitations and practical applicability of the proposed framework. Finally, Sect. 6 summarizes the key findings and outlines directions for future research.
2.1 Retrieval Framework
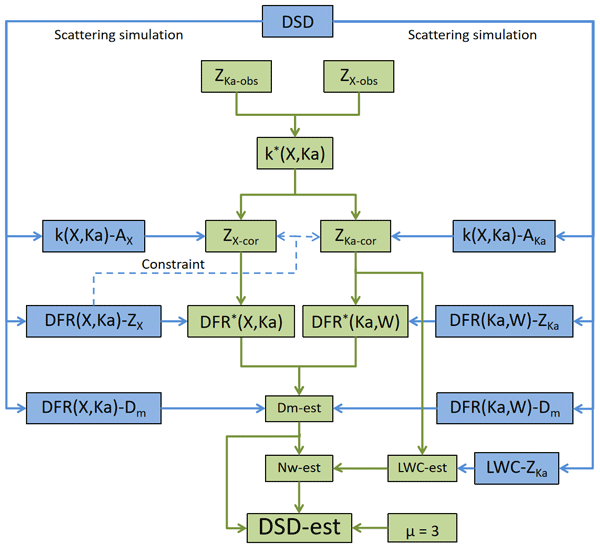
The overall retrieval framework of this study is built upon the synergy between dual-frequency radar observations and T-matrix scattering simulations. Figure 1 presents the schematic diagram of the retrieval system. Blue boxes denote the results from scattering simulations, and green boxes represent those derived from radar observation data. The framework integrates three fundamental components: (1) observation-based inputs, including X/Ka-band dual-frequency radar reflectivities and 2DVD-measured raindrop size distributions; (2) physics-based simulation, where T-matrix scattering calculations are employed to derive theoretical relationships between radar observables and DSD parameters; and (3) multi-constraint retrieval, which combines DFR(X, Ka) and DFR(Ka, W) to resolve the Dm ambiguity while using LWC–ZKa relationship for liquid water content estimation.
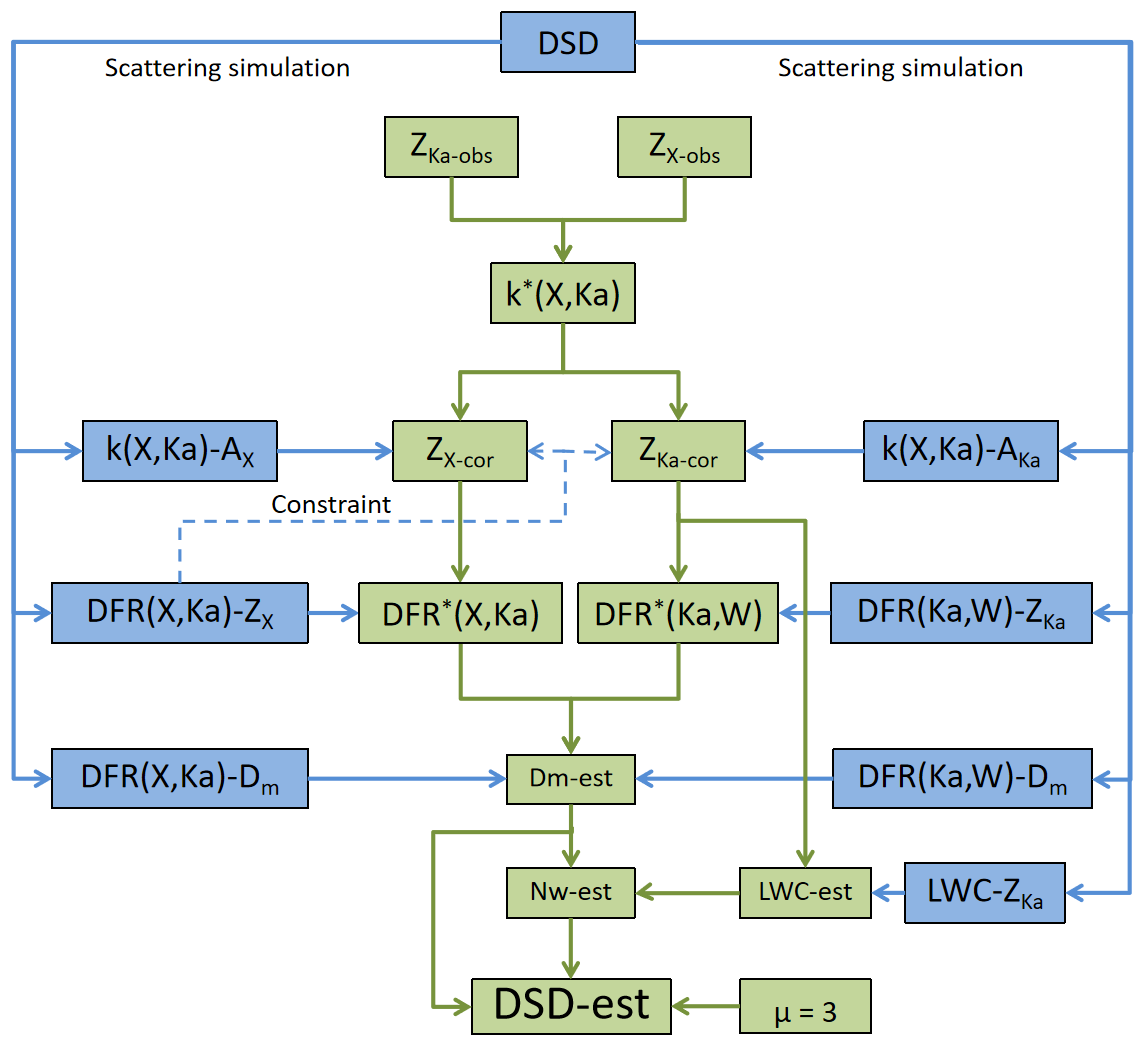
Figure 1Flowchart of X/Ka dual-frequency radar retrieval for normalized gamma raindrop size distribution (blue arrows indicate the scattering simulation workflow, while green arrows represent the retrieval workflow for real radar observation data).
The core concept of this method is rooted in the physical principle that the DFR at distinct frequency pairs, specifically X/Ka and Ka/W bands, exhibits distinct responses to variations in Dm. This disparity arises from differences in their sensitivity to particle size and scattering regime. In the DFR(X, Ka)–Dm relationship, the dual-solution means a single DFR corresponds to two Dm values when DFR(X, Ka) ≤ 0. To resolve this ambiguity, DFR(Ka, W) is employed, which operates at higher frequencies and exhibits a significantly narrower ambiguity zone than DFR(X, Ka)–Dm.
2.2 Retrieval Procedure
The overall retrieval scheme and the detailed procedure is described as follows:
-
Step 1. The 2DVD observations of raindrop size distributions are collected as ground-truth measurements. According to the measuring principles of 2DVD, the number concentration of raindrops (N(Di): ) per unit volume per unit size interval at a discrete instant are calculated using the following equations:
where Δt is the time interval (60 s is used in this study), i is the size index, j is the particle index, Aj (mm2) and Vj (m s−1) are the sensing area and fall velocity for drop j, respectively; and mi is the number of drops within size class i and time interval Δt. ΔD (mm) represents size-sorted categories of equivalent-volume diameters, and 0.2 mm is used.
The nth moment of the DSD can be obtained by integrating the spectrum, as defined by Tokay and Beard (1996):
The subscripts min and max represent the minimum and maximum diameters of raindrops, respectively. The true values of Dm, liquid water content (LWC), and Nw can be derived from the moments of the DSD:
where ρw is the density of water.
-
Step 2. T-matrix scattering calculations are performed to simulate radar reflectivities at X-, Ka-, and W-band frequencies (ZX, ZKa, ZW), specific attenuation at X-band and Ka-band (AX, AKa), and differential specific attenuation [k(X, Ka)] based on the DSDs measured by 2DVD.
-
Step 3. The retrieval relationships of DFR(X, Ka)–Dm, DFR(Ka, W)–Dm, DFR(X, Ka)–ZX, DFR(Ka, W)–ZKa, k(X, Ka)–AX, k(X, Ka)–AKa and LWC–ZKa are established via fitting.
-
Step 4. Radar observed reflectivity of X-band and Ka-band (ZX-obs, ZKa-obs) are input into the retrieval system and k∗(X, Ka) is calculated using ZX-obs and ZKa-obs. Using the retrieval relationships of k(X, Ka)–AX and k(X, Ka)–AKa, and are obtained. The observed reflectivities ZX-obs and ZKa-obs are finally corrected, yielding ZX-cor and ZKa-cor. Furthermore, the deviations exist in the reflectivity after correction when applying and to X- and Ka-band reflectivity. To address this issue, we impose constraints on the corrected reflectivity using the DFR(X, Ka)–ZX relationship (see Sect. 3.3 for details).
-
Step 5. Based on the theoretical retrieval relationships for DFR(X, Ka)–ZX and DFR(Ka, W)–ZKa, DFR∗(X, Ka) and DFR∗(Ka, W) corresponding to actual radar observations are retrieved from ZX-cor and ZKa-cor.
-
Step 6. Dm-est is retrieved using the combined DFR∗(X, Ka) and DFR∗(Ka, W) relationships, with the latter used to resolve ambiguity when DFR(X, Ka)∗ ≤ 0.
-
Step 7. LWC-est is retrieved from Ka-band reflectivity using the established LWC–ZKa relationship and Nw-est is computed from Dm-est and LWC-est using the DSD moment relationship.
-
Step 8. Dm-est and Nw-est are substituted into the normalized gamma distribution function (μ=3) to obtain the retrieved raindrop size distribution DSD-est. The normalized gamma distribution is as follow (Testud et al., 2001):
It should be emphasized that no fitting of the normalized gamma distribution to the measured DSD is involved in deriving the reference DSD parameters. The Dm, LWC, and Nw are computed directly from M3 and M4 via Eqs. (3)–(5), and are therefore independent of μ. The normalized gamma distribution (Eq. 6) with μ=3 is used only at the final step of the retrieval (Step 8) to retrieve DSD from Dm-est and Nw-est.
3.1 Instruments
The dataset utilized in this study comprises radar observations from an X/Ka dual-frequency radar and drop size distribution measurements from a 2-dimensional video disdrometer (2DVD). Both datasets were collected in vertical pointing mode at the meteorological observation site in Yangjiang, Guangdong Province, on 1 May, 11 May, 11 June 2022 and 14 June 2025. The X/Ka dual-frequency radar, developed by the 38th Research Institute of China Electronics Technology Group Corporation (CETC-38), employs a fully solid-state frequency-modulated continuous wave (FMCW) system with coaxial scanning and has undergone absolute calibration prior to field deployment. Its high temporal and spatial resolution enables the real-time tracking of precipitation system structural evolution. The 2DVD, developed by Austria's Joanneum Research, is designed to capture the two-dimensional size distribution and phase characteristics of precipitation particles. It provides essential ground-truth data for DSD research and phase identification algorithm validation. The main technical specifications of the X/Ka-band radar are presented in Table 1.
Table 1Key specifications of X/Ka dual-frequency radar system.
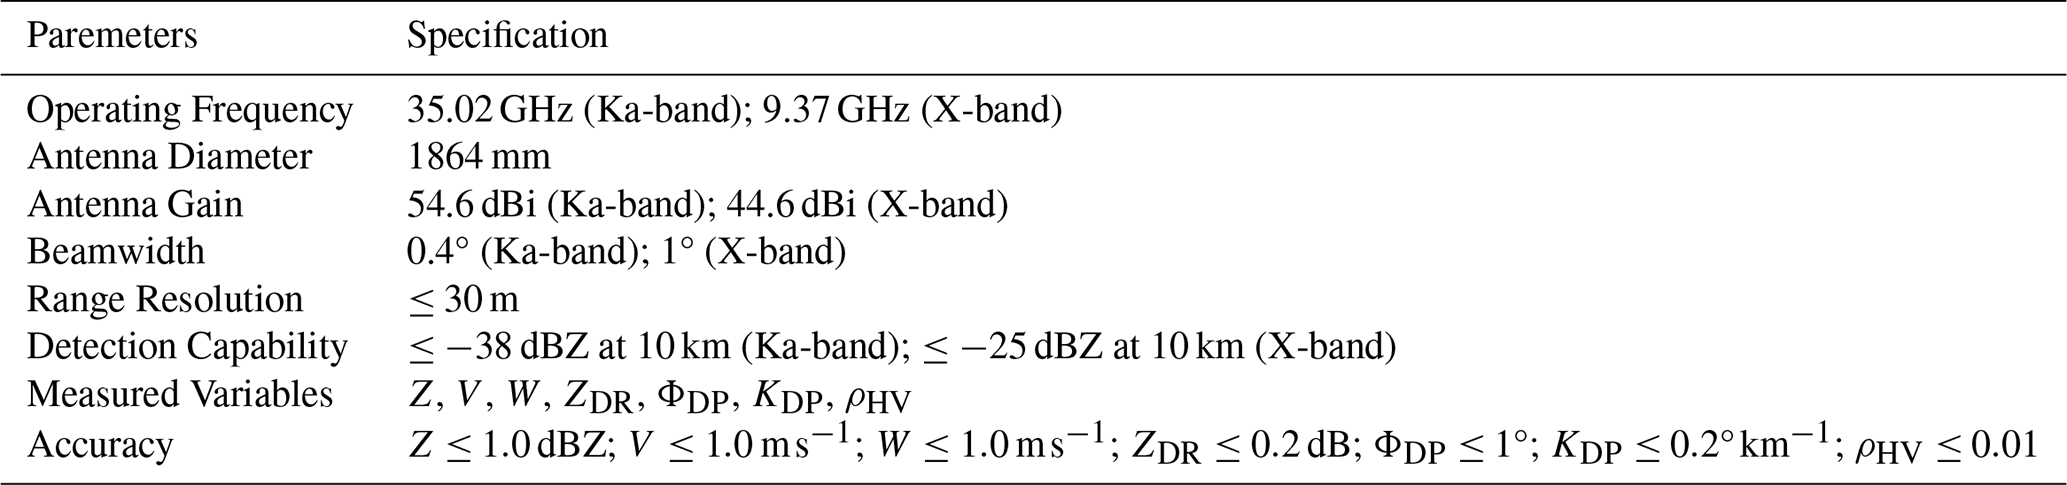
As shown in Table 1, the mismatch in beamwidth between the X- and Ka-band leads to scale errors. The scale errors can be reduced by time averaging and spatial smoothing (Ellis and Vivekanandan, 2011). To mitigate the scale mismatch between the two frequencies, Ka-band reflectivities are temporally smoothed using a 3-point running mean. This increases the effective averaging scale along the time dimension, rendering the smoothed Ka-band sampling volume approximately equivalent to that of the X-band.
3.2 Scattering Simulation
The T-matrix method provides an efficient and rigorous approach for computing electromagnetic scattering by nonspherical particles, which was developed by Waterman (1965, 1971). By directly solving Maxwell equations with appropriate boundary conditions, the method is particularly suitable for modeling the scattering properties of axisymmetric hydrometeors, such as raindrops, snowflakes, and graupel. In this study, the T-matrix method is employed to simulate the scattering characteristics of measured raindrop size distributions at X-, Ka-, and W-band frequencies. The simulations serve as the theoretical foundation for developing a new DSD retrieval algorithm based on dual-frequency radar observations.
In the context of radar meteorology, the radar reflectivity is defined as follows (in units of mm6 m−3):
where λ is the wavelength of the electromagnetic wave, m is the complex refractive index of the precipitation particle, and σH,V denotes the horizontal or vertical backscattering cross section. Zh,v represents the horizontal or vertical radar reflectivity. When expressed in terms of T-matrix elements, the Eq. (8) becomes:
where 〈…〉 denotes the volumetric ensemble average of the phase matrix elements for precipitation particles, and no represents the total number of particles per cubic meter. The constant C is defined as , where , and ε is the dielectric constant of the hydrometeor, given by ε=m2. These parameters are derived from the phase matrix outputs of T-matrix scattering simulations (Feng et al., 2019).
The axis-ratio model is still required in the T-matrix calculations because the scattering and extinction properties depend on particle shape. However, under vertically pointing observations, polarization-dependent differences are negligible and do not directly affect the retrieval framework. In this study, the raindrop axis ratio is determined using the following relationship (Tang et al., 2014):
The vertically pointing radar is configured with a zenith angle of 0°, ensuring a perfectly nadir (vertical) observation geometry. The complex refractive indices of raindrops at the X-, Ka-, and W-band frequencies at 0–30 °C used in the scattering simulations are summarized in Table 2 (Chang and Wilheit, 1979; Liebe, 1985).
Table 2Complex refraction index of raindrops at X-, Ka-, and W-band at different temperatures.

To evaluate the impact of temperature on raindrop size distribution retrieval, we take DFR(Ka, W) as an example to simulate the retrieved relationship between DFR(Ka, W) and Dm for raindrops at different temperatures (Fig. 2a). As shown in Fig. 2b, the RMSE of Dm retrieval is minimized at 20 °C. Therefore, the DFR–Dm retrieval model was established with 20 °C adopted as the reference temperature.

Figure 2Fitting curves (a) and Dm retrieval error (b) of DFR(Ka, W)–Dm at different temperatures (blue: 0 °C; green: 10 °C; black: 20 °C; red: 30 °C).
3.3 Attenuation Correction
The profiles of reflectivity measured by the X/Ka dual-frequency vertically pointing radar are shown in Fig. 3. Since both X- and Ka-band signals are subject to rain-induced attenuation, attenuation correction must be applied to the observed reflectivity prior to DSD retrieval.
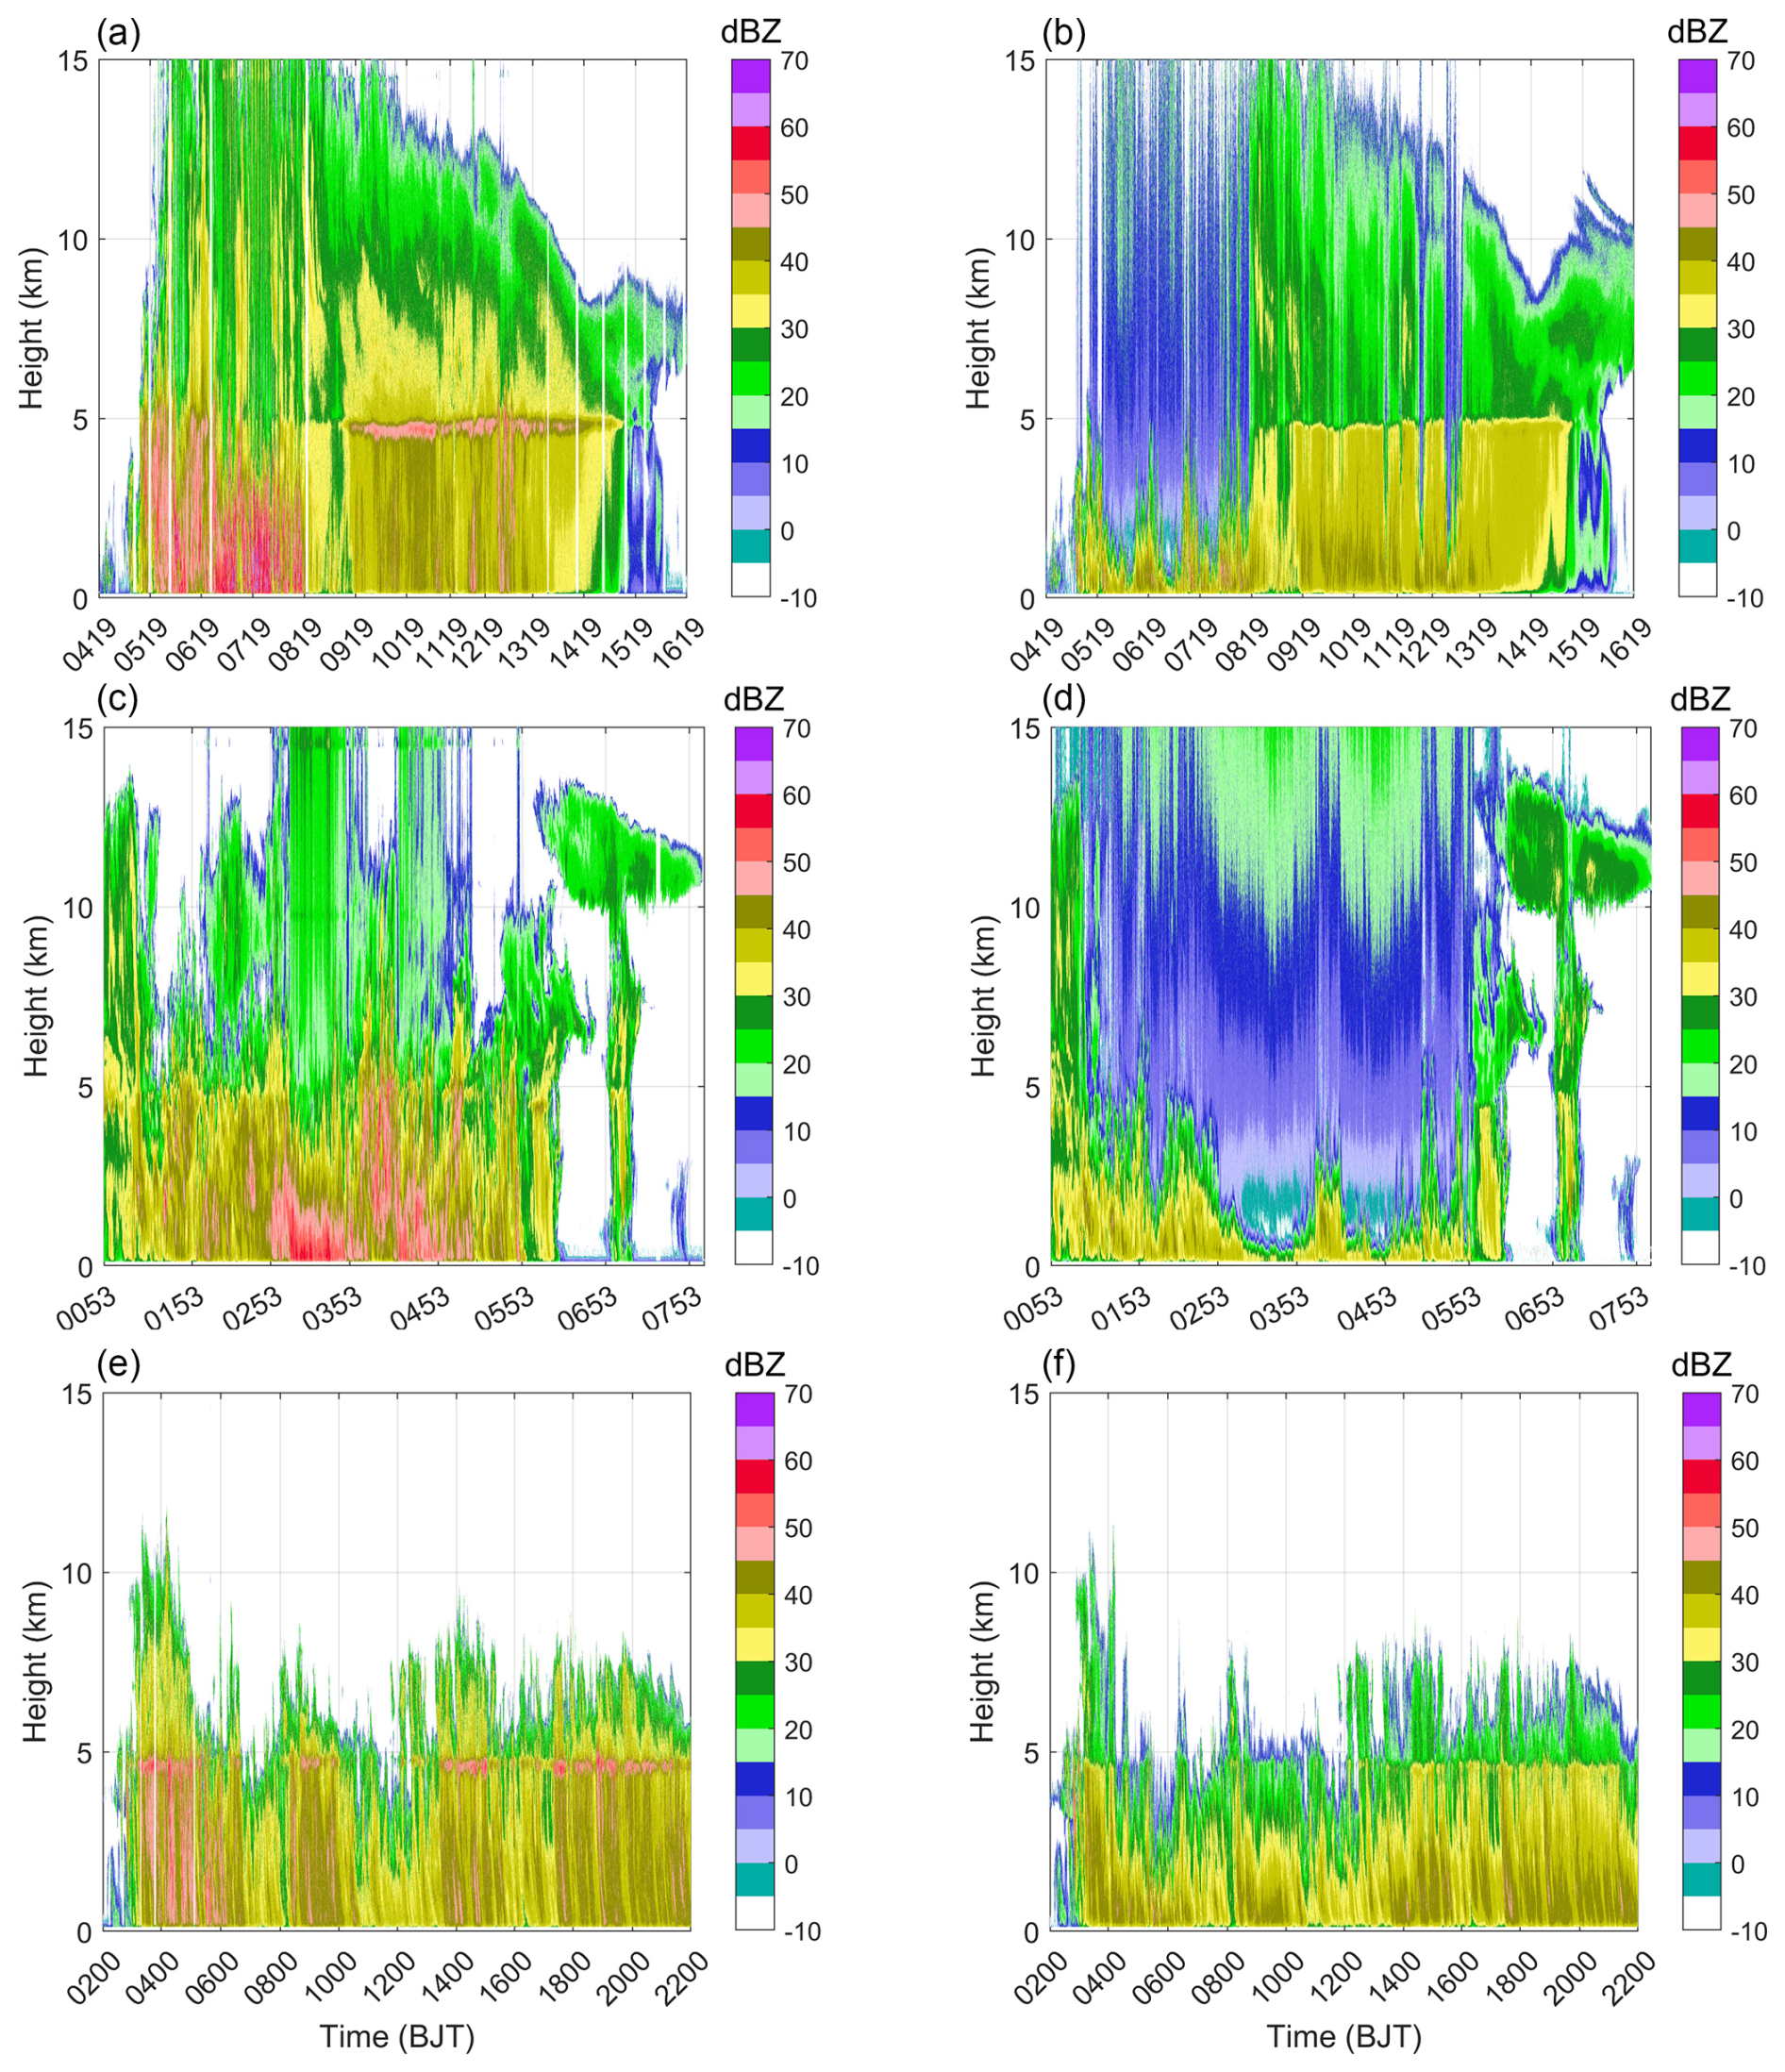
Figure 3Time-height indicator of the dual-frequency radar reflectivity (X-band: a, c, e; Ka-band: b, d, f; a, b: 11 June 2022; c, d: 11 May 2022; e, f: 1 May 2022). The height of the melting layer bright band indicates that the zero-degree layer is approximately 5 km.
In order to ensure comprehensive coverage of various precipitation types, we utilizes observation data from 1 and 11 May 2022, 11 June 2022, and 14 June 2025. The 2022 datasets are employed to construct the raindrop size distribution retrieval model, while the observation data from 14 June 2025, serve for model validation. The case on 1 May 2022 was dominated by stratiform precipitation, while the case on 11 May 2022 was dominated by convective precipitation. The 11 June 2022 case evolved from convective to stratiform precipitation as the convective activity gradually weakened.
Taking the case on 11 June 2022 as an example, the X-band exhibits less attenuation than the Ka-band. As a result, a pronounced bright band near the melting layer is evident at X-band in the stratiform precipitation (Fig. 3a), whereas the corresponding feature is barely discernible at Ka-band (Fig. 3b). Junyent et al. (2019) found that Mie scattering at X-band becomes significant only when raindrop diameters exceed approximately 6 mm. Chudler et al. (2022) found that raindrops exceeding 4.5 mm in diameter primarily form through the melting of hail and graupel, not the warm-rain process. As no hail or graupel was observed during either event, Mie scattering at X-band is expected to be negligible. Therefore, the X-band reflectivity is primarily influenced by rain attenuation, while Ka-band reflectivity is affected by both attenuation and Mie scattering.
Figure 4 shows the ground-measured rain rate, Dm and Nw for the three precipitation events, including both extreme precipitation with hourly rain rate exceeding 100 mm h−1 (Fig. 4a: 05:19–07:19 BJT; Fig. 4b: 02:53–04:53 BJT) and stable stratiform precipitation (Fig. 4a: 08:19–10:19 BJT; Fig. 4c: 08:00–22:00 BJT).
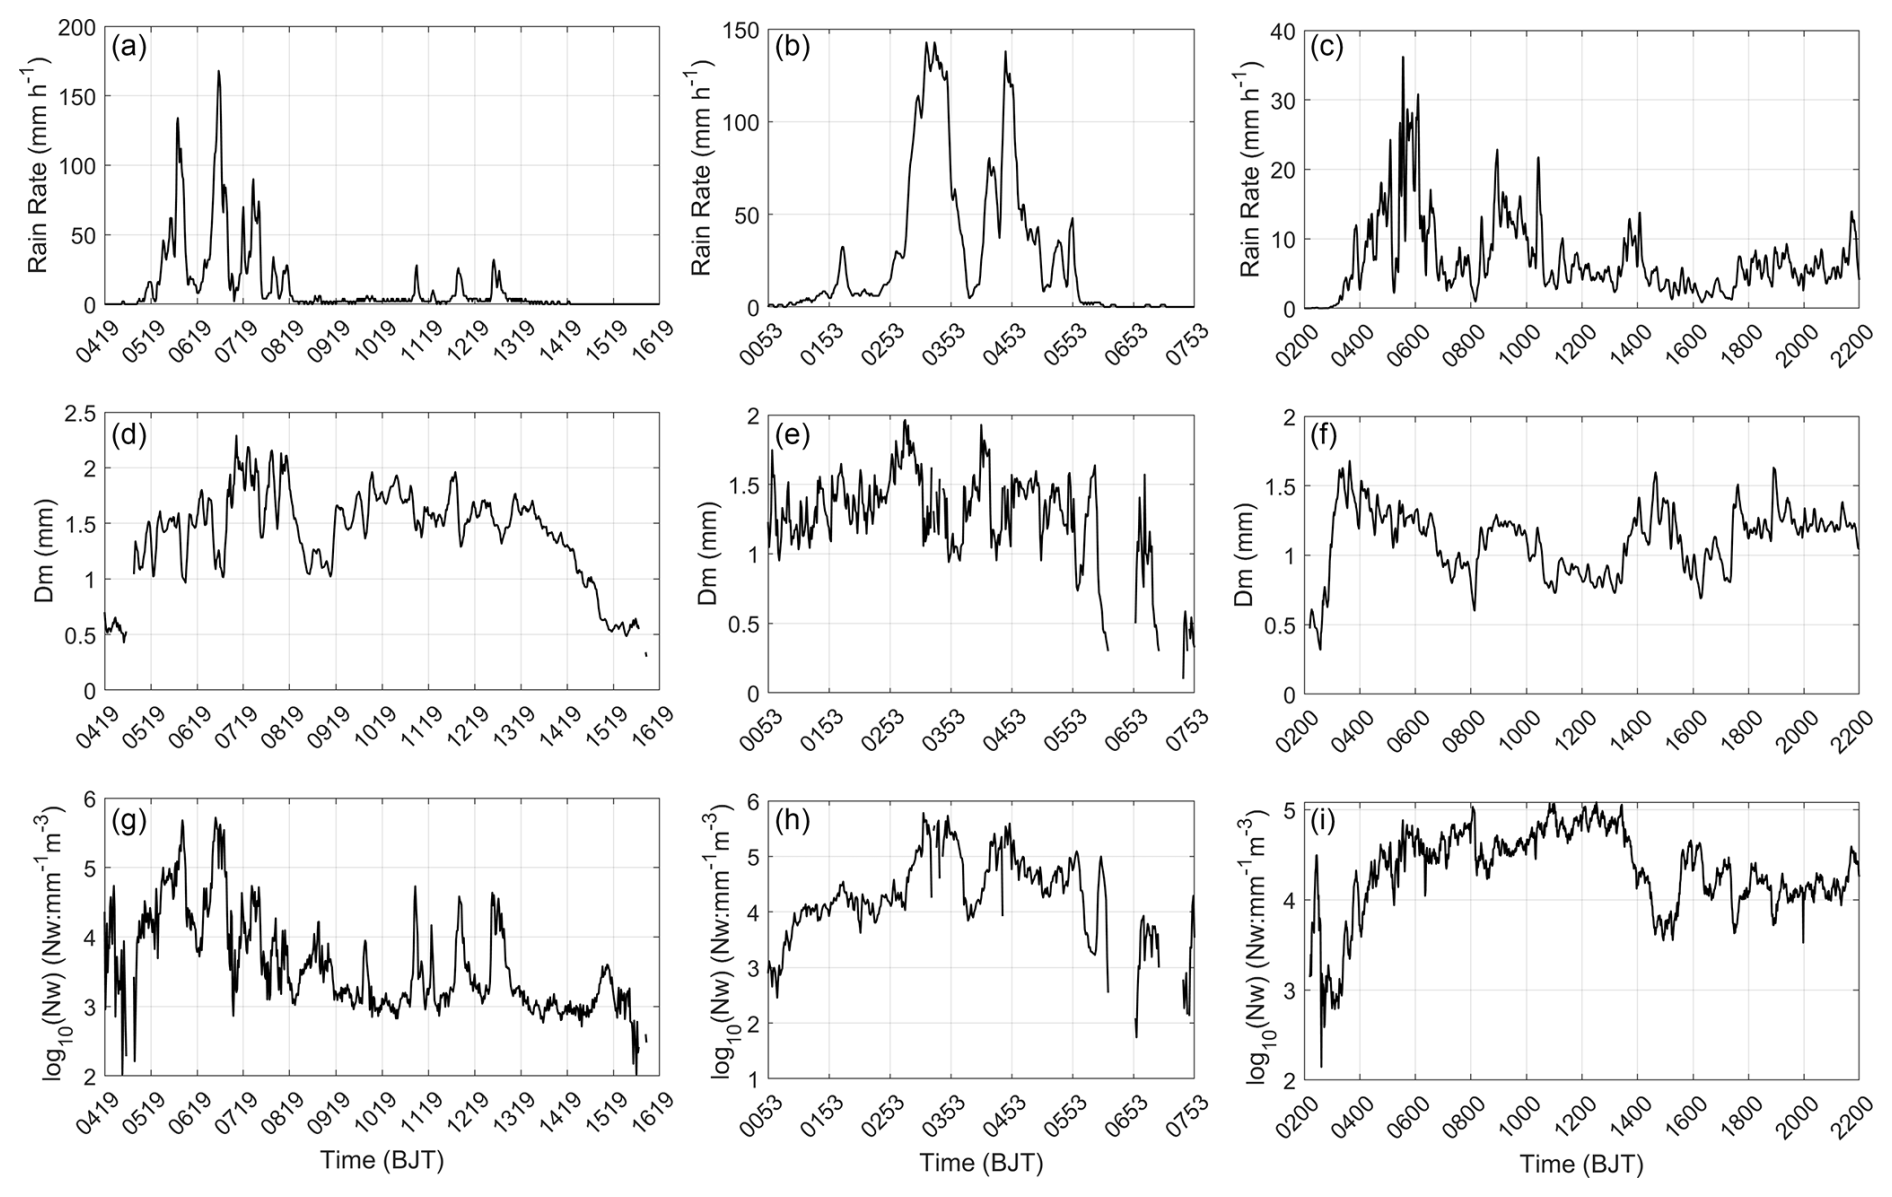
Figure 4Time series plots of ground-observed rain rate (a–c), mass-weighted mean diameter (Dm, d–f), and normalized intercept parameter (Nw, g–i) (a, d, g: 11 June 2022; b, e, h: 11 May 2022; c, f, i: 1 May 2022).
The X/Ka reflectivity is corrected for attenuation by applying the differential specific attenuation (Meneghini et al., 1992). The differential specific attenuation of the X/Ka-band is defined as:
where r1, r2 represent the near and far ends of the radar beam path, respectively. ZKa-obs(r1) and ZKa-obs(r2) denote the Ka-band observed reflectivity at the near and far ranges, while ZX-obs(r1) and ZX-obs(r2) denote the corresponding X-band observed reflectivity. The relationships between the specific attenuation at X-band (AX), Ka-band (AKa), and k(X, Ka) are estimated by scattering simulation based on measured DSDs (Fig. 5).
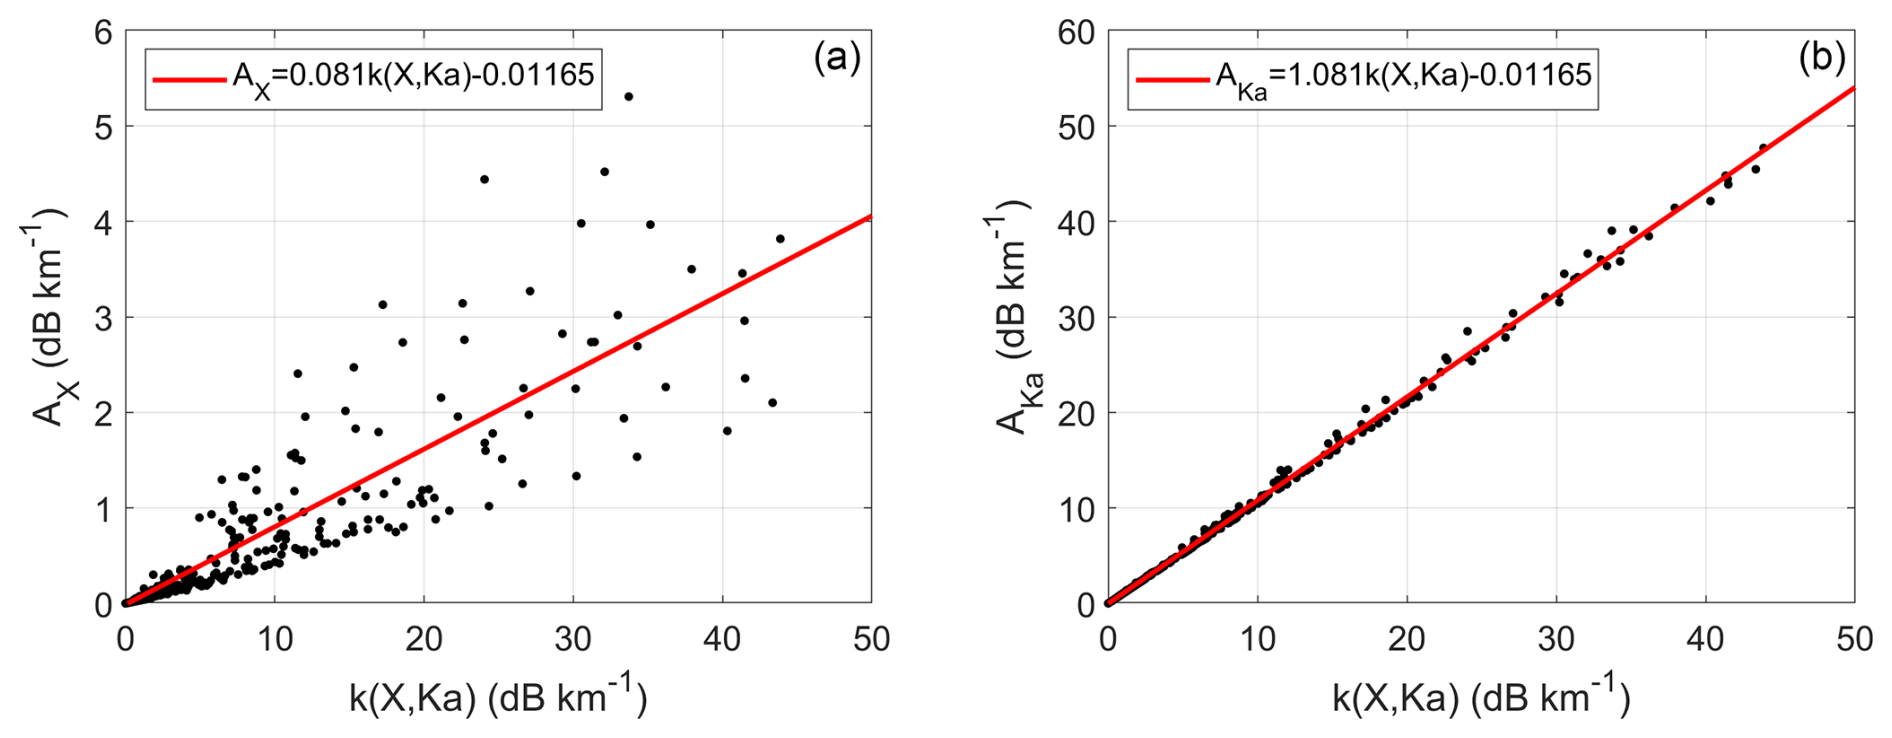
Figure 5Scatterplots of the differential specific attenuation [k(X, Ka)] and specific attenuation (a: AX, b: AKa).
The differential specific attenuation formula provides accurate results when hydrometeors are relatively small and Mie scattering is negligible at both X- and Ka-band. However, in the presence of larger particles where Mie scattering becomes significant at Ka-band, the differential specific attenuation tends to be overestimated, leading to inflated values of AX and AKa. To address this, the attenuation correction procedure for X/Ka dual-frequency radar should be constrained by theoretical DFR(X, Ka) values obtained from fitted scattering simulation results.
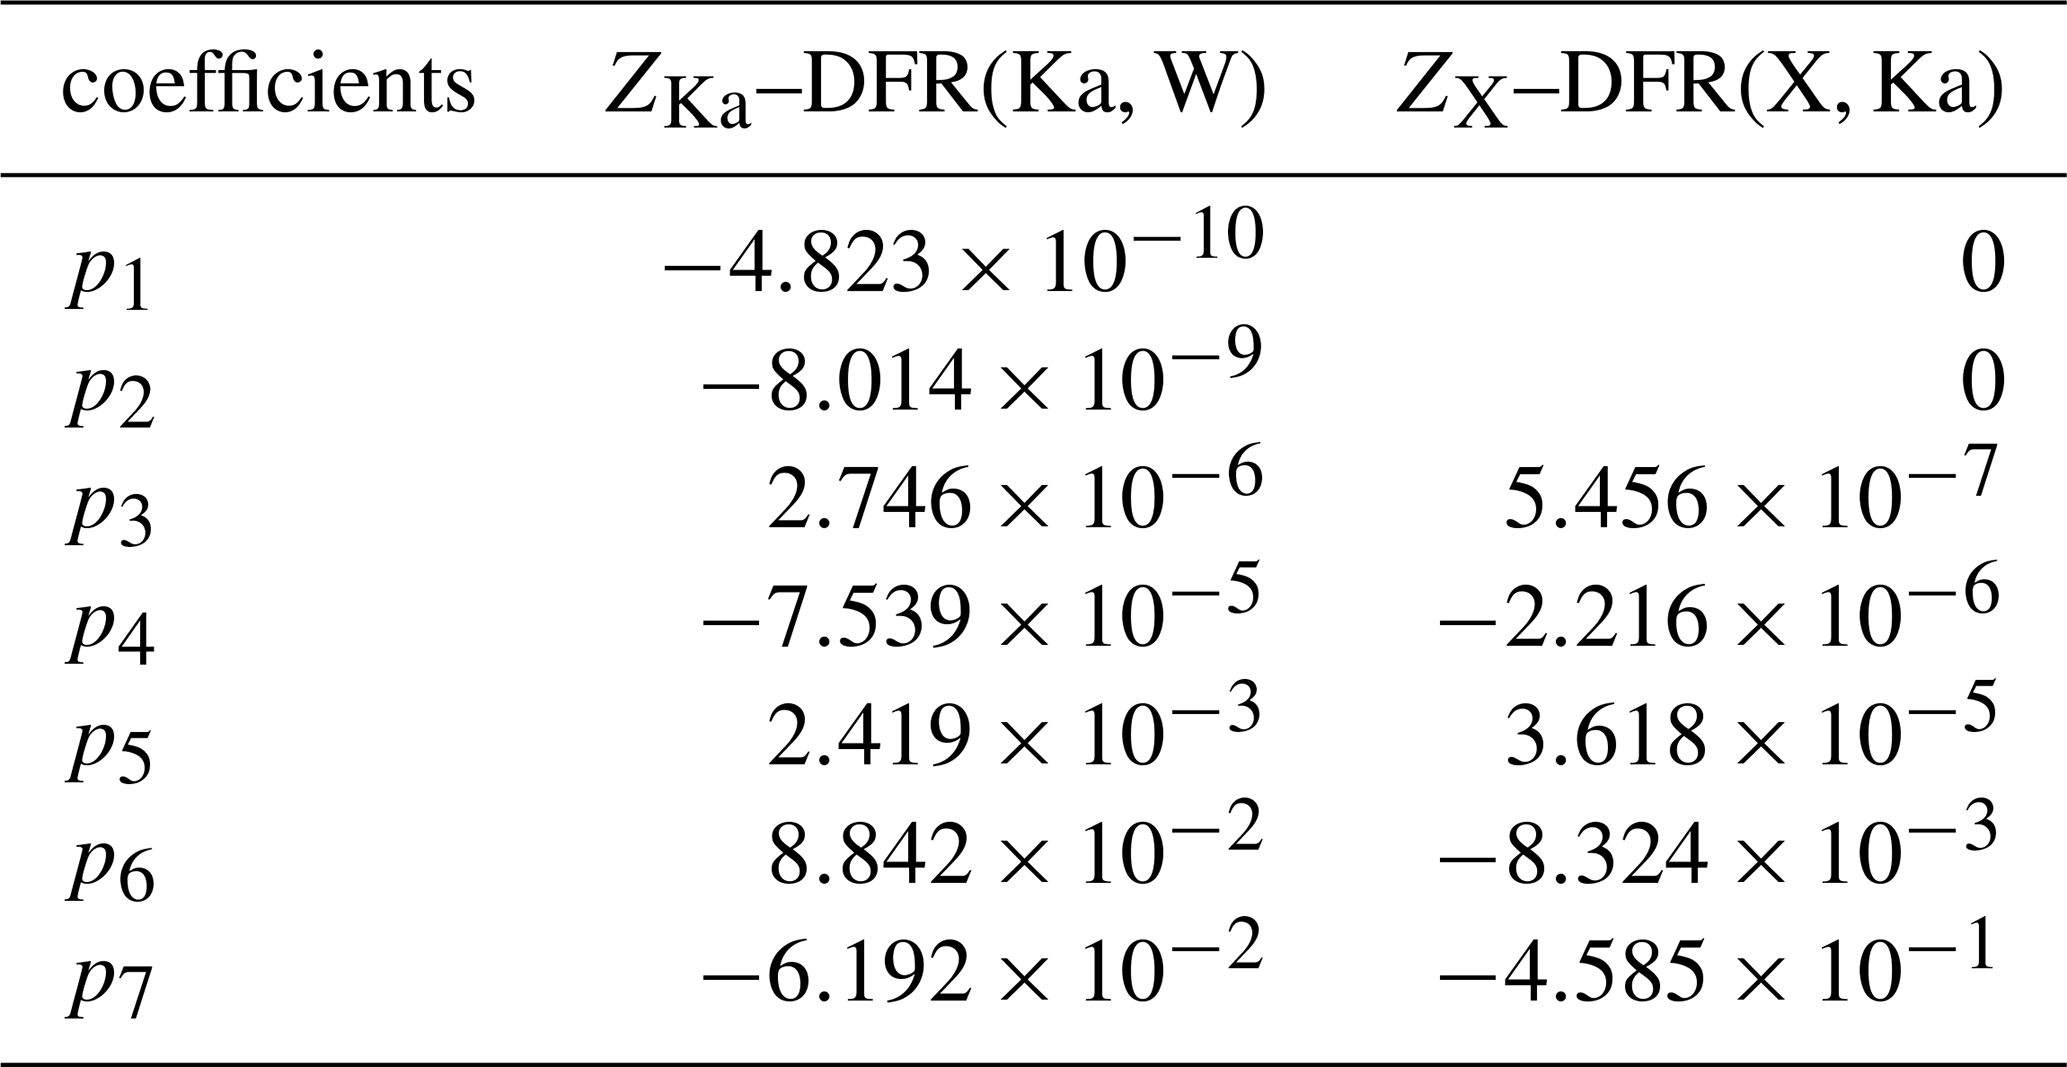
Furthermore, to reduce the ambiguity of DFR(X, Ka)–Dm, theoretical DFR(Ka, W) are similarly obtained and used to retrieve Dm when DFR(X, Ka) is less than 0 (Sect. 3.5). The scattering simulation results and fitted curves are illustrated in Fig. 6, and the corresponding polynomial coefficients are listed in Table 3.
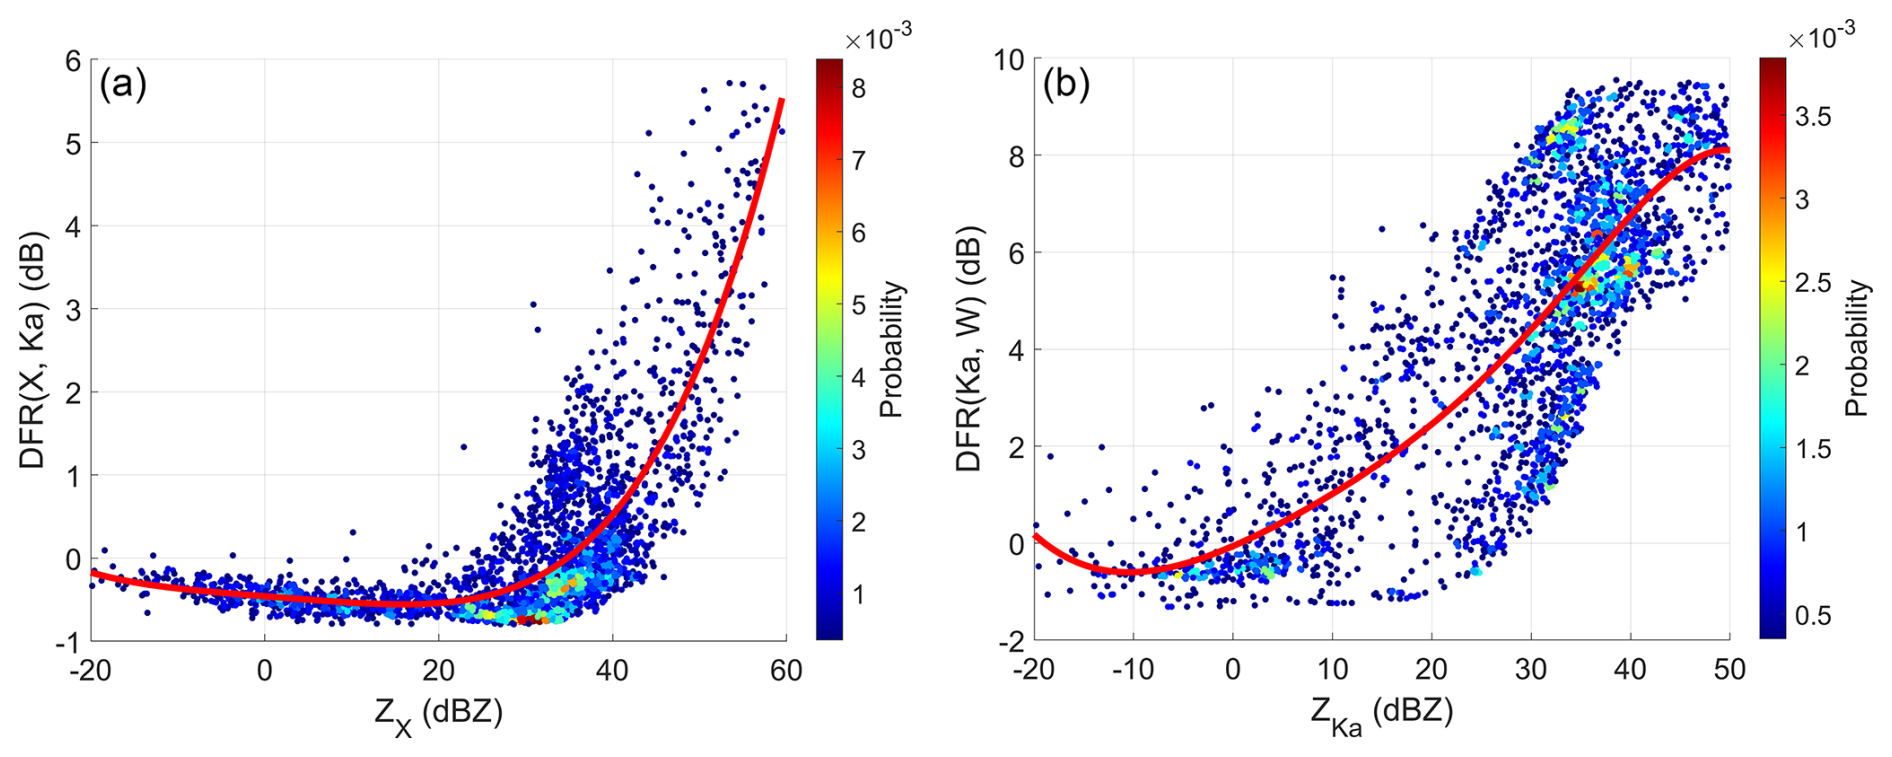
Figure 6Scatterplots of the X-band reflectivity (ZX) and X/Ka dual-frequency ratio [DFR(X, Ka)]; the Ka-band reflectivity (ZKa), and Ka/W dual-frequency ratio [DFR(Ka, W)]. The red curve represents the polynomial fit.
Since this study focuses on retrieving raindrop size distributions, all figures presented herein display physical parameters exclusively below the melting layer. As shown in Fig. 7, the corrected reflectivities at X- and Ka-band exhibit improved consistency within weak echo regions. In contrast, within strong echo zones, the corrected X-band reflectivity exceeds that at Ka-band, which aligns with theoretical expectations that the dual-frequency ratio increases with reflectivity. Additionally, a bright band feature is evident near the melting layer in the corrected Ka-band reflectivity (Fig. 7b). A similar effect was observed on 1 May 2022 (Fig. 7f), further supporting the physical consistency and accuracy of the attenuation correction.
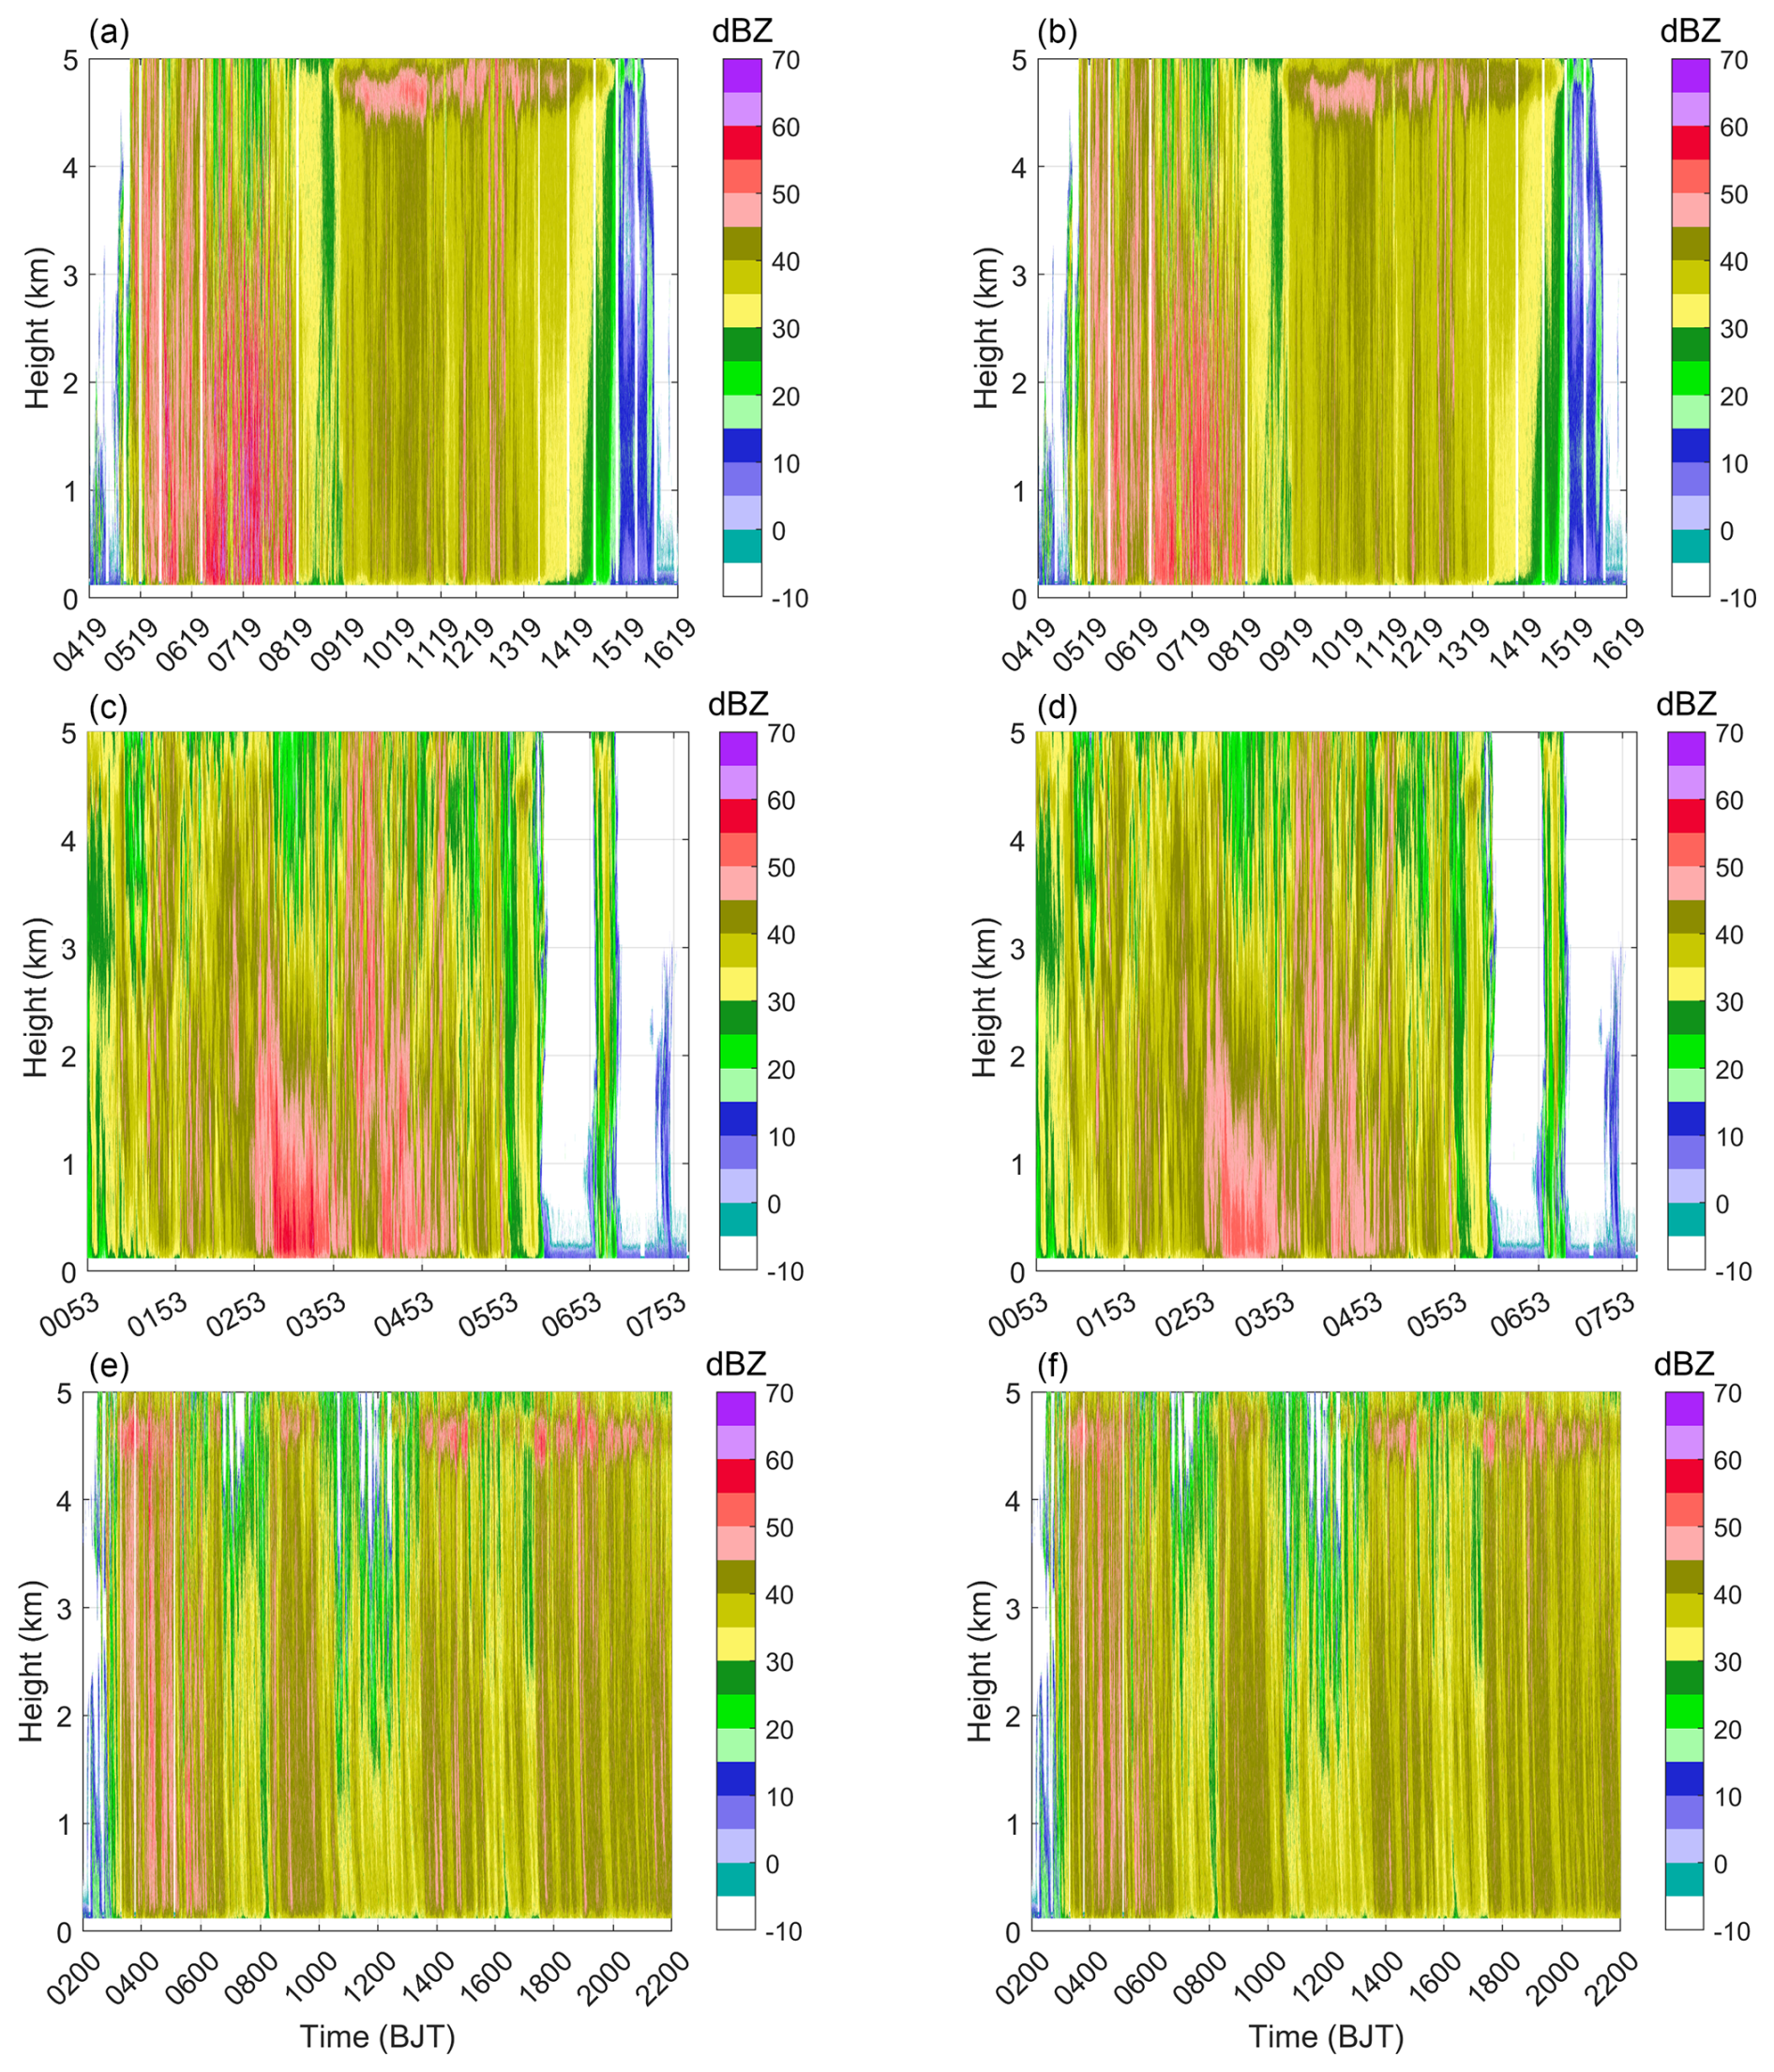
Figure 7Corrected reflectivity of the dual-frequency radar (X-band: a, c, e; Ka-band: b, d, f; a, b: 11 June 2022; c, d: 11 May 2022; e, f: 1 May 2022).
The corrected reflectivities were validated against the theoretical reflectivity values derived from ground-based raindrop size distributions measurements. The X/Ka dual-frequency radar begins recording at the fourth gate (gate length: 30 m) and the reflectivity at 120 m is taken as an approximation of the ground-level value. As shown in Fig. 8a, the X-band reflectivity exhibits negligible attenuation and closely agrees with the values calculated from raindrop size distributions. While the Ka-band reflectivity suffers marked attenuation (especially above 30 dBZ, Fig. 8b), the corrected results demonstrate close agreement with theoretical values.
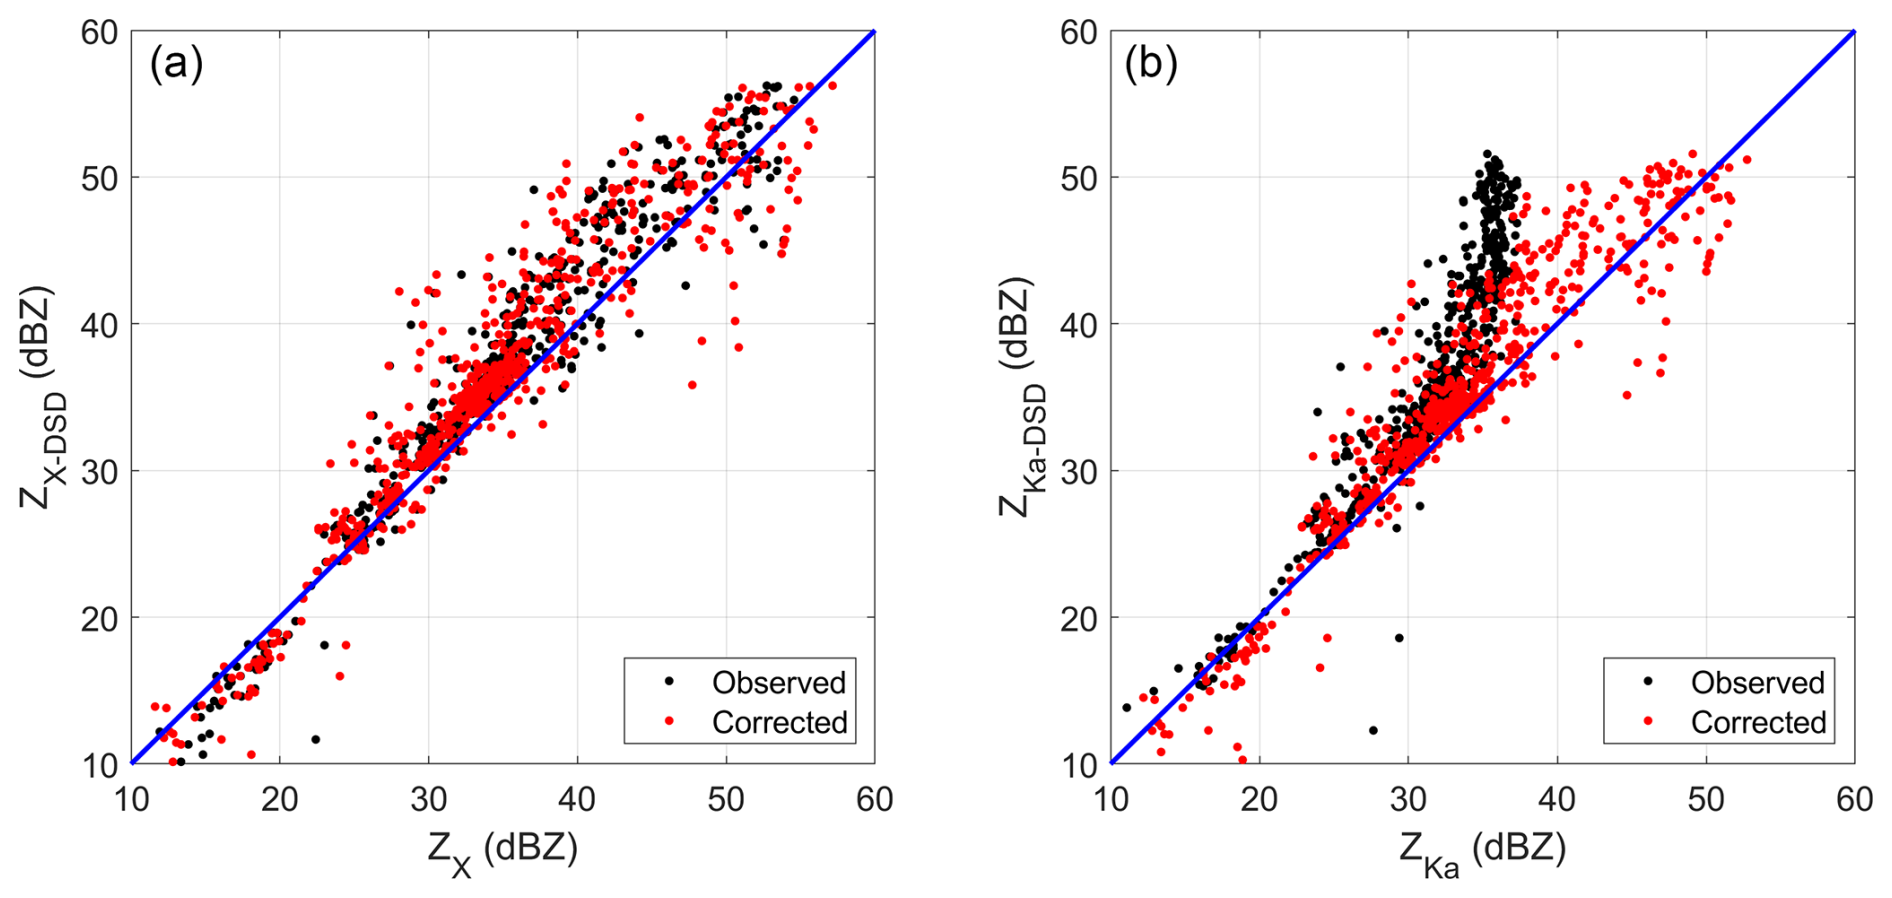
Figure 8The comparison between the observed and corrected reflectivity values for X-band (ZX) and Ka-band (ZKa) at 120 m height and the corresponding reflectivity derived from measured raindrop size distributions (ZX-DSD, ZKa-DSD).
The performance of the attenuation correction was quantitatively evaluated using the mean bias (MB), mean absolute error (MAE), root mean square error (RMSE) and correlation coefficient (CC), defined as follows:
where Ei is the observed or corrected value, Ti is the true value, and is the mean value, and n is the total sample size.
As presented in Table 4, the corrected Ka-band reflectivity (ZKa-cor) aligns much more closely with theoretical values than the observed reflectivity (ZKa-obs). This improvement is evidenced by a significant reduction in MB, along with decreased MAE and RMSE, and an increased CC.
Table 4Error statistics of Ka-band reflectivity before and after correction.

Using the accurately corrected X- and Ka-band reflectivity, the DFR(X, Ka) and DFR(Ka, W) are obtained (Fig. 9). The results show that DFR(Ka, W) has a broader dynamic range than DFR(X, Ka), and regions of high values coincide for both ratios.

Figure 9Time-height indicator of the dual-frequency ratio [DFR(X, Ka): a, c, e; DFR(Ka, W): b, d, f; a, b: 11 June 2022; c, d: 11 May 2022; e, f: 1 May 2022].
3.4 Sensitivity Analysis of μ
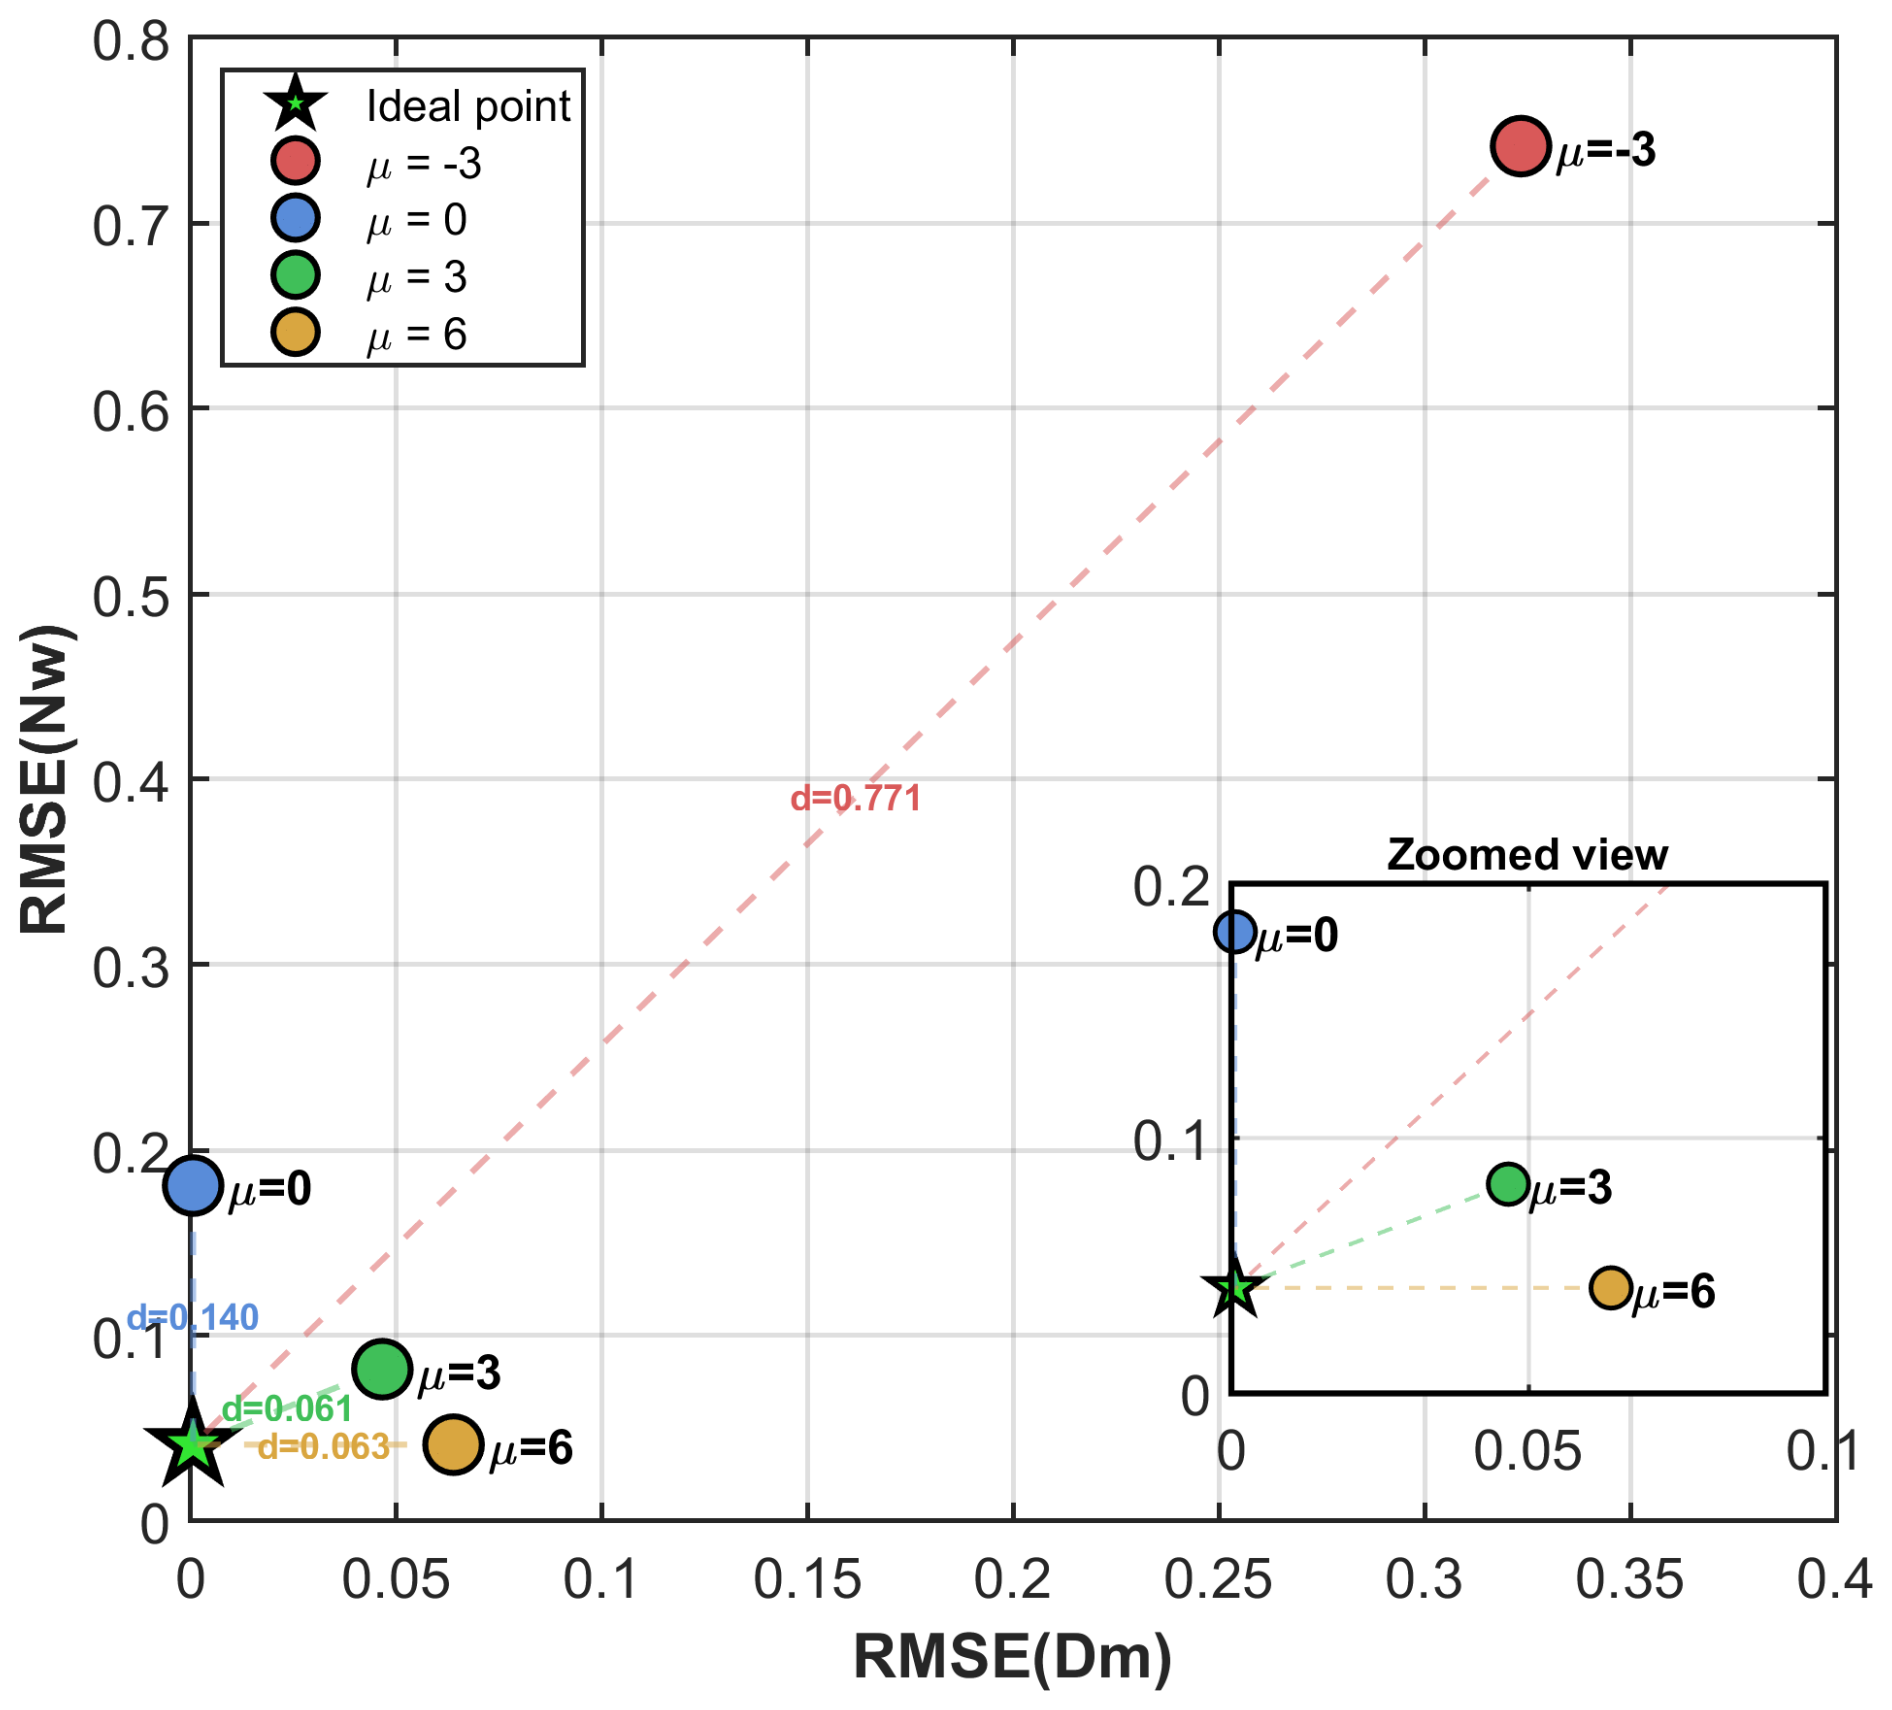
The setting of the shape parameter (μ) can influence the retrieval results. To minimize retrieval errors, the optimal value of μ was determined through sensitivity tests. As shown in Fig. 10a, the retrieval error for Dm is smallest when μ=0, and gradually increases as μ takes values of 3 and 6, though the differences among these positive values are not substantial. In contrast, Fig. 10b shows that the retrieval error for Nw decreases progressively as μ increases, with μ=3 and μ=6 yielding notably smaller errors than μ=0. The corresponding statistical results are summarized in Table 5.
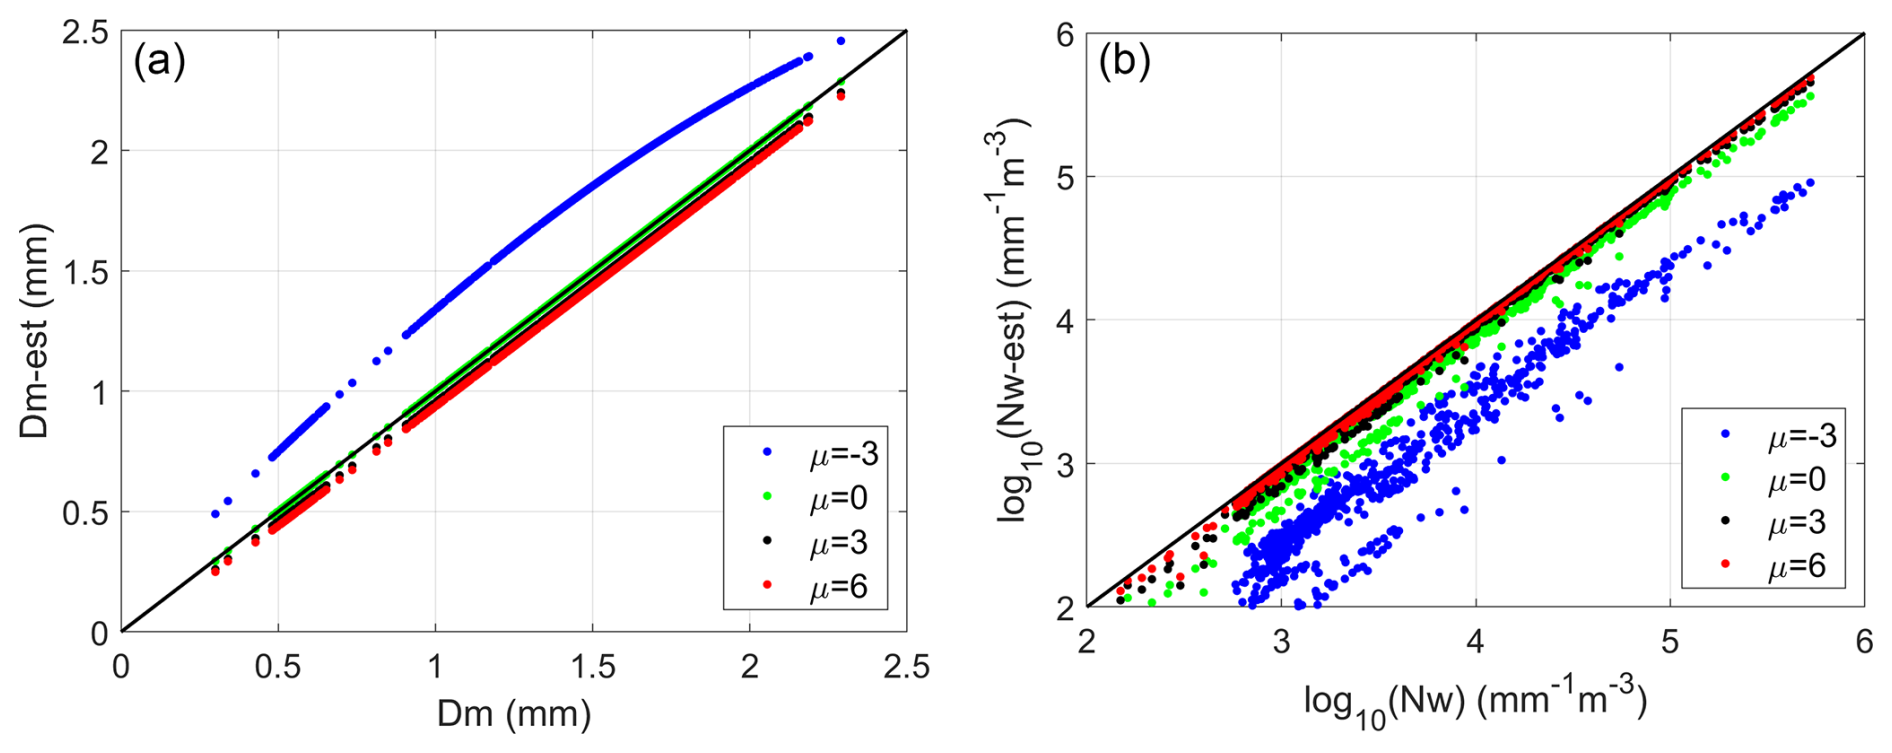
Table 5Retrieval errors of Dm and Nw for different values of μ.
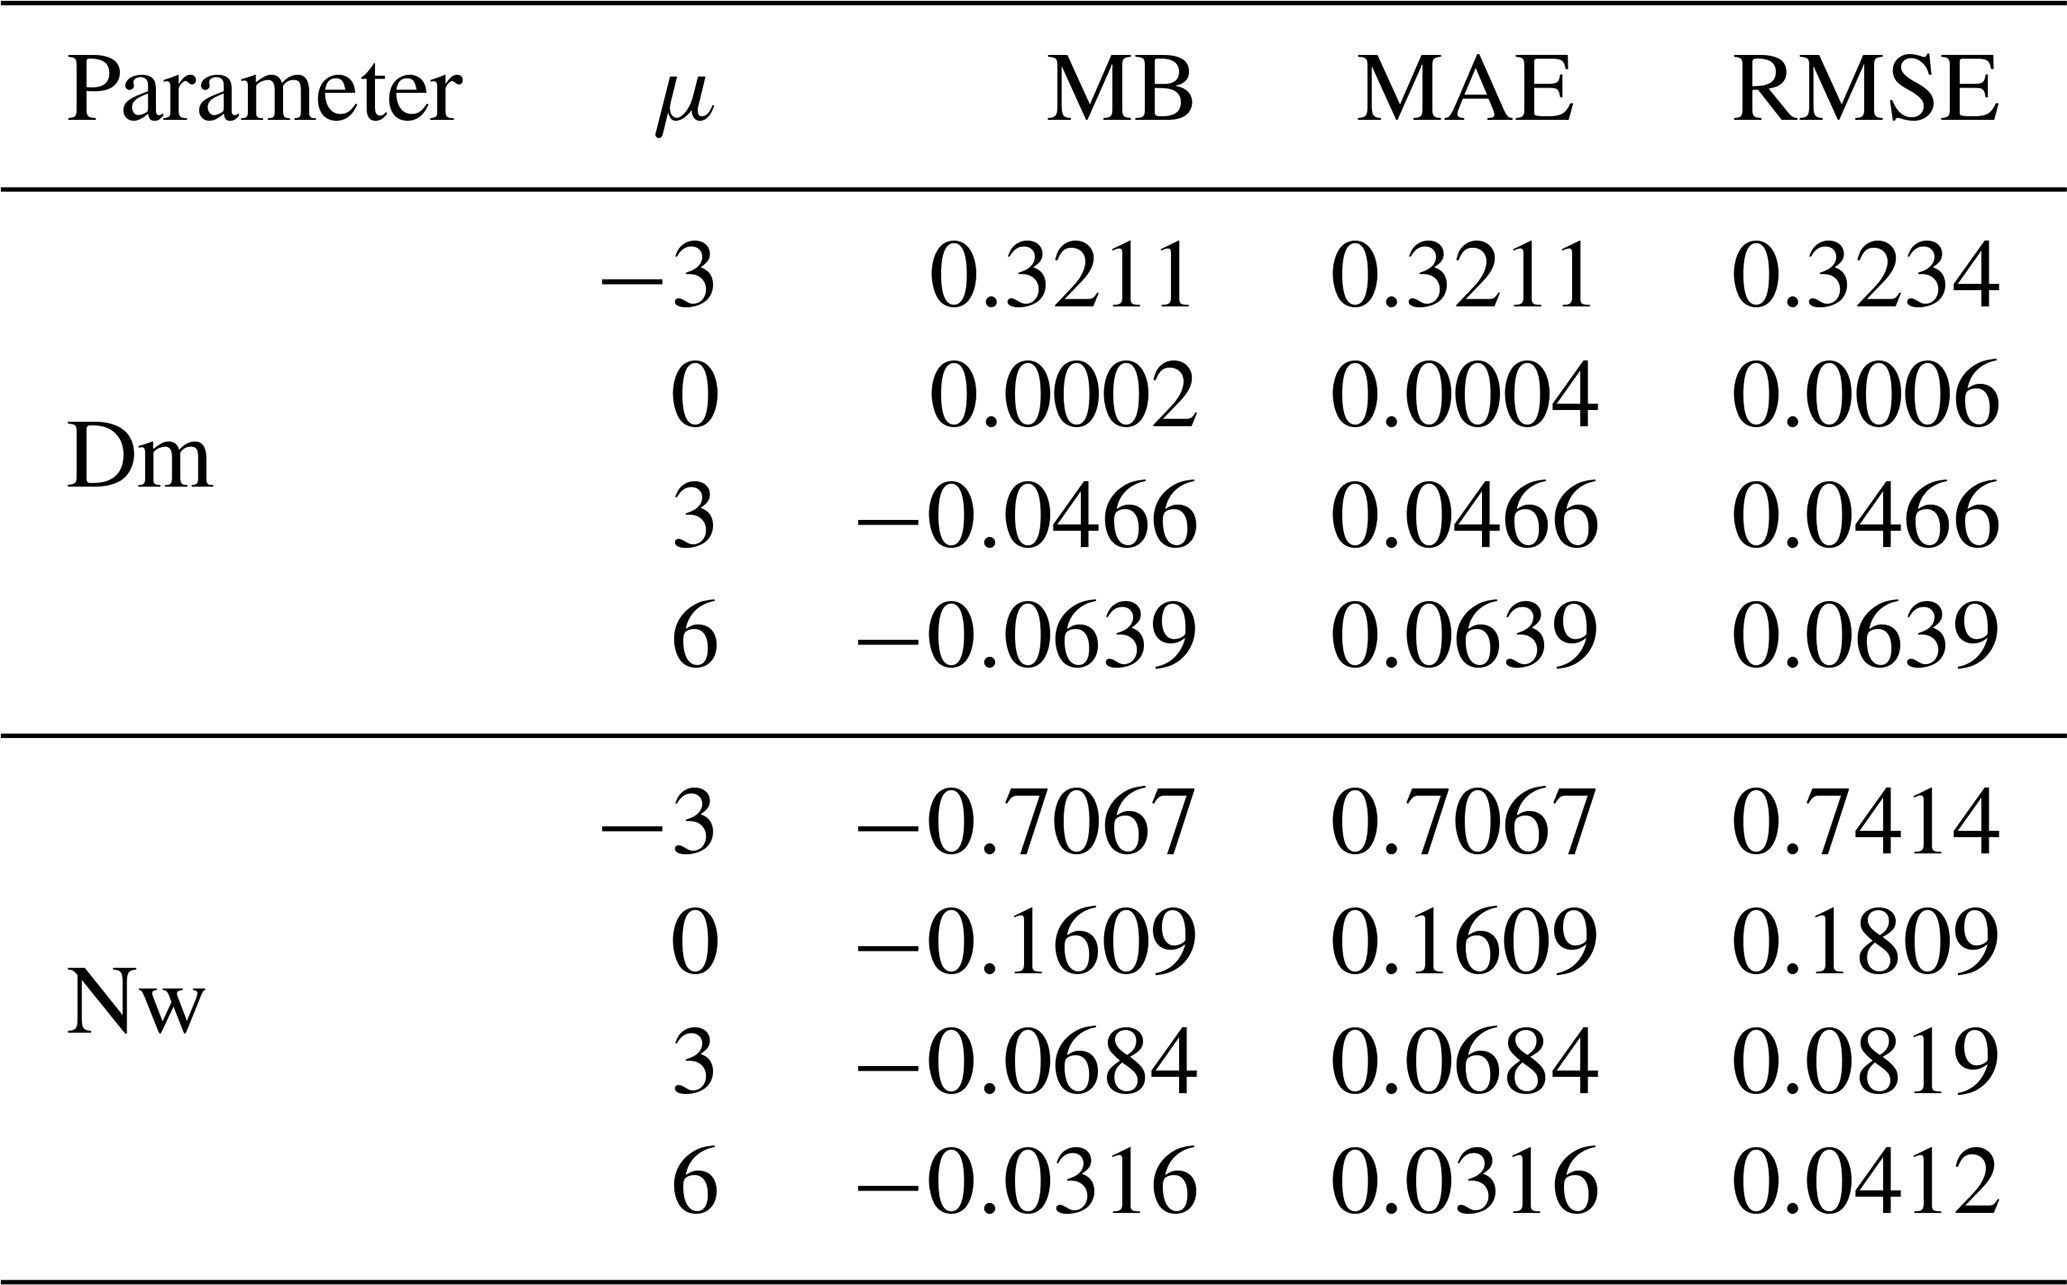
Although a full DSD reconstruction error metric would be desirable, the primary purpose of the retrieval framework is to estimate Dm and Nw, which are the governing parameters of the normalized gamma distribution. Therefore, Dm and Nw retrieval errors were selected as the optimization criteria in this study. To determine the optimal μ that minimizes the retrieval errors of both Dm and Nw against the ground-truth values, the Euclidean distance from each candidate μ to ideal point – serving as the cost function:
Here, and (Table 5), defining the coordinates of the ideal point in the objective space. The Euclidean distance between each candidate μ and ideal point is presented in Fig. 11. The results indicate that μ=3 corresponds to the shortest distance (0.061), closely followed by μ=6 (0.063), while exhibits the largest deviation. Therefore, μ=3 represents the optimal value that minimizes the retrieval errors of Dmand Nw, consistent with the value adopted by Meneghini et al. (2022).
3.5 Reduction of the Ambiguous Zone in the DFR–Dm Relationship
Based on scattering simulations using the measured DSDs, the true reflectivities at X-, Ka-, and W-bands (denoted as ZX, ZKa, and ZW) were derived. These values were then used to compute the corresponding dual-frequency ratios [DFR(X, Ka) and DFR(Ka, W)]. As noted earlier, the relationship between DFR and Dm exhibits ambiguity when DFR is less than 0. This issue is illustrated in Fig. 12a: while a unique Dm value corresponds to each positive DFR, an ambiguous zone emerges (marked by dashed lines in Fig. 12a) for negative DFR values, where a single DFR corresponds to two different Dm values. This region is referred to as the ambiguous zone in the study.
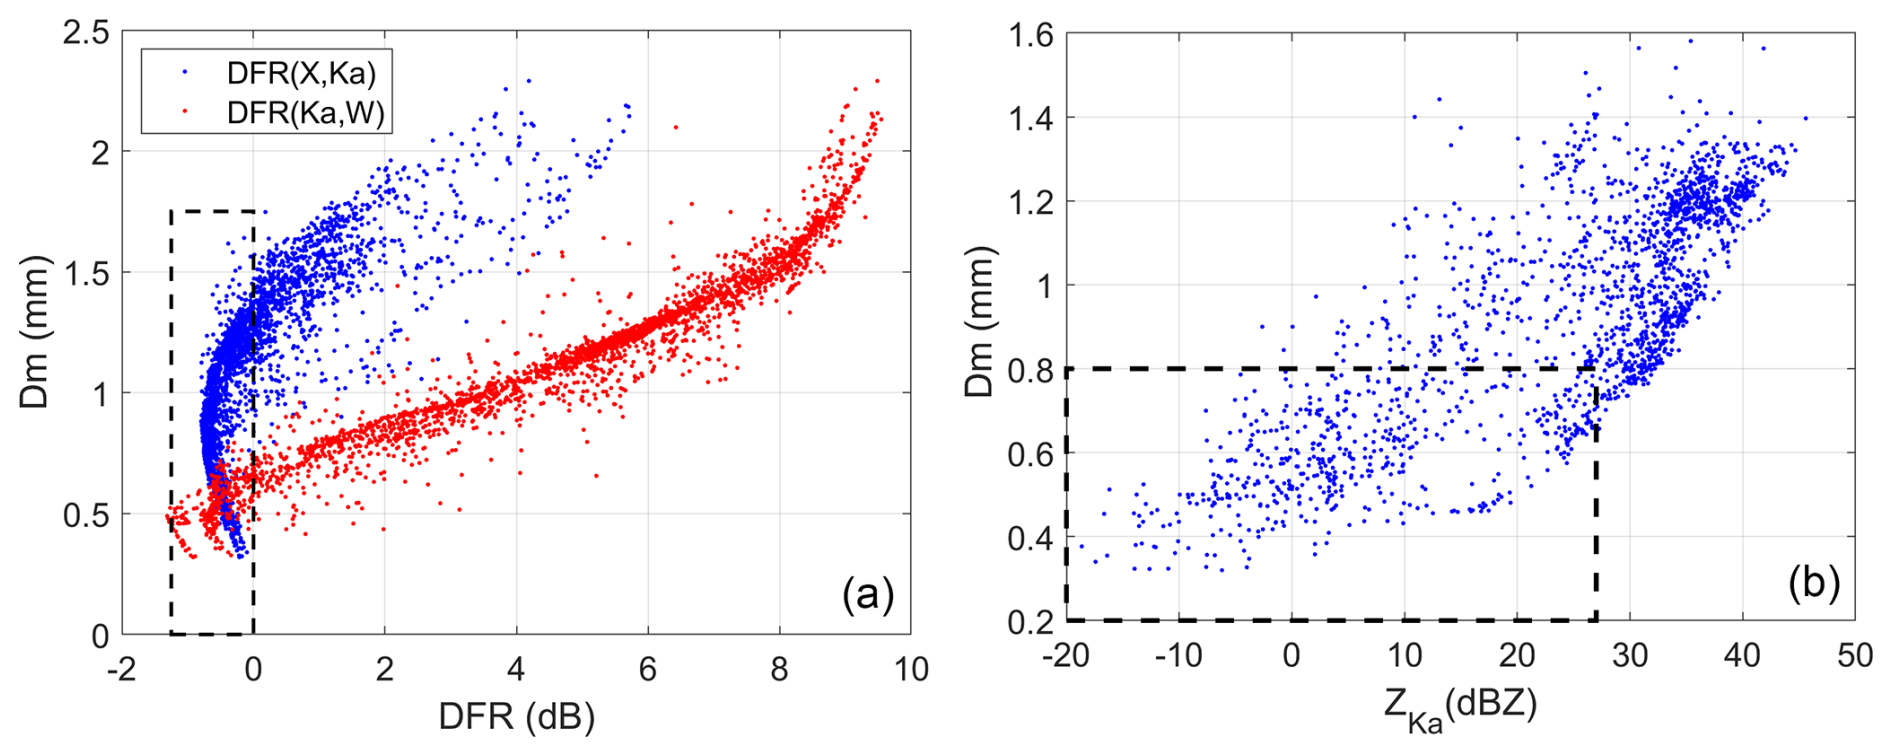
Figure 12Scattering simulation scatterplots. (a) The DFR–Dm where blue dots represent DFR(X, Ka) and red dots represent DFR(Ka, W). The black dashed area indicates the ambiguous zone when DFR≤0. (b) The ZKa–Dm scatterplots when DFR(X, Ka) ≤ 0, with the black dashed area representing the ZKa–Dm scatter plot when DFR(Ka, W) ≤ 0.
Although the DFR(Ka, W)–Dm relationship also contains an ambiguous zone, its range is substantially narrower than that of DFR(X, Ka). As shown in Fig. 12b, the ambiguous zone for DFR(Ka, W) is confined to a ZKa range of approximately −20 to 20 dBZ, corresponding to Dm values between 0.3 and 0.8 mm (dashed area). In comparison, the ambiguous zone for DFR(X, Ka) covers a much wider ZKa range of about −20 to 45 dBZ, corresponding to Dm values from 0.3 to 1.6 mm. Therefore, DFR(Ka, W) provides a effective constraint on Dm retrievals, particularly where DFR(X, Ka)–Dm is ambiguous. This result validates the strategy adopted in this study: using DFR(Ka, W) to resolve ambiguities in the DFR(X, Ka)–Dm relationship.
Table 6 summarizes the statistics of the DFR data used in this study. The results show that 1013 data points fall within the unambiguous zone of DFR(X, Ka) (>0), allowing unique retrieval of Dm. In comparison, the number increases significantly to 2505 for DFR(Ka, W) (>0), demonstrating that DFR(Ka, W) effectively narrows the ambiguity zone associated with DFR(X, Ka). Relying solely on DFR(X, Ka), only 35.38 % of the dataset yields a unique Dm solution. This proportion rises markedly to 87.5 % when the constraint from DFR(Ka, W) is incorporated. These results confirm that DFR(Ka, W) substantially reduces retrieval ambiguity and improves the robustness of Dm retrieval.

4.1 Retrieval of Dm
Given that DFR(Ka, W) exhibits a significantly narrower ambiguity zone than DFR(X, Ka), we leverage this characteristic to constrain and improve Dm retrieval. A combined approach has been formulated to resolve the ambiguity in the DFR(X, Ka)–Dm relationship. The derived relationship is presented in Fig. 13 and Eq. (19).
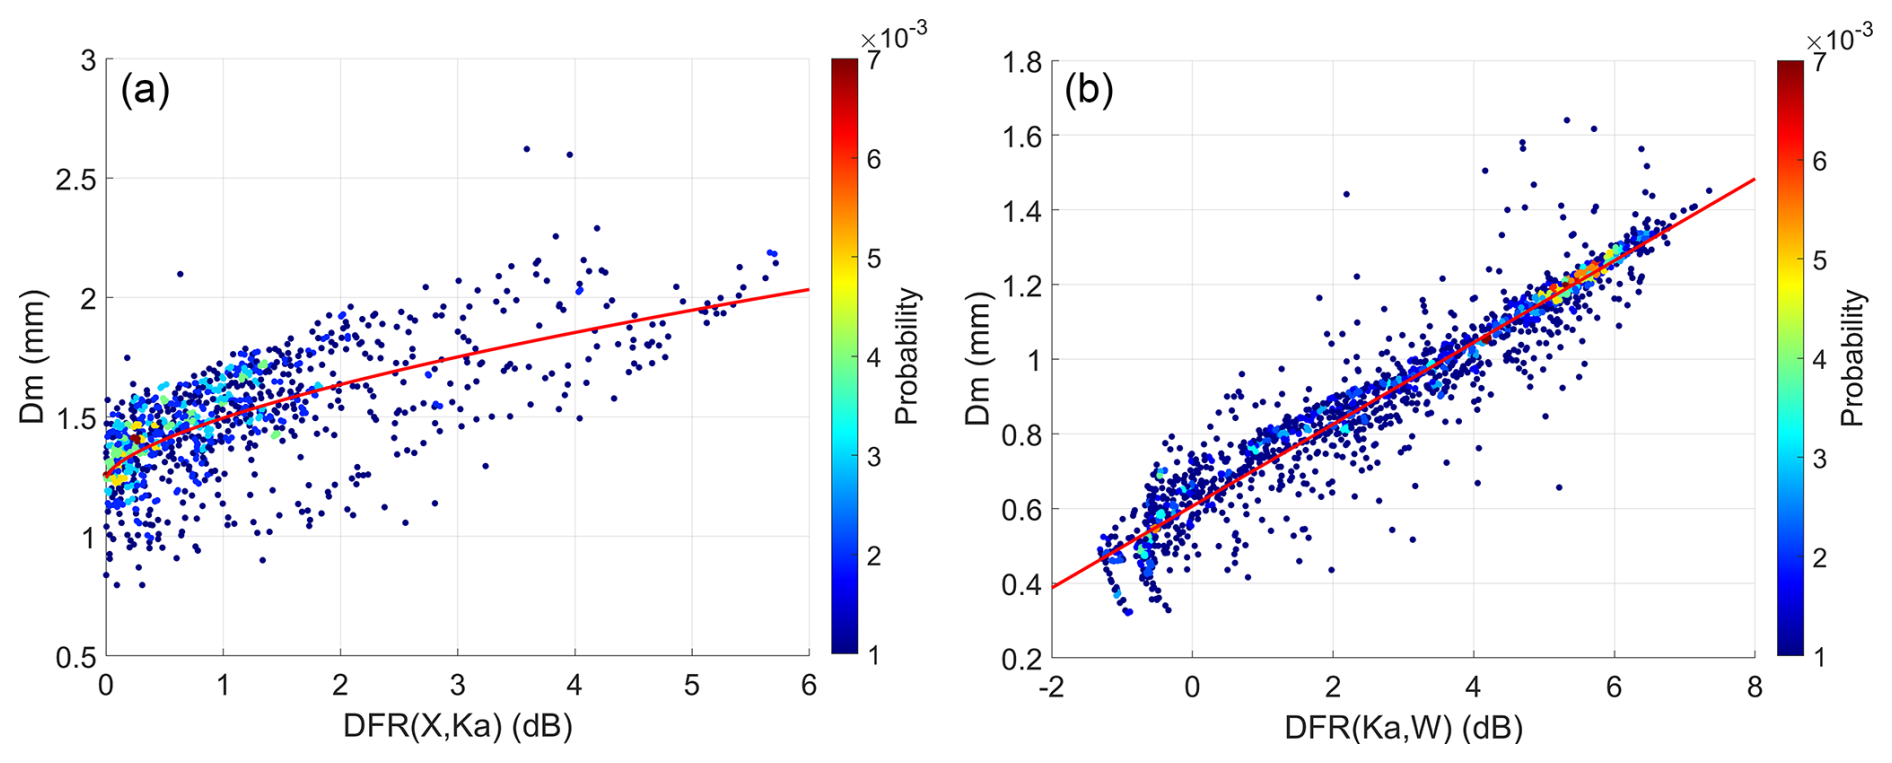
As shown in Fig. 13, the combination of DFR(X, Ka) and DFR(Ka, W) can accurately retrieve raindrops with Dm greater than 0.5 mm. Specifically, the DFR(Ka, W)–Dm accurately retrieves larger Dm values when DFR(Ka, W) is less than 0, with retrieval errors remaining only for raindrops smaller than 0.5 mm (Fig. 13b). Furthermore, as indicated in Fig. 14, rain rates do not exceed 0.6 mm h−1 when Dm is below 0.5 mm. Therefore, the retrieval error associated with DFR(Ka, W) in this range is almost negligible.
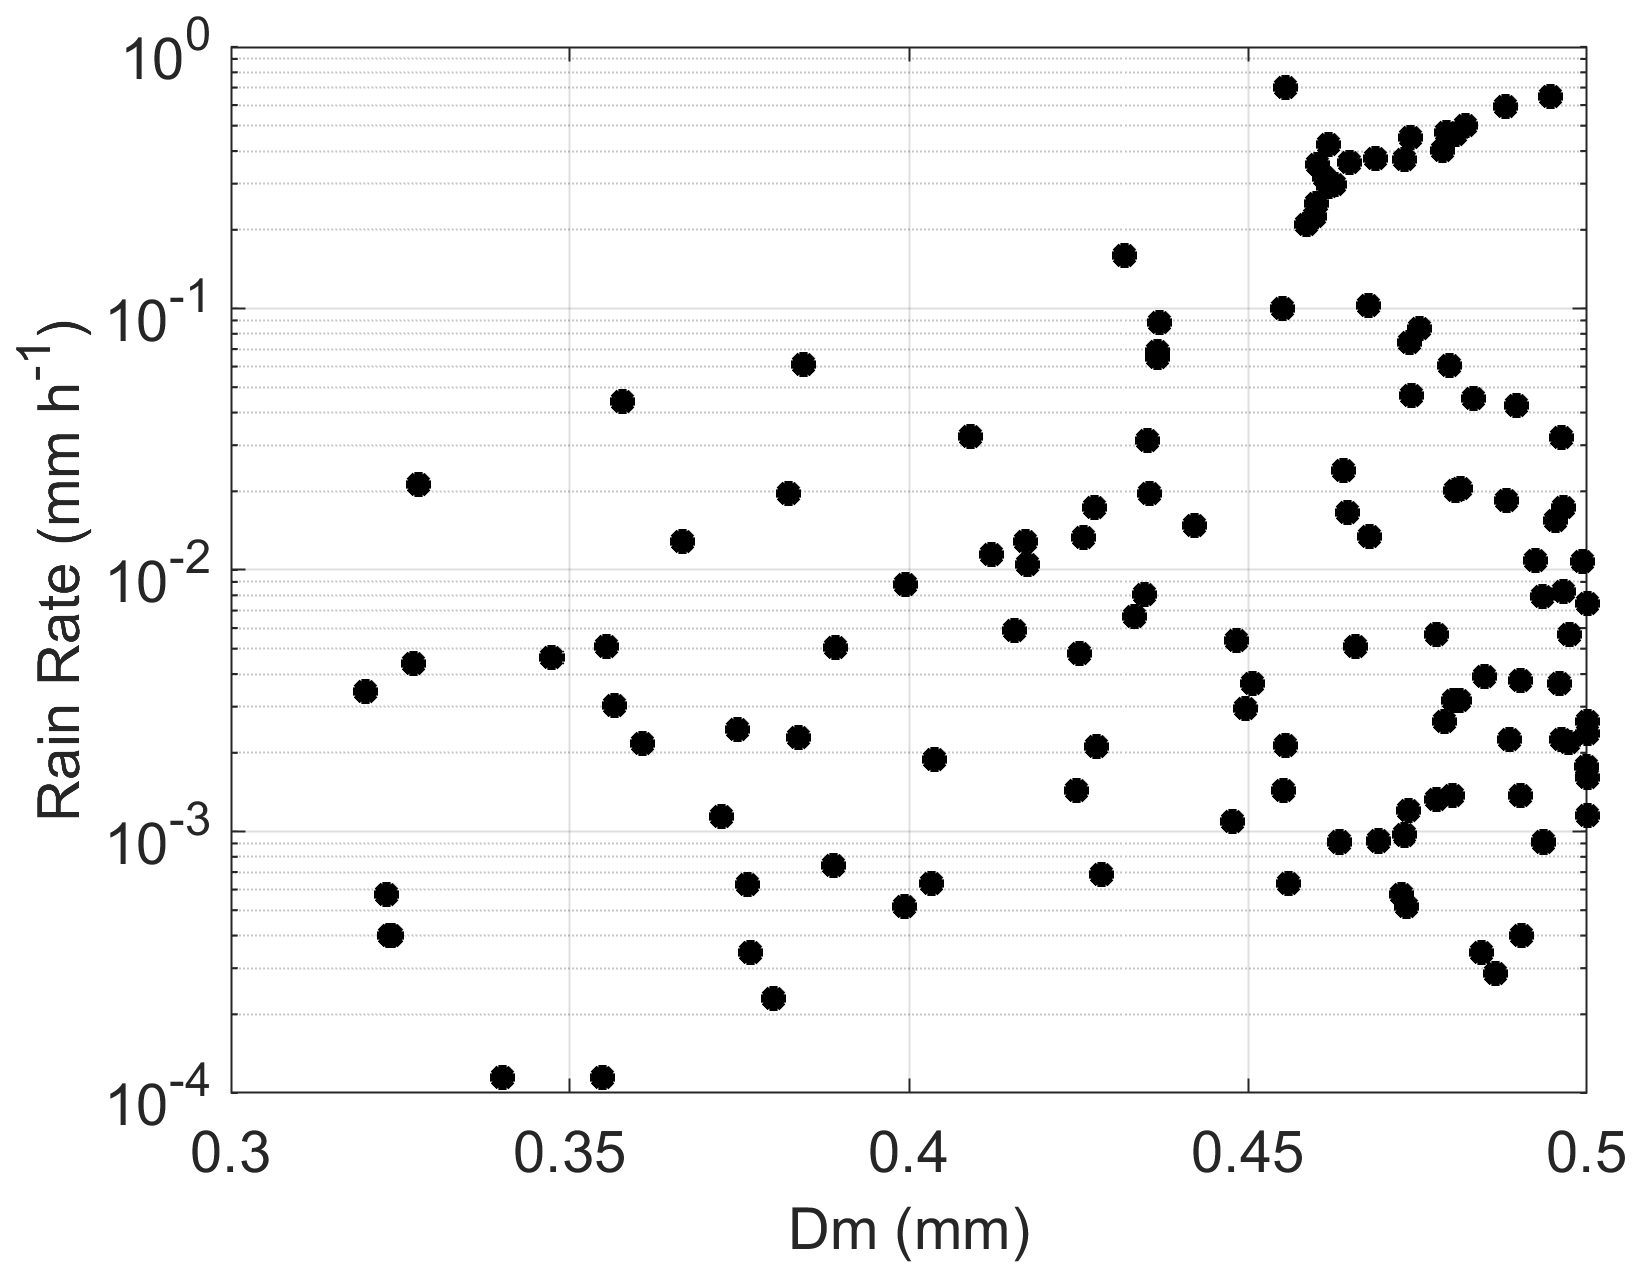
Figure 14Scatterplots of rain rate versus Dm when Dm is below 0.5 mm based on measrued DSDs.
4.2 Retrieval of Nw and LWC
The normalized intercept parameter (Nw) is retrieved by Eq. (5), which depends on both LWC and Dm. While Dm is retrieved through the combination of DFR(X, Ka) and DFR(Ka, W), the retrieval of LWC is still required. In this study, the method proposed by Oh et al. (2018) is adopted to estimate LWC from Ka-band reflectivity.
The fitted retrieval relationship between ZKa and LWC is presented in Fig. 15. This curve is derived from T-matrix scattering simulations based on measured raindrop size distributions. The monotonic and nonlinear nature of the ZKa–LWC relationship enables reliable LWC estimation over a broad dynamic range of the reflectivity.
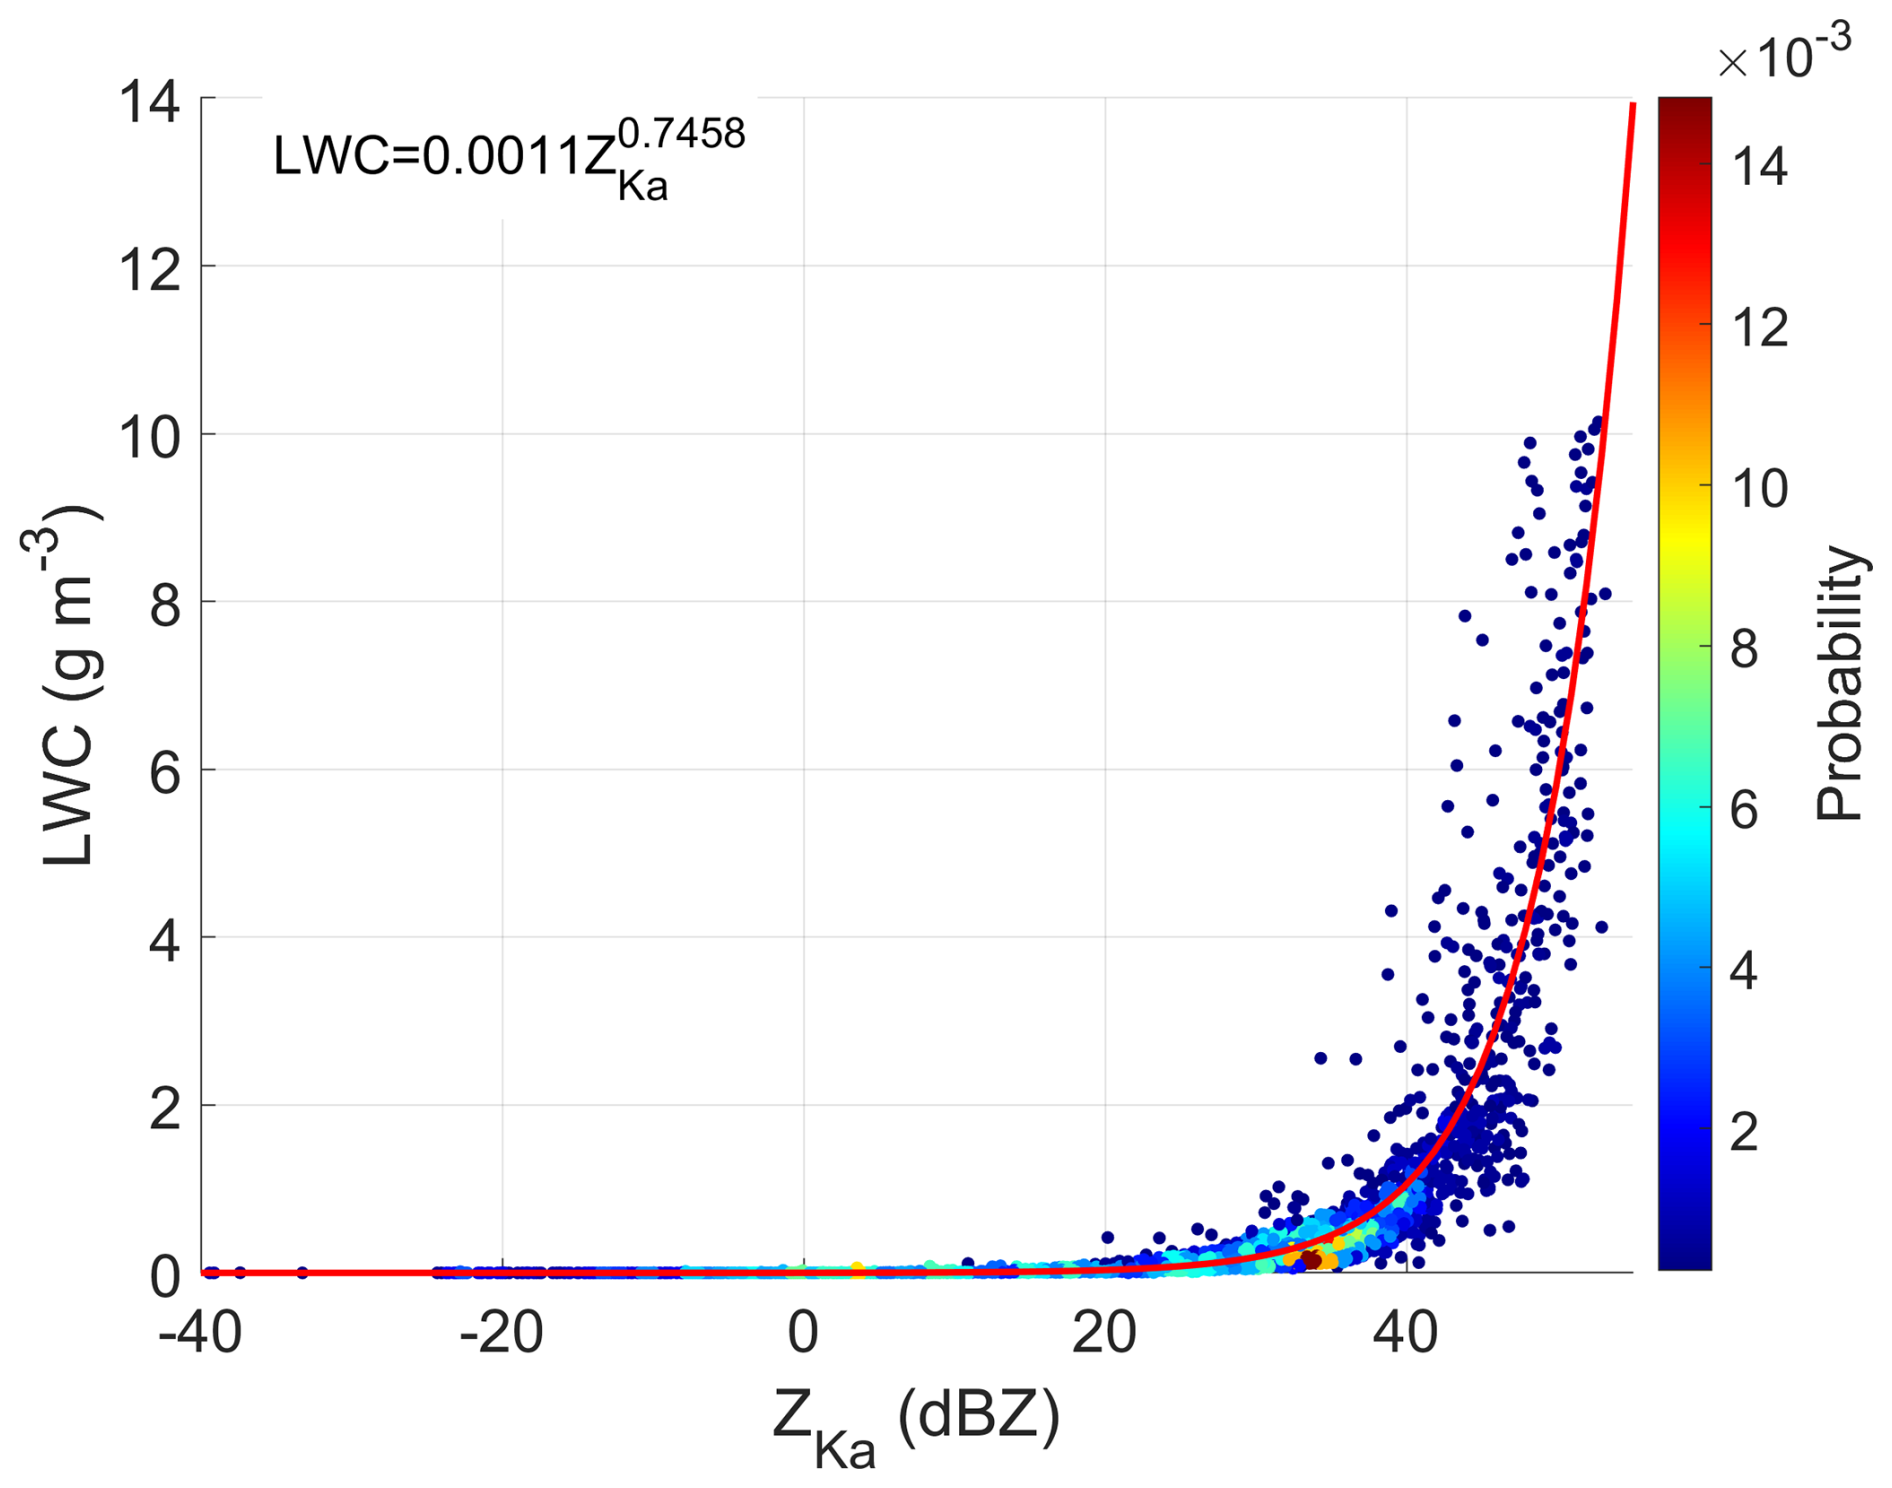
Figure 15Scatterplots of the Ka-band reflectivity (ZKa) and liquid water content (LWC) through scattering simulation.
4.3 Retrieval Results and Validation
To investigate the vertical structure of precipitation microphysics, Fig. 16 shows retrieved profiles of Dm and Nw from X/Ka-band dual-frequency radar data. The results reveal distinct microphysical characteristics between convective and stratiform precipitation. Convective clouds generally exhibit larger Dm and Nw with significant vertical inhomogeneity, whereas stratiform clouds are more uniform. Notably, Dm increases at lower altitudes accompanied by a substantial enhancement in Nw in the convective regions. This indicates the occurrence of intense microphysical processes, such as raindrop coalescence and breakup, within convective updrafts and downdrafts.
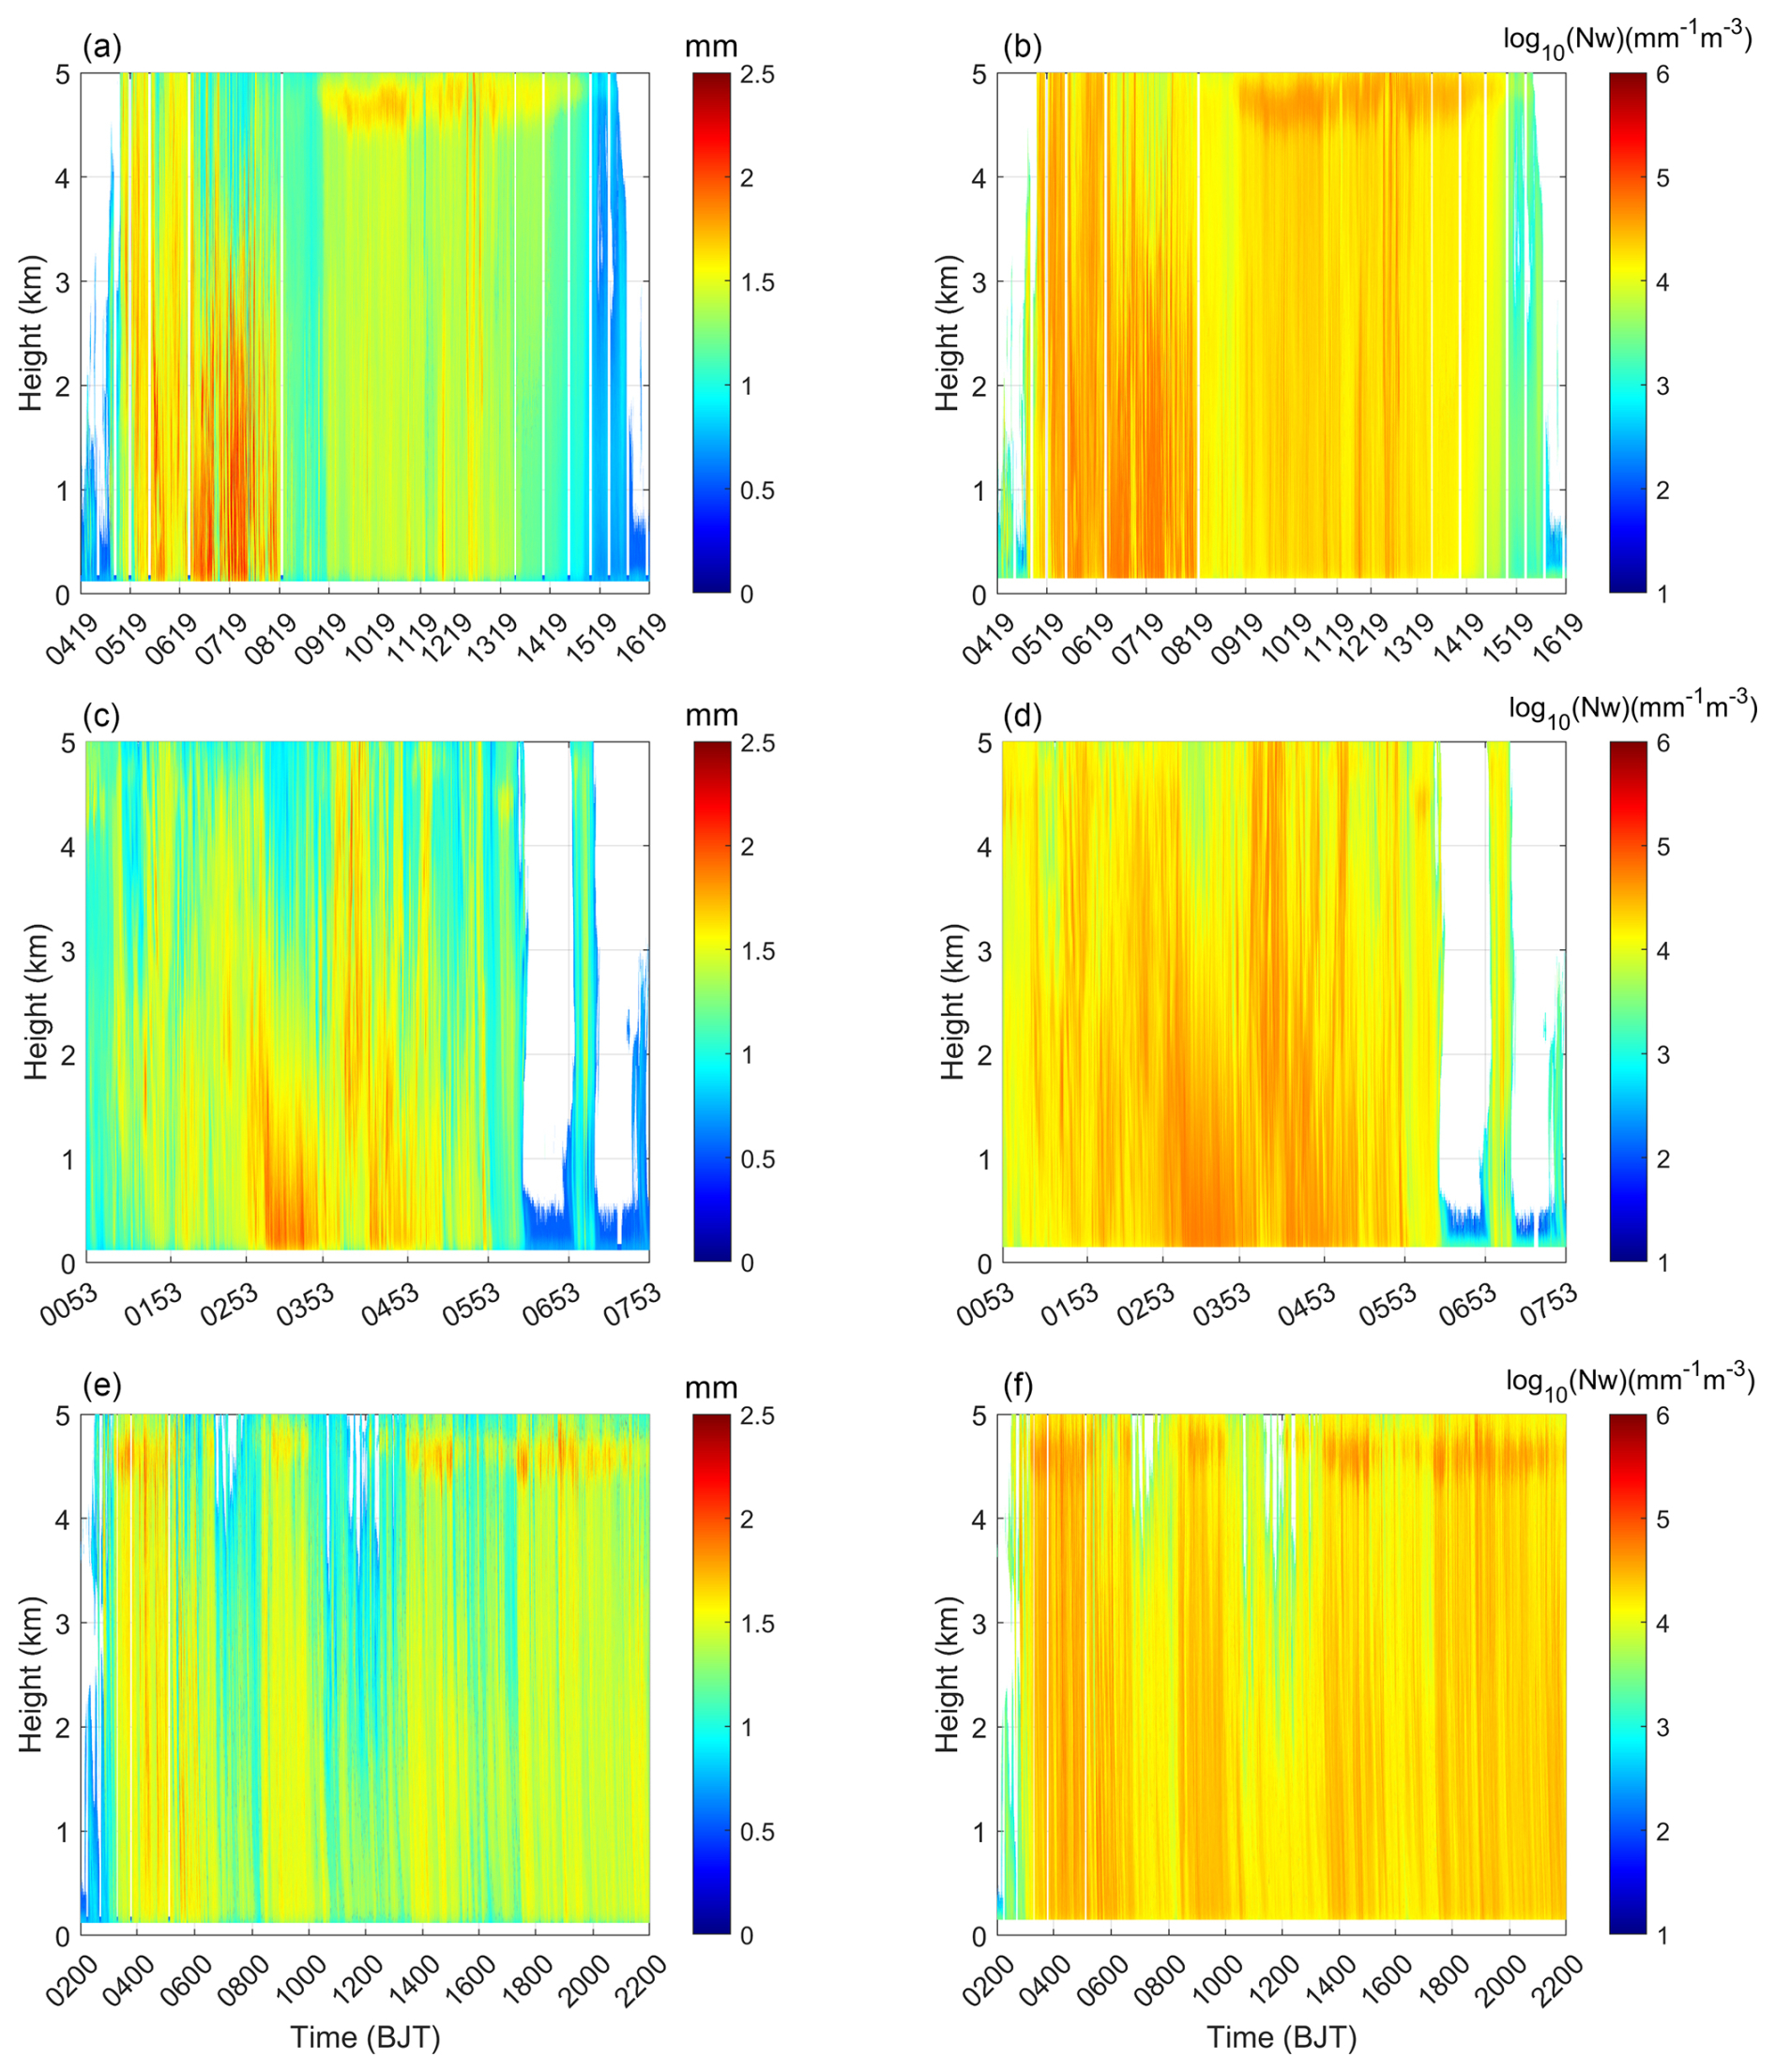
Figure 16Time-height profiles of the mass-weighted mean diameter (Dm) and normalized intercept parameter (Nw) (Dm: a, c, e; Nw: b, d, f; a, b: 11 June 2022; c, d: 11 May 2022; e, f: 1 May 2022).
In contrast, stratiform precipitation displays vertically uniform distributions of Dm and Nw, consistent with its stable, layered structure. However, the melting layer (bright band) causes a local enhancement in these parameters, leading to peaks in Dm and Nw near the 0 °C isotherm. This characteristic is attributed to the increased radar reflectivity of melting hydrometeors. These findings suggest that the proposed retrieval framework has the potential to capture microphysical differences across precipitation types and vertical levels, offering insights into cloud structure and precipitation formation mechanisms.
The performance of the proposed retrieval method was evaluated by comparing near-surface X/Ka-band radar retrievals with ground-based 2DVD observations. Its superiority was further demonstrated through a comparison with two conventional methods (Fig. 17) and the retrieval formula is shown in Eq. (20). The first estimates Dm only when DFR(X, Ka) > 0, ignoring the dual-solution problem (Wang et al., 2020; Liu and Wang, 2020). The second follows the same procedure as the first when DFR>0, but it selects the large Dm when DFR≤0 (Mardiana et al., 2004).
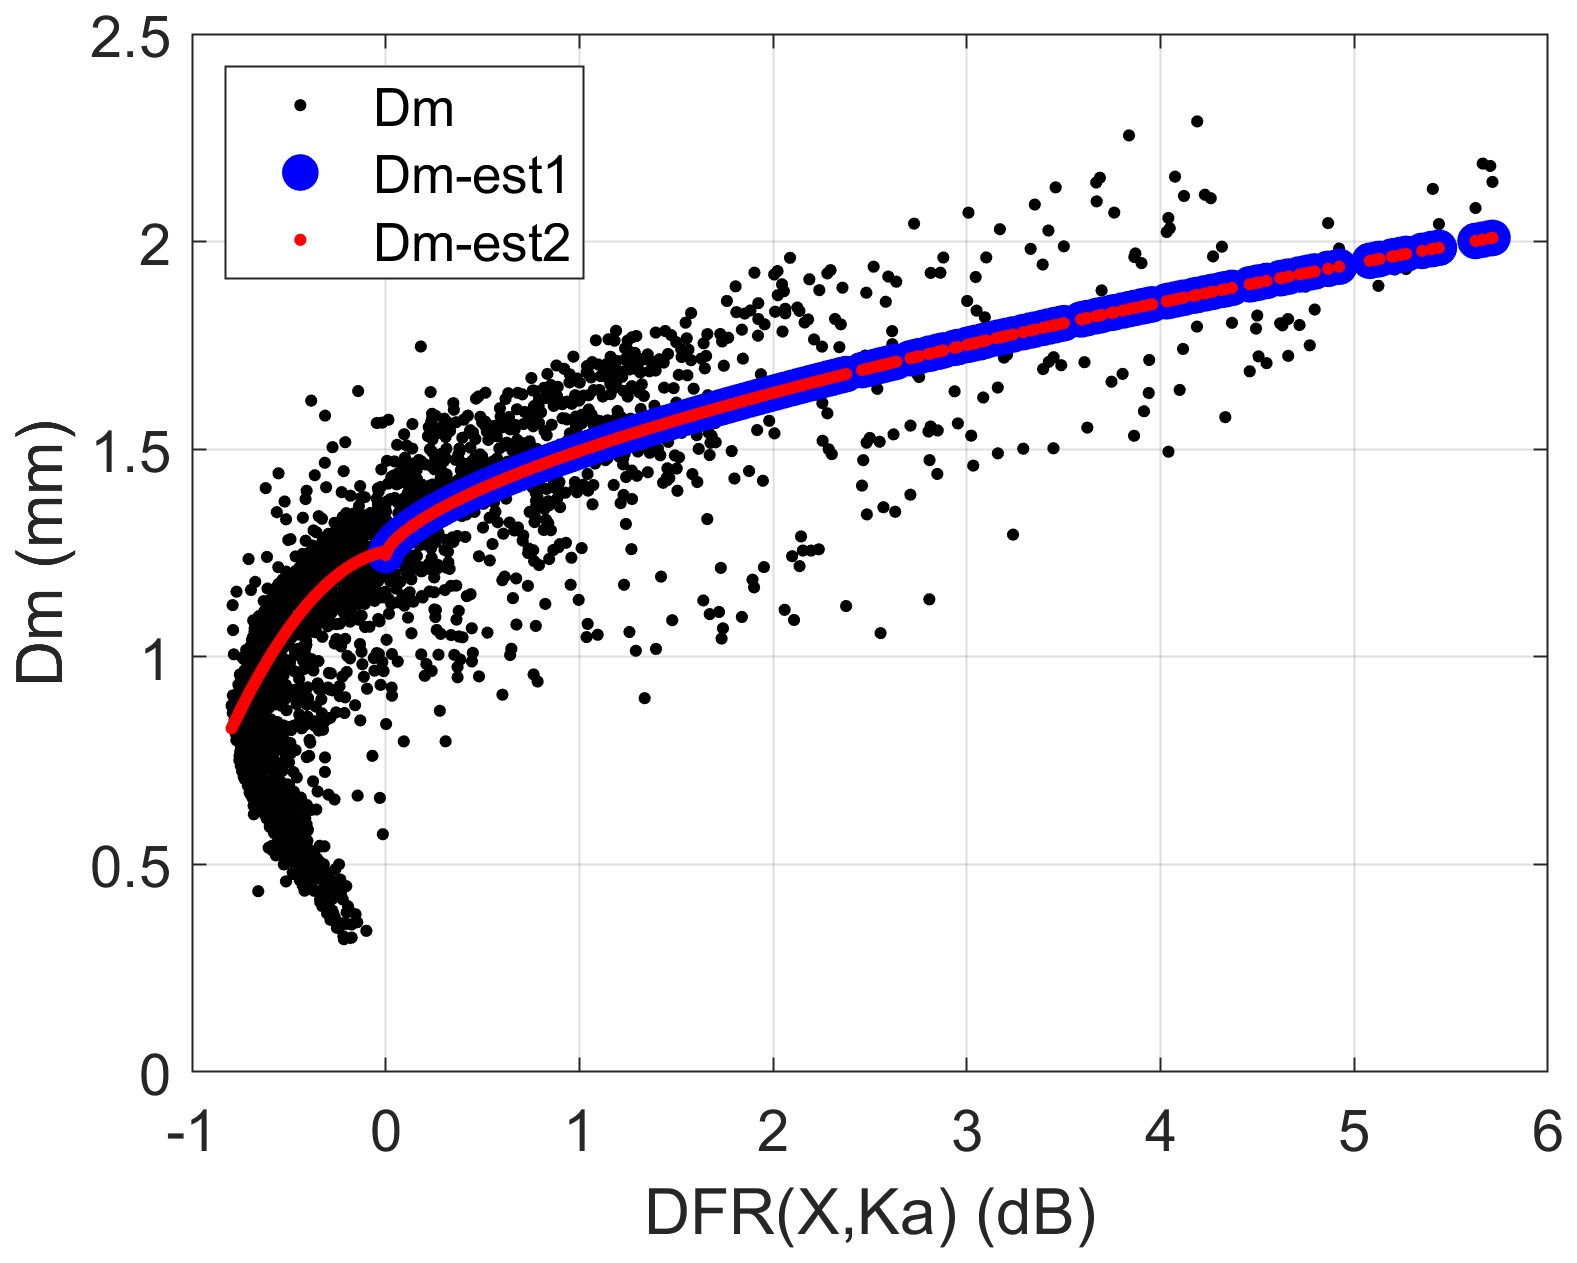
Figure 17The mass-weighted mean diameter retrieved by conventional methods versus the true value. [Dm (black): true value; Dm-est1 (blue): the first conventional method; Dm-est2 (red): the second conventional method.]
As shown in Fig. 18, the first conventional method performs well only for large raindrops, but fails to capture Dm smaller than 1.3 mm (Fig. 18b). The second conventional method tends to overestimate the small Dm (Fig. 18c). In contrast, the proposed framework demonstrates a substantial improvement by accurately retrieving Dm across the entire size spectrum (Fig. 18a), including smaller raindrops that are commonly found in stratiform and light precipitation.
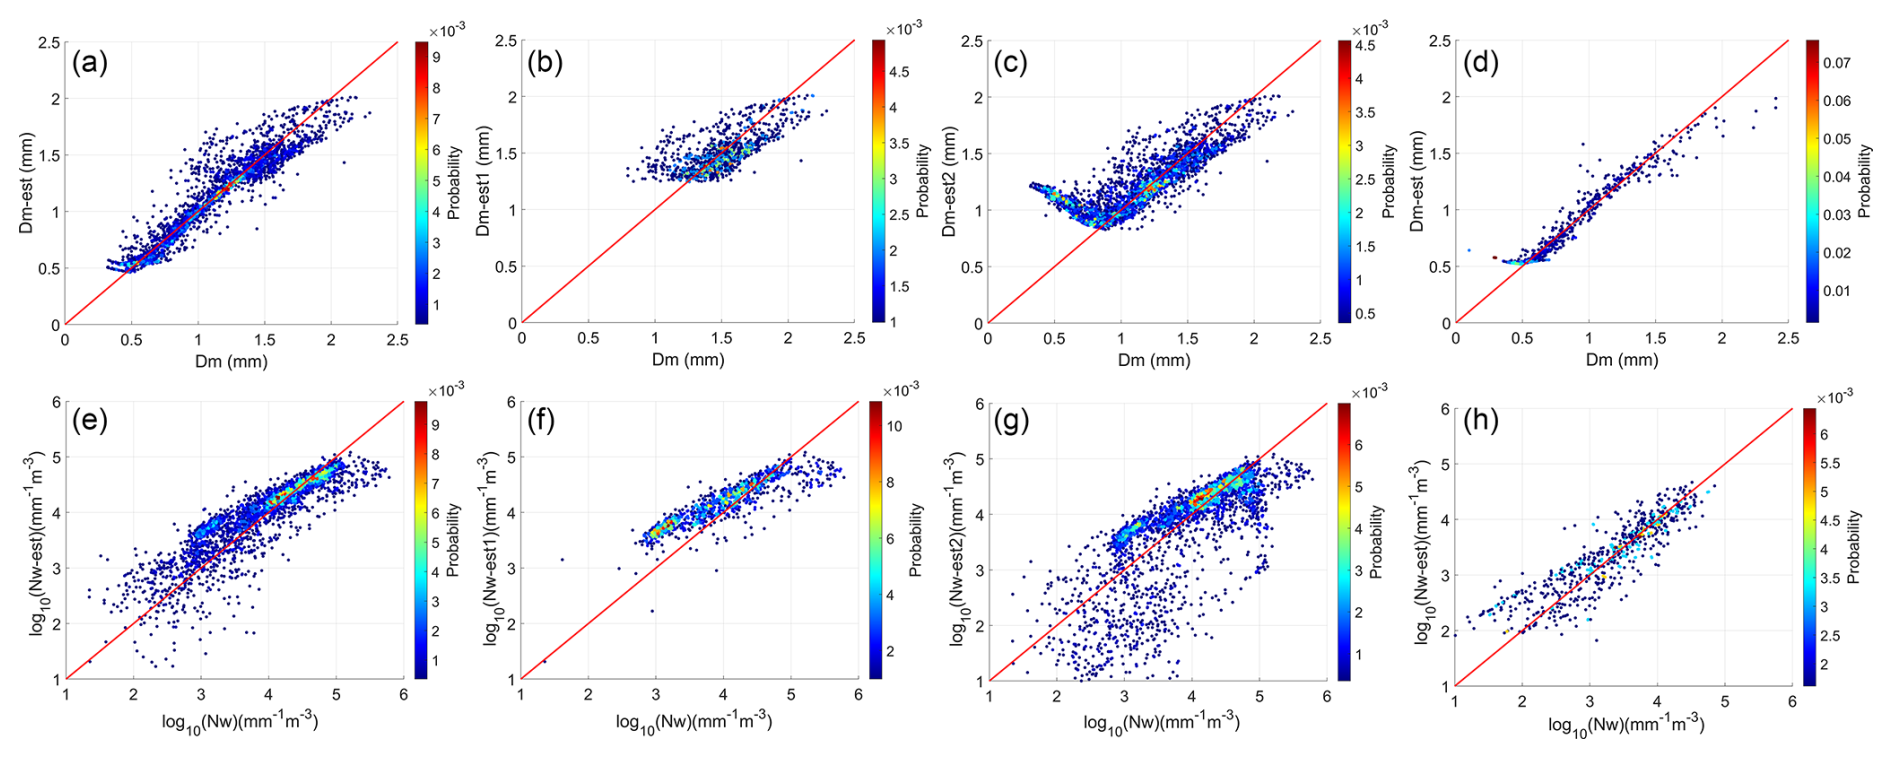
Figure 18Retrieved mass-weighted mean diameter (Dm) and normalized intercept parameter [log 10(Nw)] (a, e: the proposed framework; b, f: the first conventional method; c, g: the second conventional method; d, h: the retrieved Dm and Nw of 14 June 2025 by the proposed framework).
In terms of Nw retrieval, the first conventional method can only accurately retrieve Nw for large raindrops (Fig. 18f). Due to the inverse relationship between Dm and Nw, the overestimation of Dm by the second conventional method leads to underestimated Nw retrievals for small raindrops (Fig. 18g). In contrast, the proposed framework overcomes these limitations of conventional methods, demonstrating good consistency between the retrieved Nw and ground truth (Fig. 18e). Furthermore, the proposed framework was applied to a precipitation case on 14 June 2025 to evaluate its applicability. As shown in Fig. 18d and h, the retrieval results agree well with ground-based measurements, suggesting the potential applicability of the proposed framework. As quantitatively assessed in Table 7, the proposed framework shows improved accuracy and a degree of generalizability in retrieving both Dm and Nw compared to the two conventional methods. Notably, despite the second conventional method performing better than the first for Dm retrieval, it shows weaker capability in retrieving Nw.
Table 7Retrieval error statistics for the mass-weighted mean diameter (Dm) and the normalized intercept parameter (Nw).
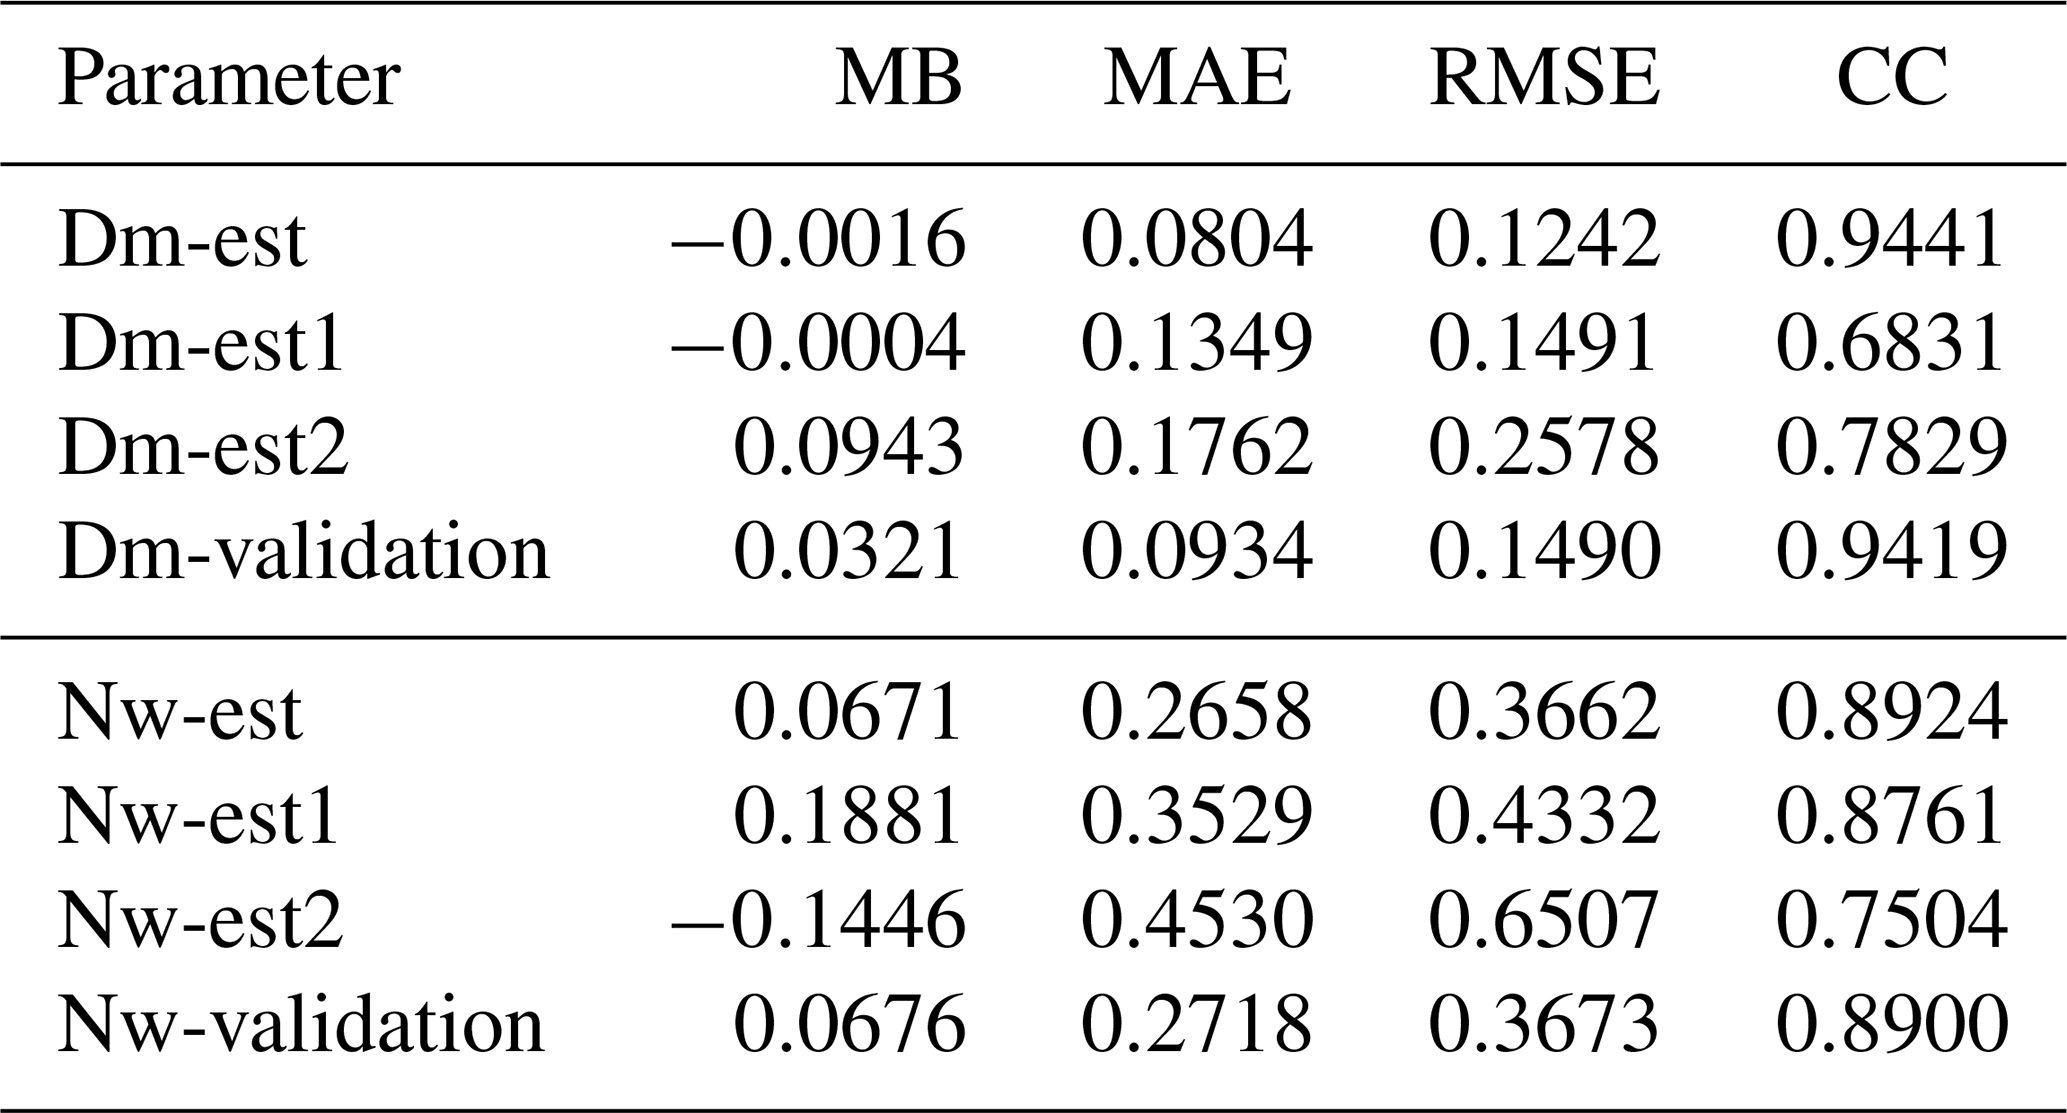
Note: “-est” denotes results from the proposed framework; “-est1” and “-est2” denote results from the first and second conventional methods, respectively; “-validation” denotes the retrieval results from the proposed framework for 14 June 2025.
A comparison of retrieved raindrop size distributions with ground truth across reflectivity intervals is shown in Fig. 19. The proposed framework outperforms the conventional ones, accurately retrieving DSDs across all intervals with particular improvement for weak echoes (Fig. 19a). While conventional methods improve with higher reflectivity (Fig. 19b–d), the proposed framework consistently achieves the best accuracy, followed by the second and then the first conventional method. This conclusion is validated by the Dm and Nw error statistics (MB, MAE) in Fig. 20.
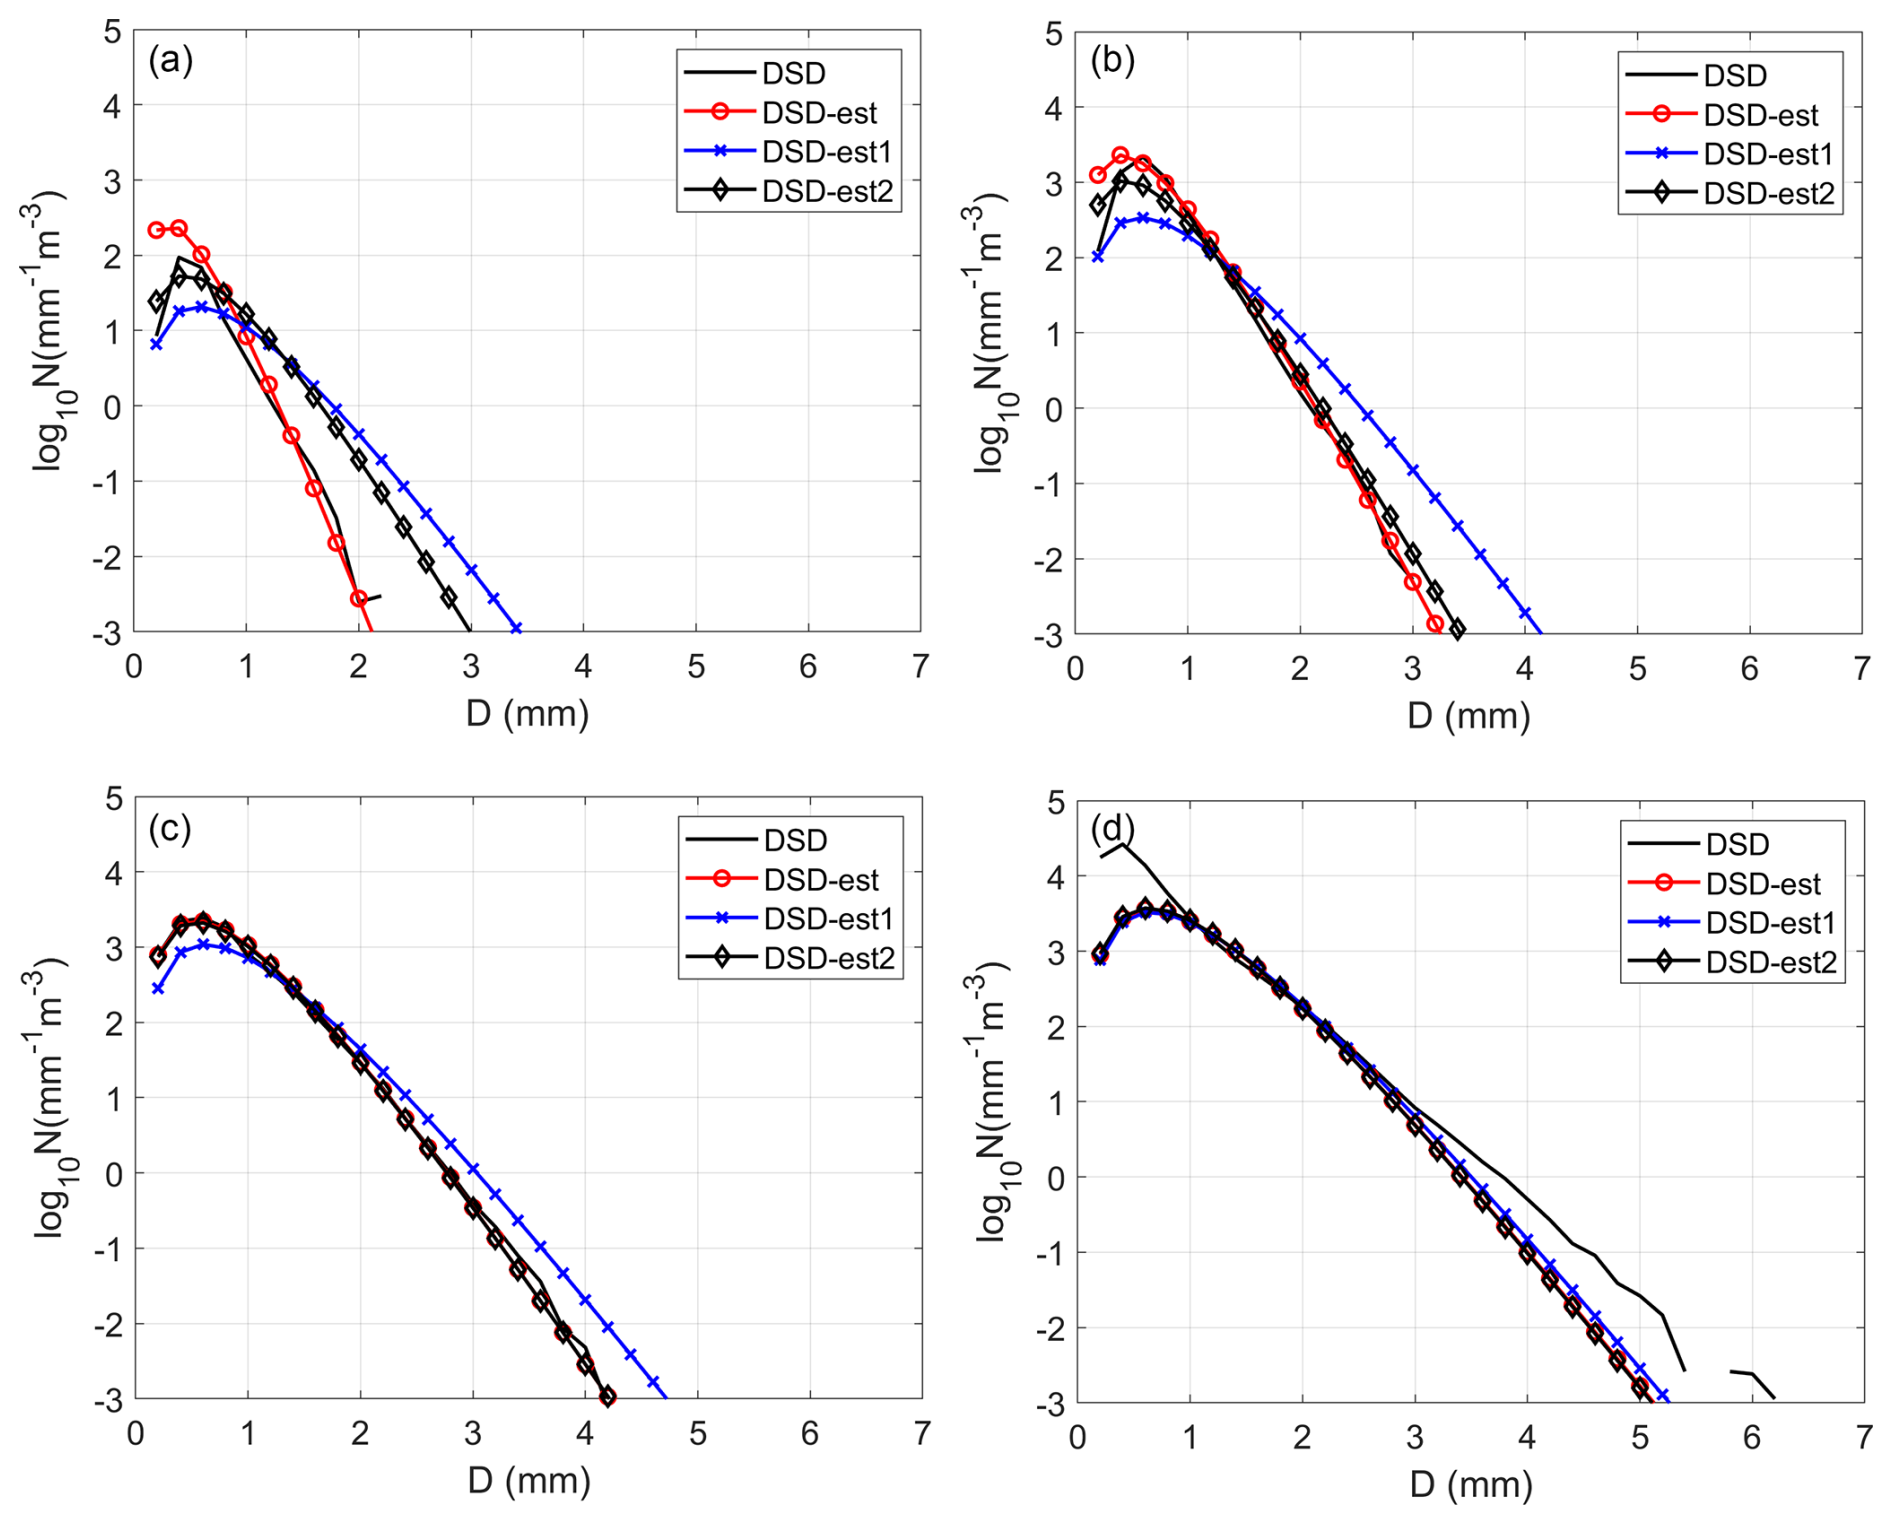
Figure 19The mean raindrop size distributions retrieved by conventional methods (DSD-est1, DSD-est2) and the proposed framework (DSD-est) against the true values (DSD). (a) Z<20 dBZ, 655 samples; (b) , 466 samples; (c) , 1281 samples; (d) , 394 samples.
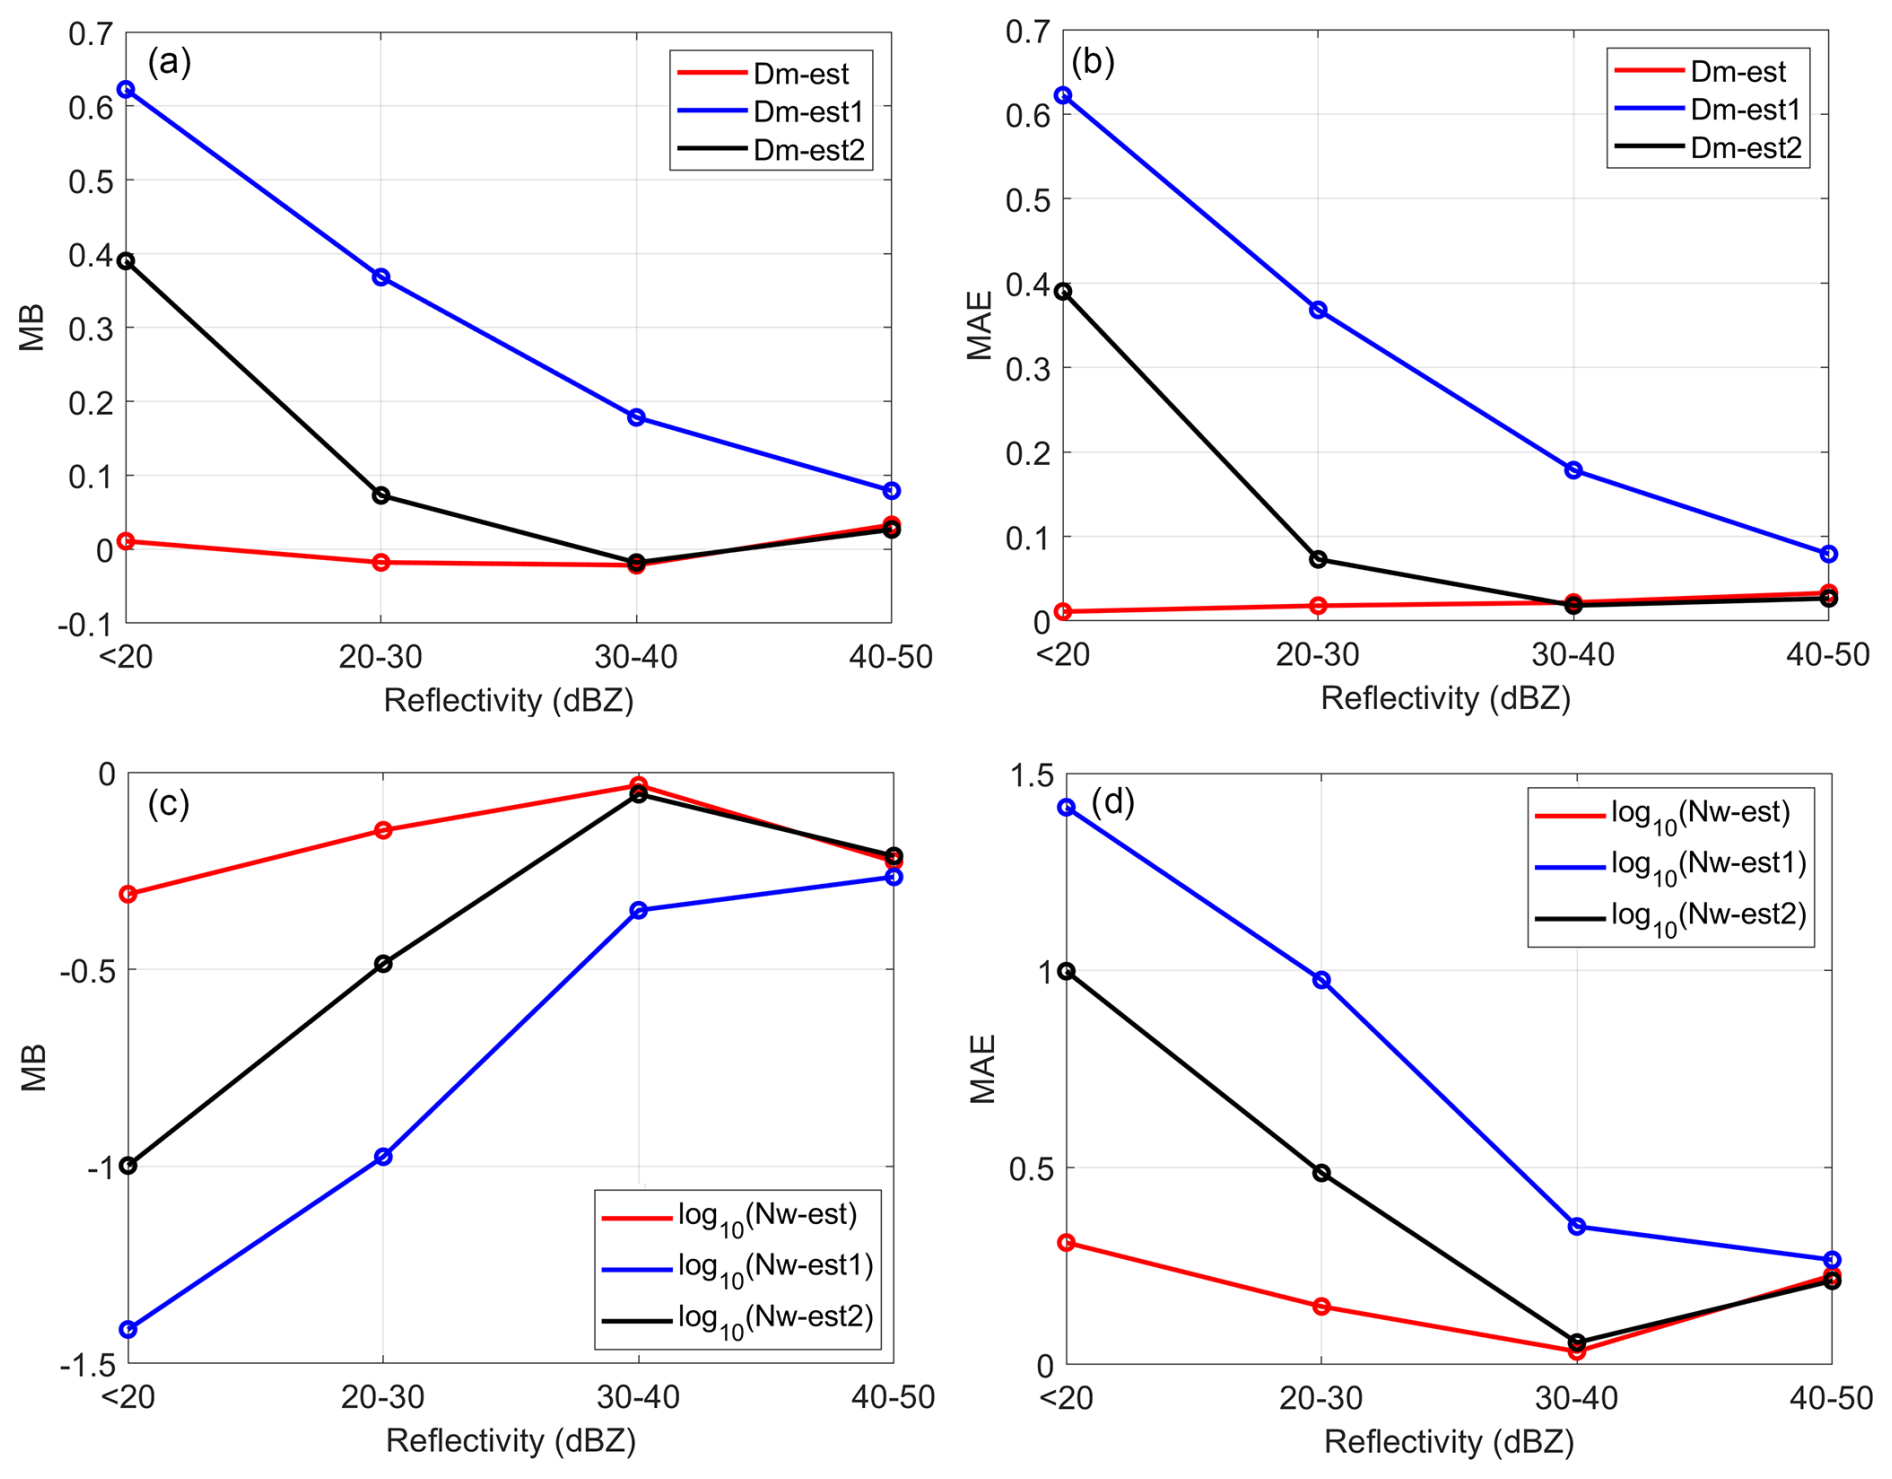
Figure 20Retrieval performance of Dm (a, b) and log 10(Nw) (c, d) across multiple reflectivity intervals (-est, proposed framework; -est1, first conventional method; -est2, second conventional method).
4.4 Independent Validation
The retrieval relationships (DFR–Dm and LWC–ZKa) were established using DSD data from three precipitation events in 2022 (1 May, 11 May, and 11 June), and the retrieval performance was independently evaluated using data from a separate precipitation event on 14 June 2025, which was not included in the relationship development.
As presented in Table 7, the independent validation results (Dm-validation and Nw-validation) demonstrate comparable accuracy to the training-period evaluation (Dm-est and Nw-est), with correlation coefficients exceeding 0.94 for Dm and 0.89 for Nw. This consistency supports the generalizability of the proposed retrieval framework to unseen precipitation events. However, it should be acknowledged that the current validation is based on a limited number of rainfall events from a single observational site and therefore may represent an upper-bound estimate of retrieval performance. Future studies will employ event-independent validation using leave-one-event-out cross-validation with a larger sample size to further quantify the robustness and generalization capability of the proposed framework.
5.1 Sensitivity of the retrieval to W-band reflectivity uncertainties
A critical question for the practical applicability of the proposed framework is the extent to which the retrieval tolerates uncertainties in the W-band reflectivity, given that no W-band radar observations are currently available and that the DFR(Ka, W) constraint is invoked in the ambiguous zone of DFR(X, Ka), where the retrieval is most vulnerable. In this section, the tolerance is quantified through a controlled sensitivity experiment.
All uncertainty sources affecting the W-band measurement act exclusively through the reflectivity itself. In logarithmic units, the calibration bias (ΔZcal) and the attenuation-correction residual (ΔZatt) are additive and can be combined into a single total error term, , such that the combined reflectivity is given by ZW+δZW. Since , the net offset δZW translates into an equal and opposite shift in DFR(Ka, W). The shifted ratio is then mapped onto Dm through the fitted DFR(Ka, W)–Dm relationship (Eq. 19), and onto Nw through (LWC being retrieved from ZKa and therefore unaffected). Consequently, a single sensitivity curve obtained by perturbing ZW with a net offset δZW constitutes the complete response function of the retrieval to the combined effect of calibration errors and attenuation residuals.
The W-band reflectivities were perturbed with offsets ranging from −2 to +2 dB in steps of 0.1 dB, and the retrieval was re-run for all samples in the ambiguous zone of DFR(X, Ka). Among the ambiguous-zone samples, the fraction retaining a unique Dm solution decreases only gradually, from 80.5 % at δZW=0 % to 72 % at dB (Fig. 21a). The Dm RMSE of the resolved samples increases from 0.08 mm at zero offset to 0.14 mm at dB, remaining comparable to the best-performing conventional method (0.149 mm, Table 7); beyond ±1.1 dB, the Dm RMSE exceeds that of the conventional methods, marking the point at which the advantage of the proposed framework is gradually lost (Fig. 21b). The RMSE of log 10(Nw) increases consistently from 0.18 to 0.33 over the same range (Fig. 21c), yet it remains lower than that obtained with the conventional method (0.433, Table 7). The results indicate that the proposed framework tolerates a combined W-band reflectivity uncertainty of approximately ±1 dB.
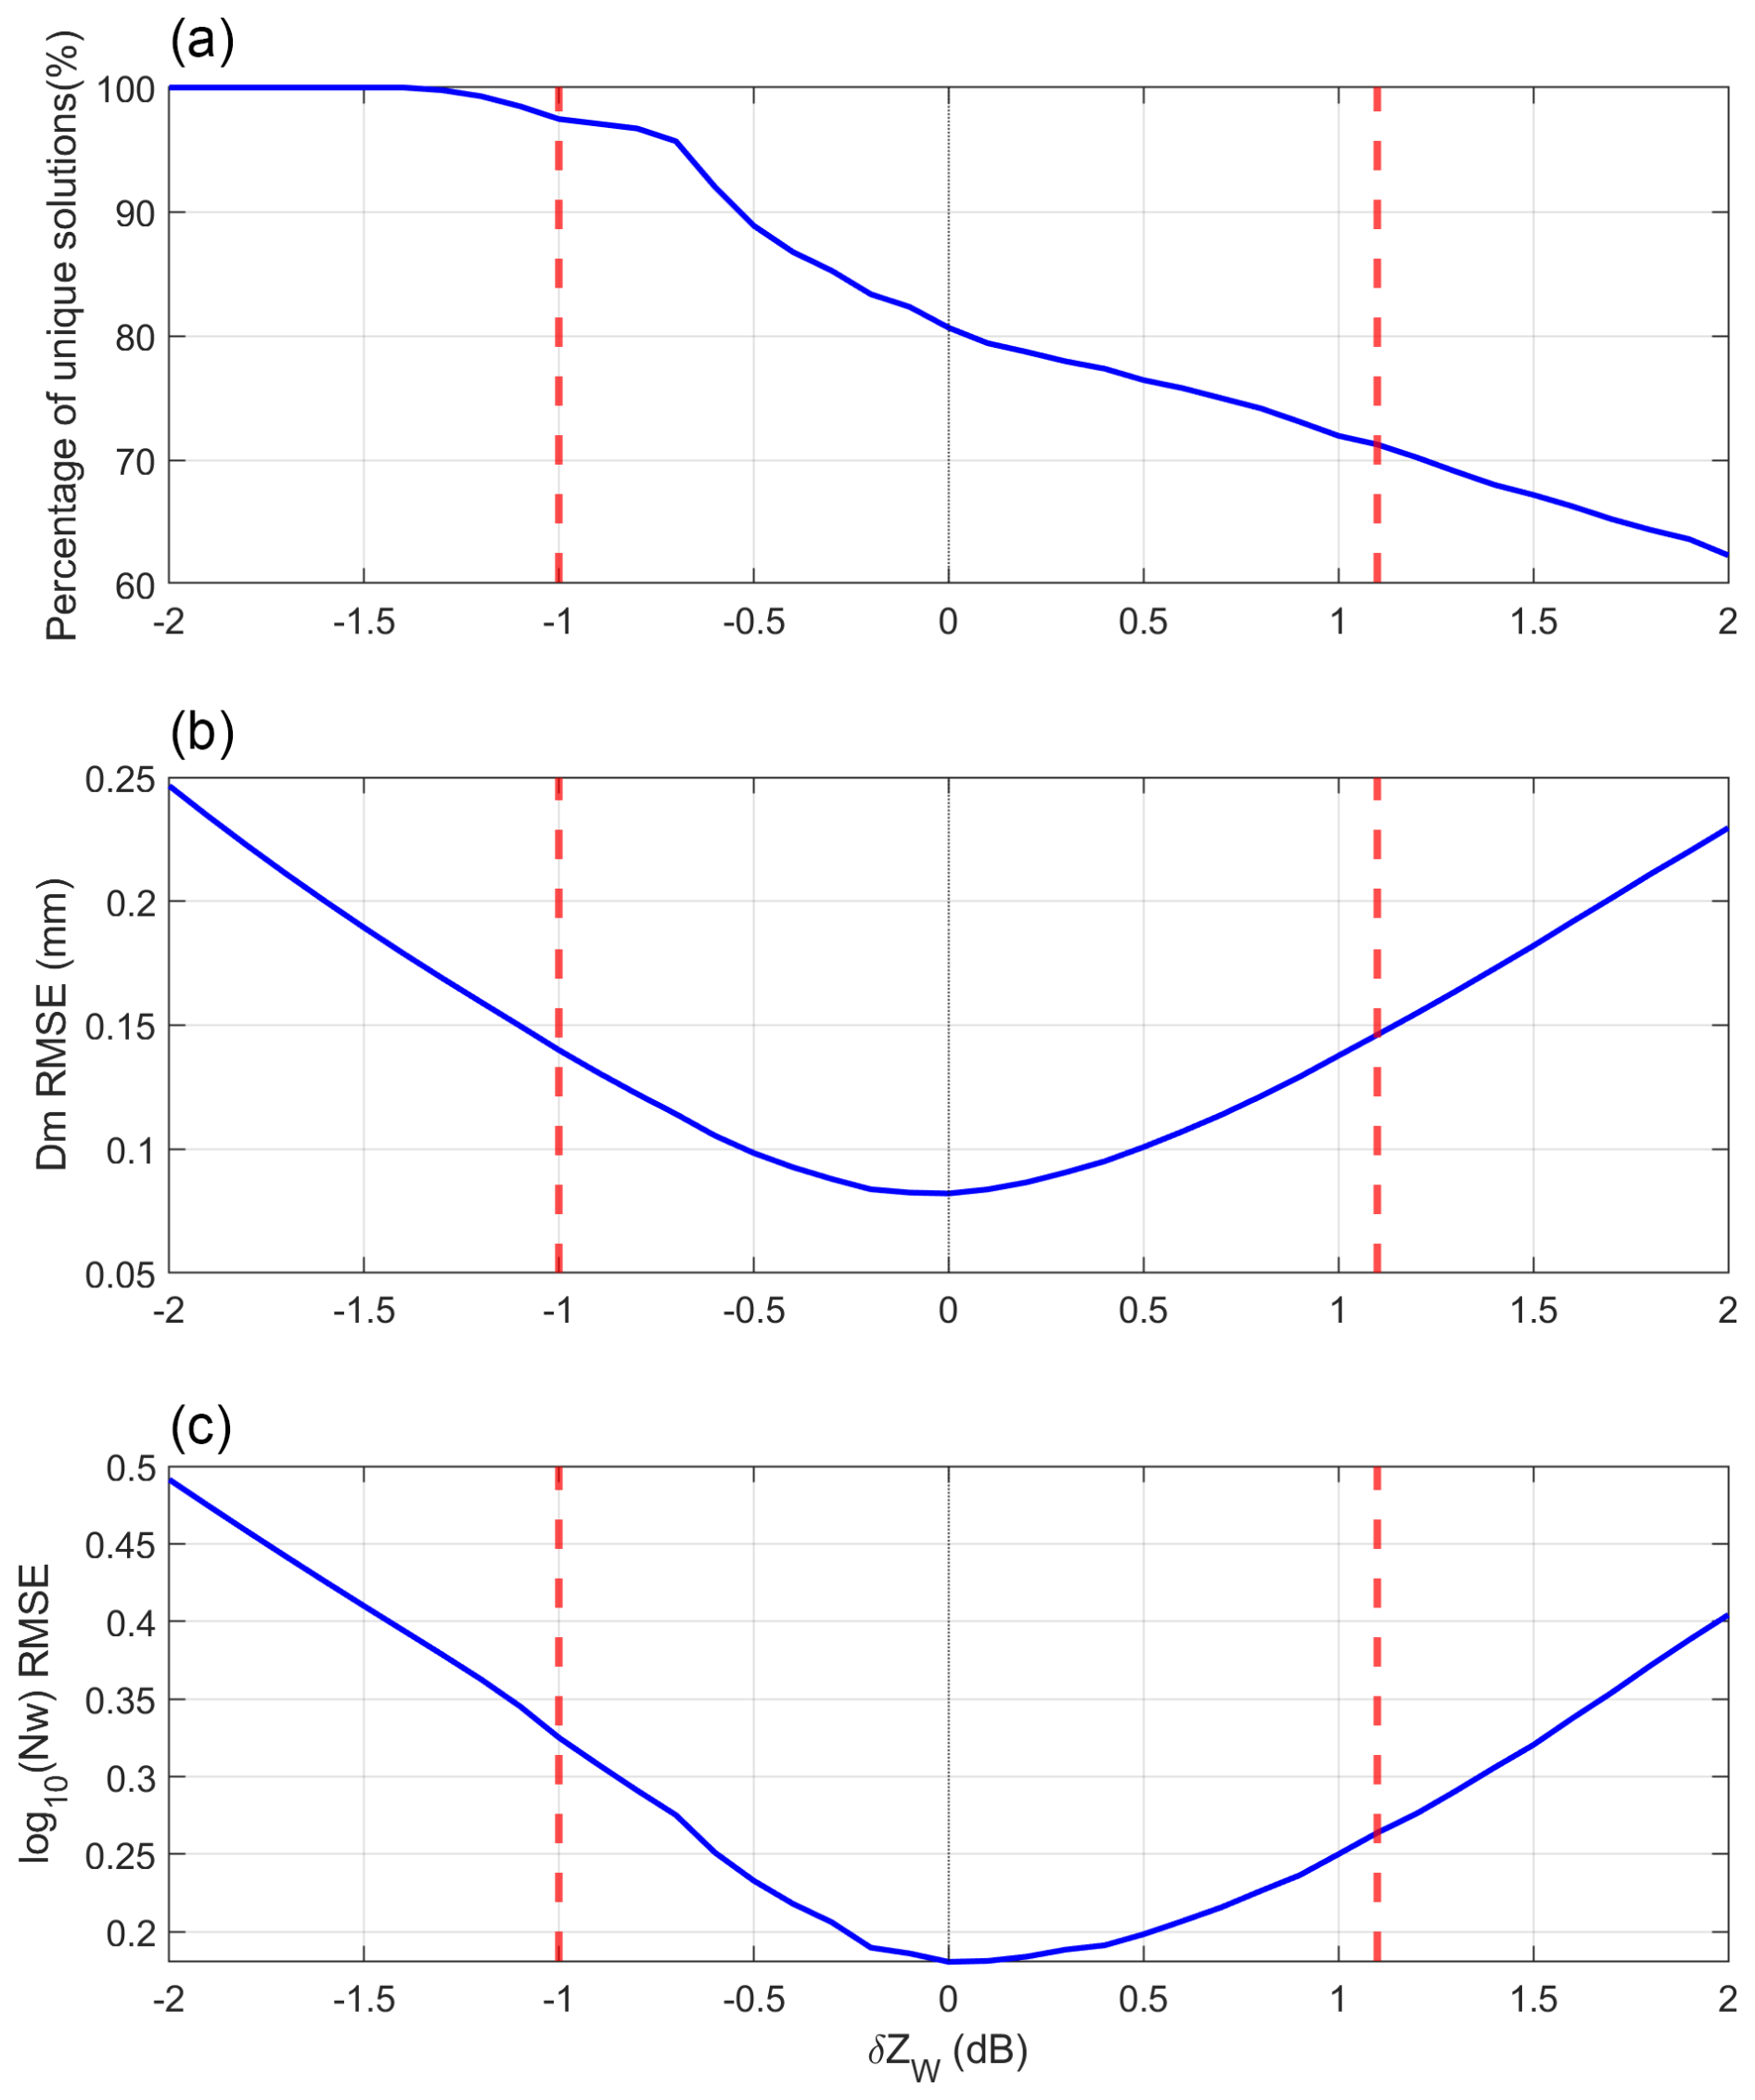
Figure 21Sensitivity of the DSD retrieval to the combined W-band reflectivity uncertainty δZW, evaluated over the ambiguous-zone samples (DFR(X, Ka) ≤ 0). (a) Percentage of samples retaining a unique Dm solution, (b) Dm RMSE of the resolved samples, (c) RMSE of log 10(Nw). The vertical red lines in all panels indicate the threshold offsets beyond which the Dm RMSE exceeds that of the conventional methods.
5.2 Representativeness of 2DVD Validation
The validation of radar retrievals against 2DVD measurements is subject to several representativeness issues. First, wind drift during raindrop fall can cause horizontal displacement between the radar sampling volume and the disdrometer location, particularly under strong wind conditions. Second, the time required for raindrops to fall from the radar sampling height (120 m in this study) to the ground introduces a temporal lag that may result in sampling different parcels, especially for rapidly evolving precipitation systems. Third, the fundamental difference in sampling volumes between the radar (30 m) and the 2DVD (10 cm) can lead to statistical representativeness errors, particularly for inhomogeneous precipitation fields. These factors limit the accuracy and usefulness of quantitative comparisons between X/Ka dual-frequency radar and 2DVD. The 2DVD measured DSDs are used to ensure that the radar retrieved results are reasonable and relatively accurate.
5.3 Generalization and Sample Limitations
The retrieval framework presented in this study was developed and evaluated using data from a single observational site (Yangjiang, Guangdong Province) and a limited number of precipitation events (four cases total, with three used for relationship development and one for independent validation). While the cases include both stratiform and convective precipitation types, the sample size is insufficient to fully characterize the performance of the proposed framework across diverse meteorological regimes, seasonal variations, and geographical locations. The generalization capability of the retrieval relationships to other climatic regions and precipitation regimes remains to be demonstrated. Future studies should incorporate a larger and more diverse dataset, including observations from multiple sites and different seasons, to further validate and refine the proposed retrieval framework. Furthermore, the radar operates in a vertically pointing mode in this study, which largely eliminates polarimetric differences and limits the application of polarimetric parameters. Incorporating polarimetric constraints will be one of the priorities for future work.
This study presents a proof-of-concept DSD retrieval framework that explores the potential of combining X/Ka-band radar observations with simulated DFR(Ka, W) constraints to mitigate the DFR(X, Ka)–Dm ambiguity problem. The main findings are summarized as follows:
The results suggest that the DFR(Ka, W) has the potential to significantly reduce the ambiguity in the DFR(X, Ka)–Dm relationship. The proportion of data capable of yielding a unique Dm solution increased from 35.38 % to 87.5 % after incorporating the simulated DFR(Ka, W) constraint. This improvement could enable more accurate retrievals of Dm in weak precipitation where DFR(X, Ka) ≤ 0.
The proposed framework shows potential advantages over conventional approaches, particularly for retrieving DSDs of weak echoes (<20 dBZ) where conventional methods exhibit substantial errors. The independent validation using a separate precipitation event demonstrates comparable retrieval accuracy, suggesting that the proposed relationships have a degree of generalizability.
It is important to emphasize the W-band reflectivities were obtained through scattering simulations rather than actual radar observations, and the evaluation is based on a limited sample from a single observational site. The results of the sensitivity experiments demonstrate that a W-band reflectivity accuracy of approximately 1 dB is required, and that such accuracy can be achieved using current ground-based W-band radar calibration practice together with standard attenuation correction. The practical applicability of the Ka-W constraint for operational three-frequency radar systems requires further validation with real W-band observations and more extensive datasets covering diverse precipitation regimes. Future work should also address the assumptions regarding the DSD model shape parameter, incorporate height-dependent DSD models for upper-level retrievals, and quantify the impact of radar calibration and attenuation correction uncertainties on retrieval accuracy.
The dual-frequency radar data, raindrop size distribution data, and retrieval codes will be provided upon request from the corresponding author.
LF had the idea for the retrieval and wrote the manuscript. JY proposed improvements to the retrieval method and guided the writing of the manuscript. ZG has provided the joint observation data from dual-frequency radar and raindrop size distribution measurements. JS, YS, XH, and HY provided valuable feedback during the development of the retrieval method and verification of the retrieval results.
The contact author has declared that none of the authors has any competing interests.
Publisher's note: Copernicus Publications remains neutral with regard to jurisdictional claims made in the text, published maps, institutional affiliations, or any other geographical representation in this paper. The authors bear the ultimate responsibility for providing appropriate place names. Views expressed in the text are those of the authors and do not necessarily reflect the views of the publisher.
We gratefully acknowledge the Yangjiang Meteorological Bureau of Guangdong Province for providing the essential observational data and their dedicated efforts. We also extend our sincere thanks to the developers of the T-matrix scattering code, whose work made the scattering simulations in this research possible.
This research is supported by the Frontier Research Program of the Chinese Academy of Sciences (grant no. XDB0760402), Beijing Science and Technology Plan Project (grant no. Z251100004525005), Guangdong Basic and Applied Basic Research Foundation (grant no. 2024A1515510010), China Meteorological Administration Tornado Key Laboratory (grant no. TKL202402) and Natural Science Foundation of Hebei Province (grant no. 2024304015).
This paper was edited by Alexis Berne and reviewed by two anonymous referees.
Chang, A. T. C. and Wilheit, T. T.: Remote sensing of atmospheric water vapor, liquid water, and wind speed at the ocean surface by passive microwave techniques from the Nimbus 5 satellite, Radio Sci., 14, 793–802, https://doi.org/10.1029/RS014i005p00793, 1979.
Chudler, K., Rutledge S. A., and Dolan, B.: Unique radar observations of large raindrops in tropical warm rain during PISTON, Mon. Weather Rev., 150, 2719–2736, https://doi.org/10.1175/MWR-D-21-0298.1, 2022.
Ellis, S. M. and Vivekanandan, J.: Liquid water content estimates using simultaneous S and Ka band radar measurements, Radio Sci., 46, 1–15, https://doi.org/10.1029/2010RS004361, 2011.
Feng, L., Xiao, H., and Luo, L.: Simulation of polarization characteristics and attenuation of dual-polarization rain-measuring radar with T-matrix methods, Chinese Journal of Computational Physics, 36, 189–202, https://doi.org/10.19596/j.cnki.1001-246x.7826, 2019 (in Chinese).
Hou, A. Y., Kakar, R. K., Neeck, S., Azarbarzin, A. A., Kummerow, C. D., Kojima, M., Oki, R., Nakamura, K., and Iguchi, T: The Global Precipitation Measurement Mission, B. Am. Meteorol. Soc., 95, 701–722, https://doi.org/10.1175/BAMS-D-13-00164.1, 2014.
Iguchi, T. and Meneghini, R.: Stability of the dual-frequency radar equations and a new method applied to the GPM's Dual-Frequency Precipitation Radar (DPR) data, IEEE T. Geosci. Remote, 60, 5111818, https://doi.org/10.1109/TGRS.2022.3159396, 2022.
Iguchi, T., Seto, S., Meneghini, R., Yoshida, N., Awaka, J., Le, M., Chandrasekar, V., Brodzik, S., Kubota, T., and Takahashi, N.: GPM/DPR level-2 algorithm theoretical basis document, NASA ATBD, 238 pp., https://gpm.nasa.gov/sites/default/files/2022-06/ATBD_DPR_V07A.pdf (last access: 14 January 2026), 2021.
Junyent, F., Chandrasekar, V., and Kennedy, P.: Resonance Scattering Detection Using the CSU–CHILL Dual-Wavelength, Dual-Polarization Radar, J. Atmos. Ocean. Tech., 36, 1177–1198, https://doi.org/10.1175/JTECH-D-18-0074.1, 2019.
Kubota, T., Seto, S., Satoh, M., Nasuno, T., Iguchi T., Masaki, T., Kwiatkowski, J. M., and Oki, R.: Cloud Assumption of Precipitation Retrieval Algorithms for the Dual-Frequency Precipitation Radar, J. Atmos. Ocean. Tech., 37, 2015–2031, https://doi.org/10.1175/JTECH-D-20-0041.1, 2020.
Ladino-Rincon, A., Nesbitt, S. W., Girolamo, L. D., Rauber, R. M., Mcfarquhar, G. M., and Lawson, R. P.: Droplet size distribution retrieval from dual-frequency precipitation radar measurement using a deep neural network, J. Atmos. Ocean. Tech., 42, 1549–1566, https://doi.org/10.1175/JTECH-D-25-0004.1, 2025.
Li, H., Ran, Z., Liu, L., Chen, Y., Bi, Y., Zhang, Y., Chen, H., and Mao J.: Research progress in profiling cloud and precipitation microphysics characteristic with ground-based multi-frequency radar, Torrential Rain and Disasters, 42, 361–371, https://doi.org/10.12406/byzh.2023-075, 2023 (in Chinese).
Liao, L. and Meneghini, R.: A study of air/space-borne dual-wavelength radar for estimates of rain profiles, Adv. Atmos. Sci., 22, 841–851, https://doi.org/10.1007/BF02918684, 2005.
Liao, L. and Meneghini, R.: Physical evaluation of GPM DPR single- and dual-wavelength algorithms, J. Atmos. Ocean. Tech., 36, 883–902, https://doi.org/10.1175/JTECH-D-18-0210.1, 2019a.
Liao, L. and Meneghini, R.: A modified dual-wavelength technique for Ku- and Ka-band radar rain retrieval, J. Appl. Meteorol. Clim., 58, 3–18, https://doi.org/10.1109/IGARSS.2018.8517440, 2019b.
Liao, L., Meneghini, R., and Tokay, A.: Uncertainties of GPM DPR rain estimates caused by DSD parameterizations, J. Appl. Meteorol. Clim., 53, 2524–2537, https://doi.org/10.1175/JAMC-D-14-0003.1, 2014.
Liebe, H. J.: An updated model for millimeter wave propagation in moist air, Radio Sci., 20, 1069–1089, https://doi.org/10.1029/RS020i005p01069, 1985.
Liu, L., Zhang,Y., and Ding, H.: Vertical air motion and raindrop size distribution size distribution retrieval using a Ka/Ku dual-wavelength cloud radar and its preliminary application, Chinese Journal of Atmospheric Sciences, 45, 1099–1113, https://doi.org/10.3878/j.issn.1006-9895.2104.20200, 2021 (in Chinese).
Liu, S. and Wang G.: Study on the impacts of DSD parameters on precipitation estimation using dual-frequency radar, Plateau Meteorology, 39, 570–580, http://www.gyqx.ac.cn/article/2020/1000-0534/1000-0534-2020-39-3-570.shtml (last access: 10 October 2026), 2020 (in Chinese).
Mardiana, R., Iguchi, T., and Takahashi, N.: A dual-frequency rain profiling method without the use of a surface reference technique, IEEE T. Geosci. Remote, 42, 2214–2225, https://doi.org/10.1109/TGRS.2004.834647, 2004.
Marshall, J. S. and Palmer, W. M.: The distribution of raindrops with size, J. Meteorol., 5, 165–166, https://doi.org/10.1175/1520-0469(1948)005<0165:TDORWS>2.0.CO;2, 1948.
Meneghini, R., Kozu, T., Kumagai, H., and Boncyk, W. C.: A study of rain estimation methods from space using dual-wavelength radar measurements at near-nadir incidence over ocean, J. Atmos. Ocean. Tech., 9, 364–382, https://doi.org/10.1175/1520-0426(1992)009<0364:ASOREM>2.0.CO;2, 1992.
Meneghini, R., Kumagai, H., Wang, J. R., Iguchi, T., and Kozu, T.: Microphysical retrievals over stratiform rain using measurements from an airborne dual-wavelength radar-radiometer, IEEE T. Geosci. Remote, 35, 487–506, https://doi.org/10.1109/36.581956, 1997.
Meneghini, R., Liao, L., and Iguchi, T.: A Generalized Dual-Frequency Ratio (DFR) Approach for Rain Retrievals, J. Atmos. Ocean. Tech., 39, 1309–1329, https://doi.org/10.1175/JTECH-D-22-0002.1, 2022.
Oh, S. B., Lee, Y. H., Jeong, J. H., Kim, Y. H., and Joo, S.: Estimation of the liquid water content and Z–LWC relation using Ka-band cloud radar and a microwave radiometer, Meteorol. Appl., 25, 423–434, https://doi.org/10.1002/met.1710, 2018.
Rose, C. R. and Chandrasekar, V.: A system approach to GPM dual-frequency retrieval, IEEE T. Geosci. Remote, 43, 1816–1826, https://doi.org/10.1109/TGRS.2005.851165, 2005.
Seto, S., Iguchi, T., and Oki, T.: The basic performance of a precipitation retrieval algorithm for the Global Precipitation Measurement mission's single/dual-frequency radar measurements, IEEE T. Geosci. Remote, 51, 5239–5251, https://doi.org/10.1109/TGRS.2012.2231686, 2013.
Seto, S., Iguchi, T., Meneghini, R., Awaka, J., Kubota, T., Masaki, T., and Takahashi, N.: The precipitation rate retrieval algorithms for the GPM Dual-Frequency Precipitation Radar, J. Meteorol. Soc. Jpn., 99, 205–237, https://doi.org/10.2151/jmsj.2021-011, 2021.
Skofronick-Jackson, G., Petersen, W., Berg, W., Kidd, C., Stocker, E., Kirschbaum, D., Kakar, R., Braun, S., Huffman, G., Iguchi, T., Kirstetter, P., Kummerow, C., Meneghini, R., Oki, R., Olson, W., Takayabu, Y., Furukawa, K., and Wilheit, T.: The Global Precipitation Measurement (GPM) mission for science and society, B. Am. Meteorol. Soc., 98, 1679–1695, https://doi.org/10.1175/BAMS-D-15-00306.1, 2017.
Skofronick-Jackson, G., Kirschbaum, D., Petersen, W., Huffman, G., Kidd, C., Stocker, E., and Kakar, R.: The Global Precipitation Measurement (GPM) mission's scientific achievements and societal contributions: Reviewing four years of advanced rain and snow observations, Q. J. Roy. Meteor. Soc., 144, 27–48, https://doi.org/10.1002/qj.3313, 2018.
Tang, Q., Xiao, H., Guo, C., and Feng, L.: Characteristis of the raindrop size distributions and their retrieved polarimetric radar parameters in northern and southern China, Atmos. Res., 135–136, 59–75, https://doi.org/10.1016/j.atmosres.2013.08.003, 2014.
Testud, J., Oury, S., Amayenc, P., and Black, R. A.: The concept of “normalized” distributions to describe raindrop spectra: A tool for cloud physics and cloud remote sensing, J. Appl. Meteorol., 40, 1118–1140, https://doi.org/10.1016/S1464-1909(00)00122-2, 2001.
Tokay, A. and Beard, K. V.: A Field Study of Raindrop oscillations. Part I: Observation of Size Spectra and Evaluation of Oscillation Causes, J. Appl. Meteorol., 35, 1671–1687, https://doi.org/10.1175/1520-0450(1996)035<1671:AFSORO>2.0.CO;2, 1996.
Ulbrich, C. W.: Natural variations in the analytical form of the raindrop size distribution, J. Appl. Meteorol. Clim., 22, 1764–1775, https://doi.org/10.1175/1520-0450(1983)022<1764:NVITAF>2.0.CO;2, 1983.
Wang, G., Liu, S., and Liu, L.: Uncertainties in retrieving microphysical properties of rain profiles using ground-based dual-frequency radar, Meteorol. Appl., 27, e1876, https://doi.org/10.1002/met.1876, 2020.
Waterman, P. C.: Matrix formulation of electromagnetic scattering, P. IEEE, 53, 805–812, https://doi.org/10.1109/PROC.1965.4058, 1965.
Waterman, P. C.: Symmetry, unitarity and geometry in electromagnetic scattering, Phys. Rev., 3, 825–839, https://doi.org/10.1103/PhysRevD.3.825, 1971.
- Abstract
- Introduction
- Overall retrieval strategy
- Instrument and Data Processing
- Raindrop Size Distribution Retrieval and Evaluation
- Discussion and Limitations
- Conclusions
- Code and data availability
- Author contributions
- Competing interests
- Disclaimer
- Acknowledgements
- Financial support
- Review statement
- References
- Abstract
- Introduction
- Overall retrieval strategy
- Instrument and Data Processing
- Raindrop Size Distribution Retrieval and Evaluation
- Discussion and Limitations
- Conclusions
- Code and data availability
- Author contributions
- Competing interests
- Disclaimer
- Acknowledgements
- Financial support
- Review statement
- References