
the Creative Commons Attribution 4.0 License.
the Creative Commons Attribution 4.0 License.
 | 19 Oct 2026
Comprehensive validation of MODIS atmospheric temperature profile data across mainland China using sounding observations
Wenjie Zhang
Mengxi Qu
Ranhao Sun
Jiarui Zhao
Guicai Ning
Aziz Inamov
Zokhid Mamatkulov
Di Zhou
Bakhtiyor Pulatov
Yuanjian Yang

The vertical profile of atmospheric temperature is crucial for understanding energy transfer within the climate system. The Moderate Resolution Imaging Spectroradiometer (MODIS) atmospheric profile product (MOD07_L2) provides vertical temperature profiles at 5 km spatial resolution. However, comprehensive validation of its absolute accuracy – particularly for lower tropospheric stability (LTS) and temperature inversion layer (TIL) detection – remains limited. Therefore, this study systematically evaluated sounding observations collected at 74 stations across mainland China from 2003 to 2020, covering both daytime and nighttime periods. Results indicated that MOD07_L2 temperature-profile retrievals were generally more accurate at nighttime than during daytime and performed better in the upper layers (400–620 hPa) than in lower layers (850–1000 hPa). In particular, pronounced negative biases were observed at 850 and 920 hPa, especially during daytime. In contrast, MODIS-derived LTS was more accurate during daytime (r = 0.74, B = −0.33 K, RMSE = 4.52 K) than at nighttime (r = 0.57, B = −3.59 K, RMSE = 6.78 K). For TIL, MOD07_L2 displayed limited detection capability, achieving an overall detection rate of 6.6 % during daytime and 13.1 % at nighttime. This study provides essential data support for atmospheric science, hydrology, and ecology fields that rely on high-resolution vertical temperature profiles.
- Article
(15236 KB) - Full-text XML
- BibTeX
- EndNote


The vertical distribution of atmospheric temperature constitutes a fundamental component of Earth's climate system, profoundly influencing weather patterns, atmospheric circulation, and surface environmental processes. In recent years, intensified global climate change has induced substantial alterations in this distribution. Notably, the pronounced tropospheric warming juxtaposed against stratospheric cooling highlights the intricate energy exchanges and dynamic interactions among atmospheric layers (Dessler and Davis, 2010; Seidel et al., 2016). These anomalous variations in temperature profiles have consequently reconfigured global circulation patterns and heightened the frequency of extreme weather events (Seeley and Wordsworth, 2021; Galfi and Lucarini, 2021).
In recent years, rapid advancements in remote sensing technology and numerical simulations have greatly advanced the observation and analysis of vertical temperature distributions from the surface to the stratosphere (Santer et al., 2018; Thorne et al., 2011). Although vertical temperature data are now available from diverse sources, notable disparities remain among datasets in terms of spatial and temporal resolution, parameter coverage, and applicability. Reanalysis datasets, such as the National Centers for Environmental Prediction (NCEP), European Centre for Medium-Range Weather Forecasts Reanalysis 5 (ERA5), and Climatic Research Unit (CRU), offered global coverage and long-term consistency but fell short in meeting the demands of fields requiring high-resolution data (Hersbach et al., 2020; Gelaro et al., 2017; Saha et al., 2010). For instance, despite optimizations in NCEP's boundary layer parameterization, its coarse spatial resolution (2.5°) remained inadequate for resolving local-scale temperature details (Saha et al., 2010; Grimmond et al., 2010). Similarly, while the CRU dataset provided long-term records, its 0.5° resolution constrained its utility in local-scale studies (Harris et al., 2020). Furthermore, although ERA5 excelled in global climate trend analysis, its 0.25° resolution still imposed limitations on regional-scale investigations (Zhao et al., 2014). In contrast, the Moderate Resolution Imaging Spectroradiometer (MODIS) atmospheric profile product (MOD07_L2) emerged as an optimal choice for regional studies, owing to its high spatial resolution of 5 km (Schwarz et al., 2011; Chen et al., 2019). However, existing research has primarily focused on the retrieval accuracy of surface or near-surface temperatures. For example, Ouyang et al. (2015) evaluated the effects of atmospheric water vapor and land-surface emissivity on land surface temperature retrieval in the Heihe River Basin, while Zhu et al. (2017) used MOD07_L2-derived near-surface air temperature for regional daytime air-temperature estimation in the eastern Qaidam Basin. Systematic evaluations of vertical temperature profiles, particularly in the mid-to-upper atmosphere, remain limited (Zhang et al., 2021; Yuan et al., 2023). Additionally, some studies have employed MOD07_L2 vertical temperature profiles to examine atmospheric structures and thermal stratification, albeit relying on limited station data (Huang et al., 2020a; Barlow et al., 2015). To date, no nationwide assessment of these profiles has been undertaken across complex terrains and diverse climatic zones.
Lower tropospheric stability (LTS) served as a pivotal factor influencing atmospheric vertical distributions and weather patterns, governing air vertical mixing and convective activity intensity. Variations in LTS exhibited strong correlations with atmospheric temperature profiles, particularly in modulating extreme weather events such as severe pollution episodes, air humidity fluctuations, and precipitation extremes (Ning et al., 2018; Guo et al., 2016, 2017). Additionally, Li et al. (2014) confirmed that in low-latitude oceanic regions, enhanced LTS is typically significantly associated with subsidence at 700 hPa and increased low-level cloud cover, indicating that LTS serves as a crucial link connecting large-scale dynamical processes with the vertical structure of clouds. As a high-resolution atmospheric vertical profile product, MOD07_L2 held substantial potential for national-scale LTS analysis, yet its efficacy in this domain remained unvalidated. In addition, temperature inversion layers (TIL) represented a key feature of atmospheric vertical temperature distributions, suppressing vertical air mixing and thereby altering local climate conditions (Barlow et al., 2015; Li et al., 2019). Recent research further revealed a close coupling between the inversion layer and the atmospheric boundary layer, jointly influencing the vertical distribution and capture efficiency of aerosols (Liu et al., 2022). The MOD07_L2 dataset furnished temperature data across 20 vertical pressure levels, laying a robust foundation for inversion layer detection and analysis (Coll et al., 2012; Leng et al., 2019). Existing validations have predominantly relied on radiosonde or lidar data, leaving the performance of MOD07_L2 in inversion detection unevaluated on a systematic basis.
Therefore, this study makes several novel contributions to the field. First, it provides the first long-term (2003–2020) and nationwide validation of MOD07_L2 vertical temperature profiles across China's diverse climatic and topographic regions beyond previous site-specific assessments. Second, it represents the first systematic evaluation of the MOD07_L2 product's capability to retrieve LTS and detect TIL, thereby extending validation beyond single-level temperatures to derived parameters critical for boundary layer and climate studies. Third, the diagnostic analysis of retrieval errors – particularly the attribution of the pronounced negative biases at 850 and 920 hPa to surface and atmospheric conditions and the limited vertical sensitivity of infrared retrievals – provides actionable insights for both users of the MODIS archive and developers of future satellite missions.
2.1 Study area
This study covered the entirety of China, characterized by complex and diverse geographical and climatic conditions. China's topography ascended progressively from east to west, featuring low-lying plains and hills in the east and towering mountains and plateaus in the west – most notably the Tibetan Plateau, with an average elevation surpassing 4000 m. This configuration established a pronounced topographical gradient. China encompassed a broad spectrum of climate types, spanning tropical zones in the south to cold temperate regions in the north, complemented by alpine climates in the west, thereby engendering substantial climatic diversity. Eastern coastal areas are predominantly humid, whereas western regions are largely arid or semi-arid. These geographical and climatic characteristics amplified variations in surface temperature distributions and atmospheric boundary layer features across regions. To delineate these regional distinctions more precisely, this study adopted China's agricultural zoning framework (Fig. 1), comprising the Northeast China Plain (NEP), the Northern Arid and Semi-Arid Region (NAS), the Huang-Huai-Hai Plain (HHH), the Loess Plateau (LP), the Qinghai-Tibet Plateau (TP), the Middle-Lower Yangtze Plain (MYP), the Sichuan Basin and Surrounding Areas (SB), the Yunnan-Guizhou Plateau (YGP), and Southern China (SC). This zoning scheme is accessible via the following link: https://www.resdc.cn (last access: 7 October 2026).
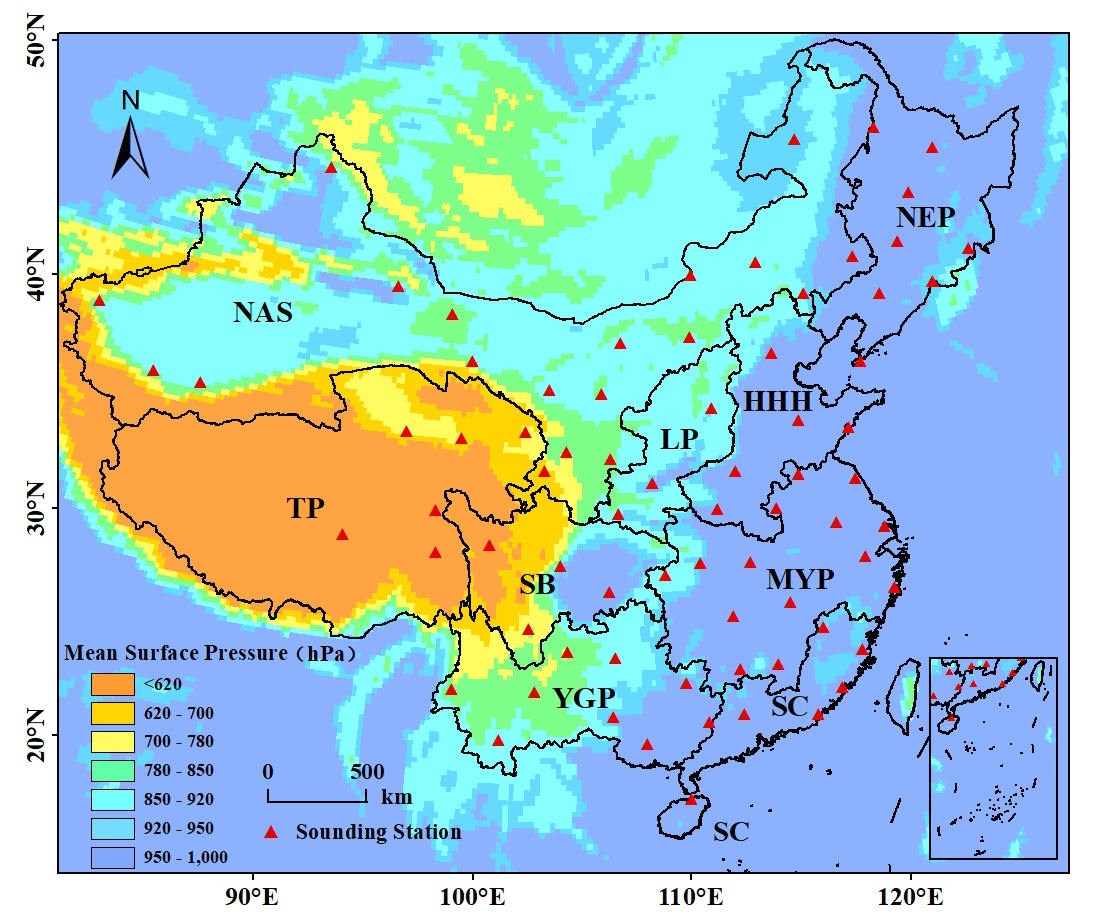
Figure 1Annual mean surface pressure and distribution of sounding stations in China from 2003 to 2020. The nine agricultural zones (NEP, NAS, HHH, LP, TP, MYP, SB, YGP, and SC) are labeled in the figure.
2.2 Data
2.2.1 Sounding data
The radiosonde observations used in this study were provided by the China Meteorological Administration (http://data.cma.cn, last access: 7 October 2026). Hereafter, these observations are referred to as sounding data. This study used vertical temperature profiles from sounding data collected at 74 stations across mainland China between 2003 and 2020. These data were collected using meteorological balloons that measure atmospheric temperature, pressure, and other parameters at various altitudes, ranging from the surface to the upper atmosphere. Sounding observations were conducted daily at 00:00 and 12:00 UTC at more than 100 pressure levels, enabling detailed characterization of the vertical temperature distribution. The sounding observations used in this study were collected in accordance with the requirements of the WMO GCOS Upper-Air Network (GUAN) and underwent rigorous quality-control procedures. During the study period, the data completeness rate across all selected stations exceeded 90 %, providing a reliable foundation for statistical analysis.
2.2.2 MOD07_L2 data
This study utilizes the MOD07_L2 Collection 6.1 atmospheric profile product generated by NASA's Moderate Resolution Imaging Spectroradiometer (MODIS) sensor. This version incorporates significant improvements in retrieval algorithms and cloud detection (https://ladsweb.modaps.eosdis.nasa.gov, last access: 7 October 2026). This product provided vertical atmospheric temperature profiles at 20 pressure levels (5, 10, 20, 30, 50, 70, 100, 150, 200, 250, 300, 400, 500, 620, 700, 780, 850, 920, 950, and 1000 hPa) with a spatial resolution of 5 km. For this study, temperature data were selected at the 400, 500, 620, 700, 780, 850, 920, 950, and 1000 hPa levels, which can represent key features of the vertical temperature distribution relevant to LTS calculation and TIL detection. For clear expression, the nine pressure levels were categorized into lower layers (850, 920, 950, and 1000 hPa), middle layers (700 and 780 hPa), and upper layers (400, 500, and 620 hPa). This classification aligned with standard isobaric surfaces in meteorological studies and reflected the characteristic atmospheric processes at varying altitudes. Additionally, surface pressure was obtained directly from the MOD07_L2 Surface_Pressure data set (hPa) at 5 km resolution and was used to calculate near-surface potential temperature for LTS. Fill values and records with invalid surface-pressure measurements were excluded. No external surface-pressure data were used, and no additional surface-pressure-specific correction was applied. Cloud screening followed the standard clear-sky screening implemented in the MOD07_L2 product.
2.3 Methodology
2.3.1 Vertical interpolation of vertical temperature profiles
To ensure comparability between the MOD07_L2 temperature retrievals and sounding observations, vertical interpolation was performed in this study. A linear interpolation method was employed to interpolate the sounding temperature data onto the corresponding pressure levels of MOD07_L2. If a pressure level Pmodis in MOD07_L2 exactly matched a pressure level in the sounding data, the corresponding sounding temperature Tsod was directly used without interpolation. For pressure levels in MOD07_L2 (Pmodis) that did not match any sounding pressure levels, the two adjacent pressure levels in the sounding data (Plower and Pupper) and the corresponding temperatures (Tlower and Tupper) were searched to satisfy the following relationship:
Then, the vertical temperature lapse rate γ was calculated as follows:
where γ is the temperature lapse rate with respect to pressure (°C hPa−1). Plower and Pupper are the two adjacent sounding pressure levels below and above Pmodis, respectively, and Tlower and Tupper are their corresponding sounding temperatures (°C). This value indicated the amount of temperature change corresponding to a unit change in pressure between adjacent sounding layers. By applying the calculated lapse rate γ, the temperature at the MOD07_L2 pressure level (Pmodis) was interpolated to obtain its equivalent sounding temperature value as below:
where Tmodis represents the equivalent sounding temperature (°C) interpolated to the MOD07_L2 pressure level Pmodis. When Pmodis fell outside the maximum or minimum pressure levels of the sounding data, the following approach was used to handle boundary cases: If the pressure value corresponding to the MOD07_L2 pressure level (Pmodis) was greater than the maximum pressure value (Pmax corresponding to the lowest altitude) in the sounding data, interpolation was performed using the two sounding pressure levels with the highest pressure values, Pmax−1 and Pmax. Similarly, if the pressure value of MOD07_L2 (Pmodis) was less than the minimum pressure value (Pmin corresponding to the highest altitude) in the sounding data, Pmin and Pmin+1 were used.
2.3.2 Accuracy evaluation metrics
The retrieval accuracy of MOD07_L2 was evaluated using the Pearson correlation coefficient (r), bias (B), and root mean square error (RMSE), which were calculated as follows:
where Mi and Si represent the MOD07_L2 retrieval and the corresponding sounding observation, respectively. and are their mean values, and n is the number of matched samples. Bias (B) was calculated as the mean difference between the MOD07_L2 retrievals and sounding observations. The correlation coefficient is dimensionless, whereas B and RMSE are expressed in °C. A negative B indicates an underestimation by MOD07_L2, while a positive B indicates an overestimation. The same metrics were also applied to the evaluation of MOD07_L2-derived LTS by replacing temperature with the corresponding LTS values. For LTS, B and RMSE are expressed in K.
2.3.3 Sensitivity analysis of temporal matching window
Sounding data are typically observed at 00:00 and 12:00 Beijing Time. However, due to the sun-synchronous orbit of the Terra satellite carrying MODIS, the overpass times of MOD07_L2 data exhibit spatial variations within China, with earlier overpass times in the eastern regions compared to the western regions. To ensure the comparability between satellite retrievals and sounding observations, and to assess the impact of time deviations on retrieval accuracy, this study conducted a time-matching sensitivity experiment. The time deviation () was divided into four intervals: 0–0.5, 0.5–1, 1–1.5, and 1.5–2 h. Statistical metrics between MOD07_L2 temperature retrieval values and sounding data were calculated within each interval to determine the optimal matching window. Detailed sensitivity analysis results are presented in the Results section of this article.
2.3.4 Lower Tropospheric Stability Calculation
Lower tropospheric stability (LTS) was defined as the difference between the potential temperature at the 700 hPa level and that near the surface (Guo et al., 2016; Ning et al., 2018). To accurately obtain the near-surface temperature from MOD07_L2 data, a linear interpolation method was employed. Based on the two pressure levels closest to the surface and their corresponding temperature values, the temperature corresponding to the surface pressure was calculated. In the sounding data, the near-surface layer was defined as the lowest-altitude, highest-pressure valid level and its corresponding temperature in the raw data. Subsequently, the temperatures at the 700 hPa level and near the surface were converted to potential temperatures using the standard formula. The calculation formula for potential temperature (θ) is as follows:
In this formula, T denotes temperature (K), p denotes pressure, p0 is the reference pressure, typically taken as 1000 hPa, R is the gas constant for dry air, taken as 287.05 J kg−1 K−1, and cp is the specific heat at constant pressure for dry air, taken as 1004 J kg−1 K−1. After obtaining the potential temperatures at the 700 hPa level and near the surface, LTS was calculated as their difference:
LTS measures atmospheric stability, with higher values indicating greater stability. It is expressed in kelvins (K).
2.3.5 Temperature inversion layer detection
The identification of TIL was based on analyzing the vertical temperature differences between neighboring pressure levels. Under standard adiabatic conditions, temperature should decrease as pressure decreases. If adverse, temperature inversion was defined. To evaluate the detection accuracy of temperature inversions in the MOD07_L2 data, its results were compared against sounding observations. In this study, an inversion was regarded as co-detected when both the MOD07_L2 profile and its corresponding sounding profile contained at least one inversion. Nboth represents the number of matched profiles in which both MOD07_L2 and sounding data detected at least one inversion. The ratio of this number to the total number of sounding profiles containing at least one inversion (NSD) defines the inversion detection accuracy for that dataset:
3.1 Sensitivity analysis of time-matching window
To determine the optimal time-matching window, we analyzed the variations in accuracy between MOD07_L2 temperature retrievals and sounding observations across different time-difference intervals (; Fig. 2). The results showed that, for h, no valid matches were available in the NEP, while the number of matches in the HHH was too small to support a nationwide evaluation. When the window was expanded to 1–1.5 and 1.5–2 h, the sample size increased significantly. During daytime, the B values for the SB and LP reached −3.81 and −3.30 °C, respectively, under the 1–1.5 h window (Fig. 2c), with corresponding RMSE values of 4.33 and 4.60 °C. Under the 1.5–2 h window, the daytime B in the HHH was −1.91 °C, with a corresponding RMSE of 3.78 °C. These results suggest that greater time differences may contribute to larger discrepancies between MOD07_L2 retrievals and sounding observations in some regions. By contrast, nighttime B and RMSE varied relatively little across the four time windows. At the national scale, extending the matching window from < 1 h to < 2 h increased the number of matched records from 554 128 to 894 061 during daytime and from 299 578 to 711 344 at nighttime. Averaged across the nine pressure levels, daytime r, B, and RMSE changed from 0.961, −1.00 °C, and 3.22 °C to 0.963, −0.91 °C, and 3.18 °C, respectively; the corresponding nighttime values changed from 0.958, −0.46 °C, and 2.76 °C to 0.968, −0.37 °C, and 2.73 °C. Thus, although errors increased in a few regions, the 2 h window substantially increased sample coverage without reducing national-scale accuracy and was retained for the subsequent analyses.
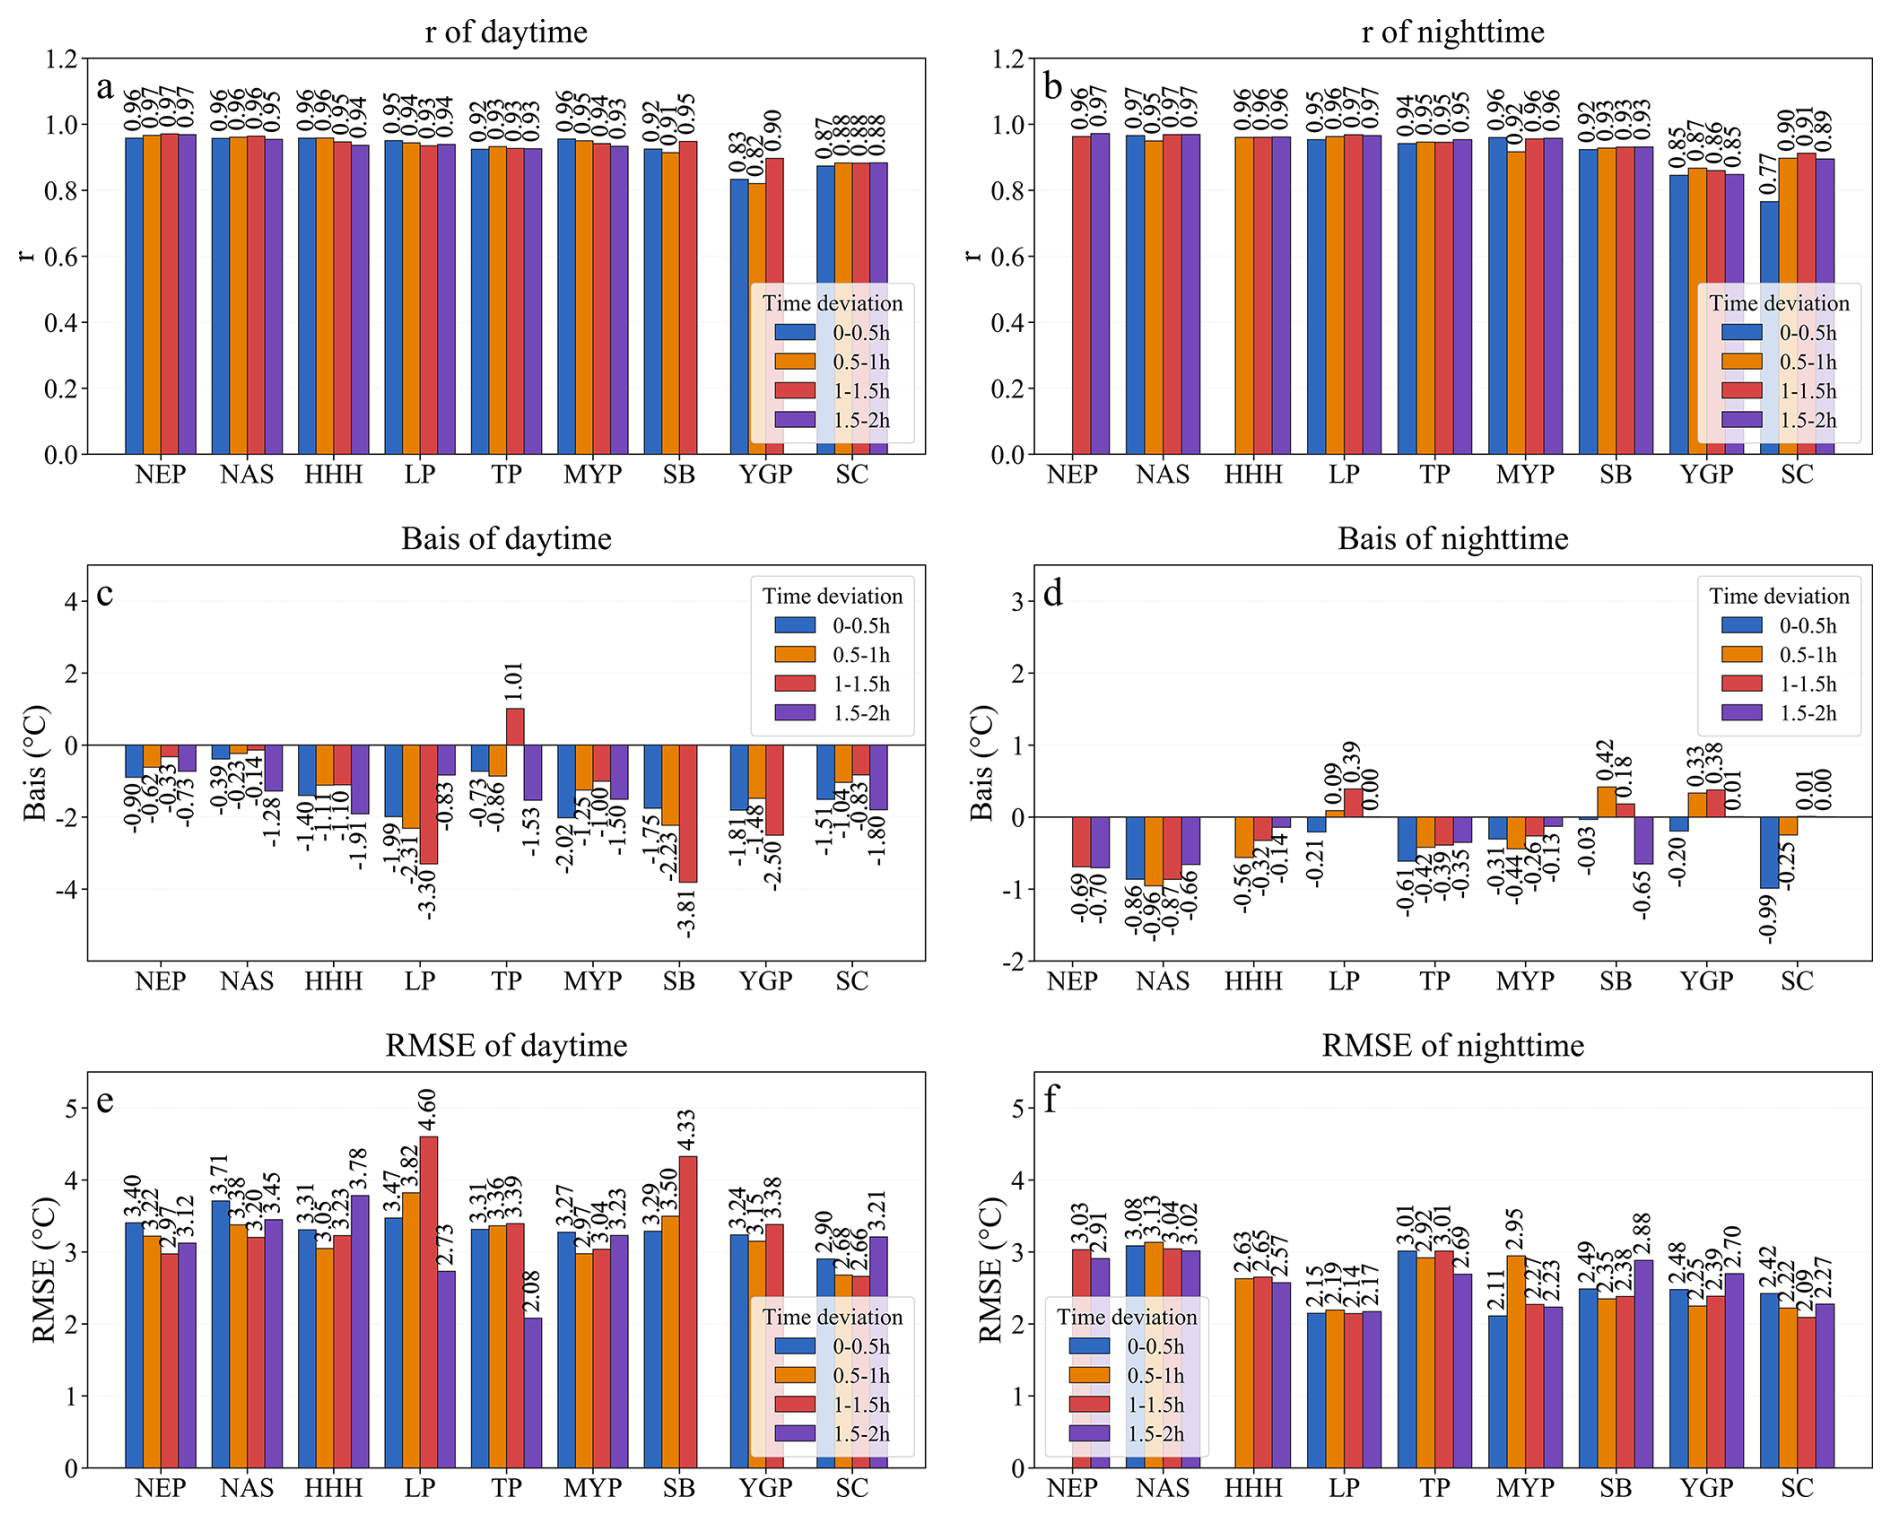
Figure 2Sensitivity analysis of temperature retrieval accuracy to different temporal matching windows. Panels (a), (c), and (e) show daytime correlation coefficient (r), bias (B), and root mean square error (RMSE), respectively; panels (b), (d), and (f) show the corresponding nighttime statistics.
3.2 The overall absolute retrieval accuracy during daytime and nighttime
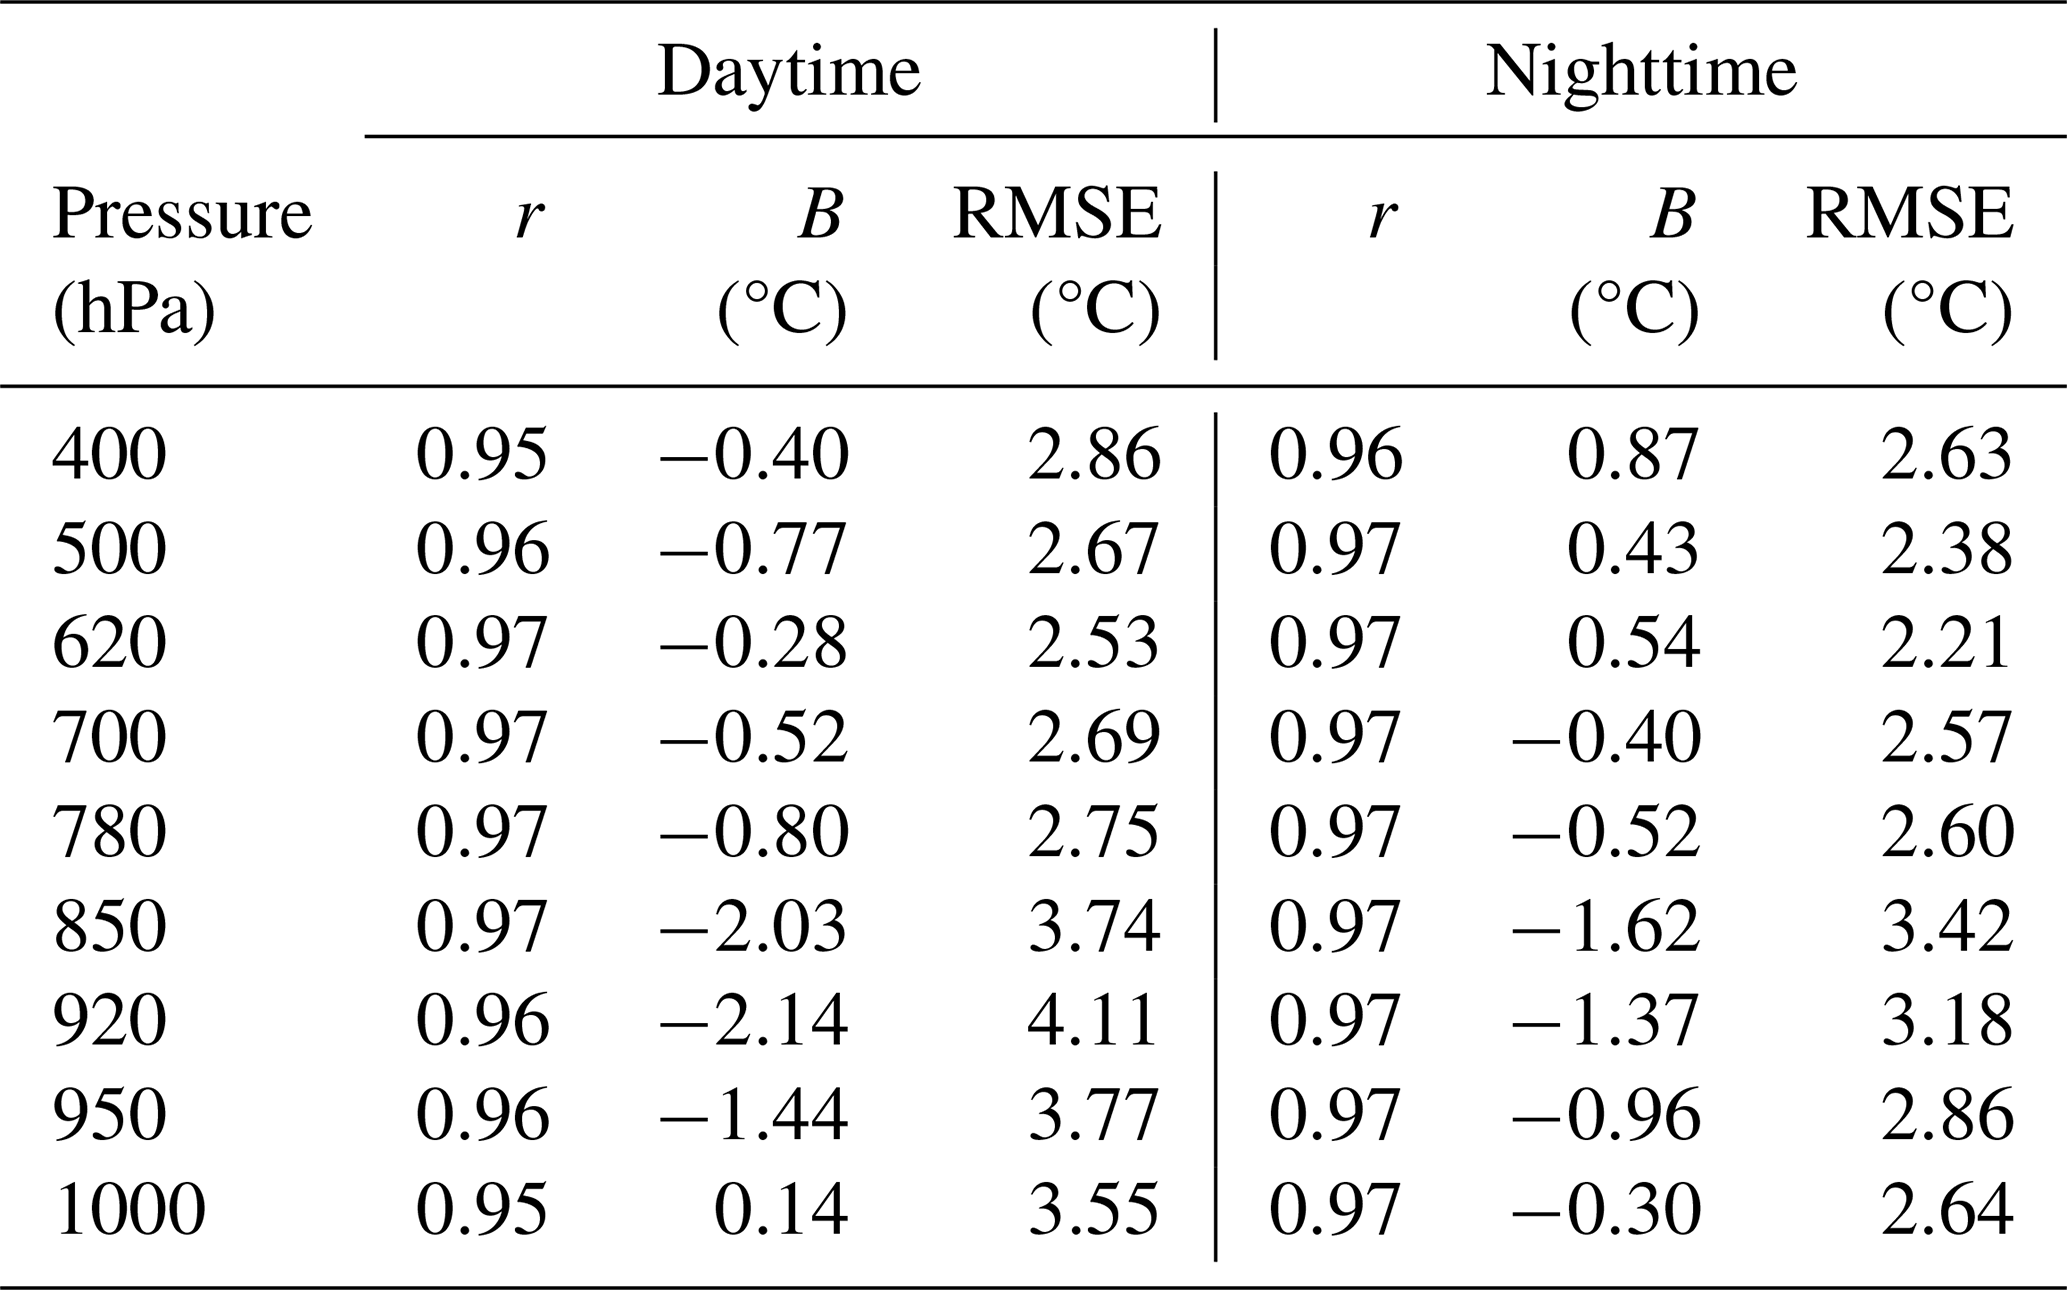
Figure 3 illustrates the density scatterplots comparing MOD07_L2 instantaneous retrievals with sounding temperatures at different pressure levels during daytime. MOD07_L2 agreed closely with the sounding observations in the upper layers (400–620 hPa), with r values of at least 0.95 and RMSE values ranging from 2.53 to 2.86 °C. Retrieval errors increased toward the lower layers, particularly at 850 and 920 hPa, where the B values were −2.03 and −2.14 °C, respectively, with corresponding RMSE values of 3.74 and 4.11 °C. Thus, the daytime retrievals showed pronounced negative biases and greater uncertainty at these two lower pressure levels.
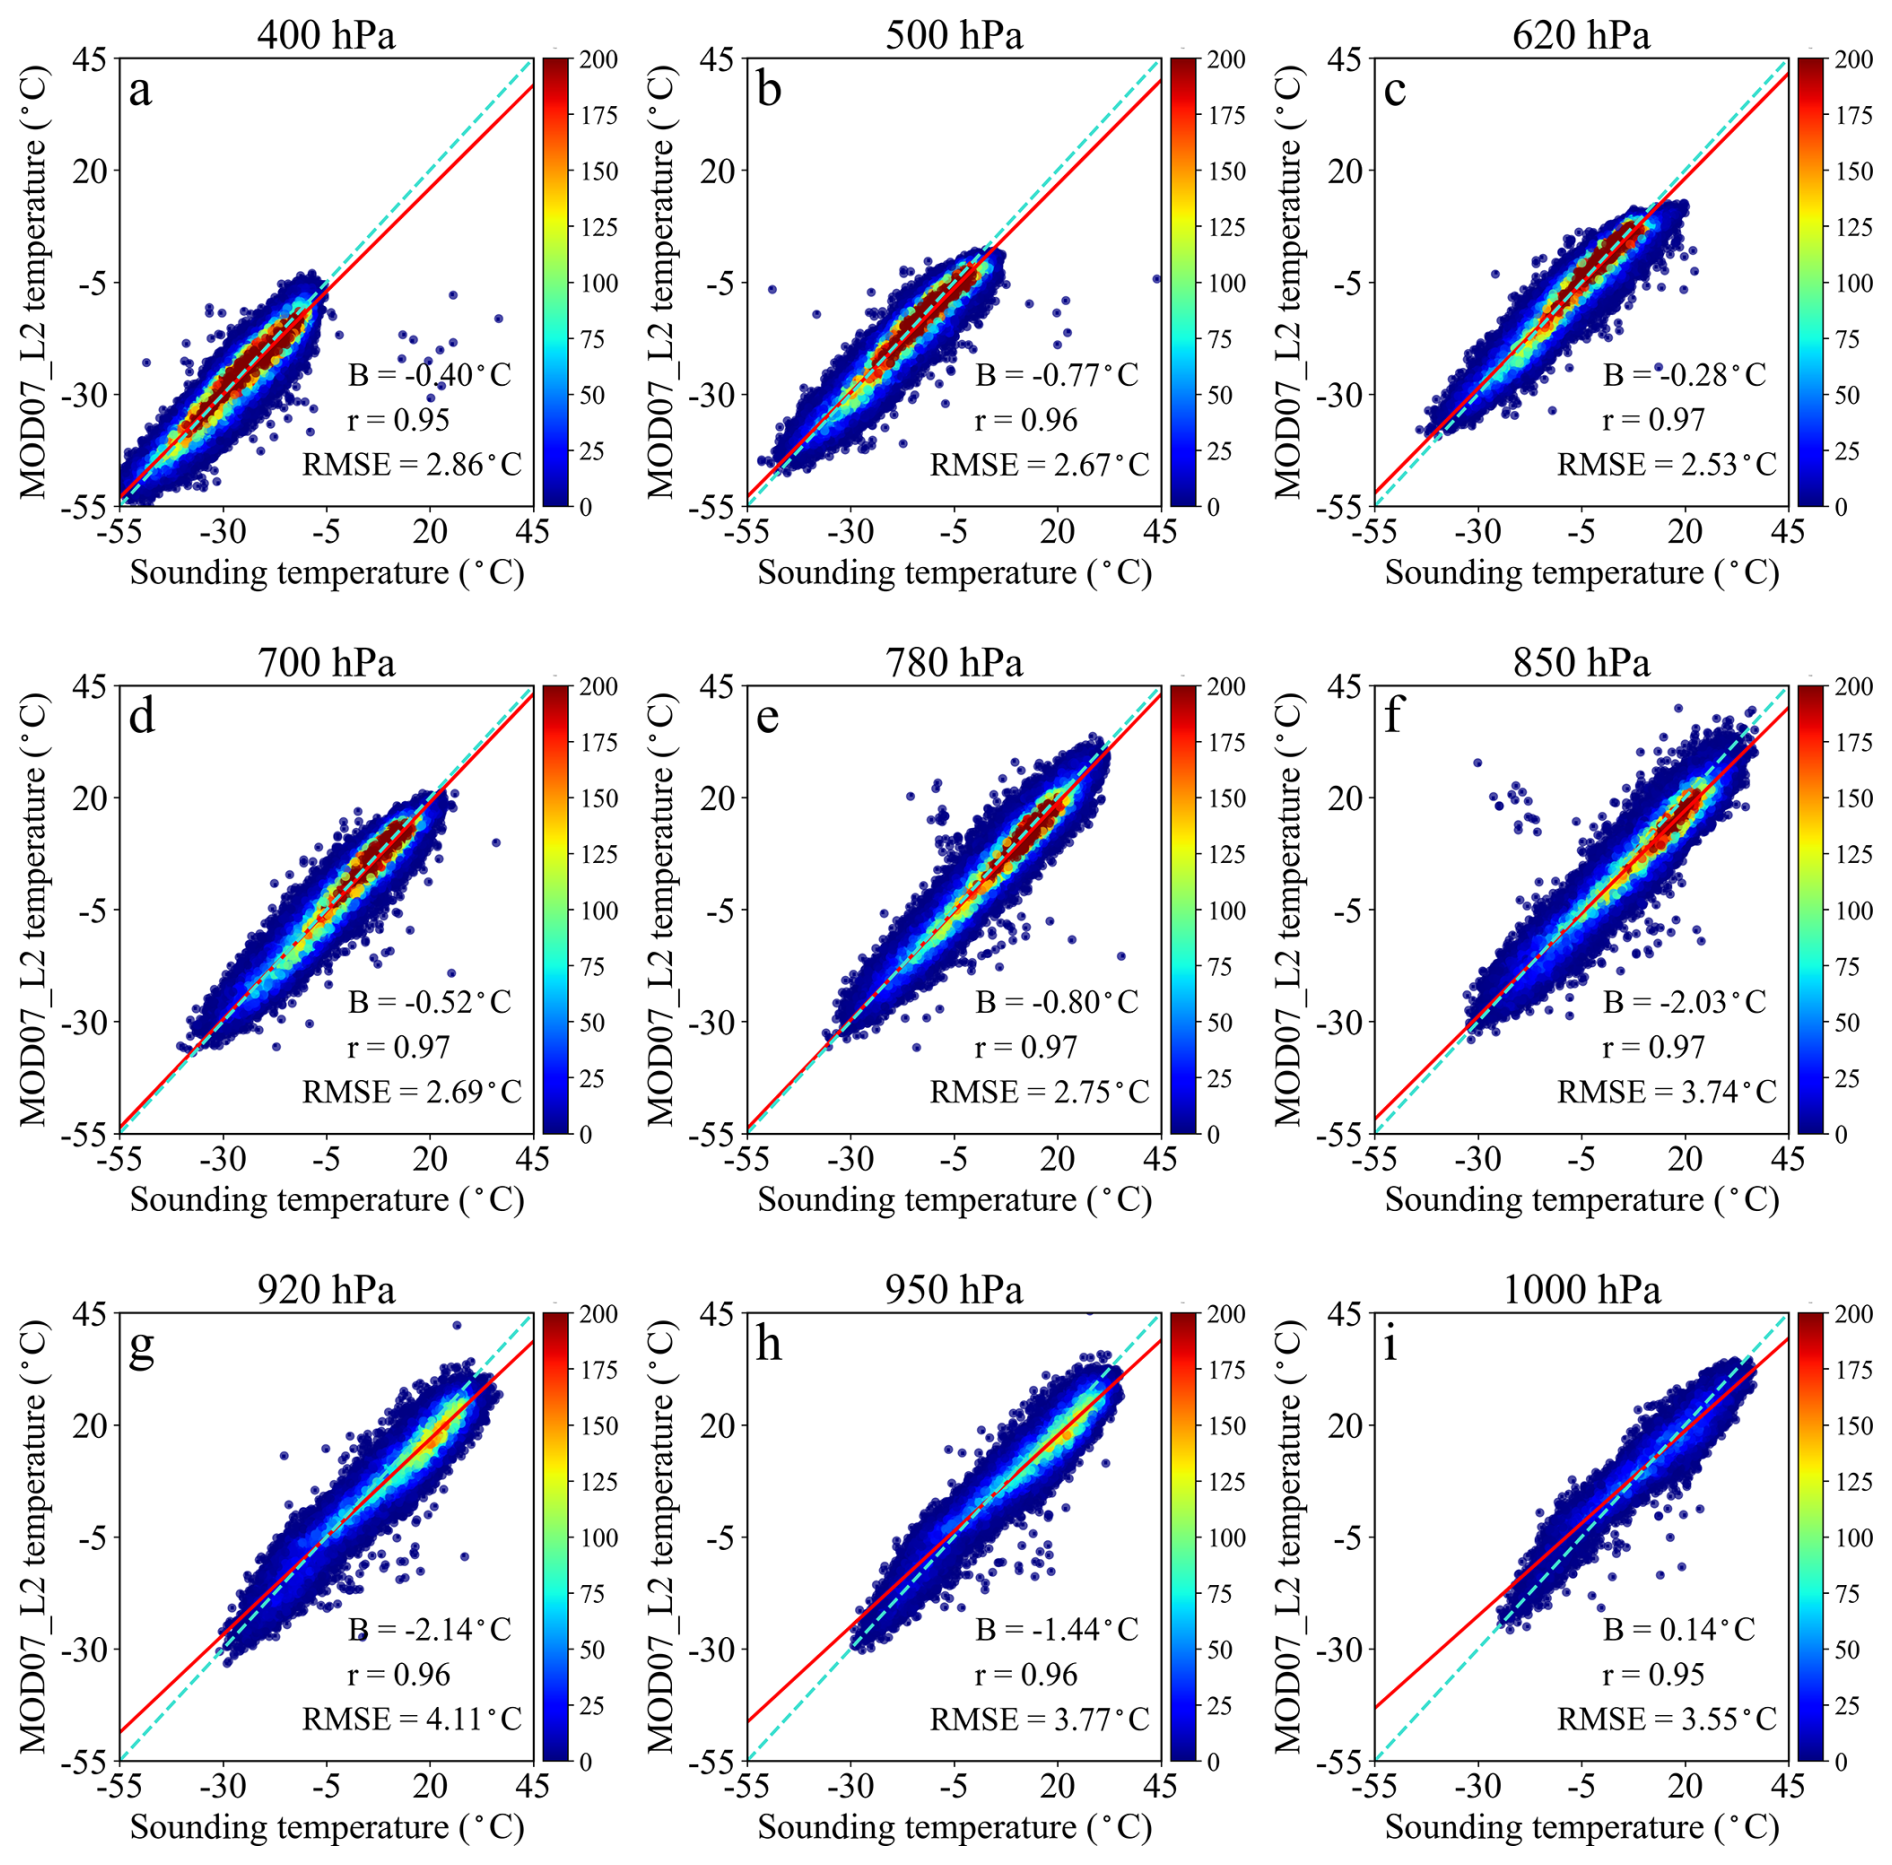
Figure 3Overall accuracy of MOD07_L2 temperature retrievals evaluated against sounding observations during daytime from 2003 to 2020.
Figure 4 illustrates the density scatterplots comparing MOD07_L2 instantaneous retrievals with sounding observations at different pressure levels during nighttime. In general, the overall retrieval performance during nighttime was better than that during daytime. In the upper layers, r was above 0.96, the RMSE ranged from 2.21 to 2.63 °C, indicating strong correlations and relatively small errors. RMSE values were lower at nighttime than during daytime at all examined pressure levels. At 850 and 920 hPa, the B values were −1.62 and −1.37 °C, respectively, with corresponding RMSE values of 3.42 and 3.18 °C. Although these biases and RMSE values were lower than the corresponding daytime values, they remained relatively large compared with those at the other pressure levels.
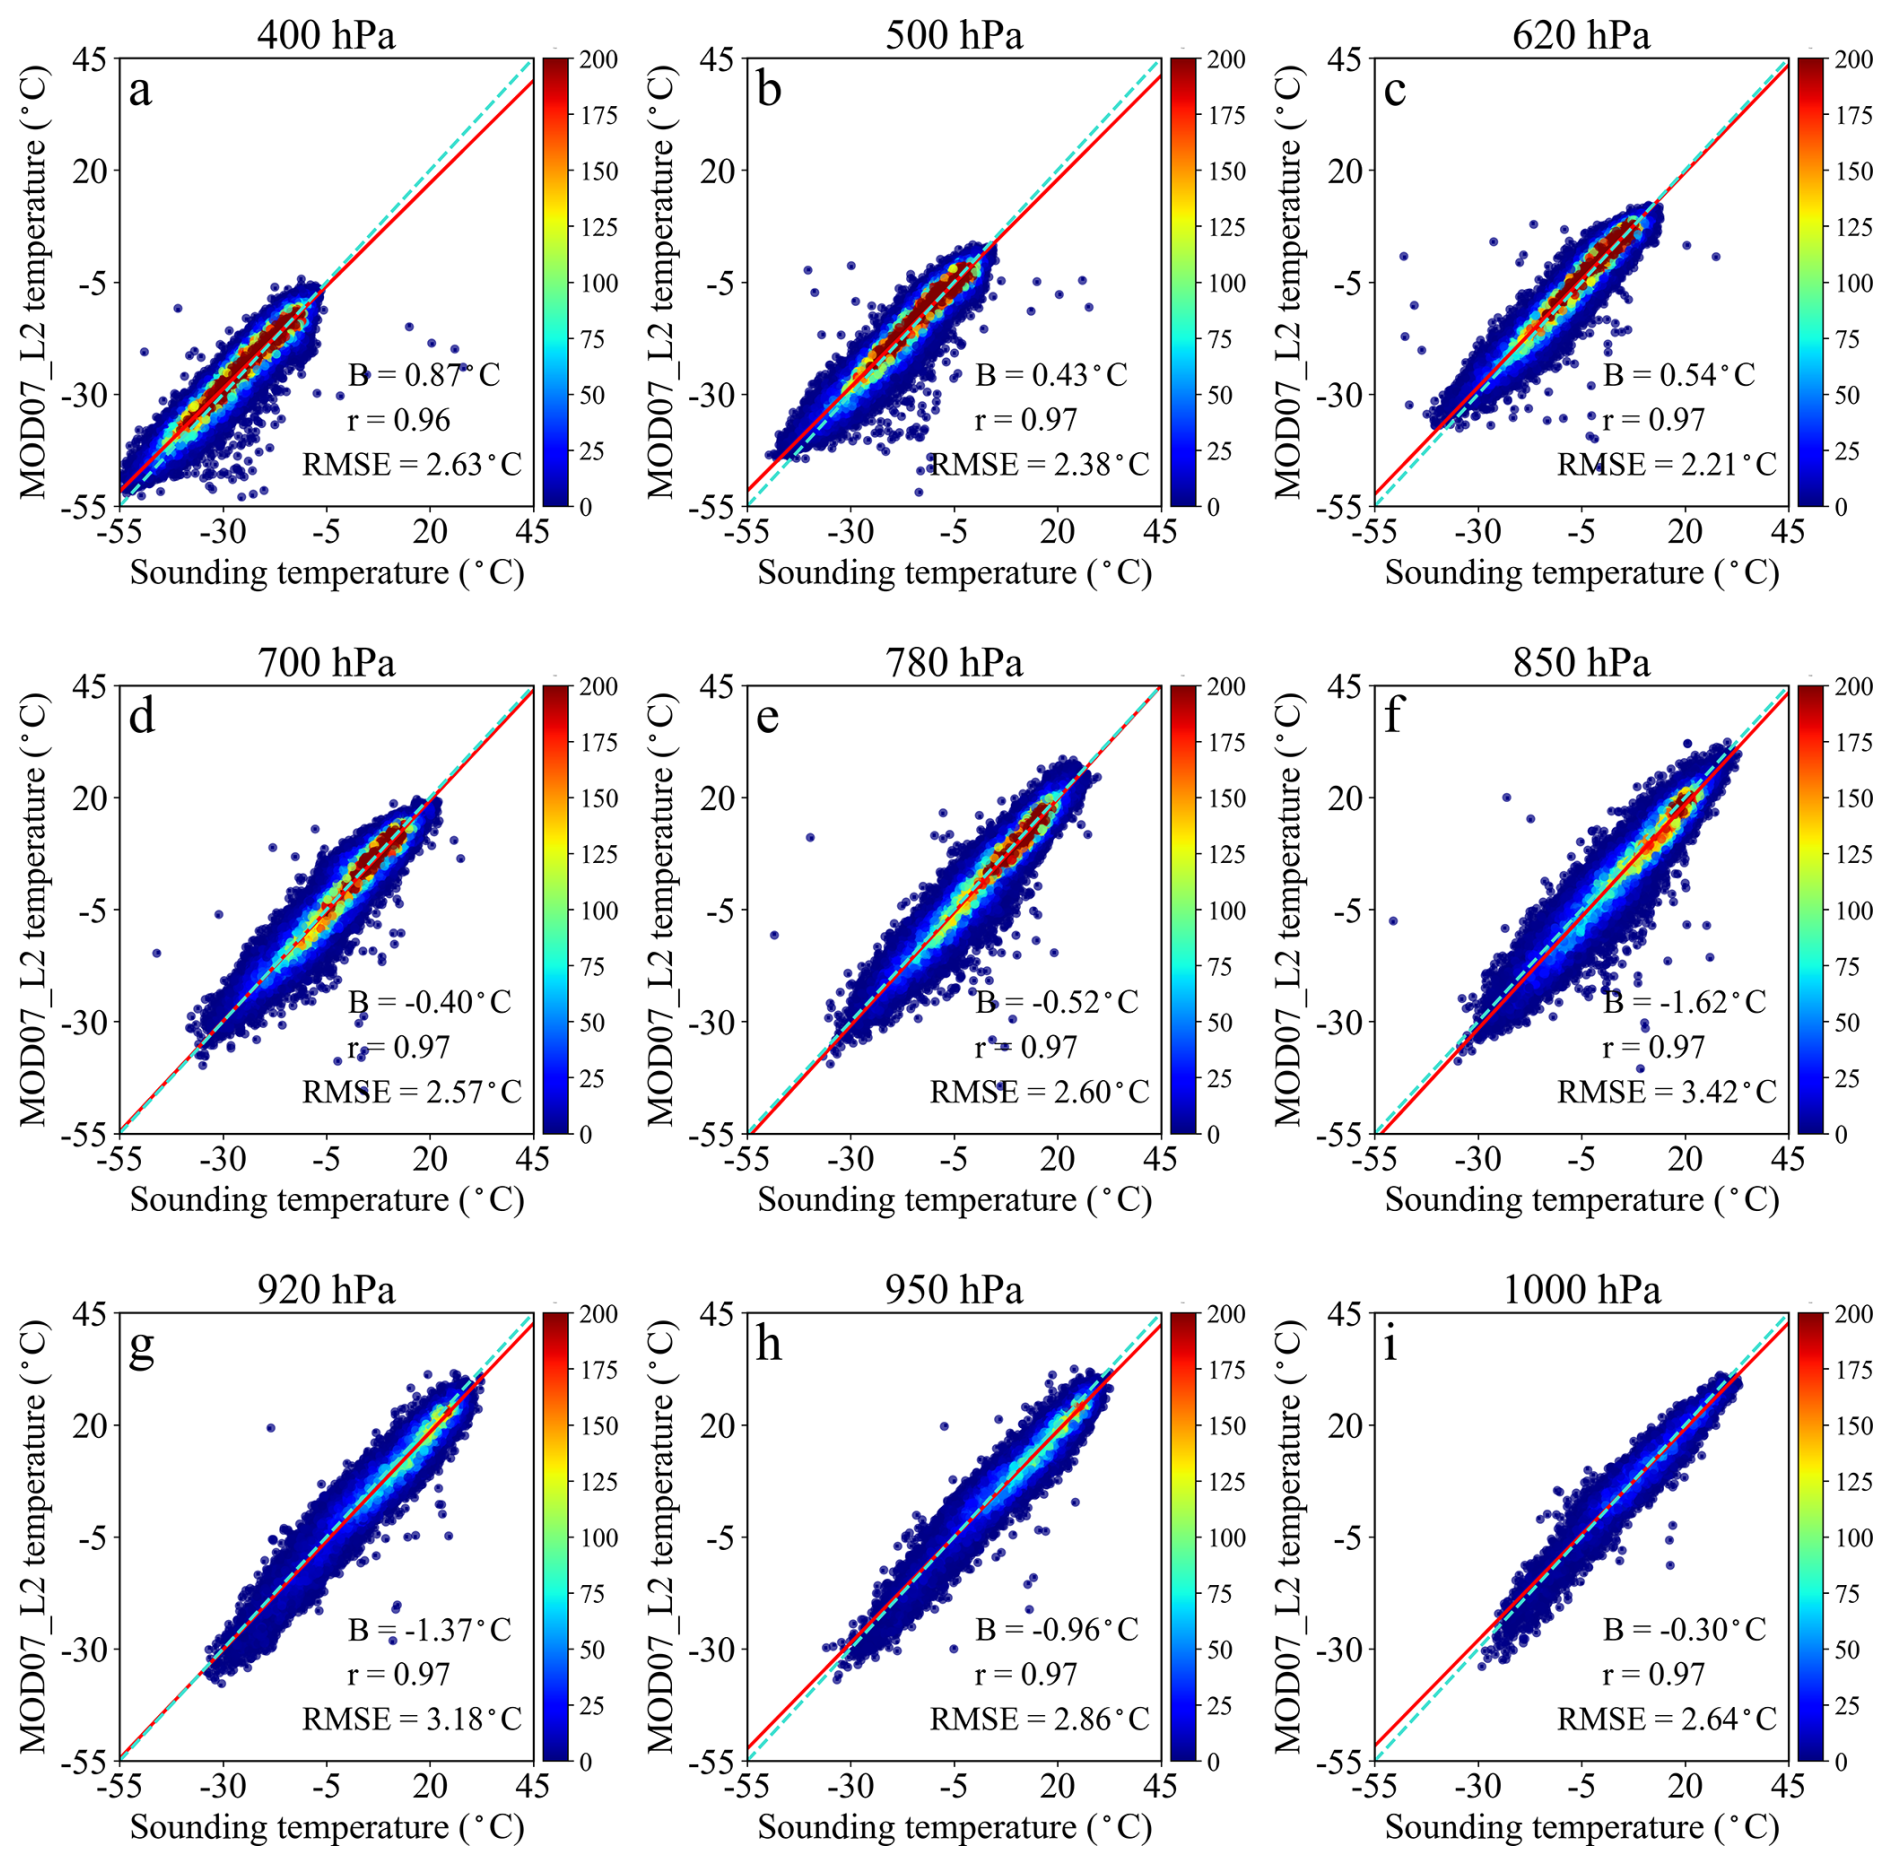
Figure 4Overall accuracy of MOD07_L2 temperature retrievals evaluated against sounding observations during nighttime from 2003 to 2020.
Table 1 summarizes the national-scale validation statistics (r, B, and RMSE) for all nine pressure levels.
Table 1National-scale validation statistics for MOD07_L2 temperature retrievals at nine pressure levels during daytime and nighttime from 2003 to 2020.
3.3 The Spatial Distribution of the Absolute Retrieval Accuracy
Figure 5 presents the spatial distribution of MOD07_L2 retrieval accuracy metrics across various pressure levels during daytime. The first two columns display the effective matching sample size for each station and the pressure difference (hereafter ΔP) between the local near-surface pressure and the target pressure level, respectively. The pressure difference was calculated as , where Pnear-surface is the pressure of the local near-surface layer and Ptarget is the target pressure level. A smaller ΔP indicates that the target pressure level is closer to the local surface. The sample size generally exhibits a decreasing trend from northwest to southeast across China. In the upper layers, retrieval performance was generally better over the NEP, NAS, and HHH, which are characterized by relatively flat terrain and sufficient sample sizes. The r exceeded 0.95, the B was within ±2 °C, and the RMSE was around 2.5 °C. However, relatively large negative B values were observed over the MYP, whereas relatively large positive B values occurred over the TP. In the middle levels, B was generally small across most regions. In the lower layers, relatively large negative B values were observed in the western part of the NAS at 850 hPa. At 920 and 950 hPa, pronounced negative B values mainly occurred over southern regions, including the SC, YGP, SB, and MYP where RMSE exceeded 3.5 °C at some stations. At 1000 hPa, relatively large positive B values were observed in parts of the NEP. Overall, daytime retrieval errors became larger and more spatially variable in the lower layers, particularly over southern China and regions with complex terrain.
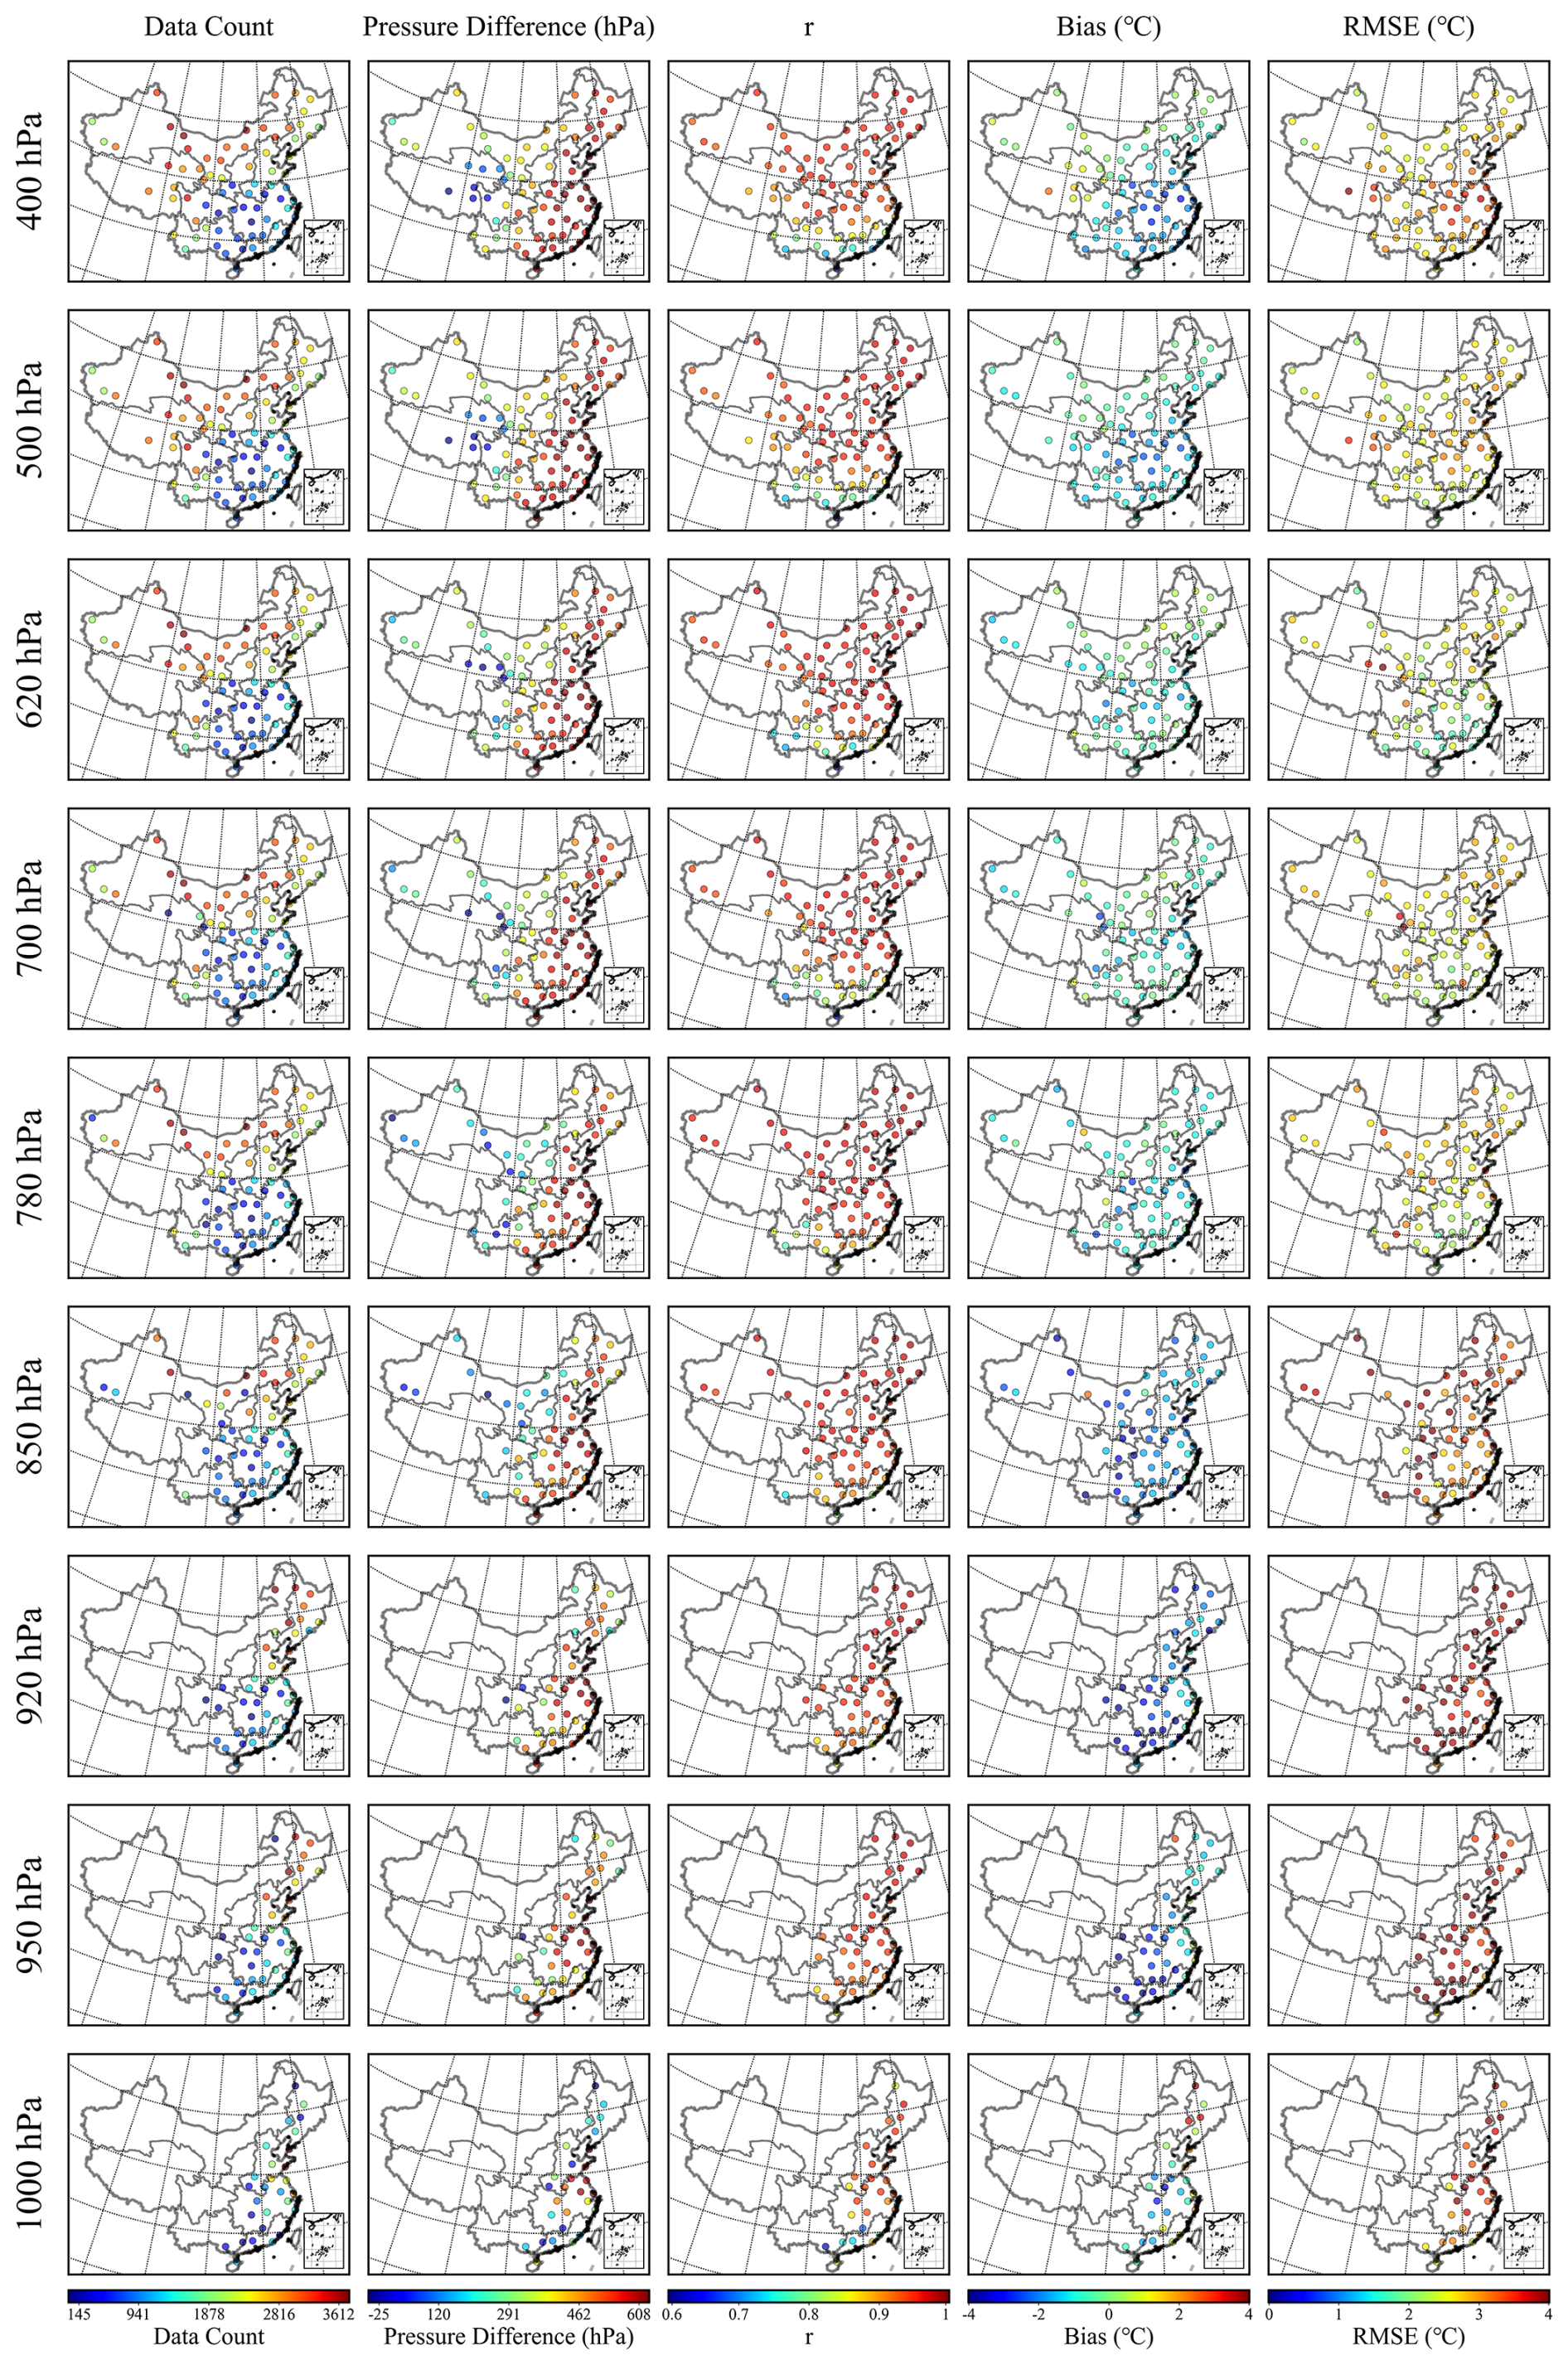
Figure 5Spatial distribution of statistical indicators at each station for MOD07_L2 temperature retrievals evaluated against sounding observations at nine pressure levels during daytime from 2003 to 2020.
Figure 6 illustrates the comparison between MOD07_L2-retrieved temperatures and sounding observations at different pressure levels during nighttime. The first two columns present the effective matched sample size for each station and the corresponding pressure difference (ΔP), calculated as described above, respectively. Spatially, the nighttime sample size exhibited a decreasing gradient from northeast to southwest in the upper and middle layers, while lower counts were observed in the lower layers over the NEP, SC, and the southeastern part of the YGP. In the upper layers, the retrieval accuracy was slightly higher than that during daytime over flat regions such as the NEP, HHH, and NAS. r exceeded 0.95, RMSE ranged from 2.0 to 2.5 °C at most stations, and slight positive biases were generally observed. Negative biases persisted over the MYP, but their absolute values were generally less than 2 °C. In the middle layers, nighttime retrieval errors were generally lower than those during daytime. In the lower layers, the retrieval accuracy at nighttime improved over most regions, especially over the HHH and MYP. In these regions, r approached 0.9, B remained close to 0 °C, and RMSE decreased to approximately 2.0 °C. By contrast, negative biases over the NAS and NEP became more pronounced, approaching −4 °C at some stations. In the NEP, where the sample size was relatively small, RMSE values ranged from 3.0 to 4.0 °C. Overall, nighttime retrieval performance improved across most regions, although relatively large negative biases and RMSE values persisted over the NAS and NEP in the middle and lower layers.
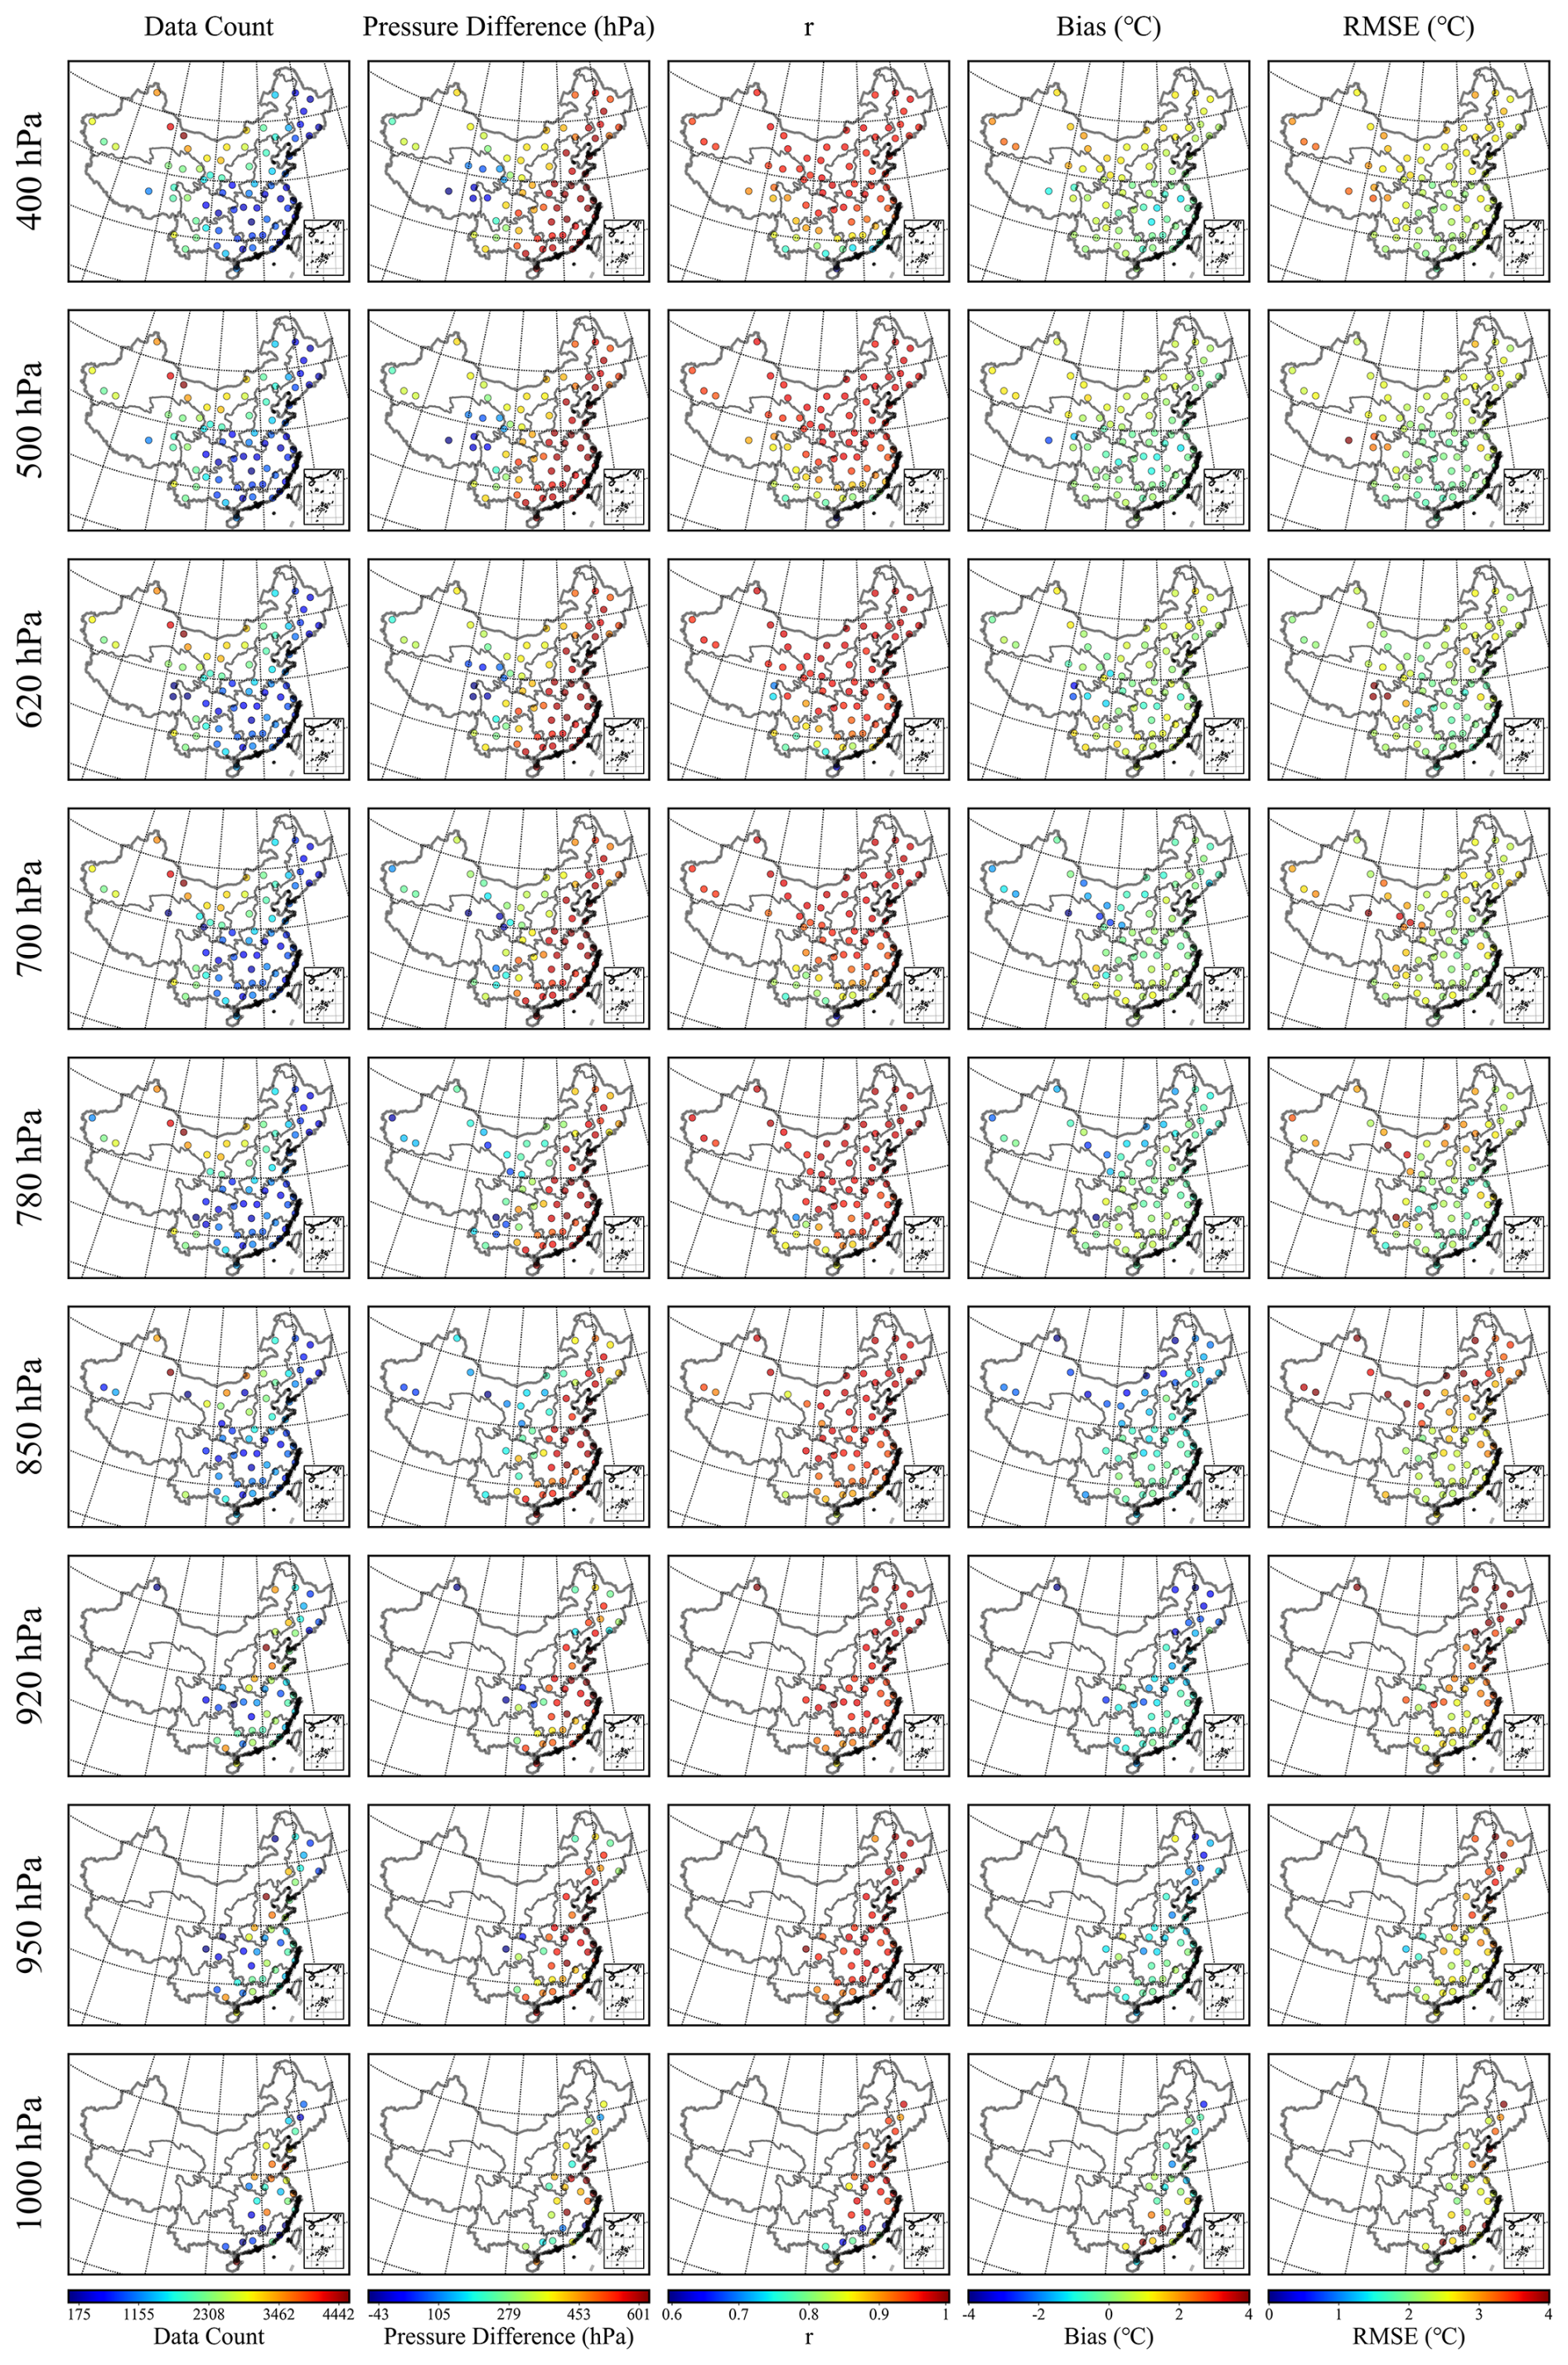
Figure 6Spatial distribution of statistical indicators at each station for MOD07_L2 temperature retrievals evaluated against sounding observations at nine pressure levels during nighttime from 2003 to 2020.
3.4 The accuracy of lower tropospheric stability
Figure 7 illustrated the ability of the MOD07_L2 product to capture lower tropospheric stability (LTS) during both daytime and nighttime. During daytime, the r, B, and RMSE were 0.74, −0.33 K, and 4.52 K, respectively. At night, r decreased to 0.57, B became more negative at −3.59 K, and RMSE increased to 6.78 K. Furthermore, the red regression line deviated more markedly from the cyan 1 : 1 line at night, indicating a stronger negative bias and greater dispersion in the MOD07_L2-derived LTS. Overall, MOD07_L2 captured daytime LTS more accurately than nighttime LTS.
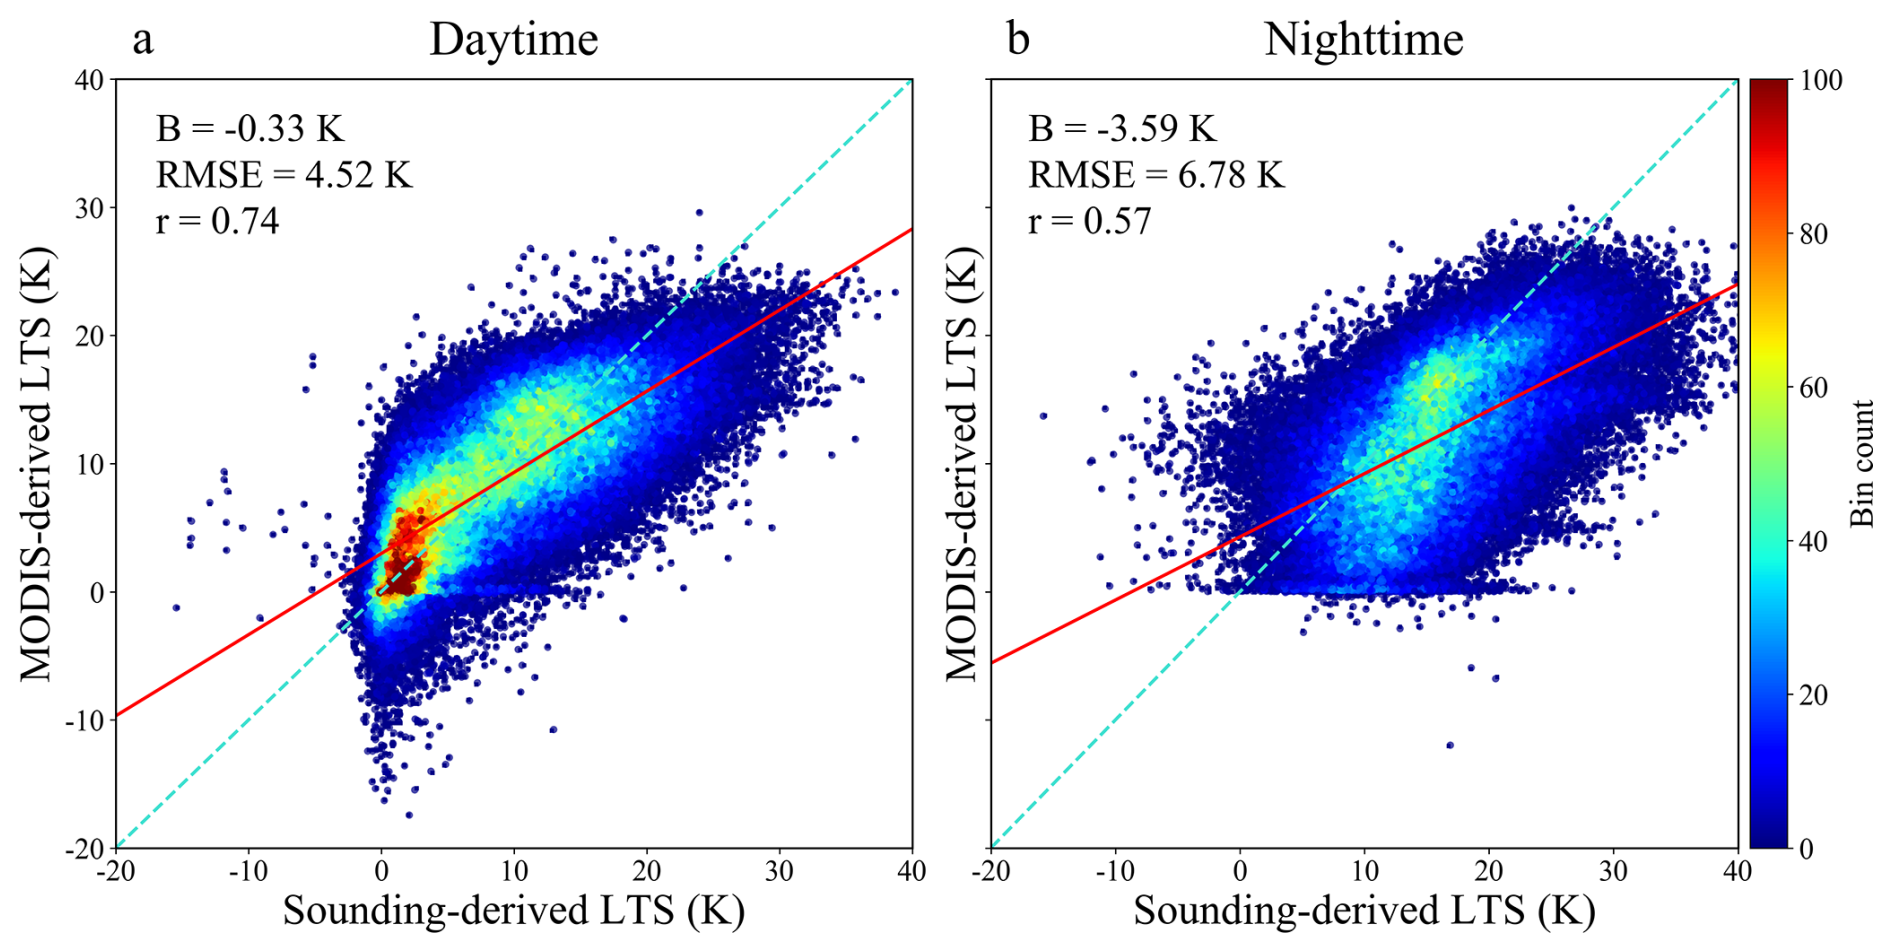
Figure 7Heat map of sounding-derived and MOD07_L2-derived lower tropospheric stability during daytime and nighttime from 2003 to 2020.
In terms of spatial distribution, the retrieval accuracy of LTS exhibited pronounced regional variability during both daytime and nighttime (Fig. 8). During daytime, r values were lower in humid and topographically complex regions such as the SB, MYP, LP, and HHH, with most values falling below 0.5. By contrast, higher r values were observed over the NAS and Northeast China Plain, with regional means of approximately 0.58. These results indicated that retrieval performances were superior in arid and flat terrains. The mean RMSE during daytime was approximately 4.38 K nationwide and was relatively low over the TP, SC, and SB, whereas higher values occurred over the HHH and Northeast China Plain. The mean bias was close to zero nationwide, although negative biases occurred over the TP and Northeast China Plain, whereas positive biases were evident over the YGP, SB, and LP. During nighttime, the spatial distribution of r exhibited a distinct pattern. Lower r values were observed over the TP, SB, LP, NAS, and YGP, whereas higher values occurred over the SC, MYP, Northeast China Plain, and HHH, suggesting that retrieval performance in humid zones improved at nighttime compared with daytime. Nighttime RMSE values were lower over the YGP, SC, MYP, and HHH, mostly ranging from 3 to 4 K, reflecting greater retrieval stability. Higher RMSE values occurred over the TP, NAS, LP, Northeast China Plain, and SB, with regional means generally exceeding 5 K, thereby indicating greater uncertainty. In terms of bias, relatively small deviations occurred over the HHH, SC, and YGP, whereas pronounced negative biases persisted over the TP, LP, NAS, and SB. Overall, the retrieval performance was better over arid and flat regions during daytime but improved over humid regions at nighttime, while larger nighttime uncertainties remained in arid, high-elevation, and topographically complex regions.
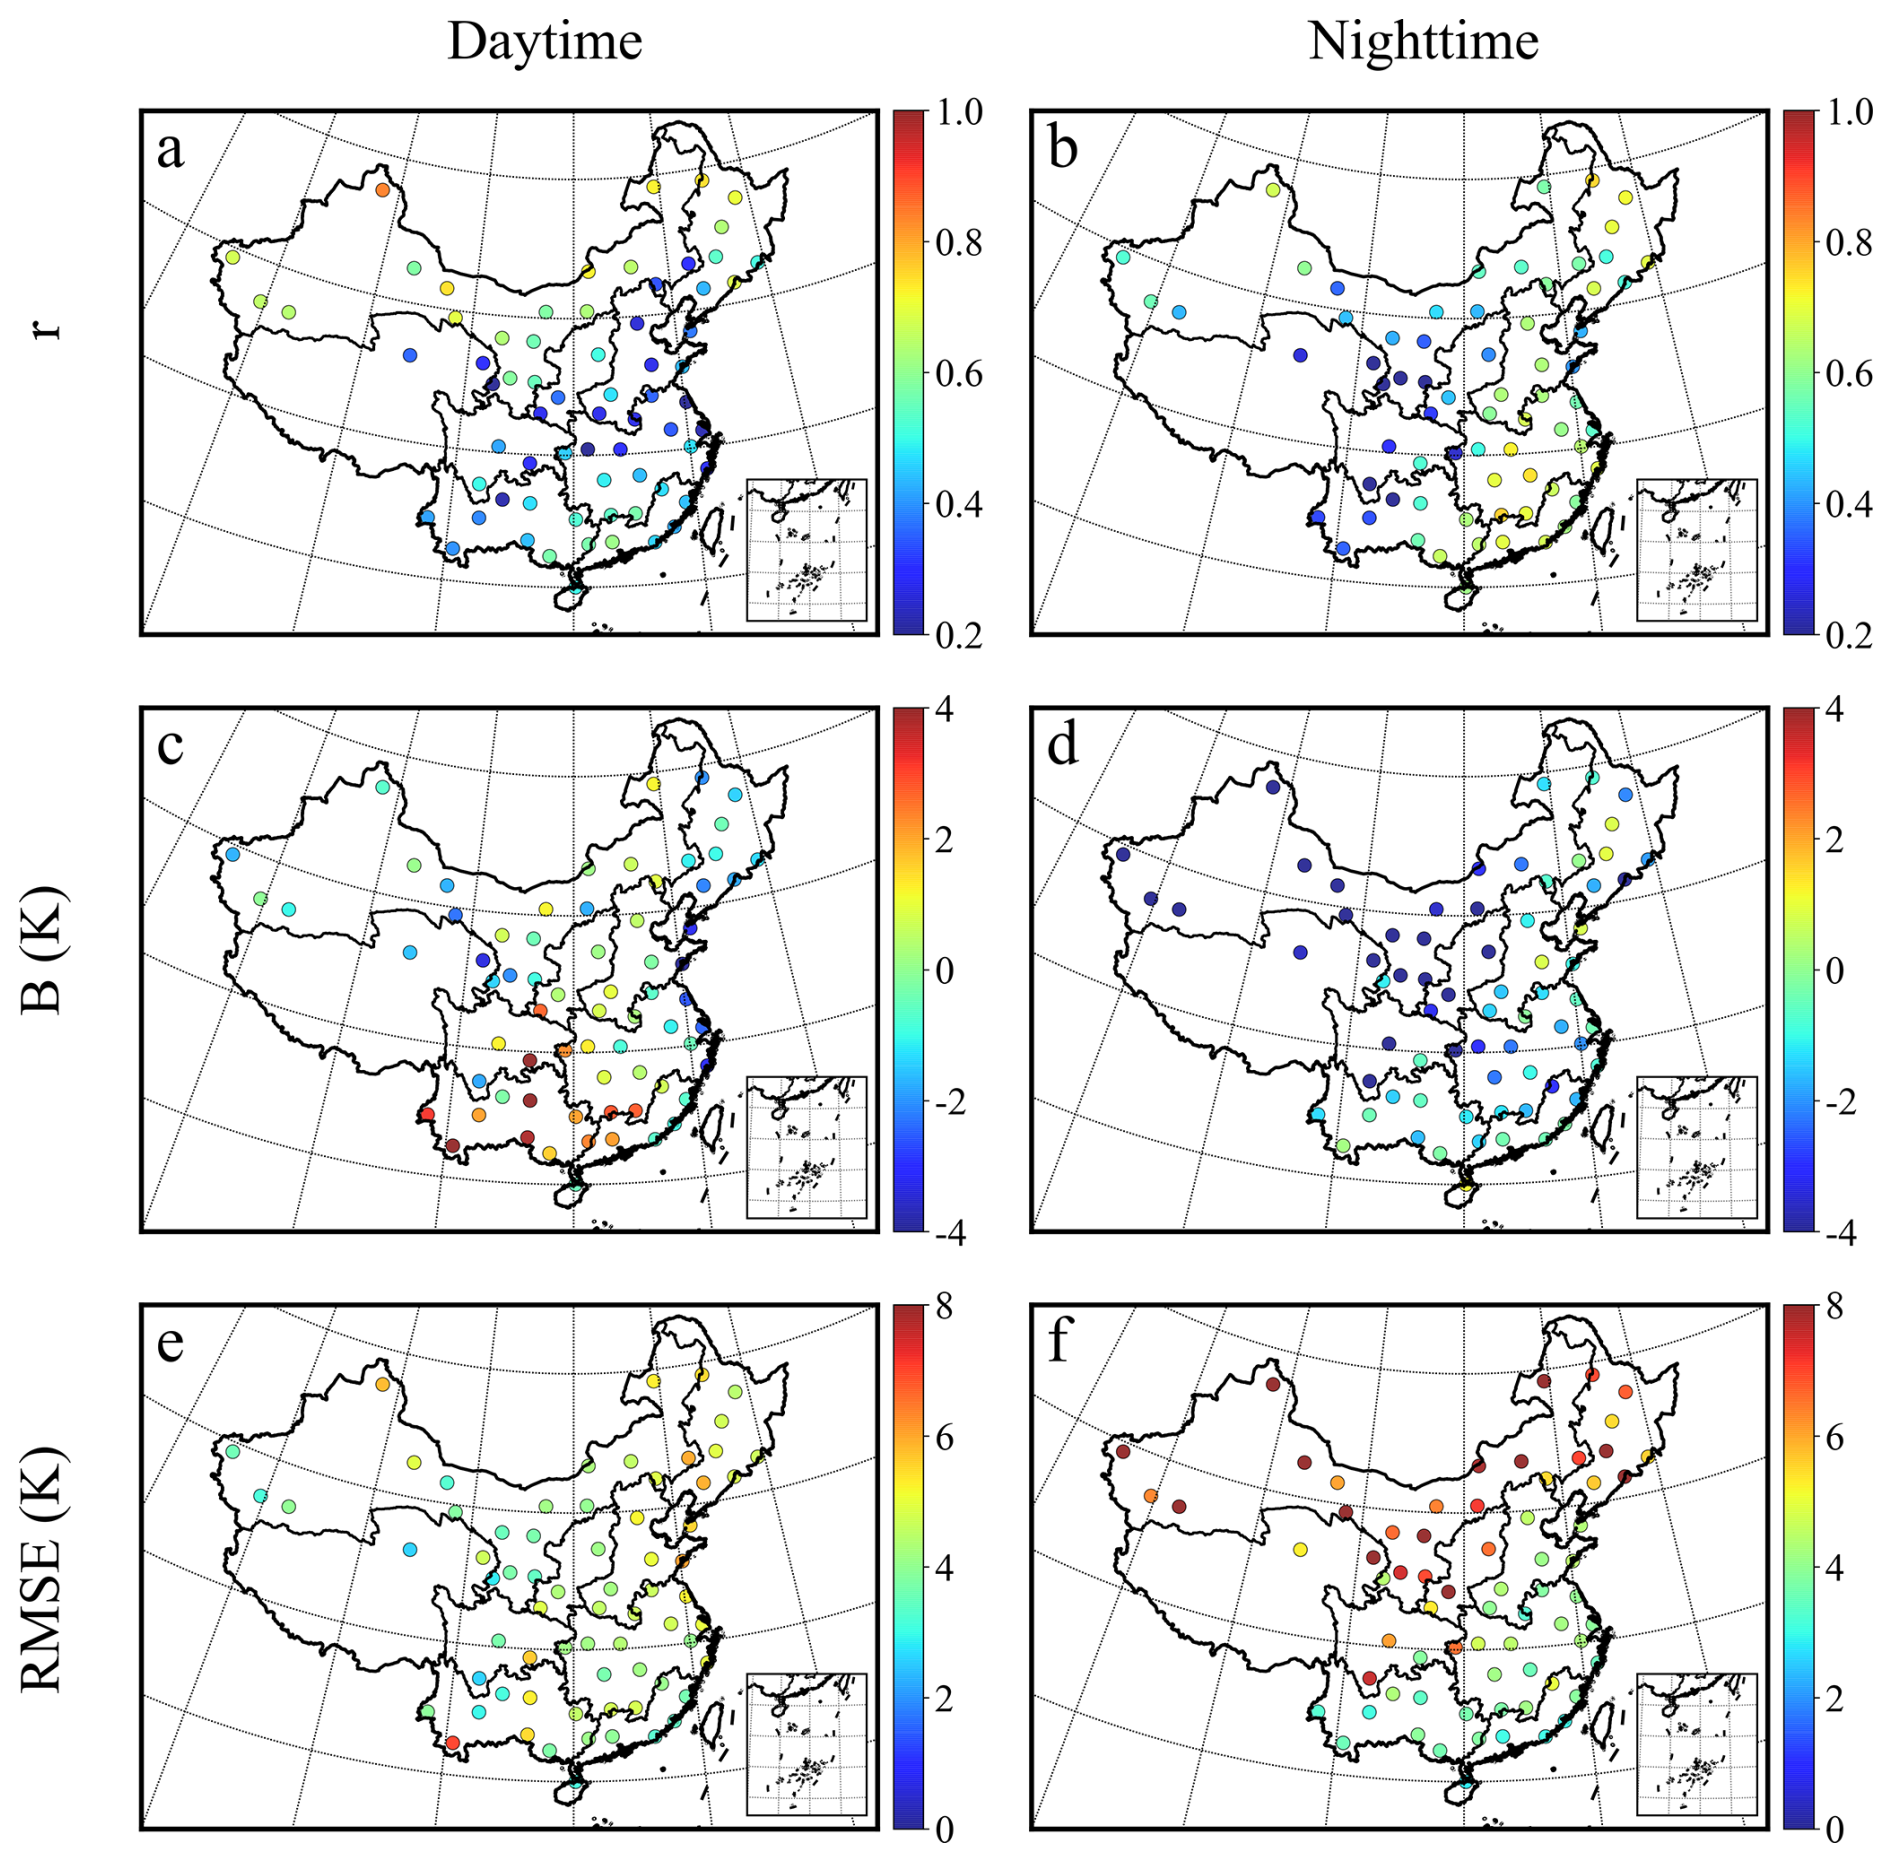
Figure 8Spatial distribution of MOD07_L2 lower tropospheric stability retrieval accuracy for daytime and nighttime from 2003 to 2020. Panels (a), (c), and (e) show daytime r, B, and RMSE, respectively; panels (b), (d), and (f) show the corresponding nighttime metrics.
3.5 The identification of temperature inversion layers
Figure 9 illustrated the detection results of TILs by MOD07_L2 over China and its nine agricultural zones during daytime and nighttime. Overall, the proportion of TILs detected by MOD07_L2 was low, with 6.6 % during daytime and 13.1 % during nighttime. Generally, regions with higher detection rates during the daytime also exhibited higher rates during the nighttime, except for the SB. During daytime, the detection rate of inversion layers by MOD07_L2 was below 6 % in most regions, and inversion layers were not detected over the TP or in the SB. Only NAS and NEP showed respective 10.6 % and 8.4 % detection rates during daytime. During nighttime, the detection rate remained below 10 % in most regions, with only NEP and NAS at 29.9 % and 20.0 %, respectively. During nighttime, inversion layers were not detected over the TP. In general, the detection rates were higher during nighttime than during daytime across most regions.
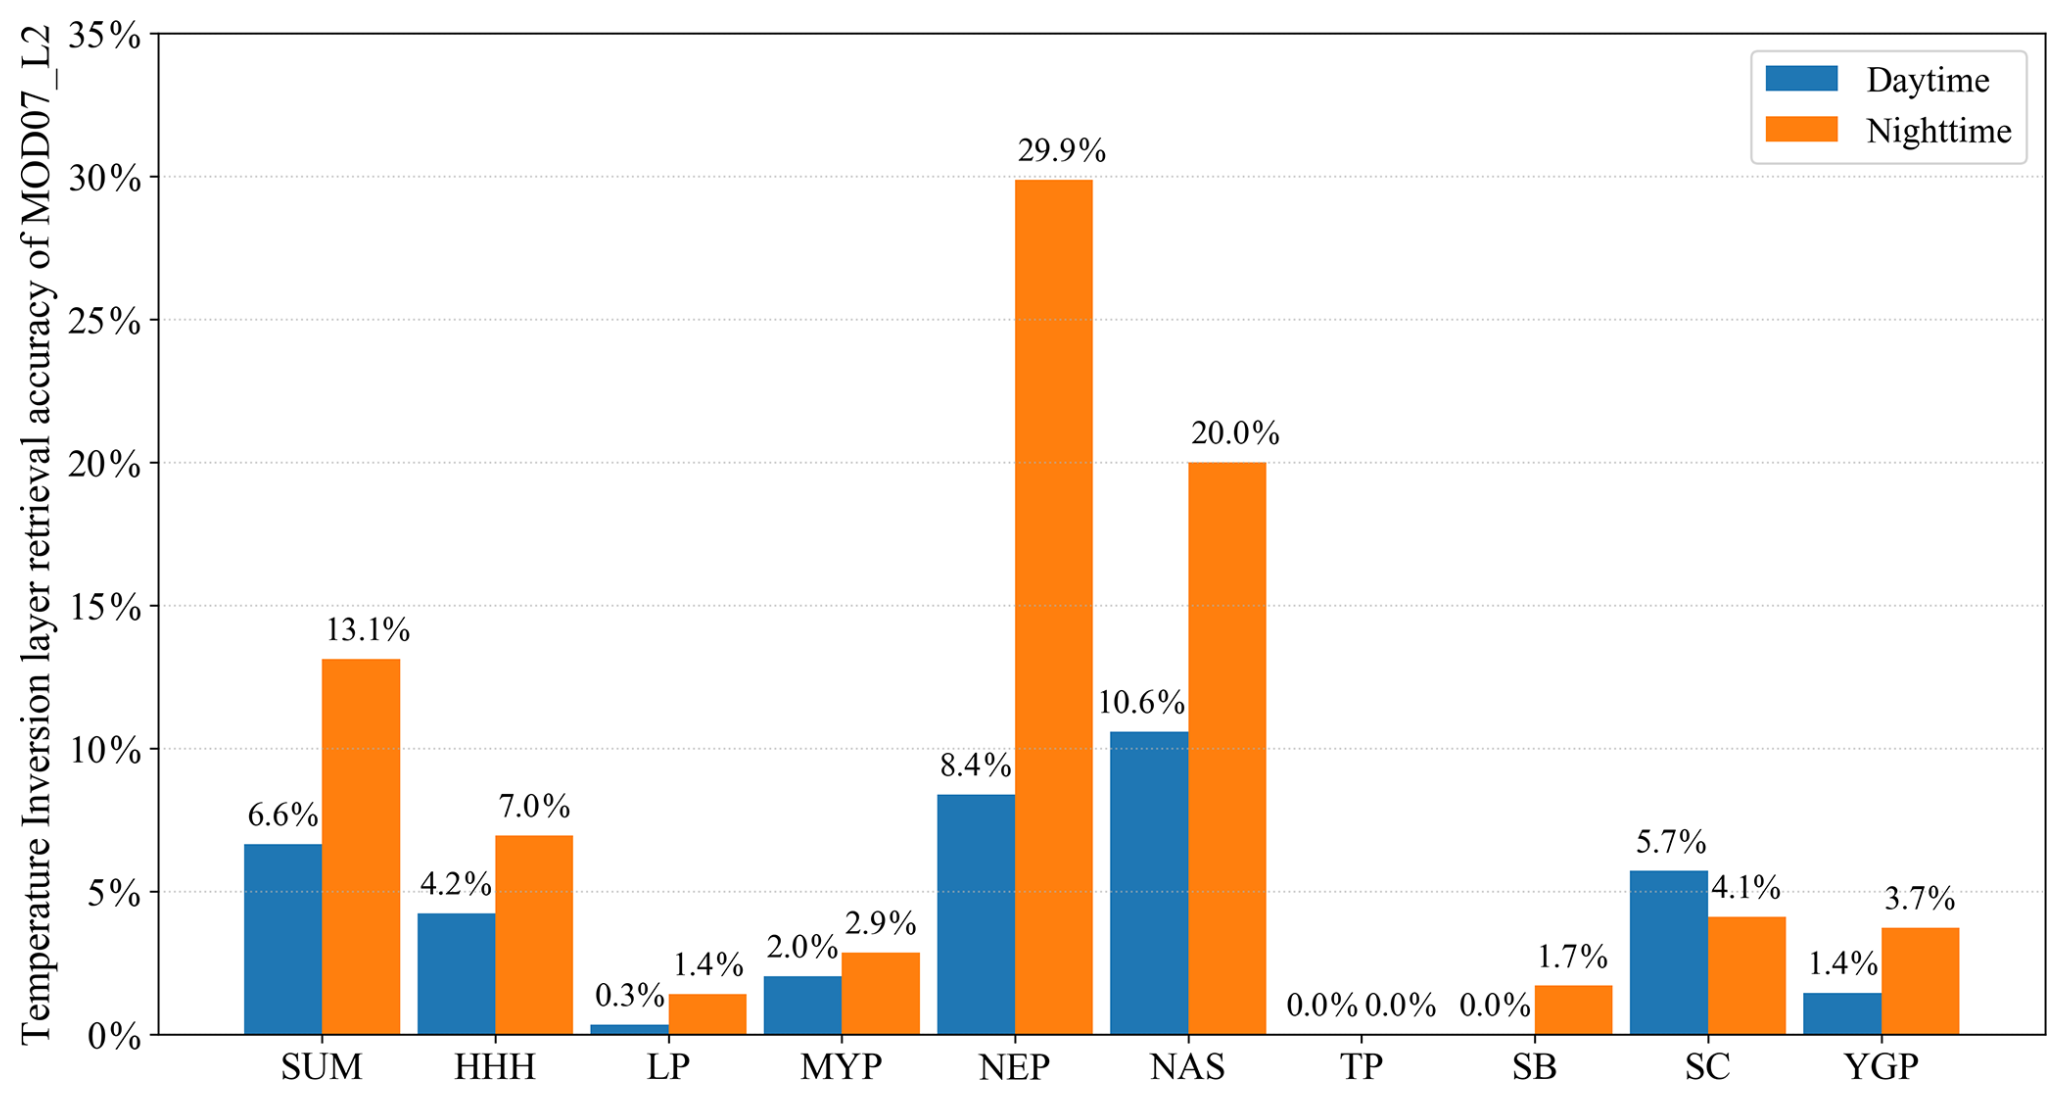
Figure 9Overall and regional detection accuracies of MOD07_L2 for temperature inversion layers during daytime and nighttime across nine agricultural regions.
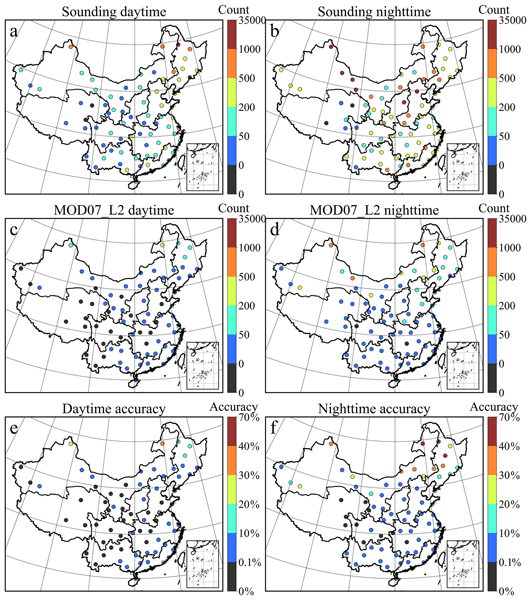
As illustrated in Fig. 10, the spatial distributions and detection accuracies of temperature inversions derived from sounding data and MOD07_L2 exhibited marked discrepancies between daytime and nighttime. During daytime, sounding data recorded the highest inversion counts in the NEP, with two stations surpassing 1000 events. Inversion counts at most stations in the NEP and HHH ranged from 200 to 500, while those in other areas were predominantly below 200. Notably, two stations on the TP detected no inversions. In contrast, MOD07_L2 identified inversion counts between 50 and 500 solely in the northern portions of the NEP and in the NAS. The majority of stations elsewhere fell below 50 counts, and no inversions were detected in the SB. Only one northeastern station on the TP detected a minimal number. Furthermore, stations in the western portions of the YGP and on the MYP also failed to detect any inversions. Detection precision exceeded 10 % at only a few isolated sites in the northern NAS and NEP. During nighttime, sounding data revealed that inversion events were more prevalent and frequent. Stations with inversion counts exceeding 1000 were primarily distributed in western NAS, northern LP, and northern HHH. Specifically, inversion counts in western NAS, NEP, HHH, and LP were relatively high, all surpassing 200. In contrast, the TP exhibited the fewest inversions, with two stations detecting none. The detection performance of MOD07_L2 improved at night, identifying 500–1000 inversions at three stations in northern NAS and exceeding 50 counts in NEP, northern NAS, and northern HHH. However, inversion counts at stations in other regions remained below 50. Detection precision reached 10 % only in northern NAS and northern NEP. Notably, MOD07_L2 failed to detect any inversions at stations on the TP, as well as in parts of the SB and MYP.
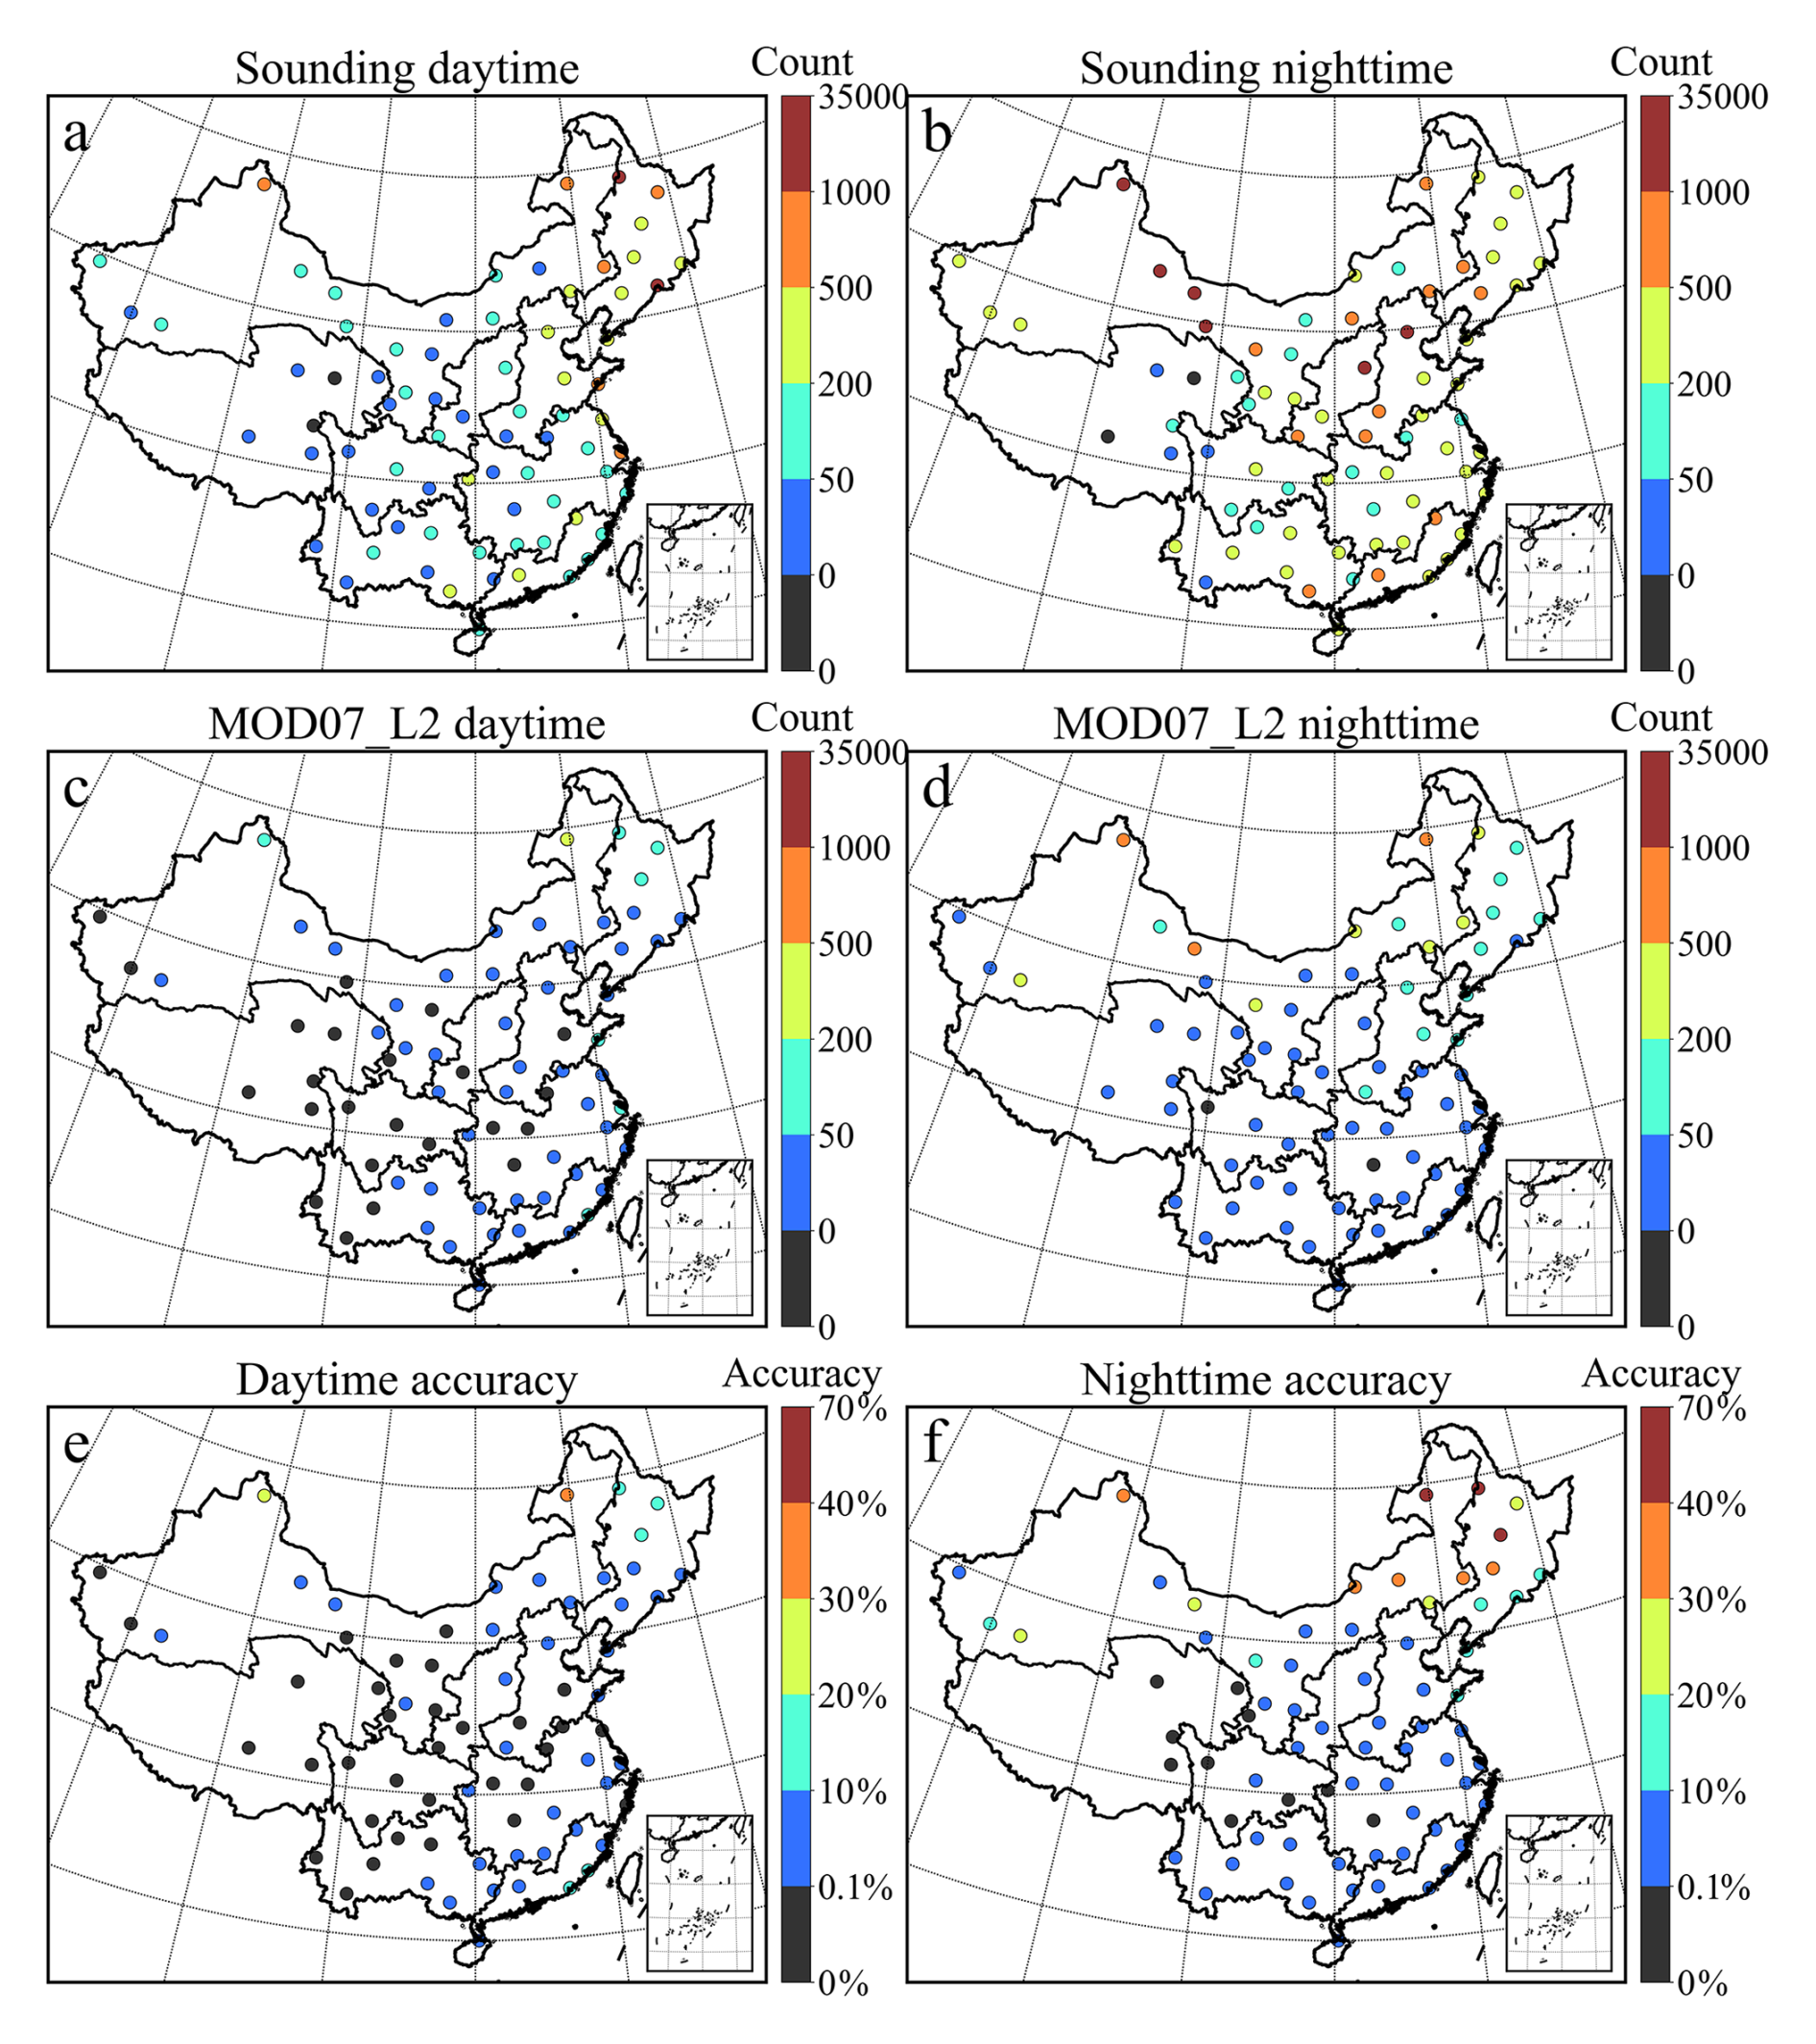
Figure 10Spatial distribution and precision of temperature inversion detection based on MOD07_L2 and sounding data during daytime and nighttime from 2003 to 2020. Panels (a) and (b) show the daytime and nighttime distributions derived from sounding data; panels (c) and (d) show the corresponding distributions from MOD07_L2; panels (e) and (f) show the detection precision at each station for daytime and nighttime.
4.1 Uncertainty of the absolute temperature retrieval
This study reveals that the retrieval accuracy of MOD07_L2 satellite temperature profiles significantly decreases as pressure levels approach the Earth's surface. This phenomenon primarily arises from stronger interference by surface longwave radiation in the lower atmosphere, greater variability in surface thermal inertia, and more intense local circulation and temperature fluctuations induced by complex terrain near the surface (Xue et al., 2023; Cheng et al., 2025; Song et al., 2024). Additionally, overall retrieval accuracy is higher at night than during the daytime, mainly because nighttime surface radiative cooling reduces diurnal variations in thermal infrared signals (He et al., 2023).
Spatially, the retrieval errors exhibit pronounced regional heterogeneity. In the TP, errors in the middle and lower layers are high, primarily attributable to high elevation and complex terrain causing standard pressure levels to be closer to the surface, as well as extreme diurnal temperature variations that amplify fluctuations in thermal infrared signals (Zhao et al., 2020; Ma et al., 2023). Additionally, the MOD07_L2 product integrates multi-channel infrared brightness temperatures with global reanalysis and sounding data through statistical regression and physical retrieval algorithms (Sobrino et al., 2015; Zhang et al., 2025). The SB and MYP exhibited relatively large lower-layer errors during daytime due to humid climate, frequent stratiform cloud cover, and topographic enclosure (Zhang and Zhang, 2019; Feng et al., 2020). In addition, the time-matching sensitivity analysis indicated that larger temporal differences also contributed to increased daytime retrieval errors over the SB and LP (Fig. 2). At nighttime, retrieval errors decreased markedly over the HHH and MYP, possibly because weaker surface heating reduced short-term thermal heterogeneity. In the NAS, sparse vegetation cover weakens near-surface energy exchange, thereby increasing retrieval errors in the lower layers (Meier et al., 2022). Dust storms and aerosols with high optical thickness further interfere with atmospheric transmittance (Huang et al., 2020b). Moreover, the pronounced nighttime negative biases over the NAS and NEP may be associated with strong stable stratification and sharp low-level temperature gradients, which are difficult for infrared profile retrievals with limited vertical resolution to resolve accurately (Guo et al., 2020; Gopikrishnan et al., 2023). It is particularly noteworthy that MOD07_L2 exhibits pronounced negative biases at 850 and 920 hPa, especially during daytime. Because these levels are close to the surface over most regions, uncertainties in surface temperature and spectral emissivity can propagate into the retrieved lower-tropospheric temperatures (Xie et al., 2023; Gopikrishnan et al., 2023). Moreover, the broad vertical weighting functions and limited vertical sampling of MOD07_L2 may smooth strong temperature gradients and warm anomalies in the lower atmosphere, thereby contributing to temperature underestimation (King et al., 2003; Sobrino et al., 2015). Water vapor absorption and residual thin-cloud contamination may further reduce the sensitivity of infrared radiances to these levels, particularly in humid regions (Platnick et al., 2003). These combined effects likely explain the more pronounced daytime negative biases at 850 and 920 hPa.
4.2 Uncertainty of lower tropospheric stability and temperature inversion layer
This study revealed that the accuracy of LTS retrieved by MOD07_L2 was higher during the daytime than at nighttime, which appears inconsistent with the superior absolute retrieval accuracy of atmospheric temperature observed at night. This discrepancy arose from the nature of LTS as a derived parameter, whose accuracy hinges not only on the absolute retrieval precision of individual layer temperatures but also on the fidelity of vertical temperature gradient retrieval. At night, although atmospheric temperature retrieval accuracy may be enhanced, the frequent occurrence of strong near-surface inversion layers heightened vertical structural complexity (Kaushal et al., 2022; Tan et al., 2021). A ground-based study at the Southern Great Plains site showed that during cloudy nights, clouds absorb surface longwave radiation and re-radiate it downward, reducing surface radiative cooling rates and thereby enhancing atmospheric instability and turbulence intensity (Li et al., 2025). This leads to more complex vertical temperature gradients at night, increasing the difficulty of LTS retrieval using MOD07_L2. The limited vertical resolution of MOD07_L2 thus struggled to resolve sharp temperature gradients within thin inversion layers, and may smooth shallow nocturnal inversions. Because near-surface potential temperature was estimated by linear interpolation from discrete pressure levels, failure to resolve the colder air near the inversion base may lead to an overestimation of near-surface potential temperature and consequently an underestimation of LTS (Zhang et al., 2023). Moreover, nighttime thermal infrared remote sensing exhibited diminished sensitivity to subtle thermal variations in the boundary layer (He et al., 2023). Prevalent cloud cover and elevated water vapor may partly explain the relatively low daytime accuracy over the SB and MYP and the persistently large nighttime errors over the SB (Zhang and Zhang, 2019). However, the improved nighttime performance over the MYP, SC, and HHH indicates that atmospheric moisture alone does not determine regional retrieval accuracy, which is also influenced by terrain and nighttime thermal structure. Additionally, pronounced nighttime negative biases persisted over the TP, LP, NAS, and SB. In these arid, high-elevation, or topographically complex regions, strong nighttime radiative cooling and terrain effects can enhance low-level temperature gradients, increasing the difficulty of accurately retrieving LTS (Feng et al., 2020; Guo et al., 2020; Chen et al., 2022). In addition, MOD07_L2 identified only a limited number of TILs, possibly due to its 5 km spatial resolution, which may average out thin inversion structures (Borbas et al., 2011). Furthermore, the limited vertical sampling of only 20 standard pressure levels in MOD07_L2 hindered the resolution of shallow near-surface inversions. MOD07_L2 data indicated that nighttime inversions were more frequent than those during the daytime, attributable to nighttime surface longwave cooling that readily initiates and sustains near-surface inversions. This mechanism aligned with findings from multi-site radiosonde observations (Zhang et al., 2022; Zeng et al., 2022). The present study further demonstrates that MOD07_L2 exhibited a higher detection rate and accuracy for nighttime inversions compared to daytime ones, primarily owing to the enhanced boundary layer stability and reduced atmospheric turbulence, which improve the reliability of satellite-based inversion detection (Tan et al., 2021). On a regional scale, the frequency of temperature inversion detection over the Tibetan Plateau is relatively low. This finding aligns with recent evaluations of reanalysis products over the TP, which have also revealed substantial challenges in capturing low-level temperature inversions due to complex terrain and surface–atmosphere interactions (Luo et al., 2025). Furthermore, MOD07_L2 provided fewer effective pressure levels in high-altitude regions, thereby reducing its inversion detection capabilities (Che and Zhao, 2021; Chen et al., 2016). In the SB, the humid and enclosed terrain promoted inversion formation. However, the multi-layered structure and moist air impeded thermal infrared profile retrieval, resulting in lower accuracy (Feng et al., 2020, 2023). In high latitude areas, despite the greater temporal mismatch between the datasets in northern NEP and NAS, MOD07_L2 demonstrated superior accuracy in inversion layer detection in these regions. This finding aligned with long-term radiosonde climatology, underscoring that colder, higher-latitude areas were prone to forming thicker and stronger near-surface inversions (Guo et al., 2020). In humid southern regions such as MYP and YGP, abundant moisture and thin inversion layers impeded effective detection by MOD07_L2. Furthermore, Huang et al. (2021) reported that humid southern China predominantly featured thin, weak elevated inversions, which posed significant challenges for reliable infrared profile retrievals.
4.3 Future effort
Based on the systematic validation of the high-resolution MOD07_L2 satellite product conducted in this study, the performance characteristics and regional applicability of this dataset in terms of vertical temperature profile absolute accuracy, lower tropospheric stability (LTS), and temperature inversion layer (TIL) detection have been clarified. Future work can be deepened in the following directions. First, optimize the spatiotemporal matching scheme by developing more refined interpolation methods or incorporating atmospheric model corrections to reduce boundary layer evolution errors potentially introduced by the < 2 h window. Second, deepen error attribution analysis by integrating auxiliary data such as cloud cover, aerosol optical depth, water vapor, and terrain, combined with radiative transfer simulations or machine learning methods, to quantitatively diagnose the mechanisms underlying the systematic negative biases at 850 and 920 hPa and their regional differences. Finally, further improve the retrieval algorithm performance of the MOD07_L2 product and explore feasible pathways for integrating multi-source observational data, with the aim of generating higher-accuracy temperature profile products, thereby significantly enhancing their application value in regional high-impact weather mechanism analysis, local climate monitoring, and environmental assessment.
While the MOD07_L2 atmospheric temperature profile product provides important information at high spatial resolution, there is still a lack of comprehensive evaluation in terms of its absolute retrieval accuracy and its capability to assess boundary layer stability and detect temperature inversions. Therefore, we conducted a comprehensive assessment by comparing MOD07_L2 temperature retrievals with sounding observations from 74 geographically distributed stations across China during 2003–2020. The absolute retrieval accuracy of MOD07_L2 showed clear differences across pressure layers during both daytime and nighttime, with nighttime accuracy generally better than that during daytime. Meanwhile, the upper layers (400–620 hPa) demonstrated higher accuracy, whereas the lower layers (850–1000 hPa) exhibited larger errors in humid and topographically complex regions. In particular, pronounced negative biases were observed at 850 and 920 hPa, especially during daytime. In contrast, MOD07_L2-derived LTS was more accurate during daytime than nighttime. Moreover, there were limitations in detecting temperature inversion layers during both daytime and nighttime. The findings of this study enhance the utility of MODIS's long-term data archive for climate applications and provide a valuable reference for the development and validation of similar products from current and future satellite missions, such as the VIIRS instrument.
The shapefile data of agricultural zones is accessible from https://www.resdc.cn. The MOD07_L2 data are available from https://ladsweb.modaps.eosdis.nasa.gov. The sounding data are available from http://data.cma.cn. These data are openly accessible, and no permissions are required to download them. The corresponding data citations have been included in the reference list of this manuscript.
WZ: Conceptualization, Methodology, Supervision, Funding acquisition, Resources, Writing – review & editing. MQ: Methodology, Supervision, Data curation, Formal analysis, Writing – original draft. RS and JZ: Validation, Supervision. GN: Conceptualization, Investigation, Writing – review & editing. AI, ZM and DZ: Validation, Methodology. BP: Methodology. YY: Conceptualization, Methodology, Supervision, Resources, Writing – review & editing.
At least one of the (co-)authors is a member of the editorial board of Atmospheric Measurement Techniques. The peer-review process was guided by an independent editor, and the authors also have no other competing interests to declare.
Publisher's note: Copernicus Publications remains neutral with regard to jurisdictional claims made in the text, published maps, institutional affiliations, or any other geographical representation in this paper. The authors bear the ultimate responsibility for providing appropriate place names. Views expressed in the text are those of the authors and do not necessarily reflect the views of the publisher.
This research has been supported by the National Key Research and Development Program of China (grant no. 2023YFE0208100), the National Natural Science Foundation of China (grant nos. 42201053 and 42222503), and the open fund project of the State Key Laboratory of Regional and Urban Ecology (grant no. SKLURE2023-2-4).
This paper was edited by Jianhuai Ye and reviewed by two anonymous referees.
Barlow, J. F., Halios, C. H., Lane, S. E., and Wood, C. R.: Observations of urban boundary layer structure during a strong urban heat island event, Environ. Fluid Mech., 15, 373–398, https://doi.org/10.1007/s10652-014-9335-6, 2015.
Borbas, E. E., Seemann, S. W., Kern, A., Moy, L., Li, J., Gumley, L. E., and Menzel, W. P.: MODIS Atmospheric Profile Retrieval Algorithm Theoretical Basis Document, Collection 6, Version 7, University of Wisconsin–Madison, Madison, WI, https://modis-images.gsfc.nasa.gov/_docs/MOD07_atbd_v7_April2011.pdf (last access: 10 September 2026), 2011.
Che, J. and Zhao, P.: Characteristics of the summer atmospheric boundary layer height over the Tibetan Plateau and influential factors, Atmos. Chem. Phys., 21, 5253–5268, https://doi.org/10.5194/acp-21-5253-2021, 2021.
Chen, G., Zhang, X., and Fu, Y.: Diurnal variation in clouds and radiative budgets over the Tibetan Plateau during summer using CERES data, J. Geophys. Res.-Atmos., 127, e2021JD036329, https://doi.org/10.1029/2021JD036329, 2022.
Chen, S., Hu, D., Wong, M. S., Ren, H., Cao, S., Yu, C., and Ho, H. C.: Characterizing spatiotemporal dynamics of anthropogenic heat fluxes: A 20-year case study in Beijing–Tianjin–Hebei region in China, Environ. Pollut., 249, 923–931, https://doi.org/10.1016/j.envpol.2019.03.113, 2019.
Chen, X., Škerlak, B., Rotach, M. W., Añel, J. A., Su, Z., Ma, Y., and Li, M.: Reasons for the extremely high-ranging planetary boundary layer over the western Tibetan Plateau in winter, J. Atmos. Sci., 73, 2021–2038, https://doi.org/10.1175/JAS-D-15-0148.1, 2016.
Cheng, J., Zeng, Q., Sun, H., Guo, Y., Yang, F., Guo, M., and Wu, C.: A global 1 km resolution daily surface longwave radiation product from MODIS satellite data from 2000–2023, Sci. Data, 12, 736, https://doi.org/10.1038/s41597-025-05076-8, 2025.
Coll, C., Caselles, V., Valor, E., and Niclòs, R.: Comparison between different sources of atmospheric profiles for land surface temperature retrieval from single channel thermal infrared data, Remote Sens. Environ., 117, 199–210, https://doi.org/10.1016/j.rse.2011.09.018, 2012.
Dessler, A. E. and Davis, S. M.: Trends in tropospheric humidity from reanalysis systems, J. Geophys. Res.-Atmos., 115, D19127, https://doi.org/10.1029/2010JD014192, 2010.
Feng, X., Wei, S., and Wang, S.: Temperature inversions in the atmospheric boundary layer and lower troposphere over the Sichuan Basin, China: Climatology and impacts on air pollution, Sci. Total Environ., 726, 138579, https://doi.org/10.1016/j.scitotenv.2020.138579, 2020.
Feng, X., Zhang, Z., Guo, J., and Wang, S.: Multilayer inversion formation and evolution during persistent heavy air pollution events in the Sichuan Basin, China, Atmos. Res., 286, 106691, https://doi.org/10.1016/j.atmosres.2023.106691, 2023.
Galfi, V. M. and Lucarini, V.: Fingerprinting heatwaves and cold spells and assessing their response to climate change using large deviation theory, Phys. Rev. Lett., 127, 058701, https://doi.org/10.1103/PhysRevLett.127.058701, 2021.
Gelaro, R., McCarty, W., Suárez, M. J., Todling, R., Molod, A., Takacs, L., Randles, C. A., Darmenov, A., Bosilovich, M. G., Reichle, R., Wargan, K., Coy, L., Cullather, R., Draper, C., Akella, S., Buchard, V., Conaty, A., da Silva, A. M., Gu, W., Kim, G.-K., Koster, R., Lucchesi, R., Merkova, D., Nielsen, J. E., Partyka, G., Pawson, S., Putman, W., Rienecker, M., Schubert, S. D., Sienkiewicz, M., and Zhao, B.: The Modern-Era Retrospective Analysis for Research and Applications, Version 2 (MERRA-2), J. Climate, 30, 5419–5454, https://doi.org/10.1175/JCLI-D-16-0758.1, 2017.
Gopikrishnan, G. S., Kuttippurath, J., Thapliyal, P. K., and Shukla, M. V.: Validation of INSAT-3D and INSAT-3DR temperature profile retrievals using ground-based, satellite, and reanalysis data, J. Geophys. Res.-Atmos., 128, e2023JD038912, https://doi.org/10.1029/2023JD038912, 2023.
Grimmond, C. S. B., Roth, M., Oke, T. R., Au, Y. C., Best, M., Betts, R., Carmichael, G., Cleugh, H., Dabberdt, W., Emmanuel, R., Freitas, E., Fortuniak, K., Hanna, S., Klein, P., Kalkstein, L. S., Liu, C. H., Nickson, A., Pearlmutter, D., Sailor, D., and Voogt, J.: Climate and more sustainable cities: Climate information for improved planning and management of cities (producers/capabilities perspective), Procedia Environ. Sci., 1, 247–274, https://doi.org/10.1016/j.proenv.2010.09.016, 2010.
Guo, J., Miao, Y., Zhang, Y., Liu, H., Li, Z., Zhang, W., He, J., Lou, M., Yan, Y., Bian, L., and Zhai, P.: The climatology of planetary boundary layer height in China derived from radiosonde and reanalysis data, Atmos. Chem. Phys., 16, 13309–13319, https://doi.org/10.5194/acp-16-13309-2016, 2016.
Guo, J., Su, T., Li, Z., Miao, Y., Li, J., Liu, H., Xu, H., Cribb, M., and Zhai, P.: Declining frequency of summertime local-scale precipitation over eastern China from 1970 to 2010 and its potential link to aerosols, Geophys. Res. Lett., 44, 5700–5708, https://doi.org/10.1002/2017GL073533, 2017.
Guo, J., Chen, X., Su, T., Liu, L., Zheng, Y., Chen, D., Li, J., Xu, H., Lv, Y., He, B., Li, Y., Hu, X.-M., Ding, A., and Zhai, P.: The climatology of lower tropospheric temperature inversions in China from radiosonde measurements: Roles of black carbon, local meteorology, and large-scale subsidence, J. Climate, 33, 9327–9350, https://doi.org/10.1175/JCLI-D-19-0278.1, 2020.
Harris, I., Osborn, T. J., Jones, P., and Lister, D.: Version 4 of the CRU TS monthly high-resolution gridded multivariate climate dataset, Sci. Data, 7, 109, https://doi.org/10.1038/s41597-020-0453-3, 2020.
He, G., He, C., Wang, H., Lu, X., Pei, C., Qiu, X., Liu, C., Wang, Y., Liu, N., Zhang, J., Lei, L., Liu, Y., Wang, H., Deng, T., Fan, Q., and Fan, S.: Nighttime ozone in the lower boundary layer: insights from 3-year tower-based measurements in South China and regional air quality modeling, Atmos. Chem. Phys., 23, 13107–13124, https://doi.org/10.5194/acp-23-13107-2023, 2023.
Hersbach, H., Bell, B., Berrisford, P., Hirahara, S., Horányi, A., Muñoz-Sabater, J., Nicolas, J., Peubey, C., Radu, R., Schepers, D., Simmons, A., Soci, C., Abdalla, S., Abellan, X., Balsamo, G., Bechtold, P., Biavati, G., Bidlot, J., Bonavita, M., De Chiara, G., Dahlgren, P., Dee, D., Diamantakis, M., Dragani, R., Flemming, J., Forbes, R., Fuentes, M., Geer, A., Haimberger, L., Healy, S., Hogan, R. J., Hólm, E., Janisková, M., Keeley, S., Laloyaux, P., Lopez, P., Lupu, C., Radnoti, G., de Rosnay, P., Rozum, I., Vamborg, F., Villaume, S., and Thépaut, J.-N.: The ERA5 global reanalysis, Q. J. R. Meteorol. Soc., 146, 1999–2049, https://doi.org/10.1002/qj.3803, 2020.
Huang, F., Zhan, W., Wang, Z.-H., Voogt, J., Hu, L., Quan, J., Liu, C., Zhang, N., and Lai, J.: Satellite identification of atmospheric-surface-subsurface urban heat islands under clear sky, Remote Sens. Environ., 250, 112039, https://doi.org/10.1016/j.rse.2020.112039, 2020a.
Huang, G., Chen, Y., Li, Z., Liu, Q., Wang, Y., He, Q., Liu, T., Liu, X., Zhang, Y., Gao, J., and Yao, Y.: Validation and accuracy analysis of the Collection 6.1 MODIS aerosol optical depth over the westernmost city in China based on Sun–Sky Radiometer observations from SONET, Earth Space Sci., 7, e2019EA001041, https://doi.org/10.1029/2019EA001041, 2020b.
Huang, Q., Chu, Y., and Li, Q.: Climatology of low-level temperature inversions over China based on high-resolution radiosonde measurements, Theor. Appl. Climatol., 144, 415–429, https://doi.org/10.1007/s00704-021-03536-w, 2021.
Kaushal, S., Singh, D. K., and Sreenivas, K. R.: Penetrative convection in nocturnal atmospheric boundary layer and radiation fog, arXiv [preprint], https://doi.org/10.48550/arXiv.2209.13185, 27 September 2022.
King, M. D., Menzel, W. P., Kaufman, Y. J., Tanré, D., Gao, B. C., Platnick, S., Ackerman, S. A., Remer, L. A., Pincus, R., and Hubanks, P. A.: Cloud and aerosol properties, precipitable water, and profiles of temperature and water vapor from MODIS, IEEE Trans. Geosci. Remote Sens., 41, 442–458, https://doi.org/10.1109/TGRS.2002.808226, 2003.
Leng, P., Liao, Q.-Y., Gao, M.-F., Duan, S.-B., Li, Z.-L., Zhang, X., and Shang, G.-F.: A full satellite-driven method for the retrieval of clear-sky evapotranspiration, Earth Space Sci., 6, 2251–2262, https://doi.org/10.1029/2019EA000869, 2019.
Li, H., Liu, B., Gong, W., Ma, Y., Jin, S., Wang, W., Fan, R., and Jiang, S.: Influence of clouds on planetary boundary layer height: A comparative study and factors analysis, Atmos. Res., 314, 107784, https://doi.org/10.1016/j.atmosres.2024.107784, 2025.
Li, J., Chen, H., Li, Z., Wang, P., Fan, X., He, W., and Zhang, J.: Analysis of low-level temperature inversions and their effects on aerosols in the lower atmosphere, Adv. Atmos. Sci., 36, 1235–1250, https://doi.org/10.1007/s00376-019-9018-9, 2019.
Li, Y., Thompson, D. W. J., Stephens, G. L., and Bony, S.: A global survey of the instantaneous linkages between cloud vertical structure and large-scale climate, J. Geophys. Res.-Atmos., 119, 3770–3792, https://doi.org/10.1002/2013JD020669, 2014.
Liu, B., Ma, X., Ma, Y., Li, H., Jin, S., Fan, R., and Gong, W.: The relationship between atmospheric boundary layer and temperature inversion layer and their aerosol capture capabilities, Atmos. Res., 271, 106121, https://doi.org/10.1016/j.atmosres.2022.106121, 2022.
Luo, Y., Wang, S., Zhang, L., Tian, B., Jia, J., Sun, W., Wu, X., Ding, M., and Zuo, Z.: Comparative evaluation of reanalysis-derived temperature profiles and low-level temperature inversion on the Tibetan Plateau, Res. Cold Arid Reg., https://doi.org/10.1016/j.rcar.2025.08.004, 2025.
Ma, Y., Huang, X.-D., Yang, X.-L., Li, Y.-X., Wang, Y.-L., and Liang, T.-G.: Mapping snow depth distribution from 1980 to 2020 on the Tibetan Plateau using multi-source remote sensing data and downscaling techniques, ISPRS J. Photogramm. Remote Sens., 205, 246–262, https://doi.org/10.1016/j.isprsjprs.2023.10.012, 2023.
Meier, R., Davin, E. L., Bonan, G. B., Lawrence, D. M., Hu, X., Duveiller, G., Prigent, C., and Seneviratne, S. I.: Impacts of a revised surface roughness parameterization in the Community Land Model 5.1, Geosci. Model Dev., 15, 2365–2393, https://doi.org/10.5194/gmd-15-2365-2022, 2022.
Ning, G., Wang, S., Yim, S. H. L., Li, J., Hu, Y., Shang, Z., Wang, J., and Wang, J.: Impact of low-pressure systems on winter heavy air pollution in the northwest Sichuan Basin, China, Atmos. Chem. Phys., 18, 13601–13615, https://doi.org/10.5194/acp-18-13601-2018, 2018.
Ouyang, X., Jia, L., Pan, Y., and Hu, G.: Retrieval of land surface temperature over the Heihe River Basin using HJ-1B thermal infrared data, Remote Sens., 7, 300–318, https://doi.org/10.3390/rs70100300, 2015.
Platnick, S., King, M. D., Ackerman, S. A., Menzel, W. P., Baum, B. A., Riedi, J. C., and Frey, R. A.: The MODIS cloud products: Algorithms and examples from Terra, IEEE Trans. Geosci. Remote Sens., 41, 459–473, https://doi.org/10.1109/TGRS.2002.808301, 2003.
Saha, S., Moorthi, S., Pan, H.-L., Wu, X., Wang, J., Nadiga, S., Tripp, P., Kistler, R., Woollen, J., Behringer, D., Liu, H., Stokes, D., Grumbine, R., Gayno, G., Wang, J., Hou, Y.-T., Chuang, H.-Y., Juang, H.-M. H., Sela, J., Iredell, M., Treadon, R., Kleist, D., Van Delst, P., Keyser, D., Derber, J., Ek, M., Meng, J., Wei, H., Yang, R., Lord, S., van den Dool, H., Kumar, A., Wang, W., Long, C., Chelliah, M., Xue, Y., Huang, B., Schemm, J.-K., Ebisuzaki, W., Lin, R., Xie, P., Chen, M., Zhou, S., Higgins, W., Zou, C.-Z., Liu, Q., Chen, Y., Han, Y., Cucurull, L., Reynolds, R. W., Rutledge, G., and Goldberg, M.: The NCEP Climate Forecast System Reanalysis, Bull. Am. Meteorol. Soc., 91, 1015–1058, https://doi.org/10.1175/2010BAMS3001.1, 2010.
Santer, B. D., Po-Chedley, S., Zelinka, M. D., Cvijanovic, I., Bonfils, C., Durack, P. J., Fu, Q., Kiehl, J., Mears, C., Painter, J., Pallotta, G., Solomon, S., Wentz, F. J., and Zou, C.-Z.: Human influence on the seasonal cycle of tropospheric temperature, Science, 361, eaas8806, https://doi.org/10.1126/science.aas8806, 2018.
Schwarz, N., Lautenbach, S., and Seppelt, R.: Exploring indicators for quantifying surface urban heat islands of European cities with MODIS land surface temperatures, Remote Sens. Environ., 115, 3175–3186, https://doi.org/10.1016/j.rse.2011.07.003, 2011.
Seeley, J. T. and Wordsworth, R. D.: Episodic deluges in simulated hothouse climates, Nature, 599, 74–79, https://doi.org/10.1038/s41586-021-03919-z, 2021.
Seidel, D. J., Li, J., Mears, C., Moradi, I., Nash, J., Randel, W. J., Saunders, R., Thompson, D. W. J., and Zou, C.-Z.: Stratospheric temperature changes during the satellite era, J. Geophys. Res.-Atmos., 121, 664–681, https://doi.org/10.1002/2015JD024039, 2016.
Sobrino, J. A., Jiménez-Muñoz, J. C., Mattar, C., and Sòria, G.: Evaluation of Terra/MODIS atmospheric profiles product (MOD07) over the Iberian Peninsula: A comparison with radiosonde stations, Int. J. Digit. Earth, 8, 771–783, https://doi.org/10.1080/17538947.2014.936973, 2015.
Song, Z., Bai, W., Zhang, Y., Wang, Y., Xu, X., and Xin, J.: Evaluation of satellite-derived atmospheric temperature and humidity profiles and their application as precursors to severe convective precipitation, Remote Sens., 16, 4638, https://doi.org/10.3390/rs16244638, 2024.
Tan, J., Che, T., Wang, J., Liang, J., Zhang, Y., and Ren, Z.: Reconstruction of the daily MODIS land surface temperature product using the two-step improved similar pixels method, Remote Sens., 13, 1671, https://doi.org/10.3390/rs13091671, 2021.
Thorne, P. W., Lanzante, J. R., Peterson, T. C., Seidel, D. J., and Shine, K. P.: Tropospheric temperature trends: History of an ongoing controversy, WIREs Clim. Change, 2, 66–88, https://doi.org/10.1002/wcc.80, 2011.
Xie, Y., Huang, X., Chen, X., L'Ecuyer, T. S., and Drouin, B. J.: Joint use of far-infrared and mid-infrared observation for sounding retrievals: Learning from the past for upcoming far-infrared missions, Earth Space Sci., 10, e2022EA002684, https://doi.org/10.1029/2022EA002684, 2023.
Xue, Y., Zhu, X., Wu, Z., and Duan, S.-B.: Retrieval of land surface temperature over mountainous areas using Fengyun-3D MERSI-II data, Remote Sens., 15, 5465, https://doi.org/10.3390/rs15235465, 2023.
Yuan, B., Li, X., Zhou, L., Bai, T., Hu, T., Huang, J., Liu, D., Li, Y., and Guo, J.: Global distinct variations of surface urban heat islands in inter- and intra-cities revealed by local climate zones and seamless daily land surface temperature data, ISPRS J. Photogramm. Remote Sens., 204, 1–14, https://doi.org/10.1016/j.isprsjprs.2023.08.012, 2023.
Zeng, H., Tian, P., Zhang, M., Cao, X., Liang, J., and Zhang, L.: Rapid change in surface-based temperature inversions across the world during the last three decades, J. Appl. Meteorol. Climatol., 61, 175–184, https://doi.org/10.1175/JAMC-D-21-0093.1, 2022.
Zhang, A. and Zhang, X.: Landsat-8-based land surface temperature inversion and comparative analysis with MODIS temperature product, J. Beijing For. Univ., 41, 1–13, https://doi.org/10.13332/j.1000-1522.20180234, 2019.
Zhang, L., Ding, M., Zheng, X., Chen, J., Guo, J., and Bian, L.: Assessment of AIRS Version 7 temperature profiles and low-level inversions with GRUAN radiosonde observations in the Arctic, Remote Sens., 15, 1270, https://doi.org/10.3390/rs15051270, 2023.
Zhang, W., Zhang, B., Zhu, W., Tang, X., Li, F., Liu, X., and Yu, Q.: Comprehensive assessment of MODIS-derived near-surface air temperature using wide elevation-spanned measurements in China, Sci. Total Environ., 800, 149535, https://doi.org/10.1016/j.scitotenv.2021.149535, 2021.
Zhang, W., Zhao, J., Zhu, W., Kong, Y., Wan, B., and Liao, Y.: Comprehensive validation of MODIS-derived instantaneous air temperature and daily minimum temperature at nighttime, Remote Sens., 17, 1732, https://doi.org/10.3390/rs17101732, 2025.
Zhang, Y., Zhang, B., and Yang, N.: Characteristics of temperature and humidity inversions based on high-resolution radiosonde observations at three Arctic stations, J. Appl. Meteorol. Climatol., 61, 415–428, https://doi.org/10.1175/JAMC-D-21-0054.1, 2022.
Zhao, L., Lee, X., Smith, R. B., and Oleson, K.: Strong contributions of local background climate to urban heat islands, Nature, 511, 216–219, https://doi.org/10.1038/nature13462, 2014.
Zhao, X., Liu, C., Yang, N., and Li, Y.: Diurnal and seasonal variations of surface energy and CO2 fluxes over a site in the western Tibetan Plateau, Atmosphere, 11, 260, https://doi.org/10.3390/atmos11030260, 2020.
Zhu, W., Lü, A., Jia, S., Yan, J., and Mahmood, R.: Retrievals of all-weather daytime air temperature from MODIS products, Remote Sens. Environ., 189, 152–163, https://doi.org/10.1016/j.rse.2016.11.011, 2017.