
the Creative Commons Attribution 4.0 License.
the Creative Commons Attribution 4.0 License.
 | 19 Oct 2026
Evaluating EUCLID location accuracy using lightning events near tall structures
Dieter Roel Poelman

Hannes Kohlmann
Wolfgang Schulz
This study evaluates the location accuracy (LA) of the European Cooperation for Lightning Detection (EUCLID) network by analysing lightning events recorded near tall structures located either on flat ground or on elevated terrain, such as mountain ridges, over a 14-year period from 2012 to 2025. Structures selected for this analysis, either exceeding 150 m in height or situated on prominent terrain like mountain tops, serve as proxy reference points for assessing the network's performance. The methodology involves calculating the ratio of lightning strike densities within 500 m of each structure to those within the surrounding ring extending from 500 m to 2 km. Structures with ratios below a defined threshold are excluded from further analysis, as the absence of elevated lightning density near the structure suggests it does not significantly attract or initiate lightning and is therefore unsuitable for our methodology. Subsequently, a density-based clustering algorithm is used to identify the most likely cluster of lightning events associated with the structure. It is then assumed that the lightning events within this cluster have struck the structure and can therefore be used in the analysis of location accuracy. Results indicate a median LA of 124 m and a 95th percentile of 258 m. These values align well with those obtained from past ground-truth campaigns using high-speed video cameras and instrumented towers. Moreover, the spatial distribution of LA derived from this methodology shows a similar pattern to that of the median value of the 50 % error ellipse semi-major axis reported by the network. In addition, a focused analysis of two well-known instrumented towers, i.e. Gaisberg and Säntis, confirms that the results in terms of LA from this methodology correspond well with findings previously reported in the literature. More generally, an overall decreasing trend in median LA over time is observed across all towers, which is consistent with expectations given the continuous evolution and improvement of the detection network. This analysis underscores the importance of consistent sensor upgrades and optimized placements to achieve high detection efficiency and location accuracy.
- Article
(2948 KB) - Full-text XML
- BibTeX
- EndNote


Lightning location systems (LLSs) are crucial tools for various applications, ranging from power grid protection and operational safety to meteorological monitoring and research. For such systems to be reliably used, their performance especially in terms of location accuracy (LA) and detection efficiency (DE) must be well understood and validated. Although network intercomparisons (Poelman et al., 2013; Poelman and Schulz, 2020) are sometimes used to estimate LLS performance, they rely on the implicit assumption that one network can serve as ground truth; an assumption that is not entirely valid. Consequently, the most direct and reliable approach involves comparing LLS data against independent ground-truth references.
Over the years, several methodologies have been employed to provide such ground-truth data, including lightning discharges to instrumented towers (Diendorfer, 2010), rocket-triggered events (Jerauld et al., 2005; Nag et al., 2011), and observations from high-speed video and electric field recordings (Idone et al., 1998; Schulz et al., 2010). Each of these approaches comes with its own strengths and limitations. Instrumented towers and triggered lightning offer precise location data, but their validity is inherently local and often limited to a handful of sites. Moreover, upward lightning – commonly observed at these towers – frequently lacks return strokes and may consist solely of initial continuous currents (ICC). Upward events with ICC only remain undetected by LF/VLF LLSs. High-speed video methods, with frame rates of at least a few hundred frames per second, can provide more spatially distributed performance estimates, yet are resource-intensive and typically confined to limited temporal and geographic windows. Further, this method does not provide the absolute location accuracy, but the relative location accuracy. This is because it relies on multiple discharges striking the same ground strike point, which is discernible through video observation, while the absolute location bias from the true ground strike point is not known.
The European Cooperation for Lightning Detection (EUCLID) has been periodically assessed using these methods (e.g. Schulz et al., 2016). However, such studies typically rely on a limited number of fixed locations and are therefore not necessarily representative of the system's performance across its full spatial coverage. These limitations highlight the need for complementary validation approaches. One such alternative is the use of multi-year datasets of lightning strikes to a large number of tall (mostly uninstrumented) structures distributed across the network, allowing spatial variations in location accuracy to be captured. Only a few studies have adopted this approach; for example, Cramer and Cummins (2014) evaluated the LA of the U.S. National Lightning Detection Network (NLDN) using a set of 22 towers, developing a methodology to identify events likely associated with a given tower based on location error ellipse parameters. In contrast, Zhu et al. (2020) significantly expanded this approach by using more than 1400 towers to evaluate, for the first time, the location error of the NLDN across the entire contiguous US.
In this context, the present study investigates the use of lightning data associated with a large number of tall structures, such as towers, masts, and chimneys, distributed across Europe as reference points for strike locations, enabling the assessment of location accuracy over a much broader spatial scale than is achievable with a limited number of instrumented towers. By systematically comparing lightning events near selected tall structures over a fourteen-year period, a spatially extensive and statistically robust assessment of location accuracy is provided. In doing so, the study can provide insight into EUCLID's performance and its evolution over time.
2.1 Lightning Location System
EUCLID maintains a widespread lightning detection network comprising more than 170 sensors across the European continent, as shown in Fig. 1. Note that some sensors are also located in the Macaronesian region, i.e. the Azores, Madeira, and Canary Islands, although these are not shown in Fig. 1. The primary objective of this network is to detect and classify both cloud-to-ground (CG) strokes and intracloud (IC) pulses operating in the very low and low frequency bands. Lightning event locations are determined using a combination of time-of-arrival (TOA) methods and magnetic direction finding (MDF) techniques. For every detected event, EUCLID records a detailed set of parameters, including a high-precision timestamp (with sub-microsecond resolution), the event's geographic location, discharge type (CG or IC), polarity, and peak current estimate. In addition to the physical attributes of each strike, the network logs various quality indicators. These include the lengths of the semi-major and semi-minor axes of the 50 % confidence ellipse surrounding the estimated location, the number of sensors that contributed to the solution, and a Chi-square that is related the coherence among sensor measurements. Readers interested in further details may consult https://www.euclid.org/ (last access: 17 October 2026).
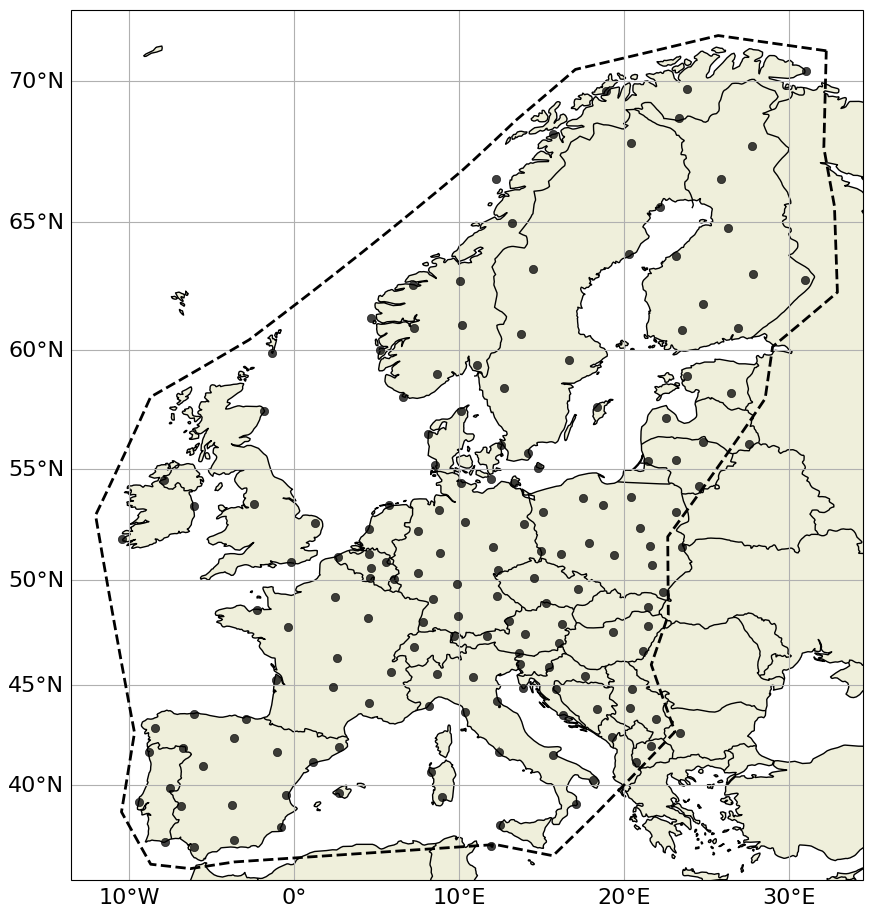
Figure 1Sensor distribution with the EUCLID network in 2025. Analysis is limited to the area outlined by the dashed polygon.
EUCLID is undergoing continuous refinement, with older sensors being replaced by newer models and sensor locations being optimized through additions or relocations. In addition, the central processing software is periodically upgraded to enhance overall system performance. These ongoing changes are reflected in the network's performance, particularly in terms of detection efficiency and location accuracy. Existing performance evaluations are based on a combination of direct lightning observations from instrumented towers and supplementary video and electric field measurements at selected sites (e.g. Schulz et al., 2016; Diendorfer, 2016). Thanks to ongoing network upgrades, a steady improvement in location accuracy has been observed over time. Regarding DE, data from instrumented towers suggest values of 70 % for negative CG strokes and 96 % for flashes. However, broader studies using video and E-field data from the periods 2008–2012, 2011, and 2012–2013 yield higher DE values of 84 % for strokes and 98 % for flashes, as reported by Schulz et al. (2016) and Diendorfer (2016). The slightly lower DE observed in tower-based studies likely stems from the fact that towers predominantly record subsequent strokes, which have weaker peak currents and are therefore more difficult to detect. More recent investigations by Schwalt et al. (2020) using ground-truth data from Austria (2015, 2017, 2018) confirm stroke detection rates between 76 % and 85.6 %. The consistency of these performance metrics, despite the continuous changes in hardware and configuration over the years, highlights the reliability and robustness of the EUCLID system.
Several ground-truth studies have quantified the location accuracy of EUCLID and its regional subsystems, consistently demonstrating substantial improvements over time. Using direct current measurements at the Säntis Tower in Switzerland, Azadifar et al. (2016) reported a median absolute location error of 186 m for 269 negative flashes recorded between 2010–2013. Similarly, Paul et al. (2020), based on measurements at the Peissenberg Tower in Germany between May 2011 and September 2017, found a geometric mean location error of 161 m based on 51 events detected by EUCLID, comprising both return stroke current pulses and pulses superimposed on the continuing current of a preceding return stroke, and 132 m when considering only return strokes. A broader assessment by Schulz et al. (2016), combining tower measurements, electric field data, and video observations across several European regions, highlights the temporal evolution of EUCLID performance. In particular, at the Gaisberg Tower in Austria, the moving median location error decreased from 317 m in 2007 to 89 m by the end of 2014, reflecting continuous improvements in network configuration and processing techniques. In addition to studies based on direct strikes to instrumented towers, several ground-truth campaigns in Europe have used high-speed camera observations. For example, analyses of the Austrian ALDIS network, which is part of EUCLID, indicates that median LA values range between 90 and 130 m based on 463 negative cloud-to-ground flashes recorded during multiple campaigns between 2015–2018 (Schwalt et al., 2020).
Another key aspect is the classification accuracy (CA) between CG and IC discharges. Studies specifically addressing CA remain relatively limited. Zhu et al. (2016) assessed classification performance in the U.S. NLDN, which shares similar sensor technology with EUCLID. Based on comparisons with optical and E-field data from the Lightning Observatory in Gainesville (LOG), they found a CG stroke CA of 92 %. Among 153 IC events – including isolated ICs and those occurring before or after return strokes – the overall CA was 86 %, with isolated IC events reaching 95 %. Given the technological and configuration parallels between NLDN and EUCLID, these results provide a useful reference. More directly, Kohlmann et al. (2017) evaluated the classification performance of EUCLID itself using ground-truth data derived from optical and electric field measurements collected in Austria (2012, 2015) and France (2014). The dataset comprised 560 events (382 CG and 178 IC), including both positive (201) and negative (359) discharges. Their results indicate an overall CA of 89 %, with significantly higher accuracy for positive events (95 %) than for negative events (85 %). When separated by discharge type, IC events were classified with an accuracy of 94 %, while CG events reached 85 %. These findings, based on direct EUCLID validation, provide a more representative estimate of its classification performance, while remaining broadly consistent with earlier results from the NLDN.
Large structures are known to occasionally initiate upward lightning discharges. When captured by an LLS, these events often exhibit a combination of IC pulses and CG strokes. This mixed signature depends both on the underlying physical processes within the flash and on possible misclassification by the detection system (Paiva et al., 2014). Excluding IC pulses would therefore discard a non-negligible fraction of tower-attributed events, particularly for structures where upward flashes are prevalent, e.g. in mountainous regions or during winter. Consequently, both IC and CG discharges are included in the location accuracy analysis, and no additional selection criteria, such as peak current thresholds, are applied.
2.2 Methodology
2.2.1 Structure selection
To assess the location accuracy of the EUCLID lightning detection network, a database of tall structures; including towers, guyed masts, chimneys, and similar installations, is compiled across Europe to serve as so-called reference points. The aim is not to create an exhaustive inventory of all existing tall structures, but rather to assemble a sufficiently large and spatially well-distributed sample within the EUCLID coverage domain to enable statistically meaningful analysis.
As a starting point, a list was compiled consisting of several dozen structures, identified through internal discussions, particularly focusing on those situated along the ridges of the Alps, Apennines, and Pyrenees. For these ridge-top towers, no minimum height criterion was applied. To expand this list, Wikipedia was systematically queried for tall towers, radio masts, and similar structures, applying minimum physical height of 150 m. This threshold follows Zhu et al. (2020), who applied the same 150 m minimum height when selecting towers, based on their Monte Carlo simulations showing that below approximately 150 m the elevated lightning-density signature around a structure becomes difficult to distinguish from background lightning density – in their 150 m and 1 µs timing-error case, the density-enhancement algorithm failed to identify a valid cluster at all. As both their method and ours rely on detecting a local density enhancement around a structure, this provides a quantitative lower bound below which that underlying assumption becomes unreliable.
Wikipedia was chosen as the primary source due to the lack of a centralized, publicly available European equivalent to, for example, the U.S. Federal Aviation Administration's Obstacle Database, which has been used in related studies over the US (Zhu et al., 2020). While other potential sources exist, such as databases from national aviation authorities, or various geospatial data repositories, Wikipedia offers the advantage of broad accessibility and rapid data extraction, which is sufficient given that the study does not require completeness. In addition to structure height (when known), ground elevation above sea level (a.s.l.) was retrieved for each site using the Google Elevation API to complement the dataset. The initial list consisted of more than 1300 entries, with the majority of them extracted from Wikipedia. Subsequently, the dataset was filtered to retain only those structures with a minimum separation of 2 km from any other structure in the list. This separation ensures that individual lightning strike clusters can be confidently attributed to a single structure, supporting a robust evaluation of the network's geolocation capabilities. Nevertheless, smaller structures, i.e. typically wind turbines, may still be located within 2 km of a larger object, but this only occurs in a handful of cases. An example and the potential consequences of such proximity will be briefly discussed in the next section.
Even after applying the initial spatial and height-based filters, not all structures were retained for the final analysis. Some towers, despite meeting the structural criteria, were found to lack sufficient associated lightning data or did not exhibit a clear enhancement in strike density relative to their immediate surroundings. For this, an additional filtering step was introduced based on the spatial distribution of lightning discharges near each tower. Specifically, the ratio of lightning strike density within a 500 m radius of each structure to the density within an annular ring extending from 500 m to 2 km is calculated. If a threshold is applied to this ratio, i.e. retaining only towers with values above the threshold, then setting it too high will limit the dataset to only a few towers, while setting it too low will include towers that do not show a meaningful lightning enhancement. In this study, structures with a density ratio below 1.5 are excluded from further analysis, as they do not appear to significantly influence local lightning activity. In the end, in total, 257 structures were retained for further analysis. Their locations and heights are shown in Fig. 2. For structures shown in black, information on the structure's height is unavailable; however, their symbol type (diamonds and triangles) indicates that they are typically situated in high-elevation areas such as mountain ridges or summits.
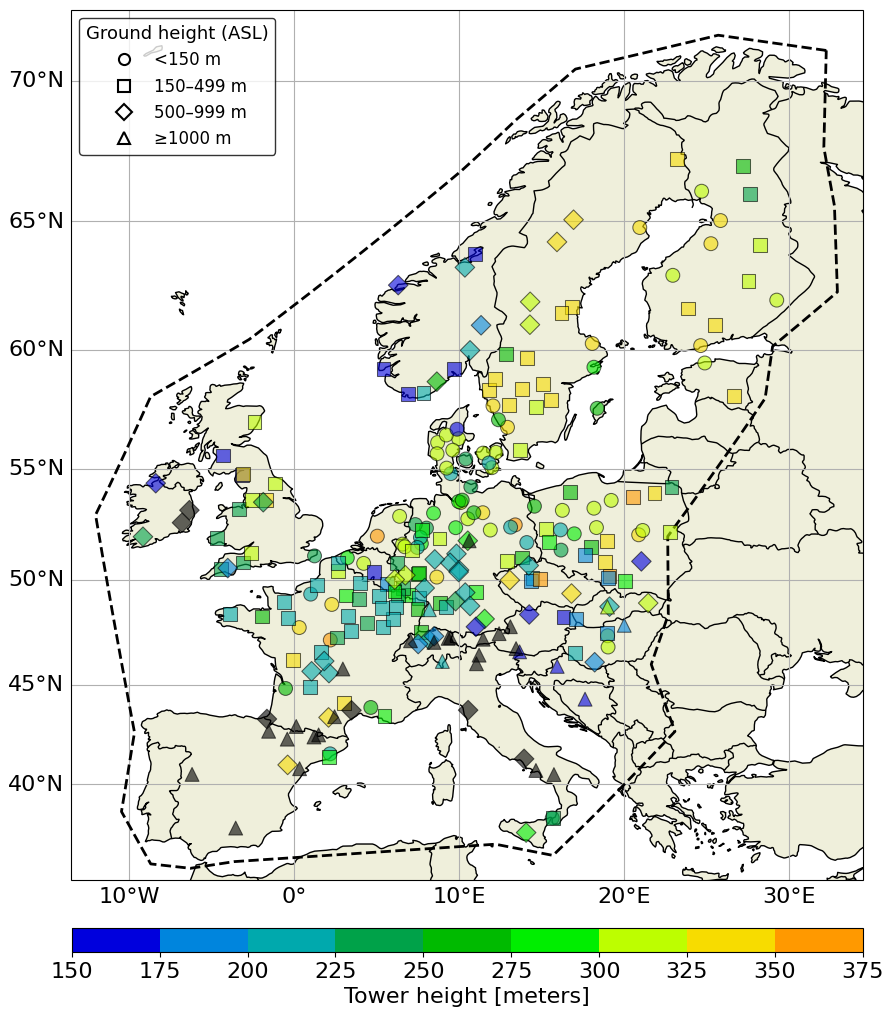
Figure 2Geographic distribution of selected structures used in the analysis. Marker color indicates structure height, while marker shape reflects the ground elevation category, as labeled in the plot. For some structures (in black), height information is unavailable; however, these are typically located in high-elevation areas such as mountain ridges or summits, as evident from their symbol type.
Finally, it is important to acknowledge potential selection biases in the tower dataset. Wikipedia, while offering broad accessibility and rapid data extraction, reflects documentation biases: towers in countries with more active Wikipedia contributors or more extensive infrastructure records may be overrepresented. Consequently, the dataset is not a comprehensive census of all lightning-relevant structures in Europe, but rather a curated set of suitable reference points. This selection may introduce regional biases; for instance, regions with dense clustering of tall structures (e.g. industrial areas with multiple chimneys or wind farms) are underrepresented because such structures fail the separation criterion. However, the primary goal of this study is not to produce performance metrics for every possible location, but to obtain a spatially distributed and statistically robust sample sufficient to assess overall network performance and its spatial variability. The resulting dataset of 257 structures achieves this objective, while the limitations described here should be considered when interpreting the results.
2.2.2 Clustering algorithm
A density-based spatial clustering algorithm, DBSCAN (Density-Based Spatial Clustering of Applications with Noise), was applied to identify the most probable group of lightning events – individual CG strokes and IC pulses, as defined in Sect. 2.1 – physically associated with each structure. The method groups nearby discharge locations into clusters based on two parameters: eps, the maximum distance within which points are considered neighbors, and min_samples, the minimum number of neighboring points required to form a cluster. Clustering is performed using only the spatial coordinates of the events; no timing information, such as inter-stroke intervals, is used, and no attempt is made to identify individual flashes or the stroke order within a flash. It is important to note that eps does not represent a physical attachment distance between a lightning strike and the structure, but rather a clustering threshold. The algorithm is well-suited for this application as it allows for the separation of high-density clusters – likely representing lightning strikes attracted to a specific tower – from surrounding noise. Once the most probable cluster associated with a structure has been identified, the location accuracy is calculated for each individual event within that cluster as the distance between the event's reported location and the structure's known location; the tower-level LA reported throughout this study is the median of these per-event distances.
A sensitivity analysis was performed by varying both eps and min_samples, and assessing their impact on individual clusters as well as on the overall LA. The results show that the choice of eps is particularly critical. For example, using a fixed min_samples value of 10, increasing eps from 0.1 (100 m) to 0.2 (200 m) doubles the overall median LA. This reflects the fact that larger eps values allow more distant discharges to be grouped together, which can result in clusters that are spatially displaced from the actual structure location. Conversely, setting eps too small may exclude relevant lightning strikes from the cluster. In contrast, the sensitivity to min_samples is more limited. For a fixed eps value (e.g. 0.1), doubling min_samples changes the overall median LA by no more than about 10 %. This indicates that the LA metric is considerably less sensitive to min_samples than to eps. Although setting min_samples too high may prevent the identification of any cluster, its overall influence on the final LA results remains comparatively moderate. Overall, the location accuracy analysis showed only moderate differences across a realistic range of parameter choices, with eps emerging as the more influential parameter. In the final configuration, eps was fixed at 100 m across all regions, while min_samples was set to 10. The choice of a fixed eps and min_samples across the entire study domain is deliberate as it ensures methodological uniformity, preventing region-specific tuning that could introduce uncontrolled variability into the location accuracy estimates. The selected scale of 100 m is sufficiently small to yield compact, approximately circular clusters around each tower – consistent with the expectation that lightning strikes to a tall structure should concentrate tightly in the LLS data – while avoiding the merger of discharges from nearby but distinct structures. The lower bound of min_samples=10 ensures that only clusters supported by at least ten events are retained, thereby increasing robustness against spurious or weakly populated clusters. An adaptive eps, for example scaled to the local semi-major axis of the error ellipse, would risk conflating clustering with the subsequent accuracy assessment: regions with poorer network performance would yield larger clusters, artificially inflating location error estimates and obscuring the independent evaluation of LA.
The spatial distribution of the towers and their associated cluster sizes, derived using the DBSCAN clustering algorithm applied to the full 2012–2025 study period, is shown in Fig. 3. As illustrated, the majority of clusters are relatively small. Clusters containing 10–50 events are the most frequent (33 %), followed by 50–100 events (26 %) and 100–250 events (20 %). The occurrence of larger clusters decreases rapidly with increasing size, yet clusters containing more than 250 events still collectively accounting for 21 % of the total (N=257). As can be seen in Fig. 3, smaller clusters are predominantly located in the northern part of the EUCLID domain, particularly over Scandinavia and Denmark.
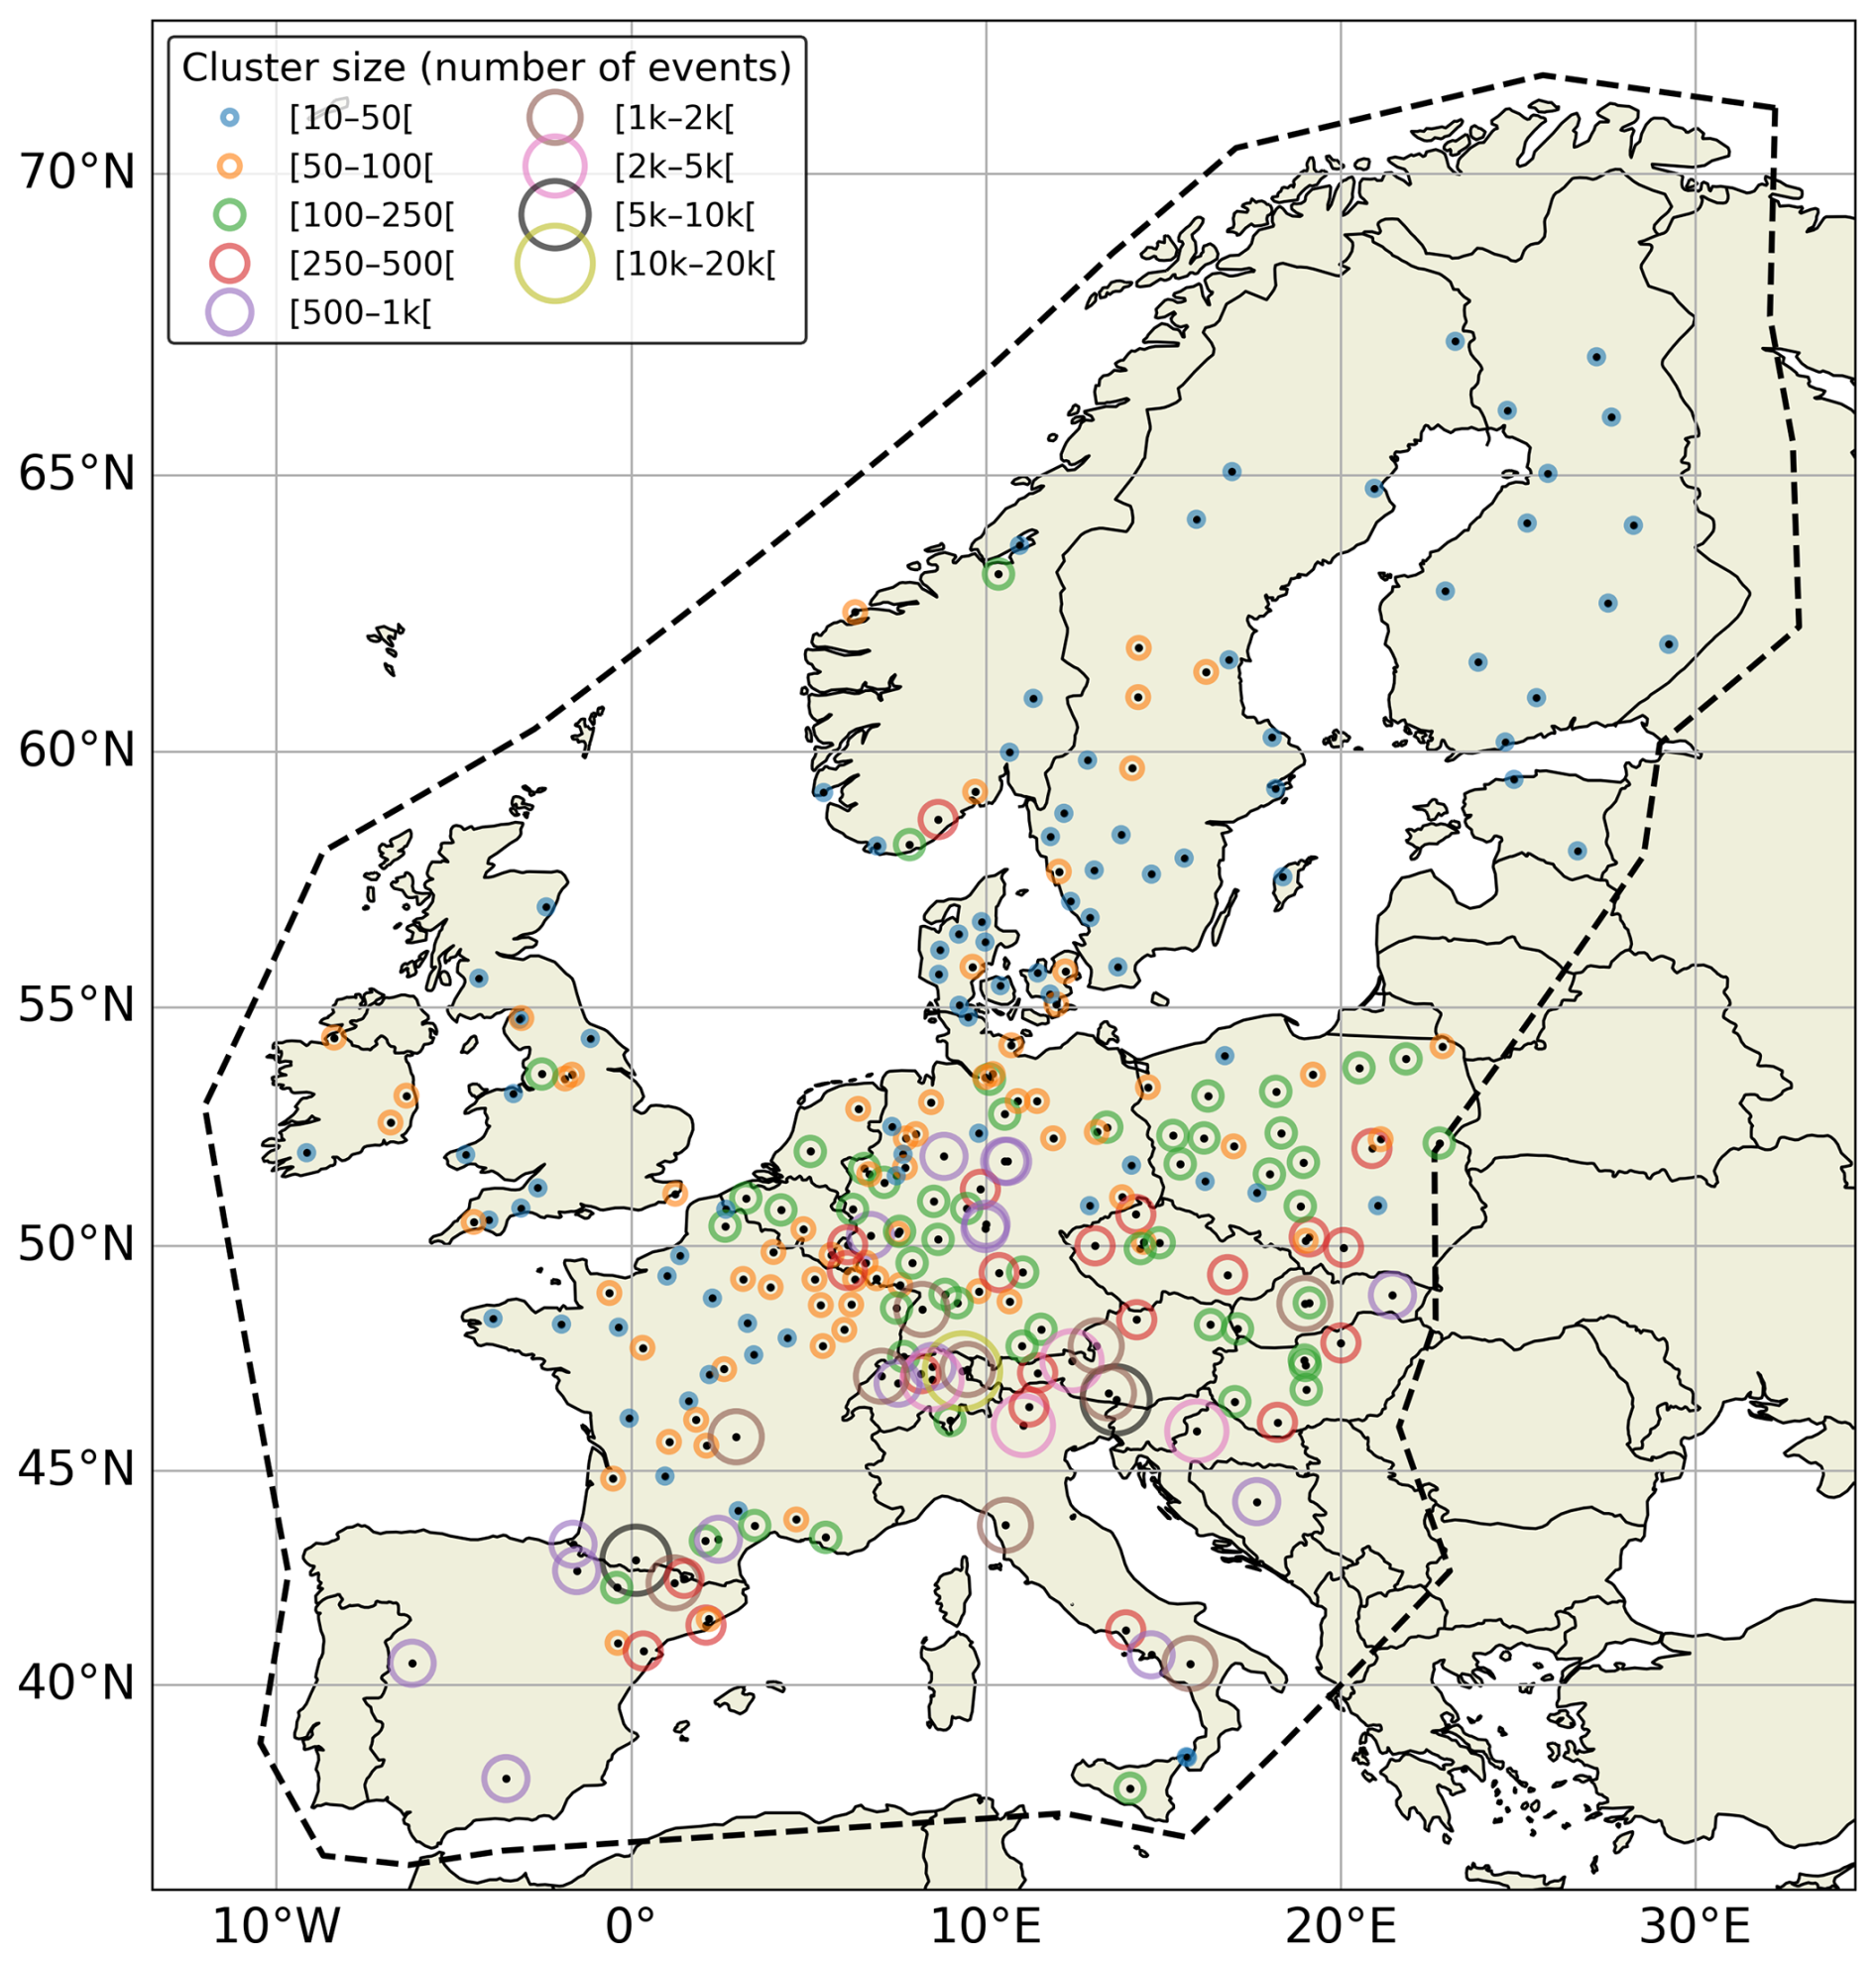
Figure 3Spatial distribution of the towers used in this study, with marker size and/or color representing the cluster size derived from the DBSCAN analysis applied to the full 2012–2025 study period, thereby illustrating the spatial variation in cluster magnitude across the study domain.
When applying DBSCAN to EUCLID observations near a structure, multiple clusters may be identified. In such cases, the cluster closest to the structure's location is assumed to contain the lightning events that struck the structure. This can happen, for instance, when another structure – such as a wind turbine – is located nearby but was not included in the original structure list. As a result, the primary structure may have passed the initial criterion of having no other tall structures within a 2 km radius. In these situations, the closest cluster to the tower was selected for analysis, under the assumption that it is most likely associated with the structure in question, a design choice quantitatively compared against an alternative, published clustering approach in Sect. 3.3. However, it is important to note that no additional filtering was applied to explicitly remove nearby structures like wind turbines from the analysis domain. As a result, the possibility remains that some lightning discharges may be misattributed to the reference tower. This introduces a potential positive bias in the estimated location errors, meaning that the reported LA values should be interpreted as upper-bound estimates under the applied methodology.
An example of the output of the DBSCAN clustering algorithm is shown in the Fig. 4. In both subplots, the lightning activity around the reference structure – located at the origin (0,0) – is represented as a color-coded 2D histogram. The number of lightning discharges falling within each spatial bin (pixel) is indicated by the color scale, with higher counts shown in red. The black polygon delineates the spatial extent of the DBSCAN cluster that was retained for the analysis, while the white star marks the gravity center of the identified cluster. Figure 4a illustrates a case where two spatially distinct dense areas are present within the same DBSCAN cluster close to the reference structure in the middle of the plot. The central peak is clearly associated with the tower at the origin, but a secondary peak is visible just to the south. This secondary maximum corresponds to a nearby wind turbine, which was not explicitly removed from the dataset – likely because the initial tower list only included structures exceeding 150 m and did not specifically target wind turbines. Because the turbine is close enough to the tower, both sets of discharges are grouped into a single DBSCAN cluster, shifting the gravity center slightly southward. In contrast, Fig. 4b shows a tower with a nearby wind turbine located farther away – approximately 1.5 km to the west. Although two dense areas are again visible, the DBSCAN algorithm only selects the cluster centered on the reference tower, as the discharges associated with the wind turbine lie outside the specified eps radius for clustering. This illustrates that the spatial proximity of such nearby sources is critical: if they fall within the clustering radius, they may be inadvertently included in the analysis. This example highlights a limitation of the methodology. While DBSCAN effectively groups high-density lightning discharges, it does not distinguish between discharges caused by the main structure under investigation and those attracted to nearby structures such as wind turbines, which are not accounted for in this study. Nonetheless, cases in which additional nearby density maxima are present were retained in the dataset rather than explicitly removed. This may introduce a slight positive bias in the estimated location errors, implying that the derived location accuracy values are likely conservative; that is, the true network performance is expected to be at least as good as, and possibly better than, the values reported here.
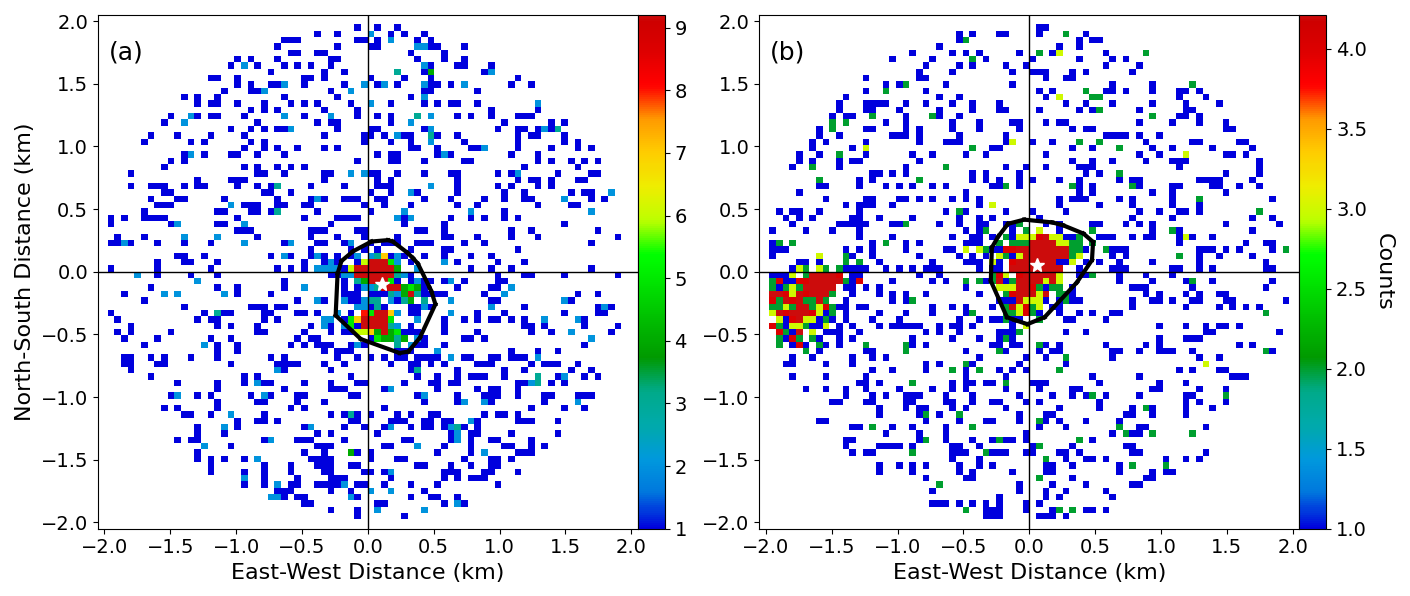
Figure 4Spatial lightning density maps for two distinct scenarios, with the instrumented structure at (0,0). The number of lightning discharges falling within each spatial bin (pixel) is indicated by the color scale, with higher counts shown in red. In (a), DBSCAN groups two adjacent high-density regions into a single cluster (black outline), with the gravitational center indicated by the white star. In (b), DBSCAN identifies only the high-density region near the structure as the primary cluster for location accuracy calculation, excluding a more distant region.
2.2.3 Cross validation against instrumented towers
The Gaisberg and Säntis towers provide an excellent testbed for validating the clustering methodology. These well-documented instrumented towers have been extensively used in the literature to assess the location accuracy of the EUCLID network, making them ideal reference sites for benchmarking the method. Both towers are equipped with sensors that record lightning strikes with high temporal precision through GPS synchronization. Combined with their precisely known locations, this enables unambiguous matching of EUCLID-detected events to tower impacts, providing a reliable reference dataset for evaluating geolocation performance. For both towers, the reference (ground-truth) datasets and the DBSCAN-based cluster inputs include the full mix of CG- and IC-classified pulses recorded by EUCLID, consistent with the general methodology adopted throughout this study (Sect. 2.1).
This validation approach has been applied in previous studies, such as those by Schulz et al. (2016), where the median location error was calculated as a moving median over the most recent 100 confirmed CG strokes to the Gaisberg tower. Here, an updated version of their Fig. 4 is presented in Fig. 5a, using an extended current-measurement dataset covering the period 2000–2025 and including both CG- and IC-classified pulses confirmed at the tower, kindly provided by Hannes Pichler (personal communication, 2026). As shown in Fig. 5a, the black dots indicate a clear improvement in network accuracy over time, with the median LA decreasing from roughly 400–500 m in the early 2000s to about 70 m by 2025.
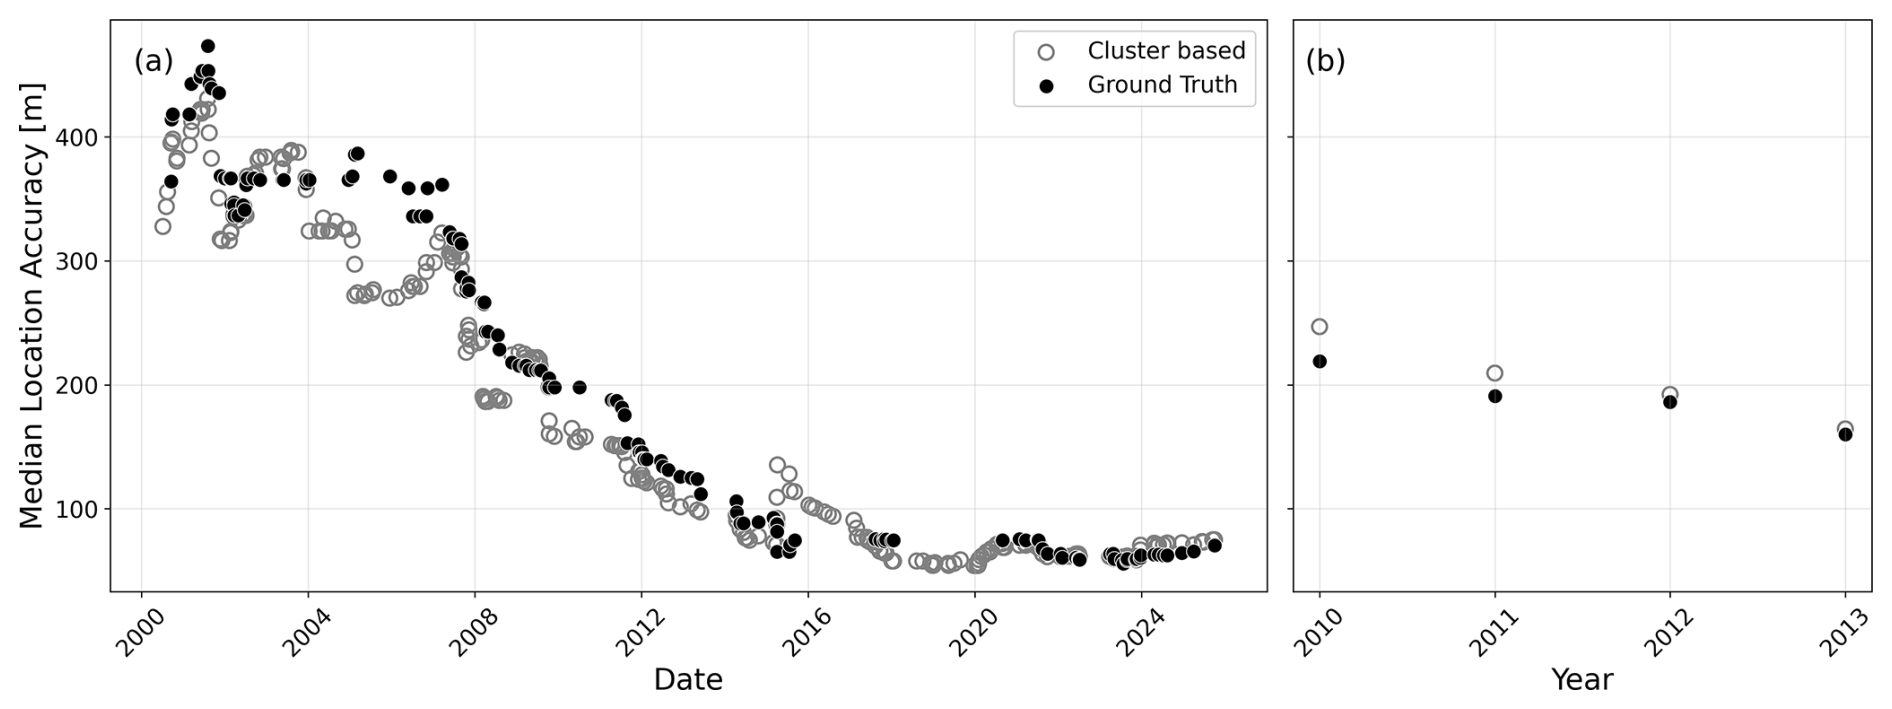
Figure 5Temporal evolution of the median location error calculated (a) using a moving median for the Gaisberg tower and (b) grouped per year for the Säntis tower.
In addition, Fig. 5a shows the moving median values (grey circles) derived using the DBSCAN-based clustering methodology introduced in this study. The strong agreement between these values and those obtained from direct tower measurements demonstrates that the clustering approach successfully reproduces the established location accuracy estimates.
For the Säntis tower, a moving-median analysis similar to that available for the Gaisberg tower is, to the authors' knowledge, not reported in the literature. However, Azadifar et al. (2016) provide, in their Table 2, annual median values of the absolute location error for pulses detected by the EUCLID network over the period 2010–2013. These reference values are shown as black dots in Fig. 5b. The grey open circles represent the corresponding median values from yearly clusters obtained using the DBSCAN methodology introduced in this study. As for the Gaisberg case, the agreement between both datasets is very good, with the derived values closely matching the published results in Azadifar et al. (2016) and reproducing the same decreasing trend over the 2010–2013 period.
This agreement also lends additional support to the fixed eps value of 100 m adopted in Sect. 2.2.2. At the Gaisberg tower, the close correspondence between the DBSCAN-based moving median LA and the ground-truth location accuracy, sustained over more than two decades (Fig. 5a), indicates that this parameter choice does not merely produce internally consistent clusters but yields location accuracy estimates that track independently validated, long-term reference data. The Säntis tower provides a shorter and more limited benchmark (Fig. 5b), yet the DBSCAN-derived estimates reproduce both the magnitude and the decreasing trend of these independent reference values. Taken together, the two towers indicate that the fixed eps of 100 m yields location accuracy estimates consistent with independent ground truth across different sites and over both short- and long-term validation periods, reinforcing the statistical robustness of the methodology.
3.1 Median location accuracy across towers
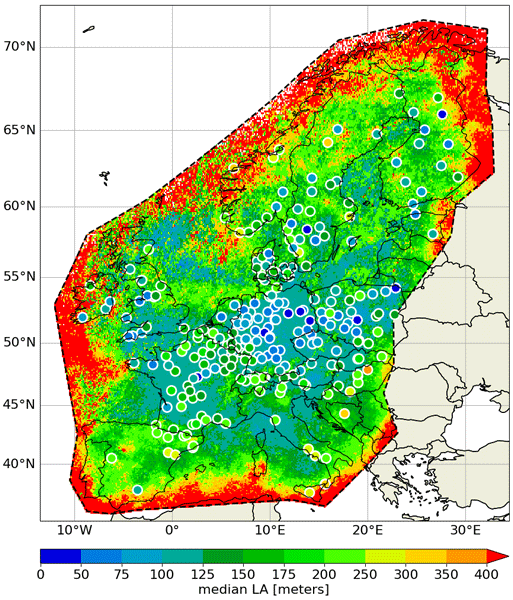
Figure 6 summarizes the median LA for each structure in the dataset, with circle colors indicating the median LA value on a scale ranging from 0 to 400 m. The majority of towers fall within the green and blue ranges, reflecting generally good geolocation performance across the network, while only a small subset exhibits large median errors. Across all towers, the mean and median LA obtained with the adopted methodology are 137 and 124 m, respectively, with a 95th percentile of 258 m. To further support the robustness of the network-wide median LA, a bootstrap and random-subsampling analysis was performed on the 257 median LA values. Resampling with replacement (10 000 iterations) yields a 95 % confidence interval of [115.5,135.2] m around the observed median of 124.9 m. In addition, randomly subsampling 50 %, 70 %, and 90 % of the towers (without replacement) produces median LA values that remain tightly clustered around the full-sample estimate, with the 95 % range narrowing from ±10 m at 50 % subsampling to ±2 m at 90 % subsampling. This confirms that the reported median LA is not driven by a small subset of towers and supports the statistical robustness of the result.
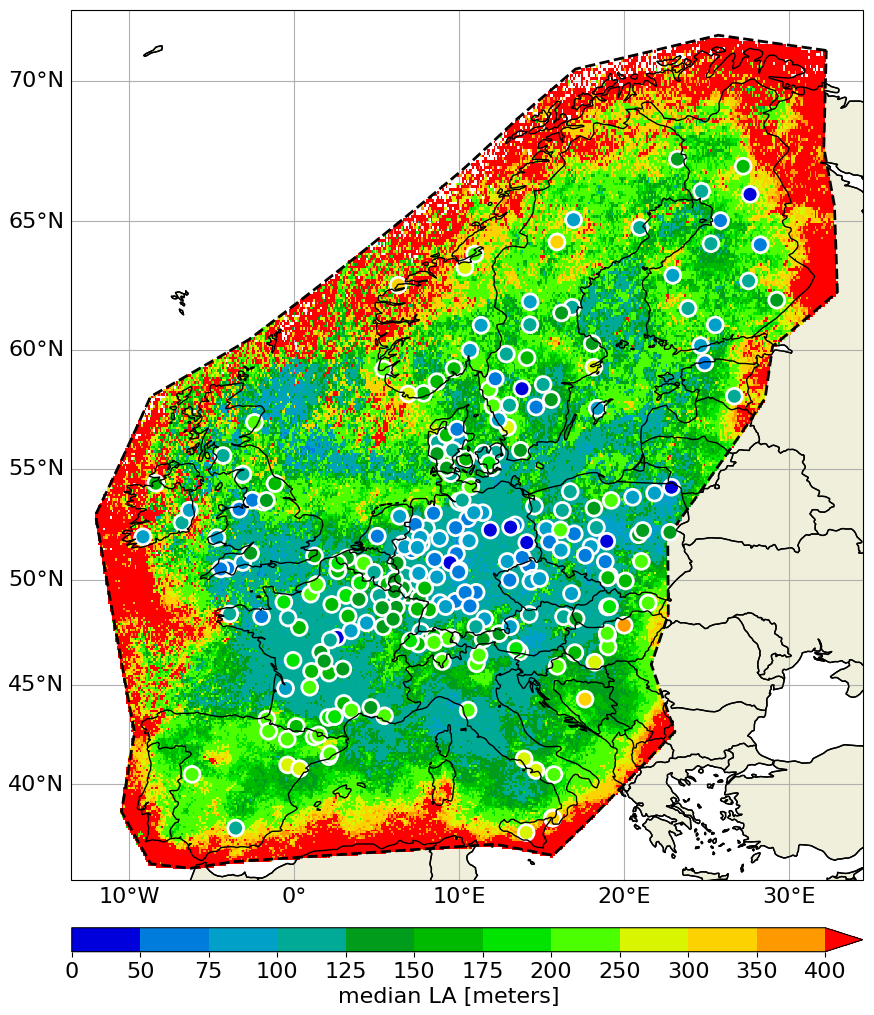
Figure 6Median location accuracy (LA) at each instrumented tower (colored circles), overlaid on the spatial distribution of the median semi-major axis (SMA) of the 50 % error ellipse for EUCLID strokes from 2012–2025. The color bar indicates the scale in meters.
We further examined whether structures located closer to the EUCLID network boundary (dashed line in Fig. 6) show systematically larger median LA, using the geodesic distance from each tower to this boundary. No significant relationship was found (Spearman's , p=0.19, n=257); however, only a small number of towers in our dataset lie close to the network periphery, which limits the statistical power to detect such an effect. Given that Zhu et al. (2020) identified a clear edge effect on location error using a substantially larger and denser set of towers along the boundary of the U.S. National Lightning Detection Network, a similar effect cannot be excluded for EUCLID and may become detectable as the number of instrumented structures near the network periphery increases in future studies.
In the background of the Fig. 6, the underlying colour field represents the spatial distribution of the median semi-major axis (SMA; see Nag et al., 2011; and Cramer and Cummins, 2014) of the 50 % error ellipse assigned by the EUCLID system. This ellipse describes the region within which the event is expected to lie with 50 % probability. The spatial pattern of the SMA generally aligns with the tower-based median LA values, with lower SMA regions (blue and green tones) typically corresponding to better (i.e. lower) median LA, and higher SMA values associated with reduced location accuracy. The consistency between both metrics suggests that SMA captures spatial variations in geolocation quality in a manner broadly aligned with structure-based clustering algorithm estimates. It is important to note, however, that the SMA is a mathematical-derived property provided by the EUCLID system, rather than an independent measurement. As a result, the observed agreement between median LA and SMA primarily reflects internal consistency within the network, rather than an independent validation of absolute location accuracy. Nevertheless, this alignment supports the use of SMA as a practical, real-time proxy for relative geolocation quality across the network.
To further quantify the differences between SMA-derived uncertainties and LA values derived from the DBSCAN clustering method, the following approach was conducted. Using SMA values within a 2 km radius around each structure yields mean and median values of 138 and 119 m, respectively, with a 95th percentile of 244 m, showing overall comparable magnitudes to the tower-based median LA estimates. A more detailed comparison (Fig. 7) shows the distribution of signed differences between the median tower LA and the SMA of all lightning events recorded within a 2 km radius of each tower. The distribution reveals a median offset of −10 m, with the interquartile range (IQR) spanning from −42 m (P25) to +47 m (P75), corresponding to an IQR of 89 m. The near-zero mean (−2 m) and median value suggest that, on average, there is no substantial systematic bias between both estimates, though the slight negative median hints that the derived location accuracy tends to be marginally smaller than the EUCLID-reported SMA. The distribution appears broadly symmetric around zero, although moderate tail heaviness is present. Consequently, the standard deviation (σ=69 m) is moderately influenced by these extreme values and should be interpreted with caution as a measure of typical variability. More robust measures of spread are provided by the IQR (89 m) and the P5–P95 range (−111 to +109 m), the latter capturing larger discrepancies observed for a limited number of towers.
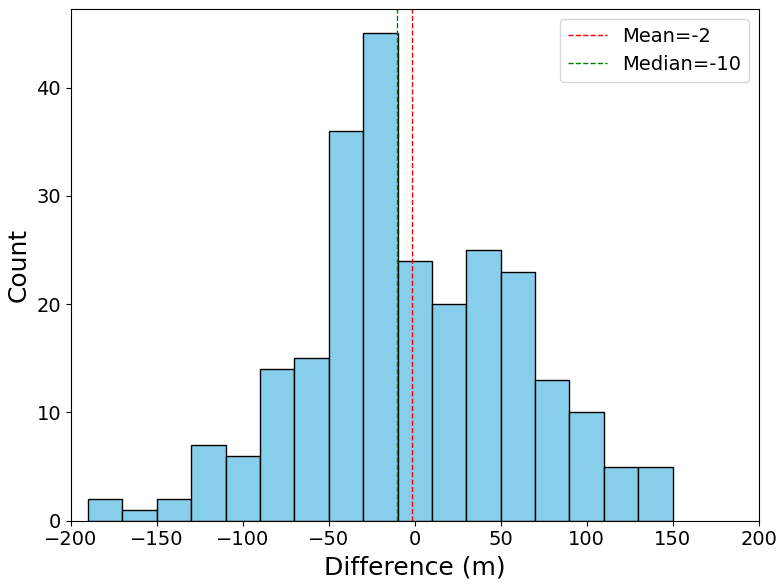
Figure 7Distribution of signed differences between median LA (derived from DBSCAN clustering) and SMA values within 2 km of each structure. Each structure contributes one value to this distribution (N=257); the count on the vertical axis therefore refers to the number of structures, not the number of individual lightning events.
It should be noted that, by definition of the 50 % error ellipse, the true strike location lies within the ellipse for 50 % of the detected events and outside it for the remaining 50 %. This is consistent with the small observed median offset of −10 m between the tower-based median LA and the SMA: for approximately half of the investigated towers the median SMA exceeds the DBSCAN-derived LA, while for the other half it is smaller, closely matching the split expected under the theoretical definition of the ellipse. This agreement lends further support to the SMA as a practical proxy for location accuracy in situations where direct ground-truth validation is not available. The investigated parameter SMA represents the larger axis and serves only as a proxy for the shape or area of the 50 % error ellipse, as neither the axis ratio nor the orientation were considered in this comparison (as also described in Cramer and Cummins, 2014). This simplification may contribute to the marginally smaller LA values derived from the cluster estimation algorithm compared to the SMA-based values. This suggests that the SMA nonetheless provides a reasonable approximation of the spatial scale of location uncertainty. Overall, although the SMA reproduces the general spatial patterns and magnitude of location accuracy, variability at individual tower locations remains non-negligible, as reflected by the P5–P95 range of −111 to +109 m.
3.2 Temporal evolution of the location error
To examine how LA has evolved over time using our structure-based methodology, we divided the dataset into two distinct periods: the first covering January 2012–December 2014, and the second comprising the most recent three years, from January 2023 to December 2025. A histogram comparing the distribution of median LA values across these periods, as shown in Fig. 8, clearly illustrates an improvement over time: the second period shows a shift toward lower median LA values. Quantitatively, the mean and median LA for the first period are 135 and 126 m, respectively, while the corresponding values for the second period are 119 and 100 m. This demonstrates an enhancement in location accuracy over the years. These findings are consistent with the trend shown in Fig. 5a, where a running mean of the median LA for the instrumented Gaisberg tower also indicates a steady improvement. The results presented here, however, extend that trend to a much broader set of towers included in this study, reinforcing the evidence for network-wide progress in geolocation performance.
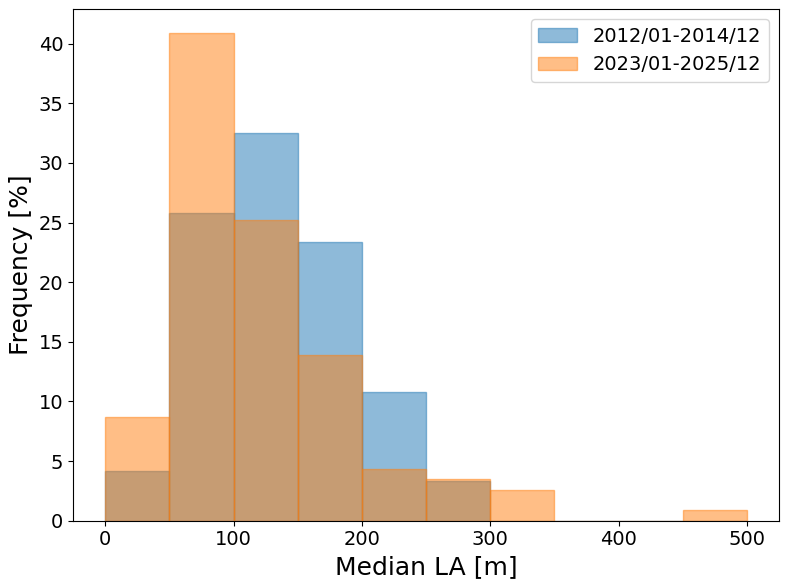
Figure 8Histogram of median location accuracy values for all towers, contrasting the first three years (blue) with the last three years (orange) of the dataset.
A small number of structures (n=4 of 115 with median LA≥300 m in 2023–2025) show a higher median LA in the more recent period than in 2012–2014, contributing to the tail extending to 450–500 m in Fig. 8. These four structures have roughly half as many lightning events available in 2023–2025 as in 2012–2014; using the full 2012–2025 record, for which cluster sizes are substantially larger and more robust, their median LA is comparable to the 2012–2014 values and consistently lower than in the 2023–2025 sub-period alone. This indicates that the apparent degradation reflects a short-window sampling fluctuation rather than a genuine loss of geolocation performance, and none of the four structures are located near the network boundary.
3.3 Comparison with an alternative clustering approach (Zhu et al., 2020)
To place the DBSCAN-based clustering approach adopted here in context, it is instructive to compare it with the raster-based method of Zhu et al. (2020), developed for a similar assessment of the U.S. NLDN using lightning strikes to towers. Their approach differs from ours in two respects. First, rather than a point-based clustering algorithm with a fixed neighborhood radius, Zhu et al. (2020) apply a raster-based density threshold, in which local lightning density is computed on a 50 m×50 m grid within a 2 km domain around each tower, with hard bounds on the retained cluster size (25–250 grid cells). Second, when multiple density-elevated regions occur within the domain – for example due to a nearby structure not included in the reference tower list – their algorithm retains the region containing the domain-wide density maximum, whereas the present method instead selects the cluster closest to the known structure location (Sect. 2.2.2), specifically to avoid misattributing lightning activity from a competing nearby source.
We implemented the Zhu et al. (2020) algorithm and applied it to the subset of 257 structures for which our own DBSCAN-based method yielded a valid cluster. A cluster satisfying all of Zhu et al.'s size and density-ratio criteria was identified for 137 of these 257 structures (53 %), a success rate of a similar order to the 589 of 1451 candidate towers (41 %) reported by Zhu et al. (2020) for the NLDN – keeping in mind that their candidate list, unlike ours, was not pre-filtered by a density-enhancement criterion. For one structure, the domain-wide density maximum criterion caused Zhu et al.'s algorithm to select a cluster located approximately 1.5 km from the tower; substituting a closest-to-tower cluster-selection rule, analogous to the one adopted in this study, resolves this case (yielding ∼90 m under both methods). Applying this closest-to-tower selection rule throughout, the median difference in location accuracy between the two methods (Zhu et al. minus ours) is −2.0 m (interquartile range: 15.8 m, n=132), indicating that the two clustering approaches are fundamentally consistent despite their methodological differences.
This study presents a large-scale evaluation of the location accuracy of the EUCLID lightning detection network using lightning activity in the vicinity of tall structures distributed across Europe. By combining a density-based clustering approach with a systematic tower selection methodology, a spatially extensive and statistically robust assessment of network performance is achieved. However, the location error retrieved based on the methodology described should not be regarded as the absolute location accuracy, but is a good proxy estimate.
The results demonstrate that the location accuracy obtained from the clustering methodology is consistent with earlier studies based on instrumented towers and independent measurement techniques, thereby supporting the validity of the approach. Moreover, comparison with the semi-major axis of the error ellipse indicates that this parameter captures the general spatial patterns of geolocation quality observed in the tower-based estimates. This agreement is expected, as the SMA is mathematically valid provided that all systematic errors are properly corrected and the standard deviations of the angle and timing inputs in the location algorithm are accurately configured.
The temporal analysis highlights a clear improvement in location accuracy over the study period, consistent with ongoing network upgrades, sensor replacements, and processing enhancements. This confirms that continuous optimization of the network configuration translates directly into measurable gains in performance.
More generally, the use of tall structures proves to be a valuable and scalable approach for assessing relative variations and long-term trends in location accuracy over large geographic domains. However, it should be emphasized that this method does not provide an absolute measure of the true location error of natural lightning, as the exact strike point on or near a structure remains uncertain and may be influenced by nearby objects or clustering assumptions. Consequently, the results presented here should be interpreted as conservative estimates of location accuracy – likely somewhat larger than the true geolocation errors – rather than exact ground-truth values. Despite these limitations, the methodology offers a meaningful complement to traditional validation techniques, enabling continuous and spatially comprehensive monitoring of network performance. Future work could extend this methodology by examining individual events within the DBSCAN clusters of a selected subset of towers, comparing each event's own 50 % error ellipse against its actual positional offset from the tower. Such an event-level analysis could help verify the representativeness of the error ellipse as a location accuracy metric in cases where direct ground-truth validation is unavailable.
The EUCLID lightning location data used in this study are jointly owned by the members of the EUCLID network under a cooperation agreement that governs data sharing and commercial licensing. Because the data include sensor contributions from multiple operators, redistribution to third parties requires approval from all EUCLID members and cannot be granted unilaterally by the authors. Access to the specific data set used in this study can be requested from the corresponding author and is subject to approval by the EUCLID consortium.
DRP: Conceptualization, Data curation, Formal analysis, Investigation, Methodology, Visualization, Writing – original draft. HK: Supervision, Writing – review and editing. WS: Supervision, Writing – review and editing.
The contact author has declared that none of the authors has any competing interests.
Publisher's note: Copernicus Publications remains neutral with regard to jurisdictional claims made in the text, published maps, institutional affiliations, or any other geographical representation in this paper. The authors bear the ultimate responsibility for providing appropriate place names. Views expressed in the text are those of the authors and do not necessarily reflect the views of the publisher.
The authors are grateful to all past and present EUCLID members for being able to use the data for this study. We further thank Hannes Pichler (OVE-ALDIS) for kindly providing the extended Gaisberg tower current-measurement dataset used in Fig. 5a. We thank Martin Murphy (Vaisala) and the anonymous referee for their constructive reviews, which helped improve this manuscript. We also thank Hugh Hunt (University of Witwatersrand) for his valuable community comments during the open discussion.
This paper was edited by Ulla Wandinger and reviewed by Martin Murphy and one anonymous referee.
Azadifar, M., Rachidi, F., Rubinstein, M., Paolone, M., Diendorfer, G., Pichler, H., Schulz, W., Pavanello, D., and Romero, C.: Evaluation of the performance characteristics of the European Lightning Detection Network EUCLID in the Alps region for upward negative flashes using direct measurements at the instrumented Säntis Tower, J. Geophys. Res.-Atmos., 121, 595–606, https://doi.org/10.1002/2015JD024259, 2016.
Cramer, J. A. and Cummins, K. L.: Evaluating location accuracy of lightning location networks using tall towers, in: International Lightning Detection Conference, Tucson, Arizona, USA, https://www.vaisala.com/en/view-and-download-papers-earlier-ildcilmc-conferences (last access: 17 October 2026), 2014.
Diendorfer, G.: LLS performance validation using lightning to towers, in: Proc. 21st Int. Lightning Detection Conf., Orlando, FL, Vaisala, 15 pp., https://www.vaisala.com/en/view-and-download-papers-earlier-ildcilmc-conferences (last access: 17 October 2026), 2010.
Diendorfer, G.: A review of 25 years of lightning research in Austria from 1991–2015, in: World meeting on Lightning, 6–8 April 2016, Cartagena, Colombia, https://www.acofi.edu.co/womel/conference-papers (last access: 17 October 2026), 2016.
Idone, V. P., Davis, D. A., Moore, P. K., Wang, Y., Henderson, R. W., Ries, M., and Jamason, P. F.: Performance evaluation of the U.S. National Lightning Detection Network in eastern New York: 1. Detection efficiency, J. Geophys. Res., 103, 9045–9055, https://doi.org/10.1029/98JD00154, 1998.
Jerauld, J., Rakov, V. A., Uman, M. A., Rambo, K. J., Jordan, D. M., Cummins, K. L., and Cramer, J. A.: An evaluation of the performance characteristics of the U.S. National Lightning Detection Network in Florida using rocket-triggered lightning, J. Geophys. Res., 110, D19106, https://doi.org/10.1029/2005JD005924, 2005.
Kohlmann, H., Schulz, W., and Pedeboy, S.: Evaluation of EUCLID IC/CG classification performance based on ground-truth data, in: 2017 International Symposium on Lightning Protection (XIV SIPDA), Natal, Brazil, https://doi.org/10.1109/SIPDA.2017.8116896, 35–41, 2017.
Nag, A., Mallick, S., Rakov, V. A., Howard, J. S., Biagi, C. J., Hill, J. D., Uman, M. A., Jordan, D. M., Rambo, K. J., Jerauld, J. E., DeCarlo, B. A., Cummins, K. L., and Cramer, J. A.: Evaluation of U.S. National Lightning Detection Network performance characteristics using rocket-triggered lightning data acquired in 2004–2009, J. Geophys. Res., 116, D02123, https://doi.org/10.1029/2010JD014929, 2011.
Paiva, A., Saba, M., Naccarato, K., Schumann, C., Jaques, R., Ferro, M., and Warner, T.: Detection of upward lightning by lightning location systems, in: 2014 International Conference on Lightning Protection (ICLP), Shanghai, China, https://doi.org/10.1109/ICLP.2014.6973425, 1824–1826, 2014.
Paul, C., Heidler, F. H., and Schulz, W.: Performance of the European lightning detection network EUCLID in case of various types of current pulses from upward lightning measured at the Peissenberg Tower, IEEE T. Electromagn C., 62, 116–123, https://doi.org/10.1109/TEMC.2019.2891898, 2020.
Poelman, D. R. and Schulz, W.: Comparing lightning observations of the ground-based European lightning location system EUCLID and the space-based Lightning Imaging Sensor (LIS) on the International Space Station (ISS), Atmos. Meas. Tech., 13, 2965–2977, https://doi.org/10.5194/amt-13-2965-2020, 2020.
Poelman, D. R., Honoré, F., Anderson, G., and Pedeboy, S.: Comparing a regional, subcontinental and long-range lightning location system over the Benelux and France, J. Atmos. Ocean. Tech., 30, 2394–2405, https://doi.org/10.1175/JTECH-D-12-00263.1, 2013.
Schulz, W., Pichler, H., and Diendorfer, G.: Evaluation of 45 negative flashes based on E-field measurements, video data and lightning location data in Austria, in: Proc. 30th Int. Conf. on Lightning Protection, Cagliari, Italy, Power and Energy Society, https://doi.org/10.1109/ICLP.2010.7845770, 1–4, 2010.
Schulz, W., Diendorfer, G., Pedeboy, S., and Poelman, D. R.: The European lightning location system EUCLID – Part 1: Performance analysis and validation, Nat. Hazards Earth Syst. Sci., 16, 595–605, https://doi.org/10.5194/nhess-16-595-2016, 2016.
Schwalt, L., Pack, S., and Schulz, W.: Ground truth data of atmospheric discharges in correlation with LLS detections, Elect. Power Syst. Res., 180, 106065, https://doi.org/10.1016/j.epsr.2019.106065, 2020.
Zhu, Y., Rakov, V. A., Tran, M. D., and Nag, A.: A study of National Lightning Detection Network responses to natural lightning based on ground truth data acquired at LOG with emphasis on cloud discharge activity, J. Geophys. Res.-Atmos., 121, 14651–14660, https://doi.org/10.1002/2016JD025574, 2016.
Zhu, Y., Lyu, W., Cramer, J., Rakov, V., Bitzer, P., and Ding, Z.: Analysis of location errors of the U.S. National Lightning Detection Network using lightning strikes to towers, J. Geophys. Res.-Atmos., 125, e2020JD032530. https://doi.org/10.1029/2020JD032530, 2020.