
the Creative Commons Attribution 4.0 License.
the Creative Commons Attribution 4.0 License.
 | 04 Nov 2026
Retrieval of bimodal aerosol size distributions for stratospheric sulfate and smoke aerosols using multi–wavelength satellite measurements

Cheng-Hsuan Lu
Pyrocumulonimbus events (pyroCb) are a natural driver of stratospheric aerosol variability by injecting smoke plumes containing aerosols and trace gases into the upper troposphere and lower stratosphere. Smoke aerosols are distinct in their chemical, optical, and microphysical properties from stratospheric sulfate aerosols. A new approach in retrieving the bimodal lognormal aerosol size distribution from stratospheric aerosol observations is developed. Aerosol size distributions inferred from in situ and satellite based studies are used to model stratospheric aerosol properties following a pyroCb event. Synthetic and observational multi–wavelength data from the Stratospheric Aerosol and Gas Experiment III on the International Space Station (SAGE III/ISS) are used to simulate and validate the retrieval method. Aerosol optical and microphysical properties are determined to vary for coarse mode aerosol concentrations totaling more than 0.1 %–1 % of the population. Simulated retrievals show reduced negative bias in number density with retrieval of a bimodal distribution, with limitations from the measurement technique and retrieval persisting in defining the ultrafine aerosol concentrations. Retrieved aerosol size distributions resolve the shape, centers, and range of the synthetic distributions, with retrieved distribution moments consistently within the uncertainty range of the input extinction measurements.
Validation of the retrieval algorithm applied to SAGE III/ISS observations is conducted against in situ balloon-borne measurements characterizing aerosol properties following pyroCb events in the northern hemisphere in 2017 and 2020. SAGE III/ISS retrieved aerosol size distributions of stratospheric smoke in these coincident observations display two modes with fine mode median diameters approximately 200–400 nm and coarse mode median diameters of 500–800 nm. Observed aerosol surface area and volume densities are enhanced in the perturbed layers over quiescent conditions and show strong agreement between the SAGE III/ISS retrieved and in situ measured values.
- Article
(12107 KB) - Full-text XML
-
Supplement
(4932 KB) - BibTeX
- EndNote


Stratospheric aerosols are present in persistent, evolving layers globally which directly contribute to Earth's global radiative balance (Junge et al., 1961; Murphy et al., 2021). Volcanic eruptions and pyrocumulonimbus (pyroCb) events are natural drivers of change to the stratospheric aerosol layer through high altitude injections of aerosols and gases. PyroCb events occur with relative frequency globally during periods of intense wildfire activity (Peterson et al., 2025). These events efficiently transport smoke into the upper troposphere and lower stratosphere (UTLS), potentially perturbing UTLS aerosol layers for months (Das et al., 2021; Solomon et al., 2022; Peterson et al., 2021; Yu et al., 2019; Baars et al., 2019). PyroCb aerosols are black and brown carbon enlarged by coatings of organic materials up to several hundred nanometers which persist during aging and transport (Katich et al., 2023; Beeler et al., 2024; Asher et al., 2024). Smoke in upper atmospheric layers have distinctly observable aerosol optical and microphysical properties which evolve over time (Christian et al., 2020; Torres et al., 2020; Ansmann et al., 2018, 2021, 2024; Baars et al., 2019; Haarig et al., 2018; Ohneiser et al., 2020, 2021, 2022; Asher et al., 2024; Todt et al., 2023). Increased stratospheric aerosol direct radiative forcing and midlatitude stratosphere ozone depletion follow pyroCb events due to the unique composition and size of the smoke aerosols (Solomon et al., 2022, 2023; Stone et al., 2025; Christian et al., 2020; D'Angelo et al., 2022; Yu et al., 2019, 2021). Intense pyroCb outbreaks have resulted in increased ozone loss over the polar regions (Solomon et al., 2023; Stone et al., 2025; Ohneiser et al., 2021, 2022; Ansmann et al., 2022).
Stratospheric aerosols consist primarily of sulfate aerosols with natural and anthropogenic sources fueling sulfate production in the stratosphere (Junge et al., 1961; Murphy et al., 2021). Stratospheric aerosol samples also include tropospheric originating aerosols from biomass burning, dust, and industrial burn–off transported to the UTLS along with sedimenting aerosols from the upper atmosphere containing meteoric and metallic compounds (Murphy et al., 2014, 2021, 2023; Junge et al., 1961; Trickl et al., 2024). In situ measurements from balloon-borne optical particle counters typically assuming a hydrophilic sulfate aerosol have provided the most consistent data record of stratospheric aerosol microphysical properties to date, with major sampling efforts taking place in the northern and southern hemisphere midlatitudes (Deshler, 2023; Todt et al., 2023). Efforts to characterize the stratospheric aerosol layer and its role in global radiative and chemical equilibria, cloud microphysics, and stratospheric dynamics rely largely on these in situ observations (Deshler, 2008; Murphy et al., 2021).
Diverse sources of stratospheric aerosols and their complex aerosol microphysical interactions produce polydisperse aerosol size distributions (Kremser et al., 2016). Stratospheric aerosols measured by in situ optical particle counters are typically distributed in bimodal lognormal distributions with mostly dominant fine modes and secondary coarse modes (Deshler, 2008, 2023). Major volcanic eruptions enhance aerosol size and concentrations, while shifting partitioning toward the large particle mode (Yue, 1999; Deshler et al., 2003; Asher et al., 2024). The role of frequent, small volcanic eruptions has been shown to modulate the stratospheric aerosol layer (Vernier et al., 2011; Wrana et al., 2023). The increased frequency and overall intensity of wildfires and pyroCb events over the last decade globally has contributed to a growing proportion of carbonaceous aerosols within the UTLS (Katich et al., 2023). Poorly constrained estimates of smoke aerosol size, concentration, and composition in the UTLS introduce uncertainties in aerosol and climate models relying on estimates of the aerosol optical and microphysical properties.
Satellite instruments have observed elevated near infrared aerosol extinction following both volcanic and pyroCb events (Bourassa et al., 2019; Solomon et al., 2022; Rieger et al., 2021; Siddaway and Petelina, 2011). Extreme pyroCb outbreaks like the 2017 Pacific Northwest Event (PNE) and 2019/2020 Australian New Year's Super Outbreak (ANYSO) increase stratospheric aerosol loading in the respective hemisphere for months (Torres et al., 2020; Yu et al., 2019, 2021; Peterson et al., 2018, 2021; Das et al., 2021; Khaykin et al., 2020). Total attenuation resulting from aerosol plumes following major pyroCb events are comparable with that of moderate to large volcanic eruptions, inducing negative radiative forcing at the surface and top of atmosphere (Liu et al., 2022; D'Angelo et al., 2022; Yu et al., 2021; Khaykin et al., 2020; Selitto et al., 2022; Das et al., 2021). Sparse and recent in situ and ground-based measurements of pyroCb smoke report larger diameters than for boundary layer smoke and are distinct in their composition and microphysics from background stratospheric aerosols (Katich et al., 2023; Li et al., 2025; Asher et al., 2024; Murphy et al., 2021; Haarig et al., 2018; Baars et al., 2019; Ansmann et al., 2021). The modern day stratosphere requires understanding of the microphysical properties of stratospheric smoke aerosols and their spatiotemporal evolution. More generally, stratospheric aerosol size distributions must be characterized and more frequently sampled to comprehensively understand their impacts on the stratospheric radiative budget as well as their influence on stratospheric processes, chemistry, and circulations (Murphy et al., 2021).
Aerosol extinction in the stratosphere measured by occultation or scattering techniques is strongly dependent on the ambient aerosol size distribution. Limb scattering instruments like the Ozone Mapping and Profiler Suiter (OMPS) currently in operation (Taha et al., 2021; Chen et al., 2018; Loughman et al., 2018), the Scanning Imaging Absorption Spectrometer for Atmospheric Chartography (SCIAMACHY) (Malinina et al., 2018), and the Optical Spectrograph and InfraRed Imager System (OSIRIS) (Bourassa et al., 2008; Rieger et al., 2014, 2019) currently in operation, use a priori assumptions of the aerosol composition and size distribution shape, having fixed parameters of number, radius, or distribution width for lognormal or gamma distributions, to retrieve aerosol extinction. Assumptions of the aerosol size distribution during processing of scattering data from limb profilers affects the retrieved extinction profiles (Malinina et al., 2019; Loughman et al., 2018; Rieger et al., 2014).
While retrieving aerosol size distribution from multi–wavelength extinction data is difficult and ill–constrained, it is well suited to solar occultation measurements with high signal to noise ratio and no a priori assumptions of the size distribution (von Savigny and Hoffmann, 2020; Ramachandran and Leith, 1992). The Atmospheric Chemistry Experiment Fourier Transform Spectrometer (ACE-FTS) currently in operation measures aerosol transmittance using the solar occultation technique over a broad spectral range in the infrared from 750–4000 cm−1 with two additional visible/near–infrared imager filtered channels at 525 and 1022 nm, respectively (Bernath et al., 2005; Bernath, 2017). ACE-FTS is capable of identifying stratospheric sulfate aerosol from the transmission spectra with high accuracy of the chemical species and provides a climatology of the median aerosol diameter, slant column number density, and weight percentages of H2SO4 inferred using a unimodal lognormal distribution and fixed distribution width (Bernath et al., 2026; Bhusal et al., 2026; Boone et al., 2024). ACE-FTS climatology show that the stratospheric aerosol size distribution is responsive to major volcanic and pyroCb events which typically increases the aerosol median diameter (Bernath et al., 2026; Bhusal et al., 2026). Aerosol size distribution retrievals with assumption of a bimodal distribution better recreate the observed transmission profiles from ACE-FTS (Boone et al., 2024).
The Stratospheric Aerosol and Gas Experiment (SAGE) instruments have used the solar occultation technique to monitor the stratospheric composition since 1979 (Chu and McCormick, 1979; Yue et al., 1986; Thomason et al., 1997; Thomason and Knepp, 2023) with high precision data that correlate closely with various satellite and in situ datasets (Deshler et al., 2003; Kovilakam and Deshler, 2015; Kalnajs and Deshler, 2022; Kovilakam et al., 2020). Solar occultation aerosol measurements from SAGE II were inverted to lognormal aerosol size distributions detailing climatology of stratospheric aerosol size and microphysical properties (Yue et al., 1986; Yue, 1999, 2000; Wang et al., 1996; Bingen et al., 2003, 2004). Inversion products from the currently operational SAGE III on the International Space Station (SAGE III/ISS) use unimodal lognormal aerosol size distributions to detail aerosol size and distribution width and evaluate variability in stratospheric aerosol microphysical properties, particularly during volcanically active periods (Knepp et al., 2024; Wrana et al., 2021, 2023, 2025). The SAGE III/ISS version 6 product provide statistical evaluation of the retrieved parameters to fit the size resolved information in the extinction spectra (Knepp et al., 2024). SAGE III products use the broad spectrum of the instrument channels to formulate extinction color ratios having sensitivity to a large range of aerosol sizes in the stratosphere from inclusion of a new NIR channel at 1544 nm. The retrieval methods display increased sensitivity using three or more channels and should include the UV channel to enhance the curvature in the spectral data (Malinina et al., 2019).
A new technique for retrieving bimodal lognormal aerosol size distributions from satellite multi-wavelength extinction data is developed to characterize stratospheric aerosol properties with growing influence of wildfires contributing to aerosol concentrations. Key parameters of the aerosol size distribution can be inferred from spectrally dependent aerosol extinction measurements from occultation instruments (Yue, 1999; Wrana et al., 2021; Knepp et al., 2024). Unique solutions of the aerosol size distribution are generated with assumptions of the aerosol composition and morphology and adherence to similar properties calculated with Mie theory over a broad wavelength range. This work utilizes the naturally varying extinction spectra of stratospheric aerosols to infer a bimodal aerosol size distribution and introduces retrieval of the mode number fraction for satellite instrument retrievals. The retrieval technique is tested using synthetic aerosol extinction measurements derived from in situ aerosol size distribution measurements and demonstrated for external mixtures of sulfate and smoke aerosols. The retrieval approach is applied to select SAGE III/ISS multi-wavelength extinction observations which has been in operation since June 2017 and provided continuous high resolution vertical profiling in the stratosphere. Descriptions of the SAGE III/ISS aerosol dataset and in situ datasets are included in Sect. 2. The theoretical basis and framework of the retrieval algorithm are described in Sect. 3. Application of the retrieval algorithm to synthetic data in both quiescent and perturbed samples is described in Sect. 4. Validation of SAGE III/ISS retrieved stratospheric aerosol size distributions and aerosol properties against in situ measurements made following pyroCb events (the 2017 PNE event and 2020 North American pyroCb events) is presented in Sect. 5. Performance and limitations of the retrieval algorithm in inferring stratospheric aerosol size distributions and aerosol optical and microphysical properties from synthetic and observational SAGE III/ISS measurements are discussed in Sect. 6.
2.1 SAGE III/ISS
SAGE III/ISS solar and lunar occultation L2 v6.0 products are hosted by the Atmospheric Science Data Center at NASA Langley Research Center with data available since launch in June 2017 (NASA/LARC/SD/ASDC, 2025). Solar occultation observations during sunrise and sunset events provide dual hemispheric coverage every month with nominal spatial coverage from 70° S to 70° N following the orbital inclination of the ISS at 51.6°. SAGE III/ISS solar occultation measurements report aerosol extinction at 9 wavelength channels, ranging from 384 to 1544 nm, with a vertical range from 0–45 km altitude at 0.5 km resolution.
Identification of large smoke or volcanic plumes, and additionally clouds, is quantitatively dependent on the transmission angle and whether the SAGE III/ISS instrument captures the full extent of the phenomena within its line of sight, with potential biases in measurements of off–center atmospheric phenomena. SAGE III/ISS aerosol extinction measurements reach saturation at km−1. High saturation can lead to increased uncertainty for affected wavelength channels. A conservative threshold of 20 % relative uncertainty is used here to include only high quality aerosol extinction data (Knepp et al., 2022; Yue et al., 2005). Following the Kovilakam et al. (2023) aerosol categorization method, SAGE III/ISS observations are processed to filter measurements of clouds and cloud–aerosol mixtures from optically dense aerosol layers. First, a mask is applied to exclude anomalous negative extinction coefficients for stratospheric observations below 25 km. Second, an aerosol/cloud screening method is applied to each observation to conservatively keep aerosol only observations (Kovilakam et al., 2023; Thomason and Vernier, 2013). Data must pass the quality checks for each selected wavelength channel to proceed with the aerosol size distribution retrieval.
2.2 In situ Observations
Long–term measurements of stratospheric aerosols using balloon payloads have been conducted at various midlatitude and polar sites, with the primary data acquisition from Laramie, WY since 1970. Optical particle counters (OPC) launched from Laramie, WY and Boulder, CO have provided long–term records of stratospheric aerosols in northern hemisphere midlatitudes (Deshler, 2023). Balloon–borne OPC sample aerosol optical diameters and aerosol size resolved concentrations, determined from scattered light, from the launch point up to a height exceeding 30 km. The Wyoming Laser Particle Counter (WLPC) (2008–2020) and Laboratory for Atmospheric and Space Physics (LASP) Optical Particle Counter (LOPC) (since 2020) use laser illumination at 633, and 780 nm, respectively, to collect aerosol sizing and concentration data with minimum uncertainty of 10 % (Deshler, 2023; Kalnajs and Deshler, 2022).
WLPC measures across 8 size bins ranging from 0.184–9 µm, with the upper size bin sometimes extending to 33.2 µm. LOPC data are collected over more than 50 size bins ranging from 0.300–20.0 µm. Condensation nuclei (CN) measurements are taken by a condensation nuclei counter (University of Wyoming CNC, LASP Stratospheric Total Aerosol Counter (STAC)) capable of measuring aerosol diameters larger than 0.020 µm. OPC aerosol optical and microphysical properties are calculated using Riemann sums over the size resolved concentrations in the full resolution products. OPC aerosol size distributions, available online accompanying the full resolution product, fit bimodal or unimodal lognormal distributions to the OPC and CNC/STAC aerosol concentrations at a 0.5 km vertical resolution. Monte Carlo simulations determine uncertainty measures for OPC aerosol size distribution moments, median radii, and distribution widths at 40 %, 30 %, and 20 %, respectively (Deshler et al., 2003).
The bimodal lognormal aerosol size distribution is defined by 6 distinct parameters: fine and coarse mode median diameters (dp, g), fine and coarse mode geometric widths (σg), coarse mode number fraction (γCoarse), and the total aerosol number (N0). The bimodal lognormal aerosol size distribution for N0 particles can be expressed as shown in Eq. (1).
The initial N0 used for all synthetic distributions is set to 10 cm−3. Unimodal or bimodal lognormal aerosol size distributions are distinguished by the coarse mode fraction (γCoarse) with values ranging from 0 %–10 %. Fine mode and coarse mode refer to individual modes of the bimodal lognormal distribution. Median diameters range from 1–2000 nm for the fine mode (dp, Fine) and 300–2300 nm for the coarse mode (dp, Coarse) in intervals of 50 nm. Mode widths (σg) for both modes range from 1.05–2 in intervals of 0.1.
Forward calculations of aerosol extinction (τ(λ)) in Eq. (2) are performed using Mie theory for a polydisperse aerosol population at selected wavelength (λ) and complex refractive index (m). Aerosol extinction is calculated by integrating the product of the aerosol size distribution (n(dp)) and extinction cross section (), considering the size, composition, and wavelength dependent aerosol scattering and absorption effects across size resolved concentrations.
The Angstrom exponent (α) in Eq. (3) relates the spectral dependency of aerosol extinction (τ) at selected wavelengths to classify aerosol size. The Angstrom exponent can be used to characterize the coarse mode of the size distribution by the predominant aerosol microphysics (Ångstrom, 1929, 1930; Schuster et al., 2006).
The retrieval framework uses two solution spaces to infer aerosol size distribution parameters of a bimodal lognormal distribution from multi–wavelength observations. The retrieval performed over the solution spaces consider the spectral properties of the aerosol population which are inherently independent of aerosol loading. The initial solution space uses forward simulated aerosol extinction color ratios (ECR, X′) spanning the UV–NIR spectrum to infer the fine mode size distribution (dp, Fine and σg, Fine). The next solution space uses forward simulated Angstrom exponents (α) by fine mode diameter to infer the coarse mode characteristics (σg, Coarse and γCoarse). The retrieval algorithm then iteratively refines the fine and coarse mode characteristics (dp, Fine, σg, Fine, dp, Coarse) until the final results are self consistent.
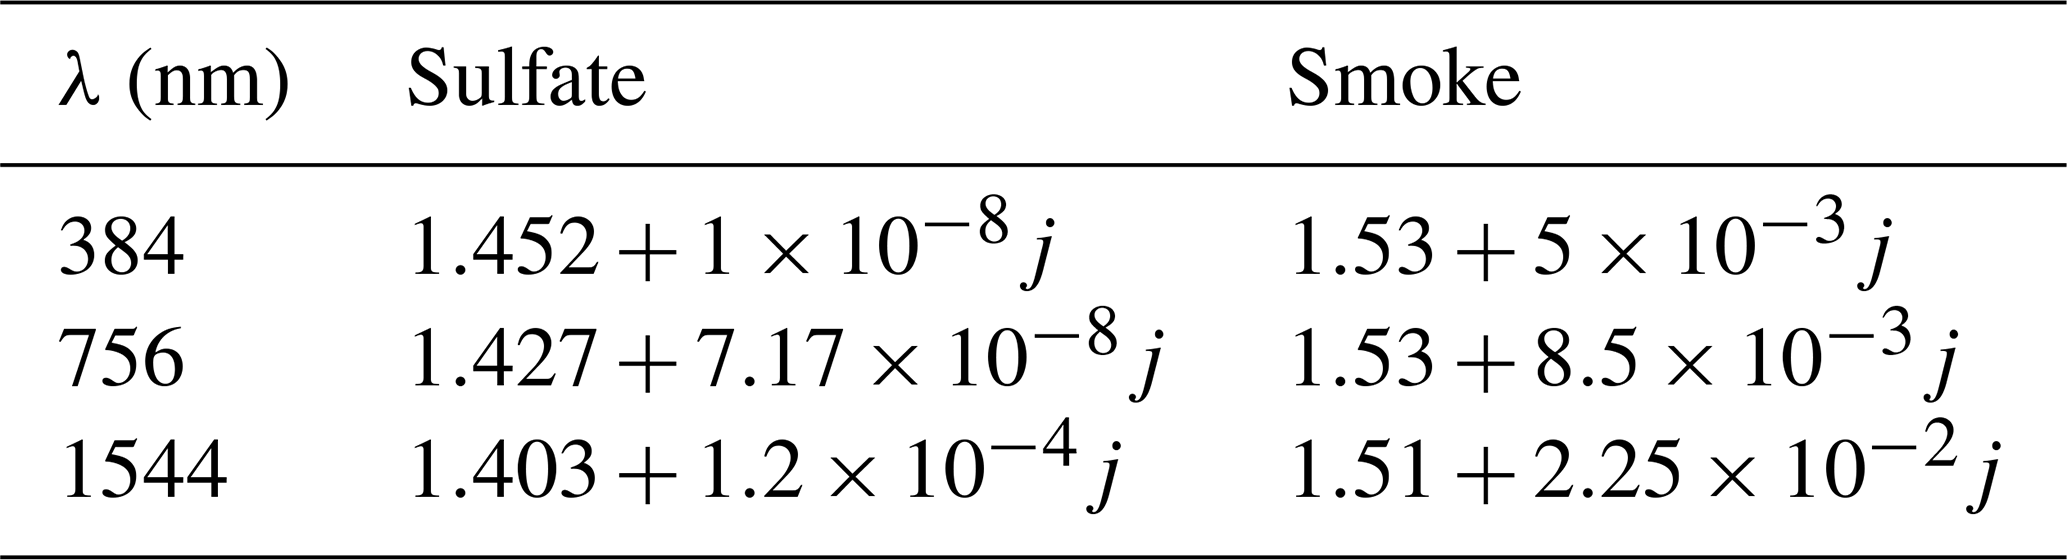
Mie theory code implemented following the Bohren and Huffman specification (Bohren and Huffman, 1998; Sumlin et al., 2018) performs all calculations of aerosol properties. Aerosol properties of externally mixed sulfate (75 % H2SO4 by weight) and organic carbon aerosols are calculated at SAGE III/ISS wavelengths of 384, 756, and 1544 nm using the refractive indices in Table 1 provided in Optical Properties of Aerosols and Clouds Dataset (OPAC, Hess et al., 1998) under assumption of dry (low relative humidity) conditions. The organic carbon (soluble) refractive index is similar to brown carbon measurements after smoke events (Sumlin et al., 2018; Knepp et al., 2022), thus solutions using the organic carbon refractive index are referred to as smoke aerosols hereafter.
Table 1Aerosol refractive index (m) at select SAGE III/ISS wavelengths for sulfate and smoke aerosols assuming 0 % relative humidity (OPAC, Hess et al., 1998).
Forward simulated aerosol extinction coefficients are used to formulate reference ECRs, using the 384/756 and 1544/756 nm pairs, for each permutation of the aerosol size distribution and composition defined above. The ECRs, and also Angstrom exponents, are known to decrease with increasing aerosol diameters (Kovilakam et al., 2023; Wrana et al., 2021; Bhatta et al., 2023; von Savigny and Hoffmann, 2020; Yue, 2000; Wang et al., 1996). ECRs of 384/756 and 1544/756 nm are composed of wavelength ratios near 2, with both ECRs having high functional sensitivity to a range of aerosol sizes. As shown in Fig. 1, the 384/756 nm [756/1544 nm] ECR for sulfate aerosols shows sensitivity to aerosol diameters 0.001–1.25 µm [0.05–2.0 µm]. For smoke aerosols, the 384/756 nm [756/1544 nm] ECR shows sensitivity to aerosol diameters 0.050–0.9 µm [0.2–1.7 µm]. Figure 2a shows the initial solution space assuming a unimodal distribution (γCoarse=0). Fine mode parameters (dp, Fine and σg, Fine) are determined through interpolation of the observational data which are mapped to the solution space. Forward simulated ECRs vary for bimodal lognormal distributions, with permutations of γCoarse and σg, Coarse modifying the resulting aerosol optical properties (Fig. 2b). Figure 2b shows the initial solution space after determination of γCoarse=10 % and with increases in large particle concentrations forming similar but unique ratios from Fig. 2a.
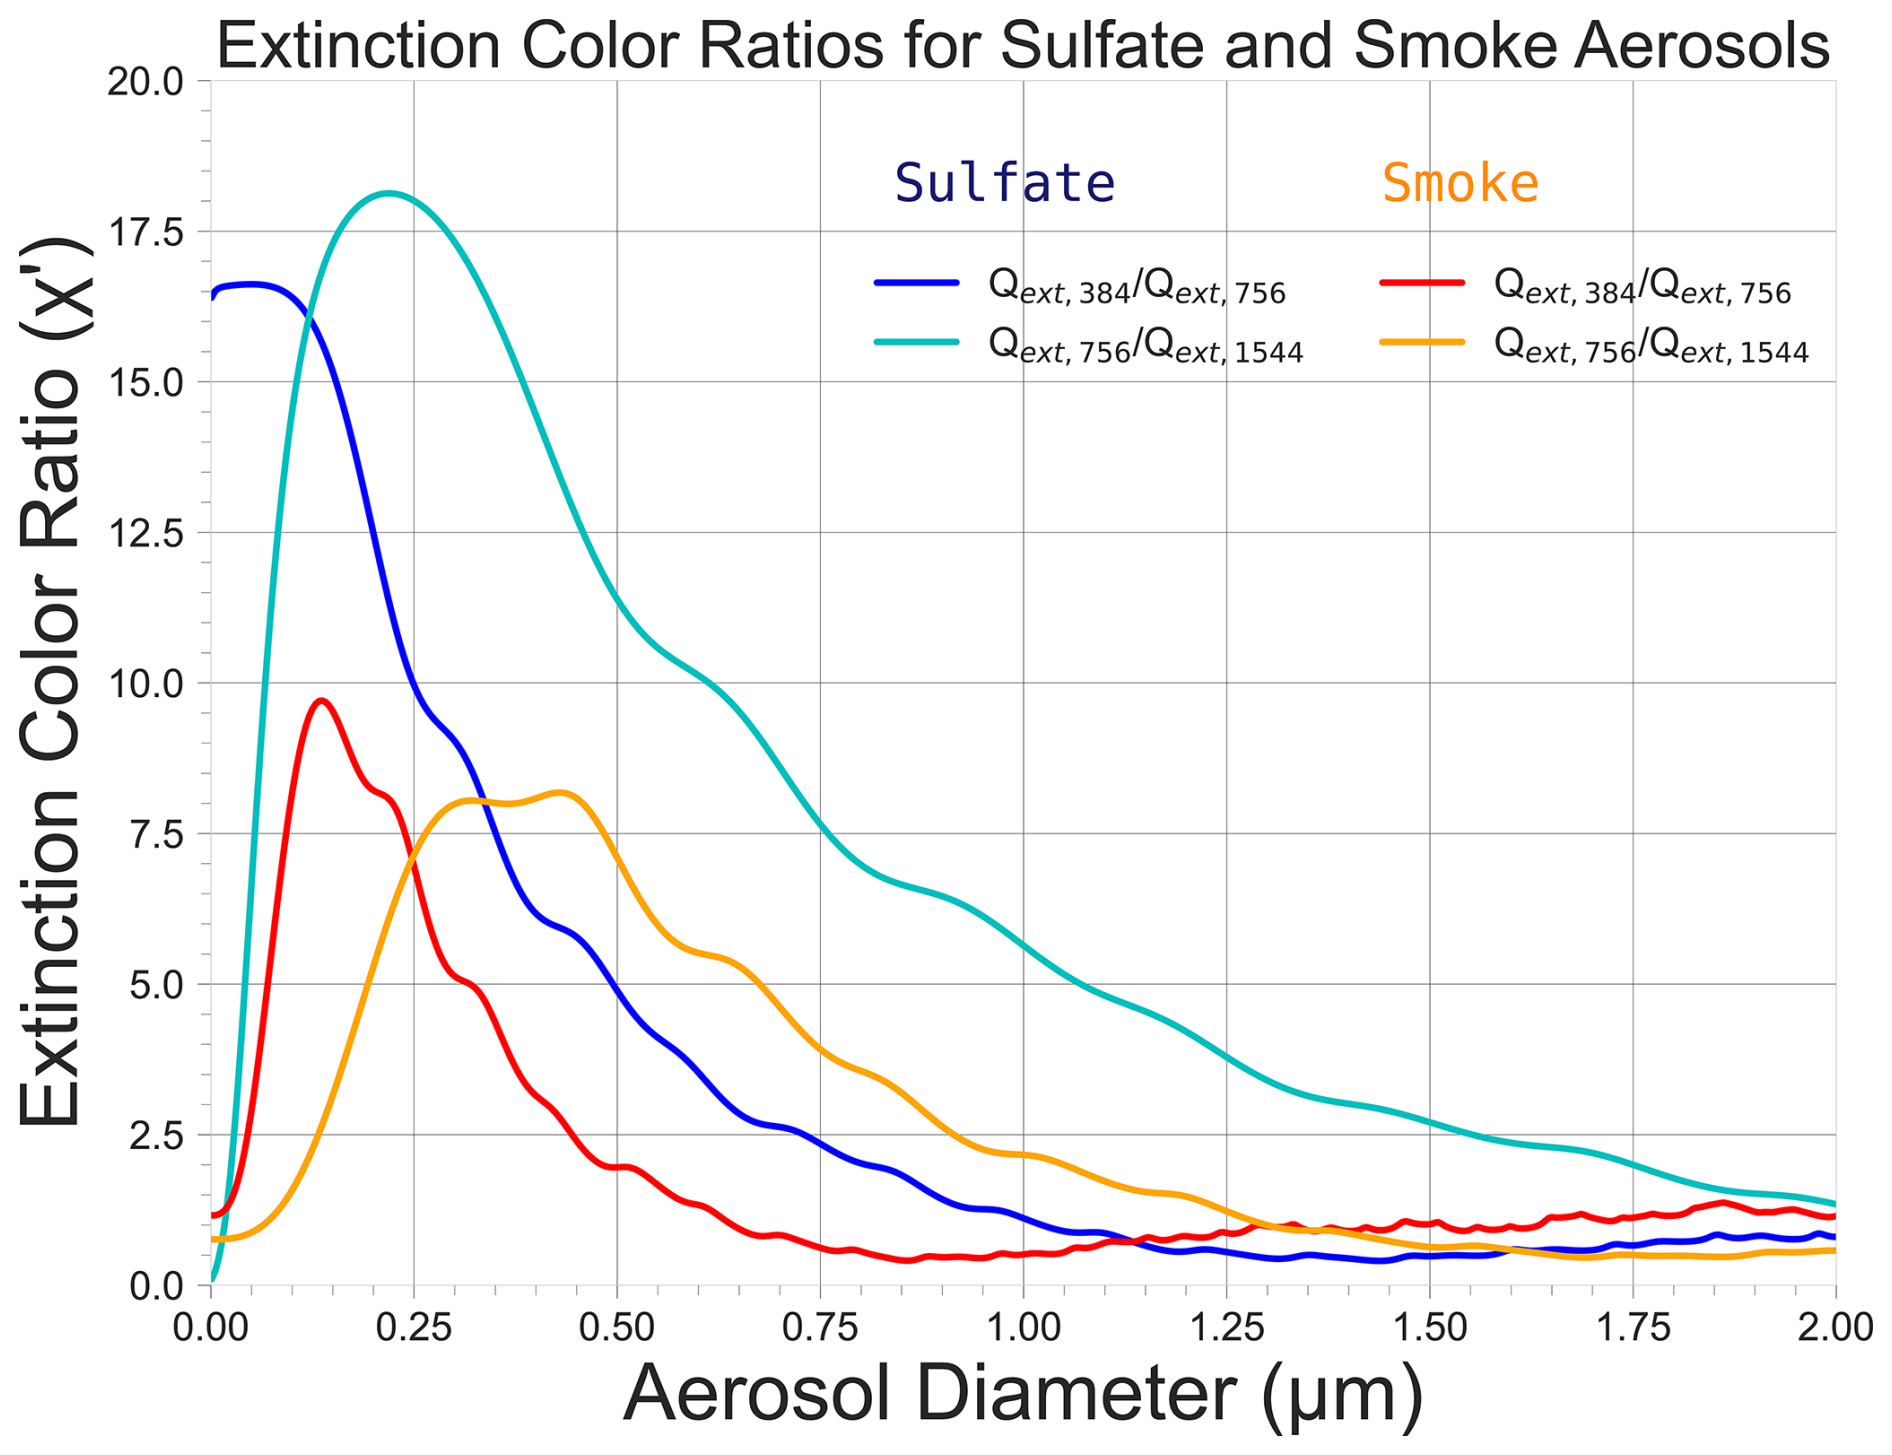
Figure 1Extinction color ratios for sulfate and smoke aerosols using the 384/756 and 756/1544 nm wavelength pairs as a function of aerosol diameter.
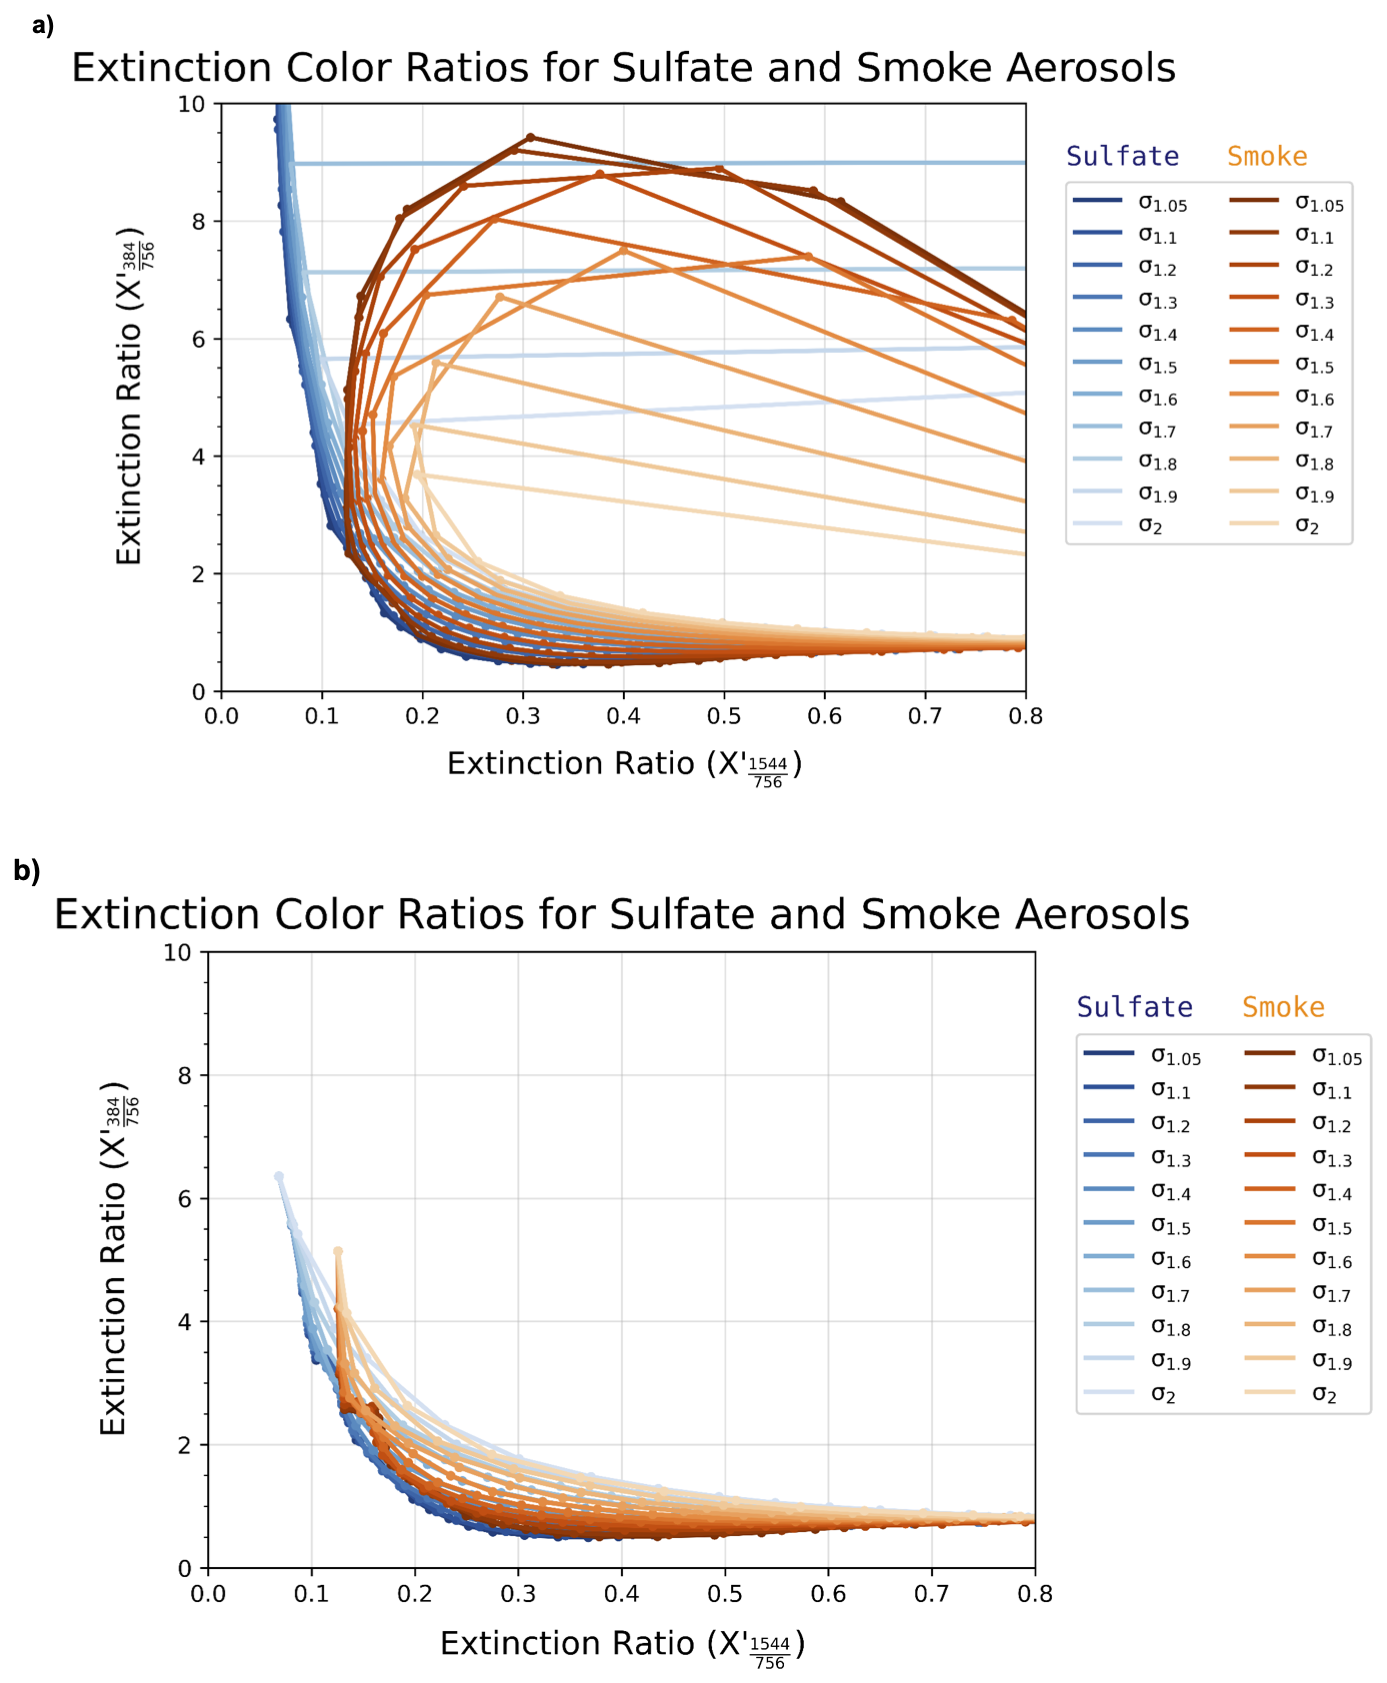
Figure 2Forward simulated extinction coefficient ratios (X′) at 1544/756 nm (x axis) and 384/756 nm (y axis) for sulfate and smoke aerosols as a function of the aerosol size distribution. Each curve shows the extinction ratios for a unique fine mode distribution width (σg, Fine) parameterized within the range of values (1.05, 1.1–2.0) in intervals of 0.1 and for fine mode median diameters (dp, Fine) in range of 1–2000 nm in intervals of 50 nm. The initial solution space (shown in a) assumes a coarse mode fraction (γCoarse) equal to 0. (b) shows the solution space for γCoarse equal to 10 % and σg, Coarse equal to 1.05.
Forward simulated Angstrom exponents are used to determine the unique solution for the coarse mode characteristics (σg, Coarse and γCoarse) (Malinina et al., 2019; Schuster et al., 2006). Figure 3 shows the dependence of the Angstrom exponent on dp, Fine for sulfate and smoke aerosols for each forward simulated bimodal lognormal aerosol size distribution. The Angstrom exponent varies with aerosol size, with possible solutions of γCoarse shown along a gradient as a function of the retrieved dp, Fine and σg, Fine. The Angstrom exponent similarly varies for σg, Coarse at fixed γCoarse as a function of dp, Fine. The retrieval algorithm first determines γCoarse and then σg, Coarse, with iteration further refining the fine and coarse mode parameters. The Angstrom exponent (384/756 nm) as a function of the retrieved dp, Fine is most sensitive to the coarse mode characteristics when dp, Fine is less than 750 nm. Larger dp, Fine weaken sensitivity to coarse mode characteristics as Angstrom exponents reach minimums.
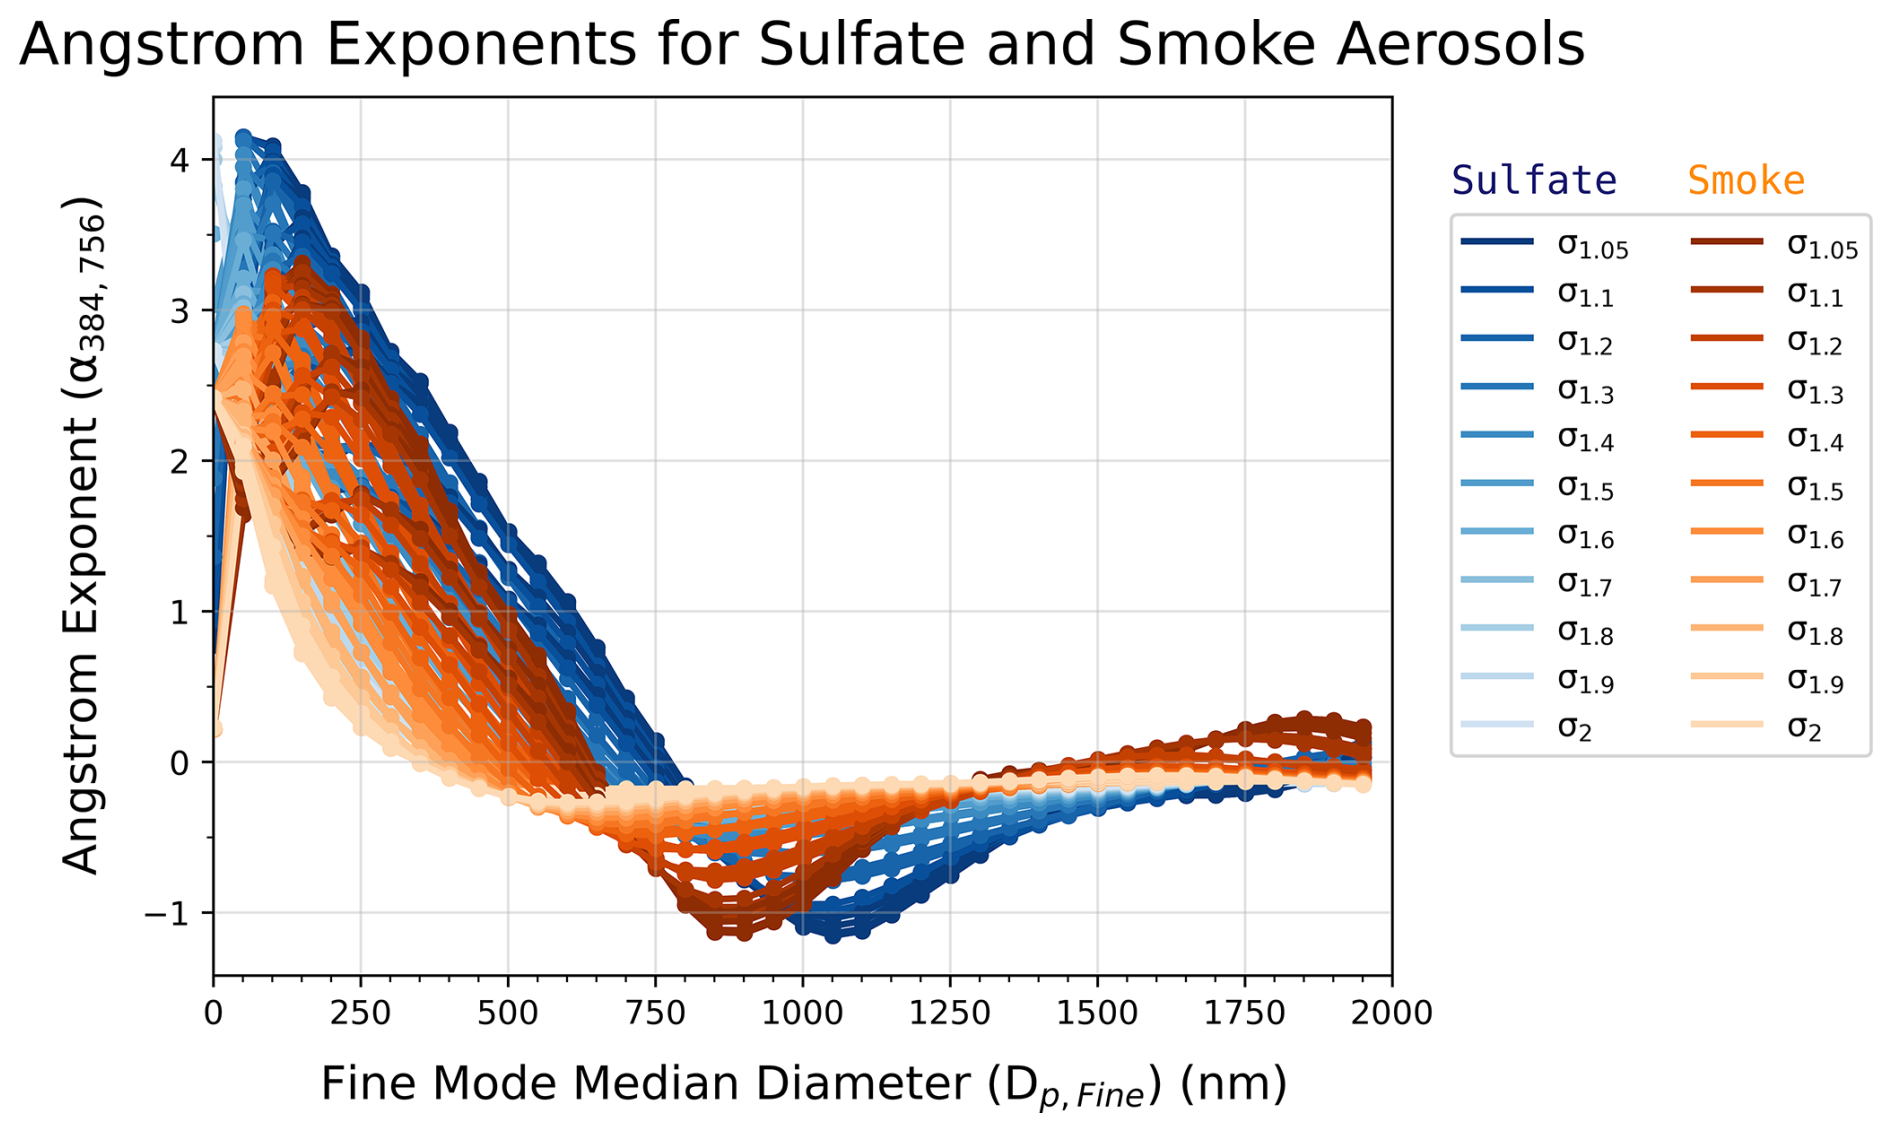
Figure 3Forward simulated Angstrom exponents (α) at 384/756 nm (y axis) as a function of the fine mode median diameter (dp, Fine) (x axis) for sulfate and smoke aerosols. Angstrom exponents varying for the fine mode width (σg, Fine) and coarse mode number fraction (γCoarse) (shown here), with fixed coarse mode width (σg, Coarse) ().
Previous works (Yue, 1999; Oberbeck et al., 1983; Deshler et al., 2003; Rieger et al., 2014; von Savigny and Hoffmann, 2020) provide satellite and in situ descriptions of stratospheric bimodal lognormal aerosol size distribution. The sensitivity of aerosol properties to varying coarse mode concentrations is assessed using forward simulations across 75 logarithmically spaced γCoarse ranging from 0 %–10 %. These forward simulations use synthetic stratospheric aerosol size distributions inferred from the literature and data record. Aerosol optical and microphysical properties for the synthetic aerosol size distributions are assessed across the range of γCoarse. The retrieval algorithm is then used to retrieve aerosol size distributions from the synthetic aerosol extinction data with varying γCoarse. Retrieval performance is assessed based on the retrieved size distributions and aerosol properties and their agreement with the synthetic aerosol size distributions and distribution moments. Synthetic SAGE III/ISS aerosol extinction measurements are given an uncertainty of 20 % which is propagated to the aerosol size distribution moments.
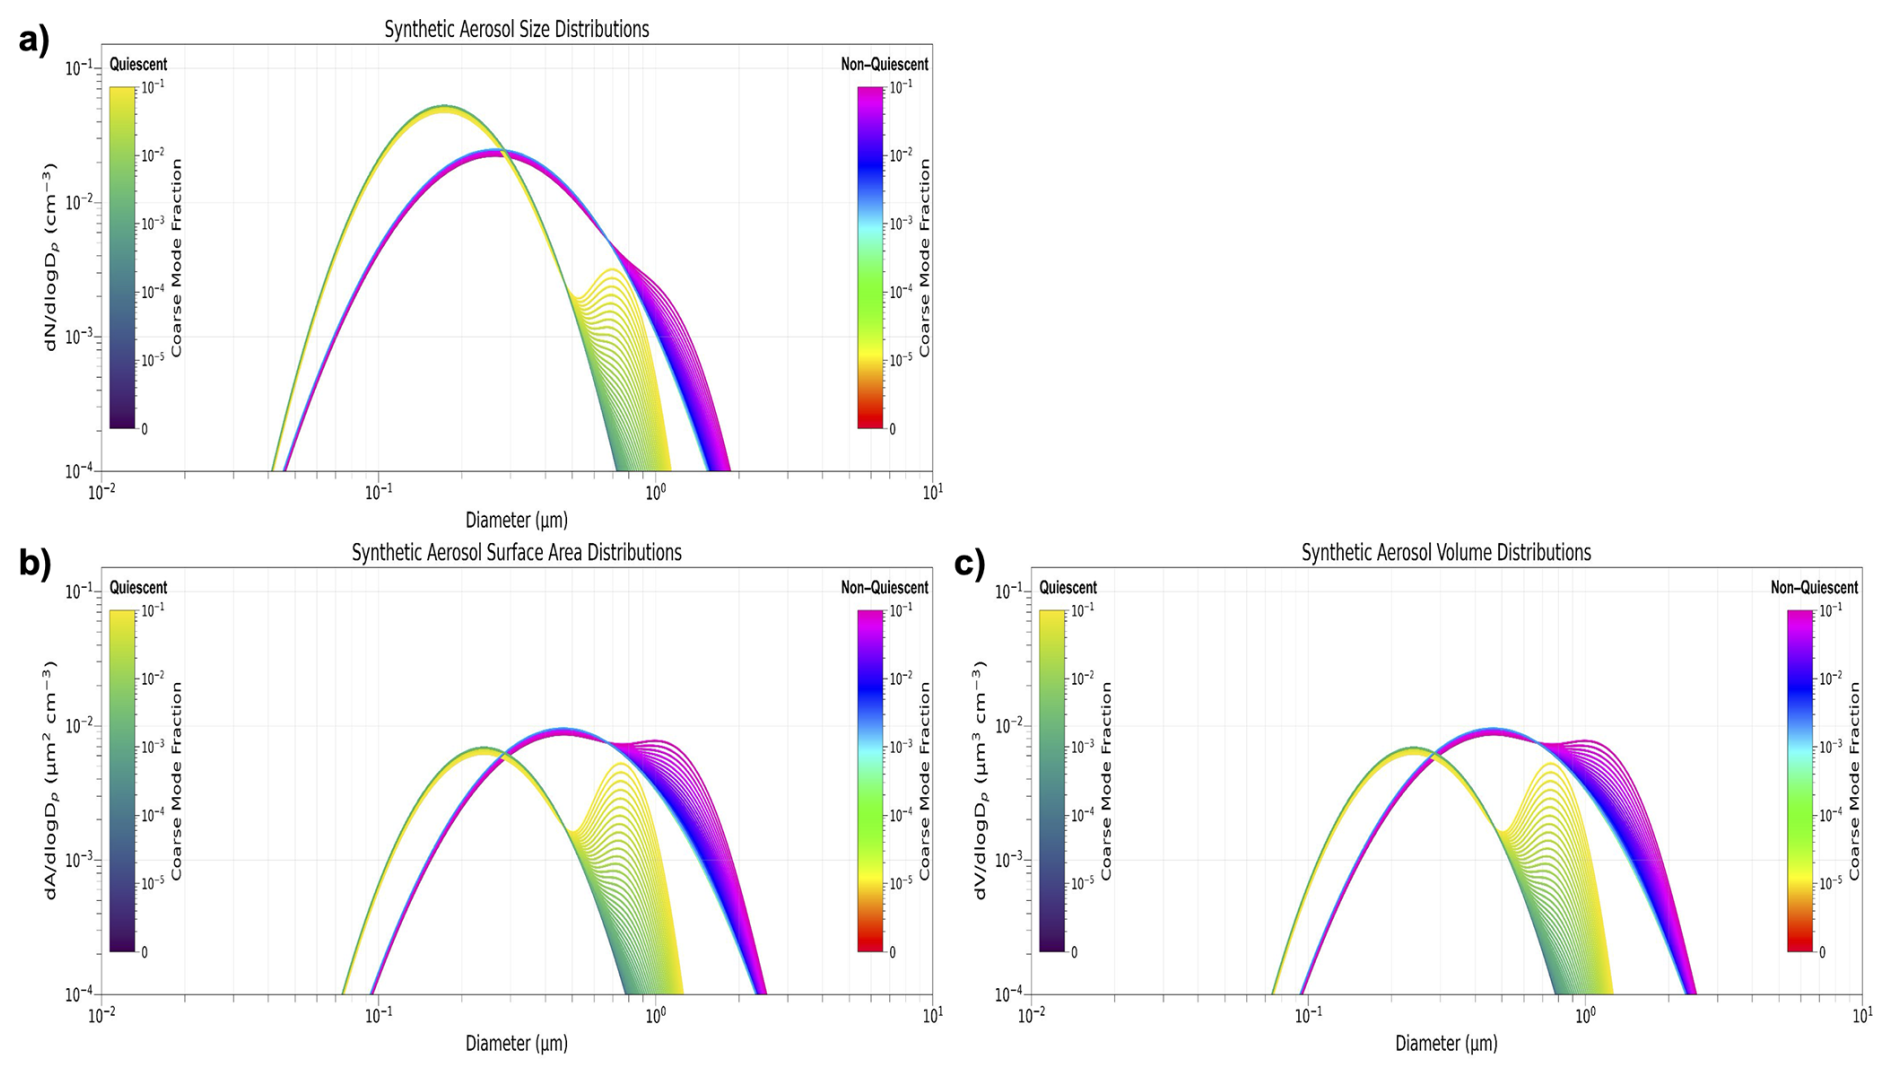
Figure 4The aerosol size (a), surface area (b), and volume (c) distributions are shown for a quiescent (green/yellow) and non-quiescent (blue/magenta) stratospheric sample. Forward simulated γCoarse values range from 0 %–10 % are presented with increases in γCoarse over 75 total iterations.
Two scenarios are simulated to evaluate the retrieval of the aerosol size distributions and γCoarse dependent aerosol properties under stratospheric quiescent and non–quiescent conditions. Simulated quiescent and non–quiescent scenarios produce varying number, surface area, and volume distributions as a function of γCoarse (Fig. 4). Retrievals are performed for each aerosol composition and size distribution with a 20 % uncertainty range applied to the synthetic aerosol extinction coefficients.
The quiescent stratospheric sample shown in Fig. 4 has the following aerosol size distribution parameters:
dp, Fine=204 nm, dp, Coarse=730 nm, , , .
A bimodal aerosol size distribution representing a large scale stratospheric perturbation is adopted from Yue (1999) referencing in situ samples following the El Chichón volcanic eruption (Yue, 1999; Oberbeck et al., 1983). Aerosol size distribution parameters for the non–quiescent distributions shown in Fig. 4 are: dp, Fine=350 nm, dp, Coarse=1050 nm, , , . The non–quiescent distributions have enhanced aerosol size, surface area, and volume densities from the quiescent sample.
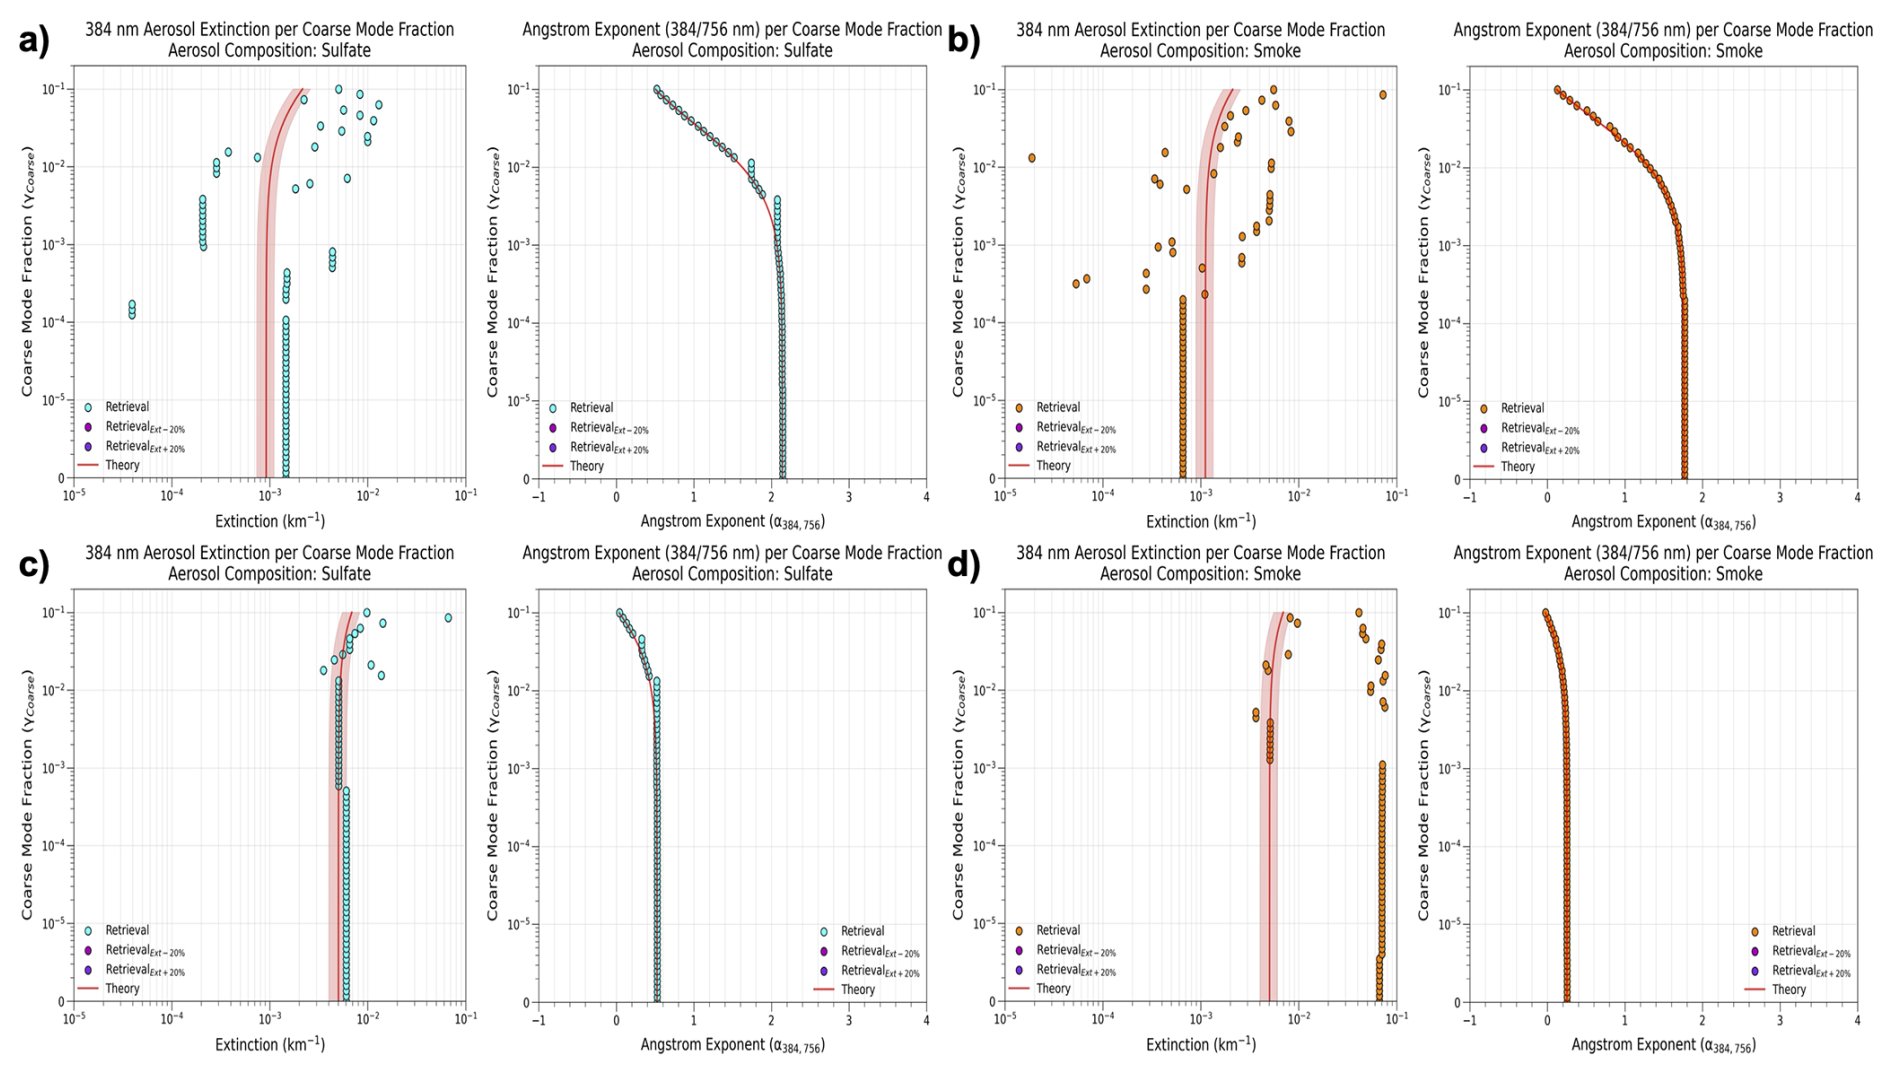
Figure 5Retrieved 384 nm aerosol extinction (km−1) and Angstrom Exponent (α384,756 nm) for synthetic distributions describing: (a) quiescent, sulfate, (b) quiescent, smoke, (c) non-quiescent, sulfate, and (d) non-quiescent, smoke. Retrievals performed for aerosol extinction values with a 20 % uncertainty range. Retrieved aerosol extinction calculated using assumed particle number of 10 cm−3 to highlight retrieval performance.
4.1 Retrievals of the Quiescent Aerosol Size Distribution
Figure 5a shows the forward simulated and retrieved aerosol extinction (384 nm) and Angstrom exponents (384/756 nm) for sulfate aerosols calculated from the quiescent distribution. Synthetic aerosol extinction coefficients range from 7– km−1 and increase when γCoarse is greater than 1 % (Fig. 5a left panel). Retrieved aerosol extinction is underestimated when γCoarse is 0.1 %–1 % with retrieved distributions having smaller median diameter and broader width than the synthetic distribution. When the prescribed γCoarse is greater than 1 %, retrieved aerosol extinction values increase as the size distribution shifts to increased concentrations of coarse mode aerosols. Retrieved extinction deviates from the synthetic values with increases in coarse mode aerosol concentrations. Angstrom exponents range from 0.4–2.2, with decreases with γCoarse values larger than 1 % (Fig. 5a right panel). Retrieved Angstrom exponents remain in close agreement with the synthetic data, maintaining alignment in the spectral properties of the polydisperse aerosol population, while retrieved aerosol extinction yields mixed results depending on the magnitude of γCoarse. Retrieved γCoarse of at least 0.1 % lead to best agreement with the synthetic data (Fig. 6a). The retrieval algorithm is sensitive to γCoarse larger than 0.1 %, with synthetic γCoarse less than 0.1 % implying that the distribution is effectively unimodal with small overestimations of retrieved aerosol diameter.
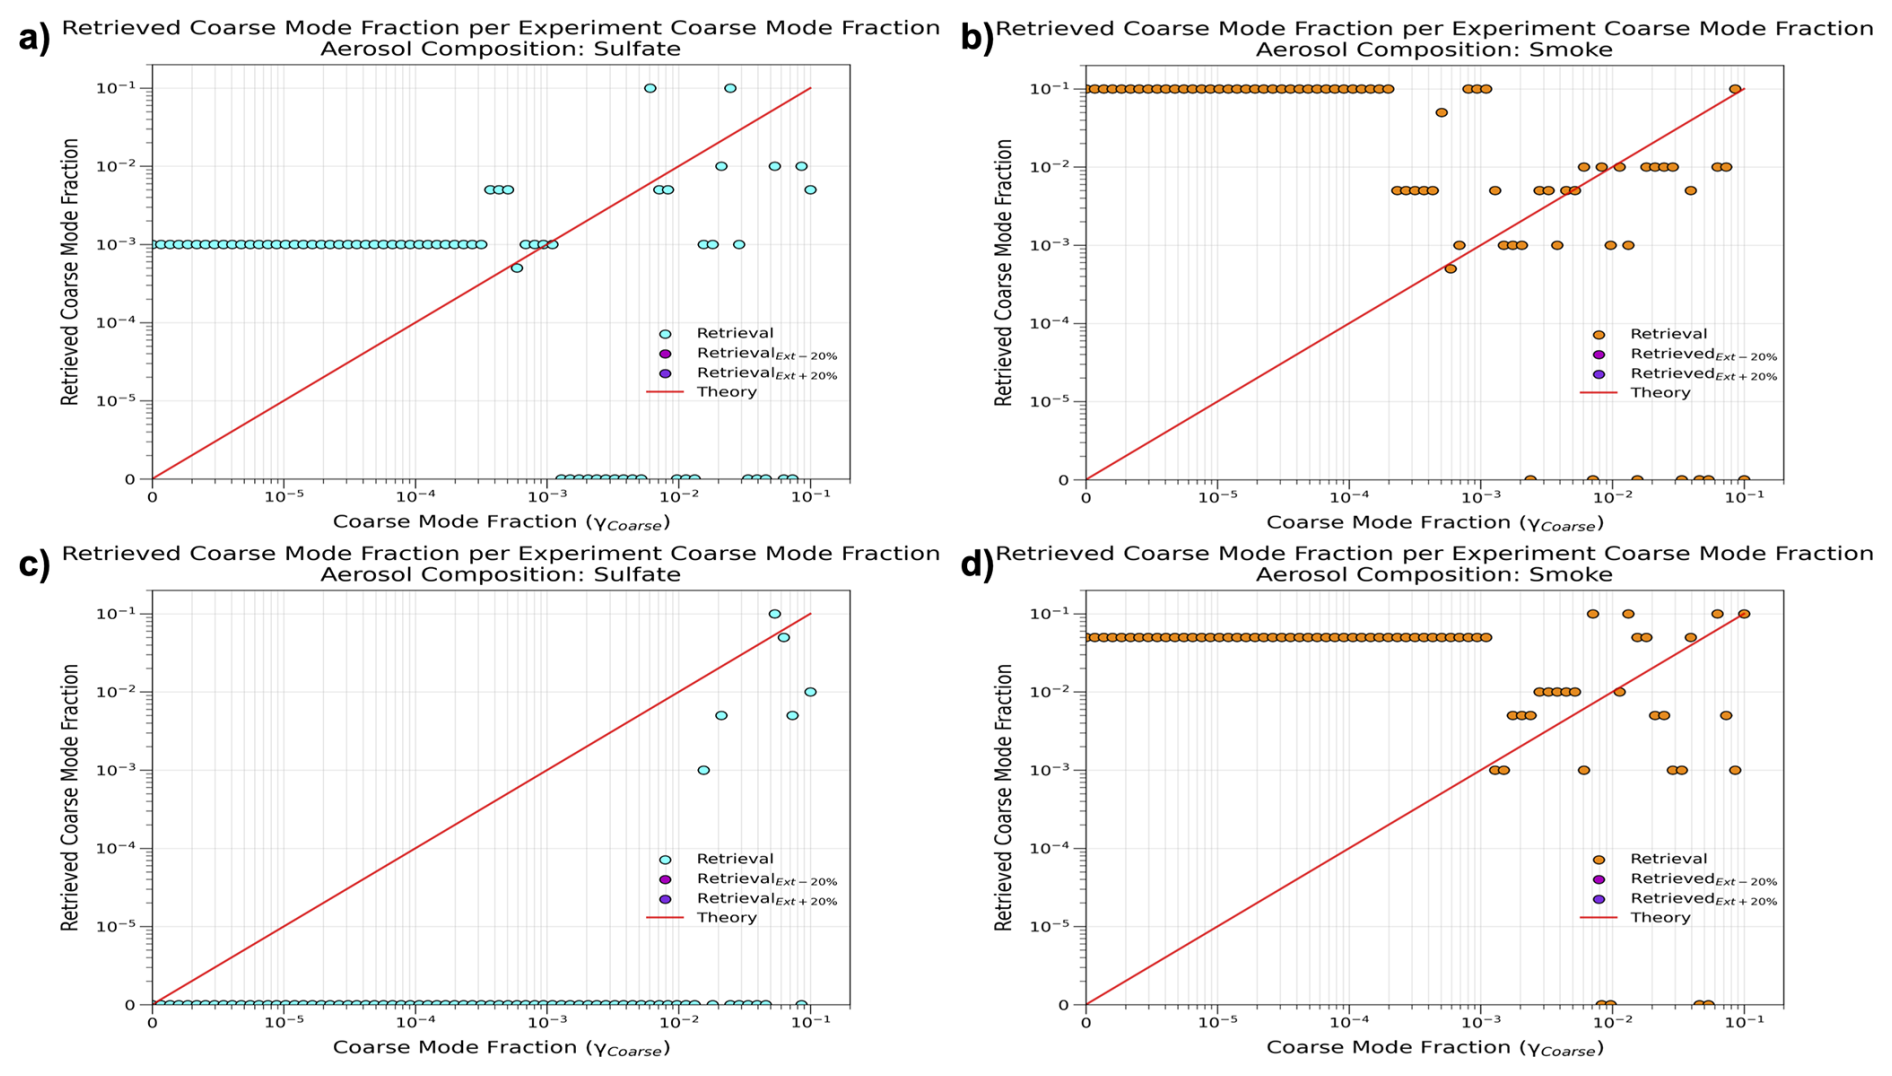
Figure 6Retrieved aerosol size distribution coarse mode number fractions (γCoarse) for synthetic distributions describing: (a) quiescent, sulfate, (b) quiescent, smoke, (c) non-quiescent, sulfate, and (d) non-quiescent, smoke. 1:1 line shown for theory and retrieval γCoarse.
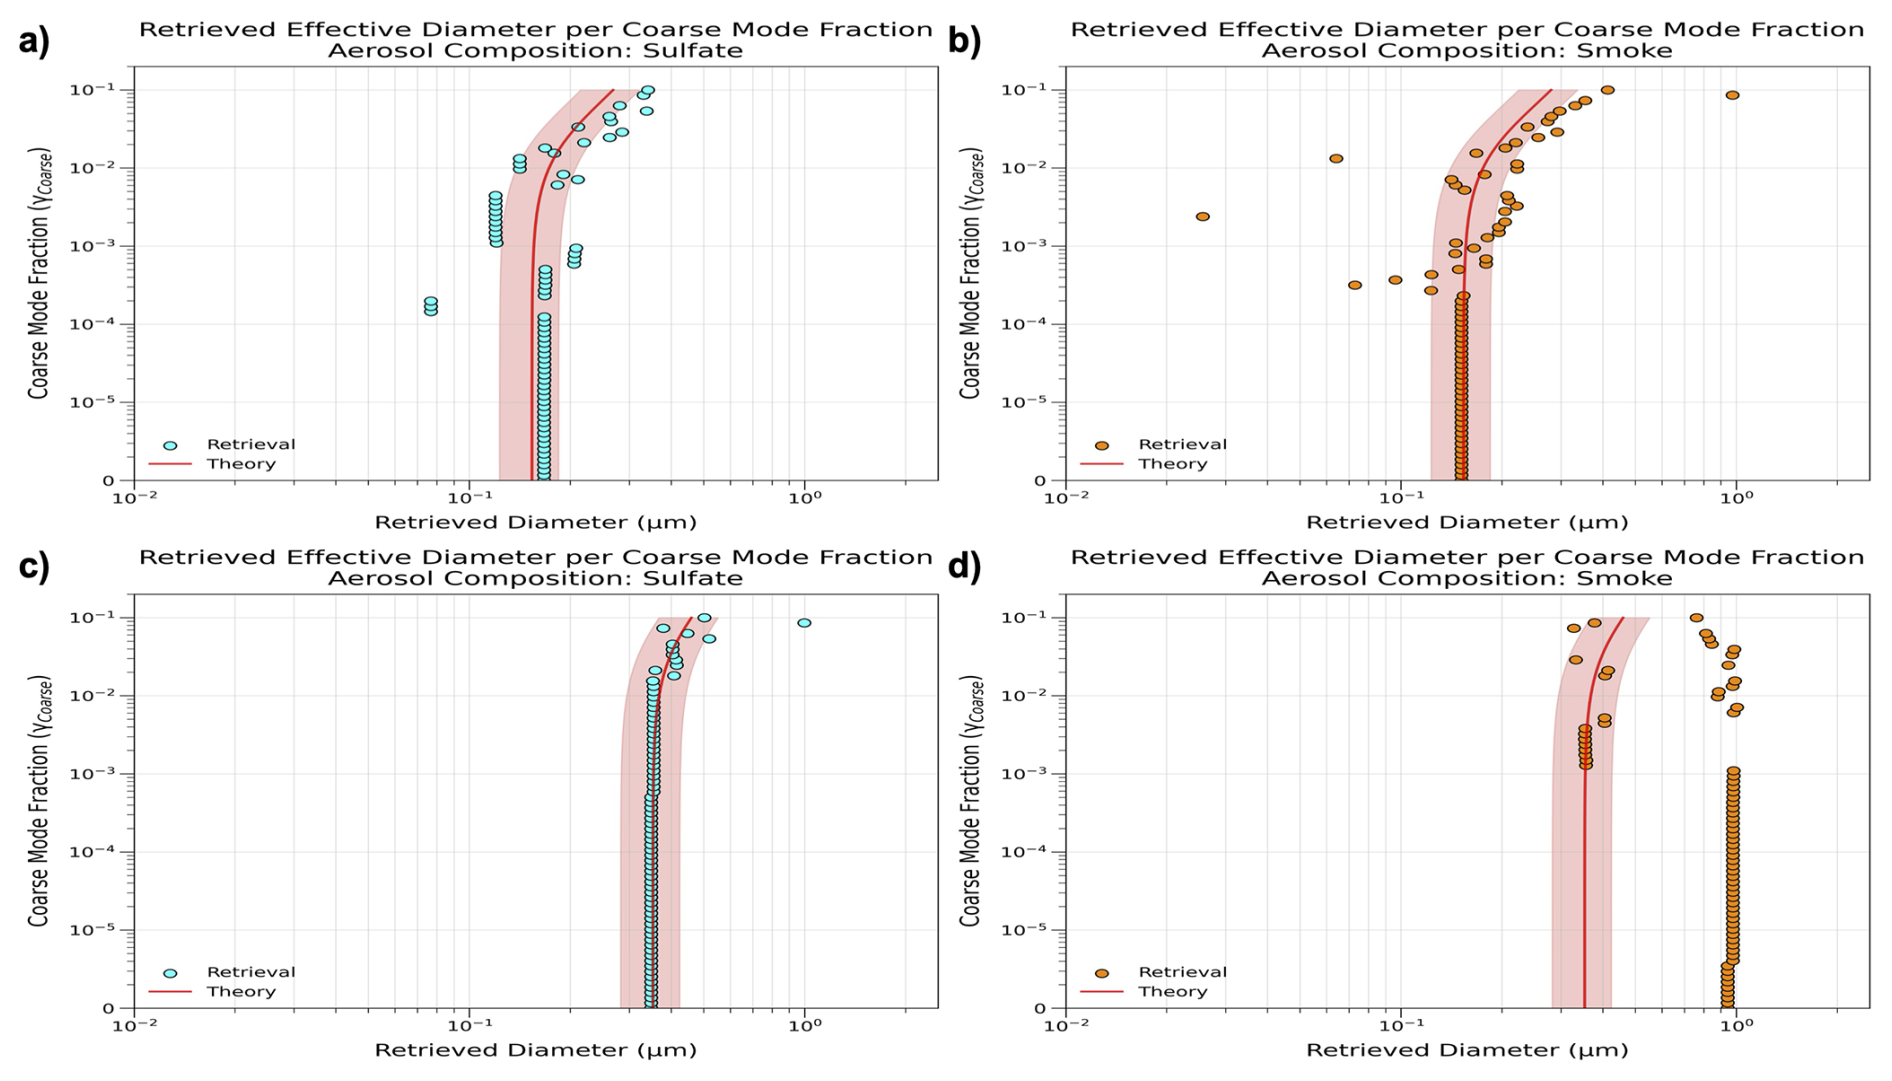
Figure 7Retrieved aerosol effective diameter (dp, eff) for synthetic distributions describing: (a) quiescent, sulfate, (b) quiescent, smoke, (c) non-quiescent, sulfate, and (d) non-quiescent, smoke. Values shown with a 20 % uncertainty range.
Retrieved aerosol size distributions for sulfate aerosols have mostly increased aerosol sizes from the synthetic distribution with retrieved aerosol effective diameters (dp, eff) near 150–350 nm (Fig. 7a). Retrieved aerosol size distributions with prescribed γCoarse of less than 1 % have retrieved dp, Fine ∼250 nm and dp, Coarse ∼550 nm, and dp, eff of 150 nm. For prescribed γCoarse of 1 % and greater, the retrieved dp, Coarse increases towards the true value ∼700 nm, with increases in dp, Fine to ∼400 nm, and dp, eff to ∼300 nm. Retrieved dp, Fine and dp, Coarse increase as the prescribed γCoarse increases with retrievals for small (large) γCoarse biased towards the fine (coarse) mode. Increases in retrieved aerosol diameters are accompanied with narrowing of the retrieved distribution modes, while underestimation of the median diameters tends to broaden the retrieved distribution modes.
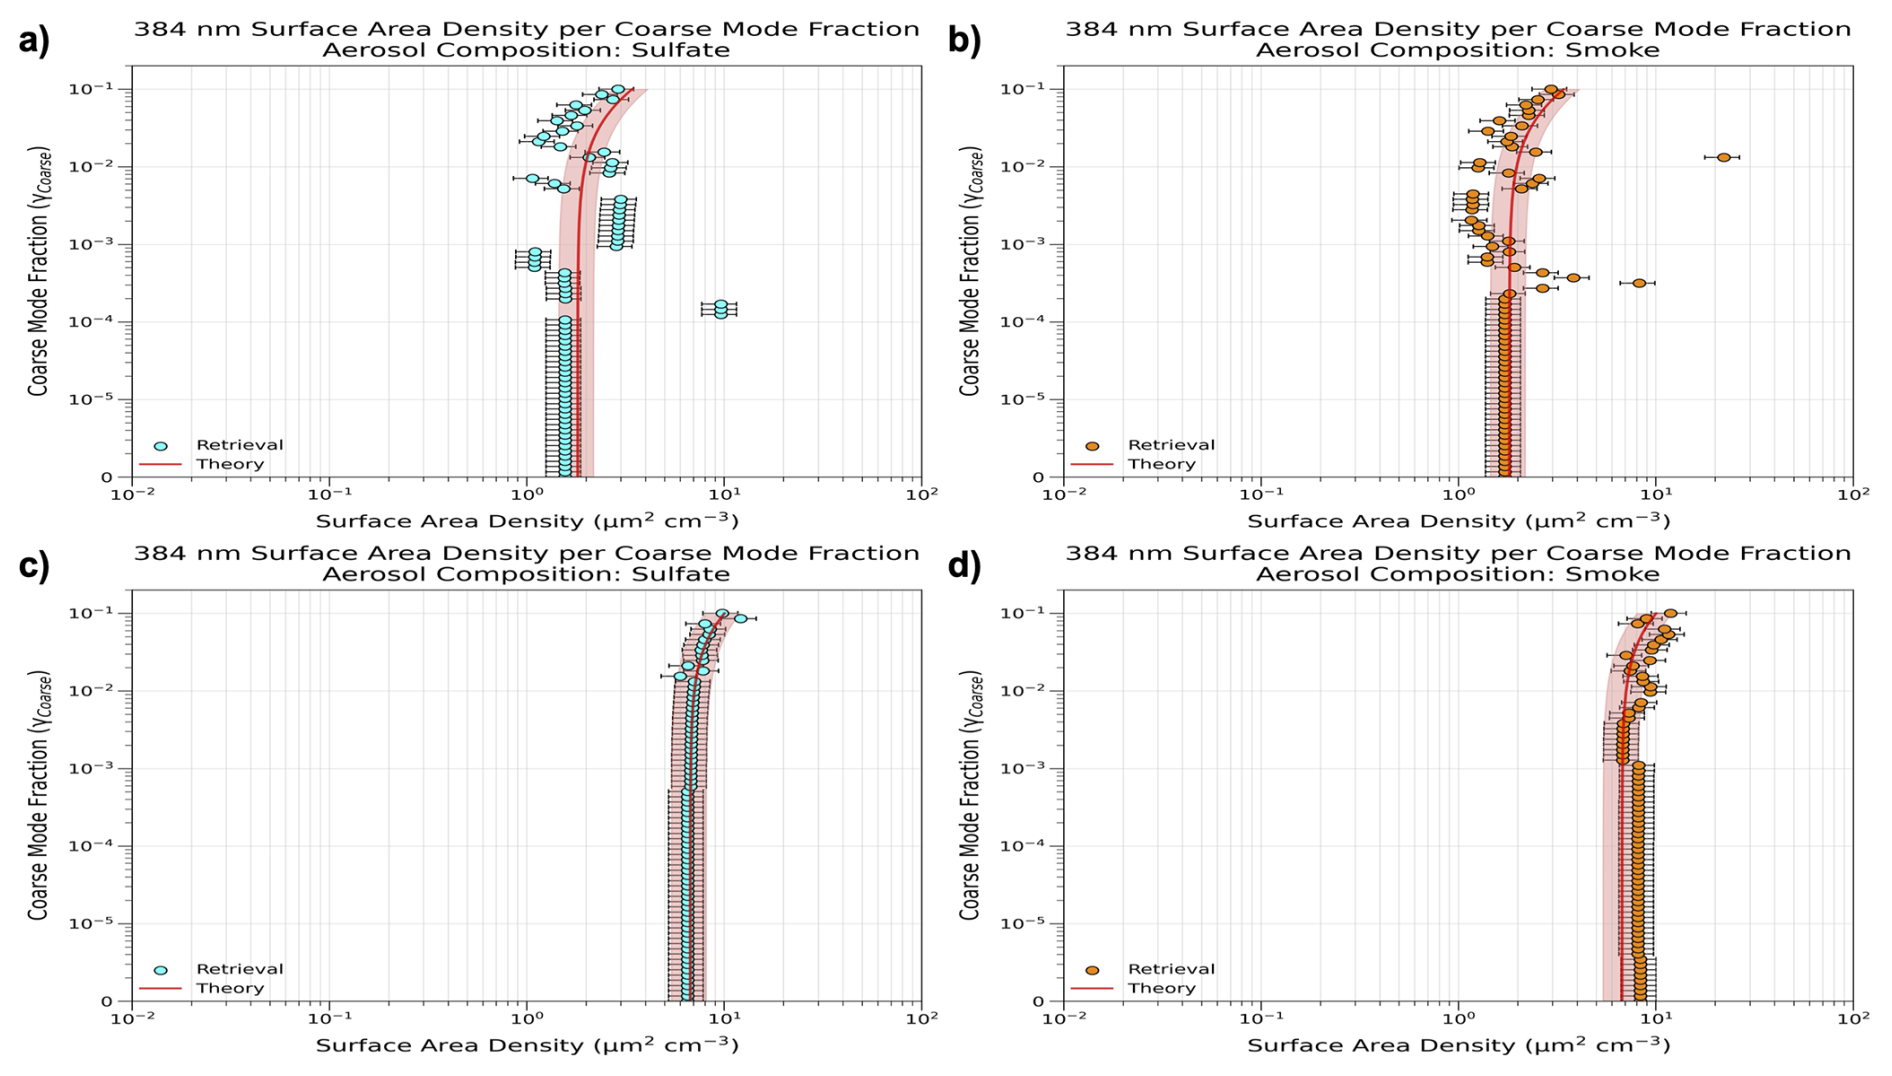
Figure 8Retrieved 384 nm aerosol surface area density (µm2 cm−3) for synthetic distributions describing: (a) quiescent, sulfate, (b) quiescent, smoke, (c) non-quiescent, sulfate, and (d) non-quiescent, smoke. Values shown with a 20 % uncertainty range.
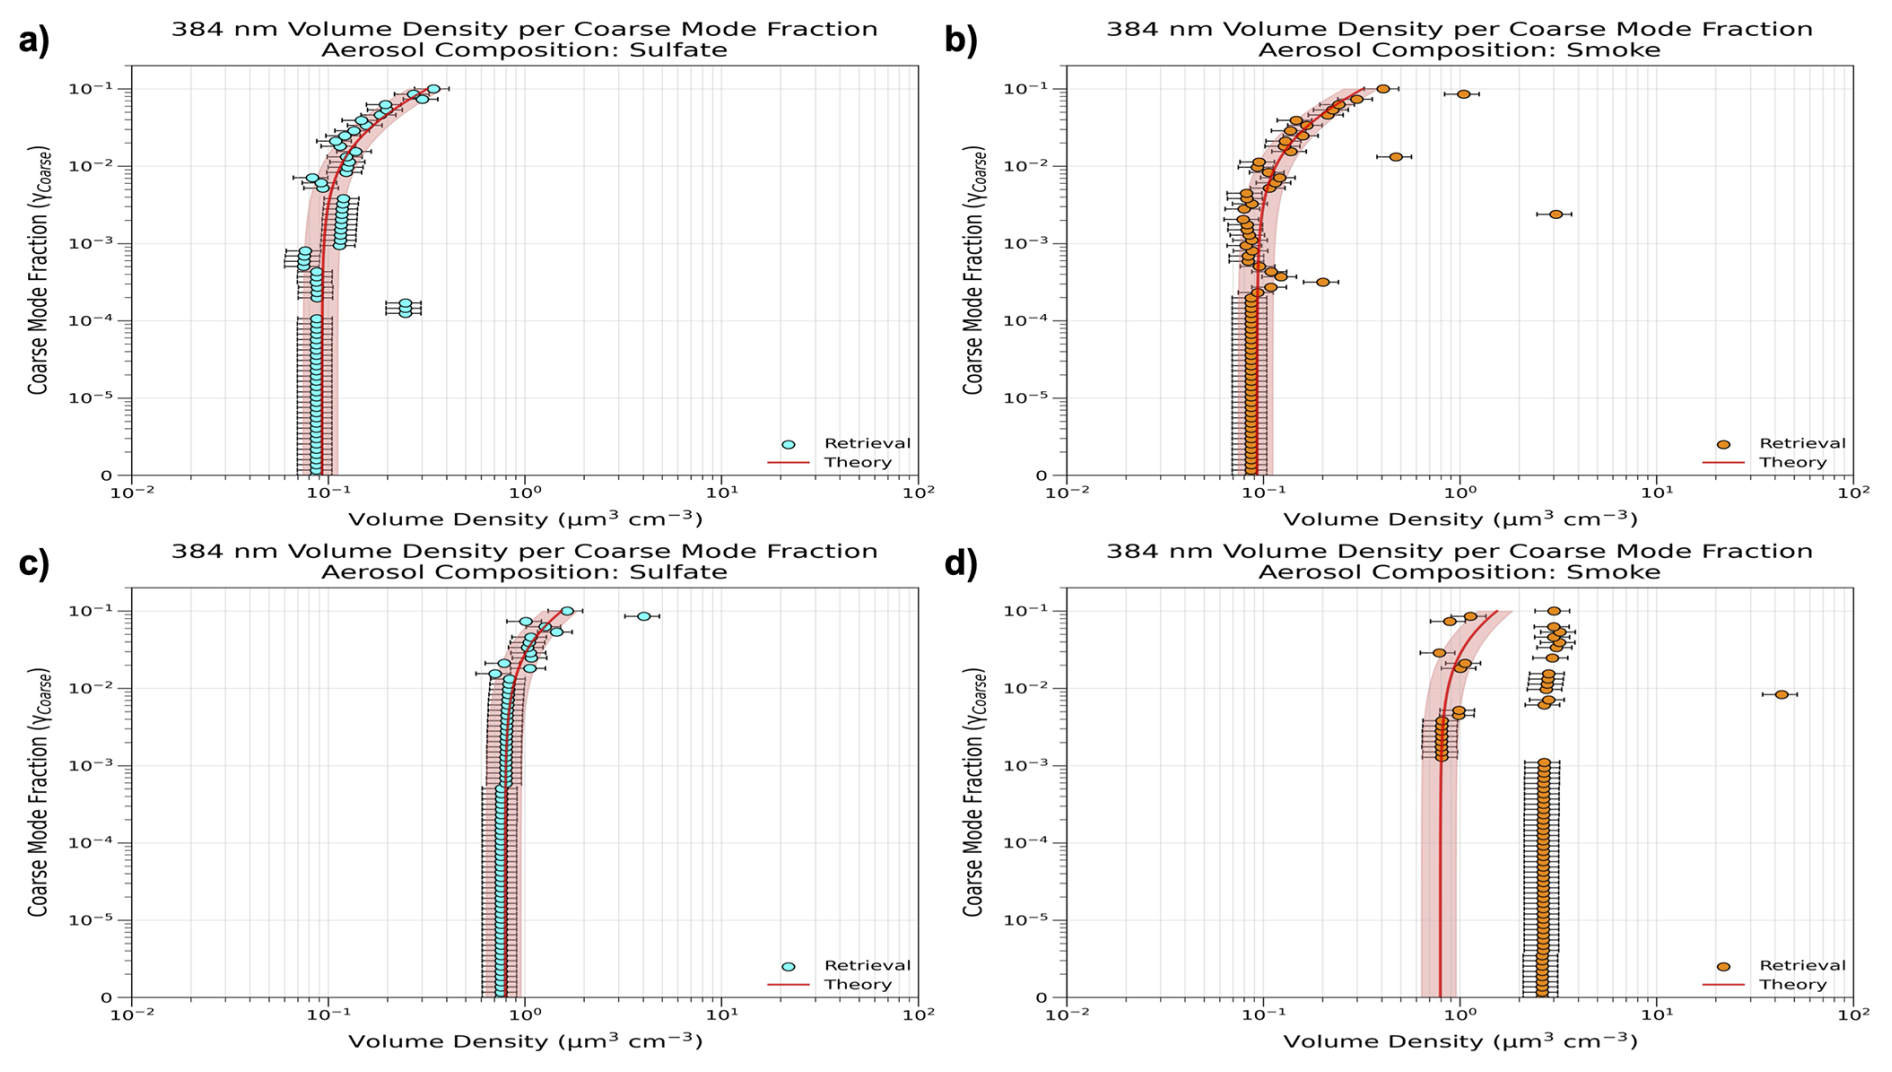
Figure 9Retrieved 384 nm aerosol volume density (µm3 cm−3) for synthetic distributions describing: (a) quiescent, sulfate, (b) quiescent, smoke, (c) non-quiescent, sulfate, and (d) non–quiescent, smoke. Values shown with a 20 % uncertainty range.
Retrieved aerosol surface area and volume density for sulfate aerosols are found within or near the prescribed uncertainty bounds with slight underestimations (Figs. 8a, 9a). Synthetic surface area densities increase when γCoarse are larger than 1 % and synthetic volume densities increase with γCoarse larger than 0.5 %. Retrieved aerosol number density profiles are consistently underestimated and within one order of the initialized N0 value of 10 cm−3 (Fig. 10a). Larger prescribed γCoarse increase the retrieved aerosol median diameters and dp, eff with larger underestimation of N0. The retrieved distributions emphasize the fine mode aerosol concentrations which dominate the overall aerosol number while maintaining a slight coarse mode, describing the accumulation mode population in the synthetic distribution. The retrieved distributions resolve the higher order aerosol size distribution moments and, in particular for large γCoarse, is an encouraging result of the retrieval performance.
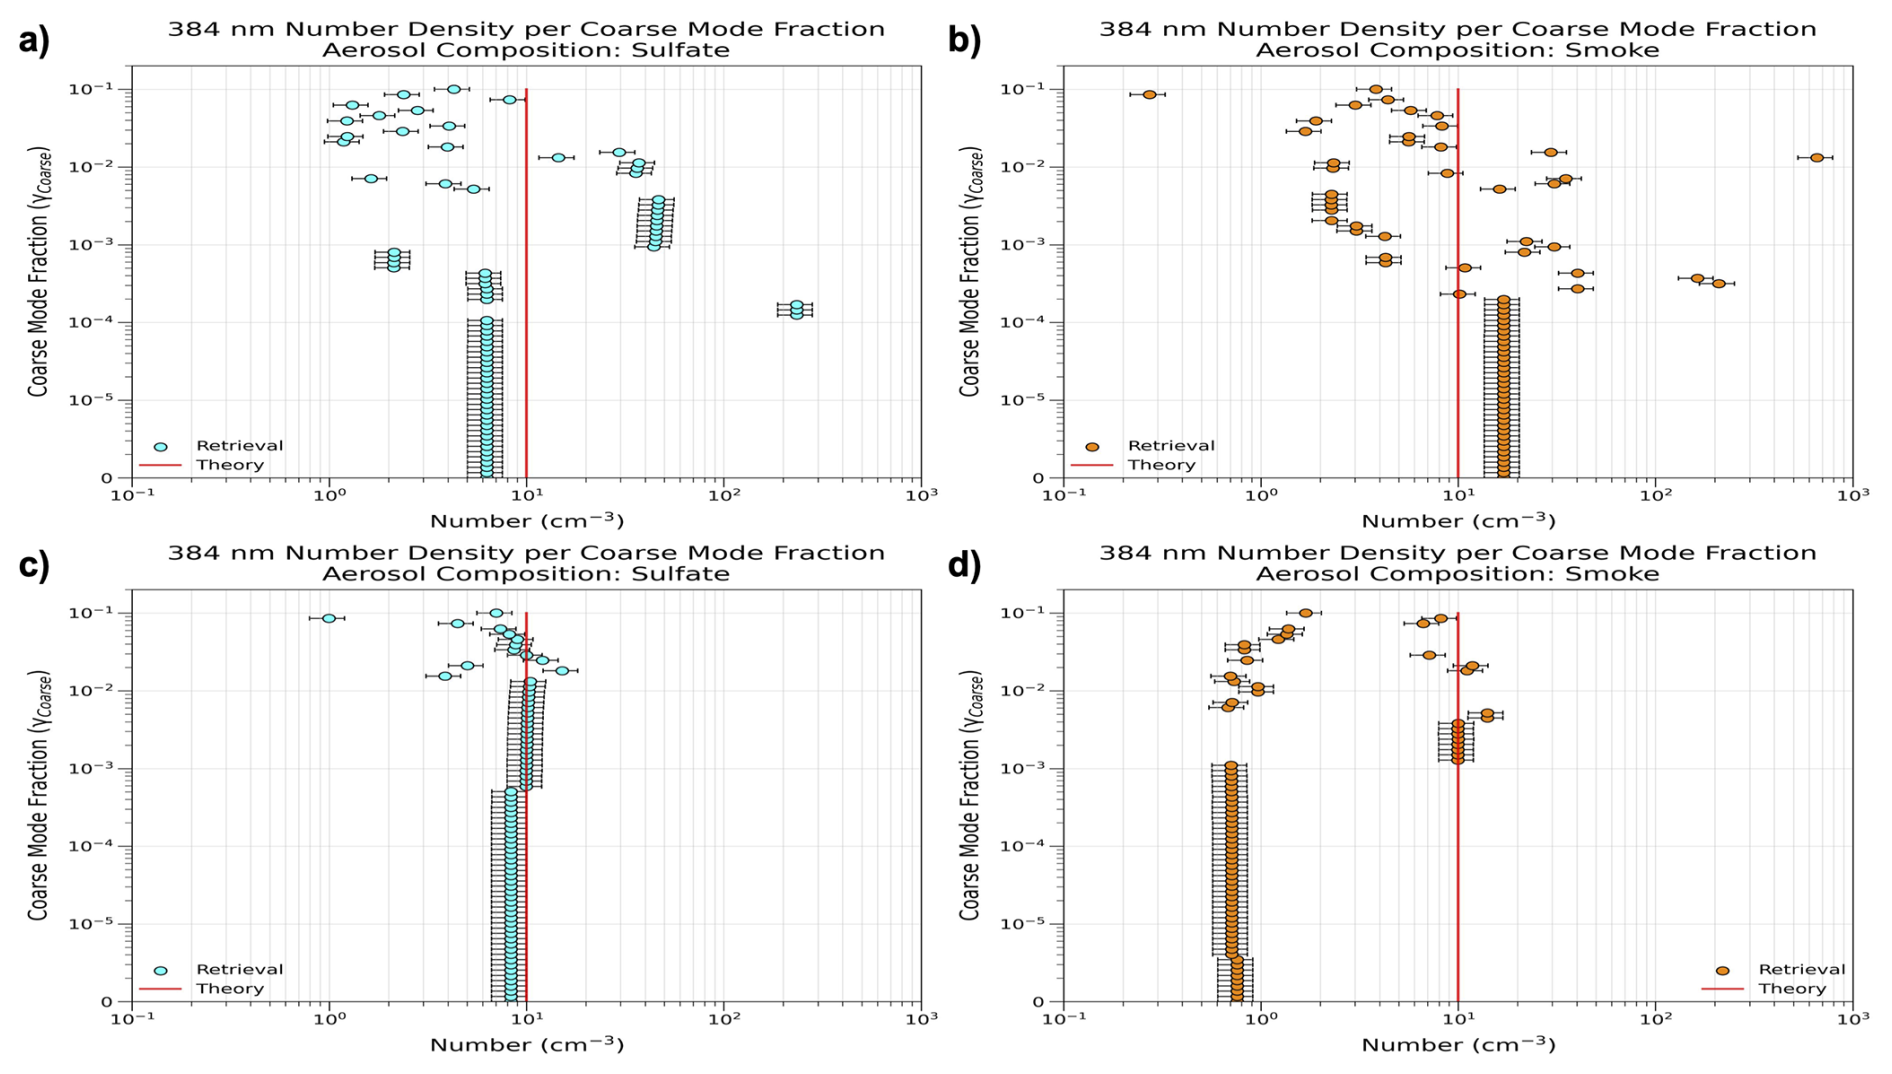
Figure 10Retrieved 384 nm aerosol number density (cm−3) for synthetic distributions describing: (a) quiescent, sulfate, (b) quiescent, smoke, (c) non-quiescent, sulfate, and (d) non-quiescent, smoke. The retrieved value is calculated from the extinction measurement (± 20 % uncertainty) while assuming aerosol number density is equal to 10 cm−3.
Aerosol extinction is marginally increased for smoke aerosols compared to sulfate aerosols at 384 nm (Fig. 5a, b) and across SAGE III/ISS NIR channels (not shown). Retrieved aerosol extinction coefficients for smoke aerosols show fair agreement with the synthetic data with small underestimations with synthetic γCoarse values less than 0.1 %, and increased extinction with slight overestimations for most retrievals when synthetic γCoarse is greater than or equal to 0.1 % (Fig. 5b left panel). Retrieved aerosol extinction increases for the large prescribed γCoarse as distributions shift to describing larger aerosol sizes within the range of the synthetic distribution defined fine and coarse modes. For synthetic γCoarse larger than 1 %, synthetic aerosol optical and microphysical properties increase with increased coarse mode aerosol concentrations. Synthetic Angstrom exponents range from 0–1.8 with good agreement between retrieved and synthetic data (Fig. 5b right panel). Smoke aerosol Angstrom exponents are smaller than for sulfate aerosols from the increased NIR extinction.
The retrieved aerosol size distributions for smoke aerosols are bimodal lognormal distributions with large γCoarse ranging from 0.1 %–10 % (Fig. 6b). Synthetic γCoarse values less than 0.05 % are overestimated with retrieved γCoarse equal to 10 %. The inflated coarse mode partitioning has retrieved dp, Fine and dp, Coarse of less than 500 nm, with dp, eff closely matching the synthetic data (Fig. 7b). Retrieved γCoarse are found closer to the 1:1 line for the synthetic γCoarse values larger than 0.05 %, approximating the threshold of γCoarse where the coarse mode strongly impacts aerosol properties (Fig. 6b). Retrieved median diameters increase by 300 nm for retrievals over the synthetic γCoarse range, with retrieved dp, Fine ranging from 100 to 400 nm and dp, Coarse from 400 to 700 nm, and dp, eff from 150–300 nm (Fig. 7b). Retrievals of larger dp and broader σg, Coarse increase dp, eff to 200–400 nm (Fig. 7b) and further lower retrieved number densities (Fig. 10b).
Surface area densities are retrieved for smoke aerosols within the sample uncertainty bounds with good agreement with the synthetic values overall (Fig. 8b). Retrieved aerosol number and surface area densities are underestimated from synthetic values for retrieved distributions having strong coarse modes and where synthetic γCoarse is greater than or equal to 0.05 %. Volume densities are retrieved in close agreement with the synthetic values (Fig. 9b). Size distribution retrievals for smoke aerosols exhibit some instability with γCoarse larger than 0.05 % in this distribution.
Retrieved aerosol properties are in closer agreement with the synthetic data for smoke aerosols than sulfate aerosols for γCoarse larger than 1 % even with increased dp, eff. Overall, the sulfate retrieved aerosol size distributions include larger dp, g with a dominant fine mode describing the accumulation mode aerosols. Smoke aerosol retrievals exhibit stronger partitioning to coarse mode aerosol concentrations with larger γCoarse values, broadening the σg, Coarse, and increasing dp, eff. Retrieved aerosol number, surface area, and volume density tend to be larger in the smoke aerosol retrievals for this distribution as a result. The retrieved aerosol distribution moments are resolved well with dp, eff, surface area, and volume density remaining within the uncertainty bounds of the synthetic dataset for both compositions.
4.2 Retrievals of the Non–Quiescent Aerosol Size Distribution
Aerosol extinction is significantly enhanced in the non–quiescent distribution across the SAGE III/ISS wavelength spectrum for both sulfate and smoke aerosols, e.g., aerosol extinction coefficients at 384 nm for sulfate aerosols range from 4– km−1, with increases in aerosol extinction with γCoarse larger than 1 % (Fig. 5c left panel). Retrieved distributions for sulfate aerosols produce aerosol extinction within the uncertainty bounds of the synthetic data for most retrieved size distributions. Angstrom exponents range from 0 to 0.6 (Fig. 5c right panel) and decrease when γCoarse exceeds 1 %. The Angstrom exponents are notably smaller with the increased aerosol diameters from the quiescent aerosol size distribution.
There is strong agreement overall in the microphysical properties of the retrieved and synthetic aerosol size distributions for sulfate aerosols. Most retrieved γCoarse describe a unimodal distribution (Fig. 6c) with retrieved aerosol concentrations firmly within the accumulation mode, matching the synthetic distribution where these optically impactful aerosols dominate extinction. The retrieved distributions have broad fine modes with distribution means near 400 nm and retrieved dp, eff agree well with the synthetic values ranging from 350–500 nm (Fig. 7c). Number densities are retrieved in close agreement and are within 20 % of 10 cm−3 for most retrievals (Fig. 10c).
The non–quiescent synthetic distributions produce enhanced aerosol surface area densities of 5–8 µm2 cm−3 (Fig. 8c) and volume densities of 0.6–1.0 µm3 cm−3 (Fig. 9c). The increased particle diameters and enhanced surface area and volume densities in the retrieved distributions for sulfate aerosols match the synthetic data. The retrieval algorithm is more likely to result in a bimodal lognormal distribution when synthetic γCoarse is larger than 5 % (Fig. 6c). The retrieved bimodal distributions for large synthetic γCoarse have strong agreement with the synthetic data as dp, eff increases to ∼450–500 nm (Fig. 7c).
Synthetic aerosol extinction coefficients for smoke aerosols are marginally increased from sulfate aerosols and range from 4– km−1 at 384 nm (Fig. 5d left panel). Angstrom exponents from the synthetic dataset for smoke aerosols range from 0–0.3 (Fig. 5d right panel), are marginally smaller than for sulfate aerosols, and have strong agreement between the retrieved and synthetic values. For synthetic γCoarse less than 0.1 %, the retrieved distributions produce enhanced aerosol extinction from the synthetic data with retrieved distributions largely bimodal (Fig. 6d) and overestimating aerosol size with dp, eff ∼1 µm (Fig. 7d). The retrieval algorithm solution spaces deteriorate with large γCoarse and σg, Coarse, compensating with increased aerosol sizes to match the large extinction values produced in the synthetic distribution. Retrieved smoke aerosol number density is underestimated (Fig. 10d) and volume density is overestimated (Fig. 9d) with increases in retrieved diameters. Retrieved surface area densities maintain close agreement with the synthetic values within the uncertainty range with the retrieved distribution having sensitivity to the accumulation mode aerosols (Fig. 8d).
Retrieved aerosol extinction coefficients best match the synthetic dataset for a range of synthetic γCoarse from 0.1 %–10 % where larger synthetic γCoarse more clearly define a fine and coarse mode, with retrieved dp, eff between 300–400 nm (Fig. 7d). Retrieved volume densities show strong agreement with the synthetic data where retrieved number densities (Fig. 10d) and γCoarse (Fig. 6d) are shown to be in stronger agreement with the synthetic data. The separation of two modes in synthetic distributions with large γCoarse helps the retrieval algorithm target the optically impactful aerosols, where otherwise the retrieved size distributions isolate a single mode producing the enhanced aerosol extinction, leading to overestimates in retrieved aerosol sizes. This range also produces solutions which oscillate between the best match and overestimates in aerosol extinction, marking instability in the retrieval of synthetic distributions with large γCoarse as Mie resonances increase with particle diameter. Solutions oscillate as retrieved distributions infer a broad coarse mode which introduces non-uniqueness to the solution space.
When compared to the sulfate aerosol retrievals reflecting a major volcanic event, the retrieved distributions for smoke aerosols have larger dp, Fine, relatively narrow σg, Fine, along with strong partitioning to a broad coarse mode. Retrieved aerosol size distributions with retrieved dp, Fine ∼400 nm, dp, Coarse ∼600–900 nm, dp, eff ∼300–400 nm, and γCoarse ∼1 % show strong agreement in aerosol optical and microphysical properties with the synthetic data. Synthetic γCoarse ranging from 0.1 %–10 % provide the closest matches in the retrieved and synthetic data with the synthetic distributions including stronger partitioning to a large particle mode and enhanced aerosol extinction, closely resembling aerosol size distributions following a stratospheric perturbation.
The pyroCb observations analyzed in Sect. 5 include individual stratospheric profiles from SAGE III/ISS and coincident in situ measurements collected near Laramie, WY. This research includes samples of the 2017 PNE event in western North America during late summer of 2017, along with pyroCb events in western North America in September 2020. SAGE III/ISS observations are filtered for coincidence with the in situ measurement within a bounding box of ± 5∘ latitude, ±10° longitude from the Laramie, WY launch location (41.31° N, −105.65° E) and within ± 24 h of the WLPC/LOPC flight. Coincidence criteria are relaxed to ±10° latitude if no coincident profile is found. Satellite and in situ data of sulfate or smoke aerosol external mixtures use the refractive indices in Table 1.
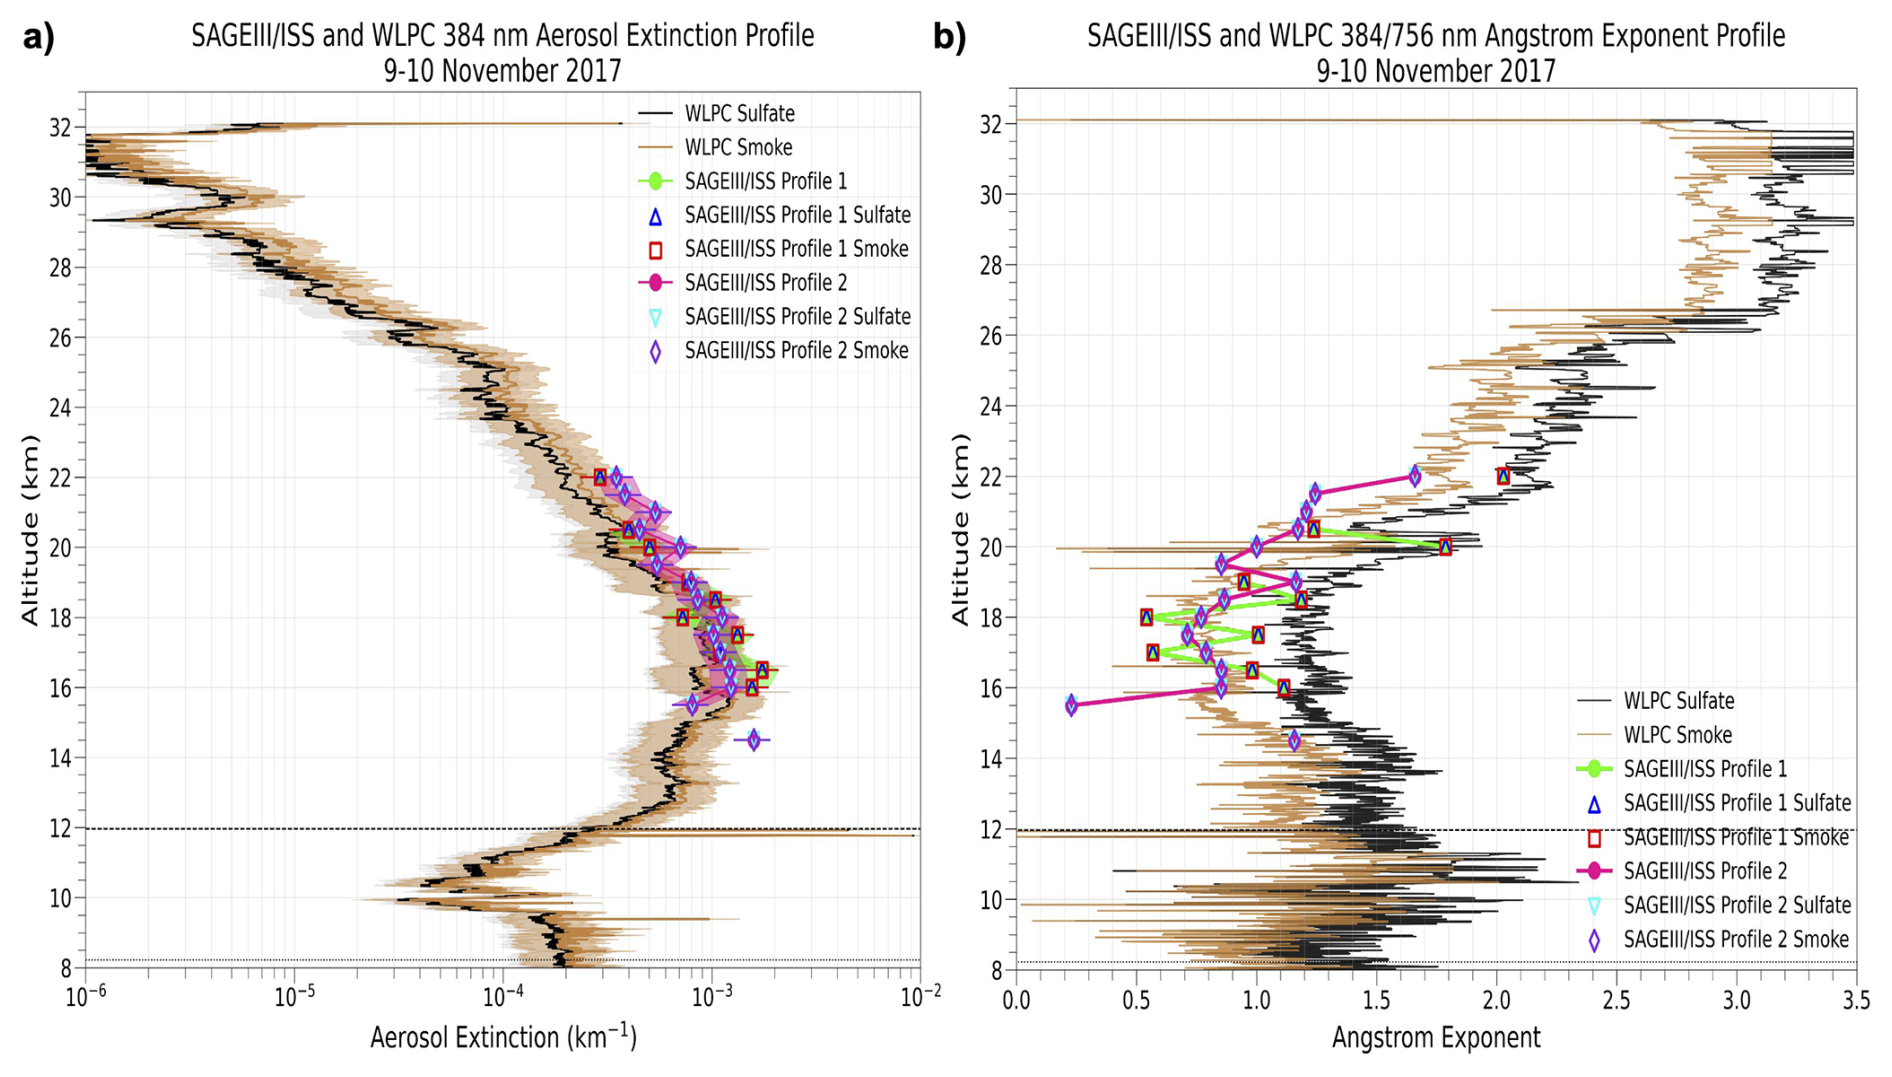
Figure 11Aerosol extinction at 384 nm (km−1) (a) and Angstrom exponents (384/756 nm) (b) from SAGE III/ISS observations coincident with WLPC in situ measurements made on 9 November 2017. WLPC aerosol extinction coefficients and Angstrom exponents are shown for external mixtures of sulfate and smoke aerosols, respectively. SAGE III/ISS sulfate and smoke aerosol data are calculated from the retrieved aerosol size distributions.
5.1 2017 Pacific Northwest Event (PNE)
Two SAGE III/ISS observations are coincident with the WLPC in situ measurement made on 9 November 2017 near Laramie, WY: Profile 1 on 9 November 2017 (46.87° N, −98.44° E) and Profile 2 on 10 November 2017 (46.5° N, −108.96° E). Both SAGE III/ISS and WLPC detect enhanced aerosol extinction from 14–20 km following dispersal of pyroCb aerosols in the lower stratosphere (Fig. 11a) (Yu et al., 2019; Torres et al., 2020; Baars et al., 2019). SAGE III/ISS aerosol extinction measurements are within 50 % of the WLPC measurements. Tropopause heights from MERRA-2 reanalysis matching the spatiotemporal location of individual SAGE III/ISS profiles are shown as horizontal dotted lines. SAGE III/ISS aerosol extinction measurements and calculated values from retrieved size distributions are overlaid in Figs. 11 and 15, respectively, with retrieved SAGE III/ISS profiles labeled as sulfate or smoke values. Angstrom exponents in the lower stratosphere are reduced to ∼0.5–1.5 and increase sharply with height above 20 km (Fig. 11b). WLPC Angstrom exponents assuming smoke aerosols show strong agreement with SAGE III/ISS observations up to ∼20 km with persistent aerosol loading in the lower stratosphere from the summer pyroCb events.
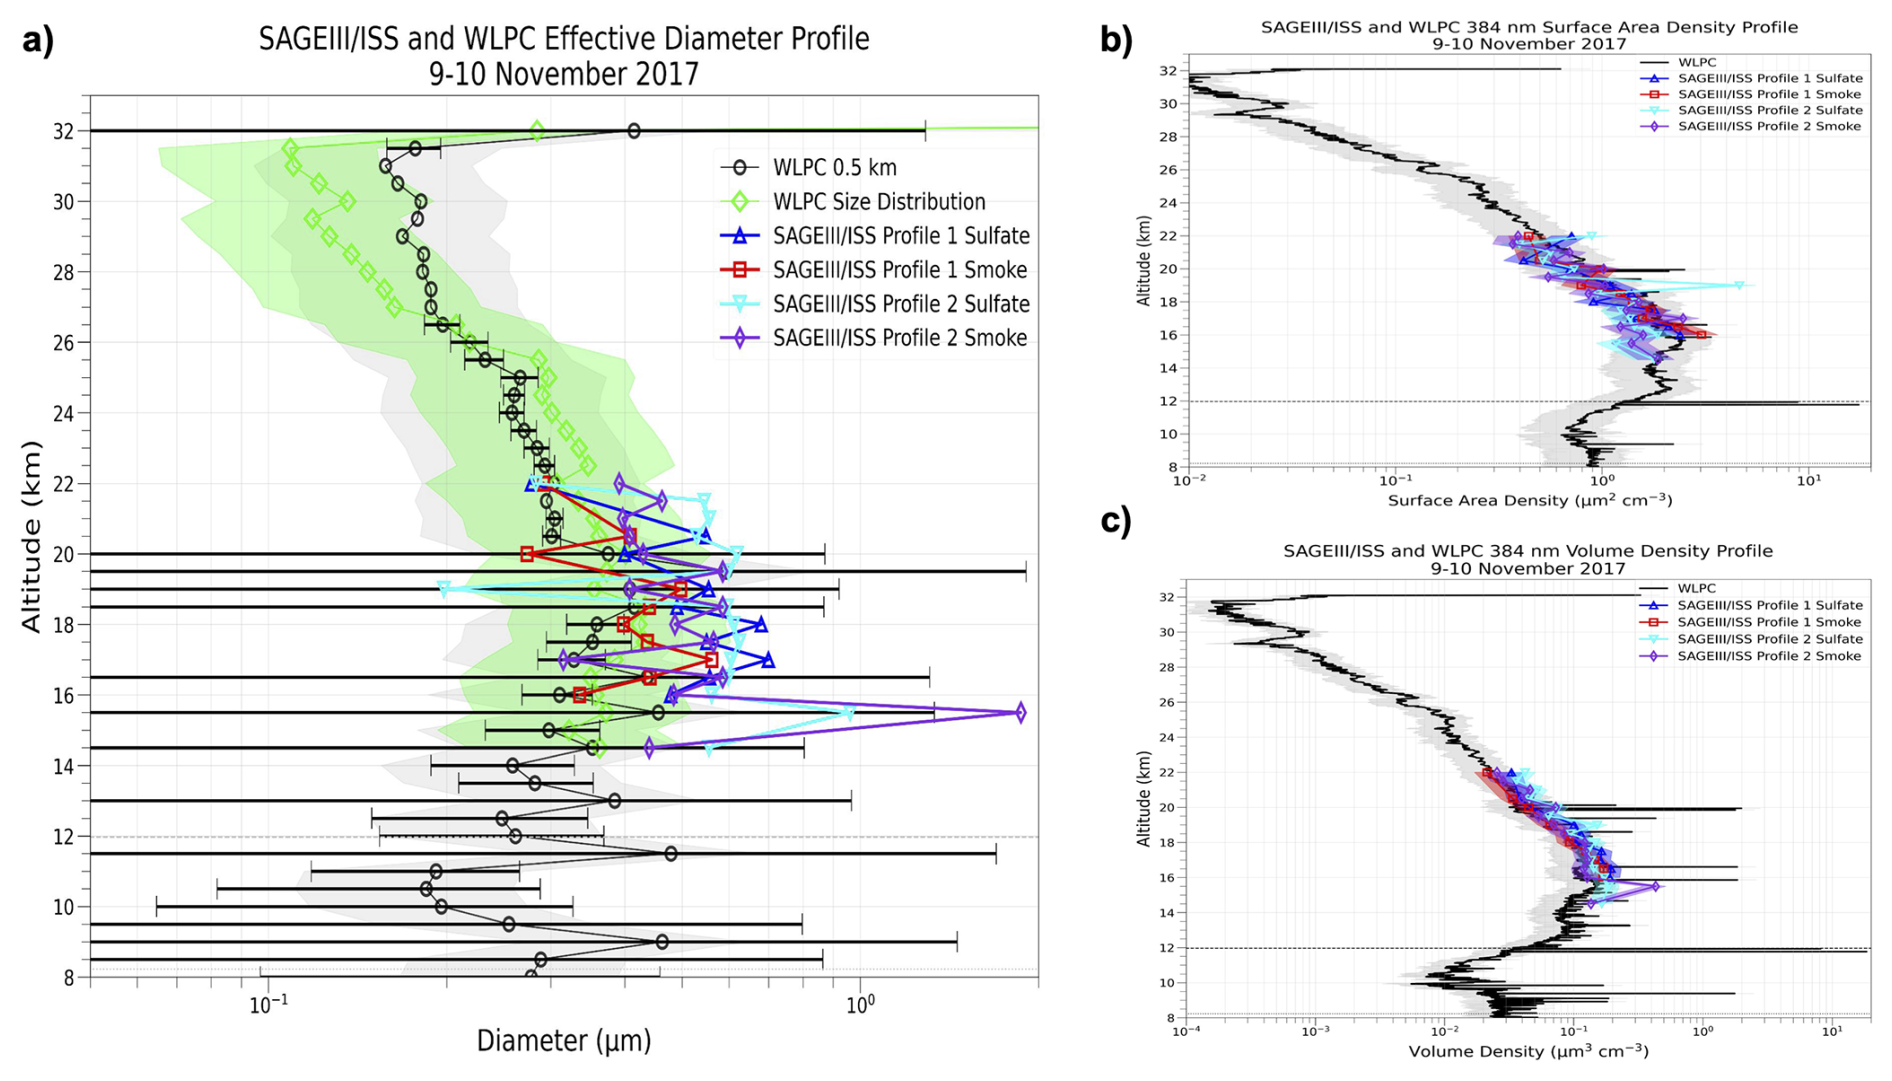
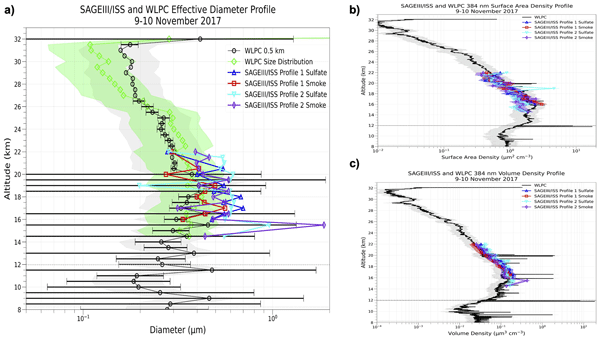
Figure 12SAGE III/ISS and WLPC (a) aerosol effective diameter (nm), (b) surface area density (µm2 cm−3), and (c) volume density (µm3 cm−3) profiles from 9–10 November 2017. (a) WLPC full resolution mean aerosol effective diameters at 0.5 km resolution (WLPC 0.5 km) with error bars depicting standard deviation at this vertical resolution. WLPC Size Distribution uses the publicly distributed size distribution fits of the measured aerosol concentrations to calculate the distribution moments.
SAGE III/ISS and WLPC display increases in aerosol effective diameters to 300–700 nm in the lower stratosphere below 20 km (Fig. 12a), in agreement with EARLINET lidar retrieved aerosol effective diameters of 640±200 nm in smoke layers intercepted above Leipzig, Germany in August (Haarig et al., 2018). WLPC measured aerosol effective diameters below 20 km within smoke infiltrated layers have high variance at 0.5 km altitude resolution with an uncertainty of 40 % spanning several hundred nanometers. SAGE III/ISS and WLPC collected dp, Fine range from 200–500 nm with significant partitioning to a coarse mode within the upper accumulation mode where dp, Coarse are centered near 500–800 nm. Lower stratospheric aerosol surface area densities are enhanced and range from 1–3 and 0–3 µm2 cm−3 from SAGE III/ISS and WLPC, respectively, with SAGE III/ISS retrieved values in agreement within the 40 % uncertainty range of the WLPC (Fig. 12b). SAGE III/ISS retrieved aerosol volume densities in the lower stratosphere below 18 km reach maxima of 0.1–0.25 µm3 cm−3 (Fig. 12c), while values at higher altitudes remain below 0.1 µm3 cm−3. Strong agreement in SAGE III/ISS retrieved and WLPC measured volume densities are shown in the smoke enhanced layers and throughout the vertical profile. PollyNET (NETwork of POrtabLe Lidar sYstems) stratospheric aerosol mass measurements of the diluted smoke layers agree well with the coincident SAGE III/ISS and WLPC observations, similarly describing the enhanced aerosol mass following the PNE over background stratospheric conditions (Baars et al., 2019). Decreases in aerosol volume density coincide with decreases in aerosol size above 22 km.
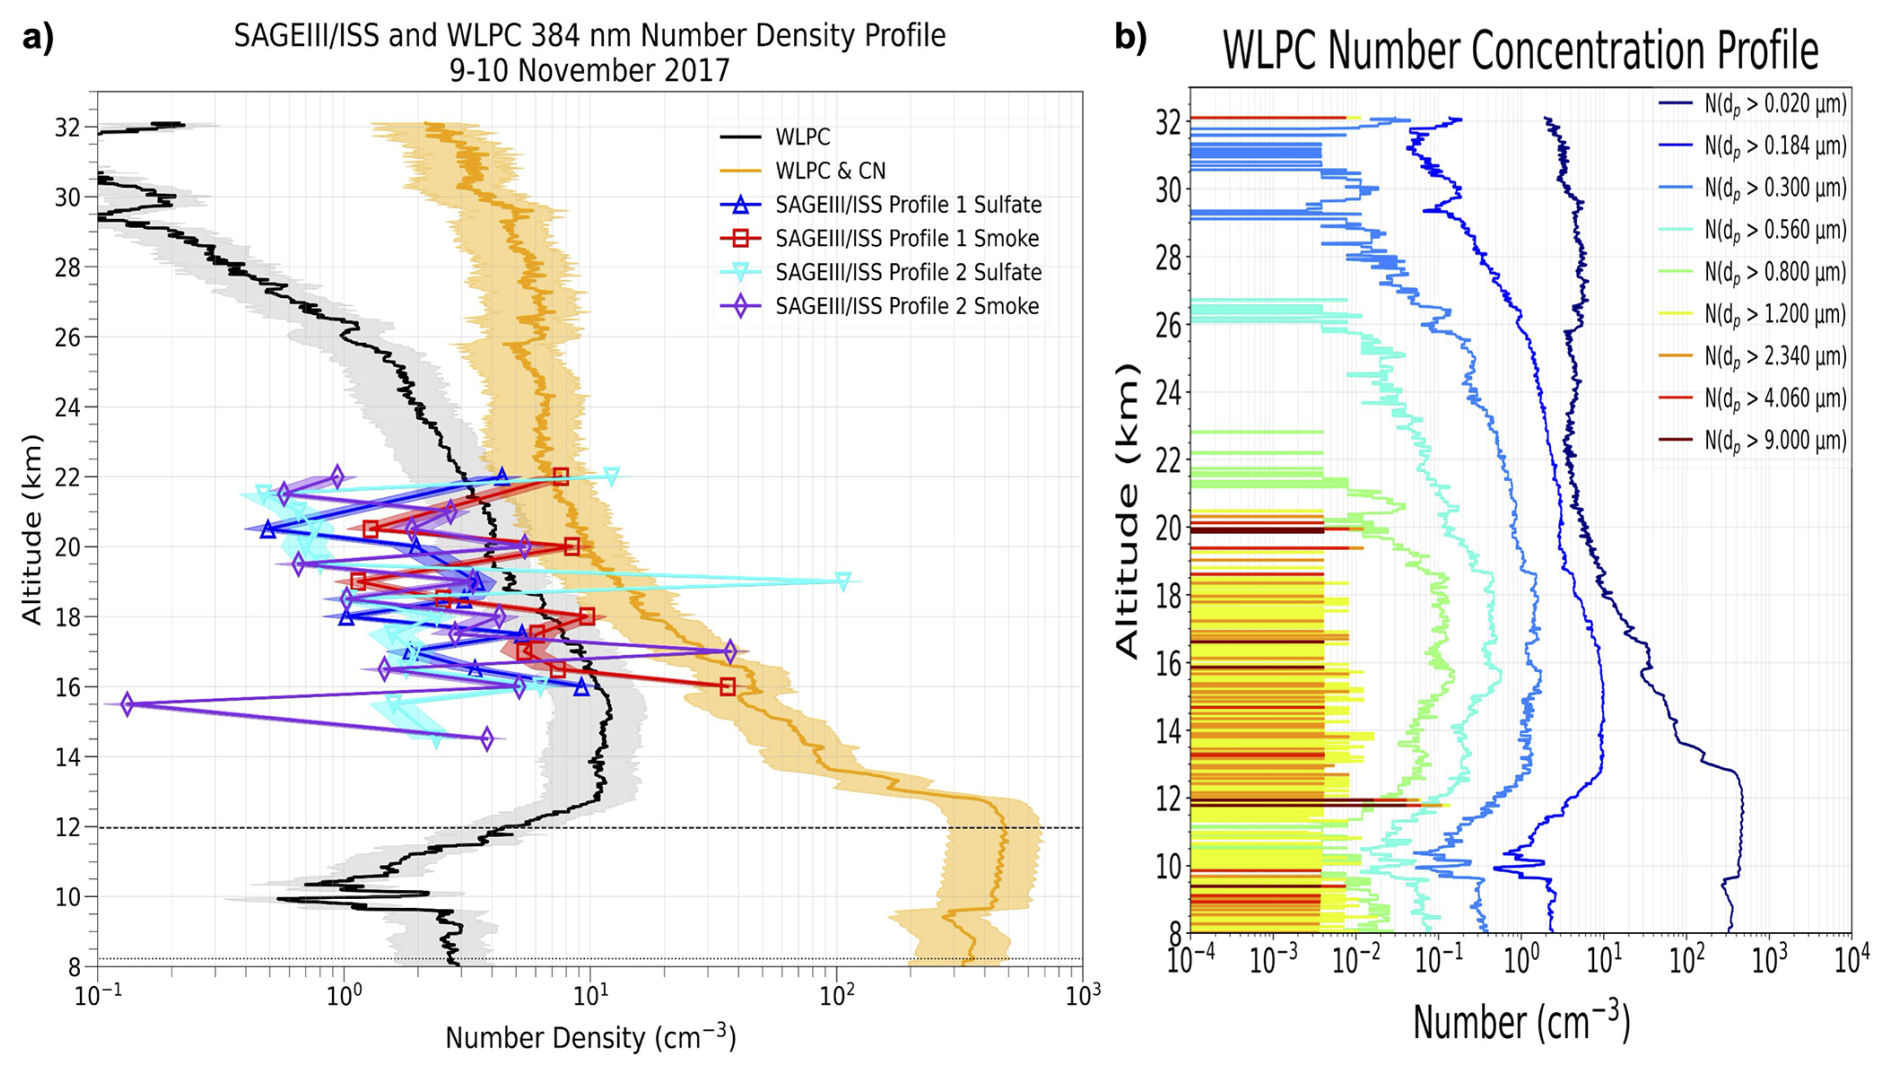
Figure 13SAGE III/ISS and WLPC (a) aerosol number density (cm−3) and (b) WLPC aerosol size resolved concentrations (cm−3). (a) WLPC aerosol number densities are calculated with and without inclusion of independent CN measurement, shown in (b) N(dp>0.020 µm).
Retrieved SAGE III/ISS aerosol number densities are consistent with WLPC aerosol size resolved concentrations for N(dp >0.02–0.3 µm) with the majority of SAGE III/ISS retrieved number densities below 20 km falling between 1–10 cm−3 (Fig. 13a). SAGE III/ISS retrieved smoke aerosol number densities are mostly larger than the sulfate retrieval, with WLPC number density including CN measurement showing that total aerosol concentrations can be dominated by the small aerosol population. WLPC number concentrations for N(dp>0.300 µm) are near or less than 1 cm−3, while N(dp>0.184 µm) range from 3–10 cm−3 through much of the lower stratosphere (Fig. 13b). WLPC measured aerosol concentrations show a broad range between the N(dp>0.300 µm) and N(dp>0.184 µm) bins suggesting that a large portion of the accumulation mode population falls within 184–300 nm range (Fig. 13b). Increased concentrations of aerosols with diameters less than 300 nm indicate growth of total aerosol population, with coagulation being an efficient driver of aerosol growth following increases in stratospheric aerosol mass which are most prominent in the smoke affected layers.
From 16.5–17.6 km, smoke aerosols are detected with near maximum aerosol size, surface area and volume density, and extinction in the vertical profile for this date (Figs. 11–12). At 16.5 km, retrieved aerosol effective diameters range from ∼400–600 nm (Fig. 12a). SAGE III/ISS retrievals at 16.5 km show dp, Fine are found between 250–350 nm in profile 1 and 250–500 nm in profile 2, and WLPC dp, Fine is equal to 240 nm (Fig. 14). SAGE III/ISS and WLPC aerosol size distributions describe σg, Fine from 1.4–1.6 with σg, Coarse remaining narrow (∼1.1–1.4). SAGE III/ISS retrieved dp, Coarse are found between 550–800 nm for profiles 1 and 2 if a coarse mode is detected. WLPC dp, Coarse is equal to 3.66 µm with minimal aerosol concentrations of diameters 2–9 µm meeting the lower concentration sensitivity of the WLPC instrument. SAGE III/ISS retrieved aerosol size distributions at this height closely resemble the WLPC aerosol size distribution fine mode and negligible coarse mode concentrations. The measured distributions highlight the overall increased concentration of accumulation mode aerosols within the broad ranging polydisperse distribution describing the smoke aerosols.
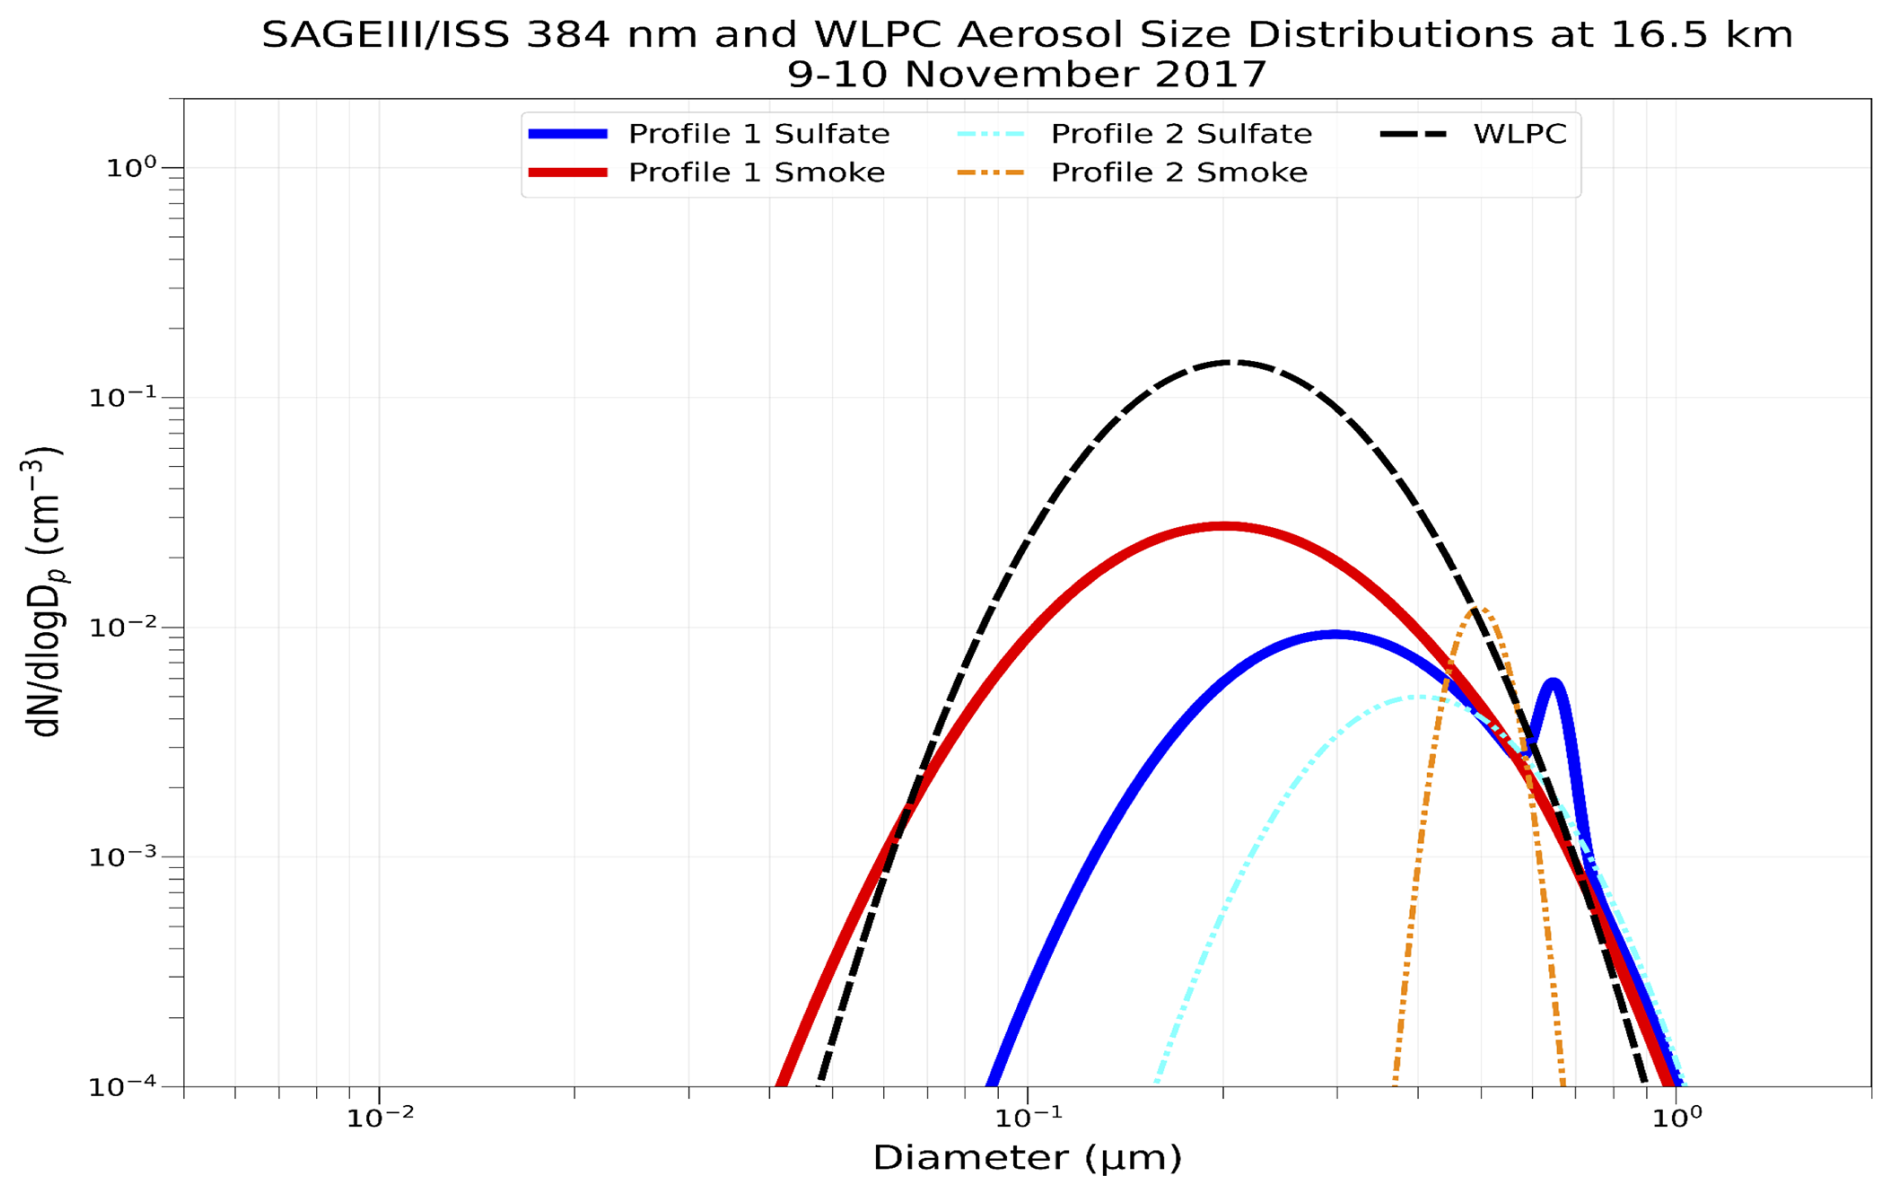
Figure 14SAGE III/ISS and WLPC aerosol size distributions (cm−3) at 16.5 km from 9–10 November 2017.
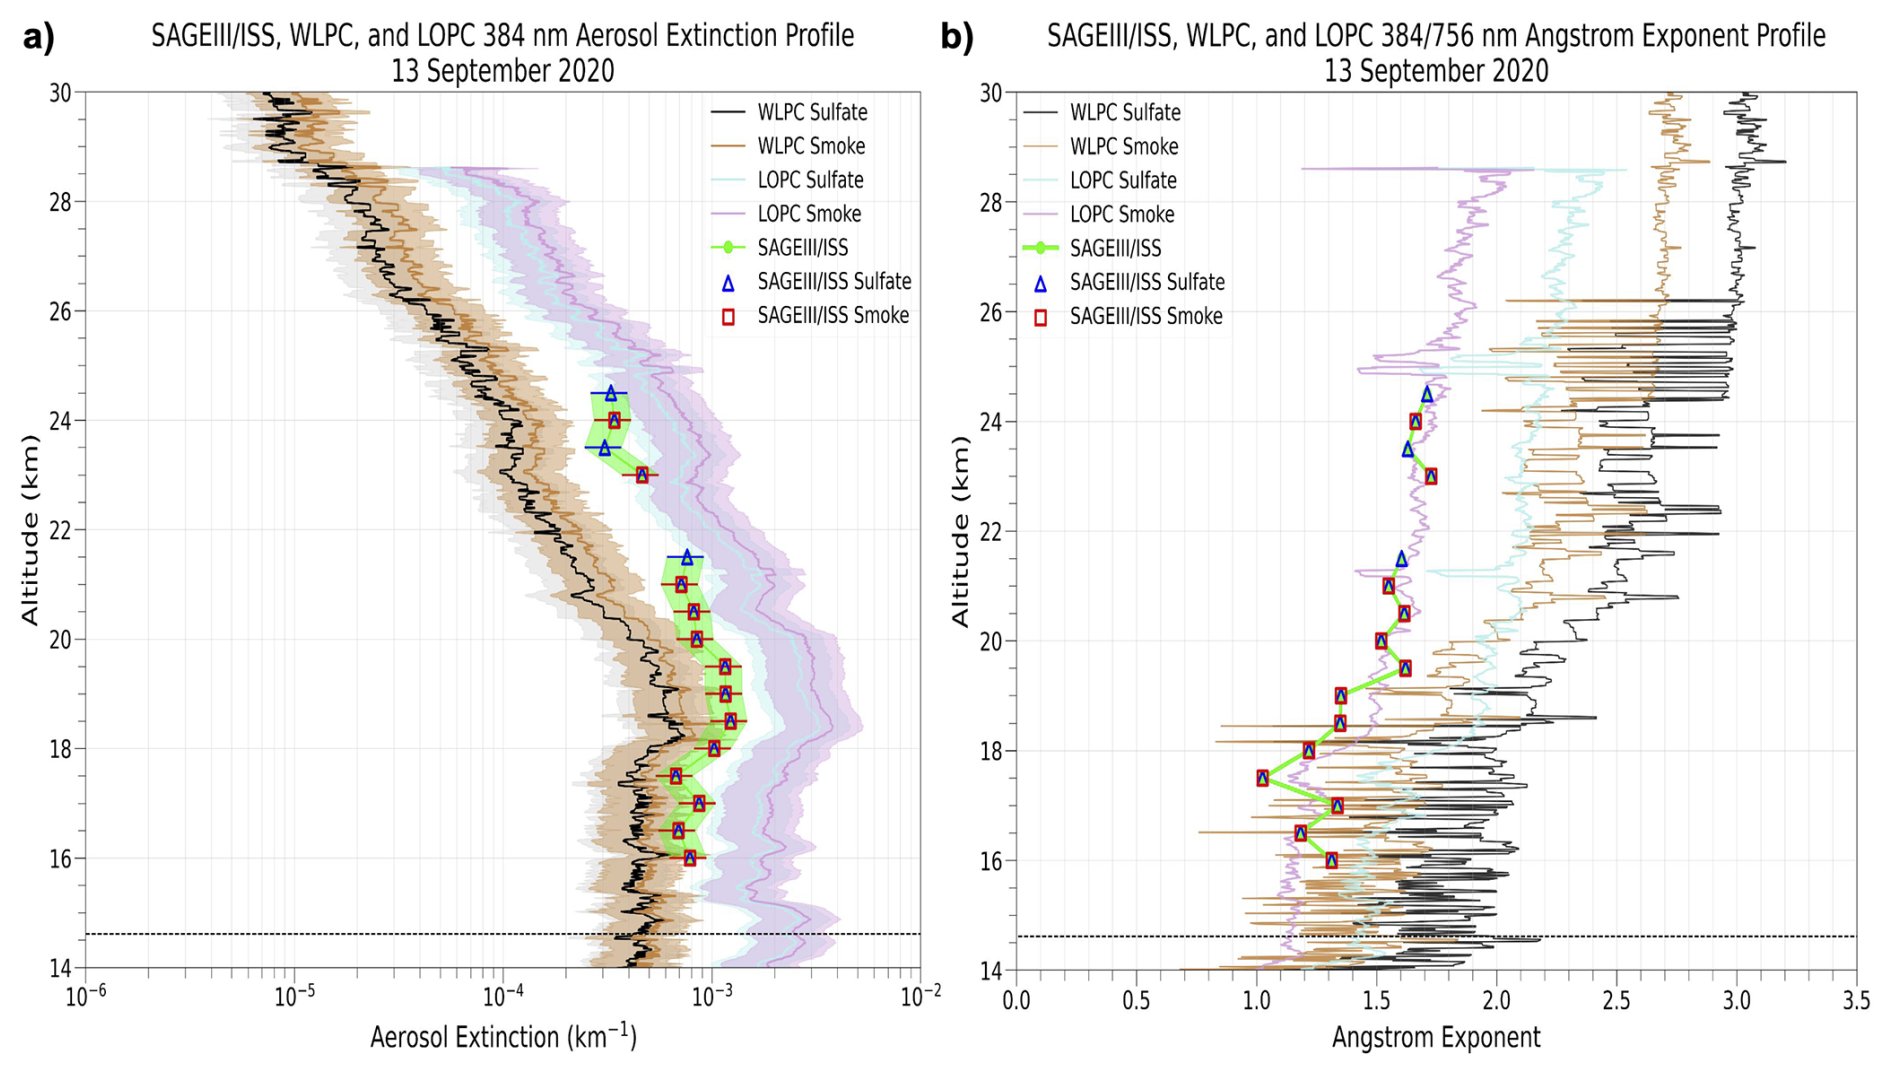
Figure 15Aerosol extinction at 384 nm (km−1) (a) and Angstrom exponents (384/756 nm) (b) from SAGE III/ISS observations coincident with WLPC and LOPC in situ measurements made on 13 September 2020 during an active wildfire period in North America. In situ aerosol extinction coefficients are shown for external mixtures of sulfate and smoke aerosols, respectively. SAGE III/ISS sulfate and smoke aerosol data are calculated from the retrieved aerosol size distributions.
Sampling at Laramie, WY in late April 2018 with coincident SAGE III/ISS measurement indicate reduced aerosol optical and microphysical properties from November 2017 (not shown here). WLPC measurements describe CN concentration increases from the previous samples, along with reduced accumulation mode aerosol concentrations with dp ranging from 184–800 nm. N(dp>0.80 µm) are less than N(dp<0.80 µm) aerosol concentrations by an order of magnitude but remain enhanced over quiescent conditions. Aerosol effective diameters remain enlarged to near 400 nm throughout the lowermost stratosphere. SAGE III/ISS retrieved aerosol optical and microphysical properties for sulfate and smoke aerosols below 20.5 km demonstrate reductions in aerosol extinction, surface area and volume density by ∼40 %, with decreases in number density reaching 50 %. Aerosol number and volume density reductions indicate further reduction in the smoke aerosol retrieved properties which decrease by more than 50 % and 60 %, respectively. Aerosol diameters remaining increased to several hundred nanometers and reductions in volume density, and other aerosol properties shown here, are similar to observations of smoke aerosols in the UTLS up to 12.5 km in NASA's AToM field campaign in 2017 and 2018 (Katich et al., 2023). Decreases in stratospheric aerosol properties near Laramie, WY over this time span agree with Polly lidar station measurements of reduced aerosol mass in the northern hemisphere midlatitudes (Baars et al., 2019).
5.2 Post September 2020 PyroCb Events
A single SAGE III/ISS observation is coincident with the dual launch of the WLPC and LOPC from Laramie, WY on 13 September 2020 following an active wildfire period in the continental United States. During September 2020, five pyroCb events in California and Colorado injected smoke aerosols into the UTLS between 10–17 km (Peterson et al., 2025). Resulting pyroCb smoke plumes were transported to Europe in subsequent days (Baars et al., 2021; Hu et al., 2022). In situ measurements from Boulder, CO also document increased aerosol loading in the lower stratosphere during the intense wildfire outbreaks in 2020 (Todt et al., 2023). Stratospheric aerosol layers are expected to have residual impacts from the 2019 Raikoke volcanic eruption (48.3° N, 153.3° E) contributing to the aerosol loading along with the additional smoke aerosols.
SAGE III/ISS and WLPC/LOPC measured aerosol extinction profiles show moderate extinction in the lower stratosphere from tropopause (∼14.6 km) to 18 km, with maximums from 18–20 km (Fig. 15a). SAGE III/ISS measures reduced Angstrom exponents up to 19 km which match OPC measured reductions in the smoke profile (Fig. 15b). In smoke dominated layers, LOPC reports more pronounced reductions in Angstrom exponent than the WLPC with increased sensitivity to large aerosols in the LOPC measurement. Angstrom exponents increase with height above 19 km. SAGE III/ISS retrieved aerosol optical and microphysical properties are juxtaposed to the measured values from the WLPC and LOPC throughout much of the vertical profiles while showing strong agreement with the WLPC in the lowermost stratosphere and with the LOPC at higher altitudes. LOPC aerosol extinction is largely enhanced from the WLPC at high altitudes where low concentrations benefit sampling from the high flow rate LOPC instrument.
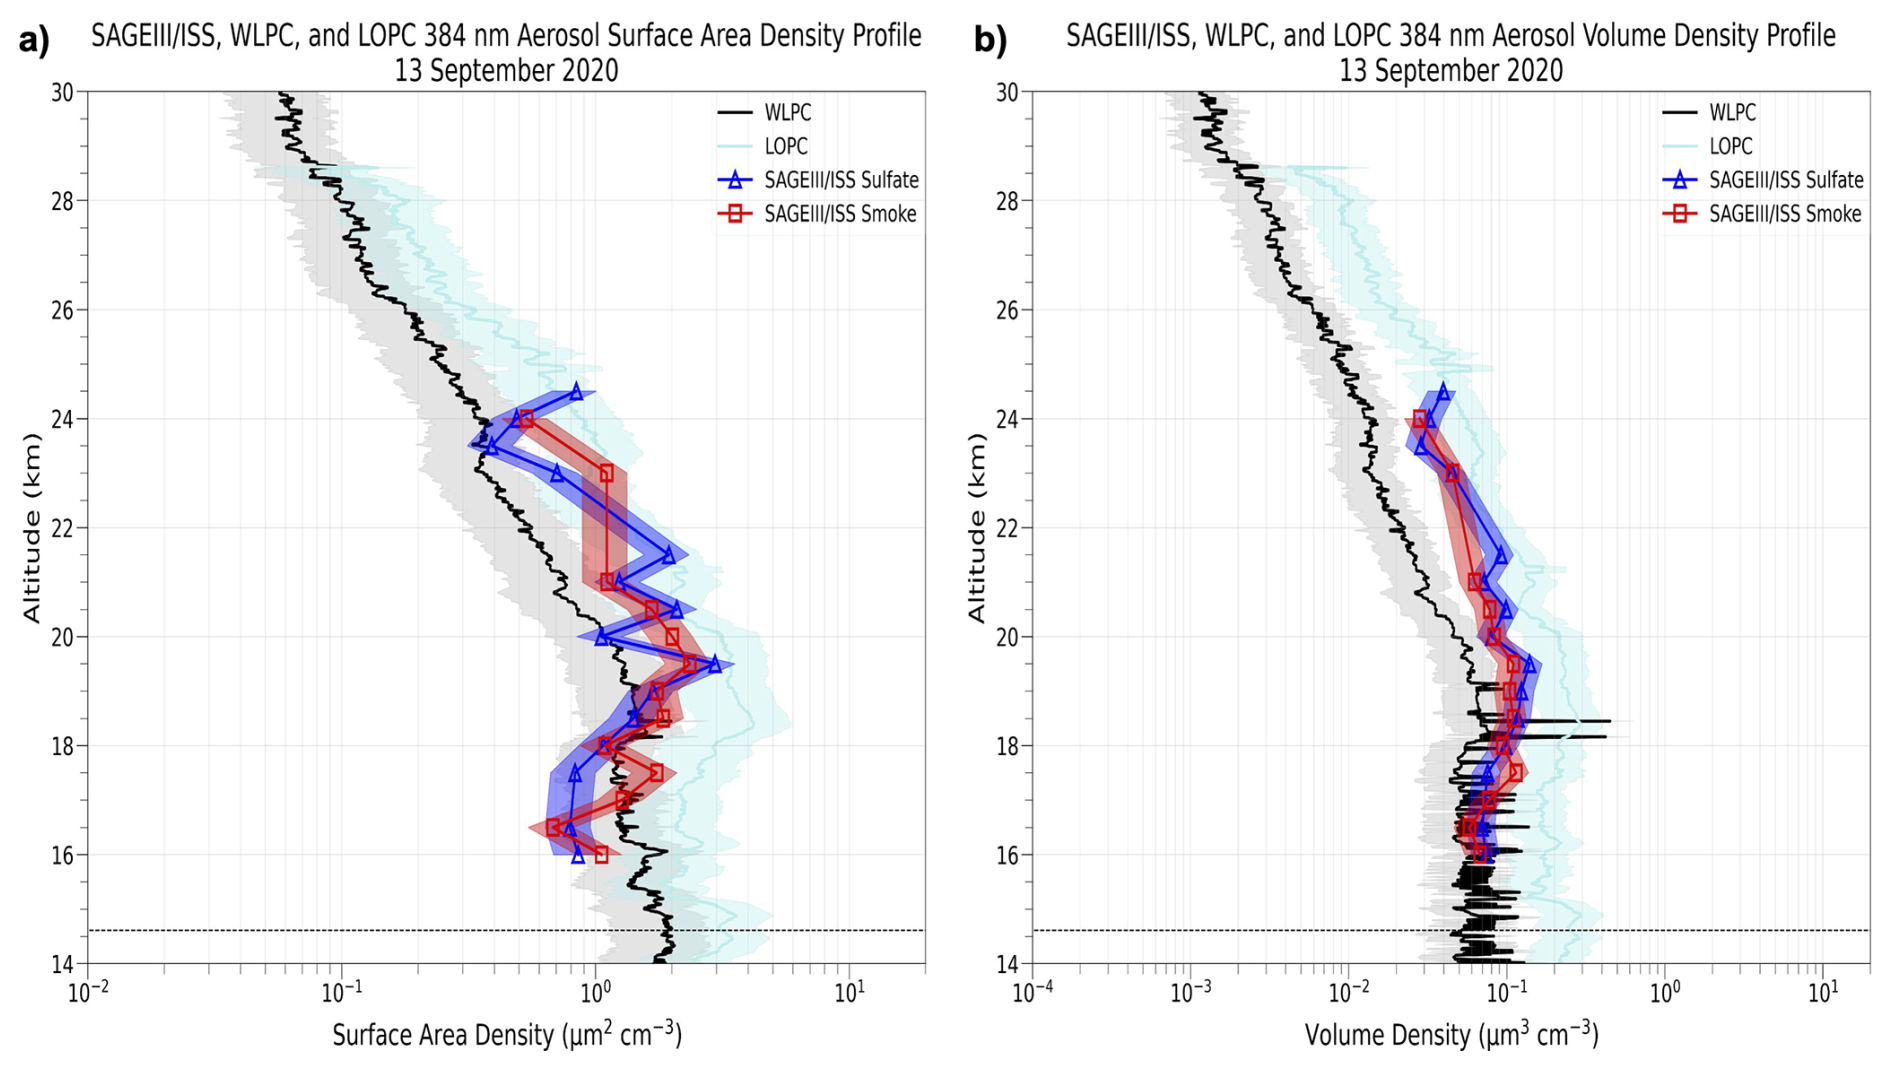
Figure 16SAGE III/ISS, WLPC, and LOPC (a) surface area density (µm2 cm−3), and (b) volume density (µm3 cm−3) profiles from 13 September 2020.
Aerosol surface area and volume densities are moderate from tropopause to 18 km, with values increased above 18 up to 22 km and where the maximum quantities are measured. SAGE III/ISS and WLPC retrieved aerosol surface area densities range from ∼1.0–3.0 µm2 cm−3 with LOPC measurements reaching 5 µm2 cm−3 in the stratosphere (Fig. 16a). SAGE III/ISS and WLPC retrieved aerosol volume densities range from ∼5– µm3 cm−3 while LOPC measurements reach 1– µm3 cm−3 (Fig. 16b). From 18–20 km, increases in aerosol number densities are measured from each instrument converging to values of ∼5 cm−3 (4–7 cm−3) (Fig. S1c in the Supplement). Aerosol number densities in the lowermost stratosphere below 18 km are overall reduced from the higher altitude layers. SAGE III/ISS retrieved values show fairly strong agreement with the aerosol concentrations from the lowest measured size bins from the WLPC and LOPC, N(dp>0.184 µm) and N(dp>0.300 µm) respectively, ranging from 1–10 cm−3 (Fig. S1).
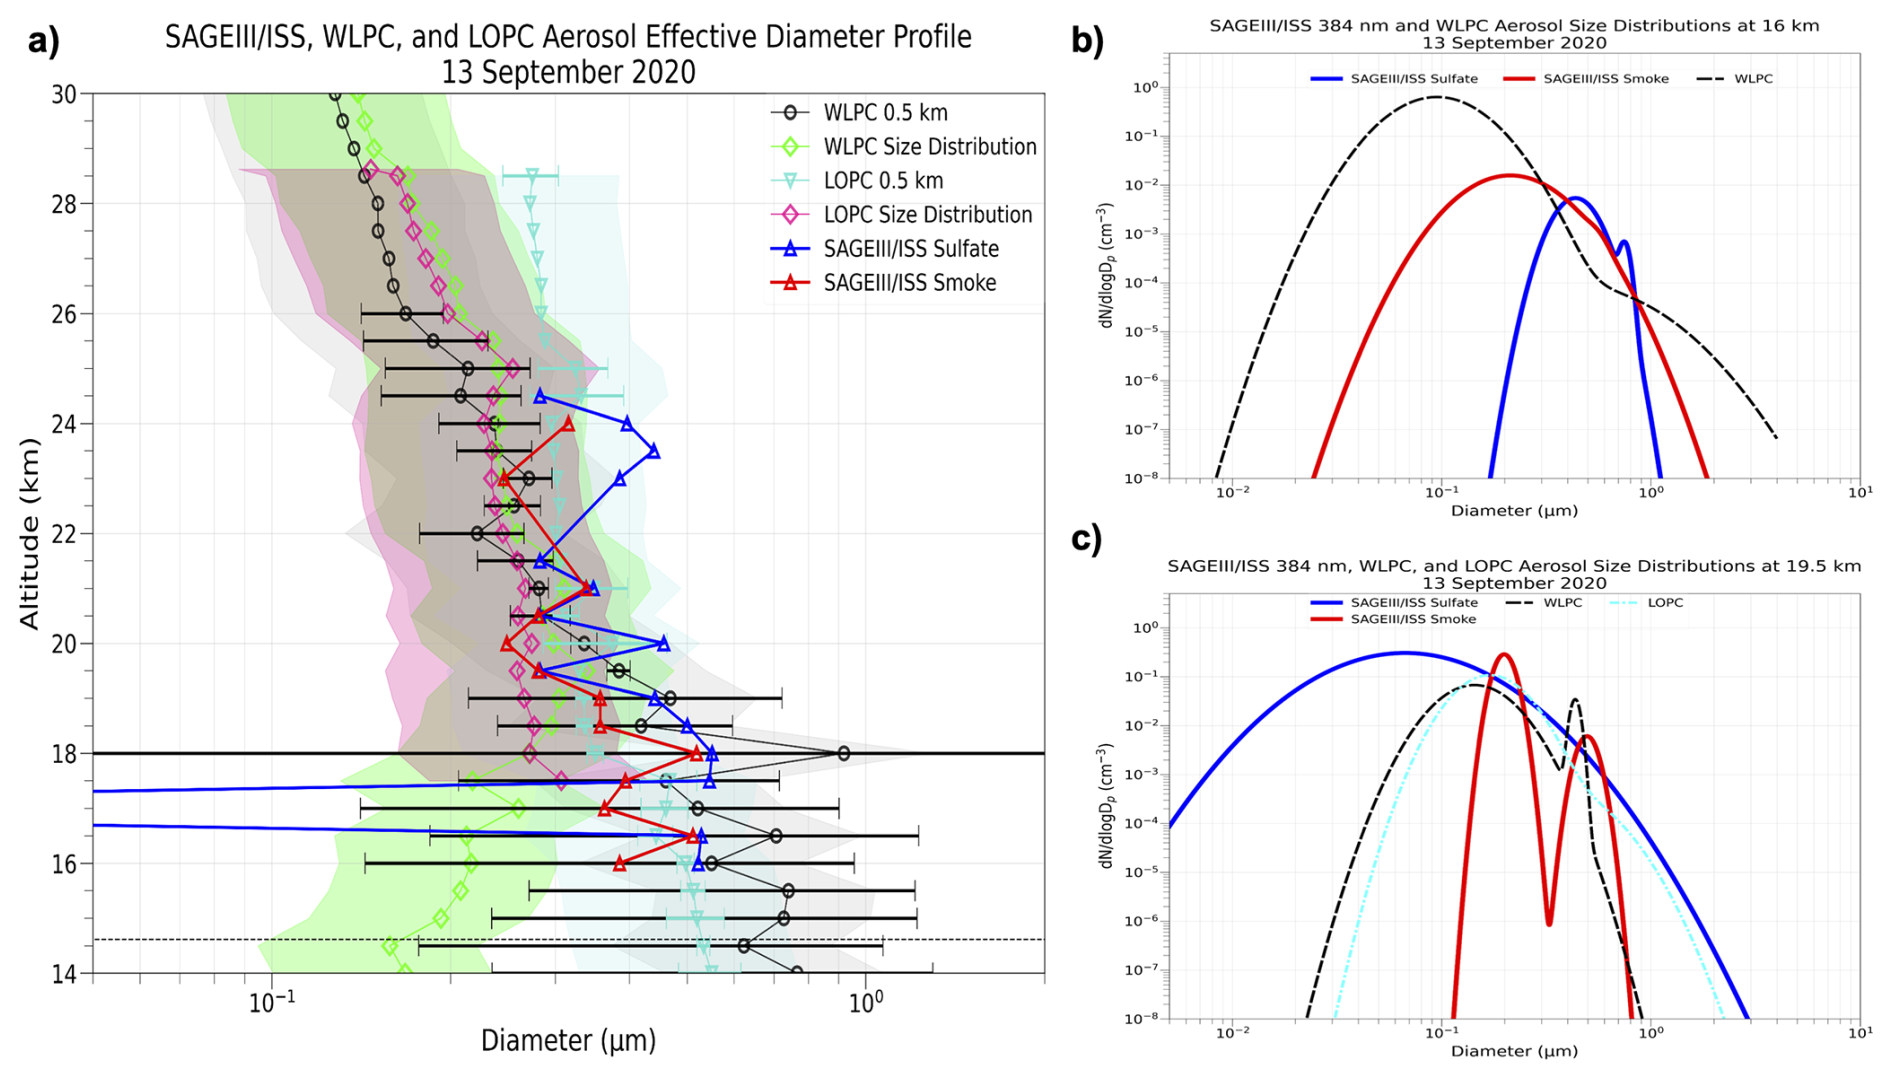
Figure 17SAGE III/ISS, WLPC, and LOPC (a) aerosol effective diameter (nm) from retrieved, measured, and fit data. SAGE III/ISS, WLPC, and LOPC aerosol size distributions (cm−3) at (b) 16 km and (c) 19.5 km from 13 September 2020. (a) OPC full resolution mean aerosol effective diameters at 0.5 km resolution (WLPC 0.5 km, LOPC 0.5 km) with error bars depicting standard deviation at this resolution. WLPC Size Distribution and LOPC Size Distribution use the publicly distributed size distribution fits of the measured aerosol concentrations for each instrument.
The UTLS below 18.5 km is modulated by smoke aerosols moderately enhancing aerosol size and optical and microphysical properties. SAGE III/ISS retrieved and WLPC/LOPC measured aerosol effective diameters range from 350–800 nm with most effective diameters larger than 400 nm over the collective instrument range (Fig. 17a). From 15–18 km, SAGE III/ISS retrieved dp, Fine range from 350–500 nm for sulfate aerosols and 100–400 nm for smoke aerosols, with OPC measured dp, Fine ranging from 100–200 nm (Figs. 17b and S2a–b). SAGE III/ISS retrieved dp, Coarse range from 400–800 nm, with good agreement between SAGE III/ISS and WLPC measurements within a constrained range (550–750 nm) at 16 km (Fig. 17b). SAGE III/ISS and WLPC/LOPC aerosol effective diameters at 16 km are ∼500 nm (Fig. 17a). WLPC measured aerosol effective diameters range from 500–750 nm in the lower stratosphere with high variance in the 0.5 km averaged altitude bins in smoke infiltrated layers, and with reduced values in the WLPC/LOPC measurement fit aerosol size distributions (Fig. 17a). SAGE III/ISS retrieved aerosol effective diameters range from 350–550 nm in the same altitude range and are in stronger agreement with LOPC measured aerosol effective diameters from 400–550 nm.
Stratospheric aerosols near the tropopause are larger in diameter by up to several hundred nanometers compared to the stratospheric layers above, where SAGE III/ISS retrieved aerosol effective diameters from 18.5–20.5 km range from 350–550 nm (Fig. 17a). SAGE III/ISS retrieved aerosol size distributions have dp, Fine near 100–250 nm and dp, Coarse from 400–550 nm in the higher altitude layers (Figs. 17c and S2c–d). At 19.5 km, WLPC/LOPC aerosol size distributions have dp, Fine near 200 nm (160–186 nm) and dp, Coarse of ∼400 nm (406–436 nm) (Fig. 17c). Most indications of the stratospheric aerosol layers well above the tropopause are sampling residual volcanic aerosols, and that aerosol sizes are reduced but with enhanced concentrations within the accumulation mode producing enhanced aerosol extinction, and near maximums in surface area and volume densities in the vertical profile from all instruments. Aerosol concentrations and extinction are reduced above 22 km as all instruments report a decline in aerosol properties as altitude increases. These values are indicative of background stratospheric aerosols, unperturbed by smoke or other pollutants.
6.1 Simulations of the Quiescent and Non–Quiescent Distribution for Sulfate and Smoke Aerosols
Aerosol size distributions retrieved from synthetic data are shown to resolve synthetic aerosol size distributions and aerosol properties for both sulfate and smoke aerosols in the quiescent sample. Retrieved γCoarse exhibit best agreement with the synthetic γCoarse in range from 0.1 %–10 % where there is significant coarse mode partitioning of total aerosol number concentrations. Angstrom exponents vary with increases in γCoarse larger than 0.1 %, are retrieved in close agreement with the synthetic dataset, and are used to define the relative contribution of fine and coarse mode aerosol to the total aerosol mixture. The retrieved number density is highly sensitive to assumptions of the aerosol size distribution and less robust to uncertainties in refractive index and particle shape. Retrieving aerosol number density in quiescent conditions continues to be challenging due to disproportional impacts of the small aerosol population on aerosol number, as opposed to surface area or volume density, which have negligible impacts on the extinction measurement.
Synthetic aerosol size distributions, modeled after a stratospheric perturbation, exhibit enhanced aerosol extinction, surface area, and volume density from background samples due to increases in aerosol size and enhancement of accumulation and coarse mode aerosol concentrations. Increases in γCoarse by several percent enhance these properties to more than double the original value. Retrieved aerosol size distributions for sulfate aerosols are in better agreement with the synthetic data, with better sensitivity to the coarse mode aerosol concentrations more than 1 µm, than smoke aerosols for most γCoarse. The retrieved sulfate aerosol size distributions are primarily unimodal, broad, and have distribution means near 350–500 nm. Retrieved smoke aerosol size distributions provide good agreement with synthetic aerosol properties for discrete ranges in synthetic γCoarse from 0.1 %–10 %. The retrieved smoke aerosol size distributions are in closest agreement with retrieval of a bimodal distribution, γCoarse ∼1 %, and with fine and coarse mode dp both enhanced in the accumulation mode, ∼400 and 600–900 nm, respectively. Retrieved smoke aerosol size distributions otherwise overestimate aerosol extinction due to incorrectly assuming the extinction is caused by a smaller number of large particles rather than a larger number of small particles, resulting in underestimated number densities and overestimated volume densities.
PyroCb aerosols have been measured to be larger than typical smoke aerosols at the point of emission, with size distributions in the UTLS from in situ measurement suggesting two distinct modes within the accumulation mode (Katich et al., 2023; Li et al., 2025; Asher et al., 2024). Aerosol mass is largely present in the large particle mode with diameters of more than 500 nm (Haarig et al., 2018; Ansmann et al., 2021, Ohneiser et al., 2021). Wildfire and pyroCb emissions may initially have narrow unimodal distributions in measurements of fresh smoke plumes. Microphysical interactions with time broaden the size distributions. The subsequent growth, transport, and dispersal of the injected aerosols over time further alter stratospheric aerosol properties with pyroCb smoke aerosols undergoing physicochemical aging along with mixing throughout the stratosphere.
Stratospheric OPC measurements and instrument validation efforts typically assume exclusively a sulfate aerosol composition to retrieve aerosol size resolved concentrations (Li et al., 2021; Kalnajs and Deshler, 2022). PyroCb aerosols following major events can have enhanced aerosol diameters and properties calculated using a smoke refractive index (Asher et al., 2024). Measures of the aerosol optical diameter will vary for sulfate and smoke aerosols and potentially lead to high variance in mixed aerosol layers. Forward simulated multispectral aerosol extinction coefficients vary per aerosol composition and are larger for smoke aerosols in the NIR. The differences in the forward simulated aerosol extinction coefficients for sulfate and smoke aerosols drive differences in the SAGE III/ISS retrieved aerosol microphysical properties. Retrieved aerosol optical and microphysical properties are found to be in close agreement for each aerosol composition. Agreement in the retrieved and synthetic aerosol properties show that the retrieval algorithm can be used to quantify aerosol properties in the stratosphere with assumptions of the aerosol composition and expectation of a diverse, polydisperse distribution.
6.2 Characteristics of the Retrieved Aerosol Size Distributions
Retrieved aerosol size distributions describe aerosol concentrations spanning the accumulation mode with sensitivity to ultrafine and coarse mode aerosol concentrations. Most retrieved distributions include median dp larger than 0.1 µm. The retrieved distributions are able to describe broad ranges of aerosol concentrations with similar resolution of the overall distribution shape as contemporary in situ measurements have shown. The range of the retrievable aerosol size distribution median diameters in simulations of the retrieval of bimodal lognormal distributions maxes out near 1 µm difference between dp, Fine and dp, Coarse. Challenges in resolving aerosol properties with distributions containing narrow σg coincide with instances where there may be a large difference between the fine and coarse mode dp. Retrieved dp and σg per mode see changes from the synthetic dataset values in a way that minimizes the error in the resolved aerosol properties described by the retrieved aerosol size distribution. These two parameters will undergo changes inversely, and for either mode, with retrieved values preserving the original distribution shape.
Aerosol extinction produced by a bimodal lognormal aerosol size distribution can oftentimes be attributed to a primary, optically significant mode of the distribution over a less significant, secondary mode; the primary/secondary mode can manifest as either fine/coarse or coarse/fine. The weight of fine and coarse mode aerosol concentrations are expressed in the Angstrom exponent, which is used to identify the modal properties of the sample aerosol size distribution through direct retrieval of γCoarse. Forward simulated aerosol extinction ratios and Angstrom exponent spectra dynamically vary for permutations of γCoarse, and the fine and coarse modes of the bimodal lognormal distribution. While good agreement in retrieved and synthetic γCoarse is shown in some instances, and here for large γCoarse, the retrieval of γCoarse is more prone to error while the retrieved aerosol microphysical properties are not. Testing of the retrieval algorithm reveals that large synthetic γCoarse values can possibly cause oscillations in the retrieved values for some aerosol size distributions. Mie theory can produce resonant oscillations in extinction coefficients with increasing particle diameters (Todt et al., 2023; Mei et al., 2020). Oscillations in retrieved aerosol size distribution parameters occur with increases in γCoarse over 0.01 %, with most increases beginning near 0.1 %–1 % and greater. Some retrieved aerosol size distributions show oscillations only beginning near to the retrieval γCoarse limit of 10 % with enhancement of retrieved aerosol diameters and broad σg, Coarse.
The distribution mean aerosol extinction cross section helps to integrate the size, composition, and spectral variances of the aerosol extinction measurement when calculating the total aerosol number for the retrieved aerosol size distribution. Retrieving unimodal distributions for ambient bimodal distributions from occultation methods may lead to underestimations of the number density (von Savigny and Hoffmann, 2020). Retrieved number densities for bimodal lognormal distributions have less pronounced negative bias, shown for large γCoarse here, showing potential for significant boosts to the accuracy of the retrieved aerosol size distributions through better solution of the mean aerosol extinction cross section. Including an additional mode can potentially better parameterize the shape of the overall size distribution, increase resolution of the individual modes, and cover a broader range of aerosol concentrations. Aerosol number density can still be underestimated due to poor construction of the retrieved aerosol size distribution, potential biases in the extinction measurement towards larger aerosol diameters, and underlying assumptions in aerosol size, shape, and composition. A strict bounded range of the aerosol extinction prior to the inversion limits retrieval uncertainties. Resolving the aerosol size distribution centers, shape, and range proves to conserve agreement in the synthetic and retrieved aerosol microphysical properties.
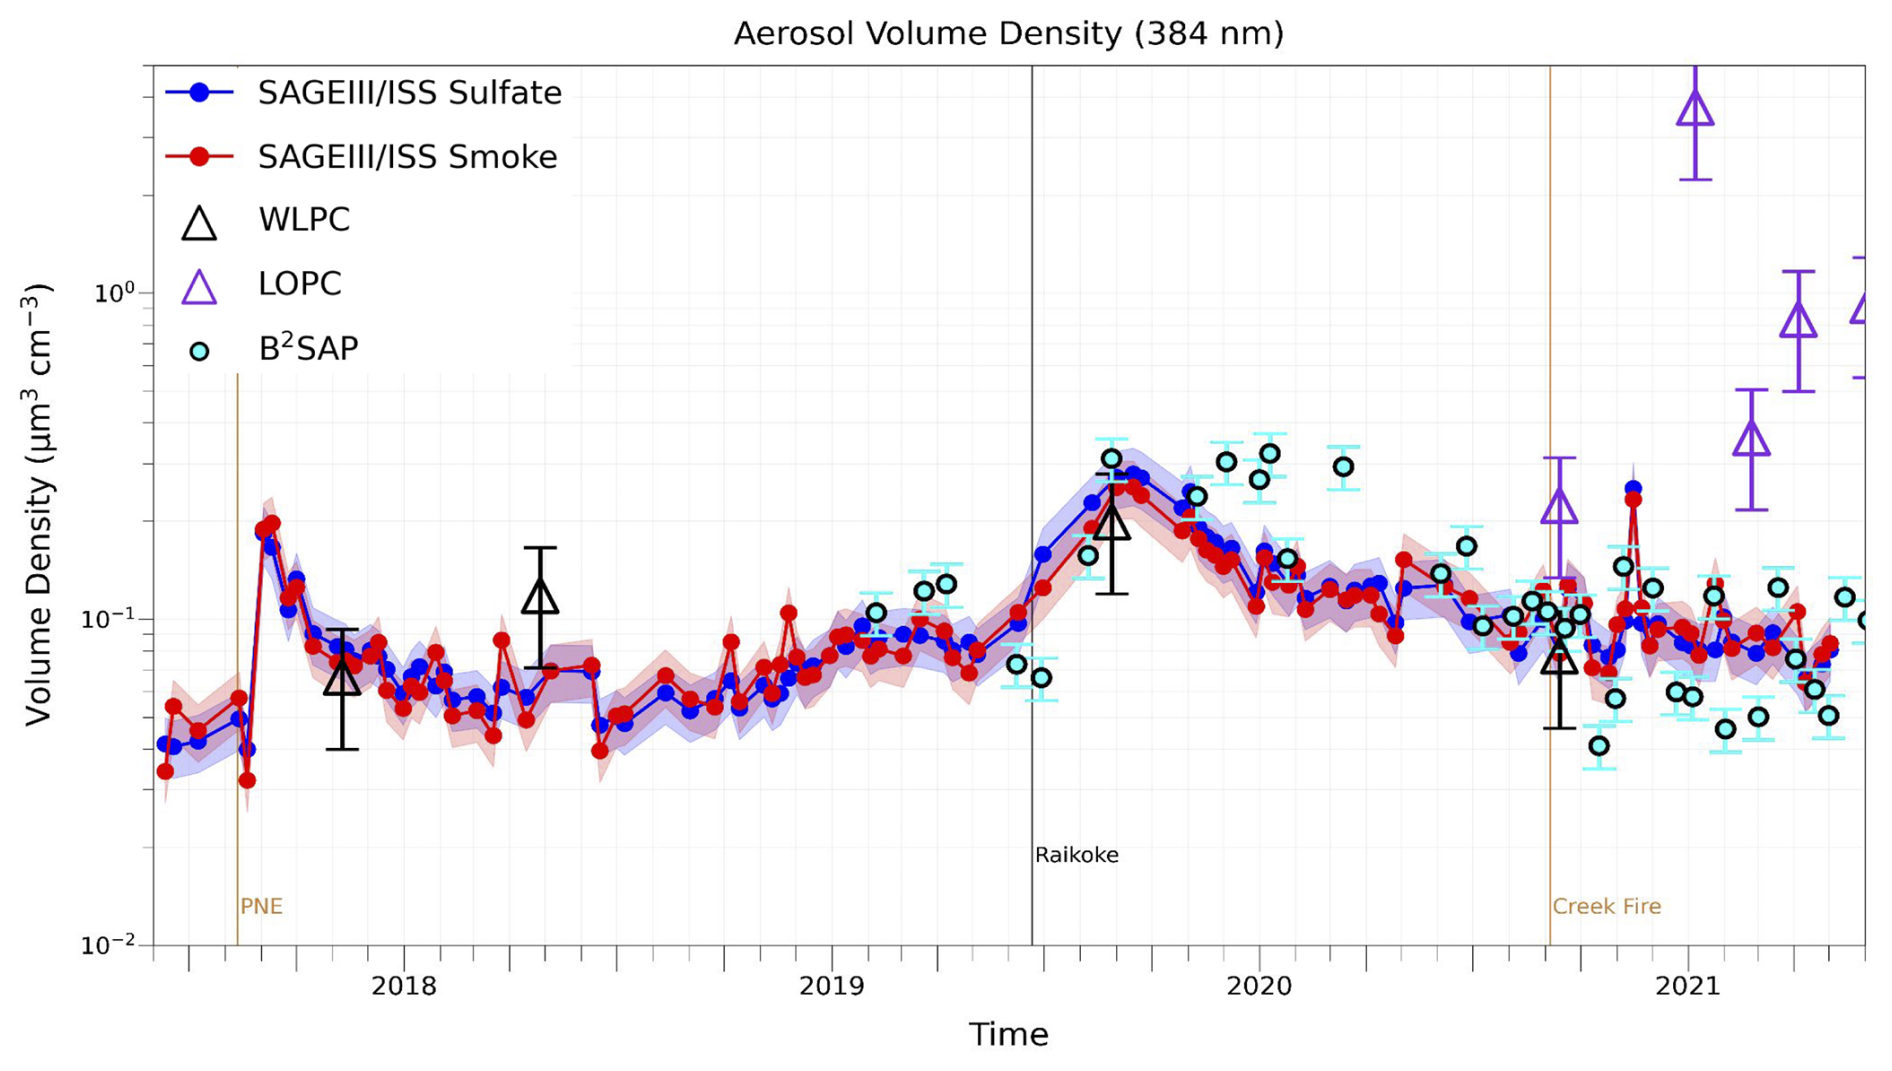
Figure 18SAGE III/ISS and in situ measured mean aerosol volume densities in the northern hemisphere midlatitudes (40–50° N) from 10–30 km altitude over a four year span.
6.3 Applicability to SAGE III/ISS Dataset
SAGE III/ISS and in situ measurements over a four year period from 2017–2021 observe several instances of stratospheric perturbations from volcanic and pyroCb activity in the northern hemisphere midlatitudes (40–50° N) (Fig. 18). In situ measurements are taken from Laramie, WY and Boulder, CO from University of Wyoming (WLPC), the Laboratory of Atmospheric Space and Physics, University of Colorado Boulder (LOPC), and NOAA's Balloon Based Stratospheric Aerosol Profiles (B2SAP), respectively. The most notable perturbation events in this hemisphere during this time are the 2017 pyroCb events in western North America including the 2017 PNE event, and the 2019 Raikoke eruption. PyroCb occur in Canada, Asia, and the United States annually and can contribute to enhancement of stratospheric aerosol layers in the northern hemisphere. Intense wildfires in the boreal region can also loft wildfire smoke into the UTLS (Ohneiser et al., 2021; Ansmann et al., 2024; Khaykin et al., 2025).
Stratospheric aerosol optical depth (sAOD) in the UTLS up to 30 km following the 2017 PNE and 2019 Raikoke eruptions increase by 2–3 times the semi–quiescent periods observed prior to the events, perturbing aerosol properties in the northern hemisphere stratosphere over long periods of time (Khaykin et al., 2024; Kloss et al., 2021; Yu et al., 2019). SAGE III/ISS sAOD in the midlatitude zonal band is in strong agreement with in situ measurements made over this time period, with agreement extending to measures of the aerosol microphysical properties. Figure 18 shows enhancements of mean stratospheric aerosol volume density following numerous volcanic and pyroCb events, with peak values reaching ∼0.2–0.3 µm3 cm−3 closely following the 2017 PNE and 2019 Raikoke events. Error bars and shading indicate uncertainty range of the in situ and satellite averages, respectively. Inherent instrument sensitivities and spatiotemporal differences in the sampled air mass produce differences in the satellite and in situ measurements. Large increases in mean aerosol volume density, surface area density, and effective diameter are observed over background semi–quiescent conditions. Maximum aerosol surface area densities range from 1–5 µm2 cm−3 and volume densities from 0.1–0.25 µm3 cm−3 in the stratosphere. Aerosol effective diameters increase following the most stratospheric impactful events with column averaged diameters reaching 400–600 nm and size distributions shifting towards increased sizes and concentrations of optically impactful aerosol. Overall strong agreement is shown in the in situ measured and satellite retrieved data with robust retrievals of stratospheric aerosol properties for sulfate and smoke samples.
The 2017 PNE enhanced aerosol optical and microphysical properties in the northern hemisphere midlatitude lower stratosphere, peaking in the lower stratosphere up to a height of 20–22 km, for nearly 10 months with aerosol size distributions described by significant accumulation mode aerosol concentrations. PyroCb enhanced aerosol concentrations sampled with coincident in situ measurements ∼2 months after the pyroCb events produced relatively strong enhancements of the aerosol extinction, surface area, and volume density in the lower stratosphere along with reduced measures of the Angstrom exponent. SAGE III/ISS initially measures strong enhancements of aerosol properties following the pyroCb events. Transport and self-lofting of smoke aerosols spatially redistribute and increase the height of the smoke layers in the northern hemisphere stratosphere (Torres et al., 2020; Yu et al., 2019). Stratospheric aging and sedimentation further alter smoke aerosol concentrations following their injection into the stratosphere (Baars et al., 2019). Initial coincident observations between SAGE III/ISS and WLPC report decreases in smoke aerosol properties and are likely characteristic of semidiluted stratospheric aerosol layers. Coincident samples more than eight months after the initial 2017 pyroCb events report decreases in aerosol optical and microphysical properties of more than 40 % with aerosol concentrations diminished.
The relative impacts to the lower stratosphere from the 2020 pyroCb events with close spatiotemporal proximity to their injection are subdued in comparison to the 2017 PNE and 2019 Raikoke events and other major pyroCb and volcanic events globally. Moderate enhancements of the aerosol properties in the lower stratosphere in late 2020 are likely impacts from the large scale wildfire activity and pyroCb events during this time period, increasing fine and coarse mode aerosol concentrations in the lower stratosphere and contributing to increased aerosol diameters in the lowermost stratosphere. For in situ and coincident SAGE III/ISS observations taken in 2017 and 2020 after North American pyroCb events, stratospheric smoke embedded layers describe a distribution with dp, Fine approximately 200–400 nm and a secondary, coarse mode with dp, Coarse 500–800 nm. Peak aerosol size and concentration enhancements in lower stratospheric smoke samples are larger following the 2017 PNE.
Major pyroCb and volcanic events alter lower stratospheric aerosol size distributions with increases in aerosol effective diameter and aerosol optical and microphysical properties which strongly impact stratospheric chemistry, radiative budget, and processes over time. Retrieved aerosol size distributions and properties from SAGE III/ISS observations demonstrate sensitivity to stratospheric aerosols in various conditions on an individual profile and global scale.
The stratospheric aerosol size distribution is commonly defined using a lognormal distribution with up to two modes and is variable in space and time. Stratospheric aerosol optical properties are inherently related to variations in the stratospheric aerosol size distribution and composition. The retrieval algorithm described here assesses the intrinsic spectral properties of the SAGE III/ISS observed aerosol layer to infer the aerosol size distribution. Retrieval performance is expected to depend on how well the overall size distribution shape, centers, and range are resolved.
Aerosol size distribution retrievals are performed using synthetic SAGE III/ISS aerosol extinction data under background or perturbed conditions. Aerosol optical and microphysical properties vary based on the parameterization of the bimodal lognormal size distribution with each aerosol property determined to change with increases in γCoarse. γCoarse larger than 0.1 %–1 % alter aerosol properties for most distributions. The distribution γCoarse is retrieved using the inherent spectral properties of the aerosol sample, with good performance when γCoarse increases to more than 0.1 % but prone to errors at low γCoarse. The retrieved aerosol size distribution and distribution moments show good resolution of the aerosol properties in agreement with the synthetic dataset for each composition. von Savigny and Hoffmann (2020) conclude that occultation instruments will retrieve lower number densities for unimodal retrievals of ambient bimodal size distributions. We suggest that retrieving the bimodal lognormal aerosol size distribution using the described retrieval algorithm provides reasonable estimates of the distribution mean extinction cross section and total aerosol number, conserving agreement in the retrieved and synthetic aerosol microphysical distributions. Retrieved aerosol number density may still exhibit a low bias as a limitation of the initial measurement and assumptions used to retrieve the aerosol size distribution. Retrieved aerosol size distributions from synthetic SAGE III/ISS data are shown to resolve aerosol concentrations over the ultrafine, fine, and coarse modes with peak sensitivity to aerosol concentrations in the accumulation mode.
Historical stratospheric aerosol sampling has been limited to largely measures of sulfate aerosols in background or volcanically perturbed instances. In contrast, the modern lower stratosphere is composed largely of sulfate with increasingly larger percentages of black and brown carbon aerosols following pyroCb events (Katich et al., 2023; Murphy et al., 2021). Observations of stratospheric sulfate or smoke will have distinguishing spectral variance and varying aerosol size distributions. SAGE III/ISS retrieved aerosol size distributions of stratospheric smoke following pyroCb events in the northern hemisphere sampled here display two modes with dp, Fine approximately 200–400 nm and dp, Coarse 500–800 nm. Lower stratospheric observations following the 2017 PNE produce the largest increases in aerosol diameters in these ranges, which increases SAGE III/ISS observed aerosol optical properties and retrieved microphysical properties initially following the event and over the next 8 months.
Stratospheric aerosol layers display stratification of aerosol optical and microphysical properties in the vertical profile with the increased aerosol loading and enhanced size distributions in the UTLS following pyroCb events. The relative increases in stratospheric aerosol diameter, and surface area and volume density, associated with the pyroCb events can produce long term, hemispheric–scale impacts to stratospheric equilibria. For each sample, determination of the enhanced aerosol size distribution moments are critically based on retrieval of the aerosol size distribution, which show strong agreement with in situ measurements.
Aerosol size distribution retrievals conducted using synthetic and observational SAGE III/ISS measurements display high sensitivity to the majority of optically and physically impactful aerosols. The retrieval algorithm is able to produce aerosol size distributions from SAGE III/ISS observations while demonstrating the capability to resolve aerosol optical and microphysical properties for the dominant aerosol compositions and concentrations in the stratosphere. The retrieval method uncertainties are contained within a strict bounded range of the SAGE III/ISS observational uncertainty in the lower stratosphere. Stratospheric aerosol size distributions are otherwise infrequently sampled but can provide key insights into aerosol properties and aerosol microphysical processing in the stratosphere. A global utility resolving stratospheric aerosol size distributions will help constrain the uncertainties in the aerosol size distribution of pyroCb aerosols and their role in weather and climate.
SAGE III/ISS level 2 solar occultation aerosol data products version 6.0 are provided by the SAGE III/ISS mission and available from the NASA LaRC ASDC archive from (https://doi.org/10.5067/ISS/SAGEIII/SOLAR_NetCDF4_L2-V6.0, NASA/LARC/SD/ASDC, 2025). OPC data is provided and maintained by the University of Wyoming stratospheric aerosol group with data access available from (https://doi.org/10.15786/WYOSCHOLAR/9897, Deshler, 2023). B2SAP data is made available through the NOAA data repository at https://csl.noaa.gov/projects/b2sap/data.html (last access: 12 February 2026). SAGE III/ISS, OPC, and B2SAP datasets include aerosol, geolocation, and meteorological data. OPAC aerosol refractive indices for aerosol components are maintained and made available from the GEISA (Gestion et Etude des Informations Spectroscopiques Atmosphériques: Management and Study of Atmospheric Spectroscopic Information) spectroscopic database, managed and maintained by l'Institut polytechnique de Paris/Institut Pierre Simon Laplace, with database access available from (https://geisa.aeris-data.fr/opac/, last access: 9 March 2025).
The supplement related to this article is available online at https://doi.org/10.5194/amt-19-6991-2026-supplement.
The individual contributions of the authors are: Methodology, software, formal analysis, investigation, validation, writing (original draft preparation) VB; investigation, formal analysis, funding acquisition, project administration, supervision, writing (review and editing) CL.
The contact author has declared that none of the authors has any competing interests.
Publisher's note: Copernicus Publications remains neutral with regard to jurisdictional claims made in the text, published maps, institutional affiliations, or any other geographical representation in this paper. The authors bear the ultimate responsibility for providing appropriate place names. Views expressed in the text are those of the authors and do not necessarily reflect the views of the publisher.
We thank Dr. Shih-Wei Wei from University at Albany, State University of New York, Albany, USA for his internal review. We acknowledge the University of Wyoming and Laboratory for Atmospheric and Space Physics (LASP) at the University of Colorado Boulder for providing WLPC and LOPC balloon-borne measurements. We also acknowledge the NOAA Chemical Sciences Laboratory (CSL) and the NOAA Global Monitoring Laboratory (GML) for providing the B2SAP balloon profile data. In addition, we acknowledge the SAGE III/ISS Project Team and Atmospheric Science Data Center at NASA Langley Research Center for providing the SAGE III/ISS data products.
This research has been supported by the National Aeronautics and Space Administration (grant no. 80NSSC24K1183).
This paper was edited by Sandip Dhomse and reviewed by two anonymous referees.
Ångström, A.: On the Atmospheric Transmission of Sun Radiation and on Dust in the Air, Geogr. Ann., 11, 156–166, https://doi.org/10.1080/20014422.1929.11880498, 1929.
Ångström, A.: On the Atmospheric Transmission of Sun Radiation, II, Geogr. Ann., 12, 130–159, https://doi.org/10.1080/20014422.1930.11880522, 1930.
Ansmann, A., Baars, H., Chudnovsky, A., Mattis, I., Veselovskii, I., Haarig, M., Seifert, P., Engelmann, R., and Wandinger, U.: Extreme levels of Canadian wildfire smoke in the stratosphere over central Europe on 21–22 August 2017, Atmos. Chem. Phys., 18, 11831–11845, https://doi.org/10.5194/acp-18-11831-2018, 2018.
Ansmann, A., Ohneiser, K., Mamouri, R.-E., Knopf, D. A., Veselovskii, I., Baars, H., Engelmann, R., Foth, A., Jimenez, C., Seifert, P., and Barja, B.: Tropospheric and stratospheric wildfire smoke profiling with lidar: mass, surface area, CCN, and INP retrieval, Atmos. Chem. Phys., 21, 9779–9807, https://doi.org/10.5194/acp-21-9779-2021, 2021.
Ansmann, A., Ohneiser, K., Chudnovsky, A., Knopf, D. A., Eloranta, E. W., Villanueva, D., Seifert, P., Radenz, M., Barja, B., Zamorano, F., Jimenez, C., Engelmann, R., Baars, H., Griesche, H., Hofer, J., Althausen, D., and Wandinger, U.: Ozone depletion in the Arctic and Antarctic stratosphere induced by wildfire smoke, Atmos. Chem. Phys., 22, 11701–11726, https://doi.org/10.5194/acp-22-11701-2022, 2022.
Ansmann, A., Veselovskii, I., Ohneiser, K., and Chudnovsky, A.: Comment on “Stratospheric Aerosol Composition Observed by the Atmospheric Chemistry Experiment Following the 2019 Raikoke Eruption” by Boone et al., J. Geophys. Res.-Atmos., 129, e2022JD038080, https://doi.org/10.1029/2022JD038080, 2024.
Asher, E., Baron, A., Yu, P., Todt, M., Smale, P., Liley, B., Querel, R., Sakai, T., Morino, I., Jin, Y., Nagai, T., Uchino, O., Hall, E., Cullis, P., Johnson, B., and Thornberry, T. D.: Balloon Baseline Stratospheric Aerosol Profiles (B2 SAP)–Perturbations in the Southern Hemisphere, 2019–2022, J. Geophys. Res.-Atmos., 129, e2024JD041581, https://doi.org/10.1029/2024JD041581, 2024.
Baars, H., Radenz, M., Floutsi, A. A., Engelmann, R., Althausen, D., Heese, B., Ansmann, A., Flament, T., Dabas, A., Trapon, D., Reitebuch, O., Bley, S., and Wandinger, U.: Californian Wildfire Smoke Over Europe: A First Example of the Aerosol Observing Capabilities of Aeolus Compared to Ground-Based Lidar, Geophys. Res. Lett., 48, e2020GL092194, https://doi.org/10.1029/2020GL092194, 2021.
Baars, H., Ansmann, A., Ohneiser, K., Haarig, M., Engelmann, R., Althausen, D., Hanssen, I., Gausa, M., Pietruczuk, A., Szkop, A., Stachlewska, I. S., Wang, D., Reichardt, J., Skupin, A., Mattis, I., Trickl, T., Vogelmann, H., Navas-Guzmán, F., Haefele, A., Acheson, K., Ruth, A. A., Tatarov, B., Müller, D., Hu, Q., Podvin, T., Goloub, P., Veselovskii, I., Pietras, C., Haeffelin, M., Fréville, P., Sicard, M., Comerón, A., Fernández García, A. J., Molero Menéndez, F., Córdoba-Jabonero, C., Guerrero-Rascado, J. L., Alados-Arboledas, L., Bortoli, D., Costa, M. J., Dionisi, D., Liberti, G. L., Wang, X., Sannino, A., Papagiannopoulos, N., Boselli, A., Mona, L., D'Amico, G., Romano, S., Perrone, M. R., Belegante, L., Nicolae, D., Grigorov, I., Gialitaki, A., Amiridis, V., Soupiona, O., Papayannis, A., Mamouri, R.-E., Nisantzi, A., Heese, B., Hofer, J., Schechner, Y. Y., Wandinger, U., and Pappalardo, G.: The unprecedented 2017–2018 stratospheric smoke event: decay phase and aerosol properties observed with the EARLINET, Atmos. Chem. Phys., 19, 15183–15198, https://doi.org/10.5194/acp-19-15183-2019, 2019.
Beeler, P., Kumar, J., Schwarz, J. P., Adachi, K., Fierce, L., Perring, A. E., Katich, J. M., and Chakrabarty, R. K.: Light absorption enhancement of black carbon in a pyrocumulonimbus cloud, Nat. Commun., 15, 6243, https://doi.org/10.1038/s41467-024-50070-0, 2024.
Bernath, P., Bhusal, M., Lecours, M., and Boone, C.: Global Characterization of Stratospheric Sulfate Aerosols by the Atmospheric Chemistry Experiment (ACE), J. Geophys. Res.-Atmos., 131, e2025JD046214, https://doi.org/10.1029/2025JD046214, 2026.
Bernath, P. F.: The Atmospheric Chemistry Experiment (ACE), J. Quant. Spectrosc. Ra., 186, 3–16, https://doi.org/10.1016/j.jqsrt.2016.04.006, 2017.
Bernath, P. F., McElroy, C. T., Abrams, M. C., Boone, C. D., Butler, M., Camy-Peyret, C., Carleer, M., Clerbaux, C., Coheur, P. -F., Colin, R., DeCola, P., DeMazière, M., Drummond, J. R., Dufour, D., Evans, W. F. J., Fast, H., Fussen, D., Gilbert, K., Jennings, D. E., Llewellyn, E. J., Lowe, R. P., Mahieu, E., McConnell, J. C., McHugh, M., McLeod, S. D., Michaud, R., Midwinter, C., Nassar, R., Nichitiu, F., Nowlan, C., Rinsland, C. P., Rochon, Y. J., Rowlands, N., Semeniuk, K., Simon, P., Skelton, R., Sloan, J. J., Soucy, M. -A., Strong, K., Tremblay, P., Turnbull, D., Walker, K. A., Walkty, I., Wardle, D. A., Wehrle, V., Zander, R., and Zou, J.: Atmospheric Chemistry Experiment (ACE): Mission overview, Geophys. Res. Lett., 32, 2005GL022386, https://doi.org/10.1029/2005GL022386, 2005.
Bhatta, S., Pandit, A. K., Loughman, R. P., and Vernier, J.-P.: Three-wavelength approach for aerosol-cloud discrimination in the SAGE III/ISS aerosol extinction dataset, Appl. Opt., 62, 3454, https://doi.org/10.1364/AO.485466, 2023.
Bhusal, M., Boone, C. D., Bernath, P. F., Lecours, M., and Petera, L.: Variation in composition and size distribution of stratospheric sulfate aerosol derived from Atmospheric Chemistry Experiment (ACE), J. Quant. Spectrosc. Ra., 362, 110012, https://doi.org/10.1016/j.jqsrt.2026.110012, 2026.
Bingen, C., Vanhellemont, F., and Fussen, D.: A new regularized inversion method for the retrieval of stratospheric aerosol size distributions applied to 16 years of SAGE II data (1984–2000): method, results and validation, Ann. Geophys., 21, 797–804, https://doi.org/10.5194/angeo-21-797-2003, 2003.
Bingen, C., Fussen, D., and Vanhellemont, F.: A global climatology of stratospheric aerosol size distribution parameters derived from SAGE II data over the period 1984–2000: 1. Methodology and climatological observations, J. Geophys. Res., 109, 2003JD003518, https://doi.org/10.1029/2003JD003518, 2004.
Bohren, C. F. and Huffman, D. R.: Absorption and scattering of light by small particles, Wiley-VCH, https://doi.org/10.1002/9783527618156, 1998.
Boone, C. D., Bernath, P. F., Pastorek, A., and Lecours, M.: Sulfate aerosol properties derived from combining coincident ACE-FTS and SAGE III/ISS measurements, J. Quant. Spectrosc. Ra., 312, 108815, https://doi.org/10.1016/j.jqsrt.2023.108815, 2024.
Bourassa, A. E., Degenstein, D. A., and Llewellyn, E. J.: Retrieval of stratospheric aerosol size information from OSIRIS limb scattered sunlight spectra, Atmos. Chem. Phys., 8, 6375–6380, https://doi.org/10.5194/acp-8-6375-2008, 2008.
Bourassa, A. E., Rieger, L. A., Zawada, D. J., Khaykin, S., Thomason, L. W., and Degenstein, D. A.: Satellite Limb Observations of Unprecedented Forest Fire Aerosol in the Stratosphere, J. Geophys. Res.-Atmos., 124, 9510–9519, https://doi.org/10.1029/2019JD030607, 2019.
Chen, Z., Bhartia, P. K., Loughman, R., Colarco, P., and DeLand, M.: Improvement of stratospheric aerosol extinction retrieval from OMPS/LP using a new aerosol model, Atmos. Meas. Tech., 11, 6495–6509, https://doi.org/10.5194/amt-11-6495-2018, 2018.
Christian, K., Yorks, J., and Das, S.: Differences in the Evolution of Pyrocumulonimbus and Volcanic Stratospheric Plumes as Observed by CATS and CALIOP Space-Based Lidars, Atmosphere, 11, 1035, https://doi.org/10.3390/atmos11101035, 2020.
Chu, W. P. and McCormick, M. P.: Inversion of stratospheric aerosol and gaseous constituents from spacecraft solar extinction data in the 038–10-μm wavelength region, Appl. Optics, 18, 1404, https://doi.org/10.1364/AO.18.001404, 1979.
D'Angelo, G., Guimond, S., Reisner, J., Peterson, D. A., and Dubey, M.: Contrasting Stratospheric Smoke Mass and Lifetime From 2017 Canadian and 2019/2020 Australian Megafires: Global Simulations and Satellite Observations, J. Geophys. Res.-Atmos., 127, e2021JD036249, https://doi.org/10.1029/2021JD036249, 2022.
Das, S., Colarco, P. R., Oman, L. D., Taha, G., and Torres, O.: The long-term transport and radiative impacts of the 2017 British Columbia pyrocumulonimbus smoke aerosols in the stratosphere, Atmos. Chem. Phys., 21, 12069–12090, https://doi.org/10.5194/acp-21-12069-2021, 2021.
Deshler, T.: A review of global stratospheric aerosol: Measurements, importance, life cycle, and local stratospheric aerosol, Atmos. Res., 90, 223–232, https://doi.org/10.1016/j.atmosres.2008.03.016, 2008.
Deshler, T.: Mid Latitude – University of Wyoming Stratospheric Aerosol Measurements, V2, Wyoming Data Repository [data set], https://doi.org/10.15786/WYOSCHOLAR/9897, 2023.
Deshler, T., Hervig, M. E., Hofmann, D. J., Rosen, J. M., and Liley, J. B.: Thirty years of in situ stratospheric aerosol size distribution measurements from Laramie, Wyoming (41° N), using balloon-borne instruments, J. Geophys. Res., 108, 2002JD002514, https://doi.org/10.1029/2002JD002514, 2003.
Haarig, M., Ansmann, A., Baars, H., Jimenez, C., Veselovskii, I., Engelmann, R., and Althausen, D.: Depolarization and lidar ratios at 355, 532, and 1064 nm and microphysical properties of aged tropospheric and stratospheric Canadian wildfire smoke, Atmos. Chem. Phys., 18, 11847–11861, https://doi.org/10.5194/acp-18-11847-2018, 2018.
Hess, M., Koepke, P., and Schult, I.: Optical Properties of Aerosols and Clouds: The Software Package OPAC, B. Am. Meteor. Soc., 79, 831–844, https://doi.org/10.1175/1520-0477(1998)079<0831:OPOAAC>2.0.CO;2, 1998.
Hu, Q., Goloub, P., Veselovskii, I., and Podvin, T.: The characterization of long-range transported North American biomass burning plumes: what can a multi-wavelength Mie–Raman-polarization-fluorescence lidar provide?, Atmos. Chem. Phys., 22, 5399–5414, https://doi.org/10.5194/acp-22-5399-2022, 2022.
Junge, C. E., Chagnon, C. W., and Manson, J. E.: A World-wide Stratospheric Aerosol Layer, Science, 133, 1478–1479, https://doi.org/10.1126/science.133.3463.1478.b, 1961.
Kalnajs, L. E. and Deshler, T.: A New Instrument for Balloon-Borne In Situ Aerosol Size Distribution Measurements, the Continuation of a 50 Year Record of Stratospheric Aerosols Measurements, J. Geophys. Res.-Atmos., 127, e2022JD037485, https://doi.org/10.1029/2022JD037485, 2022.
Katich, J. M., Apel, E. C., Bourgeois, I., Brock, C. A., Bui, T. P., Campuzano-Jost, P., Commane, R., Daube, B., Dollner, M., Fromm, M., Froyd, K. D., Hills, A. J., Hornbrook, R. S., Jimenez, J. L., Kupc, A., Lamb, K. D., McKain, K., Moore, F., Murphy, D. M., Nault, B. A., Peischl, J., Perring, A. E., Peterson, D. A., Ray, E. A., Rosenlof, K. H., Ryerson, T., Schill, G. P., Schroder, J. C., Weinzierl, B., Thompson, C., Williamson, C. J., Wofsy, S. C., Yu, P., and Schwarz, J. P.: Pyrocumulonimbus affect average stratospheric aerosol composition, Science, 379, 815–820, https://doi.org/10.1126/science.add3101, 2023.
Khaykin, S., Legras, B., Bucci, S., Sellitto, P., Isaksen, L., Tencé, F., Bekki, S., Bourassa, A., Rieger, L., Zawada, D., Jumelet, J., and Godin-Beekmann, S.: The 2019/20 Australian wildfires generated a persistent smoke-charged vortex rising up to 35 km altitude, Commun. Earth Environ., 1, 22, https://doi.org/10.1038/s43247-020-00022-5, 2020.
Khaykin, S., Taha, G., LeBlanc, T., Sakai, T., Morino, I., Liley, B., and Godin-Beekmann, S.: Stratospheric aerosols, in: State of the Climate in 2023, B. Am. Meteorol. Soc., 105, S96–S98, https://doi.org/10.1175/BAMS-D-24-0116.1, 2024.
Khaykin, S., Bekki, S., Godin-Beekmann, S., Fromm, M. D., Goloub, P., Hu, Q., Josse, B., Laeng, A., Meziane, M., Peterson, D. A., Pelletier, S., and Thouret, V.: Stratospheric impact of the anomalous 2023 Canadian wildfires: the two vertical pathways of smoke, Atmos. Chem. Phys., 25, 14551–14571, https://doi.org/10.5194/acp-25-14551-2025, 2025.
Kloss, C., Berthet, G., Sellitto, P., Ploeger, F., Taha, G., Tidiga, M., Eremenko, M., Bossolasco, A., Jégou, F., Renard, J.-B., and Legras, B.: Stratospheric aerosol layer perturbation caused by the 2019 Raikoke and Ulawun eruptions and their radiative forcing, Atmos. Chem. Phys., 21, 535–560, https://doi.org/10.5194/acp-21-535-2021, 2021.
Knepp, T. N., Thomason, L., Kovilakam, M., Tackett, J., Kar, J., Damadeo, R., and Flittner, D.: Identification of smoke and sulfuric acid aerosol in SAGE III/ISS extinction spectra, Atmos. Meas. Tech., 15, 5235–5260, https://doi.org/10.5194/amt-15-5235-2022, 2022.
Knepp, T. N., Kovilakam, M., Thomason, L., and Miller, S. J.: Characterization of stratospheric particle size distribution uncertainties using SAGE II and SAGE III/ISS extinction spectra, Atmos. Meas. Tech., 17, 2025–2054, https://doi.org/10.5194/amt-17-2025-2024, 2024.
Kovilakam, M. and Deshler, T.: On the accuracy of stratospheric aerosol extinction derived from in situ size distribution measurements and surface area density derived from remote SAGE II and HALOE extinction measurements, J. Geophys. Res.-Atmos., 120, 8426–8447, https://doi.org/10.1002/2015JD023303, 2015.
Kovilakam, M., Thomason, L. W., Ernest, N., Rieger, L., Bourassa, A., and Millán, L.: The Global Space-based Stratospheric Aerosol Climatology (version 2.0): 1979–2018, Earth Syst. Sci. Data, 12, 2607–2634, https://doi.org/10.5194/essd-12-2607-2020, 2020.
Kovilakam, M., Thomason, L., and Knepp, T.: SAGE III/ISS aerosol/cloud categorization and its impact on GloSSAC, Atmos. Meas. Tech., 16, 2709–2731, https://doi.org/10.5194/amt-16-2709-2023, 2023.
Kremser, S., Thomason, L. W., Von Hobe, M., Hermann, M., Deshler, T., Timmreck, C., Toohey, M., Stenke, A., Schwarz, J. P., Weigel, R., Fueglistaler, S., Prata, F. J., Vernier, J.-P., Schlager, H., Barnes, J. E., Antuña-Marrero, J.-C., Fairlie, D., Palm, M., Mahieu, E., Notholt, J., Rex, M., Bingen, C., Vanhellemont, F., Bourassa, A., Plane, J. M. C., Klocke, D., Carn, S. A., Clarisse, L., Trickl, T., Neely, R., James, A. D., Rieger, L., Wilson, J. C., and Meland, B.: Stratospheric aerosol-Observations, processes, and impact on climate: Stratospheric Aerosol, Rev. Geophys., 54, 278–335, https://doi.org/10.1002/2015RG000511, 2016.
Li, Y., Dykema, J., Deshler, T., and Keutsch, F.: Composition Dependence of Stratospheric Aerosol Shortwave Radiative Forcing in Northern Midlatitudes, Geophys. Res. Lett., 48, e2021GL094427, https://doi.org/10.1029/2021GL094427, 2021.
Li, Y., Dykema, J. A., Peterson, D. A., Feng, X., Shen, X., June, N. A., Fromm, M. D., McHardy, T. M., Jacquot, J. L., Pittman, J. V., Daube, B. C., Wofsy, S. C., Dean-Day, J., Rapp, A. D., Bowman, K. P., Cziczo, D. J., Mickley, L. J., Pierce, J. R., and Keutsch, F. N.: Enhanced radiative cooling by large aerosol particles from wildfire-driven thunderstorms, Sci. Adv., 11, eadw6526, https://doi.org/10.1126/sciadv.adw6526, 2025.
Liu, C., Portmann, R. W., Liu, S., Rosenlof, K. H., Peng, Y., and Yu, P.: Significant Effective Radiative Forcing of Stratospheric Wildfire Smoke, Geophys. Res. Lett., 49, e2022GL100175, https://doi.org/10.1029/2022GL100175, 2022.
Loughman, R., Bhartia, P. K., Chen, Z., Xu, P., Nyaku, E., and Taha, G.: The Ozone Mapping and Profiler Suite (OMPS) Limb Profiler (LP) Version 1 aerosol extinction retrieval algorithm: theoretical basis, Atmos. Meas. Tech., 11, 2633–2651, https://doi.org/10.5194/amt-11-2633-2018, 2018.
Malinina, E., Rozanov, A., Rozanov, V., Liebing, P., Bovensmann, H., and Burrows, J. P.: Aerosol particle size distribution in the stratosphere retrieved from SCIAMACHY limb measurements, Atmos. Meas. Tech., 11, 2085–2100, https://doi.org/10.5194/amt-11-2085-2018, 2018.
Malinina, E., Rozanov, A., Rieger, L., Bourassa, A., Bovensmann, H., Burrows, J. P., and Degenstein, D.: Stratospheric aerosol characteristics from space-borne observations: extinction coefficient and Ångström exponent, Atmos. Meas. Tech., 12, 3485–3502, https://doi.org/10.5194/amt-12-3485-2019, 2019.
Mei, F., McMeeking, G., Pekour, M., Gao, R.-S., Kulkarni, G., China, S., Telg, H., Dexheimer, D., Tomlinson, J., and Schmid, B.: Performance Assessment of Portable Optical Particle Spectrometer (POPS), Sensors, 20, 6294, https://doi.org/10.3390/s20216294, 2020.
Murphy, D. M., Froyd, K. D., Schwarz, J. P., and Wilson, J. C.: Observations of the chemical composition of stratospheric aerosol particles, Q. J. Roy. Meteor. Soc., 140, 1269–1278, https://doi.org/10.1002/qj.2213, 2014.
Murphy, D. M., Froyd, K. D., Bourgeois, I., Brock, C. A., Kupc, A., Peischl, J., Schill, G. P., Thompson, C. R., Williamson, C. J., and Yu, P.: Radiative and chemical implications of the size and composition of aerosol particles in the existing or modified global stratosphere, Atmos. Chem. Phys., 21, 8915–8932, https://doi.org/10.5194/acp-21-8915-2021, 2021.
Murphy, D. M., Abou-Ghanem, M., Cziczo, D. J., Froyd, K. D., Jacquot, J., Lawler, M. J., Maloney, C., Plane, J. M. C., Ross, M. N., Schill, G. P., and Shen, X.: Metals from spacecraft reentry in stratospheric aerosol particles, P. Natl. Acad. Sci. USA, 120, e2313374120, https://doi.org/10.1073/pnas.2313374120, 2023.
NASA/LARC/SD/ASDC: SAGE III/ISS L2 Monthly Solar Event Species Profiles (NetCDF) V006, https://doi.org/10.5067/ISS/SAGEIII/SOLAR_NETCDF4_L2-V6.0, 2025.
Oberbeck, V. R., Danielsen, E. F., Snetsinger, K. G., Ferry, G. V., Fong, W., and Hayes, D. M.: Effect of the eruption of El Chichon on stratospheric aerosol size and composition, Geophys. Res. Lett., 10, 1021–1024, https://doi.org/10.1029/GL010i011p01021, 1983.
Ohneiser, K., Ansmann, A., Baars, H., Seifert, P., Barja, B., Jimenez, C., Radenz, M., Teisseire, A., Floutsi, A., Haarig, M., Foth, A., Chudnovsky, A., Engelmann, R., Zamorano, F., Bühl, J., and Wandinger, U.: Smoke of extreme Australian bushfires observed in the stratosphere over Punta Arenas, Chile, in January 2020: optical thickness, lidar ratios, and depolarization ratios at 355 and 532 nm, Atmos. Chem. Phys., 20, 8003–8015, https://doi.org/10.5194/acp-20-8003-2020, 2020.
Ohneiser, K., Ansmann, A., Chudnovsky, A., Engelmann, R., Ritter, C., Veselovskii, I., Baars, H., Gebauer, H., Griesche, H., Radenz, M., Hofer, J., Althausen, D., Dahlke, S., and Maturilli, M.: The unexpected smoke layer in the High Arctic winter stratosphere during MOSAiC 2019–2020 , Atmos. Chem. Phys., 21, 15783–15808, https://doi.org/10.5194/acp-21-15783-2021, 2021.
Ohneiser, K., Ansmann, A., Kaifler, B., Chudnovsky, A., Barja, B., Knopf, D. A., Kaifler, N., Baars, H., Seifert, P., Villanueva, D., Jimenez, C., Radenz, M., Engelmann, R., Veselovskii, I., and Zamorano, F.: Australian wildfire smoke in the stratosphere: the decay phase in 2020/2021 and impact on ozone depletion, Atmos. Chem. Phys., 22, 7417–7442, https://doi.org/10.5194/acp-22-7417-2022, 2022.
Peterson, D. A., Campbell, J. R., Hyer, E. J., Fromm, M. D., Kablick, G. P., Cossuth, J. H., and DeLand, M. T.: Wildfire-driven thunderstorms cause a volcano-like stratospheric injection of smoke, npj Clim. Atmos. Sci., 1, 30, https://doi.org/10.1038/s41612-018-0039-3, 2018.
Peterson, D. A., Fromm, M. D., McRae, R. H. D., Campbell, J. R., Hyer, E. J., Taha, G., Camacho, C. P., Kablick, G. P., Schmidt, C. C., and DeLand, M. T.: Australia's Black Summer pyrocumulonimbus super outbreak reveals potential for increasingly extreme stratospheric smoke events, npj Clim. Atmos. Sci., 4, 38, https://doi.org/10.1038/s41612-021-00192-9, 2021.
Peterson, D. A., Berman, M. T., Fromm, M. D., Servranckx, R., Julstrom, W. J., Hyer, E. J., Campbell, J. R., McHardy, T. M., and Lambert, A.: Worldwide inventory reveals the frequency and variability of pyrocumulonimbus and stratospheric smoke plumes during 2013–2023, npj Clim. Atmos. Sci., 8, 325, https://doi.org/10.1038/s41612-025-01188-5, 2025.
Ramachandran, G. and Leith, D.: Extraction of Aerosol-Size Distributions from Multispectral Light Extinction Data, Aerosol Sci. Technol., 17, 303–325, https://doi.org/10.1080/02786829208959578, 1992.
Rieger, L. A., Bourassa, A. E., and Degenstein, D. A.: Stratospheric aerosol particle size information in Odin-OSIRIS limb scatter spectra, Atmos. Meas. Tech., 7, 507–522, https://doi.org/10.5194/amt-7-507-2014, 2014.
Rieger, L. A., Zawada, D. J., Bourassa, A. E., and Degenstein, D. A.: A Multiwavelength Retrieval Approach for Improved OSIRIS Aerosol Extinction Retrievals, J. Geophys. Res.-Atmos., 124, 7286–7307, https://doi.org/10.1029/2018JD029897, 2019.
Rieger, L. A., Randel, W. J., Bourassa, A. E., and Solomon, S.: Stratospheric Temperature and Ozone Anomalies Associated With the 2020 Australian New Year Fires, Geophys. Res. Lett., 48, e2021GL095898, https://doi.org/10.1029/2021GL095898, 2021.
Schuster, G. L., Dubovik, O., and Holben, B. N.: Angstrom exponent and bimodal aerosol size distributions, J. Geophys. Res., 111, 2005JD006328, https://doi.org/10.1029/2005JD006328, 2006.
Sellitto, P., Belhadji, R., Kloss, C., and Legras, B.: Radiative impacts of the Australian bushfires 2019–2020 – Part 1: Large-scale radiative forcing, Atmos. Chem. Phys., 22, 9299–9311, https://doi.org/10.5194/acp-22-9299-2022, 2022.
Siddaway, J. M. and Petelina, S. V.: Transport and evolution of the 2009 Australian Black Saturday bushfire smoke in the lower stratosphere observed by OSIRIS on Odin, J. Geophys. Res., 116, D06203, https://doi.org/10.1029/2010JD015162, 2011.
Solomon, S., Dube, K., Stone, K., Yu, P., Kinnison, D., Toon, O. B., Strahan, S. E., Rosenlof, K. H., Portmann, R., Davis, S., Randel, W., Bernath, P., Boone, C., Bardeen, C. G., Bourassa, A., Zawada, D., and Degenstein, D.: On the stratospheric chemistry of midlatitude wildfire smoke, P. Natl. Acad. Sci. USA, 119, e2117325119, https://doi.org/10.1073/pnas.2117325119, 2022.
Solomon, S., Stone, K., Yu, P., Murphy, D. M., Kinnison, D., Ravishankara, A. R., and Wang, P.: Chlorine activation and enhanced ozone depletion induced by wildfire aerosol, Nature, 615, 259–264, https://doi.org/10.1038/s41586-022-05683-0, 2023.
Stone, K., Solomon, S., Yu, P., Murphy, D. M., Kinnison, D., and Guan, J.: Two-years of stratospheric chemistry perturbations from the 2019–2020 Australian wildfire smoke, Atmos. Chem. Phys., 25, 7683–7697, https://doi.org/10.5194/acp-25-7683-2025, 2025.
Sumlin, B. J., Heinson, W. R., and Chakrabarty, R. K.: Retrieving the aerosol complex refractive index using PyMieScatt: A Mie computational package with visualization capabilities, J. Quant. Spectrosc. Ra., 205, 127–134, https://doi.org/10.1016/j.jqsrt.2017.10.012, 2018.
Taha, G., Loughman, R., Zhu, T., Thomason, L., Kar, J., Rieger, L., and Bourassa, A.: OMPS LP Version 2.0 multi-wavelength aerosol extinction coefficient retrieval algorithm, Atmos. Meas. Tech., 14, 1015–1036, https://doi.org/10.5194/amt-14-1015-2021, 2021.
Thomason, L. W. and Knepp, T.: Quantifying SAGE II (1984–2005) and SAGE III/ISS (2017–2022) observations of smoke in the stratosphere, Atmos. Chem. Phys., 23, 10361–10381, https://doi.org/10.5194/acp-23-10361-2023, 2023.
Thomason, L. W. and Vernier, J.-P.: Improved SAGE II cloud/aerosol categorization and observations of the Asian tropopause aerosol layer: 1989–2005, Atmos. Chem. Phys., 13, 4605–4616, https://doi.org/10.5194/acp-13-4605-2013, 2013.
Thomason, L. W., Poole, L. R., and Deshler, T.: A global climatology of stratospheric aerosol surface area density deduced from Stratospheric Aerosol and Gas Experiment II measurements: 1984–1994, J. Geophys. Res., 102, 8967–8976, https://doi.org/10.1029/96JD02962, 1997.
Todt, M. A., Asher, E., Hall, E., Cullis, P., Jordan, A., Xiong, K., Hurst, D. F., and Thornberry, T.: Baseline Balloon Stratospheric Aerosol Profiles (B2 SAP)–Systematic Measurements of Aerosol Number Density and Size, J. Geophys. Res.-Atmos., 128, e2022JD038041, https://doi.org/10.1029/2022JD038041, 2023.
Torres, O., Bhartia, P. K., Taha, G., Jethva, H., Das, S., Colarco, P., Krotkov, N., Omar, A., and Ahn, C.: Stratospheric Injection of Massive Smoke Plume From Canadian Boreal Fires in 2017 as Seen by DSCOVR-EPIC, CALIOP, and OMPS-LP Observations, J. Geophys. Res.-Atmos., 125, e2020JD032579, https://doi.org/10.1029/2020JD032579, 2020.
Trickl, T., Vogelmann, H., Fromm, M. D., Jäger, H., Perfahl, M., and Steinbrecht, W.: Measurement report: Violent biomass burning and volcanic eruptions – a new period of elevated stratospheric aerosol over central Europe (2017 to 2023) in a long series of observations, Atmos. Chem. Phys., 24, 1997–2021, https://doi.org/10.5194/acp-24-1997-2024, 2024.
Vernier, J.-P., Thomason, L. W., Pommereau, J.-P., Bourassa, A., Pelon, J., Garnier, A., Hauchecorne, A., Blanot, L., Trepte, C., Degenstein, D., and Vargas, F.: Major influence of tropical volcanic eruptions on the stratospheric aerosol layer during the last decade: VOLCANIC INFLUENCE AERO STRATO, Geophys. Res. Lett., 38, https://doi.org/10.1029/2011GL047563, 2011.
von Savigny, C. and Hoffmann, C. G.: Issues related to the retrieval of stratospheric-aerosol particle size information based on optical measurements, Atmos. Meas. Tech., 13, 1909–1920, https://doi.org/10.5194/amt-13-1909-2020, 2020.
Wang, P.-H., Kent, G. S., McCormick, M. P., Thomason, L. W., and Yue, G. K.: Retrieval analysis of aerosol-size distribution with simulated extinction measurements at SAGE III wavelengths, Appl. Optics, 35, 433, https://doi.org/10.1364/AO.35.000433, 1996.
Wrana, F., von Savigny, C., Zalach, J., and Thomason, L. W.: Retrieval of stratospheric aerosol size distribution parameters using satellite solar occultation measurements at three wavelengths, Atmos. Meas. Tech., 14, 2345–2357, https://doi.org/10.5194/amt-14-2345-2021, 2021.
Wrana, F., Niemeier, U., Thomason, L. W., Wallis, S., and von Savigny, C.: Stratospheric aerosol size reduction after volcanic eruptions, Atmos. Chem. Phys., 23, 9725–9743, https://doi.org/10.5194/acp-23-9725-2023, 2023.
Wrana, F., Deshler, T., Löns, C., Thomason, L. W., and von Savigny, C.: Spatiotemporal variations of stratospheric aerosol size between 2002 and 2005 from measurements with SAGE III/M3M, Atmos. Chem. Phys., 25, 3717–3736, https://doi.org/10.5194/acp-25-3717-2025, 2025.
Yu, P., Toon, O. B., Bardeen, C. G., Zhu, Y., Rosenlof, K. H., Portmann, R. W., Thornberry, T. D., Gao, R.-S., Davis, S. M., Wolf, E. T., De Gouw, J., Peterson, D. A., Fromm, M. D., and Robock, A.: Black carbon lofts wildfire smoke high into the stratosphere to form a persistent plume, Science, 365, 587–590, https://doi.org/10.1126/science.aax1748, 2019.
Yu, P., Davis, S. M., Toon, O. B., Portmann, R. W., Bardeen, C. G., Barnes, J. E., Telg, H., Maloney, C., and Rosenlof, K. H.: Persistent Stratospheric Warming Due to 2019–2020 Australian Wildfire Smoke, Geophys. Res. Lett., 48, e2021GL092609, https://doi.org/10.1029/2021GL092609, 2021.
Yue, G. K.: A new approach to retrieval of aerosol size distributions and integral properties from SAGE II aerosol extinction spectra, J. Geophys. Res., 104, 27491–27506, https://doi.org/10.1029/1999JD900455, 1999.
Yue, G. K.: Retrieval of stratospheric aerosol size distributions and integral properties from simulated lidar backscatter measurements, Appl. Optics, 39, 5446, https://doi.org/10.1364/AO.39.005446, 2000.
Yue, G. K., McCormick, M. P., and Chu, W. P.: Retrieval of Composition and Size Distribution of Stratospheric Aerosols with the SAGE II Satellite Experiment, J. Atmos. Ocean. Tech., 3, 371–380, https://doi.org/10.1175/1520-0426(1986)003<0371:ROCASD>2.0.CO;2, 1986.
Yue, G. K., Lu, C., and Wang, P.: Comparing aerosol extinctions measured by Stratospheric Aerosol and Gas Experiment (SAGE) II and III satellite experiments in 2002 and 2003, J. Geophys. Res., 110, 2004JD005421, https://doi.org/10.1029/2004JD005421, 2005.
- Abstract
- Introduction
- Datasets
- Retrieval Algorithm Theoretical Basis and Framework
- Application of Retrieval Algorithm to Synthetic Data
- Application of Retrieval Algorithm to Observational Data
- Discussion
- Conclusions
- Data availability
- Author contributions
- Competing interests
- Disclaimer
- Acknowledgements
- Financial support
- Review statement
- References
- Supplement
- Abstract
- Introduction
- Datasets
- Retrieval Algorithm Theoretical Basis and Framework
- Application of Retrieval Algorithm to Synthetic Data
- Application of Retrieval Algorithm to Observational Data
- Discussion
- Conclusions
- Data availability
- Author contributions
- Competing interests
- Disclaimer
- Acknowledgements
- Financial support
- Review statement
- References
- Supplement