
the Creative Commons Attribution 4.0 License.
the Creative Commons Attribution 4.0 License.
 | 12 Nov 2026
Vertical distribution, optical characterization and automated classification of airborne pollen from in situ measurements
Maria Christina Gatou

Antti Lipponen
Ari Leskinen
Petri Tiitta
Maria Filioglou
Xiaoxia Shang
Sanna Pätsi
Annika Saarto
Marjut Roponen
Elina Giannakaki
Mika Komppula
Bioaerosols, such as pollen grains, play an important role in air quality, human health and atmospheric processes. However, their vertical distribution within the boundary layer remains insufficiently researched. In this study, we investigate the vertical profiles of pollen concentrations between 4–272 at the Vehmasmäki station in Eastern Finland. In situ measurements with optical pollen sensors at 4, 115, and 272 m were conducted simultaneously with ground-based observations from a Hirst–type volumetric air sampler and a Cloud Droplet Analyzer. Multiple campaigns were conducted during pollen seasons between 2021–2024, focusing on the dominant pollen types, i.e. birch and pine pollen. The three optical pollen sensors showed strong agreement during the intercomparison period (R2≥0.91), demonstrating good consistency among the instruments. The Cloud Droplet Analyzer measurements in the 20–100 µm size range showed that pollen dominated the measured concentrations of coarse particles during the intensive pollen periods. Polarization scatter plots for birch and pine pollen revealed distinct optical signatures, during predefined intensive pollen periods between 2021–2023, consistent with laboratory results. Furthermore, we assess how background fine-mode aerosol influences these signatures. During a major birch pollen episode in May 2024, pollen concentrations decreased with height. These vertical profiles were compared with predictions from the System for Integrated modeLling of Atmospheric coMposition (SILAM), which reproduced the vertical distribution from the observations, but systematically overestimated pollen concentrations at all heights. Moreover, a machine–learning classification approach combining optical pollen sensor measurements and meteorological variables demonstrated the possibility of identification of dominant pollen types. Our results demonstrate the feasibility of optical pollen sensors for continuous, real–time monitoring of dominant pollen taxa in boreal regions, from measurements in Vehmasmäki.
- Article
(6727 KB) - Full-text XML
- BibTeX
- EndNote


Primary biological aerosol particles (PBAP) such as pollen grains cause a major adverse health problem worldwide. Allergenic pollen and fungal spores cause allergic diseases and their occurrence is increasing due to climate change and urban pollution (Lake et al., 2017; Traidl-Hoffmann et al., 2003). Today, up to 20 %–25 % of the population in industrialized areas suffers from allergic diseases (Linneberg, 2011). Periods of high concentration of pollen in the air have more than doubled in the past three decades (Reinmuth-Selzle et al., 2017) and climate warming will potentially lead to higher pollen concentrations and longer pollen seasons, increasing the exposure to aeroallergens (Damialis et al., 2007; Beggs, 2016). Numerous studies have examined how meteorological conditions, including relative humidity (RH), temperature (T), wind speed, sunshine duration, and rainfall, affect pollen release and transport in the atmosphere. Relative humidity and temperature can affect pollen release and phenology, while temperature can also influence the atmospheric instability and turbulent transport that control wind-driven pollen dispersal (Chico-Fernández and Ayuga-Téllez, 2025; Tomczyk et al., 2025; Linkosalo et al., 2017; Kuparinen et al., 2009). For example, low relative humidity combined with high temperature tends to be associated with increased airborne pollen concentrations (Ščevková et al., 2015).
As pollen seasons become longer and annual pollen concentrations continue to rise, impacts can also be detected in the atmospheric processes of the climate. Pollen grains are coarse particles released by plants, with sizes typically ranging from 10–100 µm (Després et al., 2012). They can rupture when wet to form tiny subpollen particles (SPPs) and may have an indirect influence on atmospheric dynamics. Many studies suggest that SPPs may affect cloud formation through cloud condensation nuclei (CCN) and ice nuclei (IN), especially in remote locations where cloud formation is limited by the amount of condensation nuclei (Steiner et al., 2015; Prisle et al., 2019; Gute and Abbatt, 2020). Pollen particles also contribute significantly to the formation of ice in clouds, leading to increased rainfall, a state that is also supported by studies using the UCLALES-SALSA large eddy simulator, focused on birch pollen (Kretzschmar et al., 2024; Prank et al., 2025; Matthews et al., 2023).
Pollen may originate from both local and distant sources, as long range atmospheric transport can contribute to airborne pollen concentrations under favorable meteorological conditions, particularly before the onset of local flowering (Sofiev et al., 2013). Pollen grains have been detected both in the atmospheric boundary layer and in the free troposphere (Gidarakou et al., 2026; Sikoparija et al., 2025). They also exhibit diurnal variations in their concentration due to the dynamics within the boundary layer (Andújar-Maqueda et al., 2025). Pollen is not homogeneously distributed in the atmospheric boundary layer, but the concentration typically decreases with increasing altitudes because of its strong dilution and the lack of pollen sources (Gregory, 1978). Rojo et al. (2019) investigated near-ground vertical profiles of pollen concentration by comparing measurements at heights of approximately 10–30 m. They found that concentrations were highest at lower sampling heights, with mean values about 30 % greater near the surface. Above roughly 10 m, vertical differences diminished and pollen concentrations became relatively uniform. Damialis et al. (2017) used aircraft measurements over Thessaloniki to show that total pollen concentrations were often higher at tree-crown level than at ground level, particularly for arboreal taxa such as Pinaceae and Quercus. These studies demonstrate that measurements at different heights provide valuable information on the vertical distribution of airborne pollen and atmospheric mixing. When combined with meteorological data or atmospheric transport models, such measurements can help investigate the contribution of local, regional and long-range transport.
Most of the vertical profile studies have been carried out near the ground using standard Hirst–type air samplers, which require changing of the sampling tape and analysis of the samples with a light microscope (Galán and Domínguez-Vilches, 1997; Alcázar et al., 1999; Rodriquez-Rajo et al., 2005; Hernández-Ceballos et al., 2011; Oteros et al., 2017; Sofiev, 2019). This can be demanding in human resources, is time–consuming and real–time measurements are not possible. At low pollen densities, systematic biases from unstable airflow rates can lead to an overestimation of 20 %, and high statistical errors up to 55 %, associated with subjective manual counting (Gottardini et al., 2009; Triviño et al., 2023; Liu et al., 2025). New techniques have been developed to reduce workload and enable real–time pollen measurements. These new techniques introduce image recognition and fluorescence techniques in pollen analysis. BAA500 utilizes a microscope equipped with a CCD camera in an image recognition-based pollen monitoring system (Oteros et al., 2015). The Wideband Integrated Bioaerosol Sensor and the Real–Time Airborne Particle Identifier use the fluorescence spectra of pollen grains, while SwisensPoleno Jupiter integrates UV-induced fluorescence spectroscopy and holographic imaging methods in real–time pollen monitoring (Sauvageat et al., 2020; Šauliene et al., 2019; Erb et al., 2024). LIght Detection And Ranging (LiDAR) is an effective tool for studying how pollen is distributed vertically in the atmosphere. When other non-spherical particles are not present, the particle linear depolarization ratio (PDR) allows pollen grains to be identified (Bohlmann et al., 2019, 2021). Sassen (2008) reported a high linear PDR of up to 30 % at 694 nm in plumes dominated by paper birch pollen (Betula papyrifera) in Alaska. Lidar measurements have also indicated that pollen is confined at nighttime and early in the morning, while in midday, when the boundary layer deepens, the pollen plume becomes well mixed within it (Noh et al., 2013; Sicard et al., 2016). Recent studies have shown that lidar measurements can reveal characteristic optical properties of different types of pure pollen, distinguishing them from other aerosols (Shang et al., 2020, 2022).
Machine–learning techniques for pollen classification have been a major catalyst for automated pollen monitoring. The feasibility of automated identification is supported by recent findings in Mediterranean climates, where machine learning techniques such as Random Forest have demonstrated high accuracy in predicting the onset of Olea and Quercus seasons (Papadogiannaki et al., 2025). In image-based pollen analysis, the morphological complexity of pollen grains is particularly well suited for Convolutional Neural Networks (CNNs). Previous studies have shown that optimizing CNN architectures can lead to remarkably high classification performance. For example, analyses using large annotated image datasets have demonstrated that optimized models such as DenseNet201 and ResNet50 achieved peak accuracy levels of 97.217 % and 94.257 %, respectively (Garga et al., 2024; Milling et al., 2025; Sevillano et al., 2020). However, such image-based approaches typically require large and sophisticated instrumentation as well as substantial computational resources. In contrast, there is a need for simple, low–cost and real–time pollen monitors that can be easily installed on masts or tethered balloons, where payload is limited. These simple systems are commonly based on compact optical sensors providing non-imaging measurements, observing, for example, light scattering and polarization by pollen suspended in air.
Among the different automatic devices introduced, a system used in Japan to monitor Japanese cedar pollen is the pollen sensor (PS2) manufactured by Shinyei Technology Co., Ltd, Japan. However, this instrument had not been evaluated in Europe. Its simple optical system is optimized for target taxa like Japanese cedar or cypress and cannot universally discriminate between all pollen taxa. Previous work demonstrated the possibility of using PS2 to detect Cupressaceae pollen by comparing its output with that of a Hirst–type air sampler, noting that the PS2 is compact, inexpensive and capable of discriminating pollen based on scattered light intensity and degree of polarization (DoP). Tests in the Mediterranean for Cupressaceae pollen demonstrated that PS2 measurements at the probability level of 90 % did not differ significantly from those obtained with a Hirst–trap (t-value=1.843, p-value=0.066), while the 70 % probability level showed a significant difference (t-value=4.457, p-value=0.00) (Celenk, 2020). Therefore, the two methods can work synergistically, as the PS2 offers real–time data, while the Hirst–trap provides the taxonomic information needed to verify and interpret automated measurements (Celenk, 2020). Recent evaluations of these sensors have expanded their applicability beyond bioaerosols. For instance, Iwata et al. (2026) demonstrated that similar low-cost sensors can effectively detect Asian dust by utilizing specific particle size and polarization proxies.
In this study, we investigate vertical profiles of pollen number concentrations from 4 to 272 m for different pollen types using the PS2 and compare the results to simultaneous measurements with a Hirst–type air sampler and Cloud Droplet Analyser (CDA). Measured pollen vertical profiles were also compared with the results of the Finnish System for Integrated modeLling of Atmospheric coMposition (SILAM). In addition, we analyze the polarization scatter plot of birch and pine pollen during intensive pollen periods, and assess how background fine-mode aerosols influence the observed optical signatures. Furthermore, we evaluate the consistency of multiple PS2 sensors through intercomparison experiments. Finally, we apply a machine–learning classification technique that combines optical sensor measurements with meteorological data to explore the potential for real–time identification of dominant pollen types.
The Vehmasmäki measurement station (; 190 ), is a rural forest site about 18 km south of Kuopio, Finland. It offers ideal conditions for the observation of pollen, as the concentration of background aerosols is typically low without any major pollutant sources nearby. The station is mainly surrounded by grass fields and forest with dominant tree species including Silver birch (Betula pendula), Norway spruce (Picea abies), and Scots pine (Pinus sylvestris) (Bohlmann et al., 2021).
Continuous measurements at the station include Vaisala ceilometers CL51 and CL61, a multi-wavelength Raman polarization lidar (PollyXT), a Halo Doppler lidar, and multiple in situ instruments for aerosol size distribution, number concentration, and optical properties. The airborne pollen types were identified and their concentrations monitored using a Hirst–type volumetric air sampler. The instrument operated each year throughout the main pollen season since 2019, typically from March to August. Meteorological parameters were measured both on top of the container, as well as from a 318 m tall mast. The mast is equipped with temperature and relative humidity measurements at eight different heights (2, 26, 66, 115, 168, 215, 272, and 300 m), and wind speed and direction are provided for four heights (26, 115, 215, and 272 m).
2.1 PS2 pollen sensor
The PS2 draws a sample from the ambient air with the help of a suction fan that produces an air flow of 0.7 L min−1 through the sensor. The sample is illuminated with 790 nm light from a laser diode, and the light scattered from the particles in the sample is detected at 135-degree scattering angle with two light detectors (Fig. 1). The two detectors are used to discriminate pollen from other particles based on two factors. First, the scattered light intensity is measured by one detector (PD2 in Fig. 1), which outputs the parameter Ppol that is a relative measure related to particle size. Secondly, the other scattered light intensity, denoted as Spol, is measured by the other detector (PD1 in Fig. 1) through a polarization filter whose orientation is perpendicular to the incident polarization. The combined output of these is then denoted as the degree of polarization (DoP), a relative index related to particle shape:
Since the light scattered from particles with complex shapes or rough surfaces like pollen changes the incident light polarization plane, part of the scattered light is able to pass the polarizing filter (PF) (Fig. 1).

Figure 1Schematic representation of optical detection principle of the pollen sensor PS2 where two pollen detectors (PD), a polarized filter (PF) and 790 nm laser diode (LD) are presented.
Irregular particles such as dust strongly depolarize the incident light and therefore produce a relatively higher signal in the polarized channel, whereas more spherical or weakly depolarizing particles, such as many pollen grains, retain a larger fraction of the original polarization and are more strongly detected in the non-polarized channel (Fig. 1). This difference in scattering intensity and polarization response enables discrimination between pollen and other particles. In this work we installed PS2 sensors at three locations for measuring the vertical profile of pollen concentrations: at the roof level of the measurement station (at the height of 4 m) and on the mast at the heights of 115 and 272 m. Prior to the vertical measurements, an intercomparison campaign was conducted by operating all PS2 units side-by-side at the 4 m rooftop location for a two-week period to ensure data consistency.
The PS2 was intercompared using pollen grains from most abundant taxa, in order to identify different pollen types. Two PS2 sensors were intercompared in the laboratory as follows. The sensors were mounted on the inner surface of a local exhaust ventilation hood. Pollen of Alnus incana, Betula pendula, Urtica dioica, Populus tremula, Salix, Pinus sylvestris, and Picea abies were placed in cuvettes, and each cuvette was tapped at the bottom to gradually release the pollen, while the open end was held close to the sensor inlets. The target was to reach more than one thousand counts per sensor to improve statistical reliability. To prevent cross-contamination between different pollen taxa, the sensors and their surroundings were cleaned with laboratory pressurized air between tests. The cleanliness was verified by performing one-minute blank tapping tests, which produced fewer than 20 counts. Background levels were also assessed after cleaning by measuring for 5–90 min, yielding less than one count per minute.
Figure 2 shows the SEM images of the most typical pollen grains observed in Vehmasmäki. The images show that the size range and shape of conifer pollen grains (Pinus sylvestris and Picea abies) differ from the rest pollen grains.

Figure 2Examples of pollen morphology (SEM imaging) for the most typical pollen grains: (a) Alder (b) Birch (c) Grasses, (d) Spruce, (e) Pine, and (f) Nettle in Vehmasmäki (source: PalDat – a palynological database; https://www.paldat.org, last access: 4 February 2026; Halbritter and Heigl, 2020).
Figure 3 summarizes the PS2 count patterns in the Ppol–DoP plane for selected pollen grains, measured in the laboratory, and fog droplets, measured in the field (Vehmasmäki). As we can see in Fig. 3, fog droplets show low Ppol values (1.6–2.0) but high DoP (0.6–0.9), while different pollen taxa form distinct clusters with moderate DoP (−0.05–0.4). Based on these specific polarization signatures for every aerosol type, we found them suitable for particle classification and thus used the limits of Ppol>1.3 and in field measurements for pollen grains to distinguish them from fog droplets.

In the field measurements, the presence of fog droplets was also identified based on dew point depression calculations. Fog forms when the temperature and dew point of the air approach the same value. So, the difference between air temperature and dew point (dT<1 °C) was used as an indicator of fog formation and ambient PS2 dataset from Vehmasmäki was used for this purpose.
2.2 The Burkard sampler
Airborne pollen was monitored using a Burkard 7 d recording (Burkard Manufacturing Co Ltd) volumetric air sampler operated at 4 (above ground level). The sampler draws air through a 14 mm × 2 mm orifice at a flow rate of 10 L min−1, impacting particles with sufficient inertia (>4 µm) onto a greased tape mounted on a drum rotating on a seven-day cycle (Hirst, 1952). The tape was divided into daily segments and analyzed in the Department of Biodiversity Sciences (University of Turku, Finland) by light microscopy, providing pollen information with a temporal resolution of 2 h. Different microscopic counting strategies have been proposed for Hirst-type samplers, and previous studies have shown that commonly used counting methods provide comparable estimates of airborne pollen concentrations (Cariñanos et al., 2000). Using this method, pollen grains were identified to taxonomic type based on their morphological characteristics, and number concentrations were calculated from the known sampling flow. In total, up to 24 pollen types have been detected, of which the most abundant taxa in Vehmasmäki were considered in this study. Main sources of uncertainty include flow variability, counting methodology, and mounting media, with reported discrepancies of ∼16 % for concentrations >10 Pollen grains m−3 and larger deviations at lower concentrations (Adamov et al., 2021).
2.3 The Cloud Droplet Analyzer
The Cloud Droplet Analyzer (CDA) is a high-resolution optical aerosol spectrometer system to measure the size distribution and number concentration of aerosols. The measurement accuracy of the device has been developed using a white light source and 90° scattered light detection, which enables a well defined calibration curve throughout the entire particle size range of 0.6–100 µm (Bächler et al., 2024). An accurate determination of the particles has been reached using the T-aperture technique, which enables the particle size and particle number measurements in high concentrations without border zone error. In this study, CDA was adapted to monitor pollen grains, applying the particle measurement size range of 20–100 µm and using a pollen particle density of 600 kg m−3, plus a refractive index of 1.54+0i in the data analysis (Sicard et al., 2021; Jackson and Lyford, 1999; Kim et al., 2018).
2.4 SILAM
SILAM (System for Integrated modeLling of Atmospheric Composition) is a global mesoscale chemical transport and dispersion model developed by the Finnish Meteorological Institute for air quality and atmospheric composition applications (Sofiev et al., 2006). The model employs an Eulerian and a Lagrangian particle dispersion mode to simulate transport of pollutants in 3-D. SILAM features eight chemicophysical transformation modules for gas chemistry, secondary aerosol formation and aerosol dynamics, wet and dry deposition processes, radioactive decay, and pollen transformations. The model can use as inputs a wide range of emission sources, including anthropogenic pollutants, biogenic volatile organic compounds from vegetation, natural aerosols such as sea salt and dust, smoke from biomass burning, and even ship emissions or nuclear accident plumes. SILAM also provides pollen forecasts throughout Europe with a spatial resolution of 10 km and a temporal resolution of 1 h. Vertical profiles of pollen concentrations are available for 10 atmospheric layers, ranging from the surface up to 9 km. For the SILAM data used in this study (version 5.9), the forecasted pollen taxa include alder, birch, grass, hazel, mugwort, olive and ragweed pollen (http://silam.fmi.fi/, last access: 21 November 2025).
2.5 Methodology
2.5.1 Temporal averaging and sensor intercomparison
Since the Hirst–type volumetric air sampler provides a 2 h temporal resolution, data from all other instruments were averaged over identical 2 h intervals to maintain consistency. The optical pollen sensors were intercompared with laboratory suspensions of common pollen taxa and other particles to ensure accurate discrimination based on scattered light intensity and polarization. To evaluate instrumental consistency, an intercomparison of three PS2 instruments, named as PS21, PS22, and PS23, was conducted at the Vehmasmäki station from 11 May–2 June 2023. All sensors were located and operated continuously. Linear regression analysis was performed using the raw concentration measurements of PS22 and PS23 against PS21, which served as the reference instrument for the intercomparison. The regression slopes were used to quantify the systematic differences between the sensors. To express the measurements of PS22 and PS23 on the PS21 scale, their concentration time series were rescaled by dividing the raw measurements by their respective regression slopes. Slope coefficients obtained from the regression were used as correction factors to correct PS22 and PS23 time series and eliminate systematic bias.
2.5.2 Estimation of PM10 contribution
To investigate how the polarization characteristics of different pollen types depend on the contribution of other particles to the total aerosol mixture, we combined the PS2 data with the share of particles with a diameter of 10 µm or less (PM10), following Filioglou et al. (2023). To estimate the PM10, we combined aerosol size distributions from the NanoScan SMPS Nanoparticle Sizer (NS, TSI model 3910) and an Optical Particle Sizer (OPS, TSI model 3330) instruments. The NS and OPS number size distributions were then converted to volume size distributions assuming spherical particles and merged into a single distribution, which was multiplied by a constant particle density and integrated over the size range corresponding to particles with diameters of 10 µm or less to obtain PM10. The Burkard pollen number concentrations were converted to mass concentrations (PMpollen) using the assumed pollen densities of 0.8 and 0.4 g cm−3 and particle diameters of 25 and 75 µm for birch and pine pollen respectively (Gregory, 1961; Sicard et al., 2021; Jackson and Lyford, 1999). The percentage share of PM10 in the aerosol mixture was defined as
providing a measure of the non-pollen contribution to the total aerosol mixture. This parameter was used together with the PS2 data to analyze the polarization scatter plot of the different dominant pollen types.
2.5.3 Selection of intensive pollen periods and vertical profile analysis
Regarding the vertical distribution of birch pollen, we combined simultaneous observations from PS2-Roof at 4 m, PS2-Mast at 115 m and PS2-Mast at 272 at Vehmasmäki station with birch pollen profiles simulated by the SILAM model. The analysis was performed during the peak of the birch pollen season from 14–20 May 2024. This intensive pollen period (IPP) was selected considering that at least three consecutive 2 h measurements had shown birch contribution of more than 90 % to the total pollen load and also that the daily mean birch pollen concentration should be greater than 300 Pollen grains m−3 (Shang et al., 2020).
To focus the analysis on periods with high pollen concentration, several data filters were applied to each instrument. For PS2 data, we retained only 2 h timestamps derived from Burkard pollen concentration timeseries, when the birch pollen concentration was higher than 142 Pollen grains m−3. We also excluded the timestamps with precipitation, relative humidity over 80 % and low visibility below 1000 m. The total pollen concentration was calculated as the sum of all identified pollen types. After filtering, mean concentrations at each height were calculated.
2.5.4 Machine–learning based pollen classification
Lastly, we applied a machine–learning approach to classify the dominant pollen types automatically. The analysis used data from a PS2 optical pollen sensor, a Burkard sampler, and meteorological instruments, all located in the Vehmasmäki station, covering the pollen seasons 2021–2024. The Burkard sampler served as the reference for pollen identification and concentration.

Figure 4Time series of the 2 h concentrations of the two dominant pollen types birch and pine pollen measured by the Hirst–type air sampler at 4 during the period 1 May–1 July for (a) 2021, (b) 2022, (c) 2023, and (d) 2024 at the Vehmasmäki station.
In the machine–learning approach, all measurements were averaged into non-overlapping 2 h intervals that match the temporal resolution of the Burkard sampler. Meteorological predictors included 2 h mean air temperature and relative humidity measured at 2 at the same site. To represent the strong seasonal cycle of pollen emission, the fraction of the year (scaled from 0 to 1) was also included as a model predictor. The final input feature vector consisted of six variables: Ppol, Spol, DoP, temperature, relative humidity, and fraction of year. Ground-truth labels were derived from the Burkard counts. Six dominant types were defined: Alnus (ALNU), Picea (PICE), Pinus (PINU), Betula (BETU), Poaceae (POAC), and Urtica (URTI). If the total pollen concentration was below 142 Pollen grains m−3, the sample was assigned to a NONE class. Otherwise, if a single type contributed at least 80 % of the total concentration, the sample was assigned to that type; all other multi-type samples were labeled as MIX. This resulted in eight mutually exclusive classes. Classification was performed using a Random Forest (RF) classifier from the Scikit-learn Python package. Our RF model consisted of 300 trees with unrestricted depth, a minimum of eight samples required to split an internal node, a minimum of three samples per leaf, three features considered at each split, bootstrap sampling, and balanced class weights to compensate for the class imbalance. Model performance was assessed by a 10-fold stratified shuffle-split cross-validation, each using 90 % of the samples for training and 10 % for testing. We report the classification accuracy and confusion matrices over all splits test data. To also assess whether temporal dependence between consecutive 2 h observations affected the estimated classification performance, an additional grouped stratified validation was performed in which observations were grouped into consecutive 3 d periods. All observations within each 3 d block were assigned exclusively to either the training or validation data.
3.1 Pollen periods and Data availability
For all the campaigns that were conducted during May and July at Vehmasmäki station for the years 2021–2024 the dominant pollen types measured by the Hirst–type air sampler were consistently birch pollen (Betula) and pine pollen (Pinus). Every year, both pollen types show variability, not only in the timing of occurrence, but also in the magnitude of the concentration, reflecting variability in reproduction and phenology and the influence of meteorological conditions during each season. Figure 4 shows the time series of the two dominant pollen types at the Vehmasmäki station for each year during the period 1 May–1 July, using 2 h concentrations on a logarithmic scale. In 2021, birch pollen exhibited an exceptionally strong season, with a maximum 2–hourly concentration of 64 384 Pollen grains m−3 on 12 May. Pine pollen peaked later, on 5 June 2021, reaching 10 571 Pollen grains m−3. In 2022, the concentrations were weaker with birch pollen peak at 1991 Pollen grains m−3 on 22 May and pine pollen at 8649 Pollen grains m−3 on 12 June. In 2023, birch pollen again appeared in early May, peaking at 2701 Pollen grains m−3 on 15 May. Pine pollen reached its maximum of 7619 Pollen grains m−3 on 11 June. The 2024 season showed a similar variability, with birch pollen peaking at 14 003 Pollen grains m−3 on 15 May and pine pollen at 9816 Pollen grains m−3 on 29 May. The 2024 pollen season is visually shorter due to an early stop in measurements. For all years, birch pollen systematically showed an earlier peak than pine pollen. Peak birch pollen days consistently occur within a narrow 5–10 d window each year, while pine pollen exhibits a broader and later maximum, around early to mid June. Compared with birch pollen, the occurrence of the pine pollen peak shows greater annual variability, with shifts of up to one week between years. Figure 5 presents the data availability for each campaign year, including the operational periods of the PS2-Mast, the PS2-Roof and the identified IPP's for birch and pine pollen.

Figure 5Availability of the measurements of three PS2 instruments at Vehmasmäki station during 2021–2024, and the IPPs of birch and pine pollen.
3.2 Intercomparison measurements
The average pollen concentration was 1340 Pollen grains m−3 (PS21) throughout intercomparison campaign 10 May–2 June 2023 at Vehmasmäki station (Fig. 6a). Observed pollen concentration was close to the average particle concentration (NCDA) of 1300 Pollen grains m−3 measured in size range of 20–100 µm, so pollen grains clearly dominated that size range. Simple linear regression analyses of PS2 raw data, where PS21 data were used as a predictor, gave original slope values of 0.94 (R2=0.91) for PS22 and 0.77 (R2=0.90) for PS23. After applying slope corrections to minimize device bias by dividing PS22 and PS23 data with their respective slope factors as described in the Sect. 2.5.1, the slopes improved to 0.99 and 0.97 respectively. Based on the intercomparison data, PS2s have a strong agreement, since the correlation coefficients are equal to 0.91 and 0.90, respectively (Fig. 6b and c).

Figure 6Pollen concentration (a) and correlations between PS2s (b, c) in the period of intercomparison campaign measured using three PS2 pollen sensors and CDA where PS22 and PS23 data are corrected (slope correction).
3.3 Polarization scatter plot of pollen
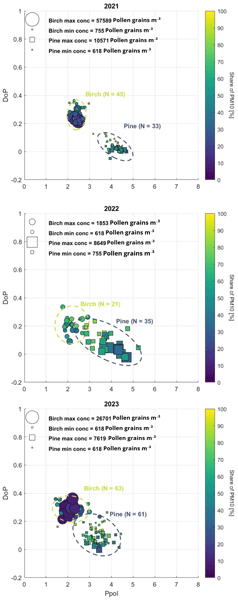
For each year, we identified the IPPs for birch and pine pollen based on the Burkard time series at Vehmasmäki and the constraints we described in Sect. 2.5.3. The IPPs are summarized in Table 1. Results of PS2 measurements for IPPs are shown in Fig. 7. During these selected periods, the data points represent 2 h averaged PS2 measurements. The contribution of background PM10 to the total aerosol mixture was used as a color scale for the polarization scatter plots. Circles denote birch pollen and squares denote pine pollen. The size of the markers is proportional to pollen concentration. Finally, we depicted the distribution for each pollen type using covariance ellipses. The number of samples for each pollen type is indicated in each panel. The analysis of the IPPs across the three years of Vehmasmäki campaigns reveals two clearly separated clusters in the polarization scatter plot. Birch pollen consistently shows higher DoP of 0.24±0.03, 0.17±0.04, and 0.29±0.04 for 2021, 2022, and 2023 respectively, while pine's DoP remains very low at 0.01±0.02, 0.04±0.04, and 0.06±0.04, respectively. Lower Ppol values of 2.41±0.13, 2.06±0.21, and 2.14±0.29 for 2021, 2022, and 2023 characterize birch pollen, whereas pine pollen is distinguished by higher mean Ppol values of 4.31±0.21, 4.27±0.30, and This separation is consistent across all three years. The ellipse extents show that pine pollen covers a broader range in both Ppol and DoP exhibiting a negative correlation. The largest markers (highest pollen concentrations) remain close to the cluster centers. The color reveals that most of the IPP samples correspond to relatively low PM10 shares less than 40 % of the aerosol mass, confirming the dominance of pollen in the selected periods. As the share of PM10 increases, both pollen types are biased to lower Ppol values, due to dispersion of the signal by fine particles and higher DoP, because the background is dominated by more spherical, fine–mode aerosols.
Table 1Intensive pollen periods (IPPs) for birch and pine pollen at Vehmasmäki during 2021–2023.


Figure 7Polarization scatter plot of birch and pine pollen during their IPPs at Vehmasmäki in (a) 2021, (b) 2022, (c) 2023. The color scale indicates the contribution of background PM10 to the total aerosol mixture. Circles denote birch pollen and squares denote pine pollen, while marker size is proportional to pollen number concentration. Dashed ellipses represent the covariance of each pollen cluster. N denotes the number of 2 h averaged samples included for each pollen type during the corresponding IPP.
These findings are in very good agreement with the laboratory polarization scatter plot produced by PS2 intercomparison experiments in the laboratory. Birch pollen occupies the region of higher DoP associated with more spherical particles, while pine pollen shows a lower DoP with high Ppol, characteristic of larger and more irregular particles. The strong agreement between the in situ polarization scatter plot and the laboratory reference scatter plot provides a sound basis for classifying pollen taxa using optical sensors.
The small offsets likely reflect the more complex and variable atmospheric mixture in the in situ measurements. Overall, the comparison shows that the in situ PS2 measurements during the IPPs are fully compatible with the PS2 intercomparison polarization scatter plot for birch and pine pollen.
3.4 Vertical profile of measured and predicted pollen concentration
To examine the vertical distribution of birch pollen, we combined simultaneous observations from three PS2s at 4, 115 m, 272 and Burkard at 4 m, with birch pollen concentrations simulated by the SILAM model. The analysis was focused from 14 to 20 May 2024, during birch pollen season. The PS2 measurements at 115 and 272 m were not individually classified using their polarization properties. Instead, the same IPPs identified from the Burkard Hirst-type sampler at 4 m were used for all three PS2 instruments, and the simultaneous measurements were assumed to be representative of the dominant pollen type during each period. We ensured that the IPP was following the criteria referred in Sect. 2.5.3 and excluded the timestamps with precipitation and relative humidity above 80 %. After filtering, we calculated the mean number concentrations at each height. Predicted birch pollen number concentrations were obtained from SILAM at multiple layers with mid-heights of 12.5, 50, 125, 275, and 575 m. For each height, we computed the mean and standard deviation of predicted birch pollen concentration during the selected IPP.
In Fig. 8, the time series of birch pollen concentration shows that the SILAM model overestimated the concentrations throughout the period. Peak concentrations were roughly twice as high as those measured at the corresponding heights. Moreover, while the observations displayed more pronounced daily fluctuations, the temporal variability in SILAM was smoother because the model replicated broad, persistent peaks during several days, probably affected by episodic release and weather.

Figure 8(a) SILAM predicted birch pollen concentrations at 12.5, 50, 125, 275, and 575 m; (b) Observed concentrations at 4, 115, 272 m from the Burkard sampler, PS2–Roof, and two PS2–Mast in Vehmasmäki during 14–20 May 2024.
In Fig. 9, both the measurements and the model show a clear decrease in concentration with height, with the highest pollen concentration near the ground. This implies that the gradient of vertical distribution of pollen was accurately replicated by the model, indicating that the transport and dispersion processes are functioning effectively in the model. At 4 m, however, the Burkard sampler measured consistently higher birch pollen concentrations than the PS2, a behavior also reported in previous intercomparison studies showing that Hirst-type samplers tend to yield higher concentrations than optical sensors due to differences in sampling efficiency and counting methodology (Maya-Manzano et al., 2023; Farooq et al., 2025). This suggests that part of the ground concentration difference arises from instrumental sampling characteristics rather than true atmospheric variability. Despite that, as shown by the time series, SILAM profile is biased toward higher pollen concentrations at all heights of the curve. Although previous evaluations have demonstrated that SILAM reproduces the overall temporal evolution and magnitude of airborne pollen concentrations reasonably well, model performance is sensitive to the pollen emission parameterization and meteorological input, and biases may occur depending on the study region and season (Sofiev et al., 2013).

Figure 9Vertical profiles of birch pollen concentration averaged over 14–20 May 2024: (a) observations from the three PS2 (4, 115, 272 m) and Burkard sampler (4 m); (b) SILAM model predictions at corresponding heights.

Figure 10Confusion matrix of Random Forest pollen classification results. The matrix shows the percentage of samples assigned to each predicted type (rows) relative to the true type identified from Burkard counts (columns). Diagonal elements represent correct classifications, while off-diagonal values indicate misclassifications. Numbers above columns show the number of reference samples per type.
3.5 Machine–learning-based pollen classification
To investigate the possibility of classifying in real–time the dominant airborne pollen types using PS2 measurements, we applied a machine–learning approach. The RF classifier achieved an overall classification accuracy of 76.9 %, as shown in Fig. 10. Performance was highest for Poaceae (90.2 %), Betula (88.2 %) and Pinus (79.7 %), while Alnus (50 %) and Picea (56.7 %) showed lower accuracies and frequent confusion with the NONE and MIX classes. Urtica were detected with low success (16.2 %), with many samples misclassified as MIX or NONE. The NONE class was generally robust (84.5 %), although some Alnus and Urtica were incorrectly labeled as NONE. The largest residual confusion was between MIX and NONE, reflecting cases where pollen concentrations were low or multiple types contributed without a single dominant type. The results support the broader applicability of the PS2 sensors for continuous pollen monitoring. Using 3 d temporally grouped validation reduced the overall classification accuracy only moderately, from 76.9 % to 74.5 %, indicating that temporal dependence between neighboring observations does not substantially affect the overall classification performance. Overall, these results demonstrate that combining PS2 data with meteorology, dominant pollen types can be identified effectively. The method is adequate to capture the primary seasonal dynamics of in situ measurements of airborne pollen, even though classification accuracy varies depending on the type of pollen.
This study provides new insights into the vertical distribution and optical properties of airborne pollen using lightweight optical sensors compared with laboratory measurements and models. The three PS2 pollen sensors demonstrated strong consistency during the intercomparison campaign, confirming their suitability for reliable real time pollen monitoring. In addition, the CDA measurements in the 20–100 µm size range provided independent support that pollen dominated the measured concentrations of coarse particles during the intensive pollen periods. The polarization scatter plot of birch and pine pollen showed distinct differences, supporting the use of PS2 for the identification and classification of certain pollen types. Vertical profiles revealed a clear decrease in pollen concentration with height, which is consistent with boundary layer dynamics. The differences observed between the Burkard and the PS2 at 4 m indicate that Hirst-type samplers may report higher pollen concentrations than optical sensors due to sampling and counting characteristics. This highlights the importance of considering specific instrument biases when combining datasets against mixed measurement types. While the SILAM model reproduced the vertical gradient of concentration, it systematically overestimated pollen concentrations. This highlights the need for improved parameterization of pollen release, dispersion and deposition. These results also emphasise the importance of high resolution observational datasets for improving models.
The integration of compact sensors offers a practical approach for continuous pollen monitoring at multiple heights. Such measurements can enhance allergy forecasting and improve atmospheric transport models. Future work should focus on expanding the range of monitored types, applying machine–learning for automated classification and extending observations to urban environments with more complicated dynamics and PM background like anthropogenic aerosols.
Our results demonstrate that the PS2 sensor and machine–learning methods work very well synergistically to provide reliable classifications of airborne pollen. By combining optical signals with meteorological data, the classifier achieved robust identification of the dominant pollen taxa. The approach performed best for Poaceae, Betula and Pinus while some challenges remained for less abundant groups such as Alnus, Picea, and Urtica. Despite these limitations, the method consistently captured the main seasonal dynamics of airborne pollen. These findings highlight the potential of lightweight optical sensors, when coupled with machine–learning, to provide real–time pollen information in support of pollen monitoring.
The datasets of all the in situ data used in this study, including the Hirst-type pollen measurements, PS2 measurements, Cloud Droplet Analyzer (CDA) data, NanoScan–Optical Particle Sizer (NS–OPS) measurements, and SILAM modelled pollen concentrations, are available in the Finnish Meteorological Institute's research data repository METIS (https://doi.org/10.57707/fmi-b2share.d9at2-4za47, Gatou et al., 2026).
MCG analyzed the data and wrote the manuscript. ALe, MK performed the intercomparison of the PS2 pollen sensors. SP and AS analyzed the pollen samples and provided the pollen data. ALe provided the analysis of the in situ aerosol data. ALi conducted the machine–learning-based pollen classification. PT provided the matlab scripts for the intercomparison measurements. MF provided the PM data and introduced the PMshare methodology. XS contributed to the analysis using data from the SILAM model. PT, MK, MR, EG, and ALe initiated and managed the project. MF, ALe, MK, and XS participated in the measurement campaigns. All authors contributed to the interpretation of the results and were involved in the editing and discussion of the manuscript.
The contact author has declared that none of the authors has any competing interests.
Publisher's note: Copernicus Publications remains neutral with regard to jurisdictional claims made in the text, published maps, institutional affiliations, or any other geographical representation in this paper. The authors bear the ultimate responsibility for providing appropriate place names. Views expressed in the text are those of the authors and do not necessarily reflect the views of the publisher.
The authors acknowledge the SILAM development team at the Finnish Meteorological Institute for providing access to the model data. The authors are thankful for the use of the microphotographs of pollen grains from PalDat (PalDat–a palynological database, 2000 onwards; https://www.paldat.org, last access: 4 February 2026), courtesy of the Division of Structural and Functional Botany, University of Vienna. Generative AI (OpenAI ChatGPT) was used to create the schematic illustration of the PS2 pollen sensor shown in Fig. 1.
This research has been supported by the Research Council of Finland (grant no. 329216).
This paper was edited by Vassilis Amiridis and reviewed by two anonymous referees.
Adamov, S., Lemonis, N., Clot, B., Crouzy, B., Gehrig, R., Graber, M. J., Sallin, C., and Tummon, F.: On the measurement uncertainty of Hirst-type volumetric pollen and spore samplers, Aerobiologia, 40, 77–91, https://doi.org/10.1007/S10453-021-09724-5, 2021. a
Alcázar, P., Galán, C., Cariñanos, P., and Domínguez-Vilches, E.: Effects of sampling height and climatic conditions in aerobiological studies, J. Invest. Allerg. Clin., 9, 253–261, 1999. a
Andújar-Maqueda, J., Ortiz-Amezcua, P., Cariñanos, P., Abril-Gago, J., Linares, C. D., de Arruda Moreira, G., Bravo-Aranda, J. A., Granados-Muñoz, M. J., Alados-Arboledas, L., and Guerrero-Rascado, J. L.: The role of atmospheric boundary layer wind and turbulence on surface pollen levels, Agr. Forest Meteorol., 371, 110584, https://doi.org/10.1016/j.agrformet.2025.110584, 2025. a
Beggs, P. J.: Impacts of Climate Change on Allergens and Allergic Diseases, Cambridge University Press, https://doi.org/10.1017/CBO9781107272859, ISBN 9781107048935, 2016. a
Bohlmann, S., Shang, X., Giannakaki, E., Filioglou, M., Saarto, A., Romakkaniemi, S., and Komppula, M.: Detection and characterization of birch pollen in the atmosphere using a multiwavelength Raman polarization lidar and Hirst-type pollen sampler in Finland, Atmos. Chem. Phys., 19, 14559–14569, https://doi.org/10.5194/acp-19-14559-2019, 2019. a
Bohlmann, S., Shang, X., Vakkari, V., Giannakaki, E., Leskinen, A., Lehtinen, K. E. J., Pätsi, S., and Komppula, M.: Lidar depolarization ratio of atmospheric pollen at multiple wavelengths, Atmos. Chem. Phys., 21, 7083–7097, https://doi.org/10.5194/acp-21-7083-2021, 2021. a, b
Bächler, P., Meyer, J., Ligotski, R., Krug, P., and Dittler, A.: Measurement of transient nanoparticle emissions of a municipal biomass incineration plant equipped with pulse-jet cleaned filters, Process Saf. Environ., 184, 601–614, https://doi.org/10.1016/J.PSEP.2024.02.013, 2024. a
Cariñanos, P., Emberlin, J., Galán, C., and Dominguez-Vilches, E.: Comparison of two pollen counting methods of slides from a hirst type volumetric trap, Aerobiologia, 16, 339–346, https://doi.org/10.1023/A:1026577406912, 2000. a
Celenk, S.: An automatic sensor for cypress pollen identification: Preliminary results from PS2, https://www.researchgate.net/publication/349484027_An_automatic_sensor_for_cypress_pollen_identification_Preliminary_results_from_PS2 (last access: 15 October 2026), 2020. a, b
Chico-Fernández, J. and Ayuga-Téllez, E.: Relationship of Meteorological Variables with the Concentration of Various Tree Pollen Types in Madrid (Spain), Appl. Sci., 15, 692, https://doi.org/10.3390/app15020692, 2025. a
Damialis, A., Halley, J. M., Gioulekas, D., and Vokou, D.: Long-term trends in atmospheric pollen levels in the city of Thessaloniki, Greece, Atmos. Environ., 41, 7011–7021, https://doi.org/10.1016/J.ATMOSENV.2007.05.009, 2007. a
Damialis, A., Kaimakamis, E., Konoglou, M., Akritidis, I., Traidl-Hoffmann, C., and Gioulekas, D.: Estimating the abundance of airborne pollen and fungal spores at variable elevations using an aircraft: How high can they fly?, Scientific Reports, 7, 1–11, https://doi.org/10.1038/srep44535, 2017. a
Despres, V., Huffman, J., Burrows, S., Hoose, C., Safatov, A., Buryak, G., Fröhlich-Nowoisky, J., Elbert, W., Andreae, M., Pöschl, U., and Jaenicke, R.: Primary biological aerosol particles in the atmosphere: a review, Tellus B, 64, 15598, https://doi.org/10.3402/tellusb.v64i0.15598, 2012. a
Erb, S., Graf, E., Zeder, Y., Lionetti, S., Berne, A., Clot, B., Lieberherr, G., Tummon, F., Wullschleger, P., and Crouzy, B.: Real-time pollen identification using holographic imaging and fluorescence measurements, Atmos. Meas. Tech., 17, 441–451, https://doi.org/10.5194/amt-17-441-2024, 2024. a
Farooq, Q., Oteros, J., and Galán, C.: Advancing in the pollen frontier: a comprehensive evaluation and meta-analysis of automatic pollen monitoring systems, Aerobiologia, 41, 527–546, https://doi.org/10.1007/s10453-025-09865-x, 2025. a
Filioglou, M., Leskinen, A., Vakkari, V., O'Connor, E., Tuononen, M., Tuominen, P., Laukkanen, S., Toiviainen, L., Saarto, A., Shang, X., Tiitta, P., and Komppula, M.: Spectral dependence of birch and pine pollen optical properties using a synergy of lidar instruments, Atmos. Chem. Phys., 23, 9009–9021, https://doi.org/10.5194/acp-23-9009-2023, 2023. a
Galán, C. and Domínguez-Vilches, E.: The capture media in aerobiological sampling, Aerobiologia, 13, 155–160, https://doi.org/10.1007/BF02694502, 1997. a
Garga, B., Abboubakar, H., Sourpele, R. S., Gwet, D. L. L., and Bitjoka, L.: Pollen grain classification using some convolutional neural network architectures, Journal of Imaging, 10, 158, https://doi.org/10.3390/JIMAGING10070158, 2024. a
Gatou, M. C., Lipponen, A., Leskinen, A., Tiitta, P., Filioglou, M., Shang, X., Pätsi, S., Saarto, A., Roponen, M., Giannakaki, E., Komppula, M., and Finnish Meteorological Institute: Datasets used in Gatou et al. (2026) “Vertical distribution, optical characterization and automated classification of airborne pollen from in situ measurements”, Finnish Meteorological Institute [data set], https://doi.org/10.57707/fmi-b2share.d9at2-4za47, 2026. a
Gidarakou, M., Papayannis, A., Gao, K., Gidarakos, P., Crouzy, B., Foskinis, R., Erb, S., Brem, B. T., Zhang, C., Lieberherr, G., Collaud Coen, M., Sikoparija, B., Kanji, Z. A., Clot, B., Calpini, B., Giagka, E., and Nenes, A.: Profiling pollen and biomass burning particles over Payerne, Switzerland using laser-induced fluorescence lidar and in situ techniques during the 2023 PERICLES campaign, Atmos. Chem. Phys., 26, 923–945, https://doi.org/10.5194/acp-26-923-2026, 2026. a
Gottardini, E., Cristofolini, F., Cristofori, A., Vannini, A., and Ferretti, M.: Sampling bias and sampling errors in pollen counting in aerobiological monitoring in Italy, J. Environ. Monitor., 11, 751–755, https://doi.org/10.1039/B818162B, 2009. a
Gregory, P. H.: The microbiology of the atmosphere, L. Hill, https://doi.org/10.5962/bhl.title.7291, 1961. a
Gregory, P. H.: Distribution of airborne pollen and spores and their long distance transport, pure appl. geophys., 116, 309–315, https://doi.org/10.1007/BF01636888, 1978. a
Gute, E. and Abbatt, J. P.: Ice nucleating behavior of different tree pollen in the immersion mode, Atmos. Environ., 231, 117488, https://doi.org/10.1016/J.ATMOSENV.2020.117488, 2020. a
Halbritter, H. and Heigl, H.: PalDat – A palynological database, https://www.paldat.org/ (last access: 4 February 2026), 2020. a
Hernández-Ceballos, M. A., García-Mozo, H., Adame, J. A., Domínguez-Vilches, E., Bolívar, J. P., la Morena, B. A. D., Pérez-Badía, R., and Galán, C.: Determination of potential sources of Quercus airborne pollen in Córdoba city (southern Spain) using back-trajectory analysis, Aerobiologia, 27, 261–276, https://doi.org/10.1007/s10453-011-9195-1, 2011. a
Hirst, J. M.: An automatic volumetric spore trap, Ann. Appl. Biol., 39, 257–265, https://doi.org/10.1111/j.1744-7348.1952.tb00904.x, 1952. a
Iwata, A., Matsuki, A., Kuo, W.-C., Kobayashi, H., Shimizu, A., Kameda, T., and Orikasa, N.: A field-based evaluation of low-cost pollen sensors for their applicability to Asian dust detection, SOLA, 22, 1, https://doi.org/10.1007/s44393-025-00002-y, 2026. a
Jackson, S. T. and Lyford, M. E.: Pollen dispersal models in quaternary plant ecology: assumptions, parameters, and prescriptions, Bot. Rev., 65, 39–75, https://doi.org/10.1007/BF02856557, 1999. a, b
Kim, G., Lee, S., Shin, S., and Park, Y.: Three-dimensional label-free imaging and analysis of Pinus pollen grains using optical diffraction tomography, Sci. Rep.-UK, 8, 1782, https://doi.org/10.1038/s41598-018-20113-w, 2018. a
Kretzschmar, J., Pöhlker, M., Stratmann, F., Wex, H., Wirth, C., and Quaas, J.: From trees to rain: enhancement of cloud glaciation and precipitation by pollen, Environ. Res. Lett., 19, 104052, https://doi.org/10.1088/1748-9326/AD747A, 2024. a
Kuparinen, A., Katul, G., Nathan, R., and Schurr, F. M.: Increases in air temperature can promote wind-driven dispersal and spread of plants, P. Roy. Soc. B-Biol. Sci., 276, 3081–3087, https://doi.org/10.1098/rspb.2009.0693, 2009. a
Lake, I. R., Jones, N. R., Agnew, M., Goodess, C. M., Giorgi, F., Hamaoui-Laguel, L., Semenov, M. A., Solomon, F., Storkey, J., Vautard, R., and Epstein, M. M.: Climate change and future pollen allergy in Europe, Environ. Health Persp., 125, 385–391, https://doi.org/10.1289/EHP173, 2017. a
Linkosalo, T., Tortorec, E. L., Prank, M., Pessi, A.-M., and Saarto, A.: Alder pollen in Finland ripens after a short exposure to warm days in early spring, showing biennial variation in the onset of pollen ripening, Agr. Forest Meteorol., 247, 408–413, https://doi.org/10.1016/j.agrformet.2017.08.030, 2017. a
Linneberg, A.: The increase in allergy and extended challenges, Allergy, 66, 1–3, https://doi.org/10.1111/j.1398-9995.2011.02619.x, 2011. a
Liu, Y., Shao, W., Lei, X., Shao, W., Gao, Z., Sun, J., Yang, S., Cai, Y., Ding, Z., Sun, N., Gu, S., Peng, L., and Zhao, Z.: Validation of the Automatic Real-Time Monitoring of Airborne Pollens in China Against the Reference Hirst-Type Trap Method, Atmosphere, 16, 531, https://doi.org/10.3390/atmos16050531, 2025. a
Matthews, B. H., Alsante, A. N., and Brooks, S. D.: Pollen emissions of subpollen particles and ice nucleating particles, ACS Earth and Space Chemistry, 7, 1207, https://doi.org/10.1021/ACSEARTHSPACECHEM.3C00014, 2023. a
Maya-Manzano, J. M., Tummon, F., Abt, R., Allan, N., Bunderson, L., Clot, B., Crouzy, B., Daunys, G., Erb, S., Gonzalez-Alonso, M., Graf, E., Łukasz Grewling, Haus, J., Kadantsev, E., Kawashima, S., Martinez-Bracero, M., Matavulj, P., Mills, S., Niederberger, E., Lieberherr, G., Lucas, R. W., O'Connor, D. J., Oteros, J., Palamarchuk, J., Pope, F. D., Rojo, J., Šaulienė, I., Schäfer, S., Schmidt-Weber, C. B., Schnitzler, M., Šikoparija, B., Skjøth, C. A., Sofiev, M., Stemmler, T., Triviño, M., Zeder, Y., and Buters, J.: Towards European automatic bioaerosol monitoring: comparison of 9 automatic pollen observational instruments with classic Hirst-type traps, Sci. Total Environ., 866, 161220, https://doi.org/10.1016/j.scitotenv.2022.161220, 2023. a
Milling, M., Rampp, S. D., Triantafyllopoulos, A., Plaza, M. P., Brunner, J. O., Traidl-Hoffmann, C., Schuller, B. W., and Damialis, A.: Automating airborne pollen classification: identifying and interpreting hard samples for classifiers, Heliyon, 11, https://doi.org/10.1016/J.HELIYON.2025.E41656, 2025. a
Noh, Y. M., Lee, H., Mueller, D., Lee, K., Shin, D., Shin, S., Choi, T. J., Choi, Y. J., and Kim, K. R.: Investigation of the diurnal pattern of the vertical distribution of pollen in the lower troposphere using LIDAR, Atmos. Chem. Phys., 13, 7619–7629, https://doi.org/10.5194/acp-13-7619-2013, 2013. a
Oteros, J., Pusch, G., Weichenmeier, I., Heimann, U., Möller, R., Röseler, S., Traidl-Hoffmann, C., Schmidt-Weber, C., and Buters, J. T.: Automatic and Online Pollen Monitoring, International Archives of Allergy and Immunology, 167, 158–166, https://doi.org/10.1159/000436968, 2015. a
Oteros, J., Buters, J., Laven, G., Röseler, S., Wachter, R., Schmidt-Weber, C., and Hofmann, F.: Errors in determining the flow rate of Hirst-type pollen traps, Aerobiologia, 33, 201–210, https://doi.org/10.1007/S10453-016-9467-X, 2017. a
Papadogiannaki, S., Karatzas, K., Kontos, S., Poupkou, A., and Melas, D.: A multi-model approach to pollen season estimations: case study for Olea and Quercus in Thessaloniki, Greece, Atmosphere-Basel, 16, 454, https://doi.org/10.3390/atmos16040454, 2025. a
Prank, M., Tonttila, J., Shang, X., Romakkaniemi, S., and Raatikainen, T.: Can pollen affect precipitation?, Atmos. Chem. Phys., 25, 183–197, https://doi.org/10.5194/acp-25-183-2025, 2025. a
Prisle, N. L., Lin, J. J., Purdue, S., Lin, H., Meredith, J. C., and Nenes, A.: Cloud condensation nuclei activity of six pollenkitts and the influence of their surface activity, Atmos. Chem. Phys., 19, 4741–4761, https://doi.org/10.5194/acp-19-4741-2019, 2019. a
Reinmuth-Selzle, K., Kampf, C. J., Lucas, K., Lang-Yona, N., Fröhlich-Nowoisky, J., Shiraiwa, M., Lakey, P. S., Lai, S., Liu, F., Kunert, A. T., Ziegler, K., Shen, F., Sgarbanti, R., Weber, B., Bellinghausen, I., Saloga, J., Weller, M. G., Duschl, A., Schuppan, D., and Pöschl, U.: Air pollution and climate change effects on allergies in the anthropocene: abundance, interaction, and modification of allergens and adjuvants, Environ. Sci. Technol., 51, 4119–4141, https://doi.org/10.1021/ACS.EST.6B04908, 2017. a
Rodriquez-Rajo, F. J., MENDEZ, J., and JATO, V.: Airborne ericaceae pollen grains in the atmosphere of Vigo (Northwest Spain) and its relationship with meteorological factors, J. Integr. Plant Biol., 47, 792–800, https://doi.org/10.1111/j.1744-7909.2005.00092.x, 2005. a
Rojo, J., Oteros, J., Pérez-Badia, R., Cervigón, P., Ferencova, Z., Gutiérrez-Bustillo, A. M., Bergmann, K. C., Oliver, G., Thibaudon, M., Albertini, R., la Cruz, D. R.-D., Sánchez-Reyes, E., Sánchez-Sánchez, J., Pessi, A. M., Reiniharju, J., Saarto, A., Calderón, M. C., Guerrero, C., Berra, D., Bonini, M., Chiodini, E., Fernández-González, D., García, J., Trigo, M. M., Myszkowska, D., Fernández-Rodríguez, S., Tormo-Molina, R., Damialis, A., Kolek, F., Traidl-Hoffmann, C., Severova, E., Caeiro, E., Ribeiro, H., Magyar, D., Makra, L., Udvardy, O., Alcázar, P., Galán, C., Borycka, K., Kasprzyk, I., Newbigin, E., Adams-Groom, B., Apangu, G. P., Frisk, C. A., Skjøth, C. A., Radišić, P., Šikoparija, B., Celenk, S., Schmidt-Weber, C. B., and Buters, J.: Near-ground effect of height on pollen exposure, Environ. Res., 174, 160–169, https://doi.org/10.1016/J.ENVRES.2019.04.027, 2019. a
Sassen, K.: Boreal tree pollen sensed by polarization lidar: Depolarizing biogenic chaff, Geophys. Res. Lett., 35, https://doi.org/10.1029/2008GL035085, 2008. a
Šaulienė, I., Šukienė, L., Daunys, G., Valiulis, G., Vaitkevičius, L., Matavulj, P., Brdar, S., Panic, M., Sikoparija, B., Clot, B., Crouzy, B., and Sofiev, M.: Automatic pollen recognition with the Rapid-E particle counter: the first-level procedure, experience and next steps, Atmos. Meas. Tech., 12, 3435–3452, https://doi.org/10.5194/amt-12-3435-2019, 2019. a
Sauvageat, E., Zeder, Y., Auderset, K., Calpini, B., Clot, B., Crouzy, B., Konzelmann, T., Lieberherr, G., Tummon, F., and Vasilatou, K.: Real-time pollen monitoring using digital holography, Atmos. Meas. Tech., 13, 1539–1550, https://doi.org/10.5194/amt-13-1539-2020, 2020. a
Ščevková, J., Dušička, J., Mičieta, K., and Somorčík, J.: Diurnal variation in airborne pollen concentration of six allergenic tree taxa and its relationship with meteorological parameters, Aerobiologia, 31, 457–468, https://doi.org/10.1007/S10453-015-9379-1, 2015. a
Sevillano, V., Holt, K., and Aznarte, J. L.: Precise automatic classification of 46 different pollen types with convolutional neural networks, PLoS One, 15, e0229751, https://doi.org/10.1371/JOURNAL.PONE.0229751, 2020. a
Shang, X., Giannakaki, E., Bohlmann, S., Filioglou, M., Saarto, A., Ruuskanen, A., Leskinen, A., Romakkaniemi, S., and Komppula, M.: Optical characterization of pure pollen types using a multi-wavelength Raman polarization lidar, Atmos. Chem. Phys., 20, 15323–15339, https://doi.org/10.5194/acp-20-15323-2020, 2020. a, b
Shang, X., Baars, H., Stachlewska, I. S., Mattis, I., and Komppula, M.: Pollen observations at four EARLINET stations during the ACTRIS-COVID-19 campaign, Atmos. Chem. Phys., 22, 3931–3944, https://doi.org/10.5194/acp-22-3931-2022, 2022. a
Sicard, M., Izquierdo, R., Alarcón, M., Belmonte, J., Comerón, A., and Baldasano, J. M.: Near-surface and columnar measurements with a micro pulse lidar of atmospheric pollen in Barcelona, Spain, Atmos. Chem. Phys., 16, 6805–6821, https://doi.org/10.5194/acp-16-6805-2016, 2016. a
Sicard, M., Jorba, O., Ho, J. J., Izquierdo, R., De Linares, C., Alarcón, M., Comerón, A., and Belmonte, J.: Measurement report: Characterization of the vertical distribution of airborne Pinus pollen in the atmosphere with lidar-derived profiles – a modeling case study in the region of Barcelona, NE Spain, Atmos. Chem. Phys., 21, 17807–17832, https://doi.org/10.5194/acp-21-17807-2021, 2021. a, b
Sikoparija, B., Birgermajer, S., Ivosevic, B., Sazdovski, V., Ørby, P. V., Kloster, M., and Gosewinkel, U.: Airborne Hirst volumetric sampling gives an insight into atmospheric dispersion of pollen and fungal spores, Atmosphere-Basel, 16, 1060, https://doi.org/10.3390/atmos16091060, 2025. a
Sofiev, M.: On possibilities of assimilation of near-real-time pollen data by atmospheric composition models, Aerobiologia 2019 35:3, 35, 523–531, https://doi.org/10.1007/S10453-019-09583-1, 2019. a
Sofiev, M., Siljamo, P., Valkama, I., Ilvonen, M., and Kukkonen, J.: A dispersion modelling system SILAM and its evaluation against ETEX data, Atmos. Environ., 40, 674–685, https://doi.org/10.1016/J.ATMOSENV.2005.09.069, 2006. a
Sofiev, M., Siljamo, P., Ranta, H., Linkosalo, T., Jaeger, S., Rasmussen, A., Rantio-Lehtimaki, A., Severova, E., and Kukkonen, J.: A numerical model of birch pollen emission and dispersion in the atmosphere. Description of the emission module, Int. J. Biometeorol., 57, 45–58, https://doi.org/10.1007/S00484-012-0532-Z, 2013. a, b
Steiner, A. L., Brooks, S. D., Deng, C., Thornton, D. C., Pendleton, M. W., and Bryant, V.: Pollen as atmospheric cloud condensation nuclei, Geophys. Res. Lett., 42, 3596–3602, https://doi.org/10.1002/2015GL064060 2015. a
Tomczyk, S., Werner, M., Malkiewicz, M., Bosiacka, B., Łukasz Grewling, Grinn-Gofroń, A., Kasprzyk, I., Kluska, K., Majkowska-Wojciechowska, B., Myszkowska, D., Puc, M., Rapiejko, P., and Ziemianin, M.: Influence of meteorological conditions and climate on pollen season of the early-flowering woody taxa in Poland, Central Europe, Int. J. Biometeorol., 69, 2781–2793, https://doi.org/10.1007/s00484-025-02995-4, 2025. a
Traidl-Hoffmann, C., Kasche, A., Menzel, A., Jakob, T., Thiel, M., Ring, J., and Behrendt, H.: Impact of pollen on human health: more than allergen carriers?, Int. Arch. Allergy Imm., 131, 1–13, https://doi.org/10.1159/000070428, 2003. a
Triviño, M. M., Maya-Manzano, J. M., Tummon, F., Clot, B., Grewling, Schmidt-Weber, C., and Buters, J.: Variability between Hirst-type pollen traps is reduced by resistance-free flow adjustment, Aerobiologia, 39, 257–273, https://doi.org/10.1007/S10453-023-09790-X, 2023. a