
the Creative Commons Attribution 4.0 License.
the Creative Commons Attribution 4.0 License.
 | 13 Nov 2026
An incoherent broadband cavity-enhanced absorption spectrometer for simultaneous NO3 and N2O5 measurements, integrated into a NOy instrument suite: characterization and first field deployment
Patrick Dewald

Sergio Harb
Bénédicte Picquet-Varrault
Mathieu Cazaunau
Maxime Feingesicht
Lucas Beltran
Vincent Michoud
Xavier Landsheere
Edouard Pangui
Antonin Bergé
Christopher Cantrell
Manuela Cirtog
Reactive nitrogen species (NOy) are involved in the formation of secondary pollutants, thus following their interconversions is crucial for understanding their impact on air quality. While nitric oxide (NO) and nitrogen dioxide (NO2) are important contributors to total NOy, further constituents such as the nitrate radical (NO3) and dinitrogen pentoxide (N2O5), formed from NO2 oxidation, are key intermediates in nocturnal oxidation processes. Even though NO3 and N2O5 affect the NOy budget in the following day, their role is poorly constrained in isolated measurements. We present the “NOyBOx”, a new instrumental framework combining measurements of NO, NO2 and NOy from commercial analyzers with a custom-built incoherent broadband cavity-enhanced absorption spectrometer (IBBCEAS) that measures NO3 directly and N2O5 via a thermal dissociation inlet (TDI) and channel differencing. We describe the design of the IBBCEAS subsystem, characterize the TDI, cavity optics, transmission losses, and, using a synthetic spectra simulation approach, the bias of ambient NO2 and water vapor on our concentration retrieval procedure. Under optimal laboratory conditions we find a limit of detection (LOD) of 1.5 and 2.2 pptv (1σ Allan deviation, 15 s) for NO3 and N2O5, respectively. Under field conditions, interference by water vapor and NO2 worsens these LODs to 3.1 pptv with a total measurement uncertainty (TMU) of 12 % for NO3, and to 4.4 pptv with a mean TMU of 21 % for N2O5. Exemplary results from its first deployment during a field campaign in a temperate forest atop a 40 m tall tower are discussed.
- Article
(5314 KB) - Full-text XML
-
Supplement
(1281 KB) - BibTeX
- EndNote


Reactive nitrogen species, collectively referred to as NOy, constitute a broad class of atmospheric trace gases involved in the formation of secondary pollutants such as tropospheric ozone (O3) and particulate matter (Crutzen and Lelieveld, 2001; Kiendler-Scharr et al., 2016), as well as in the regulation of the atmosphere's oxidative capacity (Geyer et al., 2001a; Monks, 2005). Consequently, NOy species play a crucial role in air quality, human health and climate (Lelieveld et al., 2020; Wild et al., 2016). Even though natural sources of NOy emissions exist, NOy is predominantly released into the atmosphere in the form of nitric oxide (NO) through combustion processes, that is readily converted to nitrogen dioxide (NO2) in the presence of typical ambient O3 levels (Dutta et al., 2026; Logan, 1983). At the same time, NO2 is partially photolysed to NO by sunlight during the day. This interconversion between NO and NO2 is reflected in the use of the term NOx, which denotes the sum of these two species (Seinfeld and Pandis, 2012). While NOx can often form the dominant fraction of NOy in freshly polluted air masses (Pandey Deolal et al., 2012), it is progressively oxidized to a diverse suite of further (often secondary) reactive nitrogen species (NOz = NOy − NOx) including nitric acid (HNO3), nitrous acid (HONO), organic nitrates (RONO2 and RO2NO2) in both gas and particle phase (pNO3), the nitrate radical (NO3), dinitrogen pentoxide (N2O5), halogenated nitrogen species (e.g. nitryl chloride, ClNO2), and others (Finlayson-Pitts and Pitts, 2000). As air masses undergo chemical processing, the contribution of NOz to the NOy budget often increases with air mass age (Brown et al., 2017; Parrish et al., 1993; Stratmann et al., 2016). Several NOz species, notably HNO3 and organic nitrates, are sufficiently long-lived to be transported over long distances and later re-release NOx in remote regions, thereby effectively functioning as NOx reservoirs and further impacting air quality (Ito et al., 2007; Lee et al., 2016; Pye et al., 2015, 2010; Rindelaub et al., 2015).
One particularly important species among reactive nitrogen compounds crucially impacting the formation potential of particulate matter is the above-mentioned NO3 radical: It is formed from oxidation of NO2 by O3 (Reaction R1) and is in thermal equilibrium with NO2 and N2O5 (Reactions R2 and R3) (Wayne et al., 1991). Since NO3 is readily photolysed by sunlight (Reactions R4a and R4b) or rapidly reacts with NO (Reaction R5), its mixing ratios remain too low to be detected during the day (Brown and Stutz, 2012).
During the night, in the absence of sunlight and at low NO levels, NO3 has been shown to be an important oxidant for unsaturated biogenic volatile organic compounds (BVOC) such as isoprene and terpenes (Brown and Stutz, 2012; Dewald et al., 2024; Hu et al., 2023; Liebmann et al., 2019; Mermet et al., 2021; Mogensen et al., 2015; Ng et al., 2017). In urban environments, anthropogenic volatile organic compounds (AVOC), especially phenolic compounds, are also efficiently oxidized by NO3 (Bolzacchini et al., 2001; Zhang et al., 2025). These reactions between BVOC or AVOC and NO3 (Reaction R6) can yield high amounts of the NOx reservoir species detailed above including organic nitrates, nitric acid and secondary organic aerosol, all of which can significantly impact air quality, climate, and human health (Fry et al., 2014; Kumar et al., 2023; Ng et al., 2017; Schueneman et al., 2025; Wennberg et al., 2018). In addition, N2O5 (and therefore indirectly NO3) can be irreversibly removed through heterogeneous hydrolysis on e.g. aerosols (Reaction R7), producing nitrate that can be ultimately lost by wet or dry deposition (Aldener et al., 2006; Brown et al., 2009; Phillips et al., 2016). These processes can be an important sink for NOx, with NO3 and N2O5 acting as the key intermediates linking nocturnal chemistry to the removal of NOy and, consequently, to reduced ozone formation on the following day (Finlayson-Pitts and Pitts, 2000; Kane et al., 2001).
The NO3 radical is highly reactive, so its nocturnal mixing ratios rarely exceed a few parts per trillion by volume (pptv), especially in forests (Liebmann et al., 2018; Mermet et al., 2021; Yáñez-Serrano et al., 2018), and it shows strong spatio-temporal variability (Brown et al., 2007; Vrekoussis et al., 2007). Detecting it therefore requires techniques with both high sensitivity and fast time resolution.
Platt et al. (1980) made the first tropospheric NO3 measurements using differential optical absorption spectroscopy (DOAS), which determines a gas' concentration by measuring how much light of specific wavelengths it absorbs along a long open-air light path (often several km) between a light source and a distant detector. Because of its exceptional sensitivity at that time, long-path DOAS became one of the most widely used NO3 methods (Geyer et al., 2001b; McLaren et al., 2004; Platt et al., 1981; Sommariva et al., 2007). However, it only yields a concentration averaged over the whole absorption path, giving it poor spatial resolution, and it cannot operate under snow or fog (Platt and Stutz, 2008).
Since then, several alternative techniques have emerged: laser-induced fluorescence (LIF) (Matsumoto et al., 2005; Wood et al., 2003), cavity ring-down spectroscopy (CRDS) as well as cavity-enhanced absorption spectroscopy (CEAS) (Berden et al., 2000; Brown, 2003; Brown and Stutz, 2012; Lin et al., 2026). Both CRDS and CEAS work by trapping light inside an optical cavity formed by two highly reflective mirrors, so that light is reflected thousands of times before escaping. This effectively folds a path of many kilometers into a compact cell, greatly amplifying the light's interaction with trace gases without requiring a long open-air path.
CRDS has become a particularly powerful tool for measuring atmospheric trace gases, including NO3, thanks to its spatial resolution, sensitivity, and accuracy (Ball et al., 2001; Bitter et al., 2005; Dubé et al., 2006; Li et al., 2018; Lin et al., 2022; Odame-Ankrah and Osthoff, 2011; Schuster et al., 2009; Sobanski et al., 2016; Türk et al., 2026; Wagner et al., 2011; Wang et al., 2015; Wu et al., 2020). Rather than measuring absorbed light directly as in DOAS, CRDS infers concentration from how quickly light intensity decays (“rings down”) inside the cavity once a pulse (pulsed CRDS) or continuous source (cw-CRDS) is switched off: gases in the cavity absorb light and shorten this decay time, and the change in decay rate gives the concentration. Operating at a narrow wavelength range, CRDS suffers only negligible interference from O3, H2O, or NO2, achieves effective path lengths of tens of kilometers, and reaches, as recently reviewed in Türk et al. (2026), detection limits often below 1 pptv for a few seconds of averaging. It also requires less power and is smaller and lighter than DOAS setups.
Incoherent broadband cavity-enhanced absorption spectroscopy (IBBCEAS), first proposed by Fiedler et al. (2003), is a variant of these cavity techniques that has gained increasing popularity as a means of detecting NO3 in field and chamber measurements (Ball et al., 2004; Dorn et al., 2013; Fouqueau et al., 2020; Kennedy et al., 2011; Langridge et al., 2008; Ling et al., 2023; Nam et al., 2022; Suhail et al., 2019; Varma et al., 2009; Venables et al., 2006; Ventrillard-Courtillot et al., 2010; Wang et al., 2017, 2023; Wang and Lu, 2019). Unlike CRDS, which uses a single laser wavelength and needs fast-response detectors to track the decay, IBBCEAS setups consist of simpler and lower-cost components by coupling a broadband (multi-wavelength) light source into the cavity and measuring the resulting absorption spectrum, thereby avoiding the need for fast detection electronics while keeping much of the cavity-enhanced sensitivity. This gives IBBCEAS advantages of both DOAS and CRDS: like DOAS, its broadband source allows simultaneous measurement of multiple trace gases (Ling et al., 2023; Nam et al., 2022), rather than the single-species selectivity of CRDS; like CRDS, its compact optical path makes it easy to combine with other in-situ data for analyzing local atmospheric chemistry and physics. Both CEAS and CRDS are also flexible enough to deploy on ground stations, towers, vehicles, ships, and aircrafts to capture spatio-temporal variations in NO3 at local scales, and, unlike DOAS, both are largely unaffected by weather conditions.
Finally, quantifying ambient N2O5 indirectly requires thermally dissociating it into NO3 before detection by any of the techniques mentioned above (Dubé et al., 2006; Sobanski et al., 2016; Türk et al., 2026; Wang et al., 2017). Alternatively, a thermal dissociation inlet can be coupled to a chemical-ionization mass spectrometer, allowing N2O5 to be detected indirectly through the formation and subsequent detection of e.g. (Kercher et al., 2009; Slusher et al., 2004).
As detailed in Fuchs et al. (2010), NOx is commonly measured using optical methods including DOAS, CRDS, CEAS, laser-induced fluorescence (LIF), cavity attenuated phase shift (CAPS) and chemiluminescence detection (CLD). The latter quantifies NO with detection limits in the pptv range based on the detection of chemiluminescent emission of excited NO2 formed from the reaction of NO with excess O3 (Clough and Thrush, 1967; Hosaynali Beygi et al., 2011; Tadic et al., 2020). To quantify NO2, it is first converted to NO, typically by photolysis or catalytic conversion prior to entering the detection cell (Nussbaumer et al., 2021; Reed et al., 2016). A LIF-based NO2 measurement relies on excitation of NO2 at wavelengths above 400 nm and fluorescence detection above 600 nm (Day et al., 2002; Javed et al., 2019). DOAS detects ambient NO2 by exploiting its structured absorption spectrum between 400 and 600 nm, using either broadband light sources over long optical paths or natural sunlight (Leser et al., 2003; Merten et al., 2011). Cavity techniques such as CRDS, CAPS and CEAS rely on NO2 visible absorption but enhance sensitivity through long effective optical path lengths achieving excellent detection limits below 50 pptv (Fuchs et al., 2010; Gherman et al., 2008; Sobanski et al., 2016; Thieser et al., 2016; Wild et al., 2014). In case of CAPS, NO2 concentrations are deduced from the phase shift of the modulated light transmitted through the cavity, which is directly related to the optical attenuation caused by the presence of NO2 (Ge et al., 2013; Kebabian et al., 2005). NO can likewise be quantified through these techniques by first converting it to NO2 via oxidation with O3 (Friedrich et al., 2020; Ohara et al., 2024; Wüst et al., 2025).
Early NOy measurements relied on converting reactive nitrogen species to NO using heated gold or molybdenum converters, followed by chemiluminescence detection (CLD). Gold converters were designed to exclude particulate nitrate, whereas molybdenum converters also responded to particulate nitrate (Fahey et al., 1986; Williams et al., 1998). More recently, thermal dissociation techniques have been adopted, in which NOz species are thermally decomposed to NO2 prior to detection by LIF or cavity-enhanced absorption methods (Day et al., 2002; Dewald et al., 2026a; Paul et al., 2009; Wild et al., 2014). Although these approaches provide high sensitivity and speciation capability, elevated temperatures can induce secondary reactions that generate measurement artefacts. These effects can be mitigated by operating at reduced pressure or scavenging reactive radicals, although additional corrections based on laboratory calibration and chemical modelling may still be required (Womack et al., 2017; Wüst et al., 2025).
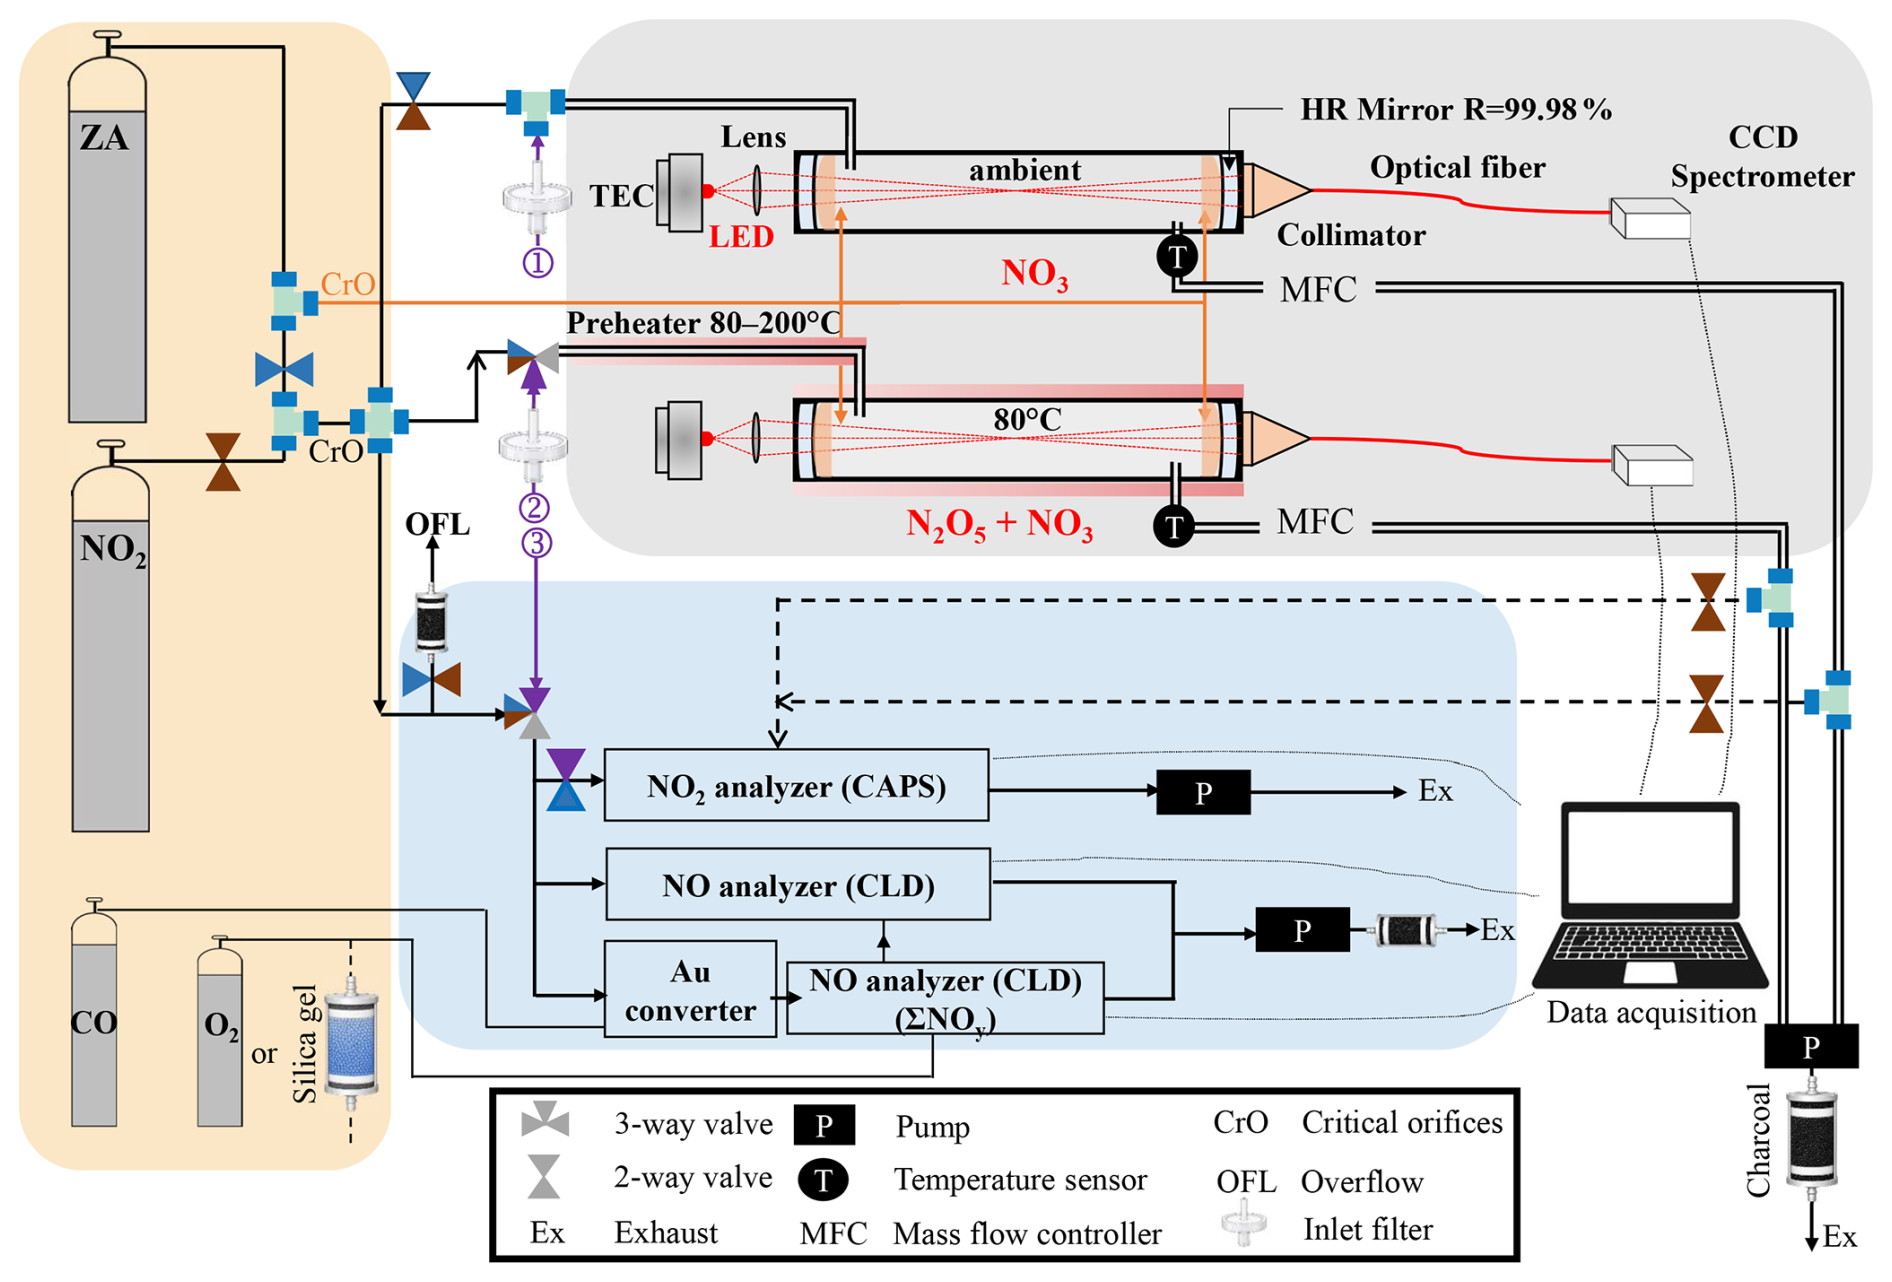
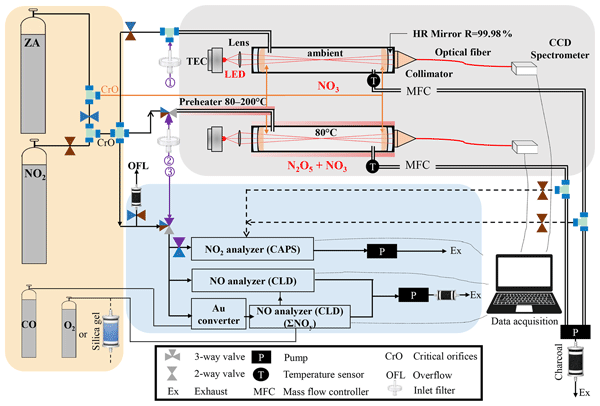
Figure 1Schematic diagram of the NOyBOx instrument. The two custom-built IBBCEAS subsystems with separate inlets 1 and 2 is shaded grey. The commercial analyzer subsystem for NO, NO2, and total gas-phase NOy is shaded blue and share inlet 3. The gas supply assembly for purging (orange solid lines), background and calibration measurements is marked in orange. The valves are coloured according to the modes (blue: background, brown: calibration, purple: sampling, grey: always open) they are active in. The black dashed lines show how the cavity exhaust flow is coupled to the NO2 analyser during calibration periods. Note that the NO3 channel's inlet is equipped with an additional charcoal filter (not shown) when calibrated with NO2.
Here, we present the NOyBOx, an integrated instrument suite that simultaneously measures NO3, N2O5, NO, NO2, and NOy. As outlined in the chemical framework above, NO3 and N2O5 can not only influence NOx-NOy partitioning but also remove reactive nitrogen from the atmosphere via heterogeneous loss of N2O5, NO3, and its oxidation products (e.g. organic nitrates, HNO3). Previous multi-channel instruments have combined NO3 N2O5 measurements with measurements of selected additional nitrogen species, such as organic nitrates and NO2 (Kennedy et al., 2011; Sobanski et al., 2016), or measured total NOy without speciated NO3 N2O5 measurements (Friedrich et al., 2020; Wild et al., 2014). One exception is a six-channel CRDS instrument as detailed in Brown et al. (2017), which included channels for O3, N2O5, NO, NO2, and total NOy, as well as NO3, although NO3 measurements were not successfully obtained during that deployment. NOyBOx combines two custom optical cavities for NO3 N2O5 measurements with commercial analyzers for NOx species and total NOy. This configuration provides the combined measurements needed to investigate the role of nocturnal oxidation processes in the reactive nitrogen budget that remains barely accessible with isolated measurements, while potentially reducing instrument complexity and cost compared with an approach based entirely on custom CRDS channels. In the following sections we describe the instrument's design, characterize its NO3 N2O5 subsystem and present results from its first field deployment during the Atmospheric ChemistRy Of the Suburban foreSt (ACROSS) campaign.
As depicted in Fig. 1, the NOyBOx instrument consists of three commercial analyzers for the measurement of NO, NO2, and NOy (blue-shaded), two custom-built IBBCEAS cavities for the quantification of ambient NO3 and N2O5 (grey-shaded), installed in a portable rack (120 cm × 80 cm × 150 cm), and a gas supply assembly (orange-shaded) for zeroing and calibration of both subsystems. The instrument can be operated in three modes: (i) ambient sampling, (ii) background measurements by supplying both subsystems with zero air (ZA) from a synthetic air cylinder (purity ≥ 99.9999 %, Air Liquide, Alphagaz), and (iii) calibration using a standard gas containing a known NO2 concentration (800 ppbv (parts per billion by volume) in N2/O2, Air Liquide). During ambient sampling, air is drawn through three dedicated inlets (Fig. 1, purple): inlet 1 supplies the NO3 IBBCEAS cavity, inlet 2 supplies the N2O5 IBBCEAS cavity, and inlet 3 supplies the commercial analyzers. The NO3 and N2O5 IBBCEAS inlets are equipped with a polytetrafluoroethylene (PTFE) membrane filter (Pall Corporation, R2PJ047) in a PTFE holder (Mace, 930-1244-101) to remove particles with a diameter bigger than 2 µm that would worsen the detection limit through scattering and deposition on mirror surfaces when entering the instrument. The commercial analyzers are equipped with internal filters. During background and calibration, gas flows are regulated by critical orifices (CrO). The mode switching in the commercial analyzer subsystem and the N2O5 channel is enabled by -way solenoid valves consisting of PTFE (Bürkert, type 0121, no. 20063588), while a 2-way solenoid PTFE valve (Bürkert, type 0121, no. 77191) in combination with a Perfluoroalkoxy alkane (PFA) T-piece (Swagelok, PFA-420-3) is used in the NO3 channel for reasons of hardware availability. Excess gas in the latter is vented via its own sampling inlet, whereas a dedicated overflow outlet (OFL) is used for the former. In both cases, the corresponding vents are equipped with removable charcoal cartridges to prevent the release of calibration gases into the ambient air. A technical scheme detailing the exact gas flows and positions of the components is available in Fig. S1 in the Supplement. Operation of the instrument is fully automated through a custom Python software, which controls the mass flow controllers (MFCs), the heaters, and the valve switching between operating modes. It also executes ambient measurements, background, and calibration sequences, and continuously acquires data from the optical cavities, gas analyzers, and auxiliary sensors (temperature, pressure). Details of the individual instrument components are provided in the following subsections.
2.1 Commercial analyzer subsystem for NO2, NO and NOy
Our measurements of NO, NO2 and NOy rely on commercial analyzers that have already been thoroughly tested in the past and are widely used by the geoscience community. Their description below is thus limited on a purely technical level and do not require any further characterization. During field operation, they are zeroed with synthetic air using the background mode. Each analyzer is generally calibrated against another commercial CLD (Horiba, APNA-370) by injecting well-defined amounts of NO and/or NO2 (typically 2–100 ppbv) into the Multiphase Atmospheric Experimental Simulation Chamber (CESAM) prior to field deployment (Wang et al., 2011). Alternatively, the analyzers were calibrated by direct injection of well-defined NO and NO2 standards using a dilution system, with NO2 additionally calibrated by gas-phase titration of excess NO with O3.
2.1.1 NO2 analyzer
A CAPS instrument (TELEDYNE API, Model T500U) measures NO2 via absorption of radiation from a light emitting diode (LED, 450 nm center wavelength) inside a cavity equipped with two highly-reflective mirrors and a vacuum photodiode detector. The cavity is thermostated (45 °C) to prevent water condensation on the mirror surfaces and minimize temperature-induced variations in the NO2 absorption cross section. It features a low zero drift (< 0.1 ppbv d−1) and provides a limit of detection (LOD) of 40 pptv (30 s) with a relative precision of 0.5 %. The analyzer samples with ca. 0.9 standard (STP) litres per minute (SLPM).
2.1.2 NO analyzer
NO was measured using a chemiluminescence-based NO analyzer (ECO PHYSICS CLD 780 TR). Excess O3 required for NO detection (see above) is supplied by an integrated ozone generator operated under low pressure (ca. 14 mbar) maintained by an external vacuum pump. The instrument's limit of detection is 10 pptv (1 min), with a sample flow rate of 3 SLPM. The ozone generator can be fed with either pure O2 or dry ambient air (0.3 SLPM); both configurations were used during the ACROSS campaign (Sect. 4). When operating on ambient air, we dried the supply air using a silica gel cartridge that was periodically renewed. Note that maximum sensitivity and accuracy was achieved when supplying the ozone generator with pure O2.
2.1.3 NOy analyzer
NOy are transformed to NO by a gold converter (ECO PHYSICS CON 765) and detected by a second ECO-PHYSICS CLD 780 TR analyzer. This converter operates by reducing all NOy species through a reaction with CO catalyzed on a gold surface at high temperature (300 °C). The sample flow is set to 3 SLPM and the CO flow is 0.03 SLPM. The NO analyzer was first calibrated alone, with the gold converter disconnected, either using the CESAM chamber or direct injections (see above). The converter was then reconnected and its conversion efficiency determined by generating a known NO2 concentration and comparing the resulting NOx signal to that of the Horiba APNA-370 analyzer, yielding a conversion efficiency of 88 %.
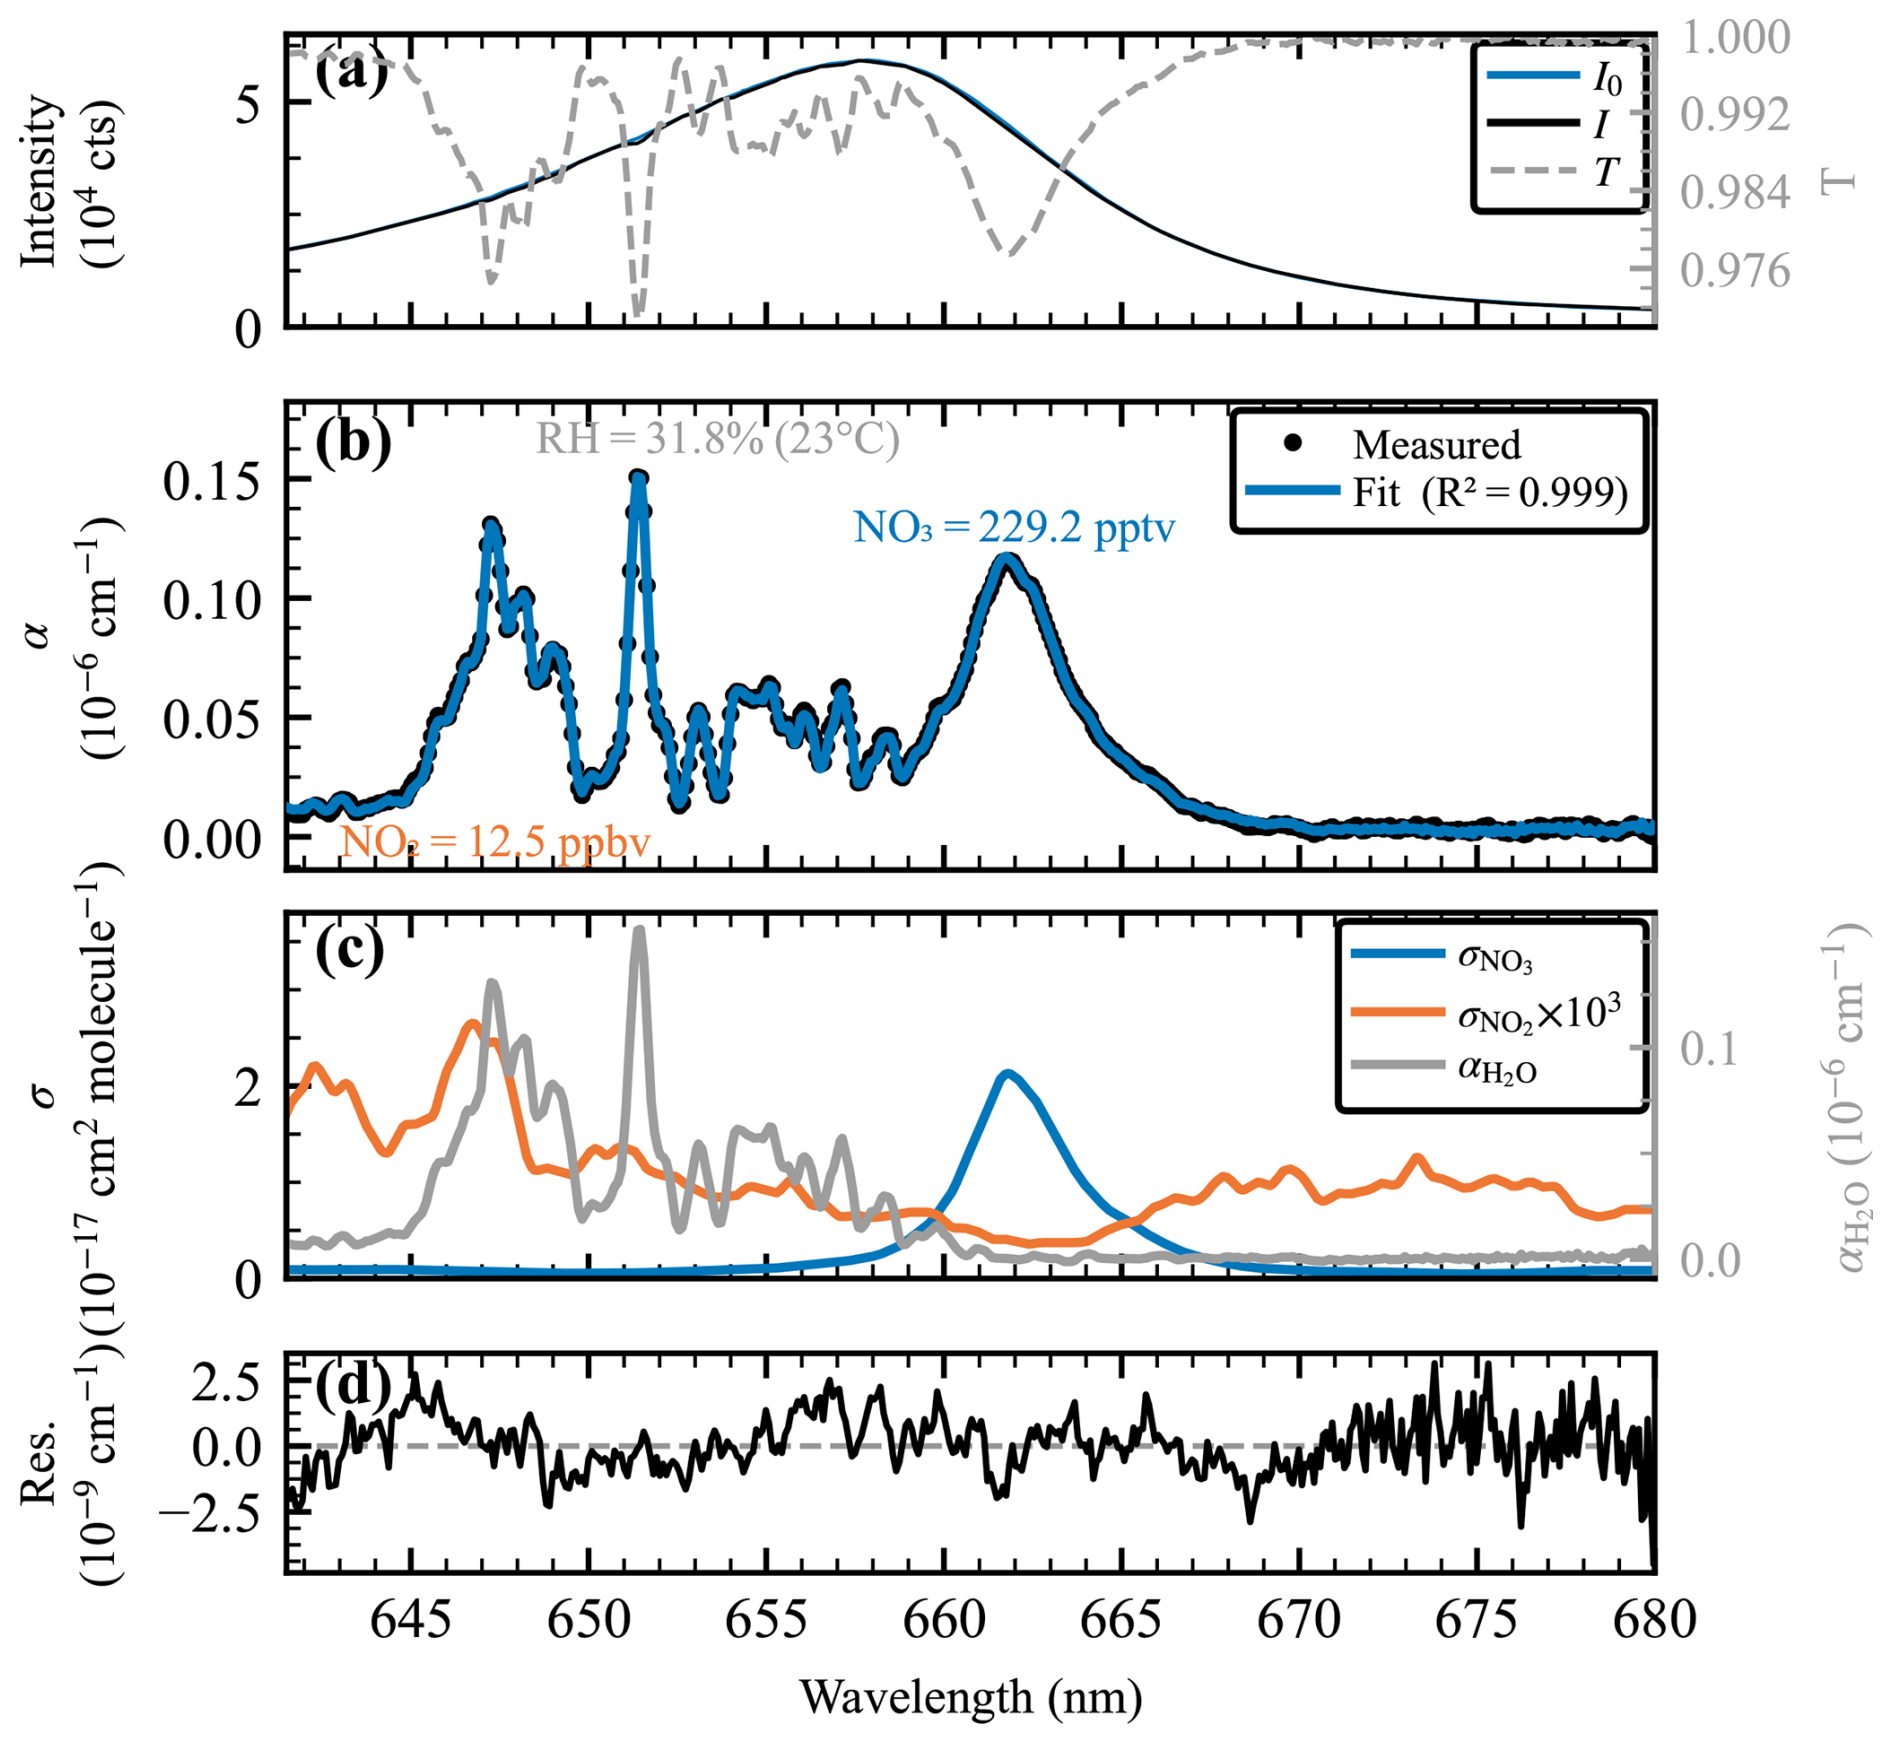
Figure 2Exemplary IBBCEAS spectral retrieval for a representative measurement at the simulation chamber CESAM with the NO3 channel: (a) Raw spectra I0 (reference, blue) and I (sample, black) with the corresponding transmission on the right axis (grey dashed). (b) Measured effective absorption coefficient α (black dots) and best-fit model (blue line); retrieved concentrations are annotated. (c) Reference absorption cross-sections of NO3 (blue, Orphal et al., 2003) and NO2 × 103 (orange, Vandaele et al., 1998) convolved with the instrument spectral response function on the left axis, and the effective H2O absorption coefficient (RH = 33 %, 23 °C) on the right axis (grey). (d) Fit residual (black solid line).
2.2 IBBCEAS subsystem for NO3 and N2O5
The two IBBCEAS channels (Fig. 1, grey-shaded) exploit the extended optical path length achievable within a high-finesse optical cavity in order to attain a sufficiently high sensitivity to detect NO3 and N2O5 at ambient concentration levels. Both channels target the strongest absorption band of NO3 at 662 nm (Orphal et al., 2003). To enable detection of N2O5, the sample air is first passed through a 1 m PFA thermal dissociation inlet (TDI) operated at 80–200 °C (residence times of 0.12–0.16 s), which quantitatively dissociates N2O5 into NO3 and NO2 (Reaction R3). The resulting stream then enters the N2O5 cavity, maintained at 80 °C to suppress the reverse recombination reaction (Reaction R2). The signal in this channel reflects the sum of ambient NO3 and N2O5, from which N2O5 is isolated by difference with the NO3 channel (see below). Although this cavity technically detects the sum of two components, for simplicity we refer to it as the N2O5 channel throughout the text. Gas flows through both cavities (7 SLPM for NO3 and 5 SLPM for N2O5 resulting in residence times of 1.31 and 1.53 s, respectively) are regulated by dedicated mass flow controllers (Alicat, MCP-20SLPM) and operated at a fairly stable intracavity pressure (970 mbar, typical value at ground level), before being combined, pumped through a charcoal trap, and vented. All connections and lines upstream the cavity consist of PFA to ensure reduced NO3 losses.
2.2.1 Light source
In each channel, light is provided by a thermally stabilized red LED (NO3: Mouser Electronics – Starboard, Luminus SST-10-DR-B130 Deep Red, max. 430 mW; N2O5: Thorlabs M660D2) with a near-Gaussian emission profile centered at 657.4 nm (FWHM 18 nm) and 660.4 nm (FWHM 21 nm) for the NO3 (Fig. 2a, blue line) and N2O5 channels, respectively. Precise thermal regulation to ± 0.01 °C (as specified by the manufacturer) via a thermoelectric cooler (Arroyo Instruments, Laser Mount) driven by a laser diode controller (Arroyo Instruments, model 6310), at operating currents of 650 and 1150 mA for the NO3 and N2O5 channels, suppresses wavelength drift and intensity instabilities that would otherwise corrupt the spectral baseline. The different operating currents originate from deploying two different types of LEDs. Under these operating conditions, we observed no statistically relevant long-term drifts in the centre wavelength with values (± 2σ) of (7.3 ± 7.6) pm h−1 (NO3) and (4.7 ± 3.4) pm h−1 (N2O5), which are below the spectrometer's resolution (> 140 pm, see below). The divergent LED emission is collimated and focused to the cavity midpoint by an aspheric condenser lens (Thorlabs ACL2520U, 25.0 mm diameter, f = 20 mm, NA = 0.79), ensuring efficient coupling into the cavity.
2.2.2 Cavity
The core of the instrument is a pair of high-finesse optical cavities, each formed by two high-reflectivity mirrors (Layertec, planar/concave, radius of curvature 1 m, diameter 25 mm, nominal reflectivity (99.98 ± 0.01) % at 630–690 nm) separated by 61.5 cm. At this reflectivity, light undergoes thousands of round trips before exiting, accumulating an extended effective path length that is the origin of the technique's sensitivity. The cavity body is a stainless-steel tube (internal diameter 18.5 mm) coated with PFA and sealed with O-rings at each mirror mount. Since any loss of mirror reflectivity directly degrades measurement sensitivity – as made explicit by Eq. (1) below – each mirror is continuously purged with clean and dry zero air (100 sccm, Fig. 1 orange lines) from the gas cylinder (purity ≥ 99.9999 %), delivered through three -inch (inner diameter) PFA tubing regulated by critical orifices at an upstream pressure of 1.5 bar, preventing aerosol deposition or condensation of semi-volatile compounds on the mirror surfaces.
2.2.3 Detection
The light transmitted through the cavity carries the spectral imprint of the intracavity absorbers. It is collected by a fiber-coupled collimator (Thorlabs, F810-SMA, f = 35.41 mm, NA = 0.25), guided via an optical fiber (Ocean Optics Vis–NIR, 200 µm slit, 1.5 m) to a dedicated spectrometer (Ocean Optics, QE65000) with a CCD thermoelectrically cooled to −15 °C to minimize dark current, and covering 617–724 nm (107 nm bandwidth) and 639–685 nm (46 nm bandwidth) for the NO3 and N2O5 channels, respectively.
2.2.4 Spectral fitting and calculation of ambient mixing ratios
The wavelength-dependent (λ) absorption coefficient of the intracavity sample, α(λ), is then retrieved from the ratio of the transmitted intensities measured in the absence (I0, Fig. 2a, blue) and presence (I, Fig. 2a, black) of the absorbing species (Engeln et al., 1998):
where (Fig. 2a, grey dashed), R(λ) is the mirror reflectivity, and deff is the effective mirror distance. Equation (1) makes explicit that I0(λ) and R(λ) must be characterized regularly, which is why each is determined, as mentioned above, through a dedicated operating mode: The reference spectrum I0(λ) is recorded in background mode using zero air. The mirror reflectivity R(λ) is determined in calibration mode by introducing a known concentration of NO2 from the standard (800 ppbv) into the cells (see Sect. 3.2).
With I0(λ) and R(λ) established, α(λ) is fully constrained during ambient sampling (Fig. 2b, black), and the concentrations of individual absorbers are retrieved by fitting their known absorption cross-sections using a least-squares (differential evolution) algorithm (Storn and Price, 1997) implemented in a custom Python data processing routine including SciPy (Virtanen et al., 2020):
where σi(λ) () and Ni () are the absorption cross-section and concentration of species i, and p(λ) is a cubic polynomial baseline correction accounting for residual source intensity fluctuations (Venables et al., 2006) and particle extinction within the cell (Varma et al., 2013).
Within the spectral range used to monitor NO3, absorption features from NO2, H2O and O3 are also present. However, given their atmospheric abundances and cross-section magnitudes (Keller-Rudek et al., 2013), all of these contribute meaningfully to the retrieved absorption. In order to quantify NO3 accurately, the interference by H2O and NO2 must be accounted for by including their absorption cross-sections in the fitting routine. The strictly monotonic behaviour of the O3 absorption spectrum in the considered spectral region allows its contribution to be accounted for within the polynomial baseline correction p(λ). The NO3 and NO2 reference cross-sections used in the spectral fitting are taken from Orphal et al. (2003), with a peak value of (2.13 ± 0.06) × 10−17 at 298 K and 662.05 nm (Fig. 2c, blue), and Vandaele et al. (1998), respectively (Fig. 2c, orange). Both reference spectra were convolved with the instrument spectral response function.
Since NO3 absorption cross-sections are temperature-dependent (IUPAC, 2026), a correction was applied when fitting spectra from the heated N2O5 cavity (353 K): the convolved cross-section from Orphal et al. (2003) was scaled by the ratio of the 662 nm band peak intensity at 298 and 353 K following Osthoff et al. (2007), yielding a value of (1.70 ± 0.10) × 10−17 at 353 K. For NO2, the ambient-temperature reference spectrum (Vandaele et al., 1998) was scaled using the ratio of the cross-sections between 640–650 nm at 298 and 353 K as reported by Davidson et al. (1988).
Water vapor presents a particular challenge, as its absorption bands partly overlap with those of NO2 and NO3, and the relative intensities of its rotational lines vary with ambient humidity and temperature (Aliwell and Jones, 1996), precluding the use of a single synthetic reference spectrum. To circumvent this, we use H2O reference spectra measured in-situ in the absence of NO3 N2O5 (e.g. clean daytime ambient air, laboratory air or humidified synthetic air from a chamber, Fig. 2c, grey). Since such a reference is an empirical spectrum rather than a literature cross section, it is expressed as an absorption coefficient α as derived from Eq. (1). The H2O reference in Fig. 2c was obtained by sampling laboratory air shortly before the experiment with its humidity (33 % RH at 23 °C) taken from a laboratory hygrometer reading (C2AI, Comet T7318) at the time of recording. The H2O amount in a sample spectrum is then retrieved from the fitted scaling factor of this reference; for example, the 31.8 % RH in Fig. 2b is the scaling factor multiplied by the reference RH. This approach is quantitative only if the reference is recorded shortly beforehand under conditions (in particular temperature) similar to those of the sample. Under such conditions, the retrieved RH agrees well with the CESAM chamber hygrometer (Vaisala HMP234), as suggested by a linear regression analysis yielding a slope (± 2σ) close to unity (1.01 ± 0.09, Fig. S2). While CEAS principally allows simultaneous retrieval of multiple species in the general case (Nam et al., 2022), accurate quantification of NO2 and H2O can be impeded by potential residual NO2 in the reference or variability in H2O relative band intensities in our approach, especially when reference and sample conditions differ. As discussed below with a synthetic spectra analysis (see Sect. 3.5), for accurate NO3 quantification, what matters is that the NO2 and H2O absorption structures are represented in the fit, not the accuracy of the retrieved NO2 amount: While NO2 quantification is strongly biased in the presence of water, the NO3 retrieval accuracy is only marginally impacted. An example fit along with the retrieved concentrations is shown in Fig. 2b (blue line) for a mixture NO3 NO2 H2O generated in CESAM simulation chamber (https://www.cesam.cnrs.fr/, last access: 9 November 2026). Note that in this example fit, constraining NO2 to the CAPS measurement (17.9 ppbv) would alter the retrieved NO3 amount by less than 0.5 %. To improve fit accuracy, spectral points near the characteristic absorption features of NO3 (662 nm), NO2 (642 nm), and H2O (651.5 nm) were weighted more heavily via a Gaussian boost function centered on each species' band. In this routine, NO3 is the target species; NO2 and H2O are fitted mainly to account for their spectral interference, and their retrieved amounts are subject to larger uncertainty. Following the example of commonly used fitting routines such as DOASIS (Kraus, 2006), spectral shift and squeeze were treated as free fit parameters (shift bounded to ± 0.1 nm, squeeze to ± 1 %), rather than fixed values, leading to very low fit residuals (Fig. 2d).
After the purely spectral concentration retrieval, final correction accounts for the loss of NO3 on surfaces along the sampling path as thoroughly discussed in earlier publications (Fuchs et al., 2008; Türk et al., 2026). In our NO3 channel, the fitted concentration () must be corrected for the transmission efficiency through the filter (TFilter) and cavity () according to Eq. (3):
Since NO3 transmission is not necessarily identical across the two channels, deriving N2O5 by channel differencing requires a slightly more general expression similar to that derived by Türk et al. (2026):
with the fitted NO3 concentration in the N2O5 channel , the corrected NO3 concentration [NO3] calculated from Eq. (3), and the transmission efficiencies through filter and the combined transmission of TDI and N2O5 cavity (). Note that NO3 resulting from N2O5 dissociation only resides in the cavity, therefore a slightly higher transmission has to be applied (, Türk et al., 2026). As discussed below, heterogeneous N2O5 losses within the instrument are not considered. Cavity temperature and pressure, monitored at the outflow of each cavity, are used to convert all retrieved concentrations from to mixing ratios. When the NO3 cavity temperature strongly differs from ambient temperature, NO3 levels must be corrected to account for the shift in the highly temperature-dependent NO2-NO3-N2O5 equilibrium (Reactions R2 and R3) during the residence time in the cavity.
The retrieval of NO3 and N2O5 concentrations from IBBCEAS measurements requires accurate determination of the cavity absorption coefficient as described in Sect. 2. According to Eq. (1), the absorption coefficient depends on the effective cavity length (deff) and the mirror reflectivity (R). The effective cavity length accounts for the reduction of the geometric cavity length caused by the mirror purge flows and is therefore required to determine the true optical path within the cavity. Once deff has been established, R can be determined, enabling calculation of the wavelength-dependent cavity absorption coefficient and, consequently, quantitative retrieval of NO3 and N2O5 concentrations through the spectral fitting procedure according to Eq. (2).
Additional instrument characterizations are required to account for the thermal conversion and sampling efficiencies as shown in Eqs. (3) and (4) of the measurement system: Since N2O5 is quantified via thermal dissociation to NO3, a thermogram is recorded to determine the temperature at which maximum conversion is achieved, ensuring quantitative conversion while avoiding unnecessary heating. Furthermore, transmission losses throughout the sampling and optical path are characterized to determine the fraction of NO3 reaching the cavity. These characterization steps require to sample stable amounts of NO3 (and N2O5) through the NO3 N2O5 subsystem. To achieve this, we mixed 10–50 sccm (standard (STP) cubic centimetre per minute) of NO2 from the calibration bottle (800 ppbv) with O3 in a Teflon-coated (FEPD-121, Chemours) 0.4 L glass reactor. Ozone was generated by 185 nm photolysis of O2 in a 60 sccm flow of dry zero air. The resulting ca. 70–110 sccm reactant flow leads to a residence time of ca. 5 min and was diluted in 5 and 7 SLPM dry synthetic air prior to sampling through the NO3 and N2O5 channel, respectively. In this configuration, NO3 + N2O5 mixing ratios of 0.05–1 ppbv were attained.
3.1 The effective cavity length
As indicated above, the presence of a zero air purge flow (100 sccm) to prevent the deposition of particles on the mirror surfaces reduces the geometric cavity path length of 61.5 cm to an effective cavity length deff. To estimate it we coupled the NO3 source to the cavities and took the ratio of the signals from both NO2 and NO3 absorption obtained with and without mirror purge flow. Averaging the ratios across both analytes and three separate experiments result in effective cavity lengths (± 2σ) of (59.7 ± 1.1) and (60.3 ± 0.9) cm for the NO3 and N2O5 channel, respectively. Note that both values are, within their associated uncertainties, consistent with the reduction of the geometric cavity length to 60.6 and 60.3 cm, respectively, predicted from the cavity-to-sample-flow ratio (i.e. the pure dilution effect).
3.2 The mirror reflectivity
Equation (1) emphasizes the need of precise knowledge of the wavelength-dependent mirror reflectivity R(λ). The two most common methods to determine R(λ) include: (i) measuring a known concentration of a stable absorbing gas compound (Venables et al., 2006; Ventrillard-Courtillot et al., 2010), and (ii) measuring the ring-down time or the phase shift (Ball et al., 2004; Kennedy et al., 2011; Langridge et al., 2008). In this study we use the first method by purging the cavities with NO2 taking advantage of its absorption across the entire spectral region of the LED emission, its well-known absorption cross sections (in ) as well as its precisely known concentrations injected from the gas cylinder ( in molecule cm−3) thanks to the coupled NO2 analyzer directly measuring each cell outflow during the calibration process (Fig. 1 dashed black lines). Together with deff (Sect. 3.1) and the directly measured transmission T(λ), the reflectivity R(λ) is deduced using Eq. (5):
To compensate for the weak absorption cross-section of NO2 in the 660–670 nm spectral range (Fig. 2b, orange), high NO2 mixing ratios (400–800 ppbv) were used to reduce the uncertainty in the mirror reflectivity determination. Figure 3 shows representative wavelength-dependent reflectivity measurements for both cavities. Between 640 and 670 nm, R(λ) ranged from 99.9866 % to 99.9886 % in the NO3 cavity (blue points) and from 99.9768 % to 99.9837 % in the N2O5 cavity (orange points). Linear regression (solid lines) of the reflectivity yielded (1.18 ± 1.58) × 10−8 nm−1 × λ + 99.987 % and (4.81 ± 0.75) × 10−8 nm−1 × λ + 99.949 %. The slope for the NO3 cavity is not significantly different from zero, indicating no evidence for a systematic wavelength dependence of R over the investigated spectral range. In contrast, the N2O5 cavity exhibits a statistically significant positive slope. Given the relatively small magnitude, the scatter of this variation and the greater uncertainty in the NO2 absorption cross sections at 353 K compared with 298 K, the observed wavelength dependence may partly reflect systematic uncertainties in the reflectivity determination rather than an intrinsic wavelength dependence of R.
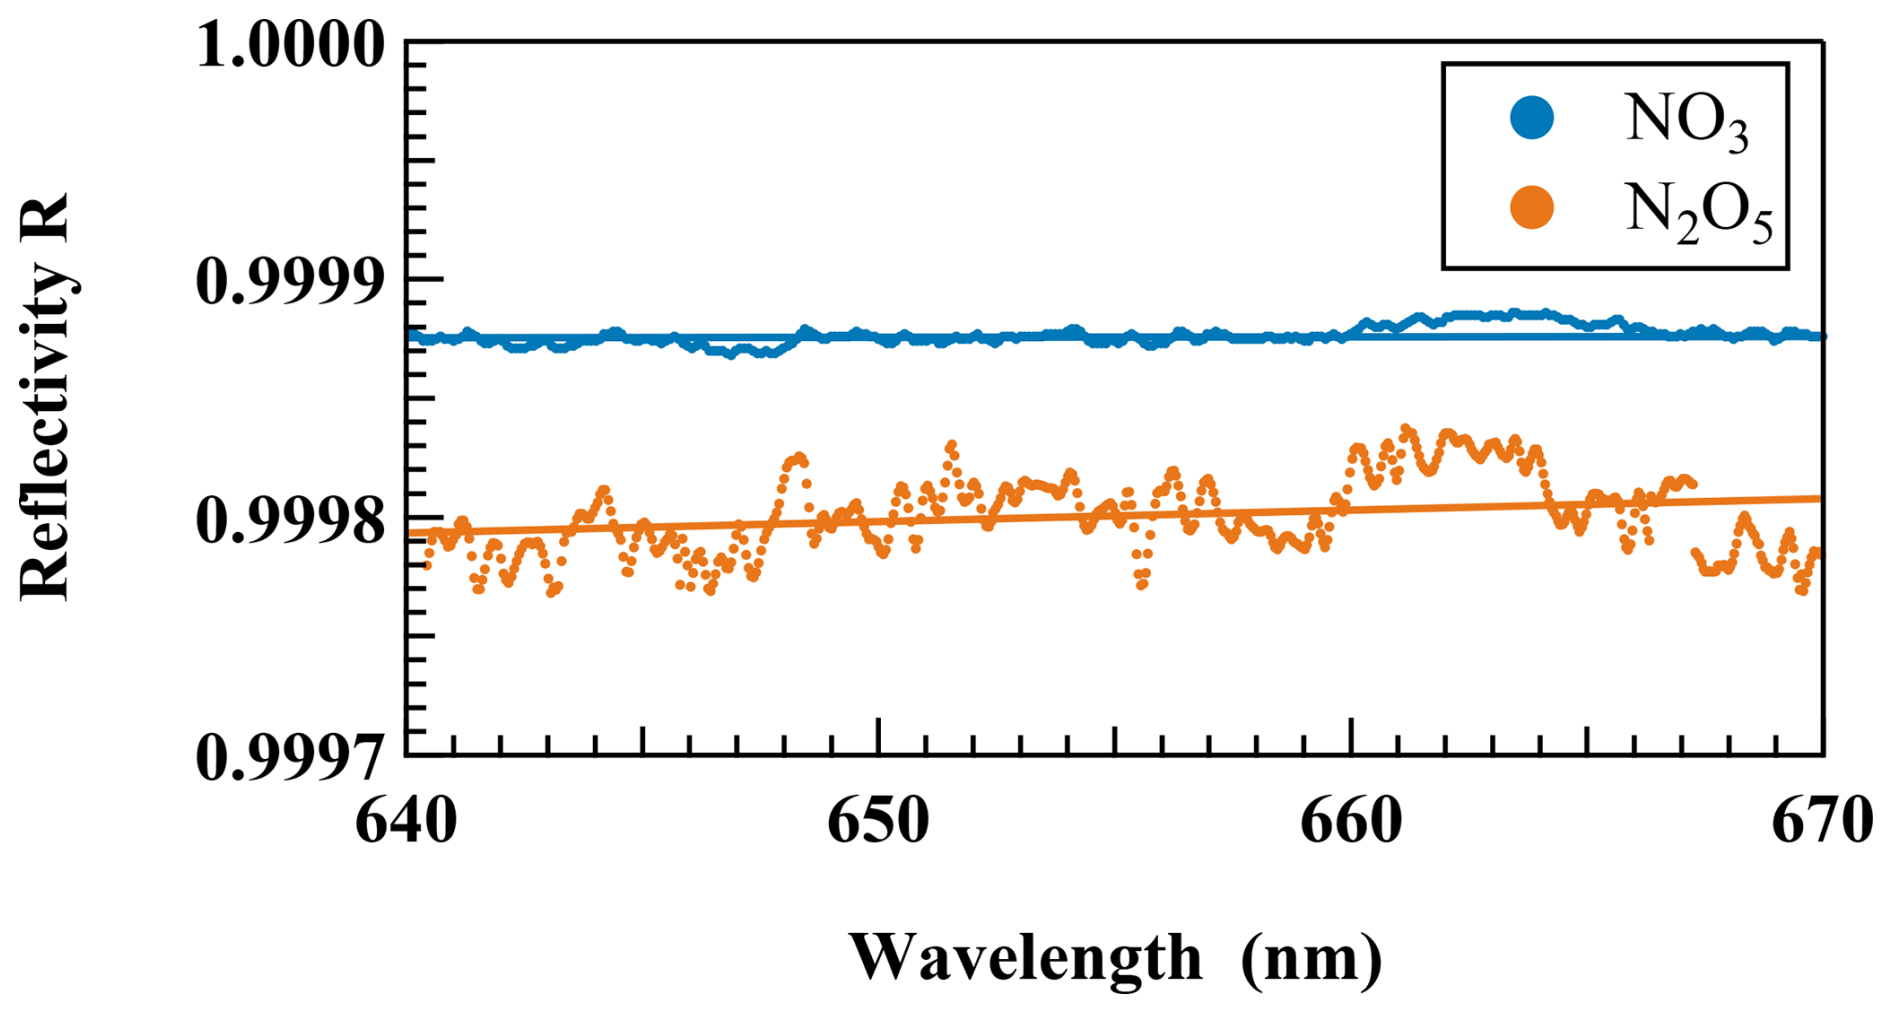
Figure 3Exemplary mirror reflectivity measurements for the NO3 (blue circles) and N2O5 (orange circles) channels along with linear regressions (same coloured solid lines).
At 662 nm, corresponding to the NO3 maximum absorption, the reflectivity was found to be 99.988 % for the NO3 channel and 99.984 % for the N2O5 channel, in good agreement with the manufacturer's specifications ((99.98 ± 0.01) % at 630–690 nm). The corresponding overall optical path lengths L(λ) were calculated with as 5.1 and 3.8 km, for the NO3 and N2O5 channel, respectively.
Mirror reflectivity was also found to depend strongly on mirror cleanliness. During the ACROSS campaign (the instrument's first field deployment), the reflectivity at 662 nm varied between 99.983 % and 99.988 % for the NO3 channel, corresponding to changes in L by a factor of 0.7, underlining the necessity of daily (or even more frequent) mirror reflectivity measurements.
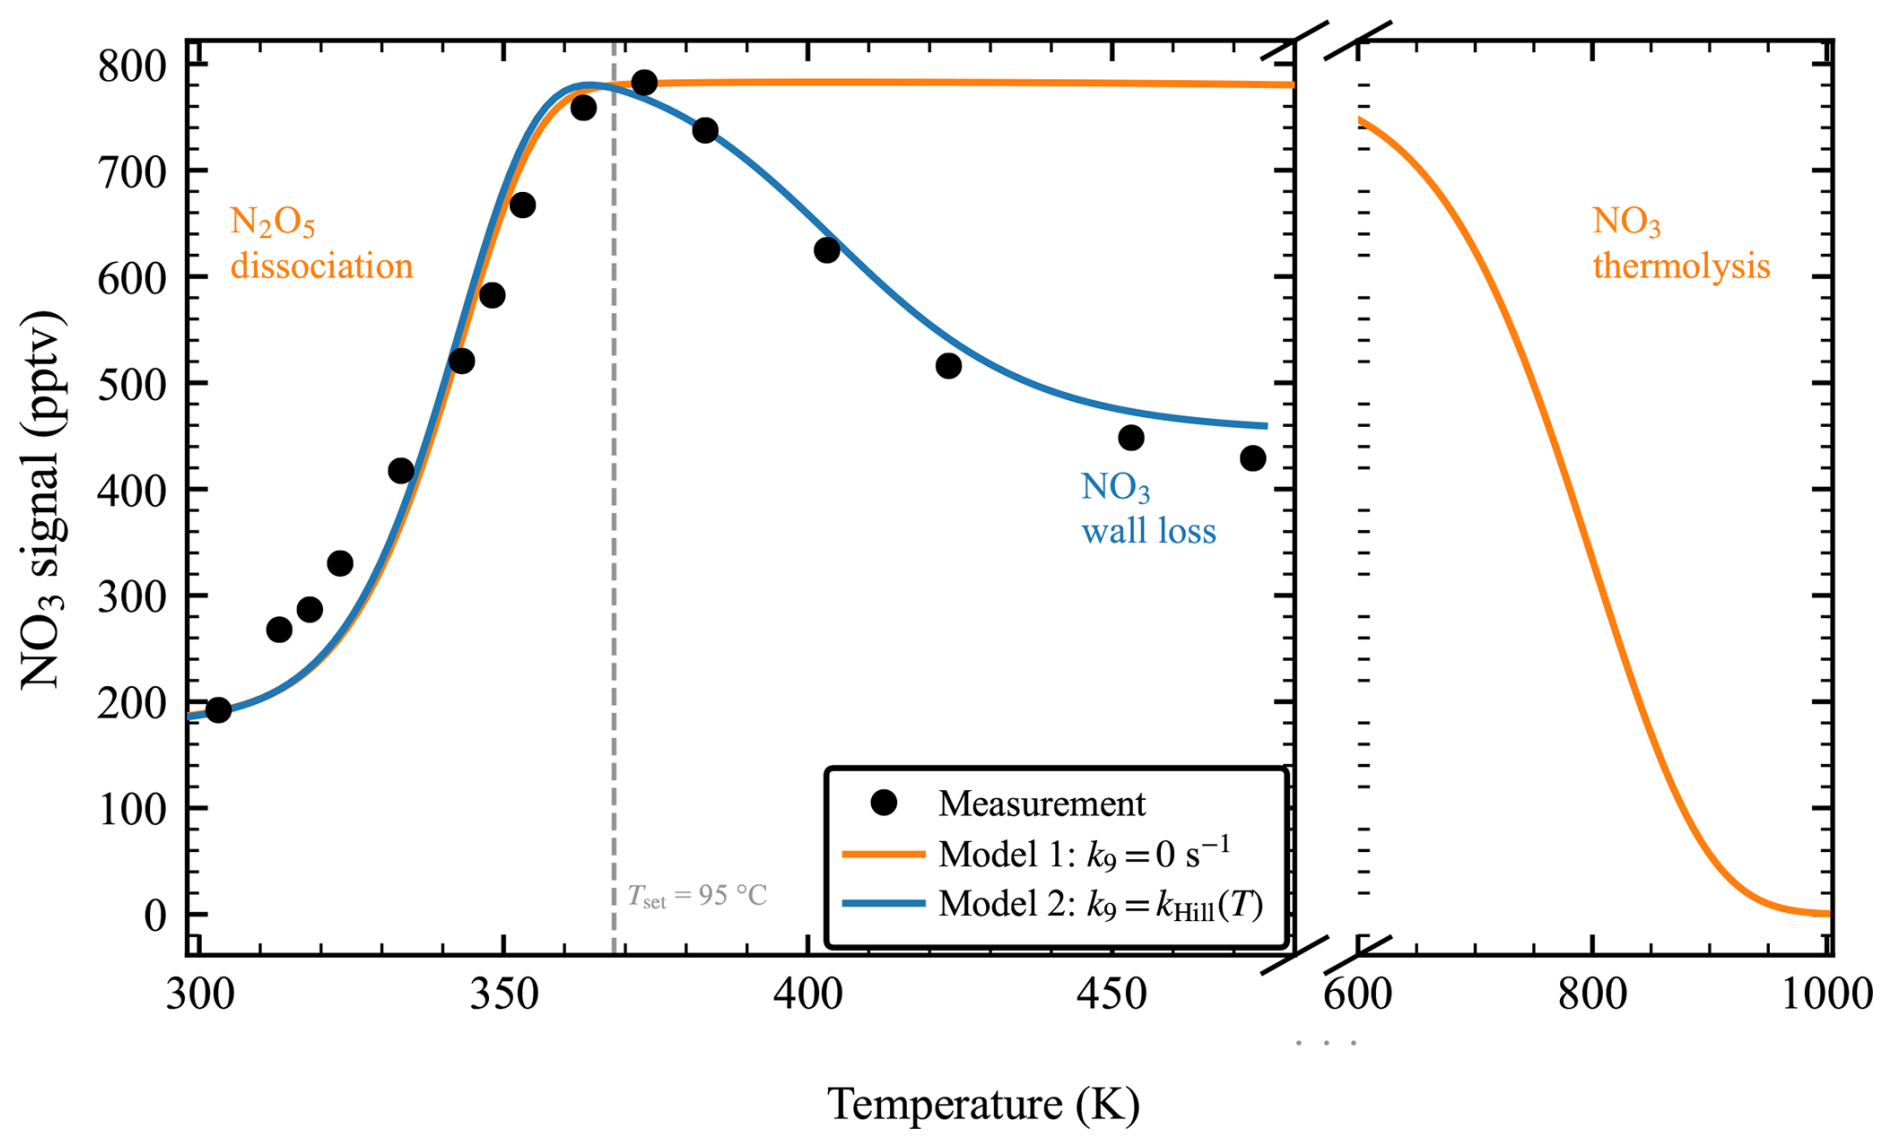
Figure 4NO3 equivalents detected in the unheated N2O5 cavity (black points) resulting from NO3 and thermally dissociated N2O5 provided from the glass reactor as a function of the preheater temperature setpoint (“thermogram”). Model 1 (orange line) shows the theoretically expected thermogram between 300 and 1000 K using IUPAC-recommended reaction rate coefficients for k2 and k3 as well as k8 according to Womack et al. (2017). Model 2 includes a temperature-dependent NO3 wall loss rate () and was adjusted to reproduce the observations. The vertical grey dashed line indicates the optimal temperature setpoint of 95 °C.
3.3 The thermal dissociation of N2O5
Detection of ambient N2O5 requires its thermal dissociation to NO3 via the TDI mentioned in Sect. 2.2. To determine the TDI heater temperature needed for quantitative N2O5 conversion, we coupled our NO3 source upstream of the TDI and the N2O5 cavity, varying the TDI setpoint temperature between 300 and 473 K while recording the signal in the unheated N2O5 cavity, which thus served solely to characterize TDI conversion efficiency. The resulting NO3 signal as a function of TDI temperature (the “thermogram”) is shown in Fig. 4 (black points). N2O5 dissociation increases continuously above 300 K, reaching a maximum at 373 K; above this temperature, the signal decreases following a sigmoidal shape before levelling off between 450 and 475 K.
This behaviour prompted us trying to reproduce the observation and to run numerical simulation using FACSIMILE (Curtis and Sweetenham, 1987) based on the residence time in the TDI and cavity (derived from their volumes and the flow rate) together with the relevant reaction rate coefficients, including the NO3–N2O5–NO2 thermal equilibrium (k2 and k3; IUPAC, 2026), NO3 thermolysis (k8, Womack et al., 2017) and an NO3 wall loss reaction (Reaction R9):
In order to verify if our observations are consistent with known gas-phase chemistry, we set k9 to 0 s−1 in Model 1 (Fig. 4, orange). This model reproduces the N2O5 dissociation up to 373 K very well, but predicts a plateau beyond the maximum, since NO3 thermolysis only becomes significant above 600 K – implying that a heterogeneous process, active only above 373 K, must be responsible for the observed decline. We reproduced the observations empirically with Model 2 by adding a Hill-type, temperature-dependent wall-loss term k9=kHill(T) = : an arbitrarily chosen constant background loss (0.1 s−1) between 300 and 373 K, followed by a sigmoidal increase in k9 to 0.4 s−1 between 373 and 473 K. Such behaviour is consistent with a surface process governed by an activation barrier – for instance, the desorption of a passivating layer once a threshold temperature is exceeded. The background loss of 0.1 s−1 is consistent with the wall loss we estimated for our unheated NO3 cavity (see below) while the high temperature wall loss of 0.4 s−1 appears plausible considering that previous studies report NO3wall loss rates that are 3–4 times higher in heated Teflon (or Teflon-coated) tubes than in their unheated equivalents (Sobanski et al., 2016; Türk et al., 2026). We find that 95 °C (grey dashed line) is the optimal TDI temperature, as it guarantees quantitative N2O5 conversion and lower NO3 wall losses.
N2O5 detection typically relies on quantitative thermal conversion to NO3 at a fixed, elevated temperature, with TDI temperature commonly verified by calculating the thermal N2O5 lifetime or via thermograms based on NO2 (Friedrich et al., 2020; Womack et al., 2017), but rarely on NO3 detection (Dubé et al., 2006; Fuchs et al., 2008). Dubé et al. (2006) determined the conversion efficiency at temperatures up to only 150 °C and saw a marginal decrease above 130 °C. Fuchs et al. (2008) focused on the interplay of sampling flow, TDI temperature and conversion efficiency rather than discussing thermograms at a fixed flowrate. The behaviour observed here underscores the importance of thoroughly verifying the optimal TDI temperature based on NO3 detection, as done in this study.
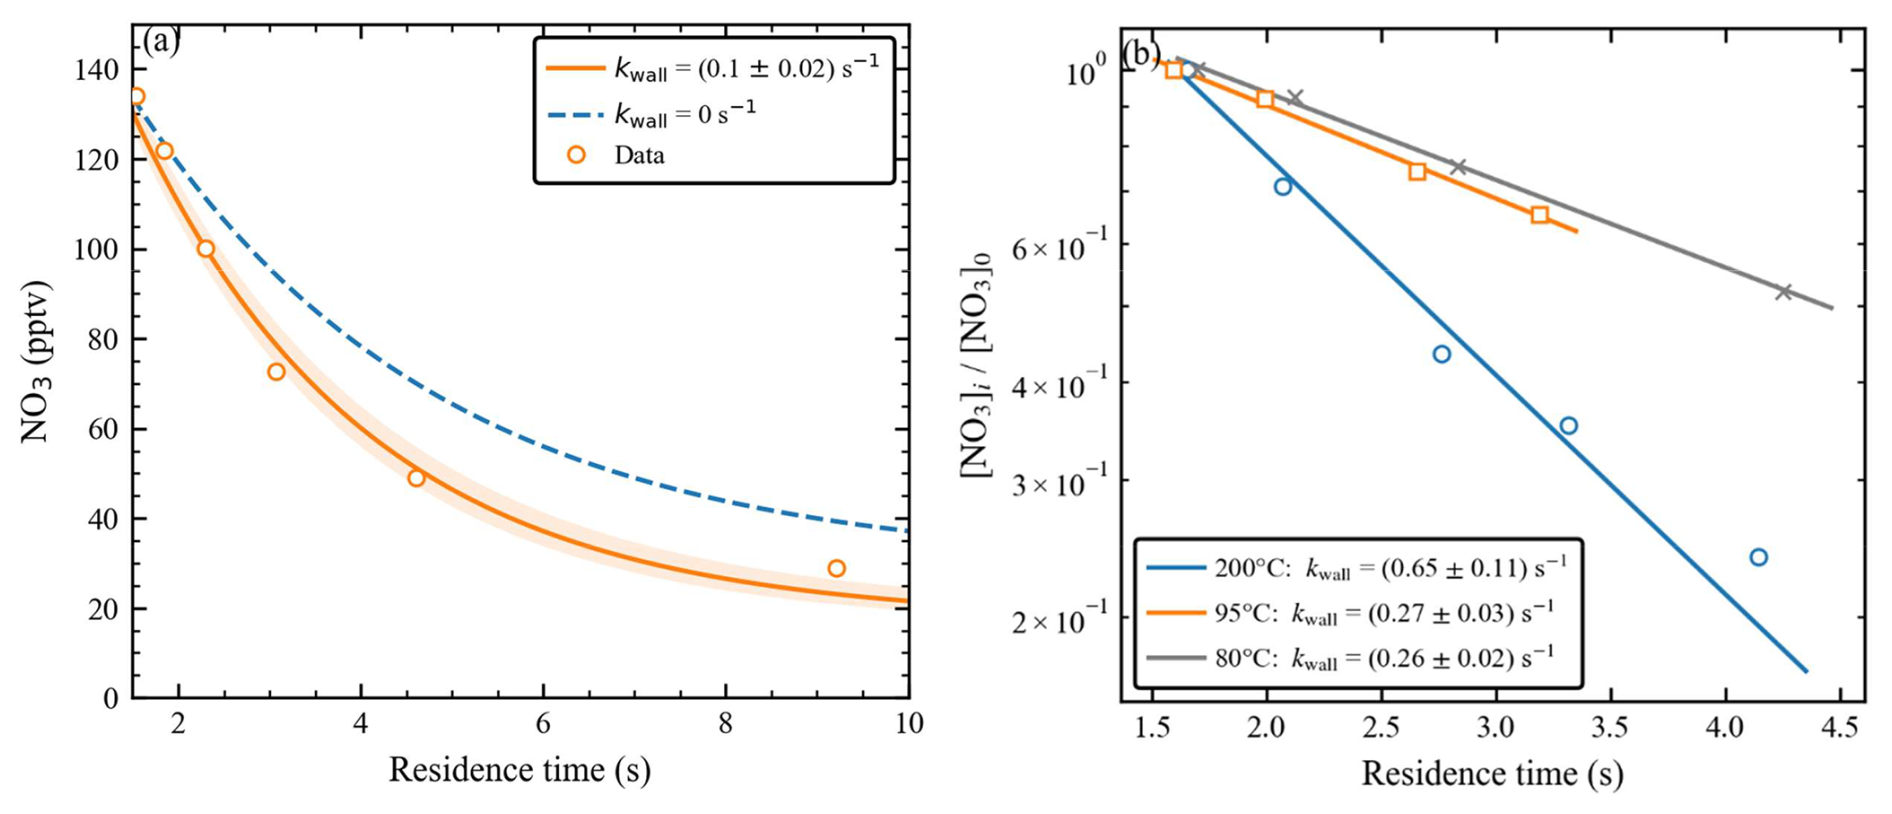
Figure 5(a) Dependency between residence time and measured NO3 mixing ratios (orange circles) in the NO3 cavity. The blue dashed line indicates modelled NO3 mixing ratios accounting for reestablishment of the thermal equilibrium while the solid orange line shows a model run including an NO3 wall loss rate adjusted to reproduce observations. (b) Dependency between measured NO3 mixing ratios and the summed residence time in N2O5 cavity (maintained at 80 °C) and TDI heated at 80 °C (grey crosses), 95 °C (blue circles) and 200 °C (orange squares). Solid lines in the same colour represent corresponding linear regressions. The slopes ± 2σ are indicated in the legend and correspond to the NO3 wall loss rate.
3.4 Losses of NO3 during sampling
NO3 is a highly reactive radical prone to surface losses during sampling. While inert materials (PFA, FEP, halocarbon wax) and short residence times minimize these losses, they remain a significant artefact in cavity systems (Fuchs et al., 2008). NO3 (and N2O5) can be lost on: (1) PFA inlet tubing, (2) the filter holder, (3) the membrane inlet filter, and (4) the cavity (and TDI, for the N2O5 channel). Losses on PFA sampling lines are reported to be negligible and are typically disregarded by keeping residence times short relative to the cavity via minimal tubing length or high bypass flow (Crowley et al., 2011; Kennedy et al., 2011; Türk et al., 2026). The same applies to our filter holder: We observed no alteration in the NO3 signal whether sampling was performed through it or through a 15 cm 1/4 in. PFA tubing. Losses on the PTFE inlet filter type we deploy (Pall Corporation, R2PJ047) are very common and have been characterized repeatedly during the past 25 years, with reported transmission values reproducibly ranging between 86 % and 98 % (Brown et al., 2002; Crowley et al., 2010; Dubé et al., 2006; Nam et al., 2022; Türk et al., 2026). The most recent estimate from Türk et al. (2026) reports a transmission efficiency of (90 ± 5) % during field operation. By repeatedly switching between sampling NO3 from CESAM through PFA tubing and through a clean filter, we found a transmission efficiency (± 2σ) of (90 ± 1) %, thereby confirming previous estimates (Fig. S3). We therefore selected this value for our correction factor calculation, i.e. TFilter is 0.9 in both channels. Direct heterogeneous N2O5 losses on Teflon-coated surfaces are negligible relative to NO3 losses and are therefore commonly excluded from the correction procedure (Fuchs et al., 2008; Kennedy et al., 2011; Türk et al., 2026).
To complete the correction scheme, we estimated the wall loss rate in the NO3 cavity and the combined wall loss rate of TDI + N2O5 cavity. The NO3 source was coupled to each cavity in turn, and residence time was varied via the cavity flow rate as previously demonstrated (Fuchs et al., 2008; Sobanski et al., 2016; Türk et al., 2026); for the NO3 cavity, the TDI was positioned between source and cavity to boost NO3 concentrations. Figure 5a shows the resulting exponential decay in NO3 with increasing residence time in the NO3 cavity. Since the NO3 NO2 mixture is not in thermal equilibrium upon entering the cavity, the decay was simulated with our box model from above (including k2 and k3 only), adjusting the initial NO3 value to match the first data point. The dashed blue curve shows the signal decrease expected from equilibration alone, which fails to reproduce the data; varying the NO3wall loss rate to best-fit the observations (orange line) yields (0.10 ± 0.02) s−1. With our residence time in the NO3 cavity of 1.53 s, this results in a transmission efficiency of (88 ± 2) %.
The same approach was applied to the TDI + N2O5 cavity ensemble (latter thermostated at 80 °C), and repeated at three TDI temperatures (Fig. 5b) to qualitatively validate the wall-loss hypothesis underlying the N2O5 thermogram (Fig. 4, blue curve). Here, no equilibrium correction is needed, so effective wall loss rates were derived directly from the slopes (± 2σ) of linear regressions: (0.26 ± 0.02), (0.27 ± 0.03), and (0.65 ± 0.11) s−1 at TDI temperatures of 80, 95, and 200 °C, respectively – corresponding to transmission efficiencies of (64 ± 2), (63 ± 3), and (34 ± 6) %. Note that even though the thermogram (Fig. 4) implies incomplete N2O5 conversion at 80 °C, numerical simulations suggest quantitative dissociation within the first 0.2 s (from overall residence time 1.31 s) inside the heated cavity, suggesting that the linear regression approach is appropriate even at that temperature. The results in Fig. 5b are consistent with the thermogram: wall loss rates show no significant increase between 353 and 368 K, but increase 2.5-fold at 473 K. Note that we cannot directly implement the measured wall loss rates from Fig. 5b in the box model since the N2O5 cavity was unheated when measuring the thermogram. This reinforces the need to carefully select the TDI temperature to avoid unnecessarily large correction factors and the associated increase in measurement uncertainty. Recall that for freshly formed NO3 in the TDI, kWall only applies to the residence time in the cavity leading to slightly higher transmissions of (67 ± 2), (66 ± 3) and (37 ± 6) %, at temperatures of 80, 95, and 200 °C, respectively.
3.5 Performance
The experiments presented above establishes the instrument response and the correction procedures required to account for sampling artifacts, including wall losses. With these effects quantified, the analytical performance of the instrument can now be assessed in terms of detection limits and overall measurement uncertainty.
3.5.1 Allan deviation and detection limits
The intrinsic detection capability of the instrument was estimated using overlapping Allan deviation analysis, which characterizes signal stability as a function of integration (averaging) time τ. For this purpose, both cavities were continuously flushed with dry zero air, and 1778 consecutive spectra with a sampling rate of 1 s were recorded under stable laboratory conditions. After converting the measured transmissions to NO3 equivalents applying Eq. (1) and fitting with , the overlapping Allan deviation was calculated using AllanTools.py (version 2024.4).
The resulting Allan deviation curves for the NO3 and N2O5 channel under typical measurement conditions are shown in Fig. 6. Increasing the integration time initially decreases the Allan deviation in both channels, as expected, with a slope of ca. because uncorrelated fluctuations in transmission (white noise) are progressively reduced through averaging. At longer integration times, however, slow instrumental drifts – arising from factors such as LED intensity fluctuations, cavity alignment and variations in pressure and temperature – become increasingly important, causing the Allan deviation to rise. The minimum of the Allan deviation therefore defines the optimum integration time reconciling averaging and drift effect and the corresponding noise-limited limit of detection achievable under these controlled conditions. Above 10 s, the two channels diverge: the N2O5 channel remains stable up to 100 s, whereas drift degrades the NO3 channel LOD beyond 30 s. During the data acquisition period, the internal NO3 cavity temperature increased by 0.6 °C. While the absence of temperature regulation in the NO3 cavity may lead to temperature-induced misalignment, potentially explaining its lower long-term stability compared to the N2O5 cavity, other sources of slow instrumental drift may also contribute to this observation. The long-term oscillations in the N2O5 Allan plot likely reflect heating cycles from the temperature controller. Overall, Fig. 6 indicates an optimal compromise integration time of 15 s, yielding noise-limited LODs (LODnoise) of 1.5 pptv (NO3) and 2.2 pptv (N2O5). This analysis assumes that the mirror reflectivity remains constant. Drift effects, contamination and cleaning can additionally lead to a variability in R, thereby additionally affecting the LOD. For instance, over the entire ACROSS campaign, the standard deviation (1σ) of (1−R) from consecutive reflectivity estimations serving as measure for its variability was 21 % for the NO3 channel and 27 % for the N2O5 channel. Propagating these 1σ variabilities into the Allan deviation analysis gives upper limits for LODnoise of 1.8 pptv (NO3) and 2.8 pptv (N2O5). The effect of the (1−R) variability on LODnoise is represented by the shaded areas in Fig. 6.
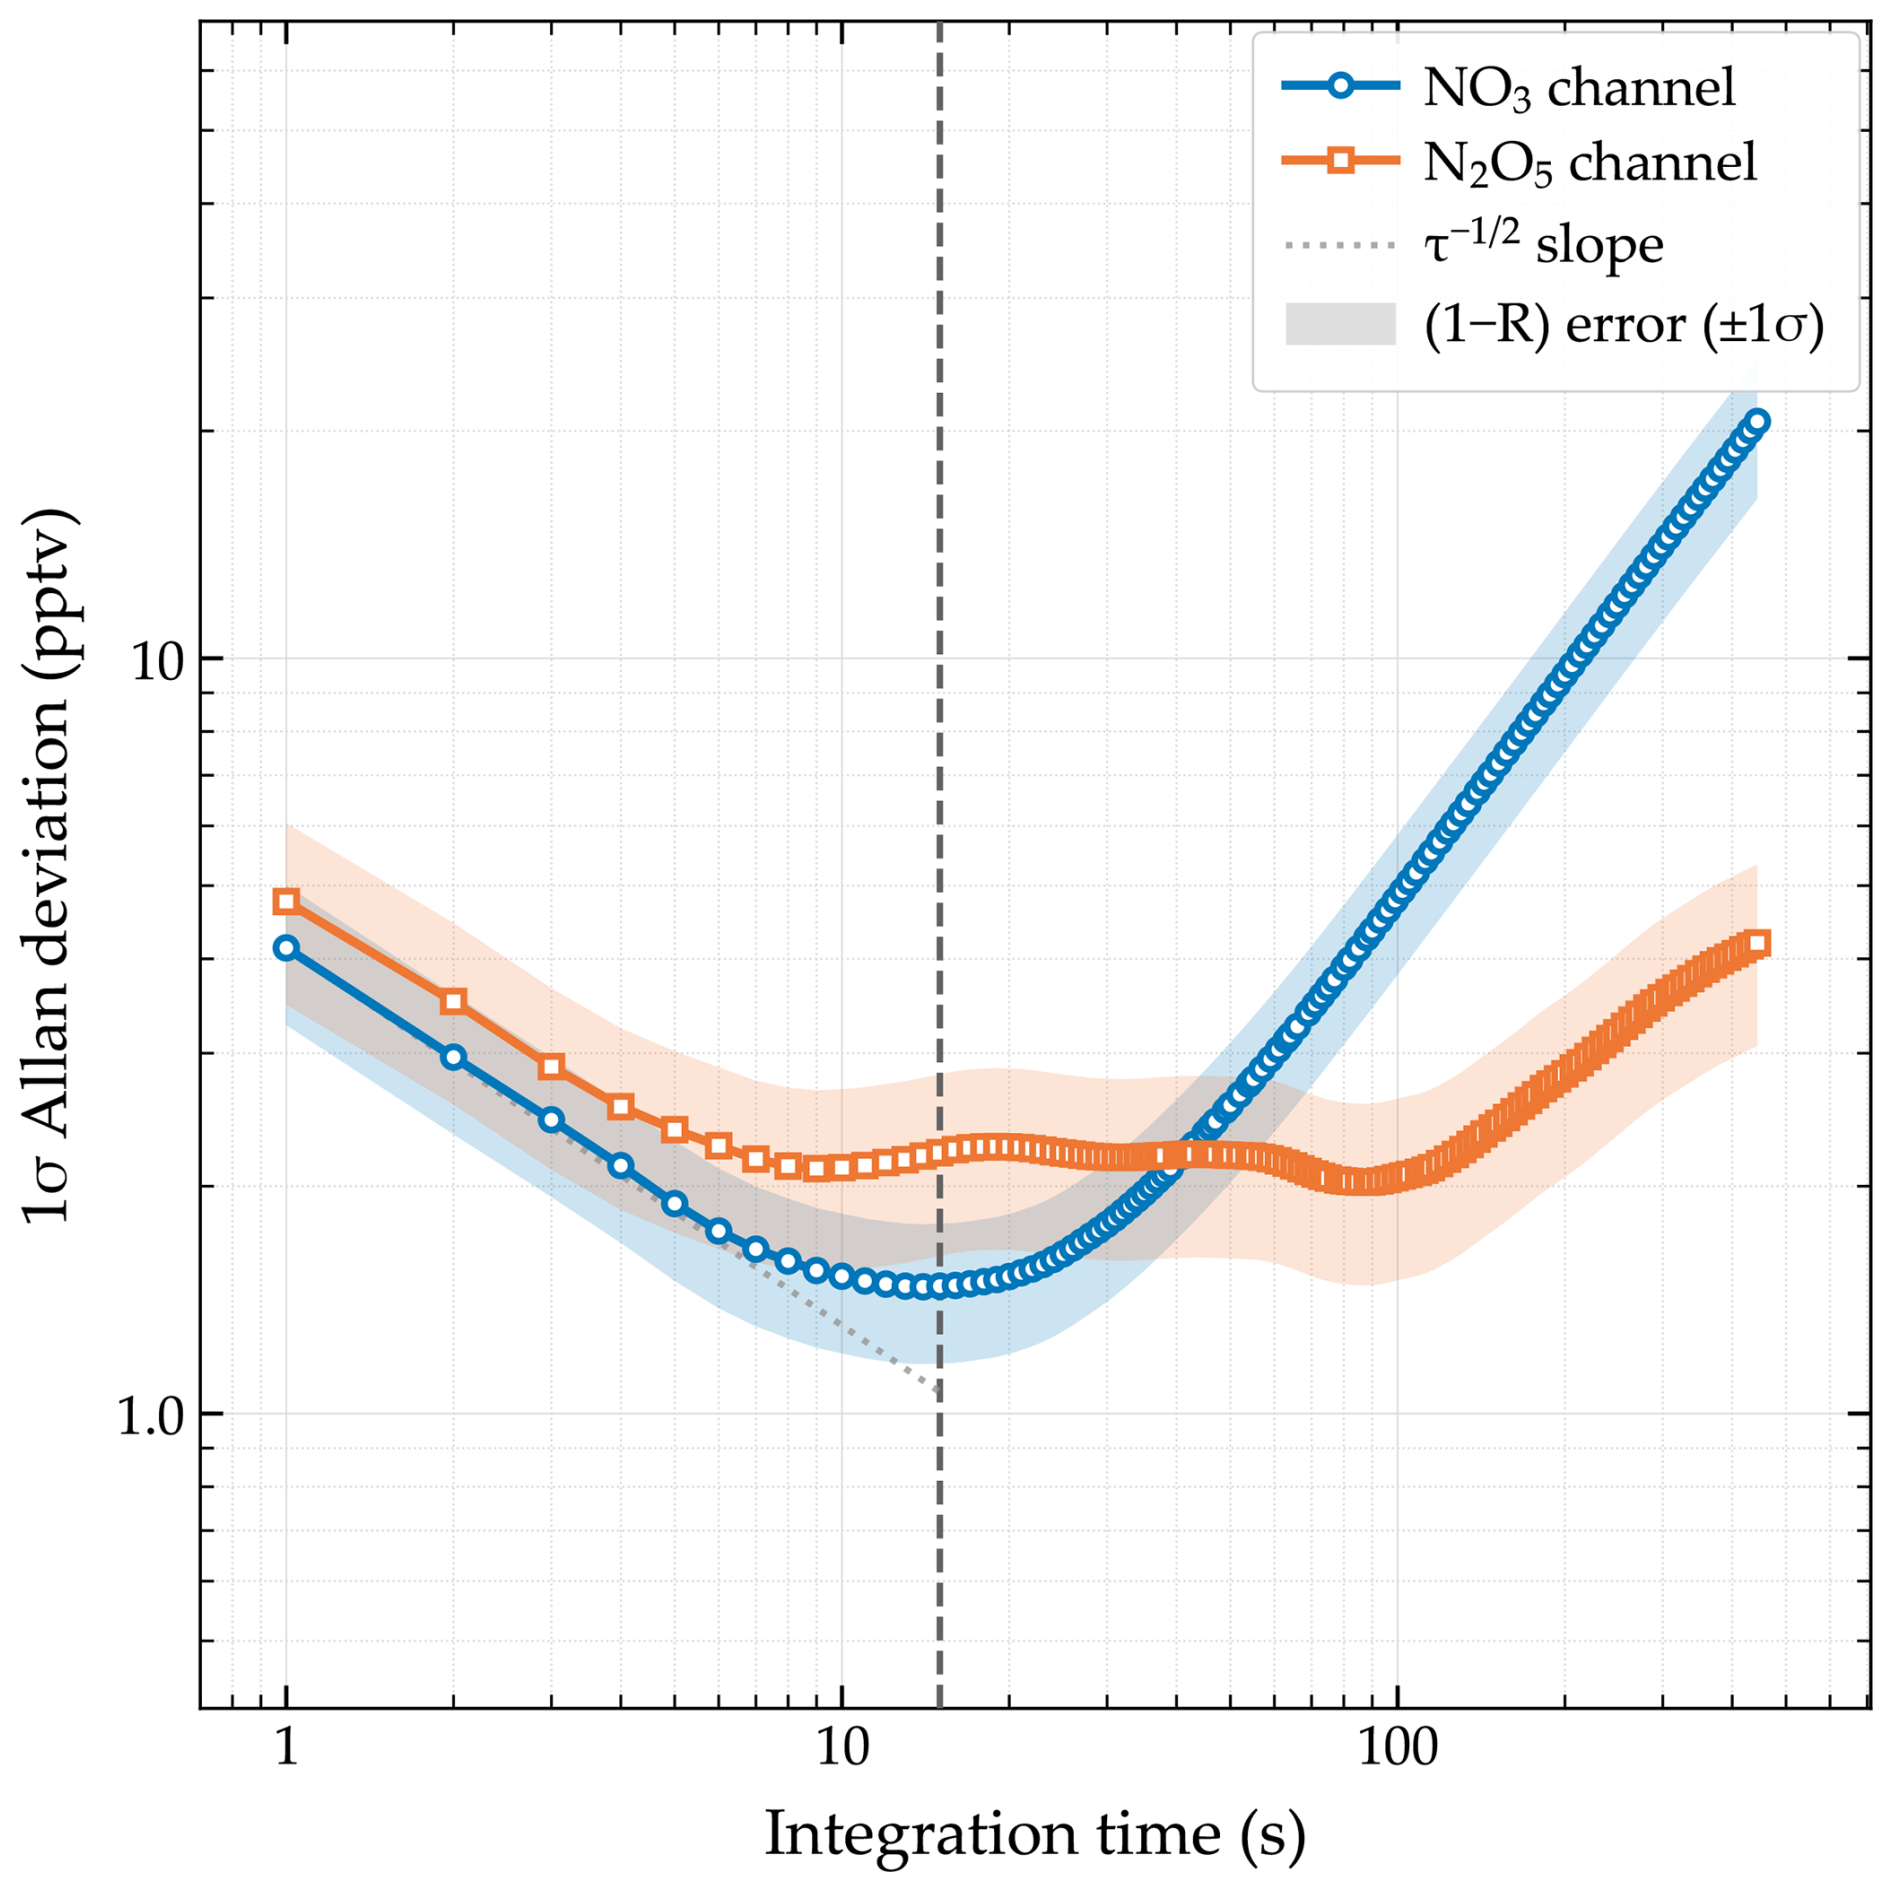
Figure 6Overlapping Allan deviation (1σ) in dependence of the NO3 channel's (blue circles) and N2O5 channel's (orange squares) integration time. The grey dashed line marks the slope. Ther vertical black dashed line marks the optimal integration time of 15 s. The effect of potential variabilities in mirror reflectivity is represented by shaded areas.
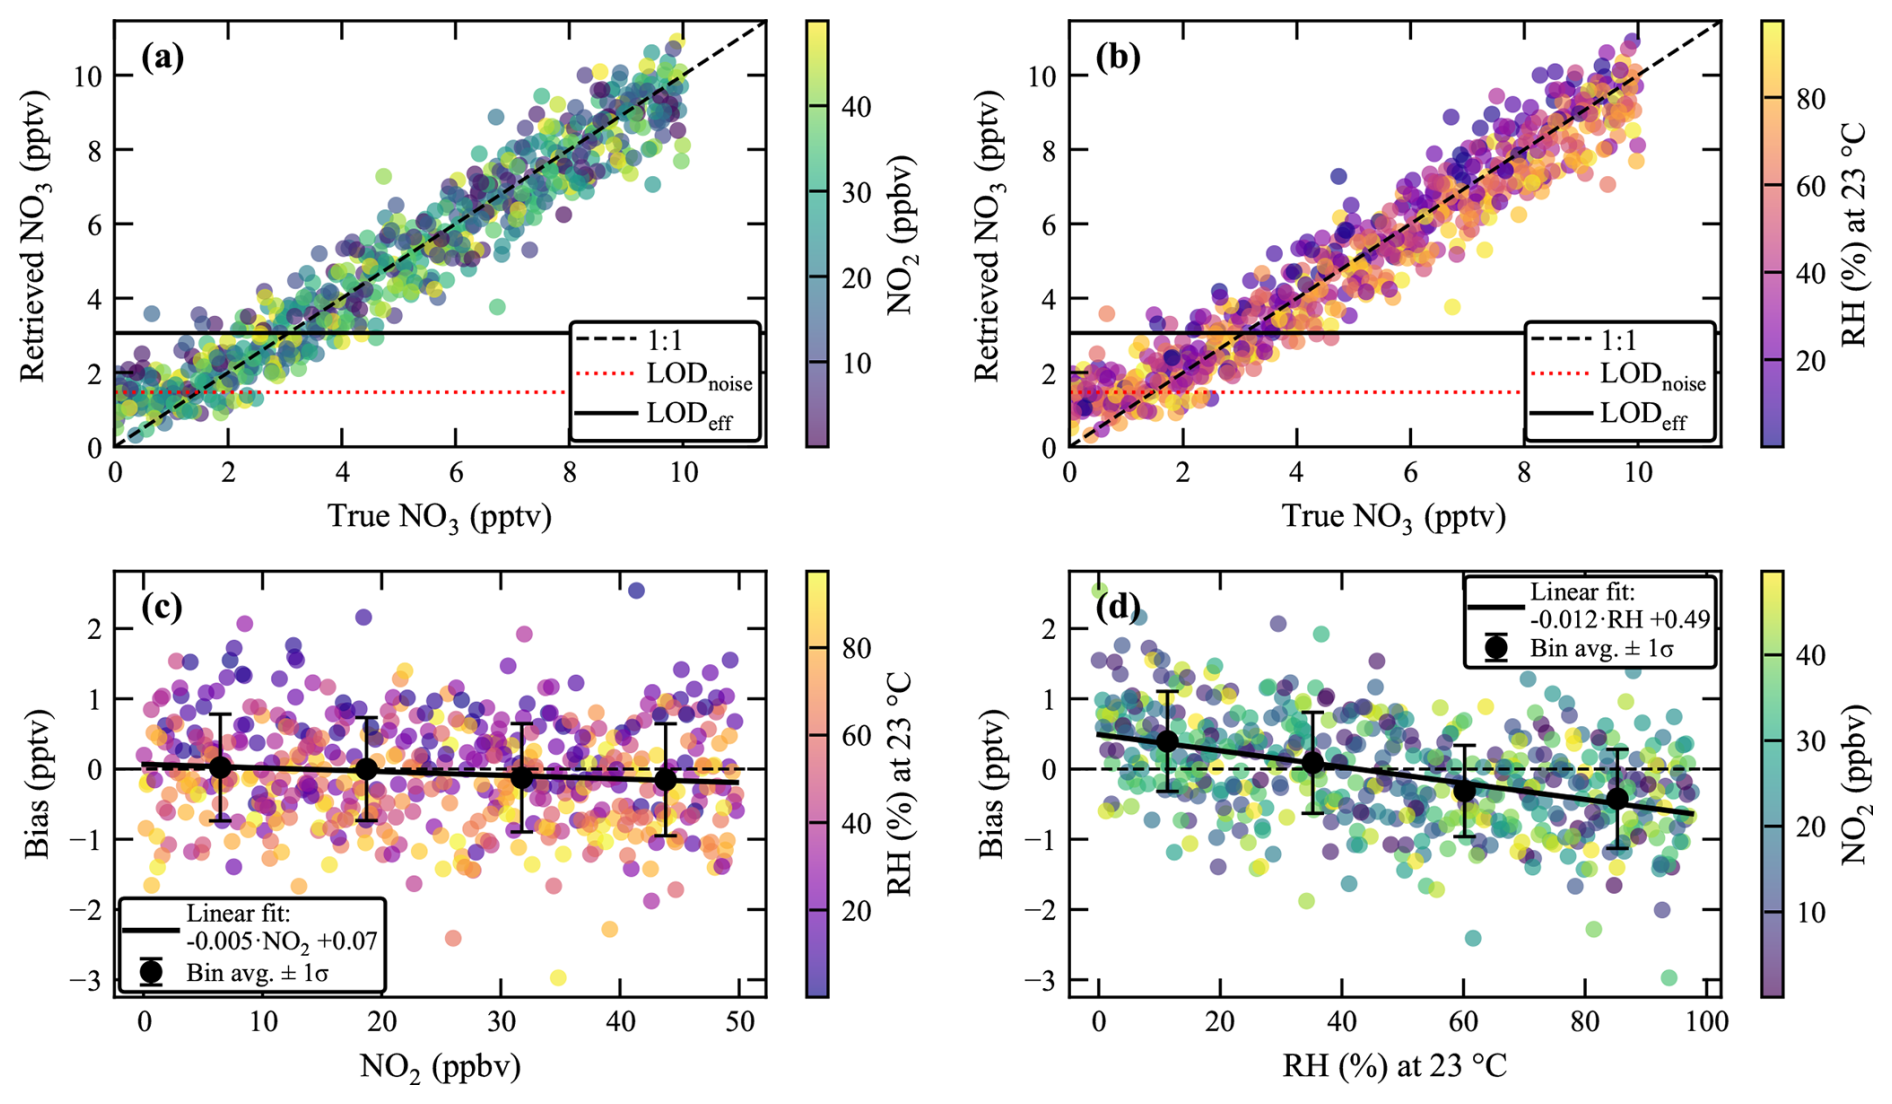
Figure 7Retrieval performance of the NO3 fitting routine as a function of interfering NO2 and water vapor, based on Monte Carlo simulations of synthetic spectra for the NO3 channel (10 noise realisation points average, 600 LHS points): (a, b) Retrieved vs. true NO3 mixing ratio, with points colored by (a) true NO2 (ppbv) and (b) relative humidity (RH, % at 23 °C). The dashed line indicates the 1:1 relationship; the dotted red line marks LODnoise derived from the Allan deviation, and the solid black line marks the effective detection limit LODeff, which additionally incorporates the standard deviation (2σ) of the retrieval bias across all simulated spectra. (c, d) Retrieval bias (retrieved – true NO3) for points NO3 > LODnoise plotted against (c) NO2 and (d) RH, colored by the complementary variable in each case. Black circles show bin-averaged values (± 1σ). Black lines show weighted linear fits to the bin-averaged points.
As described in Sect. 2.2, NO3 (and N2O5) concentrations are estimated by spectral fitting. Due to the spectral interference with NO2 and H2O, both of which are usually present alongside NO3 and N2O5 in ambient air, the LOD is likely to be worse under field conditions. Even though it is well known that both NO2 and water vapour can influence the NO3 retrieval performance of the fitting routine (Nam et al., 2022; Wang and Lu, 2019), to the best of our knowledge, their combined impact has not yet been systematically assessed. To investigate this effect, we were inspired by a synthetic-spectrum approach used to characterize fitting bias in other spectroscopic retrievals (e.g. Adkins and Hodges, 2022), here applied to IBBCEAS. Synthetic CEAS transmission spectra were generated using a rearranged form of Eq. (1), , where α is directly computed from the laboratory reference cross-sections of NO3 and NO2 and the measured H2O reference spectrum via Eq. (2). Gaussian white noise, scaled from the Allan-deviation noise floor (LODnoise) via the NO3 reference spectrum, was added to α(λ) to yield an equivalent spectral noise level. Concentration combinations of NO3 (0–10 pptv), NO2 (0–50 ppbv), and H2O (RH = 0.3 %–100 % at 23 °C) were drawn using a Latin Hypercube design (600 unique points, each with 10 independent noise realisations, giving 6000 spectra in total) (McKay et al., 1979) embedded in SciPy, and each synthetic spectrum was subsequently analysed with the same operational retrieval routine used for the ambient measurements.
Retrieved (averaged over the 10 noise realisations) vs. true NO3 mixing ratios are shown in Fig. 7a and b, coloured by NO2 and RH, respectively. As expected, the routine underperforms below LODnoise (red dashed line), tending to overestimate NO3, with scatter narrowing toward the 1:1 line (black dashed) at higher mixing ratios. This scatter shows no dependence on NO2 (Fig. 7a) but correlates with RH (Fig. 7b). Plotting retrieval bias against NO2 and RH (Fig. 7c and d) confirms this pattern: linear regression reveals no significant NO2 dependence, but a modest negative trend with RH, corresponding to biases of +0.49 to −0.71 pptv, comparable to the retrieval's inherent scatter (± 0.64 pptv, 1σ). This suggests that the presence of H2O and NO2 biases the spectral fitting as soon as both are included as fitting parameters, with the bias showing only a marginal dependence on H2O concentration and no apparent dependence on NO2 concentration. Hence, instead of indicating an LOD depending on H2O and NO2, we prefer adding twice this inherent bias (2σ) across all 600 samples to LODnoise resulting in an effective LOD of 3.2 pptv (solid black line, Fig. 7a and b), above which the data scatter symmetrically around the 1:1 line – consistent with this threshold representing a meaningful detection limit. The same analysis was carried out for the N2O5 channel, using the corresponding reference spectra and LODnoise to generate a separate set of 6000 spectra; results are shown in Fig. S4. In this case, the bias decreases slightly with NO2 and increases with RH, though again by a magnitude negligible compared to the fit-induced scatter. Using the standard deviation (2σ) of the mean bias yields an effective LOD of 4.4 pptv for the N2O5 channel. Note that this simulation approach only allows deduction of ballpark values as it neglects variability in both R and . For example, using the upper-limit values of LODnoise, which account for variability in R results in worst-case (recall that R may fluctuate in both senses) effective LODs of 4.0 pptv (NO3) and 5.8 pptv (N2O5).
The synthetic spectra also show an RH-dependent NO2 bias (Fig. S5), which increases approximately linearly with RH by 0.20 (NO3 channel) and 0.33 ppbv per % RH (N2O5 channel). For NO3 above the LOD, this NO2 bias is only weakly correlated with our above-mentioned NO3 biases (r = −0.36 and +0.32 for the N2O5 and NO3 channel, respectively), thereby confirming the low sensitivity of the NO3 retrieval accuracy to NO2 quantification. Nevertheless, taking advantage of the instrument's integrated CAPS analyzer, constraining NO2 in the fit to measured values may allow reduction of the retrieval bias in both channels – especially under very humid conditions.
3.5.2 Total measurement uncertainty
Alongside the LOD, the total measurement uncertainty (TMU) is another important indicator of instrument performance. As is evident from Eqs. (1)–(3), the TMU of the NO3 measurement is obtained by propagating, in quadrature (root-sum-square method), the relative uncertainties in: the retrieved from the spectral fitting procedure, the mirror reflectivity R, the effective path length deff, the NO3 absorption cross-section , and the NO3 transmission through the filter (TFilter) and cavity (). This assumes the individual error sources are independent and uncorrelated.
The uncertainty in from the spectral fitting procedure is accessible via the relative bias, the ratio of absolute bias to true NO3 mixing ratio, derived from the simulated spectra in the previous section. This relative bias for the NO3 channel is plotted against the true NO3 mixing ratio in Fig. 8. It decreases exponentially with increasing NO3 mixing ratio and approaches a constant systematic bias above the effective LOD. We captured this trend by binning the data and fitting a biexponential decay; the y-offset of the fit gives the relative fitting uncertainty, found to be 6.7 %.
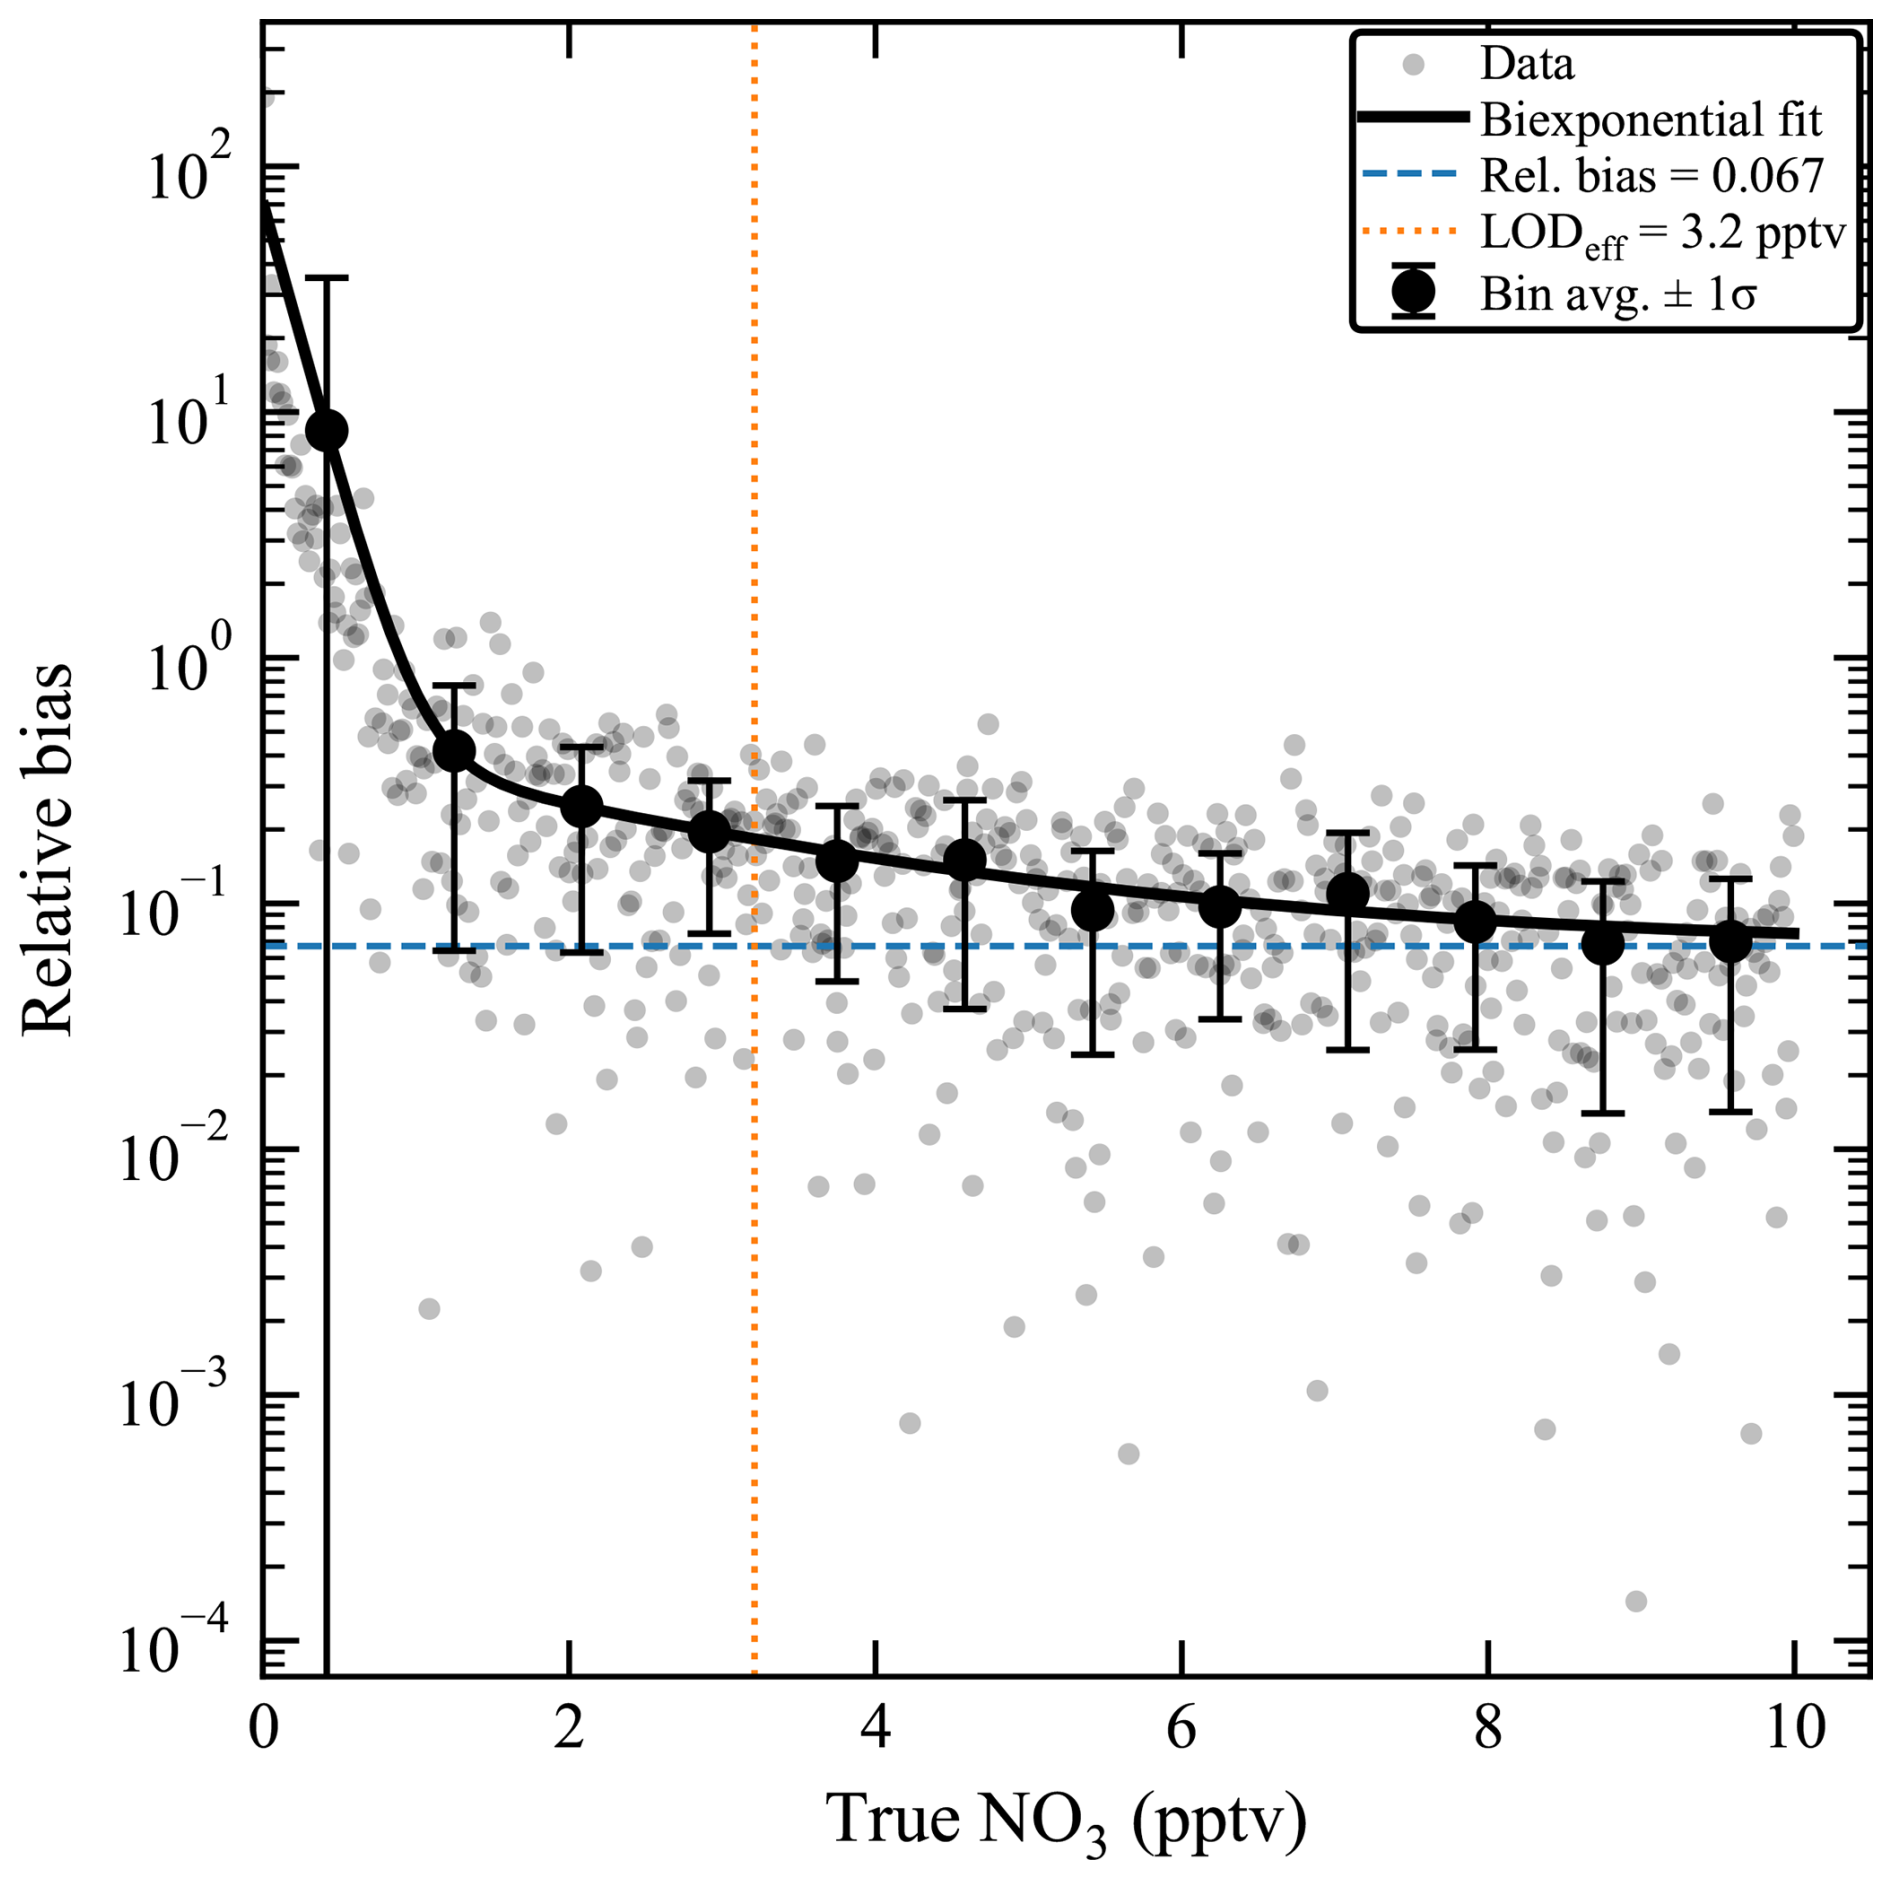
Figure 8Relative bias in retrieved NO3 () versus true NO3 concentration from Monte Carlo simulations for the NO3 channel. Gray points: individual retrievals; black circles: quantile-binned means ± 1σ. Solid line: biexponential fit with parameters (a1, a2, b1, b2, c), relative bias = , capturing the noise-dominated divergence at low NO3 and the systematic interference floor (c=0.067, blue dashed line) at higher NO3. Orange dotted line: effective LOD.
The relative uncertainty in the mirror reflectivity R is derived from Eq. (5) by propagating the relative uncertainties in deff (1.8 %), at 298 K (3 %), concentration (0.5 %), and the spectral transmission (6 %, from the Allan deviation analysis), giving 7 %. Propagating this together with the uncertainties in deff, (5 % at 298 K), TFilter (5 %; Türk et al., 2026), and (2 %) yields an overall TMU of 12 % for [NO3].
The same approach applies to the combined NO3 + N2O5 signal measured in the N2O5 channel. Repeating the Fig. 8 analysis for this channel (Fig. S6) gives a relative fitting uncertainty of 9.9 %.
Propagating this with the uncertainty in R (10 %, itself from 5 % in at 353 K, 1.5 % in deff, and 9 % in the spectral transmission) and in at 353 K (8 %) yields a relative uncertainty of 17 % in the summed signal.
Because N2O5 is obtained by channel differencing (Eq. 4), its total uncertainty requires propagating absolute errors (indicated with Δ) and directly measured values, and is given by:
The uncertainty related to [N2O5] depends on the NO3-N2O5 ratio. During the ACROSS campaign (see below), an average relative TMU of 21 % for N2O5 was found.
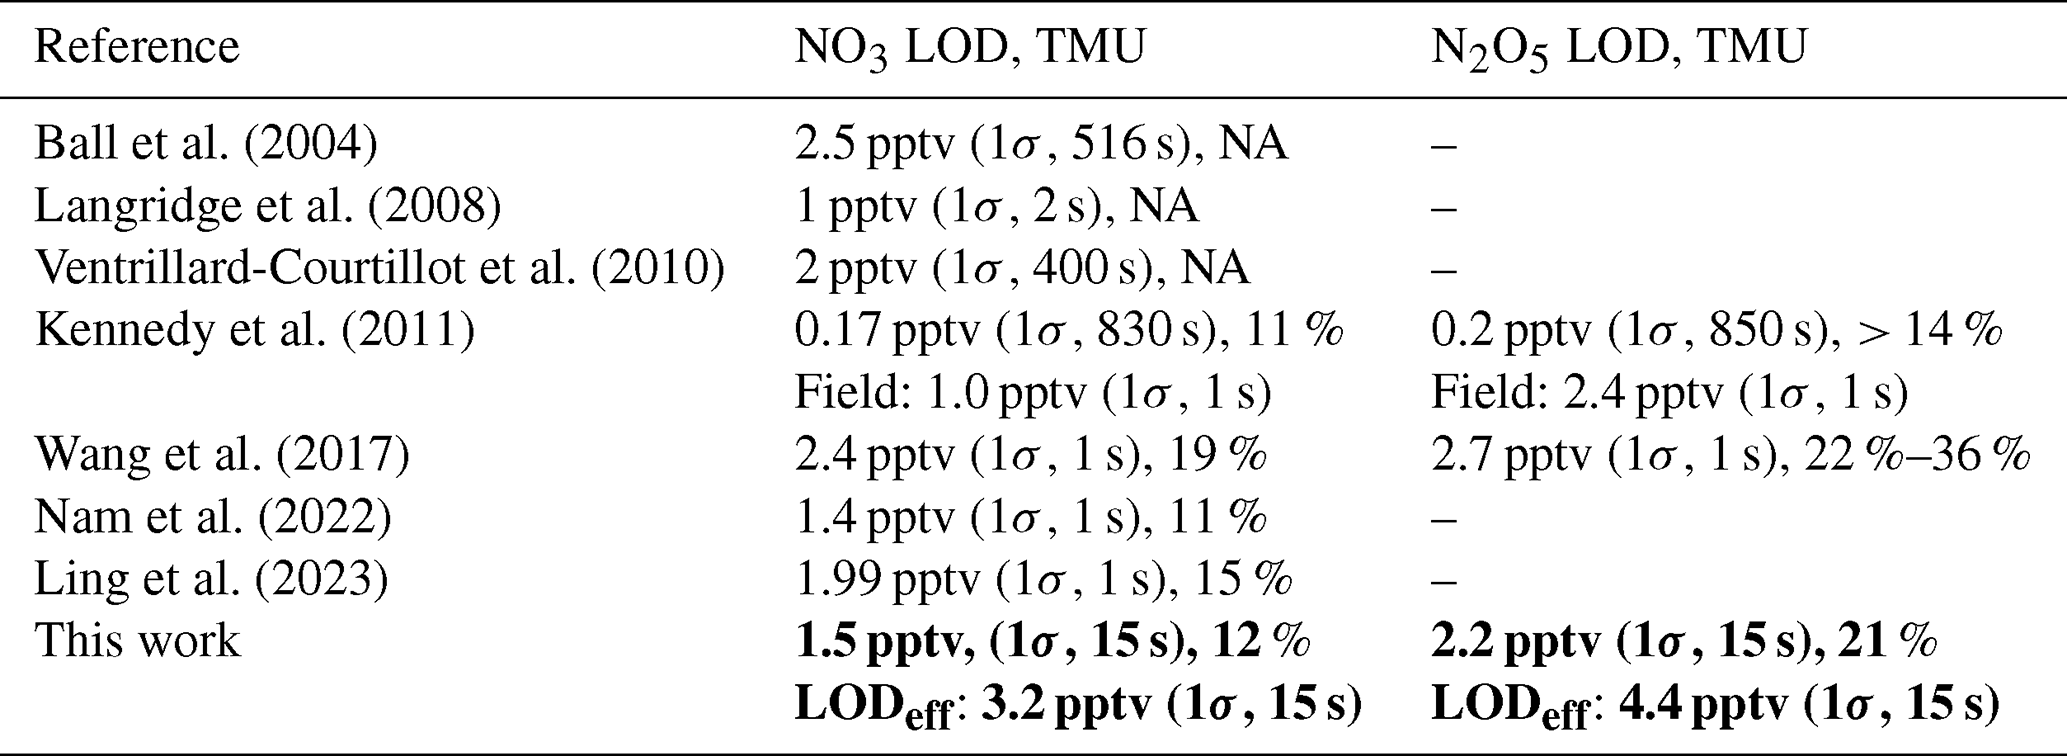
Table 1Comparison of our instrument's performance with those of selected other IBBCEAS setups. Values estimated for our setup are highlighted in bold.
3.5.3 Comparison to other instruments
Table 1 compares the LOD and TMU of this instrument with previous closed-path, field-deployable IBBCEAS setups for NO3 and N2O5.
Direct comparison is complicated by differing averaging times: several instruments report LODs at 1 s (Ling et al., 2023; Nam et al., 2022; Wang et al., 2017) or second-to-few-second integration (Ball et al., 2004; Kennedy et al., 2011; Langridge et al., 2008; Ventrillard-Courtillot et al., 2010), whereas our LOD is reported at 15 s. Since LOD scales approximately with the inverse square root of averaging time, our 1.5 pptv at 15 s corresponds to a higher 1 s-equivalent LOD, indicating that, while not the most sensitive system in this comparison, this instrument's noise-limited performance remains within the established range for closed-path IBB-CEAS instruments. Comparable or lower LODs at shorter integration times, as for example reported by Kennedy et al. (2011) and Nam et al. (2022), often go hand in hand with longer effective path lengths achieved through mirrors with higher reflectivity. However, higher mirror reflectivity reduces the intensity reaching the detector, so that increasing R does not necessarily improve the LOD (Vaughan et al., 2008). Our choice of mirror reflectivity and cavity length represents a compromise between sensitivity, transmitted intensity, mechanical stability and cost.
More directly comparable is the TMU, which varies less sensitively with averaging time. Here, our value of 12 % for NO3 is in good agreement with Kennedy et al. (2011, 11 %) and Nam et al. (2022, 11 %), and notably lower than Wang et al. (2017, 19 %). For N2O5, our mean TMU of 21 % is comparable to the lower end of the range reported by Kennedy et al. (2011, > 14 %) and Wang et al. (2017, 22 %–36 %). This indicates that our systematic uncertainty of our retrieval is competitive with previously reported closed-path IBBCEAS instruments.
Importantly, the effective (field-relevant) LODs reported here, 3.2 pptv for NO3 and 4.4 pptv for N2O5, already account for the fitting-induced bias identified in Sect. 3.5.1, which to our knowledge has not been systematically quantified in prior studies. Kennedy et al. (2011) reported effective LODs deduced from daytime ambient measurements. Other works report only a noise-limited LOD, however the true field detection limit may in practice be similarly elevated. The analysis presented here suggests that noise-limited LODs alone may understate the effective detection threshold achievable under realistic ambient conditions.
The NOyBOx instrument was deployed for the first time during the ACROSS campaign (Cantrell and Michoud, 2022), which took place over one month in summer 2022. The instrument was set up atop a 40 m tower amid and above the canopy (16–20 m) of the Rambouillet forest, ca. 50 km from Paris – a site dominated by biogenic emissions but occasionally impacted by urban plumes emanating from Paris. The IBBCEAS subsystem was operated as detailed in Sect. 2.2, but with a 120 s integration time and a TDI temperature of 473 K; R and I0 were determined every 24 h and 1–1.5 h, respectively, and inlet filters were changed manually every 4–6 h. The N2O5 inlet filter was positioned between the TDI and the cavity during that period, which is why Eq. (4) was modified accordingly to retrieve N2O5 mixing ratios. A power outage disabled our NO analyzer, so NO was instead measured with another chemiluminescence instrument (T200U, Aerodyne; LOD = 30 pptv) operated by IMT Nord Europe. The NOy and NO2 analyzers were operated as described in Sect. 2.1, allowing NOy to be derived as well. O3 was monitored by a UV absorption instrument (HORIBA APOA-370, LOD = 2.5 ppbv), and temperature was measured at 5 and 41 m along the tower (Atexis PT1000 and Thermoset PT100) by CNRM (Météo-France).
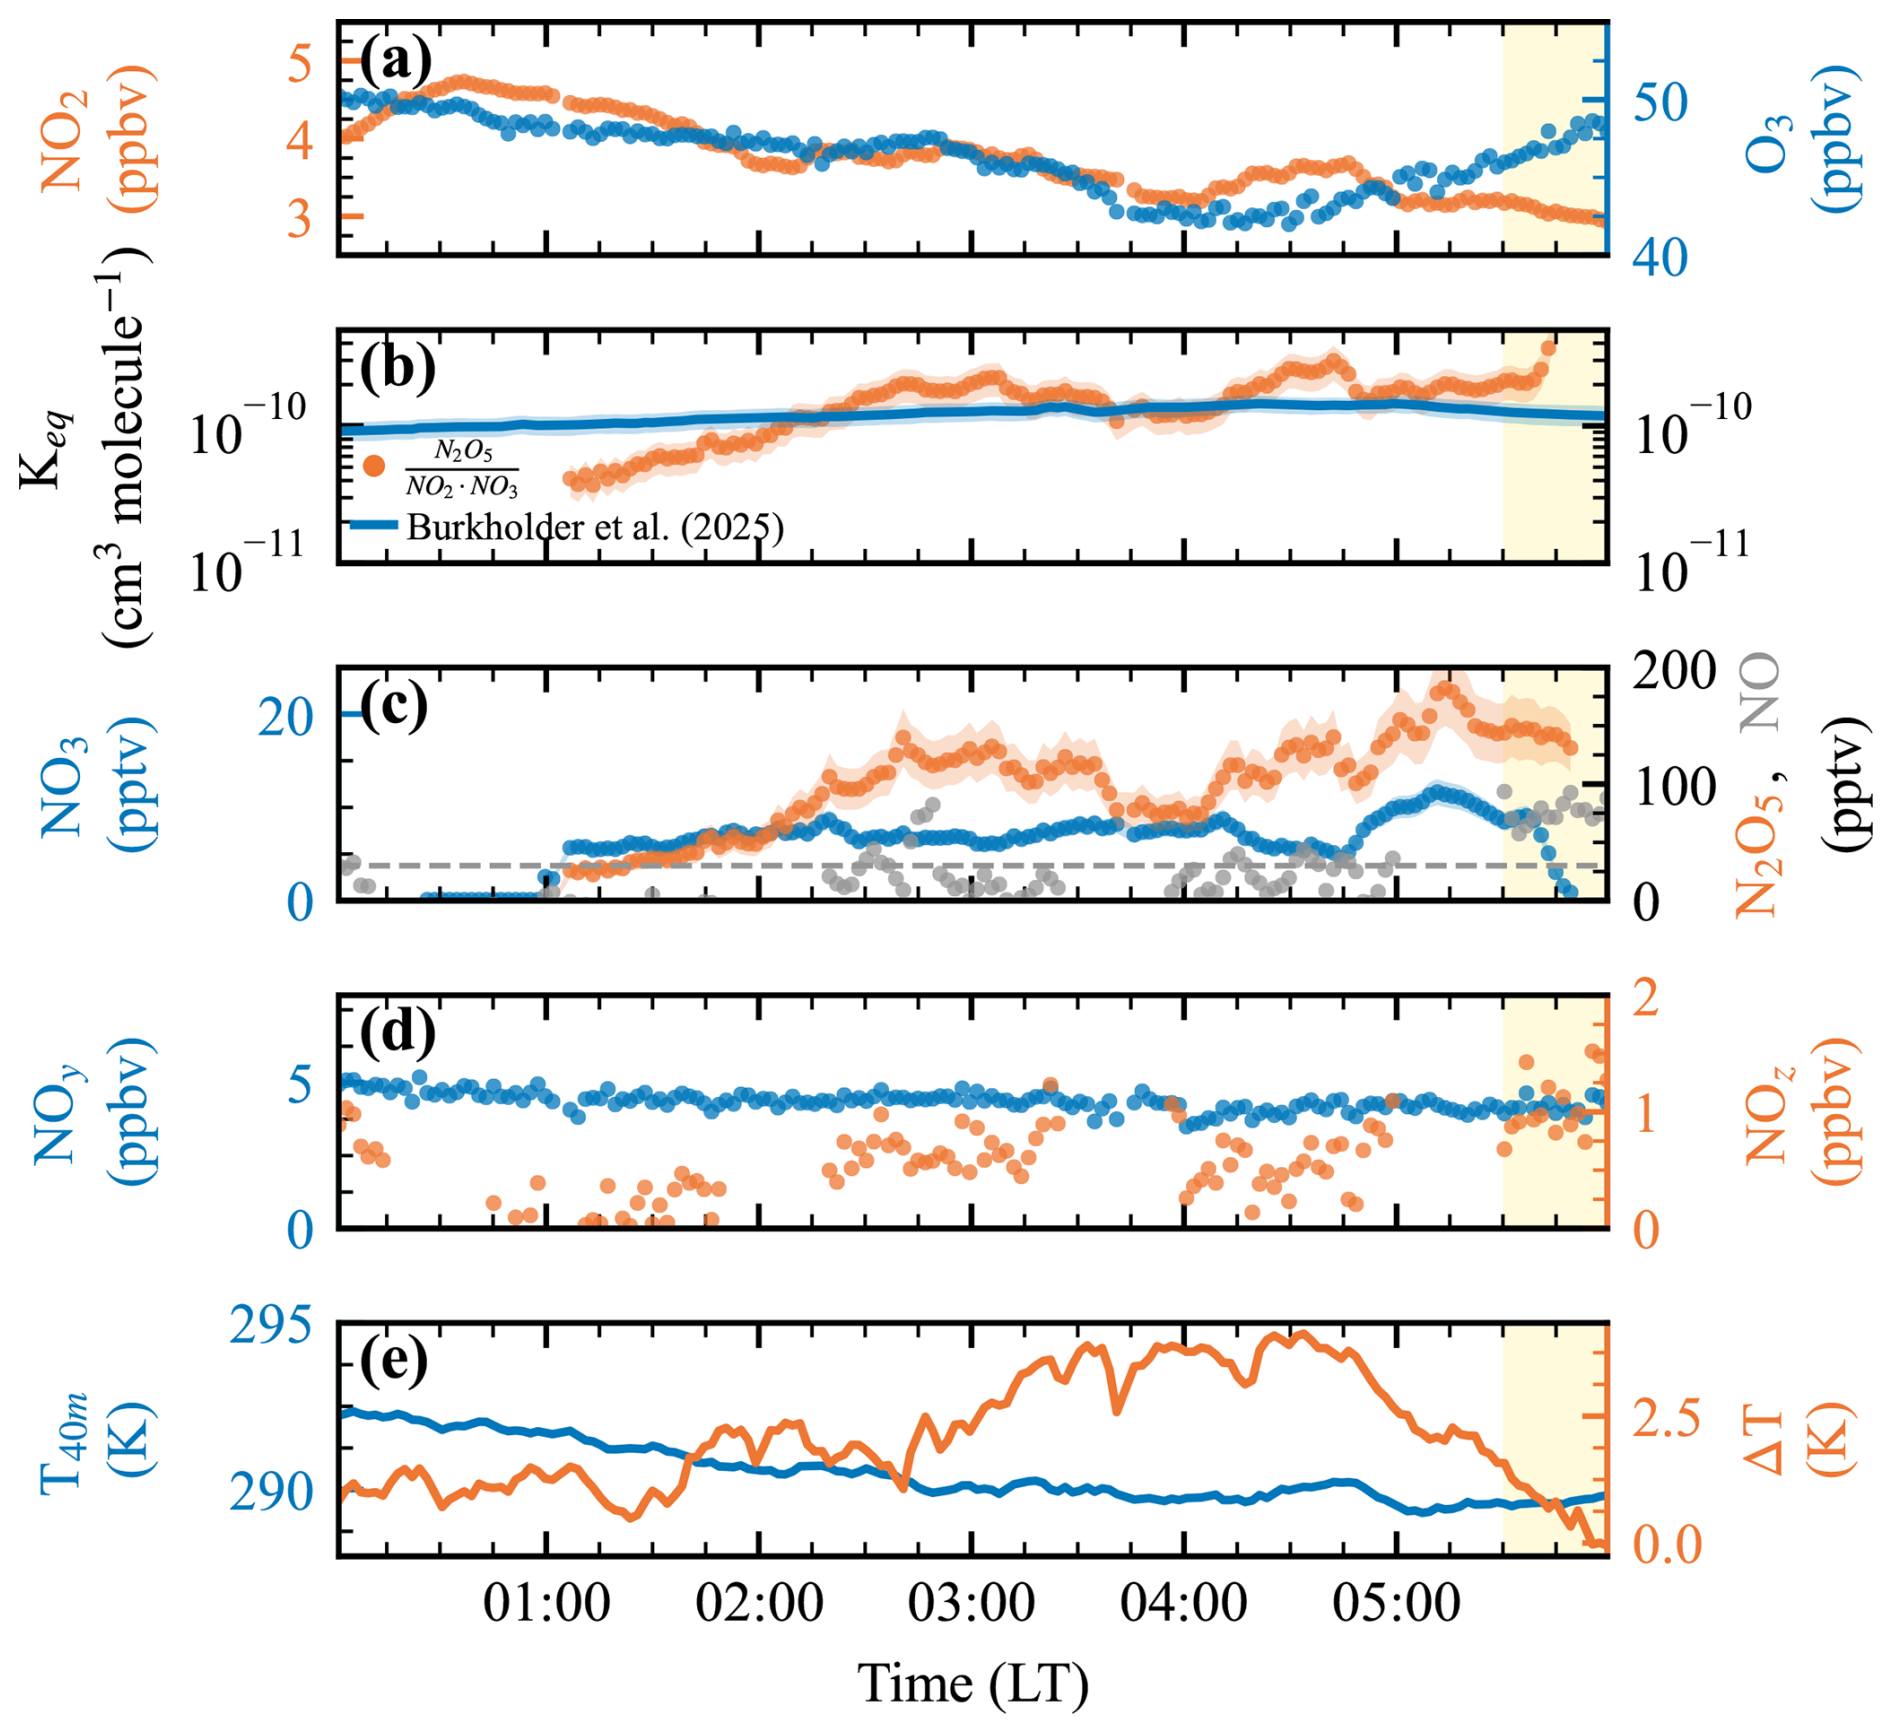
Figure 9Nocturnal time series during the ACROSS campaign (16–17 July 2022, 00:00–06:00 LT); yellow shading indicates sunrise (05:30 LT). (a) NO2 (orange, left axis) and O3 (blue, right axis). (b) Measured NO3–N2O5–NO2 relationship (orange), compared with the evaluated, temperature-dependent equilibrium constant from Burkholder et al. (2025) (blue line, shading = uncertainty). (c) NO3 (blue, left axis) and N2O5 (orange, right axis) mixing ratios with the total measurement uncertainty (shading), alongside NO (gray, right axis, provided py IMT Nord Europe); the dashed line marks the NO detection limit (30 pptv). (d) NOy (blue, left axis) and NOz (orange, right axis). (e) Ambient temperature at 40 m (blue, left axis) and the temperature difference ΔT between 5 and 41 m (orange, right axis) from CNRM (Météo-France).
Figure 9 shows the time series of a representative night (16–17 July 2022) from this campaign. Note that NO3 levels were additionally corrected by a factor of 0.94 on average using our box model introduced in Sect. 3.3. This accounts for further NO3 formed by N2O5 dissociation (Reaction R3) during the residence time in the cavity, which was ca. 5 K warmer than ambient air (see Fig. S7). O3 decreased from 50 to 44 ppbv and NO2 from 4.7 to 2.6 ppbv over the course of the night (Fig. 9a, right axis, blue); NO (Fig. 9c, right axis, grey) remained below the LOD until sunrise at ca. 05:30 LT. It was a mild summer night, with temperature (Fig. 9e, blue) decreasing from 292 to 289 K. NO2 peaked at 4.7 ppbv at 00:30 LT, increasing the NO3 production rate; by 01:00 LT, NO3 and N2O5 reached 6 and 30 pptv, respectively (Fig. 9c). Despite the continued gradual decline in NO2 and O3 thereafter, NO3 and N2O5 continued to increase through the night, coinciding with the onset of a temperature inversion (ΔT = T41 m–T5 m, Fig. 9e, orange) reaching ca. 3 K, in which air atop the tower was warmer than at ground level. As discussed in detail for this campaign by Dewald et al. (2024) and Andersen et al. (2024), such inversions decouple the tower from below-canopy reactive trace-gas emissions, reducing NO3 reactivity – consistent with the observed rise in NO3 N2O5. Peak mixing ratios of 12 pptv NO3 and 182 pptv N2O5 were reached at 05:15 LT, shortly before both fell below the LOD around sunrise (05:30 LT).
Using our simultaneous NO3, N2O5, and NO2 measurements, we calculated (Fig. 9b, orange) and compared it to the purely temperature-dependent value recommended equilibrium constant Keq by JPL (Burkholder et al. (2025); blue line). The two agree fairly within uncertainties for most of the night, with only occasional deviations. Following Crowley et al. (2010), the time needed to reach equilibrium, ( × [NO2])−1, was 6–10 s on this night using IUPAC-recommended rate coefficients, so thermal equilibrium should be established essentially throughout. We attribute the initial disagreement to instrument line and filter passivation from priorly sampled highly reactive air, an effect also reported for other cavity-based setups (Crowley et al., 2011; Türk et al., 2026). The deviations at 04:30 LT can be reconciled with local disturbances of the NO3–N2O5 equilibrium, for instance due to boundary-layer instabilities as reflected in the continuous breakdown of the temperature inversion (Fig. 9e), leading to sudden BVOC entrainment and very local NO3/N2O5 sinks (Brown et al., 2003; Dewald et al., 2020). Indeed, Chen et al. (2022) confirmed systematically with simulations that a purely temperature-derived Keq is expected to deviate substantially from the ambient ratio when competing NO3 and N2O5 sinks prevent the system from reaching true equilibrium.
NOy remained stable at ca. 5 ppbv throughout the night (panel d, blue), indicating that deposition of newly formed NOy species is negligible. NOz (= NOy − NOx; Fig. 9d, orange) fell to zero between 00:00 and 01:00 LT, indicating that NOx was the only reactive nitrogen species present at that time and pointing to a certain degree of decoupling from below-canopy emissions. With the onset of NO3 and N2O5 formation, 0.5–1 ppbv of NOz was produced showing that NO3 and N2O5 alone cannot close the NOy budget. Indeed, these elevated NO3, N2O5, and NOy mixing ratios coincided with the detection of NO3 + BVOC oxidation products by CIMS; this will be explored in a forthcoming publication.
This case study illustrates the broader value of combining NOx, NOy, and NO3 N2O5 measurements within a single instrument. By simultaneously constraining NOz production, we can directly assess how efficiently NO3 and N2O5 are being converted into higher-generation products – as demonstrated here, where the observed NOz increase accounted for only a fraction of the concurrent NO3 N2O5 signal, pointing to additional, yet-unquantified oxidation pathways. For example, the NO3-initiated oxidation of BVOCs can lead to the formation of organic nitrates, which themselves may be hydrolysed to contribute to HNO3 production.
We presented the design and characterization of the NOyBOx instrument, combining NOx, NOy, and IBBCEAS-based NO3 N2O5 measurements within a single framework. The noise-limited and effective detection limits of the NO3 and N2O5 channels were determined via Allan deviation analysis and a synthetic-spectra approach, yielding effective LODs in ambient air conditions of 3.2 and 4.4 pptv, and total measurement uncertainties of 12 % and 21 %, respectively – performance competitive with previously reported closed-path IBBCEAS instruments. Moreover, using synthetic spectra spanning realistic ambient NO2 and H2O concentrations, we showed that spectral interference from these species can bias the NO3 N2O5 retrieval beyond what is predicted by the noise-limited LOD alone. Accounting for this bias is essential to avoid underestimating the true detection threshold under field conditions, and we recommend that future IBBCEAS studies evaluate this effect explicitly rather than relying on noise-limited LODs alone.
A thermogram of N2O5 based on NO3 detection was performed. With the exception of Dubé et al. (2006), which covers only the range between 70 and 150 °C, no NO3-based thermogram is available in the literature. Our study therefore provides the first complete NO3-based thermogram of N2O5 over the temperature range of 30 to 200 °C, revealing substantially high wall losses at elevated temperatures. This finding underscores the necessity of characterizing the TDI for N2O5 dissociation based on NO3 detection in order to prevent the application of unnecessarily high correction factors.
Finally, the instrument was successfully deployed for the first time during the ACROSS field campaign, thereby demonstrating the value of combining NOx, NOy, and NO3 N2O5 within a single internally consistent framework. As inferred from our case study, NO3-initiated chemistry formed a significant source of other NOz species. Such observations, achievable only through co-located NOx, NOy, and NO3 N2O5 measurements, is essential for constraining the fate of reactive nitrogen at night and represents a key advantage of the NOyBOx over instruments measuring these species in isolation.
Data underlying the figures in this publication are available at Zenodo: https://doi.org/10.5281/zenodo.23922481 (Dewald et al., 2026b). Data from the ACROSS campaign is available at ACTRIS-AERIS (https://across.aeris-data.fr/, last access: 14 July 2026).
The supplement related to this article is available online at https://doi.org/10.5194/amt-19-7421-2026-supplement.
Conceptualization: SH, PD, MCi, BPV, MC, EP, MF, XL. Methodology: SH, PD, MCi, BPV. Formal analysis: SH, PD, MCi, BPV. Data curation/Investigation: SH, MCi, BPV, EP, MC, AB, VM, LB. Resources: CC, MC, EP, VM. Writing – Original Draft: SH, PD. Writing – Review and Editing: all authors. Visualization: PD. Project administration: MCi, CC, VM. Funding acquisition: MCi, BPV, CC.
At least one of the (co-)authors serves as editor for the special issue to which this paper belongs. The peer-review process was guided by an independent editor, and the authors also have no other competing interests to declare.
Publisher's note: Copernicus Publications remains neutral with regard to jurisdictional claims made in the text, published maps, institutional affiliations, or any other geographical representation in this paper. The authors bear the ultimate responsibility for providing appropriate place names. Views expressed in the text are those of the authors and do not necessarily reflect the views of the publisher.
This article is part of the special issue “Atmospheric Chemistry of the Suburban Forest – multiplatform observational campaign of the chemistry and physics of mixed urban and biogenic emissions”. It is not associated with a conference.
The authors thank Olivier Garrouste and Cyrielle Denjean from CNRM (Météo-France) as well as Sébastien Dusanter and Marina Jamar from IMT Nord Europe for the provision of temperature and NO data, respectively. We further thank Pascal Zapf, Cécile Gaimoz and Franck Maisonneuve for assistance during the ACROSS campaign on the Rambouillet site. Data from the ACROSS campaign are hosted by the French national centre for atmospheric data and services, AERIS. The authors gratefully acknowledge CNRS-INSU, Université Paris-Est Créteil, Université Paris-Cité, and OSU-EFLUVE for supporting CESAM platform as a component of ACTRIS Research Infrastructure. This platform also benefits from the support of ACTRIS-FR, registered on the Roadmap of the French Ministry of Research. The authors thank AERIS for curating and distributing the data produced by CESAM chamber through ACTRIS portal (https://dc.actris.nilu.no/, last access: 9 November 2026) and ACTRIS DC ASC Unit (formerly known as EUROCHAMP DC, https://data.eurochamp.org, last access: 9 November 2026).
This research has been supported by the Agence Nationale de la Recherche (grant no. ANR-17-MPGA-0002), the Centre National de la Recherche Scientifique, Institut national des sciences de l'Univers (LEFE), the HORIZON EUROPE Marie Sklodowska-Curie Actions (grant no. 101206921 (NOCTEM)), and the Agence de l'Environnement et de la Maîtrise de l'Energie (ADEME). This work has also been supported by the region “Ile de France” in the framework of a call for projects from DIM QI2 and by the Université Paris-Est Creteil investment founding.
This paper was edited by Hendrik Fuchs and reviewed by two anonymous referees.
Adkins, E. M. and Hodges, J. T.: Assessment of the precision, bias and numerical correlation of fitted parameters obtained by multi-spectrum fits of the Hartmann-Tran line profile to simulated absorption spectra, J. Quant. Spectrosc. Ra., 280, 108100, https://doi.org/10.1016/j.jqsrt.2022.108100, 2022.
Aldener, M., Brown, S. S., Stark, H., Williams, E. J., Lerner, B. M., Kuster, W. C., Goldan, P. D., Quinn, P. K., Bates, T. S., Fehsenfeld, F. C., and Ravishankara, A. R.: Reactivity and loss mechanisms of NO3 and N2O5 in a polluted marine environment: Results from in situ measurements during New England Air Quality Study 2002, J. Geophys. Res.-Atmos., 111, D23S73, https://doi.org/10.1029/2006JD007252, 2006.
Aliwell, S. R. and Jones, R. L.: Measurement of atmospheric NO3 1. Improved removal of water vapour absorption features in the analysis for NO3, Geophys. Res. Lett., 23, 2585–2588, https://doi.org/10.1029/96GL02472, 1996.
Andersen, S. T., McGillen, M. R., Xue, C., Seubert, T., Dewald, P., Türk, G. N. T. E., Schuladen, J., Denjean, C., Etienne, J.-C., Garrouste, O., Jamar, M., Harb, S., Cirtog, M., Michoud, V., Cazaunau, M., Bergé, A., Cantrell, C., Dusanter, S., Picquet-Varrault, B., Kukui, A., Mellouki, A., Carpenter, L. J., Lelieveld, J., and Crowley, J. N.: Measurement report: Sources, sinks, and lifetime of NOx in a suburban temperate forest at night, Atmos. Chem. Phys., 24, 11603–11618, https://doi.org/10.5194/acp-24-11603-2024, 2024.
Ball, S. M., Povey, I. M., Norton, E. G., and Jones, R. L.: Broadband cavity ringdown spectroscopy of the NO3 radical, Chem. Phys. Lett., 342, 113–120, https://doi.org/10.1016/S0009-2614(01)00573-5, 2001.
Ball, S. M., Langridge, J. M., and Jones, R. L.: Broadband cavity enhanced absorption spectroscopy using light emitting diodes, Chem. Phys. Lett., 398, 68–74, https://doi.org/10.1016/j.cplett.2004.08.144, 2004.
Berden, G., Peeters, R., and Meijer, G.: Cavity ring-down spectroscopy: Experimental schemes and applications, Int. Rev. Phys. Chem., 19, 565–607, https://doi.org/10.1080/014423500750040627, 2000.
Bitter, M., Ball, S. M., Povey, I. M., and Jones, R. L.: A broadband cavity ringdown spectrometer for in-situ measurements of atmospheric trace gases, Atmos. Chem. Phys., 5, 2547–2560, https://doi.org/10.5194/acp-5-2547-2005, 2005.
Bolzacchini, E., Bruschi, M., Hjorth, J., Meinardi, S., Orlandi, M., Rindone, B., and Rosenbohm, E.: Gas-Phase Reaction of Phenol with NO3, Environ. Sci. Technol., 35, 1791–1797, https://doi.org/10.1021/es001290m, 2001.
Brown, S. S.: Absorption spectroscopy in high-finesse cavities for atmospheric studies, Chem. Rev., 103, 5219–5238, https://doi.org/10.1021/cr020645c, 2003.
Brown, S. S. and Stutz, J.: Nighttime radical observations and chemistry, Chem. Soc. Rev., 41, 6405–6447, https://doi.org/10.1039/C2CS35181A, 2012.
Brown, S. S., Stark, H., and Ravishankara, A. R.: Cavity ring-down spectroscopy for atmospheric trace gas detection: application to the nitrate radical (NO3), Appl. Phys. B, 75, 173–182, https://doi.org/10.1007/s00340-002-0980-y, 2002.
Brown, S. S., Stark, H., and Ravishankara, A. R.: Applicability of the steady state approximation to the interpretation of atmospheric observations of NO3 and N2O5, J. Geophys. Res.-Atmos., 108, 4539, https://doi.org/10.1029/2003JD003407, 2003.
Brown, S. S., Dubé, W. P., Osthoff, H. D., Wolfe, D. E., Angevine, W. M., and Ravishankara, A. R.: High resolution vertical distributions of NO3 and N2O5 through the nocturnal boundary layer, Atmos. Chem. Phys., 7, 139–149, https://doi.org/10.5194/acp-7-139-2007, 2007.
Brown, S. S., Dube, W. P., Fuchs, H., Ryerson, T. B., Wollny, A. G., Brock, C. A., Bahreini, R., Middlebrook, A. M., Neuman, J. A., Atlas, E., Roberts, J. M., Osthoff, H. D., Trainer, M., Fehsenfeld, F. C., and Ravishankara, A. R.: Reactive uptake coefficients for N2O5 determined from aircraft measurements during the Second Texas Air Quality Study: Comparison to current model parameterizations, J. Geophys. Res.-Atmos., 114, D00F10, https://doi.org/10.1029/2008JD011679, 2009.
Brown, S. S., An, H., Lee, M., Park, J.-H., Lee, S.-D., Fibiger, D. L., McDuffie, E. E., Dubé, W. P., Wagner, N. L., and Min, K.-E.: Cavity enhanced spectroscopy for measurement of nitrogen oxides in the Anthropocene: results from the Seoul tower during MAPS 2015, Faraday Discuss., 200, 529–557, https://doi.org/10.1039/C7FD00001D, 2017.
Burkholder, J. B., Caravan, R. L., Huie, R. E., Orkin, V. L., Percival, C. J., Sander, R., Sander, S. P., and Wilmouth, D. M.: Chemical Kinetics and Photochemical Data for Use in Atmospheric Studies, Evaluation No. 20, JPL Publication 25-1, Jet Propulsion Laboratory, Pasadena, https://science.jpl.nasa.gov/documents/1503/NASA_Data_Evaluation_20.pdf (last access: 11 November 2026), 2025.
Cantrell, C. and Michoud, V.: An Experiment to Study Atmospheric Oxidation Chemistry and Physics of Mixed Anthropogenic–Biogenic Air Masses in the Greater Paris Area, B. Am. Meteorol. Soc., 103, 599–603, https://doi.org/10.1175/BAMS-D-21-0115.1, 2022.
Chen, X., Wang, H., and Lu, K.: Interpretation of observation via steady state in high-aerosol air mass: the impact of equilibrium coefficient in ambient conditions, Atmos. Chem. Phys., 22, 3525–3533, https://doi.org/10.5194/acp-22-3525-2022, 2022.
Clough, P. N. and Thrush, B. A.: Mechanism of chemiluminescent reaction between nitric oxide and ozone, T. Faraday Soc., 63, 915–925, https://doi.org/10.1039/TF9676300915, 1967.
Crowley, J. N., Schuster, G., Pouvesle, N., Parchatka, U., Fischer, H., Bonn, B., Bingemer, H., and Lelieveld, J.: Nocturnal nitrogen oxides at a rural mountain-site in south-western Germany, Atmos. Chem. Phys., 10, 2795–2812, https://doi.org/10.5194/acp-10-2795-2010, 2010.
Crowley, J. N., Thieser, J., Tang, M. J., Schuster, G., Bozem, H., Beygi, Z. H., Fischer, H., Diesch, J.-M., Drewnick, F., Borrmann, S., Song, W., Yassaa, N., Williams, J., Pöhler, D., Platt, U., and Lelieveld, J.: Variable lifetimes and loss mechanisms for NO3 and N2O5 during the DOMINO campaign: contrasts between marine, urban and continental air, Atmos. Chem. Phys., 11, 10853–10870, https://doi.org/10.5194/acp-11-10853-2011, 2011.
Crutzen, P. J. and Lelieveld, J.: Human impacts on atmospheric chemistry, Annu. Rev. Earth Pl. Sc., 29, 17–45, https://doi.org/10.1146/annurev.earth.29.1.17, 2001.
Curtis, A. R. and Sweetenham, W. P.: Facsimile, Atomic Energy Research Establishment, Report R-12805, Harwell Laboratory, Oxfordshire, UK, ISBN: 0705813177, 1987.
Davidson, J. A., Cantrell, C. A., McDaniel, A. H., Shetter, R. E., Madronich, S., and Calvert, J. G.: Visible-ultraviolet absorption cross sections for NO2 as a function of temperature, J. Geophys. Res.-Atmos., 93, 7105–7112, https://doi.org/10.1029/JD093iD06p07105, 1988.
Day, D. A., Wooldridge, P. J., Dillon, M. B., Thornton, J. A., and Cohen, R. C.: A thermal dissociation laser-induced fluorescence instrument for in situ detection of NO2, peroxy nitrates, alkyl nitrates, and HNO3, J. Geophys. Res.-Atmos., 107, https://doi.org/10.1029/2001jd000779, 2002.
Dewald, P., Liebmann, J. M., Friedrich, N., Shenolikar, J., Schuladen, J., Rohrer, F., Reimer, D., Tillmann, R., Novelli, A., Cho, C., Xu, K., Holzinger, R., Bernard, F., Zhou, L., Mellouki, W., Brown, S. S., Fuchs, H., Lelieveld, J., and Crowley, J. N.: Evolution of NO3 reactivity during the oxidation of isoprene, Atmos. Chem. Phys., 20, 10459–10475, https://doi.org/10.5194/acp-20-10459-2020, 2020.
Dewald, P., Seubert, T., Andersen, S. T., Türk, G. N. T. E., Schuladen, J., McGillen, M. R., Denjean, C., Etienne, J.-C., Garrouste, O., Jamar, M., Harb, S., Cirtog, M., Michoud, V., Cazaunau, M., Bergé, A., Cantrell, C., Dusanter, S., Picquet-Varrault, B., Kukui, A., Xue, C., Mellouki, A., Lelieveld, J., and Crowley, J. N.: NO3 reactivity during a summer period in a temperate forest below and above the canopy, Atmos. Chem. Phys., 24, 8983–8997, https://doi.org/10.5194/acp-24-8983-2024, 2024.
Dewald, P., Seubert, T., Wüst, L., Schuladen, J., Drewnick, F., Fachinger, F., Hoffmann, T., and Crowley, J. N.: Particle nitrate measurement using a thermal-dissociation, cavity-ringdown-spectrometer with gas-phase denuder (D-TD-CRDS), Atmos. Meas. Tech., 19, 3445–3457, https://doi.org/10.5194/amt-19-3445-2026, 2026a.
Dewald, P., Harb, S., Picquet-Varrault, B., Cazaunau, M., Feingesicht, M., Beltran, L., Michoud, V., Landsheere, X., Pangui, E., Bergé, A., Cantrell, C., and Cirtog, M.: Data underlying the figures of “An incoherent broadband cavity-enhanced absorption spectrometer for simultaneous NO3 and N2O5 measurements, integrated into a NOy instrument suite: characterization and first field deployment”, Zenodo [data set], https://doi.org/10.5281/zenodo.23922482, 2026b.
Dorn, H.-P., Apodaca, R. L., Ball, S. M., Brauers, T., Brown, S. S., Crowley, J. N., Dubé, W. P., Fuchs, H., Häseler, R., Heitmann, U., Jones, R. L., Kiendler-Scharr, A., Labazan, I., Langridge, J. M., Meinen, J., Mentel, T. F., Platt, U., Pöhler, D., Rohrer, F., Ruth, A. A., Schlosser, E., Schuster, G., Shillings, A. J. L., Simpson, W. R., Thieser, J., Tillmann, R., Varma, R., Venables, D. S., and Wahner, A.: Intercomparison of NO3 radical detection instruments in the atmosphere simulation chamber SAPHIR, Atmos. Meas. Tech., 6, 1111–1140, https://doi.org/10.5194/amt-6-1111-2013, 2013.
Dubé, W. P., Brown, S. S., Osthoff, H. D., Nunley, M. R., Ciciora, S. J., Paris, M. W., McLaughlin, R. J., and Ravishankara, A. R.: Aircraft instrument for simultaneous, in situ measurement of NO3 and N2O5 via pulsed cavity ring-down spectroscopy, Rev. Sci. Instrum., 77, https://doi.org/10.1063/1.2176058, 2006.
Dutta, I., Heald, C. L., Bourgeois, I., Crounse, J. D., Hintsa, E. J., Moore, F. L., and Peischl, J.: Characterizing the global tropospheric budget of oxidized nitrogen (NOy), Atmos. Chem. Phys., 26, 11875–11891, https://doi.org/10.5194/acp-26-11875-2026, 2026.
Engeln, R., Berden, G., Peeters, R., and Meijer, G.: Cavity enhanced absorption and cavity enhanced magnetic rotation spectroscopy, Rev. Sci. Instrum., 69, 3763–3769, https://doi.org/10.1063/1.1149176, 1998.
Fahey, D. W., Hübler, G., Parrish, D. D., Williams, E. J., Norton, R. B., Ridley, B. A., Singh, H. B., Liu, S. C., and Fehsenfeld, F. C.: Reactive Nitrogen Species in the Troposphere: Measurements of NO, NO2, HNO3, Particulate Nitrate, Peroxyacetyl Nitrate (PAN), O3, and Total Reactive Odd Nitrogen (NOy) at Niwot Ridge, Colorado, J. Geophys. Res., 91, 9781–9793, https://doi.org/10.1029/JD091iD09p09781, 1986.
Fiedler, S. E., Hese, A., and Ruth, A. A.: Incoherent broad-band cavity-enhanced absorption spectroscopy, Chem. Phys. Lett., 371, 284–294, https://doi.org/10.1016/S0009-2614(03)00263-X, 2003.
Finlayson-Pitts, B. J. and Pitts, J. N.: CHAPTER 7 – Chemistry of Inorganic Nitrogen Compounds, in: Chemistry of the Upper and Lower Atmosphere, edited by: Finlayson-Pitts, B. J. and Pitts, J. N., Academic Press, San Diego, 264–293, https://doi.org/10.1016/B978-012257060-5/50009-5, 2000.
Fouqueau, A., Cirtog, M., Cazaunau, M., Pangui, E., Zapf, P., Siour, G., Landsheere, X., Méjean, G., Romanini, D., and Picquet-Varrault, B.: Implementation of an incoherent broadband cavity-enhanced absorption spectroscopy technique in an atmospheric simulation chamber for in situ NO3 monitoring: characterization and validation for kinetic studies, Atmos. Meas. Tech., 13, 6311–6323, https://doi.org/10.5194/amt-13-6311-2020, 2020.
Friedrich, N., Tadic, I., Schuladen, J., Brooks, J., Darbyshire, E., Drewnick, F., Fischer, H., Lelieveld, J., and Crowley, J. N.: Measurement of NOx and NOy with a thermal dissociation cavity ring-down spectrometer (TD-CRDS): instrument characterisation and first deployment, Atmos. Meas. Tech., 13, 5739–5761, https://doi.org/10.5194/amt-13-5739-2020, 2020.
Fry, J. L., Draper, D. C., Barsanti, K. C., Smith, J. N., Ortega, J., Winkle, P. M., Lawler, M. J., Brown, S. S., Edwards, P. M., Cohen, R. C., and Lee, L.: Secondary Organic Aerosol Formation and Organic Nitrate Yield from NO3 Oxidation of Biogenic Hydrocarbons, Environ. Sci. Technol., 48, 11944–11953, https://doi.org/10.1021/es502204x, 2014.
Fuchs, H., Dube, W. P., Cicioira, S. J., and Brown, S. S.: Determination of inlet transmission and conversion efficiencies for in Situ measurements of the nocturnal nitrogen oxides, NO3, N2O5 and NO2, via pulsed cavity ring-down spectroscopy, Anal. Chem., 80, 6010–6017, https://doi.org/10.1021/ac8007253, 2008.
Fuchs, H., Ball, S. M., Bohn, B., Brauers, T., Cohen, R. C., Dorn, H.-P., Dubé, W. P., Fry, J. L., Häseler, R., Heitmann, U., Jones, R. L., Kleffmann, J., Mentel, T. F., Müsgen, P., Rohrer, F., Rollins, A. W., Ruth, A. A., Kiendler-Scharr, A., Schlosser, E., Shillings, A. J. L., Tillmann, R., Varma, R. M., Venables, D. S., Villena Tapia, G., Wahner, A., Wegener, R., Wooldridge, P. J., and Brown, S. S.: Intercomparison of measurements of NO2 concentrations in the atmosphere simulation chamber SAPHIR during the NO3Comp campaign, Atmos. Meas. Tech., 3, 21–37, https://doi.org/10.5194/amt-3-21-2010, 2010.
Ge, B., Sun, Y., Liu, Y., Dong, H., Ji, D., Jiang, Q., Li, J., and Wang, Z.: Nitrogen dioxide measurement by cavity attenuated phase shift spectroscopy (CAPS) and implications in ozone production efficiency and nitrate formation in Beijing, China, J. Geophys. Res.-Atmos., 118, 9499–9509, https://doi.org/10.1002/jgrd.50757, 2013.
Geyer, A., Alicke, B., Konrad, S., Schmitz, T., Stutz, J., and Platt, U.: Chemistry and oxidation capacity of the nitrate radical in the continental boundary layer near Berlin, J. Geophys. Res.-Atmos., 106, 8013–8025, https://doi.org/10.1029/2000jd900681, 2001a.
Geyer, A., Ackermann, R., Dubois, R., Lohrmann, B., Muller, T., and Platt, U.: Long-term observation of nitrate radicals in the continental boundary layer near Berlin, Atmos. Environ., 35, 3619–3631, https://doi.org/10.1016/S1352-2310(00)00549-5, 2001b.
Gherman, T., Venables, D. S., Vaughan, S., Orphal, J., and Ruth, A. A.: Incoherent broadband cavity-enhanced absorption spectroscopy in the near-ultraviolet: Application to HONO and NO2, Environ. Sci. Technol., 42, 890–895, https://doi.org/10.1021/es0716913, 2008.
Hosaynali Beygi, Z., Fischer, H., Harder, H. D., Martinez, M., Sander, R., Williams, J., Brookes, D. M., Monks, P. S., and Lelieveld, J.: Oxidation photochemistry in the Southern Atlantic boundary layer: unexpected deviations of photochemical steady state, Atmos. Chem. Phys., 11, 8497–8513, https://doi.org/10.5194/acp-11-8497-2011, 2011.
Hu, H., Wang, H., Lu, K., Wang, J., Zheng, Z., Xu, X., Zhai, T., Chen, X., Lu, X., Fu, W., Li, X., Zeng, L., Hu, M., Zhang, Y., and Fan, S.: Variation and trend of nitrate radical reactivity towards volatile organic compounds in Beijing, China, Atmos. Chem. Phys., 23, 8211–8223, https://doi.org/10.5194/acp-23-8211-2023, 2023.
Ito, A., Sillman, S., and Penner, J. E.: Effects of additional nonmethane volatile organic compounds, organic nitrates, and direct emissions of oxygenated organic species on global tropospheric chemistry, J. Geophys. Res.-Atmos., 112, https://doi.org/10.1029/2005JD006556, 2007.
IUPAC: Task Group on Atmospheric Chemical Kinetic Data Evaluation, edited by: Ammann, M., Cox, R. A., Crowley, J. N., Herrmann, H., Jenkin, M. E., McNeill, V. F., Mellouki, A., Rossi, M. J., Troe, J., and Wallington, T. J., https://iupac.aeris-data.fr/ (last access: 13 July 2026), 2026.
Javed, U., Kubistin, D., Martinez, M., Pollmann, J., Rudolf, M., Parchatka, U., Reiffs, A., Thieser, J., Schuster, G., Horbanski, M., Pöhler, D., Crowley, J. N., Fischer, H., Lelieveld, J., and Harder, H.: Laser-induced fluorescence-based detection of atmospheric nitrogen dioxide and comparison of different techniques during the PARADE 2011 field campaign, Atmos. Meas. Tech., 12, 1461–1481, https://doi.org/10.5194/amt-12-1461-2019, 2019.
Kane, S. M., Caloz, F., and Leu, M.-T.: Heterogeneous Uptake of Gaseous N2O5 by (NH4)2SO4, NH4HSO4, and H2SO4 Aerosols, J. Phys. Chem. A, 105, 6465–6470, https://doi.org/10.1021/jp010490x, 2001.
Kebabian, P. L., Herndon, S. C., and Freedman, A.: Detection of Nitrogen Dioxide by Cavity Attenuated Phase Shift Spectroscopy, Anal. Chem., 77, 724–728, https://doi.org/10.1021/ac048715y, 2005.
Keller-Rudek, H., Moortgat, G. K., Sander, R., and Sörensen, R.: The MPI-Mainz UV/VIS Spectral Atlas of Gaseous Molecules of Atmospheric Interest, Earth Syst. Sci. Data, 5, 365–373, https://doi.org/10.5194/essd-5-365-2013, 2013.
Kennedy, O. J., Ouyang, B., Langridge, J. M., Daniels, M. J. S., Bauguitte, S., Freshwater, R., McLeod, M. W., Ironmonger, C., Sendall, J., Norris, O., Nightingale, R., Ball, S. M., and Jones, R. L.: An aircraft based three channel broadband cavity enhanced absorption spectrometer for simultaneous measurements of NO3, N2O5 and NO2, Atmos. Meas. Tech., 4, 1759–1776, https://doi.org/10.5194/amt-4-1759-2011, 2011.
Kercher, J. P., Riedel, T. P., and Thornton, J. A.: Chlorine activation by N2O5: simultaneous, in situ detection of ClNO2 and N2O5 by chemical ionization mass spectrometry, Atmos. Meas. Tech., 2, 193–204, https://doi.org/10.5194/amt-2-193-2009, 2009.
Kiendler-Scharr, A., Mensah, A. A., Friese, E., Topping, D., Nemitz, E., Prevot, A. S. H., Äijälä, M., Allan, J., Canonaco, F., Canagaratna, M., Carbone, S., Crippa, M., Dall Osto, M., Day, D. A., De Carlo, P., Di Marco, C. F., Elbern, H., Eriksson, A., Freney, E., Hao, L., Herrmann, H., Hildebrandt, L., Hillamo, R., Jimenez, J. L., Laaksonen, A., McFiggans, G., Mohr, C., O'Dowd, C., Otjes, R., Ovadnevaite, J., Pandis, S. N., Poulain, L., Schlag, P., Sellegri, K., Swietlicki, E., Tiitta, P., Vermeulen, A., Wahner, A., Worsnop, D., and Wu, H.-C.: Ubiquity of organic nitrates from nighttime chemistry in the European submicron aerosol, Geophys. Res. Lett., 43, 7735–7744, https://doi.org/10.1002/2016GL069239, 2016.
Kraus, S.: DOASIS – A framework design for DOAS, PhD thesis, University of Heidelberg, Heidelberg, Germany, ISBN: 978-3-8322-5452-0, 2006.
Kumar, V., Slowik, J. G., Baltensperger, U., Prevot, A. S. H., and Bell, D. M.: Time-Resolved Molecular Characterization of Secondary Organic Aerosol Formed from OH and NO3 Radical Initiated Oxidation of a Mixture of Aromatic Precursors, Environ. Sci. Technol., 57, 11572–11582, https://doi.org/10.1021/acs.est.3c00225, 2023.
Langridge, J. M., Ball, S. M., Shillings, A. J. L., and Jones, R. L.: A broadband absorption spectrometer using light emitting diodes for ultrasensitive, in situ trace gas detection, Rev. Sci. Instrum., 79, 123110, https://doi.org/10.1063/1.3046282, 2008.
Lee, B. H., Mohr, C., Lopez-Hilfiker, F. D., Lutz, A., Hallquist, M., Lee, L., Romer, P., Cohen, R. C., Iyer, S., Kurtén, T., Hu, W., Day, D. A., Campuzano-Jost, P., Jimenez, J. L., Xu, L., Ng, N. L., Guo, H., Weber, R. J., Wild, R. J., Brown, S. S., Koss, A., de Gouw, J., Olson, K., Goldstein, A. H., Seco, R., Kim, S., McAvey, K., Shepson, P. B., Starn, T., Baumann, K., Edgerton, E. S., Liu, J., Shilling, J. E., Miller, D. O., Brune, W., Schobesberger, S., D'Ambro, E. L., and Thornton, J. A.: Highly functionalized organic nitrates in the southeast United States: Contribution to secondary organic aerosol and reactive nitrogen budgets, P. Natl. Acad. Sci. USA, 113, 1516–1521, https://doi.org/10.1073/pnas.1508108113, 2016.
Lelieveld, J., Pozzer, A., Poschl, U., Fnais, M., Haines, A., and Munzel, T.: Loss of life expectancy from air pollution compared to other risk factors: a worldwide perspective, Cardiovasc. Res., 116, 1334–1334, https://doi.org/10.1093/cvr/cvaa073, 2020.
Leser, H., Honninger, G., and Platt, U.: MAX-DOAS measurements of BrO and NO2 in the marine boundary layer, Geophys. Res. Lett., 30, https://doi.org/10.1029/2002GL015811, 2003.
Li, Z., Hu, R., Xie, P., Chen, H., Wu, S., Wang, F., Wang, Y., Ling, L., Liu, J., and Liu, W.: Development of a portable cavity ring down spectroscopy instrument for simultaneous, in situ measurement of NO3 and N2O5, Opt. Express, 26, A433–A449, https://doi.org/10.1364/OE.26.00A433, 2018.
Liebmann, J., Karu, E., Sobanski, N., Schuladen, J., Ehn, M., Schallhart, S., Quéléver, L., Hellen, H., Hakola, H., Hoffmann, T., Williams, J., Fischer, H., Lelieveld, J., and Crowley, J. N.: Direct measurement of NO3 radical reactivity in a boreal forest, Atmos. Chem. Phys., 18, 3799–3815, https://doi.org/10.5194/acp-18-3799-2018, 2018.
Liebmann, J., Sobanski, N., Schuladen, J., Karu, E., Hellén, H., Hakola, H., Zha, Q., Ehn, M., Riva, M., Heikkinen, L., Williams, J., Fischer, H., Lelieveld, J., and Crowley, J. N.: Alkyl nitrates in the boreal forest: formation via the NO3−, OH- and O3−induced oxidation of biogenic volatile organic compounds and ambient lifetimes, Atmos. Chem. Phys., 19, 10391–10403, https://doi.org/10.5194/acp-19-10391-2019, 2019.
Lin, C., Hu, R., Xie, P., Lou, S., Zhang, G., Tong, J., Liu, J., and Liu, W.: Nocturnal atmospheric chemistry of NO3 and N2O5 over Changzhou in the Yangtze River Delta in China, Atmos. Chem. Complex Air Pollut., 114, 376–390, https://doi.org/10.1016/j.jes.2021.09.016, 2022.
Lin, Y., Xia, H., Sun, P., Du, S., Liu, Y., Wu, B., Pang, T., and Zhang, Z.: Development and applications of high sensitivity cavity ring-down spectroscopy: a review, Infrared Phys. Technol., 156, 106626, https://doi.org/10.1016/j.infrared.2026.106626, 2026.
Ling, L., Li, W., and Zhang, Q.: A pptv Level Incoherent Broadband Cavity-Enhanced Absorption Spectrometer for the Measurement of Atmospheric NO3, Atmosphere, 14, 543, https://doi.org/10.3390/atmos14030543, 2023.
Logan, J. A.: Nitrogen oxides in the troposphere: Global and regional budgets, J. Geophys. Res.-Oceans, 88, 10785–10807, https://doi.org/10.1029/JC088iC15p10785, 1983.
Matsumoto, J., Kosugi, N., Imai, H., and Kajii, Y.: Development of a measurement system for nitrate radical and dinitrogen pentoxide using a thermal conversion/laser-induced fluorescence technique, Rev. Sci. Instrum., 76, 064101, https://doi.org/10.1063/1.1927098, 2005.
McKay, M. D., Beckman, R. J., and Conover, W. J.: A Comparison of Three Methods for Selecting Values of Input Variables in the Analysis of Output from a Computer Code, Technometrics, 21, 239–245, https://doi.org/10.2307/1268522, 1979.
McLaren, R., Salmon, R. A., Liggio, J., Hayden, K. L., Anlauf, K. G., and Leaitch, W. R.: Nighttime chemistry at a rural site in the Lower Fraser Valley, Atmos. Environ., 38, 5837–5848, https://doi.org/10.1016/j.atmosenv.2004.03.074, 2004.
Mermet, K., Perraudin, E., Dusanter, S., Sauvage, S., Léonardis, T., Flaud, P.-M., Bsaibes, S., Kammer, J., Michoud, V., Gratien, A., Cirtog, M., Al Ajami, M., Truong, F., Batut, S., Hecquet, C., Doussin, J.-F., Schoemaecker, C., Gros, V., Locoge, N., and Villenave, E.: Atmospheric reactivity of biogenic volatile organic compounds in a maritime pine forest during the LANDEX episode 1 field campaign, Sci. Total Environ., 756, 144129, https://doi.org/10.1016/j.scitotenv.2020.144129, 2021.
Merten, A., Tschritter, J., and Platt, U.: Design of differential optical absorption spectroscopy long-path telescopes based on fiber optics, Appl. Optics, 50, 738–754, https://doi.org/10.1364/AO.50.000738, 2011.
Mogensen, D., Gierens, R., Crowley, J. N., Keronen, P., Smolander, S., Sogachev, A., Nölscher, A. C., Zhou, L., Kulmala, M., Tang, M. J., Williams, J., and Boy, M.: Simulations of atmospheric OH, O3 and NO3 reactivities within and above the boreal forest, Atmos. Chem. Phys., 15, 3909–3932, https://doi.org/10.5194/acp-15-3909-2015, 2015.
Monks, P. S.: Gas-phase radical chemistry in the troposphere, Chem. Soc. Rev., 34, 376–395, https://doi.org/10.1039/B307982C, 2005.
Nam, W., Cho, C., Perdigones, B., Rhee, T. S., and Min, K.-E.: Development of a broadband cavity-enhanced absorption spectrometer for simultaneous measurements of ambient NO3, NO2, and H2O, Atmos. Meas. Tech., 15, 4473–4487, https://doi.org/10.5194/amt-15-4473-2022, 2022.
Ng, N. L., Brown, S. S., Archibald, A. T., Atlas, E., Cohen, R. C., Crowley, J. N., Day, D. A., Donahue, N. M., Fry, J. L., Fuchs, H., Griffin, R. J., Guzman, M. I., Herrmann, H., Hodzic, A., Iinuma, Y., Jimenez, J. L., Kiendler-Scharr, A., Lee, B. H., Luecken, D. J., Mao, J., McLaren, R., Mutzel, A., Osthoff, H. D., Ouyang, B., Picquet-Varrault, B., Platt, U., Pye, H. O. T., Rudich, Y., Schwantes, R. H., Shiraiwa, M., Stutz, J., Thornton, J. A., Tilgner, A., Williams, B. J., and Zaveri, R. A.: Nitrate radicals and biogenic volatile organic compounds: oxidation, mechanisms, and organic aerosol, Atmos. Chem. Phys., 17, 2103–2162, https://doi.org/10.5194/acp-17-2103-2017, 2017.
Nussbaumer, C. M., Parchatka, U., Tadic, I., Bohn, B., Marno, D., Martinez, M., Rohloff, R., Harder, H., Kluge, F., Pfeilsticker, K., Obersteiner, F., Zöger, M., Doerich, R., Crowley, J. N., Lelieveld, J., and Fischer, H.: Modification of a conventional photolytic converter for improving aircraft measurements of NO2 via chemiluminescence, Atmos. Meas. Tech., 14, 6759–6776, https://doi.org/10.5194/amt-14-6759-2021, 2021.
Odame-Ankrah, C. A. and Osthoff, H. D.: A Compact Diode Laser Cavity Ring-Down Spectrometer for Atmospheric Measurements of NO3 and N2O5 with Automated Zeroing and Calibration, Appl. Spectrosc., 65, 1260–1268, https://doi.org/10.1366/11-06384, 2011.
Ohara, N., Shioji, T., Matsumoto, J., Inomata, S., Sakamoto, Y., Kajii, Y., Shiigi, H., and Sadanaga, Y.: Improved continuous measurement system for atmospheric total peroxy and total organic nitrate under the high NOx condition, Rev. Sci. Instrum., 95, 045101, https://doi.org/10.1063/5.0172219, 2024.
Orphal, J., Fellows, C. E., and Flaud, P. M.: The visible absorption spectrum of NO3 measured by high-resolution Fourier transform spectroscopy, J. Geophys. Res.-Atmos., 108, 4077, https://doi.org/10.1029/2002JD002489, 2003.
Osthoff, H. D., Pilling, M. J., Ravishankara, A. R., and Brown, S. S.: Temperature dependence of the NO3 absorption cross-section above 298 K and determination of the equilibrium constant for NO3 + NO2 ⇌ N2O5 at atmospherically relevant conditions, Phys. Chem. Chem. Phys., 9, 5785–5793, https://doi.org/10.1039/b709193a, 2007.
Pandey Deolal, S., Brunner, D., Steinbacher, M., Weers, U., and Staehelin, J.: Long-term in situ measurements of NOx and NOy at Jungfraujoch 1998–2009: time series analysis and evaluation, Atmos. Chem. Phys., 12, 2551–2566, https://doi.org/10.5194/acp-12-2551-2012, 2012.
Parrish, D. D., Buhr, M. P., Trainer, M., Norton, R. B., Shimshock, J. P., Fehsenfeld, F. C., Anlauf, K. G., Bottenheim, J. W., Tang, Y. Z., Wiebe, H. A., Roberts, J. M., Tanner, R. L., Newman, L., Bowersox, V. C., Olszyna, K. J., Bailey, E. M., Rodgers, M. O., Wang, T., Berresheim, H., Roychowdhury, U. K., and Demerjiani, K. L.: The total reactive oxidized nitrogen levels and the partitioning between the individual species at six rural sites in eastern North America, J. Geophys. Res.-Atmos., 98, 2927–2939, https://doi.org/10.1029/92JD02384, 1993.
Paul, D., Furgeson, A., and Osthoff, H. D.: Measurements of total peroxy and alkyl nitrate abundances in laboratory-generated gas samples by thermal dissociation cavity ring-down spectroscopy, Rev. Sci. Instrum., 80, 114101, https://doi.org/10.1063/1.3258204, 2009.
Phillips, G. J., Thieser, J., Tang, M., Sobanski, N., Schuster, G., Fachinger, J., Drewnick, F., Borrmann, S., Bingemer, H., Lelieveld, J., and Crowley, J. N.: Estimating N2O5 uptake coefficients using ambient measurements of NO3, N2O5, ClNO2 and particle-phase nitrate, Atmos. Chem. Phys., 16, 13231–13249, https://doi.org/10.5194/acp-16-13231-2016, 2016.
Platt, U. and Stutz, J.: The Design of DOAS Instruments, in: Differential Optical Absorption Spectroscopy: Principles and Applications, edited by: Platt, U. and Stutz, J., Springer Berlin Heidelberg, Berlin, Heidelberg, 175–285, https://doi.org/10.1007/978-3-540-75776-4_7, 2008.
Platt, U., Perner, D., Winer, A. M., Harris, G. W., and Pitts, J. N. J.: Detection of NO3 in the polluted troposphere by differential optical absorption, Geophys. Res. Lett., 7, 89–92, https://doi.org/10.1029/GL007i001p00089, 1980.
Platt, U., Perner, D., Schröder, J., Kessler, C., and Toennissen, A.: The diurnal variation of NO3, J. Geophys. Res., 86, 11965–11970, https://doi.org/10.1029/JC086iC12p11965, 1981.
Pye, H. O. T., Chan, A. W. H., Barkley, M. P., and Seinfeld, J. H.: Global modeling of organic aerosol: the importance of reactive nitrogen (NOx and NO3), Atmos. Chem. Phys., 10, 11261–11276, https://doi.org/10.5194/acp-10-11261-2010, 2010.
Pye, H. O. T., Luecken, D. J., Xu, L., Boyd, C. M., Ng, N. L., Baker, K. R., Ayres, B. R., Bash, J. O., Baumann, K., Carter, W. P. L., Edgerton, E., Fry, J. L., Hutzell, W. T., Schwede, D. B., and Shepson, P. B.: Modeling the Current and Future Roles of Particulate Organic Nitrates in the Southeastern United States, Environ. Sci. Technol., 49, 14195–14203, https://doi.org/10.1021/acs.est.5b03738, 2015.
Reed, C., Evans, M. J., Di Carlo, P., Lee, J. D., and Carpenter, L. J.: Interferences in photolytic NO2 measurements: explanation for an apparent missing oxidant?, Atmos. Chem. Phys., 16, 4707–4724, https://doi.org/10.5194/acp-16-4707-2016, 2016.
Rindelaub, J. D., McAvey, K. M., and Shepson, P. B.: The photochemical production of organic nitrates from α-pinene and loss via acid-dependent particle phase hydrolysis, Atmos. Environ., 100, 193–201, https://doi.org/10.1016/j.atmosenv.2014.11.010, 2015.
Schueneman, M. K., Day, D. A., Jenks, O. J., Kim, D., Handschy, A., Morris, M. A., de Gouw, J. A., Decker, Z. C. J., Ziemann, P. J., and Jimenez, J. L.: Secondary Organic Aerosol Yields from NO3 Oxidation of Phenolic, Aromatic, and Heterocyclic VOCs: Implications for Biomass Burning Plumes, Envrion. Sci. Technol. Air, 2, 2342–2352, https://doi.org/10.1021/acsestair.4c00332, 2025.
Schuster, G., Labazan, I., and Crowley, J. N.: A cavity ring down/cavity enhanced absorption device for measurement of ambient NO3 and N2O5, Atmos. Meas. Tech., 2, 1–13, https://doi.org/10.5194/amt-2-1-2009, 2009.
Seinfeld, J. H. and Pandis, S. N.: Atmospheric Chemistry and Physics: From Air Pollution to Climate Change, Wiley, ISBN: 978-1-119-22117-3, 2012.
Slusher, D. L., Huey, L. G., Tanner, D. J., Flocke, F. M., and Roberts, J. M.: A thermal dissociation-chemical ionization mass spectrometry (TD-CIMS) technique for the simultaneous measurement of peroxyacyl nitrates and dinitrogen pentoxide, J. Geophys. Res.-Atmos., 109, D19315, https://doi.org/10.1029/2004JD004670, 2004.
Sobanski, N., Schuladen, J., Schuster, G., Lelieveld, J., and Crowley, J. N.: A five-channel cavity ring-down spectrometer for the detection of NO2, NO3, N2O5, total peroxy nitrates and total alkyl nitrates, Atmos. Meas. Tech., 9, 5103–5118, https://doi.org/10.5194/amt-9-5103-2016, 2016.
Sommariva, R., Pilling, M. J., Bloss, W. J., Heard, D. E., Lee, J. D., Fleming, Z. L., Monks, P. S., Plane, J. M. C., Saiz-Lopez, A., Ball, S. M., Bitter, M., Jones, R. L., Brough, N., Penkett, S. A., Hopkins, J. R., Lewis, A. C., and Read, K. A.: Night-time radical chemistry during the NAMBLEX campaign, Atmos. Chem. Phys., 7, 587–598, https://doi.org/10.5194/acp-7-587-2007, 2007.
Storn, R. and Price, K.: Differential Evolution – A Simple and Efficient Heuristic for global Optimization over Continuous Spaces, J. Glob. Optim., 11, 341–359, https://doi.org/10.1023/A:1008202821328, 1997.
Stratmann, G., Ziereis, H., Stock, P., Brenninkmeijer, C. A. M., Zahn, A., Rauthe-Schöch, A., Velthoven, P. V., Schlager, H., and Volz-Thomas, A.: NO and NOy in the upper troposphere: Nine years of CARIBIC measurements onboard a passenger aircraft, Atmos. Environ., 133, 93–111, https://doi.org/10.1016/j.atmosenv.2016.02.035, 2016.
Suhail, K., George, M., Chandran, S., Varma, R., Venables, D. S., Wang, M., and Chen, J.: Open path incoherent broadband cavity-enhanced measurements of NO3 radical and aerosol extinction in the North China Plain, Spectrochim. Acta. A, 208, 24–31, https://doi.org/10.1016/j.saa.2018.09.023, 2019.
Tadic, I., Crowley, J. N., Dienhart, D., Eger, P., Harder, H., Hottmann, B., Martinez, M., Parchatka, U., Paris, J.-D., Pozzer, A., Rohloff, R., Schuladen, J., Shenolikar, J., Tauer, S., Lelieveld, J., and Fischer, H.: Net ozone production and its relationship to nitrogen oxides and volatile organic compounds in the marine boundary layer around the Arabian Peninsula, Atmos. Chem. Phys., 20, 6769–6787, https://doi.org/10.5194/acp-20-6769-2020, 2020.
Thieser, J., Schuster, G., Schuladen, J., Phillips, G. J., Reiffs, A., Parchatka, U., Pöhler, D., Lelieveld, J., and Crowley, J. N.: A two-channel thermal dissociation cavity ring-down spectrometer for the detection of ambient NO2, RO2NO2 and RONO2, Atmos. Meas. Tech., 9, 553–576, https://doi.org/10.5194/amt-9-553-2016, 2016.
Türk, G. N. T. E., Andersen, S. T., Dewald, P., Schuladen, J., Lelieveld, J., and Crowley, J. N.: A small-footprint Cavity Ring-Down Spectroscopy instrument for in situ measurements of NO3 and N2O5, Atmos. Meas. Tech., 19, 4815–4832, https://doi.org/10.5194/amt-19-4815-2026, 2026.
Vandaele, A. C., Hermans, C., Simon, P. C., Carleer, M., Colin, R., Fally, S., Merienne, M. F., Jenouvrier, A., and Coquart, B.: Measurements of the NO2 absorption cross-section from 42 000 cm−1 to 10 000 cm−1 (238–1000 nm) at 220 K and 294 K, J. Quant. Spectrosc. Ra., 59, 171–184, https://doi.org/10.1016/S0022-4073(97)00168-4, 1998.
Varma, R. M., Venables, D. S., Ruth, A. A., Heitmann, U., Schlosser, E., and Dixneuf, S.: Long optical cavities for open-path monitoring of atmospheric trace gases and aerosol extinction, Appl. Optics, 48, B159–B171, https://doi.org/10.1364/AO.48.00B159, 2009.
Varma, R. M., Ball, S. M., Brauers, T., Dorn, H.-P., Heitmann, U., Jones, R. L., Platt, U., Pöhler, D., Ruth, A. A., Shillings, A. J. L., Thieser, J., Wahner, A., and Venables, D. S.: Light extinction by secondary organic aerosol: an intercomparison of three broadband cavity spectrometers, Atmos. Meas. Tech., 6, 3115–3130, https://doi.org/10.5194/amt-6-3115-2013, 2013.
Vaughan, S., Gherman, T., Ruth, A. A., and Orphal, J.: Incoherent broad-band cavity-enhanced absorption spectroscopy of the marine boundary layer species I2, IO and OIO, Phys. Chem. Chem. Phys., 10, 4471–4477, https://doi.org/10.1039/b802618a, 2008.
Venables, D. S., Gherman, T., Orphal, J., Wenger, J. C., and Ruth, A. A.: High sensitivity in Situ monitoring of NO3 in an atmospheric simulation chamber using incoherent broadband cavity-enhanced absorption spectroscopy, Environ. Sci. Technol., 40, 6758–6763, https://doi.org/10.1021/es061076j, 2006.
Ventrillard-Courtillot, I., Sciamma O'Brien, E., Kassi, S., Méjean, G., and Romanini, D.: Incoherent broad-band cavity-enhanced absorption spectroscopy for simultaneous trace measurements of NO2 and NO3 with a LED source, Appl. Phys. B, 101, 661–669, https://doi.org/10.1007/s00340-010-4253-x, 2010.
Virtanen, P., Gommers, R., Oliphant, T. E., Haberland, M., Reddy, T., Cournapeau, D., Burovski, E., Peterson, P., Weckesser, W., Bright, J., van der Walt, S. J., Brett, M., Wilson, J., Millman, K. J., Mayorov, N., Nelson, A. R. J., Jones, E., Kern, R., Larson, E., Carey, C. J., Polat, İ., Feng, Y., Moore, E. W., VanderPlas, J., Laxalde, D., Perktold, J., Cimrman, R., Henriksen, I., Quintero, E. A., Harris, C. R., Archibald, A. M., Ribeiro, A. H., Pedregosa, F., van Mulbregt, P., Vijaykumar, A., Bardelli, A. P., Rothberg, A., Hilboll, A., Kloeckner, A., Scopatz, A., Lee, A., Rokem, A., Woods, C. N., Fulton, C., Masson, C., Häggström, C., Fitzgerald, C., Nicholson, D. A., Hagen, D. R., Pasechnik, D. V., Olivetti, E., Martin, E., Wieser, E., Silva, F., Lenders, F., Wilhelm, F., Young, G., Price, G. A., Ingold, G.-L., Allen, G. E., Lee, G. R., Audren, H., Probst, I., Dietrich, J. P., Silterra, J., Webber, J. T., Slavič, J., Nothman, J., Buchner, J., Kulick, J., Schönberger, J. L., de Miranda Cardoso, J. V., Reimer, J., Harrington, J., Rodríguez, J. L. C., Nunez-Iglesias, J., Kuczynski, J., Tritz, K., Thoma, M., Newville, M., Kümmerer, M., Bolingbroke, M., Tartre, M., Pak, M., Smith, N. J., Nowaczyk, N., Shebanov, N., Pavlyk, O., Brodtkorb, P. A., Lee, P., McGibbon, R. T., Feldbauer, R., Lewis, S., Tygier, S., Sievert, S., Vigna, S., Peterson, S., More, S., Pudlik, T., Oshima, T., Pingel, T. J., Robitaille, T. P., Spura, T., Jones, T. R., Cera, T., Leslie, T., Zito, T., Krauss, T., Upadhyay, U., Halchenko, Y. O., and Vázquez-Baeza, Y.: SciPy 1.0: fundamental algorithms for scientific computing in Python, Nat. Methods, 17, 261–272, https://doi.org/10.1038/s41592-019-0686-2, 2020.
Vrekoussis, M., Mihalopoulos, N., Gerasopoulos, E., Kanakidou, M., Crutzen, P. J., and Lelieveld, J.: Two-years of NO3 radical observations in the boundary layer over the Eastern Mediterranean, Atmos. Chem. Phys., 7, 315–327, https://doi.org/10.5194/acp-7-315-2007, 2007.
Wagner, N. L., Dubé, W. P., Washenfelder, R. A., Young, C. J., Pollack, I. B., Ryerson, T. B., and Brown, S. S.: Diode laser-based cavity ring-down instrument for NO3, N2O5, NO, NO2 and O3 from aircraft, Atmos. Meas. Tech., 4, 1227–1240, https://doi.org/10.5194/amt-4-1227-2011, 2011.
Wang, D., Hu, R., Xie, P., Liu, J., Liu, W., Qin, M., Ling, L., Zeng, Y., Chen, H., Xing, X., Zhu, G., Wu, J., Duan, J., Lu, X., and Shen, L.: Diode laser cavity ring-down spectroscopy for in situ measurement of NO3 radical in ambient air, J. Quant. Spectrosc. Ra., 166, 23–29, https://doi.org/10.1016/j.jqsrt.2015.07.005, 2015.
Wang, H. and Lu, K.: Monitoring Ambient Nitrate Radical by Open-Path Cavity-Enhanced Absorption Spectroscopy, Anal. Chem., 91, 10687–10693, https://doi.org/10.1021/acs.analchem.9b01971, 2019.
Wang, H., Chen, J., and Lu, K.: Development of a portable cavity-enhanced absorption spectrometer for the measurement of ambient NO3 and N2O5: experimental setup, lab characterizations, and field applications in a polluted urban environment, Atmos. Meas. Tech., 10, 1465–1479, https://doi.org/10.5194/amt-10-1465-2017, 2017.
Wang, J., Doussin, J. F., Perrier, S., Perraudin, E., Katrib, Y., Pangui, E., and Picquet-Varrault, B.: Design of a new multi-phase experimental simulation chamber for atmospheric photosmog, aerosol and cloud chemistry research, Atmos. Meas. Tech., 4, 2465–2494, https://doi.org/10.5194/amt-4-2465-2011, 2011.
Wang, M., Lou, S., Hu, W., Wang, H., Wang, X., Fan, F., Varma, R., Venables, D. S., and Chen, J.: Intercomparison of NO3 under Humid Conditions with Open-Path and Extractive IBBCEAS in an Atmospheric Reaction Chamber, Remote Sens., 15, 739, https://doi.org/10.3390/rs15030739, 2023.
Wayne, R. P., Barnes, I., Biggs, P., Burrows, J. P., Canosamas, C. E., Hjorth, J., Lebras, G., Moortgat, G. K., Perner, D., Poulet, G., Restelli, G., and Sidebottom, H.: The Nitrate Radical - Physics, Chemistry, and the Atmosphere, Atmos. Environ., 25, 1–203, https://doi.org/10.1016/0960-1686(91)90192-A, 1991.
Wennberg, P. O., Bates, K. H., Crounse, J. D., Dodson, L. G., McVay, R. C., Mertens, L. A., Nguyen, T. B., Praske, E., Schwantes, R. H., Smarte, M. D., St Clair, J. M., Teng, A. P., Zhang, X., and Seinfeld, J. H.: Gas-Phase Reactions of Isoprene and Its Major Oxidation Products, Chem. Rev., 118, 3337–3390, https://doi.org/10.1021/acs.chemrev.7b00439, 2018.
Wild, R. J., Edwards, P. M., Dube, W. P., Baumann, K., Edgerton, E. S., Quinn, P. K., Roberts, J. M., Rollins, A. W., Veres, P. R., Warneke, C., Williams, E. J., Yuan, B., and Brown, S. S.: A measurement of total reactive nitrogen, NOy, together with NO2, NO, and O3 via cavity ring-down spectroscopy, Environ. Sci. Technol., 48, 9609–9615, https://doi.org/10.1021/es501896w, 2014.
Wild, R. J., Edwards, P. M., Bates, T. S., Cohen, R. C., de Gouw, J. A., Dubé, W. P., Gilman, J. B., Holloway, J., Kercher, J., Koss, A. R., Lee, L., Lerner, B. M., McLaren, R., Quinn, P. K., Roberts, J. M., Stutz, J., Thornton, J. A., Veres, P. R., Warneke, C., Williams, E., Young, C. J., Yuan, B., Zarzana, K. J., and Brown, S. S.: Reactive nitrogen partitioning and its relationship to winter ozone events in Utah, Atmos. Chem. Phys., 16, 573–583, https://doi.org/10.5194/acp-16-573-2016, 2016.
Williams, E. J., Baumann, K., Roberts, J. M., Bertman, S. B., Norton, R. B., Fehsenfeld, F. C., Springston, S. R., Nunnermacker, L. J., Newman, L., Olszyna, K., Meagher, J., Hartsell, B., Edgerton, E., Pearson, J. R., and Rodgers, M. O.: Intercomparison of ground-based NOy measurement techniques, J. Geophys. Res.-Atmos., 103, 22261–22280, https://doi.org/10.1029/98JD00074, 1998.
Womack, C. C., Neuman, J. A., Veres, P. R., Eilerman, S. J., Brock, C. A., Decker, Z. C. J., Zarzana, K. J., Dube, W. P., Wild, R. J., Wooldridge, P. J., Cohen, R. C., and Brown, S. S.: Evaluation of the accuracy of thermal dissociation CRDS and LIF techniques for atmospheric measurement of reactive nitrogen species, Atmos. Meas. Tech., 10, 1911–1926, https://doi.org/10.5194/amt-10-1911-2017, 2017.
Wood, E. C., Wooldridge, P. J., Freese, J. H., Albrecht, T., and Cohen, R. C.: Prototype for In Situ Detection of Atmospheric NO3 and N2O5 via Laser-Induced Fluorescence, Environ. Sci. Technol., 37, 5732–5738, https://doi.org/10.1021/es034507w, 2003.
Wu, H., Chen, J., Liu, A., Hu, S., and Zhang, J.: Cavity ring-down spectroscopy measurements of ambient NO3 and N2O5, Chin. J. Chem. Phys., 33, 1–7, https://doi.org/10.1063/1674-0068/cjcp1910173, 2020.
Wüst, L., Dewald, P., Türk, G. N. T. E., Lelieveld, J., and Crowley, J. N.: Influence of ambient NO and NO2 on the quantification of total peroxy nitrates (ΣPNs) and total alkyl nitrates (ΣANs) by thermal dissociation cavity ring-down spectroscopy (TD-CRDS), Atmos. Meas. Tech., 18, 1943–1959, https://doi.org/10.5194/amt-18-1943-2025, 2025.
Yáñez-Serrano, A. M., Nölscher, A. C., Bourtsoukidis, E., Gomes Alves, E., Ganzeveld, L., Bonn, B., Wolff, S., Sa, M., Yamasoe, M., Williams, J., Andreae, M. O., and Kesselmeier, J.: Monoterpene chemical speciation in a tropical rainforest:variation with season, height, and time of dayat the Amazon Tall Tower Observatory (ATTO), Atmos. Chem. Phys., 18, 3403–3418, https://doi.org/10.5194/acp-18-3403-2018, 2018.
Zhang, X., Liu, H., Cheng, J., Song, W., Wang, H., Zhang, Y., and Wang, X.: Gas-Phase Oxidation of Guaiacol by NO3 Radicals: Kinetic Measurements and Implications, Environ. Sci. Technol. Air, 2, 903–910, https://doi.org/10.1021/acsestair.4c00353, 2025.
- Abstract
- Introduction
- Instrument design and methodology
- Characterization of the IBBCEAS subsystem
- Field deployment
- Summary and conclusions
- Code and data availability
- Author contributions
- Competing interests
- Disclaimer
- Special issue statement
- Acknowledgements
- Financial support
- Review statement
- References
- Supplement
- Abstract
- Introduction
- Instrument design and methodology
- Characterization of the IBBCEAS subsystem
- Field deployment
- Summary and conclusions
- Code and data availability
- Author contributions
- Competing interests
- Disclaimer
- Special issue statement
- Acknowledgements
- Financial support
- Review statement
- References
- Supplement