
the Creative Commons Attribution 4.0 License.
the Creative Commons Attribution 4.0 License.
 | 18 Nov 2026
Single-blind controlled release testing of vehicle- and aircraft-based methane measurement systems at the TADI facility

Catherine Juéry
Vincent Blandin
Matthew Baker
Stéphane Bauguitte
Dominik Brunner
Philippine Burdeau
James L. France
Anders M. Fredenslund
Andreas Hueni
Gerrit Kuhlmann
Patryk Łakomiec
Sandro Meier
Roberto Paglini
Roubina Papaconstantinou
Jean-Daniel Paris
Pierre-Yves Quehe
Thomas Röckmann
Charlotte Scheutz
Martina Schmidt
Marius Vögtli
Julia B. Wietzel
Adam R. Brandt
Accurate methane emission quantification is critical for climate mitigation efforts in the oil and gas industry. This study evaluates the performance of five academic methane measurement systems through single-blind controlled release testing at the TotalEnergies Anomaly Detection Initiatives (TADI) facility in France during June and September 2024. Vehicle-based teams from the Technical University of Denmark, Heidelberg University, and a collaborative team from Utrecht University/LSCE/Cyprus Institute/Royal Holloway deployed mobile in situ measurement systems, while aircraft-based solutions from Empa/UZH and FAAM BAe-146 utilized hyperspectral imaging and airborne in situ measurements, respectively. Vehicle-based systems demonstrated strong detection capabilities with true positive rates of 93 %–95 % and minimum detection thresholds below 1 kg CH4 h−1. Quantification accuracy varied significantly, with slopes ranging from 0.38 to 1.04 when comparing estimated versus true emission rates. Aircraft systems showed more variable performance due to operational constraints and limited data availability. Post-unblinding analysis revealed critical insights into systematic errors, including background concentration calculation issues and wind measurement limitations. Low wind conditions (< 2 m s−1) particularly challenged quantification accuracy across all platforms. These findings highlight the importance of robust validation procedures and high-quality meteorological data for reliable methane emission quantification in real-world applications.
- Article
(5244 KB) - Full-text XML
-
Supplement
(16425 KB) - BibTeX
- EndNote


Methane emissions represent a significant environmental challenge in the oil and gas (O&G) industry, primarily due to the sector's substantial contribution to global greenhouse gas emissions. The energy sector contributes approximately 35 % of global anthropogenic methane emissions (IEA, 2022), meaning accurate detection and quantification of these emissions are essential for developing effective mitigation strategies. Most of these emissions originate from the upstream segment of the industry, which encompasses both onshore and offshore oil and gas production (EPA, 2024). Methane is a highly potent greenhouse gas, with a global warming impact approximately 80 times larger than that of carbon dioxide over 20 years (Forster et al., 2021). Additionally, methane emissions from O&G operations result in economic losses (IEA, 2022), with broader costs rising when accounting for the associated environmental and human health impacts (Mendoza-Cano et al., 2023; Sampedro et al., 2023). Efforts to reduce methane emissions in the sector are gaining momentum, driven by international initiatives and national commitments to curb greenhouse gas emissions. Addressing methane emissions effectively is critical for mitigating the climate crisis and enhancing the overall sustainability of the O&G sector.
Recent developments in regulation and reporting, such as the Oil and Gas Methane Partnership 2.0 (OGMP 2.0), are driving the need for rigorous industry standards in methane inventories. The European Union's (EU) methane policy adopted in 2024 introduced new requirements for monitoring, reporting, and verifying the emissions of domestically produced and imported fuels, making quantifying methane emissions accurately a critical challenge for the O&G industry.
Methane measurement sensors can broadly be categorized into three types: in situ sensors, which measure the methane concentration of an air sample drawn into the instrument at the sensor location; active scanning systems, which illuminate a target with an artificial light source, typically a laser, and retrieve the path-integrated methane column from the returned signal; and passive remote imaging systems, which measure reflected solar radiation to map methane column enhancements across a two-dimensional scene. The systems evaluated in this study fall into the first and third of these categories. Sensors are deployed on a variety of different platforms, ranging from fixed, ground-level sensors situated around a production site to global satellite constellations. Developments in remote sensing technologies (Thorpe et al., 2013, 2017; Thompson et al., 2015; Foote et al., 2021; Ayasse et al., 2024) have improved the ability to monitor global methane emissions, providing wide area coverage, while a variety of ground-based and mobile platforms have been employed to measure methane emissions at industrial sites.
Advances in detection and measurement technologies have made measurement-informed inventories and studies more commonplace (Duren et al., 2019; Foulds et al., 2022; Cusworth et al., 2024; Sherwin et al., 2024; Fougère et al., 2026; Fredenslund et al., 2026; Wietzel and Schmidt, 2026). Aircraft imaging spectrometers now underpin a substantial share of measurement-informed inventories, with large-scale surveys quantifying emissions across California (Duren et al., 2019), the United States oil and gas system (Sherwin et al., 2024), and United States landfills (Cusworth et al., 2024). Vehicle- and aircraft-based systems are also widely used for facility-scale measurements (Foulds et al., 2022; Fredenslund et al., 2026; Wietzel and Schmidt, 2026).
Controlled release testing used to evaluate the performance of methane emission measurement technologies has accompanied their development (Thorpe et al., 2016; Ars et al., 2017; Ravikumar et al., 2019; Sherwin et al., 2021; Morales et al., 2022; Chen et al., 2024; El Abbadi et al., 2024; Wietzel et al., 2025). These tests typically involve intentional releases of methane in a controlled environment to study detection and quantification capabilities under specific conditions. In single-blind testing, participants are informed about some aspects of the release (e.g. timing or location) but are unaware of the actual emissions rates, which allows researchers to assess the detection accuracy while minimizing bias. Differing levels of relevant information are kept from participants to eliminate potential expectations influencing their assessments, depending on the experimental constraints. Recent advancements in controlled release testing methodologies include the development of standardized protocols aimed at improving the consistency and comparability of results across different technologies (Bell and Zimmerle, 2020, 2022; METEC and TADI, 2025).
Ongoing research and collaboration among academic institutions and industry experts are vital for the advancement of methane emission measurement technologies. Over 4 weeks in June and September 2024, five academic teams participated in a methane controlled release experiment at the TotalEnergies Anomaly Detection Initiatives (TADI) research site in Lacq, France. They joined with several commercial operators of methane measurement technologies. The academic and commercial teams are evaluated in separate papers for two reasons: (1) the academic teams were all aircraft or vehicle-based technologies, with no crossover into the commercial satellite, drone, and fixed sensor technology groups; and (2) the academic researchers are authors of this paper. There was no difference in the evaluation of the participants (i.e., the single-blind was maintained throughout the initial analysis), but the collaborative nature of academic teams allows for a more detailed analysis of measurements when compared to proprietary methods and algorithms. Vehicle-based academic teams consisted of researchers from the Technical University of Denmark (DTU), Heidelberg University (UHEI), and a combined team from Utrecht University, the French Laboratory for Climate and Environmental Sciences, the Cyprus Institute, and Royal Holloway University of London (UU/LSCE/CYI/RHUL). Aircraft-based solutions included technologies from the FAAM Airborne Laboratory and the Swiss Federal Laboratories for Materials Science and Technology (Empa) in collaboration with the University of Zurich (UZH). The analysis team consisted of researchers from Stanford University and TotalEnergies.
This paper presents a comprehensive evaluation of the detection and quantification performance of academic methane measurement technologies tested during the TADI controlled release experiments. Through rigorous single-blind testing protocols, we assess the capabilities and limitations of various vehicle-based and aircraft-based measurement platforms across different emission rates and environmental conditions. Our analysis employs detection limit curves and parity plot comparisons to provide quantitative insights into measurement accuracy and precision, contributing valuable empirical data to the growing body of knowledge on methane emission measurement technologies. We examine how well each platform detects and quantifies releases, and which factors, such as wind and weather, limit performance. The findings from this study will inform the development of more effective methane monitoring strategies and support evidence-based decision-making for emission reduction initiatives in the oil and gas industry.
The controlled release experiments were conducted over four weeks in June and September 2024 at the TADI research facility in southwestern France. The study employed a single-blind testing protocol where academic teams were informed of release timing but remained unaware of the actual emission rates, release locations, and whether emissions were occurring during each measurement period. This section describes the experimental setup, data collection procedures, and systems used by each team to provide estimates of methane emission rates. A comprehensive description of the experimental design, site layout, release procedures and true release rates, and environmental monitoring can be found in the Supplement. The results presented in this study were collected at the same time as the data contained in McManemin et al. (2026), which presents the parallel evaluation of commercial methane measurement technologies conducted during the same campaign.
2.1 Experimental setup
Each testing day followed a structured schedule with approximately eight 45 min measurement periods, separated by 15 min intervals to allow for atmospheric dispersion and return to background methane concentrations. The controlled releases encompassed a range of emission rates from zero (for false positive testing) to over 300 kg CH4 h−1, designed to evaluate detection limits and quantification accuracy across different scales relevant to industrial operations. Methane was released from a dedicated platform at the TADI site using calibrated flow control systems with known uncertainties.
Controlled release parameters, including flowrates, locations, timing, and associated uncertainties, were recorded on-site by TADI engineers. Environmental conditions were monitored through daily meteorological observations and continuous high-resolution wind measurements using a ZX 300 Wind Lidar system positioned at the test site. However, the high-resolution wind data were not made available to participants until after the unblinding of true emission rates.
The academic teams deployed various measurement platforms, including vehicle-based mobile systems and aircraft-based technologies, each operating according to their standard protocols and methodologies. Teams were required to provide their own ancillary measurements (such as wind data) as needed for their quantification algorithms, reflecting real-world operational conditions.
2.2 Data submission and filtering procedures
Following each testing week, participants submitted their emission rate estimates and associated metadata. True release rates were unblinded only after all participants for each respective week had completed their submissions, with TADI wind lidar data provided simultaneously to enable post-analysis comparisons and method refinement.
After submission, the data filtering process categorized submitted estimates into three types: non-zero estimates (teams reporting measurable emission rates), zero estimates (teams reporting 0 kg h−1) and N/A estimates (release for which teams provided no quantification) (see Table 1). Three quality control (QC) frameworks were implemented: Strict QC (most restrictive), Stanford QC (team-specific criteria, used as default), and Participant QC (exactly as submitted by teams). The Stanford QC process utilized additional contextual information submitted with estimates to distinguish between genuine zero detections (e.g. “no plume visible”) and measurement failures due to external factors (e.g. adverse weather conditions). Detailed descriptions of the data filtering and categorization methods can be found in Sect. S4 in the Supplement. After categorization, each submitted estimate was further classified into a true positive, false positive, true negative, or false negative estimate, depending on the true release rate (see Sect. S5.1).
Table 1Release counts by participant through the filtering process.
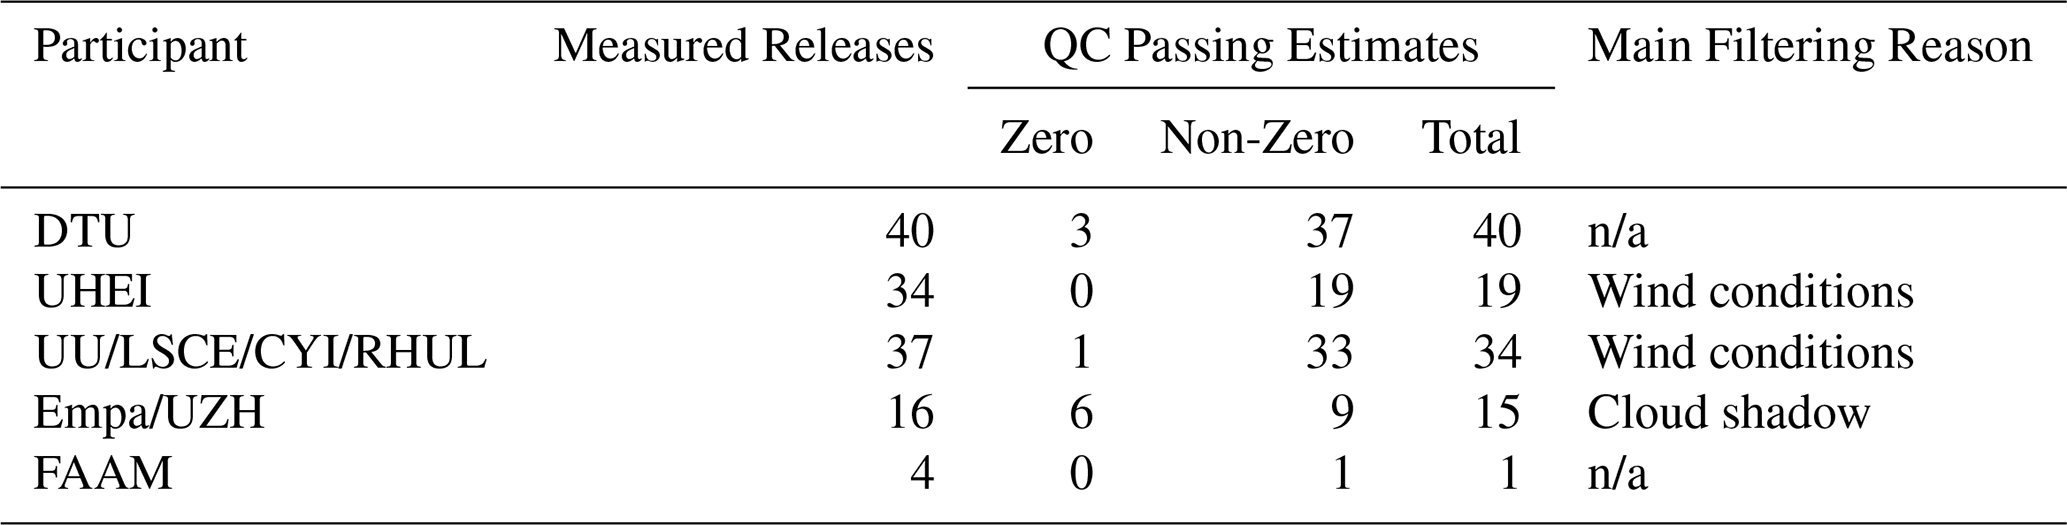
Measured releases is the number of releases that the participants measured during the testing periods. QC passing estimates is the number of measured estimates that passed the Stanford QC method, divided into zero and non-zero estimates by participant (i.e. the classification of the release rate submitted by the participant, which could be different than the true release rate). n/a: not applicable.
2.3 Technology descriptions
The following sections describe the sensor technology, systems, and measurement procedures of the participating academic teams, which are summarized in Table 2. More details on measurement and quantification methodologies can be found in Sect. S2.
Table 2Participant and deployed solution, technology type, and week(s) of controlled release testing.

n/a: not applicable.
2.3.1 Technical University of Denmark (DTU)
The DTU team deployed a mobile ground-based system using a 2017 van equipped with a Picarro cavity ring-down spectrometer (model G2203) that measures methane and acetylene concentrations in situ. This gas analyzer has a specification of CH4 precision of 3 ppb (1σ, 2 s). The team employed a tracer gas dispersion method for emission quantification, which combines the controlled release of acetylene as a tracer gas with downwind measurements of both methane and acetylene concentrations to reconstruct plume dispersion characteristics.
The methodology involves releasing acetylene at a known, constant rate from the suspected emission source while conducting at least 10 cross-plume measurements of atmospheric methane and acetylene concentrations using the mobile platform. Air is sampled at approximately 2 m height as the vehicle traverses downwind transects. The approach assumes that methane and acetylene undergo identical dispersion and transport processes, allowing methane emission rates to be inferred from the ratio of observed methane to acetylene concentrations and the known acetylene release rate. This tracer gas dispersion method is described in detail in earlier publications and has been shown in previous controlled release studies to achieve quantification errors very likely less than 20 % for fugitive emissions from area sources (Mønster et al., 2014; Delre et al., 2018; Fredenslund et al., 2019, 2023; Kissas et al., 2022). Additional details on this methodology can be found in Mønster et al. (2014) and Fredenslund et al. (2019).
For the TADI experiments, acetylene was released via tubing into the center of the ATEX zone from a gas cylinder positioned near the test site (i.e., only the tubing and the tracer gas release point were within the gas release platform as required by TADI safety practices), and the acetylene releases occurred for the entirety of the methane release periods. Due to the central position of the acetylene gas cylinder, the maximum distance to the edge of the platform was 32 m, and methane releases typically occurred within a 10 m radius of the cylinder. The measurements at TADI deviated from typical operational practices in two key ways. First, the emission zone could not be surveyed beforehand to determine precise emission locations, and emission location within the platform varied and was blinded to participants, which prevented optimal tracer gas placement at or near the actual sources. Second, real-time adjustment of tracer placement based on methane-acetylene correlation during measurement – a standard practice to optimize method performance – was not possible due to the controlled experimental constraints.
2.3.2 Heidelberg University (UHEI)
The Heidelberg University team deployed a mobile ground-based measurement system using a 2019 Volkswagen van equipped with a CH4 and CO2 optical feedback-cavity enhanced absorption spectrometer from LI-COR (LI-7810) for in situ concentration measurements, with a specification of 1σ precision of 0.25 ppb at 2 ppm with 5 s averaging. During the five-day release campaign, a standard gas cylinder was measured regularly for stabilization control of the instrument. The system incorporated dual meteorological monitoring capabilities, consisting of a fixed 3D anemometer and a mobile weather station mounted on the vehicle roof, near the intake line. These instruments provided local atmospheric wind data necessary for emission quantification algorithms. To apply the Gaussian plume dispersion method, the UHEI team conducted mobile transects around the gas release platform as shown in Fig. 1. The typical driving pattern involved driving the roads around the platform that were located approximately 50 m to the northeast, 65 m northwest, 80 m southwest, and 90 m southeast. The minimum, maximum, and mean measurement distances were 64, 211 and 105 m, respectively. The emission plume was crossed at least 10 times during these transects. When wind conditions permitted, measurements were carried out at two different distances from the TADI platform to enhance the spatial resolution and robustness of the emission estimates. Furthermore, stationary measurements were conducted during three controlled release experiments, during which methane concentrations were recorded directly downwind, aligned with the prevailing wind direction.
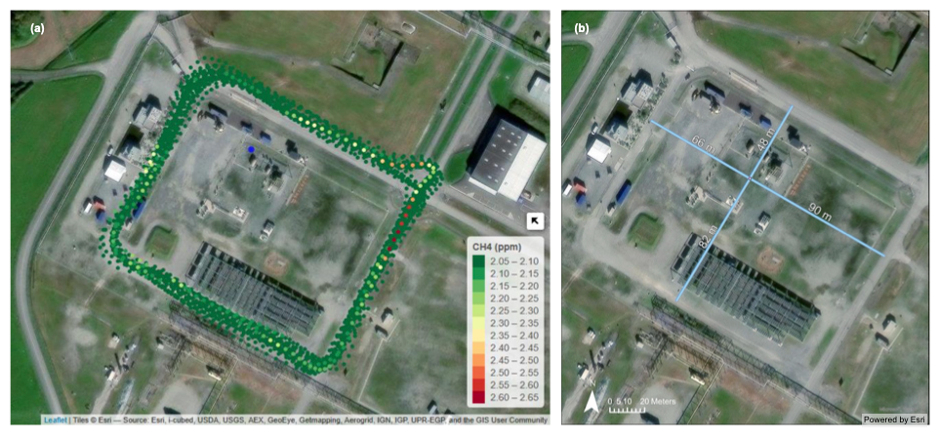
Figure 1(a) Example path driven around the TADI platform and measured CH4 concentration by the UHEI team. The map was created using leaflet for R (© Esri). (b) Distances in meters from center of gas release platform to surrounding roads. Sources: Esri, i-cubed, USDA, USGS, AEX, GeoEye, Getmapping, Aerogrid, IGN, IGP, UPR-EGP, and the GIS User Community | Powered by Esri.
Methane emission rates were calculated using one of the following methods: (1) the Other Test Method 33a (OTM33a) protocol (Korbeń et al., 2022; Morales et al., 2022) or (2) a Gaussian plume modeling approach (Korbeń et al., 2022; Wietzel et al., 2025; Wietzel and Schmidt, 2026). The OTM33a method provides a standardized framework for quantifying emissions from point sources through stationary measurements, while the Gaussian plume method is based on measured CH4 concentrations collected during transects through the emission plume. Only two estimates were submitted using OTM33a, limiting the intercomparison of these methods. Both models account for atmospheric dispersion characteristics based on the collected meteorological data. Since plume behavior is influenced by wind speed, which is a critical parameter in determining CH4 emission rates using Gaussian plume modeling (Wilson et al., 1976) measurements taken at wind speeds below 2 m s−1 were reported but flagged as such during the participants' quality control process. A detailed description of the measurement setup and methodology employed for emission detection and quantification surveys by the Heidelberg team can be found in Korbeń et al. (2022) and Wietzel et al. (2025).
2.3.3 The Cyprus Institute, Royal Holloway University of London, Utrecht University, and the Laboratory for Climate and Environmental Sciences (UU/LSCE/CYI/RHUL)
The collaborative team from Utrecht University, the French Laboratory for Climate and Environmental Sciences, the Cyprus Institute, and Royal Holloway University of London deployed a shared mobile measurement system during Week 4 of the campaign. The instrumentation comprised three complementary methane concentration analyzers: an ABB LGR-ICOS™ UAV-Microportable Analyzer, GLA133-GGA Model sampling air at a rate of 10 Hz (accuracy: ±1 %, instrument CH4 precision: 0.9 ppb at 1 s averaging and 0.3 ppb at 10 s averaging, an Aeris MIRA Ultra methane analyzer (1 ppb CH4 precision (1σ, 1 s)), and a Picarro G2311-f analyzer (CH4 precision (1σ, 10 Hz) ≤ 3 ppb), all mounted in a single vehicle equipped with an Airmar150WX WeatherStation® and GPS system for real-time positioning and local meteorological data collection (Fig. 3a). To supplement the mobile wind measurements, the team installed a stationary LI-550 Trisonica Mini 3D Wind Anemometer (10 Hz) near the release area to provide additional wind field characterization. The dual anemometer configuration was designed to capture both local wind conditions at the measurement vehicle and representative conditions near the emission source area.
The detection methodology involved repeated driving patterns around the release area while monitoring real-time methane concentration displays to identify plume crossings. Team members rotated between roles including driver, co-pilot, and control room operations, with four personnel on-site covering all operational functions. An example of driven path can be seen in Fig. 2.
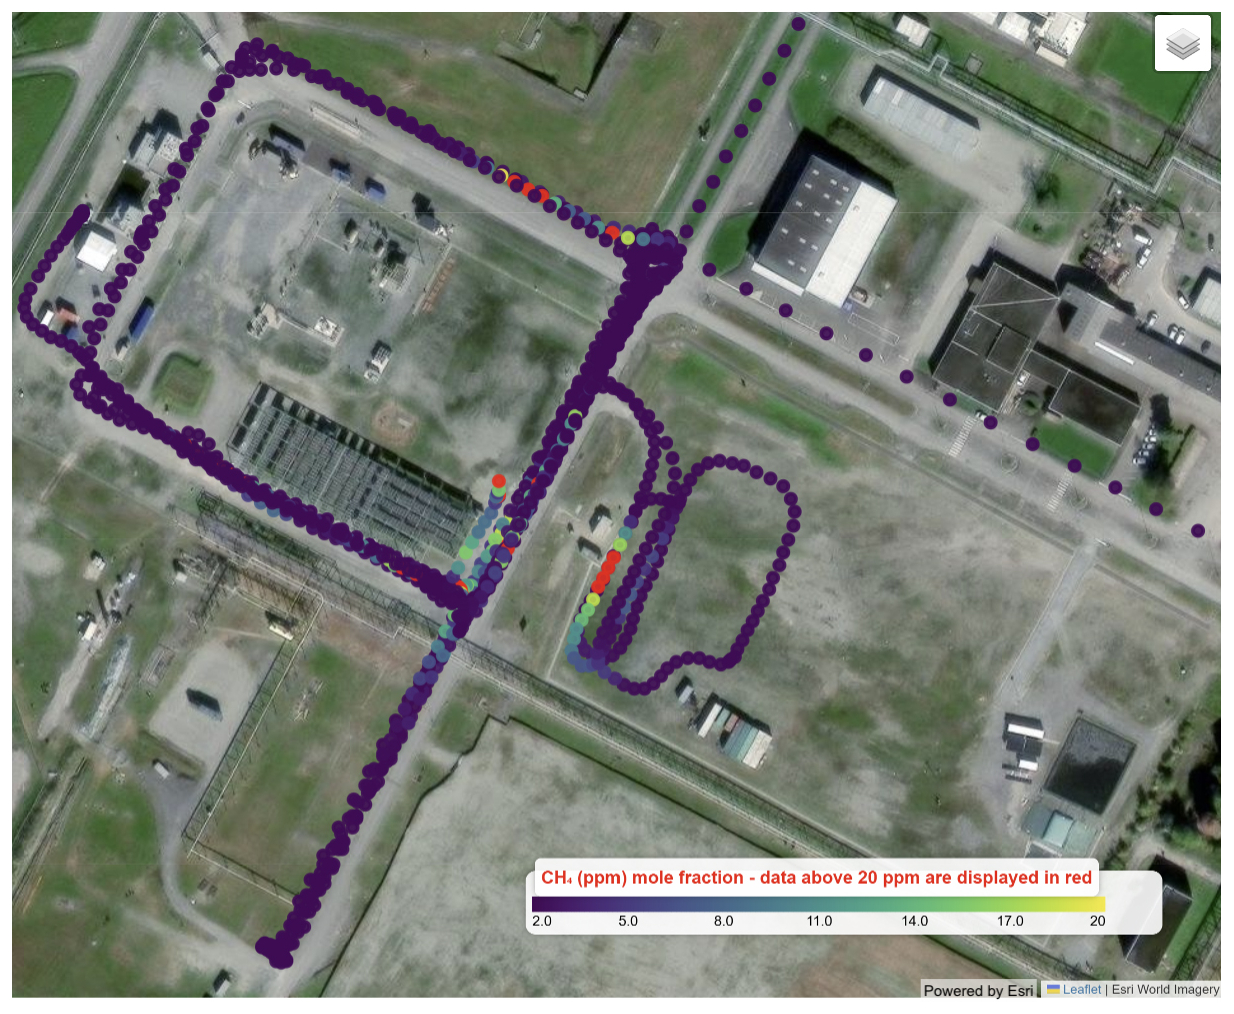
Figure 2Example path driven around the TADI platform by the UU/LSCE/CYI/RHUL team. The underlying satellite view layer is based on Esri World Imagery©, methane concentration collected by the Aeris MIRA analyzer are displayed using a colormap that scales linearly with the concentration up to 20 ppm; for clarity, data points above 20 ppm are shown in red. Refer to Fig. 1b for distances from the center of the gas release platform to the surrounding roads. Sources: Esri, Airbus DS, USGS, NGA, NASA, CGIAR, N Robinson, NCEAS, NLS, OS, NMA, Geodatastyrelsen, Rijkswaterstaat, GSA, Geoland, FEMA, Intermap, and the GIS User Community | Powered by Esri.

Figure 3(a) Vehicle setup. (b) CH4 time series of a 45 min release. (c) Identification of the emission source by gridding the area of survey and triangulating the source based on wind data. The area is divided into a logical number of cells, identified by columns and rows indexed with a letter and number. For each peak maximum detected by the vehicle, a red line represents the wind direction of origin. The cell crossed by the most lines during the same release is therefore the one identified as the potential source of the emission for that release. (d) Live mapping/visualization of CH4 mole fractions. (e) Observed and modeled CH4 mole fractions of identified useful peaks. Satellite imagery sources: Maxar, Microsoft | Map data sources: Esri, TomTom, Garmin, FAO, NOAA, USGS, ©OpenStreetMap contributors, and the GIS User Community | Powered by Esri.
Upon detecting concentration enhancements, the team used visual screening of the online sensor displays to verify plume encounters and guide subsequent survey patterns. For quantification, methane concentration data from all three analyzers were integrated with GPS positioning and wind measurements to estimate the emission source location (Fig. 3b–d). Atmospheric dispersion coefficients were determined using different methodologies. For RHUL, the dispersion coefficients of the plume (σy and σz) were approximated using Briggs' assumptions using the Pasquill–Gifford atmospheric stability classification (Briggs, 1973). A full description of the Gaussian plume procedure for the RHUL method can be found in Dowd et al. (2024). LSCE-CYI used the stability class estimate provided by the TriSonica® station. Finally, UU estimated the horizontal dispersion coefficient (σy) as the standard deviation of a gaussian function fitted on the peaks of methane enhancement above the background. Then, the stability class that yields the closest estimate of the σy value based on the downwind distance from the estimated source position is used to estimate the vertical dispersion coefficient (σz). This method is adapted from the methodology used in Maazallahi et al. (2020). The estimated location and atmospheric stability classification were then incorporated into a Gaussian plume dispersion model to calculate emission rates based on the observed concentration field (Fig. 3e).
For all members of the UU/LSCE/CYI/RHUL team, the modeling approach required assumptions about the release point height, as this parameter was not known in the single-blind experimental design.
Originally, the participating institutions (CYI/LSCE, RHUL, and UU) planned to provide separate quantification and detection results despite sharing the common vehicle platform and meteorological instrumentation. However, following the campaign's conclusion, the collaborative team decided to submit unified emission rate estimates for each release (e.g. an average of the independent results), reflecting the integrated nature of their measurement approach and data analysis. The unified estimates were provided by averaging results that were converging towards similar values (within uncertainty estimate); when the estimates from two members were converging and the estimate from the third member was not converging towards the same value, this third estimate was not included in the averaging process and was submitted to the analysis team as additional information. Only the unified results are presented in this paper to keep the evaluation process consistent across all participants, including the commercial teams.
2.3.4 Swiss Federal Laboratories for Materials Science and Technology (Empa) and University of Zurich (UZH)
The Empa/UZH team deployed an aircraft-based hyperspectral imaging system using the Airborne Visible and Infrared Imaging Spectrometer (AVIRIS-4), developed by NASA Jet Propulsion Laboratory and operated by the University of Zurich. The instrument was mounted aboard a Cessna 208B Grand Caravan EX. AVIRIS-4 captures hyperspectral data across 287 spectral bands spanning wavelengths from 375 to 2500 nm, with most observations collected during this campaign at altitudes of approximately 1000 and 1280 m (3300 and 4200 feet) above ground level (a.g.l.) (Hueni et al., 2025). Wind data for emission quantification were sourced from the ERA5 reanalysis product. An example of concentration maps collected during the experiment is shown in Fig. 4.

Figure 4Examples of true color images and CH4 concentration maps acquired by the AVIRIS-4 imaging spectrometer at 0.4 m spatial resolution. The images show emission plumes associated with reported emission rates (Q) for three distinct release events (Meier et al., 2026).
The emission quantification methodology employed a mass-balance approach to the retrieved high-resolution images of methane enhancements. Following radiometric and spectral calibration, methane enhancements were retrieved using a matched filter algorithm applied to two spectral windows with independent albedo corrections for each window. The matched filter technique uses unit absorption spectra calculated from simulated atmospheric conditions to detect methane enhancements above background levels (Kuhlmann et al., 2025; Meier et al., 2026). Plume detection involved applying enhancement thresholds to identify emission sources from high-resolution methane imagery, with background concentrations estimated using spatial low-pass filtering assuming smooth background fields. The emissions were determined using the integrated mass enhancement (IME) method implemented in the Python library for data-driven emission quantification (ddeq; Kuhlmann et al., 2024). For each controlled release, final emission estimates were computed as weighted averages of all overpasses during that release period, with uncertainties determined using median values to account for systematic errors in wind speed estimation and pixel sizing. 7–8 overpasses were generally performed per release (see Fig. 2 in Meier et al., 2026).
2.3.5 FAAM Airborne Laboratory
The FAAM team deployed the instrumented UK's BAe-146-301 Atmospheric Research Aircraft equipped with comprehensive in situ atmospheric measurement capabilities. The primary methane measurements were conducted using a customized Los Gatos Research Fast Greenhouse Gas Analyzer (model 907-011-000-000) based on laser absorption off-axis integrated cavity output spectroscopy, providing 10 Hz measurements of CH4 along with other greenhouse gases (O'Shea et al., 2013; Shaw et al., 2022). The 1σ precision for 10 Hz CH4 measurements was 2.2 ppb. It was determined from the analysis of random “target” calibrations routinely performed in-flight to monitor the performance of the analyzer (see also Fig. S3 in the Supplement and accompanying text in Sect. S2.1.5). The payload also measures additional trace gases to provide chemical fingerprinting for plume identification and source discrimination. The aircraft positioning is provided by a GPS-aided inertial navigation system, and a full description of the meteorological measurements' capability (e.g. temperature, humidity, winds) is provided in Price, 2022.
Due to airspace restrictions within the prohibited area around the TADI site and low-level flying constraints (i.e. aircraft were required to fly at least 150 m (500 feet) above ground level), FAAM adapted their typical crosswind transect methodology and instead conducted repeated 3.7 km (2 nmi) radius orbital surveys around the TADI site. This orbital approach was designed based on Gauss's theorem cylinder methodology to maximize plume interceptions during the controlled release periods, though it is acknowledged that this methodology is more suited for spatial scales of approximately 1 km (Conley et al., 2017).
Plume detection involved manual identification of methane enhancements during each orbit, with chemical tracers (NOx, CO2, SO2, and aerosols) used to differentiate controlled release plumes from other combustion sources and background local emissions. Figure 5 illustrates measurements during one of the 40 orbits flown around the TADI site; CH4 enhancements of ∼ 200 ppb are clearly observed during this release (see Figs. S5 and S6 in Sect. S2.1.5 for similar figures for CO2, NOx and SO2).

Figure 5Mole fraction of CH4 (ppb) during one orbit flown anticlockwise around TADI shown as a heat map (a) and timeseries (b) on 12 September 2024. Sources: IGN, INE, Instituto Geográfico Nacional, Esri, HERE, Garmin, GeoTechnologies, Inc., Intermap, USGS | Powered by Esri.
The team developed a novel quantification approach using the ADMS6 atmospheric dispersion model, which simulates methane dispersion fields optimized for aircraft-measured meteorological conditions. The methodology assumes a single point source and scales an initial emission rate based on the ratio of observed to modeled integrated CH4 enhancements along the flight track. The quantification approach faced several challenges unique to the TADI experimental conditions, including low wind speeds (below FAAM's typical 5 m s−1 operational threshold), unstable boundary layer conditions, and the presence of multiple plume sources in the complex industrial environment. Additionally, the limited altitude sampling range (150 due to safety restrictions) prevented full vertical integration of enhancements and required the use of “instantaneous” emission rates for each plume interception rather than traditional surface-integrated assessments.
The performance evaluation of academic methane measurement technologies is presented through detection accuracy, quantification precision, and environmental factor analysis. Results vary considerably across different measurement platforms and methodological approaches, reflecting the diverse capabilities and operational constraints of each system. The weather and wind conditions under which each team conducted measurements also varied substantially, potentially contributing to performance (see Tables S11–S13).
3.1 Detection analysis
Detection performance across the five academic teams demonstrated generally strong capabilities for identifying methane emissions, with true positive rates ranging from 60 % to 100 % (Table 3). The vehicle-based teams (DTU, UHEI, UU/LSCE/CYI/RHUL) achieved true positive rates between 93 % and 95 %, with DTU and UU/LSCE/CYI/RHUL each recording one false negative of 0.01 and 0.02 kg h−1, respectively, and UHEI achieving perfect detection of all measured releases. False positive rates remained low across all ground-based systems, with only UHEI and UU/LSCE/CYI/RHUL reporting single false positive detections. The aircraft-based systems showed more variable performance. FAAM achieved 100 % detection accuracy but measured only one release that passed quality control criteria, limiting statistical assessment of their detection capabilities. Empa/UZH recorded a 60 % true positive rate with six false negatives out of 15 releases, representing the highest false negative rate among all participants.
Table 3Summary of true positive (TP), false positive (FP), true negative (TN), and false negative (FN) releases by participant.

The percentages are calculated by dividing by the total number of non-zero releases included in the analysis. The table also includes the minimum and maximum release flowrates detected by each team (i.e. the participant reported in a quantification estimate for that release). A dash (–) indicates that no releases were able to be categorized as FP/TN due to that solution not measuring any zero releases or no zero releases passed the Stanford QC process.
Minimum detection thresholds varied significantly between measurement approaches. The ground-based systems all demonstrated very low minimum detection capabilities at rates below 1 kg h−1. The downwind distance of the vehicle deployment (Fig. 1b) should be considered while utilizing these numbers, as minimum detection limit is dependent on measurement distance. The scope of the experimental set-up did not allow for determination of the detection limit of aircraft solutions. Among aircraft systems, Empa/UZH's minimum detected was 5.5 kg h−1, while FAAM's single measurement was at 210 kg h−1. Figure 6 illustrates the distribution of estimate categorizations across different emission rate ranges, showing how detection performance varies with release magnitude. Figure 7 presents probability of detection curves for releases below 30 kg h−1, demonstrating the detection thresholds and reliability of each ground-based system through logistic regression analysis. The 30 kg h−1 threshold was chosen to span the emission rate range over which the systems transition from non-detection to reliable detection; every non-zero release above 30 kg h−1 that was measured was detected, so a wider range would add no information to the logistic fit.

Figure 6Distribution of estimate categorizations for each participant, with colors representing different result classifications: true positive, true negative, false positive, false negative, and failed QC (releases during which measurements were taken but failed to pass the Stanford QC process). The y axis is the number of releases, and the x axis corresponds to the binned methane release flowrate. Note the different y-axis scales per row.

Figure 7Detection capabilities below 30 kg CH4 h−1 for quantified releases. Each release is marked by a vertical line at y = 0 if not detected and y = 1 if detected, ordered along the x axis by release volume. Blue bars indicate the proportion of detected releases within each bin, with error bars representing 95 % confidence intervals based on a binomial distribution. The darker blue line is the best fit of a logistic regression model on the probability data. FAAM is excluded due to not measuring any releases below 30 kg CH4 h−1. UHEI detected all non-zero releases. The x-axis bins are based on the true release rate.
3.2 Quantification analysis
Quantification accuracy exhibited substantial variation across measurement platforms and emission rate ranges (Table 4). Throughout this section, “smaller releases” refers specifically to releases below 100 kg h−1. This threshold is used for the quantification analysis because it separates the bulk of the release distribution from the small number of large “satellite-scale” releases while leaving enough estimates in each subset to support a regression. The average performance of teams is evaluated using the slope and R2 values associated with the linear regression (non-zero intercept) between the true and estimated emission rates. DTU achieved the most accurate overall performance with a slope of 1.04 (R2 = 0.89) across all measurements, indicating minimal systematic bias. Performance varied further for releases below 100 kg h−1, with a slope of 1.18 (R2 = 0.92). UHEI demonstrated good linear correlation (R2 = 0.89) with a slope of 0.87, representing moderate underestimation, and achieved near-perfect quantification for smaller releases (slope = 1.03, R2 = 0.87 for < 100 kg h−1). The collaborative UU/LSCE/CYI/RHUL team showed strong correlation (R2 = 0.85) but significant underestimation (slope = 0.38), with performance degrading for smaller releases (slope = 0.32, R2 = 0.34). Empa/UZH exhibited moderate correlation (R2 = 0.74) with considerable underestimation (slope = 0.33), though performance improved for releases below 100 kg h−1 (slope = 0.77). FAAM's single quantified measurement limits statistical assessment but the true value fell within the estimated uncertainty ranges.
Table 4Key metrics for quantification performance across all participants.

a Slope and R2 are associated with the linear equation of best fit, estimated using ordinary least squares (OLS) regression. OLS is retained here for consistency with the companion evaluation of commercial technologies (McManemin et al., 2026); a sensitivity analysis in which each estimate is instead weighted by its participant-reported uncertainty (generalized least squares) is provided in Sect. S6.3 in the Supplement.
b The percent of measurements that included the true release rate within the upper and lower bounds of each estimate provided by each participant. Participants reported their own minimum and maximum values associated with an emission quantification which are used for this analysis. See Table S23 in the Supplement for more information on participant confidence level and sources of uncertainty; uncertainty bounds may not be consistent between participants.
c The percent of estimates that fell within ± 50 % of the true release rate.
d The percent of true CH4 emissions quantified by each participant (the total emissions quantified by this solution compared to the total amount of methane emitted during these releases) with upper and lower uncertainty ranges reported by participants.
n/a: not applicable.

Figure 8Quantification accuracy of the participants. Metered release rate is on the x axis. There is a small uncertainty associated with the true release flowrates, not shown in this figure. Participant reported quantification estimates are on the y axis. The dashed line represents the x = y parity line. The solid line indicates an ordinary least squares (OLS) linear regression performed on the participant data with non-zero y intercept (i.e., intercept not forced through origin).
Practical accuracy metrics reveal additional performance insights, although they are limited by the number of data points available for analysis by the aircraft teams. DTU achieved the highest proportion of estimates within ±50 % of the true values, followed by UHEI and Empa/UZH. The UU/LSCE/CYI/RHUL team achieved only 28 % of estimates within this accuracy threshold. When considering participant-reported uncertainty bounds, DTU (43 %) and Empa/UZH (44 %) showed the best calibration of uncertainty estimates. Total emission quantification, representing the cumulative accuracy across all measurements, ranged from 40 % (UU/LSCE/CYI/RHUL) to 144 % (FAAM). Three of the participating teams (DTU, UHEI, and FAAM) contained 100 % of all true methane emissions within their cumulative estimate uncertainty intervals. Figure 8 presents parity plots comparing estimated versus true emission rates for all participants, illustrating the range of quantification performance and systematic biases across different measurement approaches.
3.3 Wind analysis
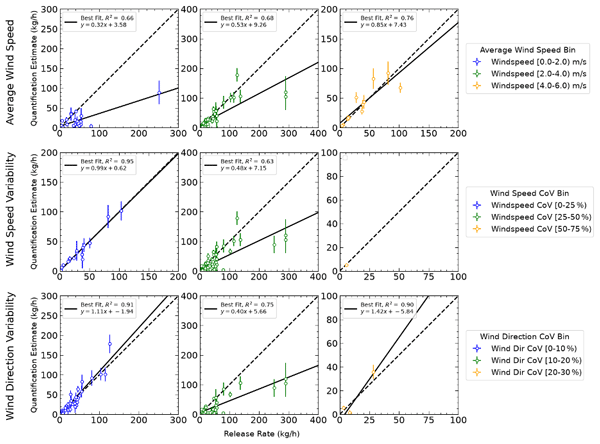
Environmental conditions, particularly wind characteristics, could have had significant influence on measurement performance. Figure 9 demonstrates the combined quantification performance of all teams except FAAM binned by wind conditions, possibly highlighting a systematic relationship between atmospheric parameters and measurement accuracy. When looking at the joint results of all teams, quantification performance improved with increasing wind speeds. The best agreement between estimated and true emission rates occurred at wind speeds between 4 and 6 m s−1. Releases measured under low wind speed conditions (below 2 m s−1) overall had increased scatter and underestimation. Wind speed coefficient of variation (CoV), defined as the standard deviation of the wind speed divided by its mean over the duration of a release period, indicates the temporal variability of wind speed during a measurement and also influences performance, with more consistent wind conditions generally producing more accurate quantification results. Throughout this paper, “consistent” and “variable” wind conditions refer to this within-period temporal variability of wind speed and direction, and not to atmospheric stability class. Wind direction variability, measured through CoV, showed a similar relationship with quantification accuracy. Periods with consistent wind direction (low CoV) are associated with better measurement performance compared to highly variable wind conditions.

Figure 9Parity plot for combined data of all solutions, binned into different wind conditions during the release. The first row bins the releases by average wind speed, the second row bins the releases by wind speed CoV, and the third row bins the releases by wind direction CoV. FAAM's single measurement is excluded from this analysis. Both axes are in kg CH4 h−1: the x axis is the metered (true) release rate, and the y axis is the participant-reported emission rate estimate.
It is important to note that the wind conditions varied widely across the 4 weeks of testing (Sect. S3.2 and S3.3). Parity plots broken into each wind condition bucket for each participant can be found in Sect. S7. The challenge of low average wind speeds (< 2 m s−1) is generally assumed for participants using local atmospheric dispersion modeling (Wilson et al., 1976) and previous experiments have highlighted the expected relationship between wind conditions and quantification ability (Morales et al., 2022; Liu et al., 2024), but more controlled release testing is needed to further quantify the relationship between wind conditions and the error of specific systems.
4.1 Detection and quantification performance
Vehicle-based systems demonstrated strong detection performance with false positive rates remaining low and true positive rates exceeding 90 %, successfully detecting releases below 0.7 kg h−1 and achieving 90 % probability of detection at below 5 kg h−1. Quantification abilities showed more variability. Overall, DTU showed impressive quantification ability, with a slope of the regression line of 1.04 for their tracer gas dispersion method (a slope of 1 is ideal). UHEI also quantified quite well, especially smaller emissions, resulting in a slope of 1.03 for releases under 100 kg h−1. The UU/LSCE/CYI/RHUL team demonstrated a tendency to underestimate in their quantification analysis (on average around −60 %); however, their measurement week (Week 4) presented the most challenging measuring conditions (e.g., low wind speeds). Overall, although the vehicle teams used different methods and quantification performance varied between operators, vehicle methane detection and quantification ability shows significant improvement from older studies utilizing a single-blind independent controlled release format (Ravikumar et al., 2019) while remaining consistent with more recent vehicle-based results (Liu et al., 2024). Direct comparison with the preceding controlled release studies is difficult due to the differences in experimental methods (e.g., distribution of release rates), analysis methods (e.g., quality processing prior to result submissions), and environmental conditions. However, while no participant in Ravikumar et al. (2019) used a tracer correlation method, the tracer method in Liu et al. (2024) also performed quite well, as demonstrated in this study. In both Liu et al. (2024) and this study, the tracer-correlation approach demonstrated quantification accuracy within 10 % of the true emission rate on average, making it the most accurate of the vehicle-based methods tested.
A practical limitation of the tracer gas dispersion method should be stated alongside its strong quantification performance. The method requires a tracer to be released at or close to the source, which presupposes that the source has already been located and is physically accessible. In this experiment the emission was known to originate from within a small, defined platform and the tracer could be placed near its center. In operational use the method is therefore a quantification tool applied to sources that have already been found by other means, rather than a survey tool capable of discovering unknown emitters across a large area. The same consideration applies, to a lesser degree, to all of the vehicle-based approaches evaluated here, which require public road access downwind of the source.
The reliance of some of the evaluated methods on a Gaussian plume description also deserves consideration. The Gaussian formulation describes an ensemble-averaged concentration field and is most defensible for averaging times long enough for turbulent fluctuations to be smoothed out under steady wind. The conditions encountered during much of this campaign – low wind speeds, high within-period variability in wind direction, and individual plume transects lasting only seconds – depart substantially from those requirements, and many plumes were most likely not well described by a Gaussian shape. This mismatch is a plausible contributor to the underestimation and increased scatter observed in the lowest wind speed bin of Fig. 9, and it is a limitation shared in modified form by the mass-balance and dispersion-model approaches used by the aircraft teams.
Aircraft-based performance was more difficult to assess due to limited measurements with the Empa/UZH AVIRIS-4 system. In this experiment, AVIRIS-4 achieved a minimum detected emission rate of 5.5 kg h−1, comparable in performance to NASA/JPL's AVIRIS-3 instrument. AVIRIS-3 could detect CH4 plumes of ≥ 4 kg h−1 but not ≤ 2.5 kg h−1 at 4500 ft altitude and average wind speeds of 1.4 m s−1 in a controlled release experiment on the University of California Riverside campus (Coleman et al., 2026). This is also comparable with previous blinded controlled release tests of hyperspectral aircraft (Sherwin et al., 2021; El Abbadi et al., 2024). In El Abbadi et al. (2024), aircraft consistently quantified releases above 10 kg CH4 h−1, with the smallest quantified plumes ranging from 2.9 to 33.8 kg CH4 h−1. The FAAM in situ system yielded only one qualifying measurement due to scheduling, airspace, and weather constraints; its detection limit therefore could not be assessed, and its single estimate says little about its performance in general.
Although remote sensing campaigns are generally carried out in summer periods with more favorable weather and illumination, conditions posed a problem to remote sensing and airborne participants in all four weeks across June and September (McManemin et al., 2026). Both aircraft operators filtered substantial portions of potential measurements due to clouds and precipitation, highlighting the operational challenges of deploying remote sensing technologies in European weather conditions; the fact that the test conditions were more challenging than desert weather reflects a performance achieved closer to a conservative version of reality. Testing under more favorable conditions has achieved higher acquisition yields (Thorpe et al., 2016; Sherwin et al., 2021; El Abbadi et al., 2024; Coleman et al., 2026). Surface properties, which were not controlled here, may also have affected AVIRIS-4 retrievals (Ayasse et al., 2018; Foote et al., 2021). The imaged scene over TADI contains a mixture of vegetated, bare and built surfaces, so surface heterogeneity is a plausible contributor to the retrieval performance reported here. A quantitative attribution of retrieval error to surface type was outside the scope of this evaluation, but stratifying detection and quantification performance by surface type would be a valuable addition to future controlled release tests of imaging spectrometers. Additionally, the operational constraints of the site restricted low flight level surveying, resulting in measurements conducted while deviating from typical protocol (i.e. offshore oil and gas measurements as described in Monreal Campos et al. (2024) and Foulds et al. (2022). The results of this experiment therefore characterize performance under unfavorable conditions rather than the intrinsic capability of aircraft-based systems, which are often deployed in more favorable environments, such as the arid, sunny regions where many oil and gas operations are located (e.g. the Middle East or Permian Basin).
Excluding FAAM's single measurement, none of the participants contained the true value within their submitted estimate ranges more than 44 % of the time (Table 4, Column 5). Even for teams with regression slopes close to unity (e.g., DTU and UHEI), the ability to quantify individual measurements within uncertainty ranges could be improved. This suggests that further work to better estimate the uncertainties associated with individual quantification estimates could be pursued as a result of this experiment. Three of the five teams (DTU, UHEI, and FAAM) quantified the total amount of methane released within their uncertainty ranges (Table 4, Column 7), which suggests the ability of these technologies to quantify emissions overall, although individual measurement ability may vary. Quantification error by order of magnitude of release is shown in Fig. 10.
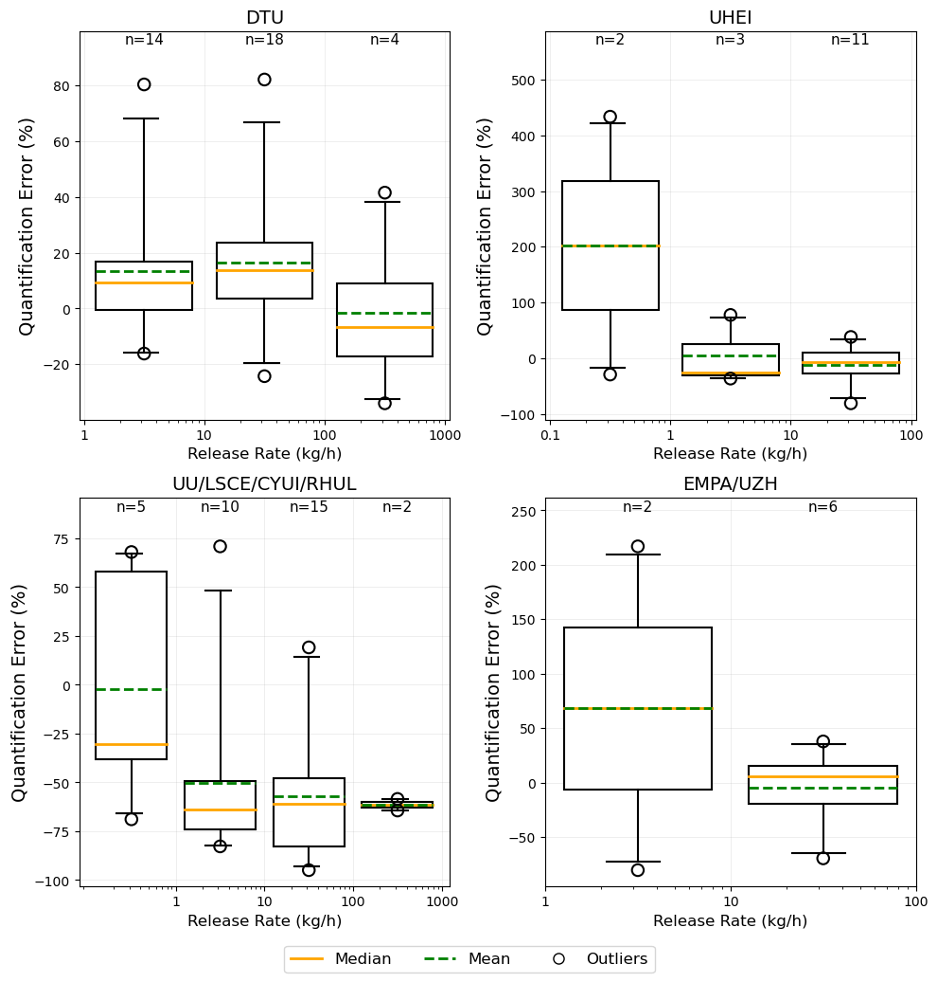
Figure 10Quantification accuracy within each order of magnitude. The mean (dashed line), median (solid line), inner quartiles (box), and 95 % confidence are shown for quantification error of release estimates for each order of magnitude (e.g. for DTU, the bins are between 1 and 10, 10 and 100, and 100 and 1000 kg h−1 from left to right), with number of samples (n). Only segments with more than one measurement (n > 1) are shown. FAAM is excluded due to their single estimate. Layout adapted from Bell et al. (2022).
4.2 Post unblinding analyses and sources of systemic error
Following the unblinding of true release rates and provision of high-resolution wind data from the TADI site, several academic teams conducted detailed analyses of their methodologies to identify sources of systematic error and opportunities for improvement. These post-campaign evaluations provide valuable insights into the challenges of real-world methane quantification and highlight areas where measurement protocols can be refined.
4.2.1 Background concentration calculation issues
The UHEI team identified a programming error in their background concentration calculation that affected quantification accuracy for smaller releases. The methane background concentration baseline was not updated from previous analyses, resulting in an additional 10 ppb being subtracted from calculated methane background concentrations, effectively lowering the baseline and artificially inflating measured concentration enhancements. This systemic bias particularly impacted releases below 2 kg h−1, affecting approximately 35 % of their total measurements.
UHEI estimated that the error manifested as a 10 %–30 % overestimation of emission rates for controlled releases between 0.5 and 2.0 kg h−1, with larger relative impacts on smaller releases where the 10 ppb offset represented a more significant fraction of the total enhancement signal. Upon correction of the background calculation methodology, the team states their quantification accuracy for low-emission scenarios improved, demonstrating the critical importance of background characterization in mobile measurement applications and for small-volume releases. Figure 10 shows the quantification error by order of magnitude of true release rate, supporting the conclusion that quantification accuracy improved for higher releases when defined by percent error. This finding underscores the sensitivity of in situ measurement systems to low concentration enhancements and highlights the value of controlled release testing in identifying basic algorithmic issues that might not be apparent in routine field operations.
4.2.2 Wind measurement and low wind speed challenges
The collaborative UU/LSCE/CYI/RHUL team deployed three complementary methane sensors, each with distinct accuracy, resolution, and response characteristics. Post-unblinding analysis of these sensors revealed systematic underestimation of emission rates, particularly under the low wind speed conditions (< 2 m s−1) prevalent during their week of testing in the TADI campaign. The team hypothesized that weak wind scenarios caused emissions to elevate above vehicle sampling height prior to detection, resulting in incomplete plume captures and highly variable enhancement signals that differed by more than an order of magnitude across individual releases. In addition to the challenging wind conditions, wind speed measurements showed systematic differences between the two anemometers deployed by the team and TADI's own wind Lidar sensor. These discrepancies, combined with the challenges of partial plume sampling in slack wind conditions, highlight the need for refined analytical approaches specifically adapted to low wind speed environments in mobile methane quantification applications.
An alternative solution is to only conduct measurements when average wind speeds are above a certain threshold (e.g. 2 m s−1), supported by the analysis in this study. The UHEI method typically avoids mobile measurements when wind speeds are below 2 m s−1 due to increased plume meandering under calm conditions. However, due to the limited controlled releases available for each team to measure, measurements were conducted under all weather conditions. UHEI applied quality control criteria and filtered results to include only measurements taken at wind speeds above 2 m s−1 (when averaged across the periods in which UHEI was actively measuring) and under low wind direction variability, resulting in only 19 of 34 participated releases included in the blind analysis.
The tracer gas correlation method used by DTU should theoretically work better in low wind speeds when the tracer gas is emitted near the methane release point (i.e., the use of the tracer ratio inherently reduces assumptions about wind speed and direction). The week in which DTU measured (Week 1) offered relatively strong wind speeds, with only 3 releases with wind speeds below 2 m s−1. This supports the conclusion that to gain a full understanding of each approach, releases should be conducted across a wide variety of environmental conditions and wind speeds, as the experiment did not offer the ability to rigorously evaluate DTU's method under low wind speed conditions.
Wind input was equally critical for the aircraft-based methods. The Empa/UZH team utilized the AVIRIS-4 airborne imaging spectrometer with the IME method for methane quantification, which requires accurate effective wind speed estimates as a critical input parameter. Initially, the team employed 10 m wind data from the ERA5 reanalysis product (approximately 25 km spatial resolution) for emission calculations. However, post-unblinding comparison with the TADI wind Lidar measurements revealed poor correlation between the reanalysis and ground-truth wind data, indicating significant limitations in the meteorological product's representation of local wind conditions. Substituting the lidar-measured wind speeds at 10 as the effective wind speed input resulted in substantial improvement in AVIRIS-4 emission estimate accuracy (Meier et al., 2026). This finding demonstrates the critical importance of high-quality, site-specific wind measurements for atmospheric-based emission quantification methods. The results indicate that standard meteorological reanalysis products, despite their widespread availability and use, may not be able to capture the specific wind conditions during an aircraft overpass taking only a few seconds, especially during the low and varying wind conditions characteristic of the September campaign period. In particular, the agreement between ERA5 and ground-based wind measurements is particularly weak for the time and length scales of the observed plumes in this study (< 20 s and < 30 m). A more thorough discussion of the Empa/UZH results can be found in Meier et al. (2026).
Overall, for this specific experiment, not enough data points were collected to rigorously test the impact of wind conditions on measurement accuracy. Although the analysis of combined results supports the literature in establishing the importance of consistent wind conditions in quantification, each technology evaluated in this campaign needs to undergo further testing to determine specific operational limits. Due to the experimental setup, participants undertook measurements in conditions that may differ from operational practice, and performance could change under different conditions, highlighting the need for more controlled release testing. Because the measurement systems are not equivalent, results at different wind speeds cannot be directly compared across all participants, which supports further research in this area. Additional single-blind controlled release tests that require participants to submit quantification estimates for all releases measured (different from what was implemented in this study due to quality control processes) and facilitate concurrent measurement by technology group would offer the ability to further investigate this important facet of methane emission quantification. This would require an extra layer of collaboration with the participants that was unavailable in this study.
This study presents the first comprehensive evaluation of academic methane measurement technologies in Europe through single-blind controlled release testing at the TADI facility in France, providing critical insights into the capabilities and limitations of diverse measurement platforms for oil and gas emission quantification.
The results demonstrate that vehicle-based systems achieved strong detection performance, with true positive rates exceeding 90 % and minimum detection thresholds below 1 kg CH4 h−1. These ground-based platforms successfully identified emissions across a wide range of release rates, from sub-kilogram to over 300 kg h−1 releases. However, quantification accuracy varied significantly between methodologies, with slopes ranging from 0.38 to 1.04 when comparing estimated versus true emission rates. The DTU tracer gas dispersion method demonstrated the most accurate overall quantification, and UHEI also achieved strong performance, particularly for emissions below 100 kg h−1. The collaborative UU/LSCE/CYI/RHUL team demonstrated a systematic underestimation of the results. However, it is important to note that each vehicle team conducted measurements in different weeks, which offered varying environmental conditions as described in this paper. The results for each participant do not encapsulate the same distribution of wind conditions which makes direct comparison more difficult. The substantial performance variability observed between academic teams using similar measurement principles highlights the cruciality of methodology refinement and quality control protocols, particularly as it applies to wind conditions.
Aircraft-based systems faced greater operational challenges, with limited data availability due to weather constraints and airspace restrictions. The first blinded test of the AVIRIS-4 hyperspectral imaging system used by the Empa/UZH team achieved 60 % detection accuracy with a minimum detection threshold of 5.5 kg h−1, while FAAM's orbital measurement approach was restricted to a single qualifying measurement. These results highlight the trade-offs between spatial coverage capabilities and operational constraints inherent in airborne measurement platforms.
Post-unblinding analysis revealed critical insights into systematic error sources that significantly impact measurement accuracy. Background concentration calculation errors affected small-release quantification for the UHEI team, while wind measurement limitations and low wind speed conditions (< 2 m s−1) challenged all platforms. The substitution of high-resolution wind lidar data for ERA5 reanalysis substantially improved aircraft-based quantification accuracy, emphasizing the crucial role of meteorological data quality in emission estimation algorithms.
Environmental conditions emerged as a dominant factor influencing measurement performance across all technologies. Low wind speeds and high temporal variability in wind direction degraded quantification accuracy, with optimal performance occurring at wind speeds above 2 m s−1. These findings underscore the importance of meteorological considerations in both measurement planning and algorithm development for real-world applications. However, more research is needed to fully understand the limits of each technology within environmental constraints, and the relationship between wind conditions and quantification ability is still not fully understood. For instance, a full evaluation and comparison of all data collected by the vehicle participants of this study could help improve understanding of the impact of wind conditions and allow a direct comparison of the different methods (i.e., Gaussian plume model vs. tracer gas correlation). In addition, comparison of the simultaneous measurements deployed by the UU/LSCE/CYI/RHUL team would allow differences between methane sensors housed on the same platform to be evaluated.
This research contributes essential empirical data to the growing body of knowledge on methane emission measurement technologies, particularly for European operational conditions. The results inform evidence-based selection of measurement approaches for different industrial applications and emission scenarios. The identified systematic error sources and environmental sensitivities provide clear targets for technological improvement and protocol development. Future research should focus on addressing the identified limitations, particularly related to the challenges of conducting measurements in low wind speeds (e.g., developing robust measurement conditions or quantification approaches that minimize assumptions about atmospheric transport at low wind speeds) and improving the integration of high-quality meteorological data into quantification methodologies. Extended controlled release campaigns under diverse environmental conditions would further validate these findings and support the development of more reliable measurement standards for the oil and gas industry, including in offshore environments where significant O&G assets are deployed. While controlled release testing is instrumental in evaluating the sensitivity and accuracy of methane measurement technologies, it is crucial to note that results obtained in controlled environments may not always translate directly to real-world conditions. This discrepancy highlights the need for additional challenge releases that replicate operational scenarios, thereby providing a more comprehensive understanding of how technologies perform in diverse environmental contexts.
The findings from this study directly support the advancement of methane monitoring capabilities essential for achieving greenhouse gas reduction targets and enhancing the environmental sustainability of oil and gas operations. As measurement-informed emission inventories become increasingly important for regulatory compliance and corporate responsibility initiatives, the insights from this controlled evaluation provide a foundation for implementing more effective methane detection and quantification strategies across the industry.
All data and code used in this study are available at https://doi.org/10.5281/zenodo.18381031 (McManemin et al., 2026). The repository includes scripts for data preprocessing, analysis, and figure generation, as well as documentation to reproduce the results presented in the manuscript. Additional details or support can be provided upon request.
The supplement related to this article is available online at https://doi.org/10.5194/amt-19-7585-2026-supplement.
Conceptualization: AM, CJ, VB, AB, JF. Project administration: AM, CJ, VB, JF. Data collection and processing: AM, CJ, VB, SM, MV, AH, GK, SB, PL, MB, JW, MS, CS, AF, RPag, PQ, RPap, JF, PB. Software: AM. Formal analysis: AM, CJ, AB. Writing – original draft: AM. Writing – review and editing: AM, CJ, VB, SB, DB, PB, JF, AF, AH, GK, SM, RPag, RPap, JP, PQ, TR, CS, MS, MV, JW, AB. Supervision: DB, GK, AB.
At least one of the (co-)authors is a member of the editorial board of Atmospheric Measurement Techniques. The peer-review process was guided by an independent editor, and the authors also have no other competing interests to declare.
Publisher's note: Copernicus Publications remains neutral with regard to jurisdictional claims made in the text, published maps, institutional affiliations, or any other geographical representation in this paper. The authors bear the ultimate responsibility for providing appropriate place names. Views expressed in the text are those of the authors and do not necessarily reflect the views of the publisher.
We acknowledge all of those who supported participation in this test and provided logistical and coordination support. Thank you to the TADI team (Jordi Jourde, Yvan Faucher), and participants who are not authors of this paper: Aeromon (Matti Irjala, Sina Hamedani Raja), Airtask Ltd (Barney Black), GSMA (Florian Parent), Flylogix (Charles Tavner), SeekOps (Brendan Smith, Michael Gully-Santiago), UHEI (Julian Grossmann, Till Gonser), Empa/UZH (Dominic Berger), GHGSat (Marianne Girard), Sensirion (Susanne Pianezzi), SLB (Manasi Doshi, Tetsushi Yamada, Gokhan Erol), and SENSIA (Jorge Mataix Clau, Gonzalo Guerrero Torija). Their collective contributions were instrumental in the successful completion of this study.
Airborne data was obtained by the FAAM Airborne Laboratory BAe-146-301 Atmospheric Research Aircraft, operated by Airtask Ltd, managed by the National Centre for Atmospheric Science, leased through University of Leeds, and owned by UK Research and Innovation and the Natural Environment Research Council (project NE/T014849/1).
AI tools such as ChatGPT, Claude, and Cursor were used to assist in light editing of this manuscript and code generation.
This research was funded by United Nations Environment Programme International Methane Emissions Observatory (agreement no. CCD24-CMB6608/RC/MSS).
This paper was edited by Lok Lamsal and reviewed by three anonymous referees.
Ars, S., Broquet, G., Yver Kwok, C., Roustan, Y., Wu, L., Arzoumanian, E., and Bousquet, P.: Statistical atmospheric inversion of local gas emissions by coupling the tracer release technique and local-scale transport modelling: a test case with controlled methane emissions, Atmos. Meas. Tech., 10, 5017–5037, https://doi.org/10.5194/amt-10-5017-2017, 2017.
Ayasse, A. K., Thorpe, A. K., Roberts, D. A., Funk, C. C., Dennison, P. E., Frankenberg, C., Steffke, A., and Aubrey, A. D.: Evaluating the effects of surface properties on methane retrievals using a synthetic airborne visible/infrared imaging spectrometer next generation (AVIRIS-NG) image, Remote Sens. Environ., 215, 386–397, https://doi.org/10.1016/j.rse.2018.06.018, 2018.
Ayasse, A. K., Cusworth, D. H., Howell, K., O'Neill, K., Conrad, B. M., Johnson, M. R., Heckler, J., Asner, G. P., and Duren, R.: Probability of detection and multi-sensor persistence of methane emissions from coincident airborne and satellite observations, Environ. Sci. Technol., 58, 21536–21544, https://doi.org/10.1021/acs.est.4c06702, 2024.
Bell, C. and Zimmerle, D.: METEC Controlled Test Protocol: Continuous Monitoring Emission Detection and Quantification, Energy Institute, Colorado State University, Fort Collins, CO, USA, https://doi.org/10.25675/10217/235364, 2020.
Bell, C. and Zimmerle, D.: METEC Controlled Test Protocol: Survey Emission Detection and Quantification, Energy Institute, Colorado State University, Fort Collins, CO, USA, https://doi.org/10.25675/10217/235363, 2022.
Bell, C., Rutherford, J., Brandt, A., Sherwin, E., Vaughn, T., and Zimmerle, D.: Single-blind determination of methane detection limits and quantification accuracy using aircraft-based LiDAR, Elem. Sci. Anthr., 10, https://doi.org/10.1525/elementa.2022.00080, 2022.
Briggs, G. A.: Diffusion estimation for small emissions, Air Resources Atmospheric Turbulence and Diffusion Laboratory, NOAA, https://doi.org/10.2172/5118833 (last access: 13 November 2026), 1973.
Chen, Z., El Abbadi, S. H., Sherwin, E. D., Burdeau, P. M., Rutherford, J. S., Chen, Y., Zhang, Z., and Brandt, A. R.: Comparing Continuous Methane Monitoring Technologies for High-Volume Emissions: A Single-Blind Controlled Release Study, ACS EST Air, 1, 871–884, https://doi.org/10.1021/acsestair.4c00015, 2024.
Coleman, R. W., Thorpe, A. K., Brodrick, P. G., Chlus, A., Fahlen, J. E., Bue, B., Chapman, J., Eckert, R. F., Jensen, D. J., Eastwood, M. L., Thompson, D. R., Elder, C. D., Beltran, S. G., Amezquita, D. R., Hopkins, F., and Green, R. O.: Identifying and quantifying greenhouse gas emissions with the AVIRIS-3 airborne imaging spectrometer, Remote Sens. Environ., 332, 115058, https://doi.org/10.1016/j.rse.2025.115058, 2026.
Conley, S., Faloona, I., Mehrotra, S., Suard, M., Lenschow, D. H., Sweeney, C., Herndon, S., Schwietzke, S., Pétron, G., Pifer, J., Kort, E. A., and Schnell, R.: Application of Gauss's theorem to quantify localized surface emissions from airborne measurements of wind and trace gases, Atmos. Meas. Tech., 10, 3345–3358, https://doi.org/10.5194/amt-10-3345-2017, 2017.
Cusworth, D. H., Duren, R. M., Ayasse, A. K., Jiorle, R., Howell, K., Aubrey, A., Green, R. O., Eastwood, M. L., Chapman, J. W., Thorpe, A. K., Heckler, J., Asner, G. P., Smith, M. L., Thoma, E., Krause, M. J., Heins, D., and Thorneloe, S.: Quantifying methane emissions from United States landfills, Science, 383, 1499–1504, https://doi.org/10.1126/science.adi7735, 2024.
Delre, A., Mønster, J., Samuelsson, J., Fredenslund, A. M., and Scheutz, C.: Emission quantification using the tracer gas dispersion method: The influence of instrument, tracer gas species and source simulation, Sci. Total Environ., 634, 59–66, https://doi.org/10.1016/j.scitotenv.2018.03.289, 2018.
Dowd, E., Manning, A. J., Orth-Lashley, B., Girard, M., France, J., Fisher, R. E., Lowry, D., Lanoisellé, M., Pitt, J. R., Stanley, K. M., O'Doherty, S., Young, D., Thistlethwaite, G., Chipperfield, M. P., Gloor, E., and Wilson, C.: First validation of high-resolution satellite-derived methane emissions from an active gas leak in the UK, Atmos. Meas. Tech., 17, 1599–1615, https://doi.org/10.5194/amt-17-1599-2024, 2024.
Duren, R. M., Thorpe, A. K., Foster, K. T., Rafiq, T., Hopkins, F. M., Yadav, V., Bue, B. D., Thompson, D. R., Conley, S., Colombi, N. K., Frankenberg, C., McCubbin, I. B., Eastwood, M. L., Falk, M., Herner, J. D., Croes, B. E., Green, R. O., and Miller, C. E.: California's methane super-emitters, Nature, 575, 180–184, https://doi.org/10.1038/s41586-019-1720-3, 2019.
El Abbadi, S. H., Chen, Z., Burdeau, P. M., Rutherford, J. S., Chen, Y., Zhang, Z., Sherwin, E. D., and Brandt, A. R.: Technological maturity of aircraft-based methane sensing for greenhouse gas mitigation, Environ. Sci. Technol., 58, 9591–9600, https://doi.org/10.1021/acs.est.4c02439, 2024.
EPA: Inventory of U.S. Greenhouse Gas Emissions and Sinks: 1990–2022, U.S. Environmental Protection Agency, EPA 430-R-24-004, https://www.epa.gov/ghgemissions/inventory-us-greenhouse-gas-emissions-and-sinks-1990-2022 (last access: 18 August 2025), 2024.
Foote, M. D., Dennison, P. E., Sullivan, P. R., O'Neill, K. B., Thorpe, A. K., Thompson, D. R., Cusworth, D. H., Duren, R., and Joshi, S. C.: Impact of scene-specific enhancement spectra on matched filter greenhouse gas retrievals from imaging spectroscopy, Remote Sens. Environ., 264, 112574, https://doi.org/10.1016/j.rse.2021.112574, 2021.
Forster, P., Storelvmo, T., Armour, K., Collins, W., Dufresne, J.-L., Frame, D., Lunt, D. J., Mauritsen, T., Palmer, M. D., Watanabe, M., Wild, M., and Zhang, H.: The Earth's Energy Budget, Climate Feedbacks, and Climate Sensitivity, in: Climate Change 2021: The Physical Science Basis. Contribution of Working Group I to the Sixth Assessment Report of the Intergovernmental Panel on Climate Change, edited by: Masson-Delmotte, V., Zhai, P., Pirani, A., Connors, S. L., Péan, C., Berger, S., Caud, N., Chen, Y., Goldfarb, L., Gomis, M. I., Huang, M., Leitzell, K., Lonnoy, E., Matthews, J. B. R., Maycock, T. K., Waterfield, T., Yelekçi, O., Yu, R., and Zhou, B., Cambridge University Press, Cambridge, UK and New York, NY, USA, 923–1054, https://doi.org/10.1017/9781009157896.009, 2021.
Fougère, C., Ghasemi, D., Khaleghi, A., Coyle, L., Bourlon, E., Li, H., Smith, M., Lavoie, M., and Risk, D.: Estimating methane emissions from Canadian landfills using aircraft measurements, Waste Manage., 221, 115615, https://doi.org/10.1016/j.wasman.2026.115615, 2026.
Foulds, A., Allen, G., Shaw, J. T., Bateson, P., Barker, P. A., Huang, L., Pitt, J. R., Lee, J. D., Wilde, S. E., Dominutti, P., Purvis, R. M., Lowry, D., France, J. L., Fisher, R. E., Fiehn, A., Pühl, M., Bauguitte, S. J. B., Conley, S. A., Smith, M. L., Lachlan-Cope, T., Pisso, I., and Schwietzke, S.: Quantification and assessment of methane emissions from offshore oil and gas facilities on the Norwegian continental shelf, Atmos. Chem. Phys., 22, 4303–4322, https://doi.org/10.5194/acp-22-4303-2022, 2022.
Fredenslund, A., Gudmundsson, E., Falk, J. M., and Scheutz, C.: The Danish national effort to minimise methane emissions from biogas plants, Waste Manage., 157, 321–329, https://doi.org/10.1016/j.wasman.2022.12.035, 2023.
Fredenslund, A. M., Rees-White, T. C., Beaven, R. P., Delre, A., Finlayson, A., Helmore, J., Allen, G., and Scheutz, C.: Validation and error assessment of the mobile tracer gas dispersion method for measurement of fugitive emissions from area sources, Waste Manage., 83, 68–78, https://doi.org/10.1016/j.wasman.2018.10.036, 2019.
Fredenslund, A. M., Klotz, L. A., Edjabou, M. E., and Scheutz, C.: Methane and nitrous oxide emission factors from full-scale garden waste composting facilities, Waste Manage. Res., 44, 1222–1231, https://doi.org/10.1177/0734242X261424609, 2026.
Hueni, A., Geier, S., Vögtli, M., LaHaye, J., Rosset, J., Berger, D., Sierro, L. J., Jospin, L. V., Thompson, D. R., Schläpfer, D., Green, R. O., Loeliger, T., Skaloud, J., and Schaepman, M. E.: The AVIRIS-4 Airborne Imaging Spectrometer, IEEE Geosci. Remote Sens. Lett., 22, 1–5, https://doi.org/10.1109/LGRS.2025.3572349, 2025.
IEA: Global Methane Tracker 2022, IEA, Paris, https://www.iea.org/reports/global-methane-tracker-2022 (last access: 26 January 2026), 2022.
Kissas, K., Ibrom, A., Kjeldsen, P., and Scheutz, C.: Methane emission dynamics from a Danish landfill: The effect of changes in barometric pressure, Waste Manage., 138, 234–242, https://doi.org/10.1016/j.wasman.2021.11.043, 2022.
Korbeń, P., Jagoda, P., Maazallahi, H., Kammerer, J., Nęcki, J. M., Wietzel, J. B., Bartyzel, J., Radovici, A., Zavala-Araiza, D., Röckmann, T., and Schmidt, M.: Quantification of methane emission rate from oil and gas wells in Romania using ground-based measurement techniques, Elem. Sci. Anthr., 10, 00070, https://doi.org/10.1525/elementa.2022.00070, 2022.
Kuhlmann, G., Koene, E., Meier, S., Santaren, D., Broquet, G., Chevallier, F., Hakkarainen, J., Nurmela, J., Amorós, L., Tamminen, J., and Brunner, D.: The ddeq Python library for point source quantification from remote sensing images (version 1.0), Geosci. Model Dev., 17, 4773–4789, https://doi.org/10.5194/gmd-17-4773-2024, 2024.
Kuhlmann, G., Stavropoulou, F., Schwietzke, S., Zavala-Araiza, D., Thorpe, A., Hueni, A., Emmenegger, L., Calcan, A., Röckmann, T., and Brunner, D.: Evidence of successful methane mitigation in one of Europe's most important oil production region, Atmos. Chem. Phys., 25, 5371–5385, https://doi.org/10.5194/acp-25-5371-2025, 2025.
Liu, Y., Paris, J.-D., Broquet, G., Bescós Roy, V., Meixus Fernandez, T., Andersen, R., Russu Berlanga, A., Christensen, E., Courtois, Y., Dominok, S., Dussenne, C., Eckert, T., Finlayson, A., Fernández de la Fuente, A., Gunn, C., Hashmonay, R., Grigoleto Hayashi, J., Helmore, J., Honsel, S., Innocenti, F., Irjala, M., Log, T., Lopez, C., Cortés Martínez, F., Martinez, J., Massardier, A., Nygaard, H. G., Agregan Reboredo, P., Rousset, E., Scherello, A., Ulbricht, M., Weidmann, D., Williams, O., Yarrow, N., Zarea, M., Ziegler, R., Sciare, J., Vrekoussis, M., and Bousquet, P.: Assessment of current methane emission quantification techniques for natural gas midstream applications, Atmos. Meas. Tech., 17, 1633–1649, https://doi.org/10.5194/amt-17-1633-2024, 2024.
Maazallahi, H., Fernandez, J. M., Menoud, M., Zavala-Araiza, D., Weller, Z. D., Schwietzke, S., von Fischer, J. C., Denier van der Gon, H., and Röckmann, T.: Methane mapping, emission quantification, and attribution in two European cities: Utrecht (NL) and Hamburg (DE), Atmos. Chem. Phys., 20, 14717–14740, https://doi.org/10.5194/acp-20-14717-2020, 2020.
McManemin, A., Juéry, C., Blandin, V., France, J. L., Burdeau, P., and Brandt, A. R.: Controlled release testing of commercially available methane emission measurement technologies at the TADI facility, Atmos. Meas. Tech., 19, 923–934, https://doi.org/10.5194/amt-19-923-2026, 2026.
Meier, S., Vögtli, M., Hueni, A., McManemin, A., Brandt, A. R., Juéry, C., Blandin, V., Brunner, D., and Kuhlmann, G.: Quantifying CH4 point source emissions with airborne remote sensing: first results from AVIRIS-4, Atmos. Meas. Tech., 19, 333–358, https://doi.org/10.5194/amt-19-333-2026, 2026.
Mendoza-Cano, O., Trujillo, X., Huerta, M., Ríos-Silva, M., Lugo-Radillo, A., Bricio-Barrios, J. A., Rueda-Abad, J. C., Pérez-Rodríguez, R. Y., Quintanilla-Montoya, A. L., Uribe-Ramos, J. M., Mendoza-Olivo, V. A., and Murillo-Zamora, E.: Assessing the relationship between energy-related methane emissions and the burden of cardiovascular diseases: a cross-sectional study of 73 countries, Sci. Rep., 13, 13515, https://doi.org/10.1038/s41598-023-40444-7, 2023.
Methane Emission Technology Evaluation Center (METEC) and TotalEnergies Anomalies Detection Initiatives (TADI): Controlled Test Protocol, Emission Detection and Quantification Protocol (version number 1.0), Colorado State University, https://metec.colostate.edu/aded/ (last access: 13 November 2026), 2025.
Monreal Campos, I., Nelson, B., Lakomiec, P., Sproson, D., Bauguitte, S., and Lewis, A.: Methane emission flux estimation from offshore oil and gas platforms with a dispersion model and airborne measurements, EGU General Assembly 2024, Vienna, Austria, 14–19 April 2024, EGU24-18821, https://doi.org/10.5194/egusphere-egu24-18821, 2024.
Mønster, J. G., Samuelsson, J., Kjeldsen, P., Rella, C. W., and Scheutz, C.: Quantifying methane emission from fugitive sources by combining tracer release and downwind measurements – A sensitivity analysis based on multiple field surveys, Waste Manage., 34, 1416–1428, https://doi.org/10.1016/j.wasman.2014.03.025, 2014.
Morales, R., Ravelid, J., Vinkovic, K., Korbeń, P., Tuzson, B., Emmenegger, L., Chen, H., Schmidt, M., Humbel, S., and Brunner, D.: Controlled-release experiment to investigate uncertainties in UAV-based emission quantification for methane point sources, Atmos. Meas. Tech., 15, 2177–2198, https://doi.org/10.5194/amt-15-2177-2022, 2022.
O'Shea, S. J., Bauguitte, S. J.-B., Gallagher, M. W., Lowry, D., and Percival, C. J.: Development of a cavity-enhanced absorption spectrometer for airborne measurements of CH4 and CO2, Atmos. Meas. Tech., 6, 1095–1109, https://doi.org/10.5194/amt-6-1095-2013, 2013.
Price, H. C.: Temperature and humidity measurements on the FAAM aircraft, Zenodo, https://doi.org/10.5281/zenodo.5846962, 2022.
Ravikumar, A. P., Sreedhara, S., Wang, J., Englander, J., Roda-Stuart, D., Bell, C., Zimmerle, D., Lyon, D., Mogstad, I., Ratner, B., and Brandt, A. R.: Single-blind inter-comparison of methane detection technologies – results from the Stanford/EDF Mobile Monitoring Challenge, Elem. Sci. Anthr., 7, 37, https://doi.org/10.1525/elementa.373, 2019.
Sampedro, J., Waldhoff, S., Sarofim, M., and Van Dingenen, R.: Marginal Damage of Methane Emissions: Ozone Impacts on Agriculture, Environ Resour. Econ., 84, 1095–1126, https://doi.org/10.1007/s10640-022-00750-6, 2023.
Shaw, J. T., Allen, G., Barker, P., Pitt, J. R., Pasternak, D., Bauguitte, S. J.-B., Lee, J., Bower, K. N., Daly, M. C., Lunt, M. F., Ganesan, A. L., Vaughan, A. R., Chibesakunda, F., Lambakasa, M., Fisher, R. E., France, J. L., Lowry, D., Palmer, P. I., Metzger, S., Parker, R. J., Gedney, N., Bateson, P., Cain, M., Lorente, A., Borsdorff, T., and Nisbet, E. G.: Large Methane Emission Fluxes Observed From Tropical Wetlands in Zambia, Global Biogeochem. Cy., 36, e2021GB007261, https://doi.org/10.1029/2021GB007261, 2022.
Sherwin, E. D., Chen, Y., Ravikumar, A. P., and Brandt, A. R.: Single-blind test of airplane-based hyperspectral methane detection via controlled releases, Elem. Sci. Anthr., 9, 00063, https://doi.org/10.1525/elementa.2021.00063, 2021.
Sherwin, E. D., Rutherford, J. S., Zhang, Z., Chen, Y., Wetherley, E. B., Yakovlev, P. V., Berman, E. S. F., Jones, B. B., Cusworth, D. H., Thorpe, A. K., Ayasse, A. K., Duren, R. M., and Brandt, A. R.: US oil and gas system emissions from nearly one million aerial site measurements, Nature, 627, 328–334, https://doi.org/10.1038/s41586-024-07117-5, 2024.
Thompson, D. R., Leifer, I., Bovensmann, H., Eastwood, M., Fladeland, M., Frankenberg, C., Gerilowski, K., Green, R. O., Kratwurst, S., Krings, T., Luna, B., and Thorpe, A. K.: Real-time remote detection and measurement for airborne imaging spectroscopy: a case study with methane, Atmos. Meas. Tech., 8, 4383–4397, https://doi.org/10.5194/amt-8-4383-2015, 2015.
Thorpe, A. K., Roberts, D. A., Bradley, E. S., Funk, C. C., Dennison, P. E., and Leifer, I.: High resolution mapping of methane emissions from marine and terrestrial sources using a Cluster-Tuned Matched Filter technique and imaging spectrometry, Remote Sens. Environ., 134, 305–318, https://doi.org/10.1016/j.rse.2013.03.018, 2013.
Thorpe, A. K., Frankenberg, C., Aubrey, A. D., Roberts, D. A., Nottrott, A. A., Rahn, T. A., Sauer, J. A., Dubey, M. K., Costigan, K. R., Arata, C., Steffke, A. M., Hills, S., Haselwimmer, C., Charlesworth, D., Funk, C. C., Green, R. O., Lundeen, S. R., Boardman, J. W., Eastwood, M. L., Sarture, C. M., Nolte, S. H., McCubbin, I. B., Thompson, D. R., and McFadden, J. P.: Mapping methane concentrations from a controlled release experiment using the next generation airborne visible/infrared imaging spectrometer (AVIRIS-NG), Remote Sens. Environ., 179, 104–115, https://doi.org/10.1016/j.rse.2016.03.032, 2016.
Thorpe, A. K., Frankenberg, C., Thompson, D. R., Duren, R. M., Aubrey, A. D., Bue, B. D., Green, R. O., Gerilowski, K., Krings, T., Borchardt, J., Kort, E. A., Sweeney, C., Conley, S., Roberts, D. A., and Dennison, P. E.: Airborne DOAS retrievals of methane, carbon dioxide, and water vapor concentrations at high spatial resolution: application to AVIRIS-NG, Atmos. Meas. Tech., 10, 3833–3850, https://doi.org/10.5194/amt-10-3833-2017, 2017.
Wietzel, J. B. and Schmidt, M.: Whole-Site Quantification of Methane Emissions from 65 German Biogas Plants Reveals Systematic Underestimation in Current Emission Inventories, Environ. Sci. Technol., 60, 24651–24660, https://doi.org/10.1021/acs.est.6c03851, 2026.
Wietzel, J. B., Korben, P., Hoheisel, A., and Schmidt, M.: Best practices and uncertainties in CH4 emission quantification: employing mobile measurements and Gaussian plume modelling at a biogas plant, Atmos. Meas. Tech., 18, 4631–4645, https://doi.org/10.5194/amt-18-4631-2025, 2025.
Wilson, R. B., Start, G. E., Dickson, C. R., and Ricks, N. R.: Diffusion under low windspeed conditions near Oak Ridge, Tennessee, NOAA Technical Memorandum ERL ARL-61, National Oceanic and Atmospheric Administration, Air Resources Laboratory, 83 pp., https://repository.library.noaa.gov/view/noaa/23517 (last access: 13 November 2026), 1976.