the Creative Commons Attribution 4.0 License.
the Creative Commons Attribution 4.0 License.
 | 23 Feb 2018
Improved source apportionment of organic aerosols in complex urban air pollution using the multilinear engine (ME-2)
Qiao Zhu
Xiao-Feng Huang
Li-Ming Cao
Lin-Tong Wei
Bin Zhang
Ling-Yan He
Miriam Elser
Francesco Canonaco
Jay G. Slowik
Carlo Bozzetti
Imad El-Haddad
André S. H. Prévôt
Organic aerosols (OAs), which consist of thousands of complex compounds emitted from various sources, constitute one of the major components of fine particulate matter. The traditional positive matrix factorization (PMF) method often apportions aerosol mass spectrometer (AMS) organic datasets into less meaningful or mixed factors, especially in complex urban cases. In this study, an improved source apportionment method using a bilinear model of the multilinear engine (ME-2) was applied to OAs collected during the heavily polluted season from two Chinese megacities located in the north and south with an Aerodyne high-resolution aerosol mass spectrometer (HR-ToF-AMS). We applied a rather novel procedure for utilization of prior information and selecting optimal solutions, which does not necessarily depend on other studies. Ultimately, six reasonable factors were clearly resolved and quantified for both sites by constraining one or more factors: hydrocarbon-like OA (HOA), cooking-related OA (COA), biomass burning OA (BBOA), coal combustion (CCOA), less-oxidized oxygenated OA (LO-OOA) and more-oxidized oxygenated OA (MO-OOA). In comparison, the traditional PMF method could not effectively resolve the appropriate factors, e.g., BBOA and CCOA, in the solutions. Moreover, coal combustion and traffic emissions were determined to be primarily responsible for the concentrations of PAHs and BC, respectively, through the regression analyses of the ME-2 results.
- Article
(5834 KB) - Full-text XML
-
Supplement
(2949 KB) - BibTeX
- EndNote


Atmospheric aerosols are generating increasing interest due to their adverse effects on human health, visibility and the climate (IPCC, 2013; Pope and Dockery, 2006). Among different particulate compositions, many studies focus on organic aerosols (OAs) because they contribute 20–90 % to the total submicron mass (Jimenez et al., 2009; Zhang et al., 2007). OAs can be either directly emitted by various sources, including anthropogenic (i.e., traffic and combustion activities) and biogenic sources, or produced via secondary formation after the oxidation of volatile organic compounds (VOCs) (Hallquist et al., 2009). Therefore, reliable source identification and quantification of OAs are essential before developing effective political abatement strategies.
Aerodyne aerosol mass spectrometer (AMS) systems are the most widely adopted online aerosol measurement systems for acquiring aerosol chemical compositions (Canagaratna et al., 2007; Pratt and Prather, 2012). An AMS provides online quantitative mass spectra of non-refractory components from the submicron aerosol fraction with a high temporal resolution (i.e., seconds to minutes) (Canagaratna et al., 2007). The total mass spectra can be assigned to both several inorganic compounds and the organic fraction through mass spectral fragmentation tables (Allan et al., 2004). To further investigate the different types of organic fractions, numerous studies have exploited the positive matrix factorization (PMF) algorithm and apportioned the AMS organic mass spectra in terms of their source emissions or formation processes (Zhang et al., 2011). PMF is a standard multivariate factor analysis tool (Paatero, 1999; Paatero and Tapper, 1994) that models the time series of measured organic mass spectra as a linear combination of positive factor profiles and their respective time series. Most of the earlier PMF studies were conducted on unit-mass resolution (UMR) mass spectrometers (Lanz et al., 2007, 2010; Ulbrich et al., 2009), although more have recently focused on high-resolution (HR) mass spectra PMF (Aiken et al., 2009; Docherty et al., 2008; Huang et al., 2010). The use of HR mass spectra data to constrain PMF solutions can reduce their rotational ambiguity and result in more interpretable OA factors. For example, Aiken et al. (2009) found that hydrocarbon-like OA (HOA) and biomass burning OA (BBOA) were better separated using HR-AMS data than with UMR data. However, even HR-AMS-PMF can also yield mixed factors (especially in heavily polluted areas) due to their complex emission patterns.
The abundant characteristic fragments for cooking-related OA (COA) (e.g., m∕z 55 and 57) and coal combustion OA (CCOA) (e.g., m∕z 51, 53, and 65) can be observed in the mass spectrum of the HOA factor (He et al., 2010; Hu et al., 2013). Elser et al. (2016) analyzed two urban HR-AMS datasets in China, and their PMF results showed an HOA profile that contained a high concentration of C2H4O (m∕z 60), which is a BBOA tracer ion. In addition, CO (m∕z 44) contributed more to COA compared to oxygenated OA (OOA). To solve this “mixed factor” problem in PMF analysis, some researchers attempted to use the multilinear engine algorithm (ME-2) with user-provided constraints (Canonaco et al., 2013; Crippa et al., 2014; Elser et al., 2016; Reyes-Villegas et al., 2016). However, several key issues with the ME-2 in these studies, such as reliability of the user-input constraints and the criteria used to determine an optimal result, still require further investigation. Most ME-2 studies (Crippa et al., 2014; Elser et al., 2016; Reyes-Villegas et al., 2016) were based on HR-AMS datasets and utilized mass profiles of PMF results from Paris (Crippa et al., 2013; mostly due to the lack of other reliable source profiles) and did not consider the specific sampling sites, which could result in uncertainties.
In this study, a novel source apportionment technique using the multilinear engine tool (ME-2) was successfully applied to organic mass spectra obtained with an HR-ToF-AMS at two urban sites during pollution-heavy periods during the same year. The improved OA source apportionment results are discussed and compared with an unconstrained PMF analysis.
2.1 Sampling sites and period
Measurements at Qingdao (36.10∘ N, 120.47∘ E; 10 m above ground level, a.g.l.) were performed from 1 to 31 November 2013, while those in Dongguan were conducted from 12 December 2013 to 1 January 2014 (33.03∘ N, 113.75∘ E; 100 m a.g.l.). Qingdao is a coastal city with over 9 million inhabitants in northern China, while Dongguan has over 8 million inhabitants and is located in southern China (shown in Fig. 1). Both of the sampling sites are on the tops of buildings in urban central areas, and there is no industrial emission nearby.
2.2 Instrumentation
An HR-ToF-AMS was deployed for the online measurement of non-refractory PM1 (Canagaratna et al., 2007). The setup and operation of the HR-ToF-AMS was similar to that in our previous studies (Huang et al., 2015, 2010). A PM2.5 cyclone inlet was briefly placed on the roof of a building to remove coarse particles and to introduce an air stream containing the remaining particles into a room through a copper tube with a flow rate of 10 L min−1. A Nafion dryer (MD-070-12S-4, Perma Pure Inc.) was positioned upstream of the HR-ToF-AMS to eliminate the potential influence of relative humidity on the particle collection (Matthew et al., 2008), after which the HR-ToF-AMS isokinetically sampled from the center of the copper tube at a flow rate of 80 mL min−1. The instrument was operated at two ion optical modes with a cycle of 4 min, i.e., 2 min for the mass-sensitive V mode and 2 min for the high-mass-resolution W mode. An Aethalometer (AE-31, Magee), which also has a PM2.5 inlet, was simultaneously used for measurements of refractory black carbon (BC) with a temporal resolution of 5 min.
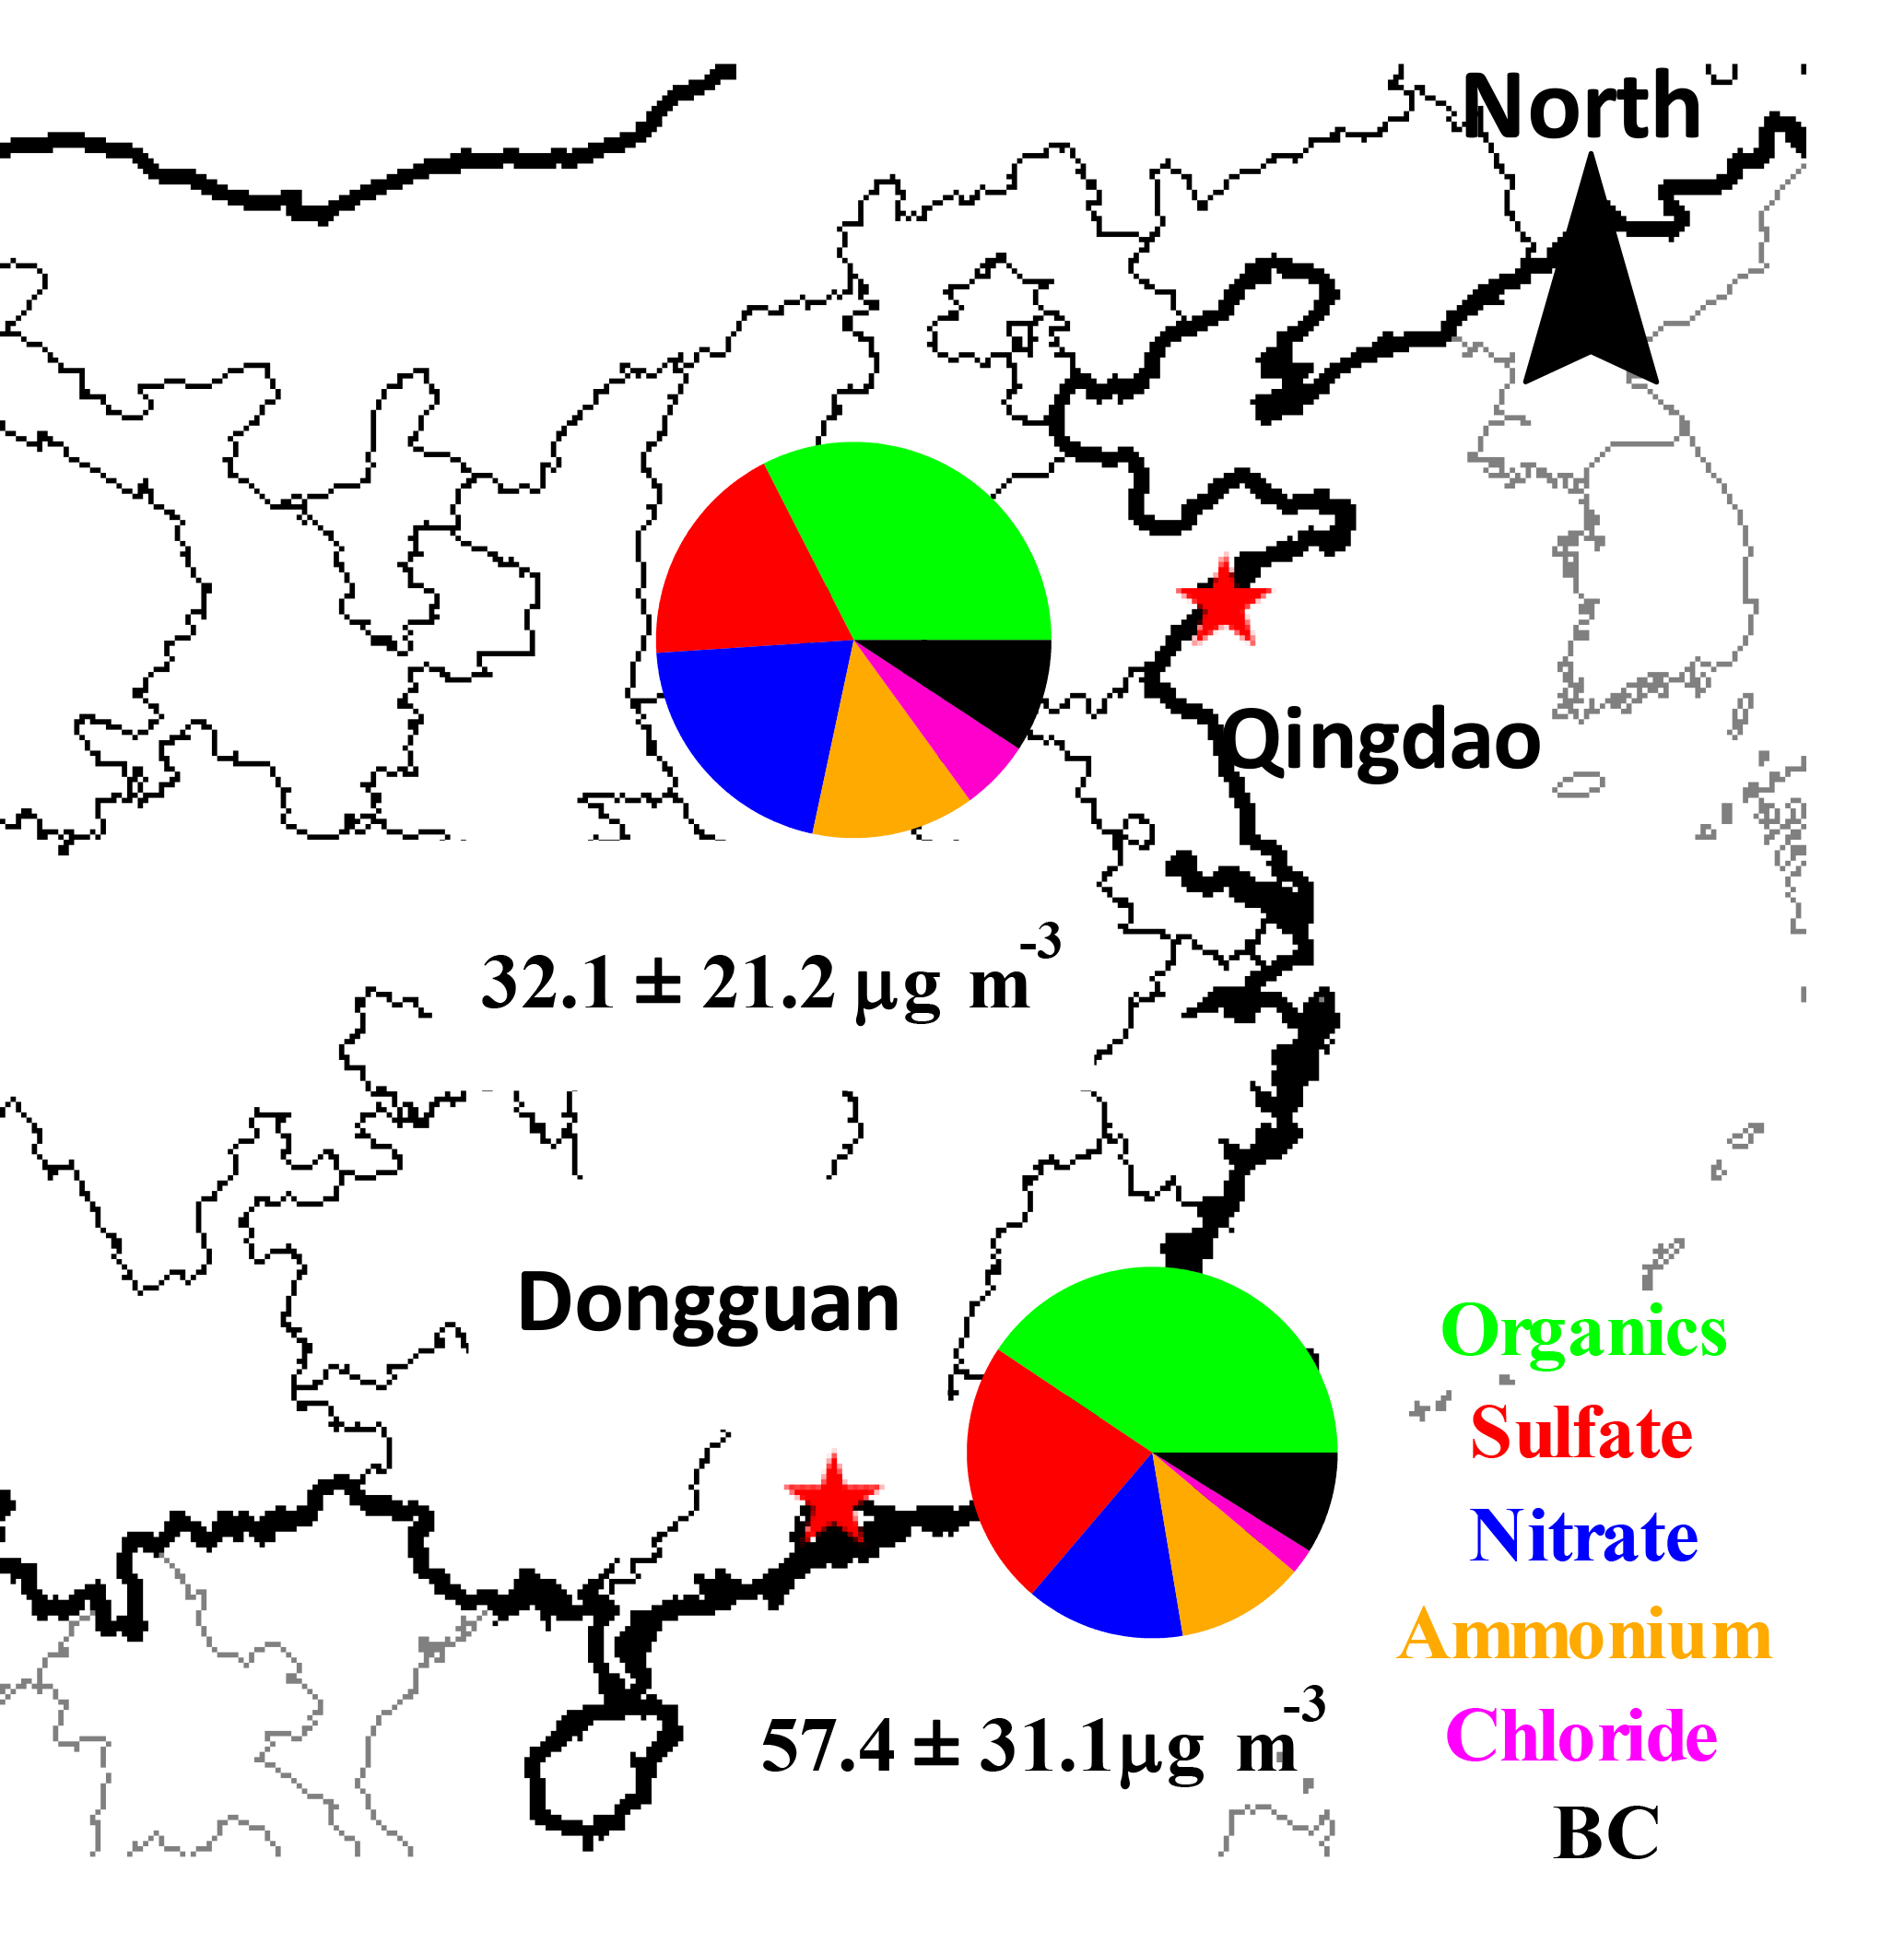
Figure 1The locations and the average PM1 chemical compositions of the Qingdao and Dongguan sampling sites.
A routine analysis of the HR-ToF-AMS data was performed using the software SQUIRREL (version 1.57) and PIKA (version 1.16) written in Igor Pro 6.37 (Wave Metrics Inc.) (http://cires1.colorado.edu/jimenez-group/ToFAMSResources/ToFSoftware/index.html). The ionization efficiency (IE) was calibrated using pure ammonium nitrate particles following standard protocols (Drewnick et al., 2005; Jayne et al., 2000). The relative IEs (RIEs) for organics, nitrate and chloride were assumed to be 1.4, 1.1 and 1.3, respectively. A composition-dependent collection efficiency (CE) was applied to the data based on the method of Middlebrook et al. (2012) and an organic elemental analysis was performed using the latest approach recommended by Canagaratna et al. (2015).
2.3 PMF and ME-2 methods for OA source apportionment
PMF is a mathematical technique used to solve bilinear unmixing problems (Paatero and Tapper, 1994) that enables a description of the variability of a multivariate database as the linear combination of static factor profiles and their corresponding time series. The bilinear factor analytic model in matrix notation is defined in Eq. (1), where the measured matrix X (consisting of i rows and j columns) is approximated by the product of G (containing the factor time series) and F (the factor profiles). E denotes the model residuals. The entries in G and F are fitted using a least-squares algorithm that iteratively minimizes the quantity Q (Eq. 2), which is defined as the sum of the squared residuals (eij) weighted by their respective uncertainties (σij).
In this study, we adopted SoFi (Canonaco et al., 2013), which is an implementation of the multilinear engine (ME-2) (Paatero, 1999), to perform the organic HR-AMS data analysis. In contrast to an unconstrained PMF analysis, ME-2 enables a more complete exploration of the rotational ambiguity of the solution space. In our case, this is achieved by directing the solution towards environmentally meaningful rotations using the a value approach. This method uses prior input profiles and the scalar a to constrain one or more output factor profiles such that they fall within a predetermined range. The a value determines the extent to which the output profiles are allowed to vary from the input profiles according to Eq. (3), where f represents the factor profile and j indicates the m∕z of the ions.
The number of output factors, which is selected by the user, is a key consideration for PMF analysis. Most unconstrained PMF results were chosen following the procedures detailed in Zhang et al. (2007). However, additional outputs in ME-2 can be generated to explore more of the solution space, and more criteria should be developed to support the factor identification, which will be discussed in Sect. 3.
2.4 Polycyclic aromatic hydrocarbon (PAH) quantification
In this study, PAH mass concentrations were quantitatively determined from the HR-AMS data. The steps outlined are as follows: first, the PAH molecular ions [M]+, including [C10H8]+, [C12H8]+, [C14H8]+, [C14H10]+, [C16H10]+, [C18H10]+, [C18H12]+, [C20H12]+, [C22H12]+, [C22H14]+, [C24H12]+, [C24H14]+, and other associated fragments, including [M-H]+, [M-2H]+, [M]2+, and [M-H]2+, were fitted in the HR spectra. Second, the fragments presented low correlation (i.e., R2 below 0.6) with their corresponding molecular ions were not taken into account. Finally, the relative ionization efficiency (RIE) for PAHs was assumed to be 1.4 and the dependency of the collection efficiency (CEb) on the chemical composition of the aerosol was estimated using a composition-dependent collection efficiency (CDCE) algorithm (Middlebrook et al., 2012). More details about the method can be found in Bruns et al. (2015).
In this section, a conventional PMF without any prior information is performed to analyze the OA source apportionment. Then, we use the ME-2 method to optimize the OA source apportionment based on the information obtained from the PMF method.
3.1 Unconstrained PMF runs
We performed unconstrained runs with a range from 2 to 10 factors. Generally, PMF solutions with large numbers of factors are not considered due to possible mathematical splits of the factor profiles. However, some factors that have small contributions or that have similar mass profiles as other factors (but different time series) may only be found in solutions with large numbers of factors. We observe that most of the solutions provided via PMF include either multiply split factors or mixed factors that are not properly separated from one another. In other words, PMF does not produce an appropriate solution. The six-factor solutions for Qingdao and Dongguan are shown in Fig. S1 and S2 in the Supplement, and three types of primary OAs (POAs) were identified for each sampling site, including HOA), coal combustion OA (CCOA) and cooking OA (COA) for Qingdao and HOA, biomass burning OA (BBOA) and COA for Dongguan. Oxygenated OA (OOA) seems to be excessively split in the six-factor solutions for both of the sites. HOA is distinguished by alkyl fragment signatures with prominent contributions of m∕z 55 (C4H and m∕z 57 (C4H (Ng et al., 2011). The COA profile is similar to that of HOA but has a higher contribution from oxygenated ions at m∕z 55 (C3H3O+) and m∕z 57 (C3H5O+) (Mohr et al., 2012). BBOA is characterized by the presence of signals at m∕z 60 (C2H4O and m∕z 73 (C3H5O, which are identified as fragments from anhydrous sugars present in biomass smoke (Alfarra et al., 2007). The OOA profile is characterized by a high signal at m∕z 44 (CO. Note that some POA profiles in this solution indicate mixing; for example, CCOAs in Qingdao contain a high concentration of the biomass burning tracer ion (m∕z 60, C2H4O, and HOAs in Dongguan have a higher-than-expected contribution of m∕z44 (CO with a high O ∕ C ratio (0.26). In addition, CCOA seems to be mixed with BBOA. We then further verified the solutions with additional factors. The results show that BBOA and CCOA are separated from each other in the 7- and 8-factor solutions for Qingdao (see Fig. S1) and that better signals for unmixed and stable HOA with low O ∕ C ratios of 0.17 or 0.18 emerged in the 7- to 10-factor solutions for Dongguan (see Fig. S2).
3.2 Investigate anchor profiles for ME-2
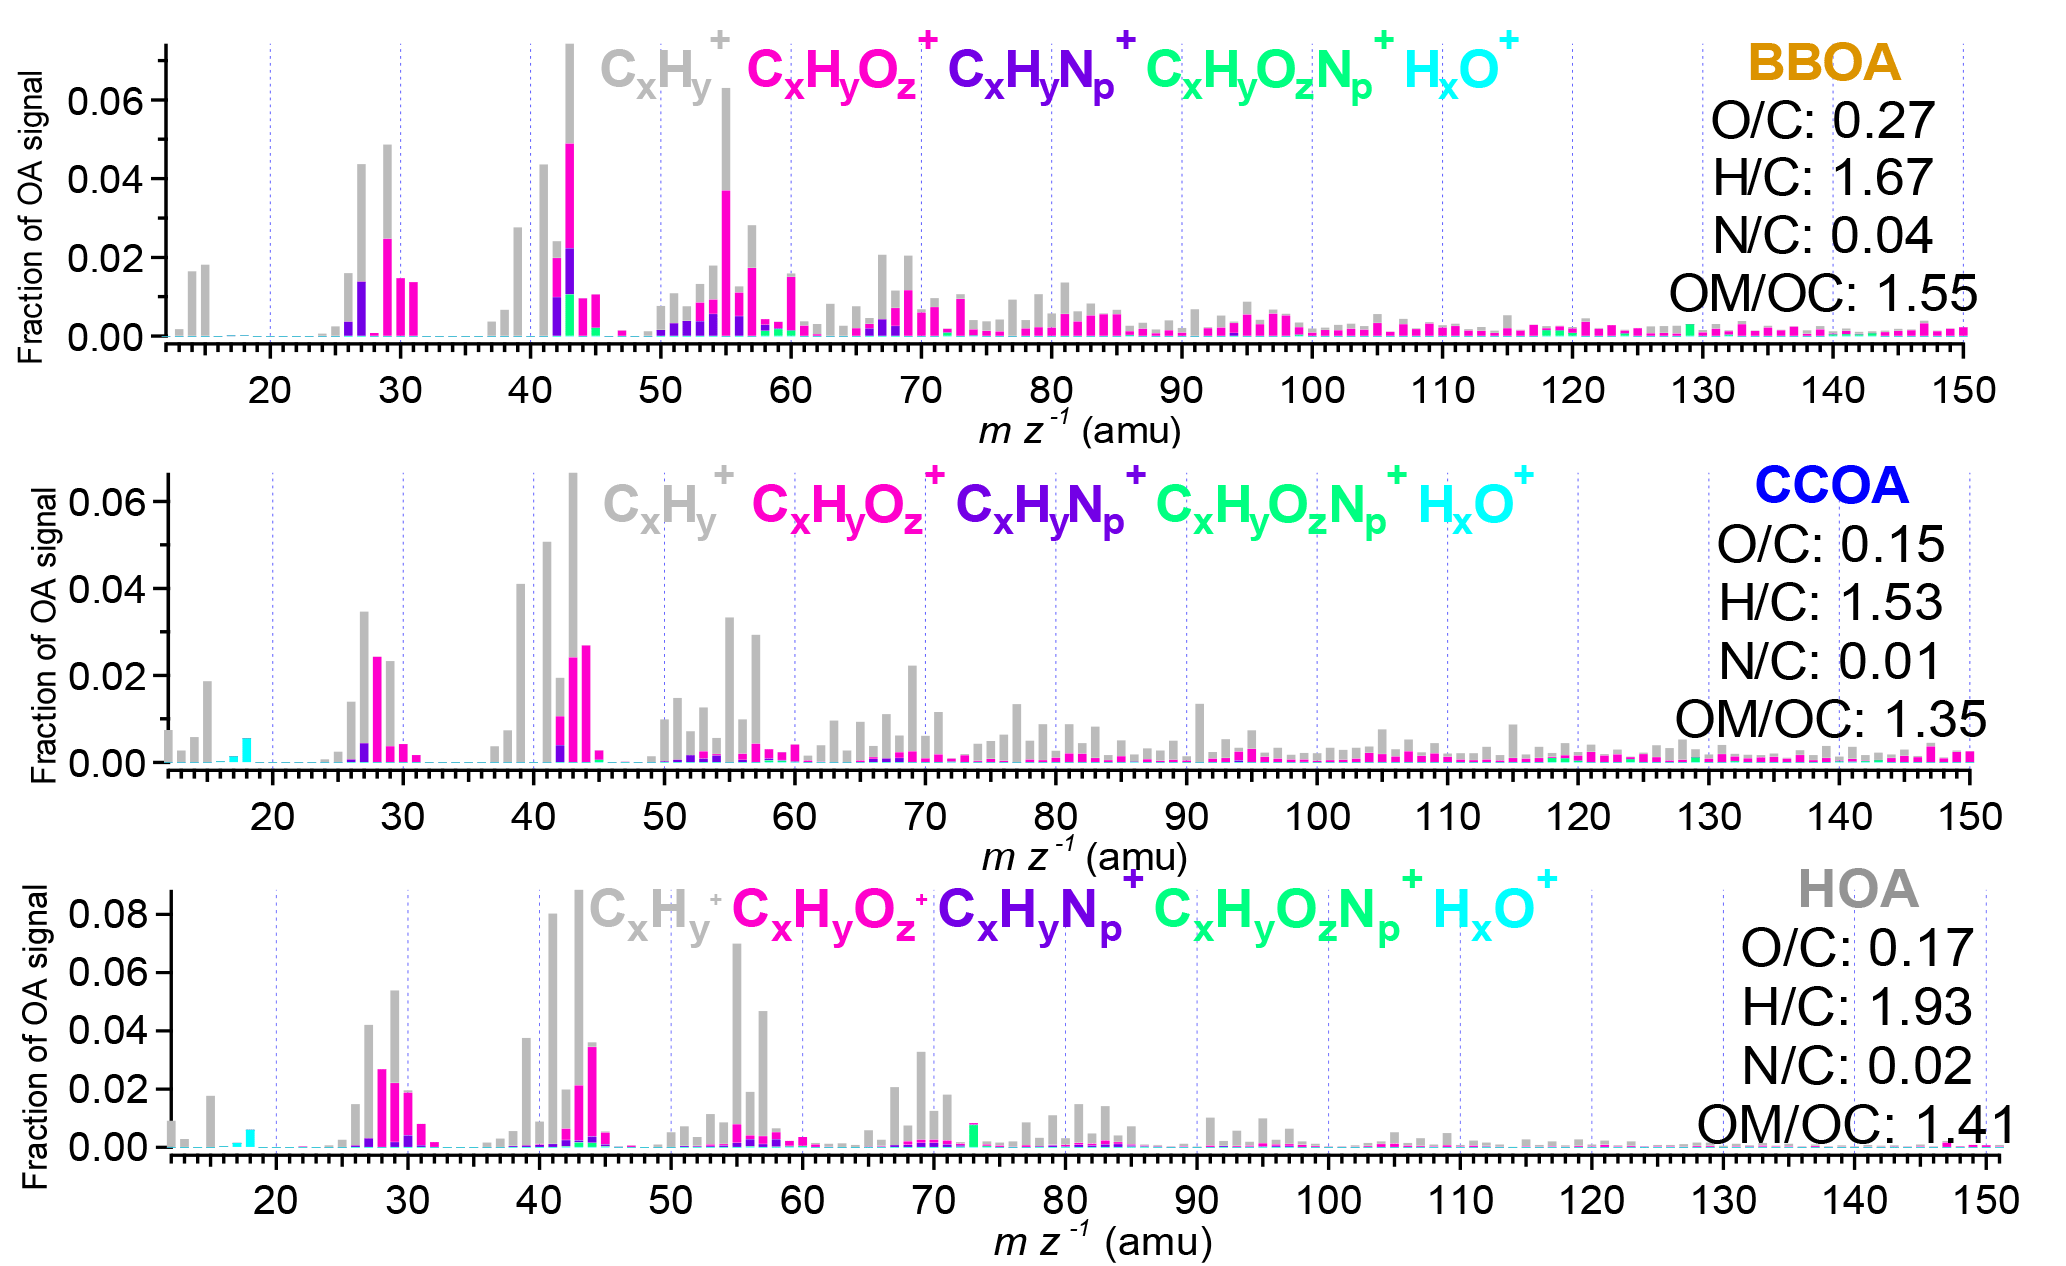
Before operating ME-2, feasible and reasonable prior input profiles must be determined. To the best of our knowledge, this is the first HR-OA dataset that employs anchor profiles extracted from an unconstrained PMF solution with a higher number of factors, and the same approach has been successfully applied to source apportionment efforts using UMR ME-2 (Fröhlich et al., 2015). In our case for Qingdao, the BBOA anchor profile should be investigated, and we attempted to look for it from the unconstrained PMF results based on the same dataset and found that the BBOA factors in the seven- and eight-factor solutions might be used as the anchor profiles. They both had good correlation with the BBOA MS in Chinese biomass burning emission simulation (He et al., 2010), confirming their basic BBOA characteristics. Although these two BBOA factors are quite similar, the BBOA from the eight-factor solution is better suited to be a constraining profile due to its smaller m∕z 44 (CO signal and higher m∕z 60 (C2H4O signal (see Fig. S3). In addition, the BBOA from the eight-factor solution also correlates better with the BBOA from a Chinese biomass burning simulation (R2=0.81) than the seven-factor solution (R2=0.79). For Dongguan, the anchor profile for HOA can be obtained from unconstrained PMF solutions. The averaged HOA profile from the 7- to 10-factor solutions was used as the anchor profile for ME-2 due to the small differences among the different solutions. Additionally, the constraining CCOA profile for Dongguan is still under consideration because the mass spectrum of BBOA was found to be very similar to that of CCOA, raising the concern that coal combustion particles might have been incorrectly apportioned to biomass burning sources (Wang et al., 2013). An appropriate CCOA anchor profile could not be obtained due to an increase in the unconstrained PMF factor number (see Fig. S2). The best approach is to employ the CCOA profile from Qingdao as the constraining profile for Dongguan in ME-2, as these two campaigns were conducted using the same HR-ToF-AMS in the same year. In addition, the CCOA from Qingdao has a very good correlation (R2=0.97) with CCOA profiles reported at other Chinese urban sites (Elser et al., 2016) (see Fig. S4). Tian et al. (2012) also found that the emission compositions of coal combustion in different regions in China are quite similar. The input profiles for BBOA, HOA and CCOA prior to operating ME-2 are shown in Fig. 2.
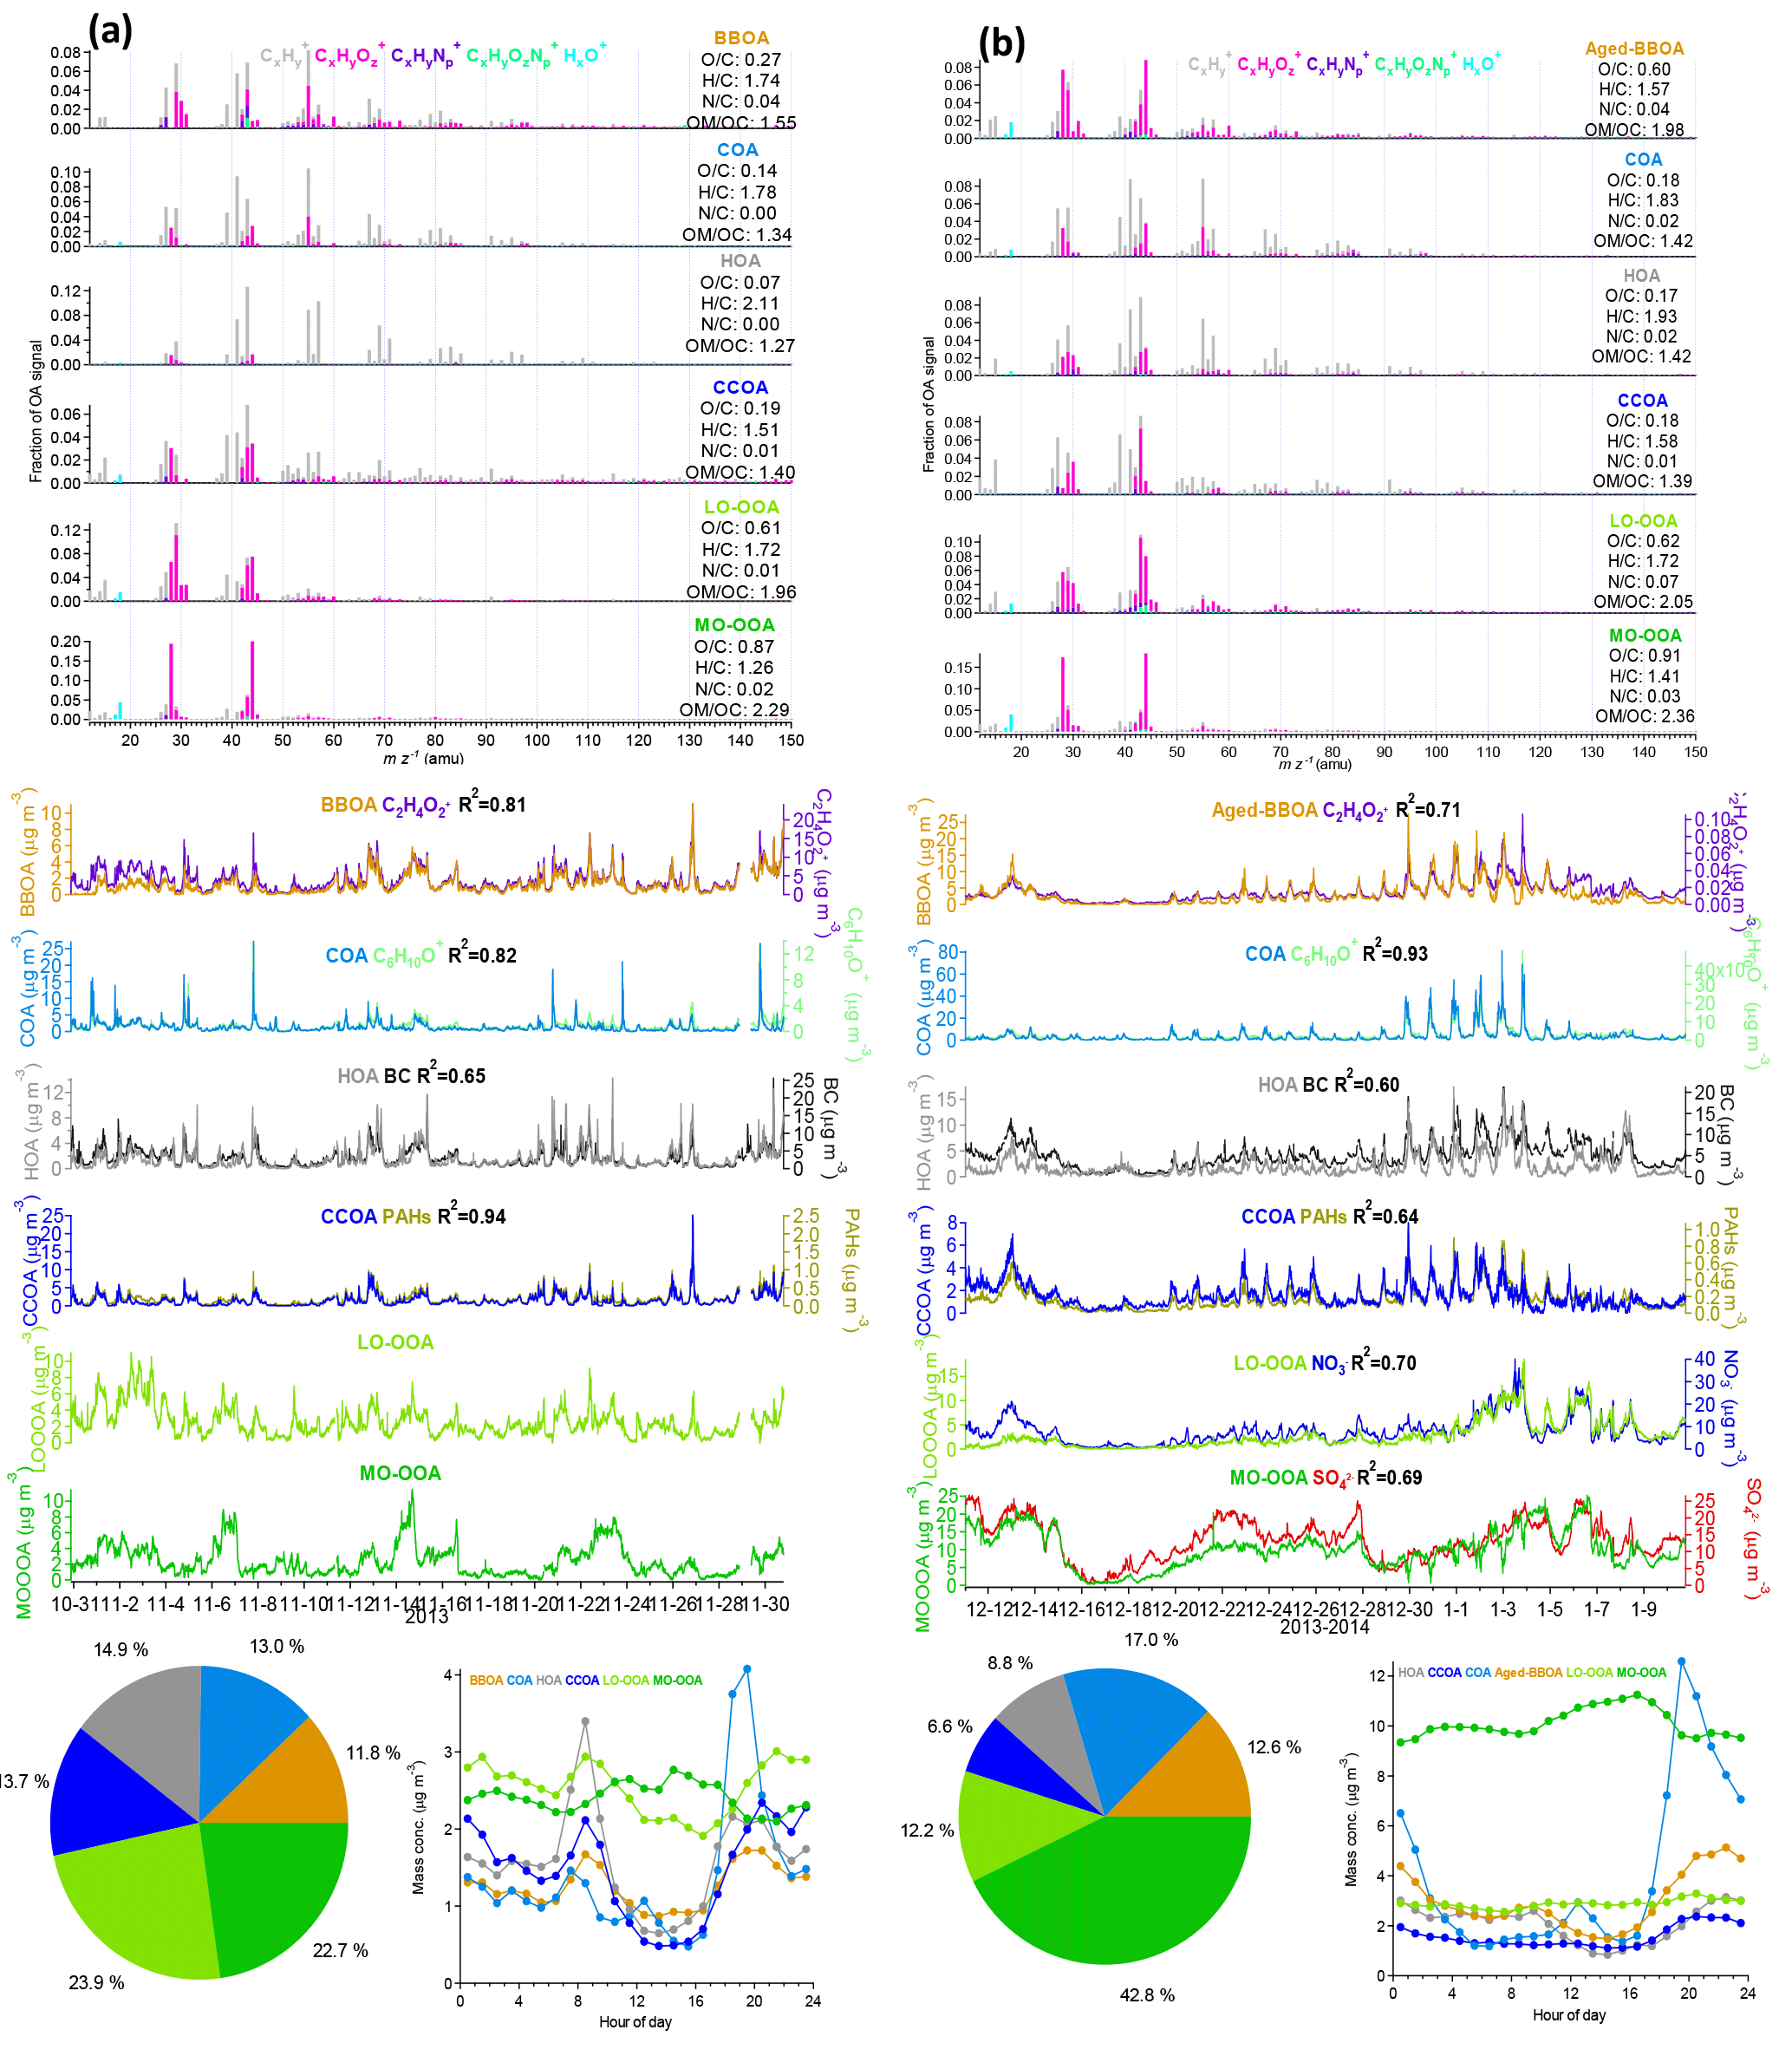
Figure 3Mass spectra of the OA factors, average fractions of the OA factors, diurnal variations of the OA factors and time series of the OA factors identified by the ME-2 method for (a) Qingdao and (b) Dongguan.
3.3 Constrain the mass spectrums of the mixed factors with different a values
According to the unconstrained PMF results, the best interpretable results for both two sites are the six-factor solutions with factors that include HOA, COA, BBOA, CCOA, less-oxidized oxygenated OA (LO-OOA) and more-oxidized oxygenated OA (MO-OOA) (Fig. 3a and b). As inputs, we constrain the a values for BBOA in Qingdao to be 11 numbers from 0 to 1 (with an increment of 0.1), which will output 11 possible solutions respectively. Similarly, for both HOA and CCOA in Dongguang, it outputs 11 × 11 = 121 possible solutions.
3.4 Criteria for obtaining the optimal results
In this study, we used two simple and reasonable criteria to obtain a better environmental OA source apportionment: the reasonability of the O ∕ C ratio and the correlation between the factors and the tracers. For Qingdao, the O ∕ C ratios for six resolved factors and the correlations between CCOA and PAHs, HOA and BC for 11 solutions with different a values are shown in Table S2. These results indicate that all of the O ∕ C ratios for each factor and each factor–tracer correlation are quite similar to one another and that they agree with the range of values in the literature (Canagaratna et al., 2015). Therefore, the solutions averaged over the 11 outputs were considered the final results for Qingdao. For Dongguan, all of the O ∕ C ratios for HOA, CCOA, COA and BBOA among the 121 possible solutions are listed in Table S3. The O ∕ C ratio of HOA in the unconstrained PMF results remained between approximately 0.17 and 0.18, providing a filter criterion with which to assess reasonable ME-2 solutions, and only solutions with a values between 0 and 0.1 fell into this range (Table S1). The O ∕ C ratios of other factors for a values between 0 and 0.1 are shown in Table S3. The solutions using a values between 0 and 0.1 for the HOA profile and an a value of 0.9 for the CCOA profile are considered ideal results for three reasons. First, unlike the HOA mass spectra, CCOAs from different sites show higher variability and the CCOA anchor profile is not derived from itself, and therefore it is reasonable to restrict the constraint with small avalues for HOA and a looser constraint should be applied for CCOA, which is consistent with the a values selecting rules in London ME-2 study (Reyes-Villegas et al., 2016). Second, the POA factors in Dongguan, including HOA and CCOA, have higher O ∕ C ratios likely as a result of a higher atmospheric oxidizing capacity and a stronger photochemical formation in southern China (Hofzumahaus et al., 2009). Moreover, some studies reported that BBOAs undergo substantial chemical processing immediately after emission and that aged BBOAs had significant concentrations in fresh plumes (Zhou et al., 2017). Thus, CCOAs in Dongguan are very likely to demonstrate relatively higher ages than those in Qingdao (0.15) with higher O ∕ C ratios (but with an O ∕ C ratio of up to 1.25 when the a value is 1, which is unacceptable). Third, with an increase in the a value for CCOA, two types of OOAs become more distinctive, and the factor correlates better with the tracer (Tables S1 and S4).
In order to prove the improvement of using the anchor profiles generated by the unconstrained PMF run with the same local datasets, we also run the ME-2 analysis using the anchor profiles available in the literature, with the results shown in Table S5 and S6. For Qingdao, the correlations between POAs and their tracers and the Q/Qexp values using the three BBOA profiles in the literature are poorer than using the BBOA obtained in this study (Table S5). For Dongguan, the results from ME-2 using the HOA profiles in the literature are also poorer than using the HOA profiles obtained in this study (Table S6). Therefore, it can be clearly seen that the method to obtain an anchor profile in this study is easier (it does not depend on the results in the literature) and more valid.
4.1 Variations in the OA factors
Figure 1 shows the chemical compounds of PM1, including the non-refractory (NR) components measured via HR-AMS (i.e., OA, SO4, NO3, NH4 and Cl) and BC concentrations measured via the AE-31, during the sampling period in both Qingdao and Dongguan. The average PM1 mass concentration was 32.1 ± 21.2 µg m−3 (mean ± standard deviation) in Qingdao and 57.4 ± 31.1 µg m−3 in Dongguan. The temporal variations in the PM1 species in conjunction with meteorological parameters are shown in Fig. S5. Although Dongguan is located in southern China with relatively less air pollution (Huang et al., 2012), the PM1 mass concentration was higher. This is mainly because of stagnant meteorological conditions with low average wind speeds (i.e., 2.3 m s−1) and a maximum wind speed of less than 6 m s−1. Among the PM1 compounds, OAs accounted for 32.5 % of PM1 in Qingdao and 40.6 % in Dongguan. This suggests that OA constitutes a very important fraction at both urban sites. Thus, the final and detailed results of the OA source apportionment are presented in this section.
For Qingdao, the final result is the average of all of the ME-2 runs, with constraints including a values from 0 to 1 fulfilling the criteria described in Sect. 3.2. The mass spectra and time series of the resolved OA sources are shown in Fig. 3a. The characteristics of each factor were distinct. The BBOA profile contained the highest m∕z 60 fraction f60 (1.5 %) compared to the other factors, and the concentrations were highly correlated with C2H4O (R2=0.81). The mass spectra of COA was characterized by a high m∕z 55∕57 ratio, which is consistent with previous results (He et al., 2010; Mohr et al., 2012; Sun et al., 2016). In addition, the time series of COA showed a good correlation with its tracer ion C6H10O+ in accordance with (Sun et al., 2016). HOAs were correlated well with BC (R2=0.65), and CCOAs were highly correlated with PAHs (R2=0.94). Among the two types of OOAs, the less-oxidized OOA (LO-OOA) had a lower CO fraction and O ∕ C ratio (0.62) compared with the more oxidized OOA (MO-OOA), which had a higher CO fraction and O ∕ C (0.91) ratio. The sum of LO-OOA and MO-OOA showed a high correlation with the sum of sulfate and nitrate (R2=0.76). The POAs (including HOA, COA, BBOA and CCOA) contributed 53.4 % to the OA concentration (Fig. 3a), which was almost equal to the SOA fraction. In terms of the diurnal trends of the OA factors shown in Fig. 3a, they are all partially driven both by planetary boundary layer (PBL) dynamics (demonstrating an increased dilution during the daytime and an accumulation of particulate matter overnight) and by the diurnal emission profile. The diurnal trend of HOA showed pronounced peaks during the morning and evening rush hours (08:00–09:00 and 19:00–21:00), which is typically the case for traffic-related pollutants. COA shows a very distinct daily trend with strong peaks during the lunch (approximately 12:00) and dinner (19:00–20:00) periods. CCOAs constituted an important and dominant source of pollutants during the wintertime in northern Chinese areas (Elser et al., 2016) due to heating activities, especially with regard to the central-heating supply that began on November 13 and continued until the end of the campaign. The diurnal variations of the four POA factors before and during the central-heating period are shown in Fig. S6. In comparison with the other three POAs, the diurnal pattern of CCOA showed a clear increase during the central-heating period with concentration peaks during the morning (at approximately 09:00) and at night (starting to rise at 18:00), which seems consistent with heating emissions and atmospheric dilution. The diurnal trends of BBOA were similar to those of CCOA. The dilution of these particles within a deeper PBL during the daytime resulted in a decreasing trend in the BBOA concentration, while peaks related to residential heating were observed during the morning (between 09:00 and 10:00) and at night (starting to rise at 17:00). The main difference between the LO-OOA and MO-OOA diurnal patterns is that an increase in the MO-OOA mass concentration was observed during the daytime, implying that the formation of secondary organic aerosols was greatly enhanced during the afternoon. In addition, the diurnal cycle for LO-OOA showed a relatively smaller decrease during the daytime compared with the POA factors. These characteristics of the OOA diurnal trend confirm their secondary nature.
For Dongguan, similar to the OA source apportionment using ME-2 in Qingdao, the final result is the average of two accepted a-value solutions with six identified factors, i.e., HOA, CCOA, COA, Aged-BBOA, LO-OOA and MO-OOA. Although the range of the O ∕ C ratio of BBOA reported in Canagaratna et al. (2015) was from 0.25 to 0.55, fresh BBOA was found to be rapidly converted to OOA in less than 1 day (Bougiatioti et al., 2014), and the O ∕ C ratio of aged BBOA could be up to 0.85 (Zheng et al., 2017). BBOA in Dongguan was apparently not fresh considering it is an urban site and Dongguan has a warmer winter (17 ∘C in Dongguan vs. 9 ∘C in Qingdao). The BBOA factor identified in Dongguan, with a strong contribution of m∕z 60, had a higher O ∕ C, indicating it was an oxygenated BBOA; therefore we name it Aged-BBOA in this study. All of the information regarding the final source results is shown in Fig. 3b. Good correlations between each OA factor and their tracers indicate that the resolved ME-2 results are reasonable. A few sharp drops (which always occurred at approximately 20:00) were observed in the MO-OOA time series ranging from 29 December to 5 January, which coincides with extreme organic aerosol pollution (Fig. S5). The inherent mechanisms for these drops remain unexplained, although we have tried a number of reasonable approaches (e.g., splitting the period into sub-periods to identify the sources, constraining more factors before running ME-2, and examining more factors) to address this issue. A similar problem in the MO-OOA time series was also found in a recent ME-2 application (Qin et al., 2017). In our case, we presume this might be the result of relatively worse meteorological conditions at night during the sampling period, thereby increasing the contribution of late supper emissions and leading to the overestimation of COAs offset by drops in the MO-OOA concentration. Also note that the O ∕ C ratios of the POAs in Dongguan were higher than those in Qingdao, suggesting that POA emissions in Dongguan underwent faster chemical processing. In addition, the relatively smaller contributions of POAs further support this inference. Freshly emitted POAs may get mixed with aged OAs more easily, while ME-2 may still consider them unmixed. MO-OOAs accounted for an average of 42.8 % of the total OA mass (which is much greater than the contribution of LO-OOAs), which is probably because some POA species could have been rapidly converted to very aged OOAs (Bougiatioti et al., 2014; Xu et al., 2015). As mentioned above, the characteristics of the diurnal trends of the POA factors in Dongguan were similar to those in Qingdao, and thus we focused on the OOA factors. MO-OOAs still showed higher concentrations during the daytime but, unlike LO-OOAs in Qingdao, the diurnal patterns of LO-OOAs in Dongguan were flat, implying that secondary OA formation in the LO-OOAs basically offset the influences of PBL variations.
Meteorological conditions (especially wind) play a crucial role in the dilution and transport of air pollution. We used the relationships between the component concentrations and wind to profoundly understand the origins of the OA factors and their nature. The distributions of the OA factor concentrations versus the wind direction and speed are plotted in Fig. S7. For both of the urban sites, higher mass concentrations of the POA factors were mostly accompanied by low wind speeds, denoting their local emission characteristics. Additionally, for the OOA factors, a large proportion of their higher concentrations were maintained at higher wind speeds, indicating that the OOAs were formed by transport processes. However, the small fraction of high-level OOAs that was concentrated within the low wind-speed region represents the fast formation of OOAs from some local POA.
4.2 Regression analysis for POA tracers
BC and PAHs are mainly derived from incomplete combustion processes (Schmidt and Noack, 2000; White, 1985), and thus they were used as tracers for the POAs. In this study, the BC was directly measured by the AE-31, and the PAHs were quantified using the method developed by Bruns et al. (2015) based on AMS data. Both the BC and PAHs showed pronounced diurnal cycles similar to those of the POAs (see Fig. S8). In addition, POAs are properly split into different subtypes via the ME-2 method, thereby providing the possibility to better understand the contributions of different POAs to BC and PAHs and to verify the POA source identification. In this section, we use a multilinear regression method to analyze the POA factors for BC and PAHs.
Figure 4 shows the average contributions of OA sources to BC and PAHs in Qingdao and Dongguan. At both sites, HOAs were the dominant attribute of BC (51 % for Qingdao and 40 % for Dongguan) and CCOAs contributed the most to the PAHs (59 % for Qingdao and 43 % for Dongguan), indicating that BC mainly originates from traffic emissions and that PAHs in the Chinese urban polluted atmosphere are dominated by coal combustion during the wintertime. These findings are consistent with results reported in similar studies (Elser et al., 2016; Huang et al., 2015, 2010; Sun et al., 2016; Xu et al., 2014; Zhang et al., 2008). Moreover, the ratio of PAHs to OAs (1.8 %) in Qingdao was similar to that in the northern Chinese urban site of Xi'an (1.9 %) (Elser et al., 2016) but was higher than that in Dongguan (0.9 %). This is likely because a larger fraction of coal combustion to the total OA concentration would enhance the ratio of PAHs to OAs (Elser et al., 2016). Biomass burning was the second-most important source for both BC and PAHs; it was responsible for 33 and 29 % of the BC at Qingdao and Dongguan, respectively, and for 29 and 34 % of the PAHs at Qingdao and Dongguan, respectively. Cooking emissions were a minor source of BC and PAHs, accounting for less than 10 %. These results are also consistent with the published findings. For example, biomass burning is an important source for BC (Kondo et al., 2011; Reddy et al., 2002) and, in some regions with fewer traffic emissions, BC has the best correlation with BBOAs (Schwarz et al., 2008). In addition, in Beijing and California, PAHs are correlated well with BBOAs but are much more weakly correlated with COAs (Ge et al., 2012; Hu et al., 2016; Sun et al., 2016).
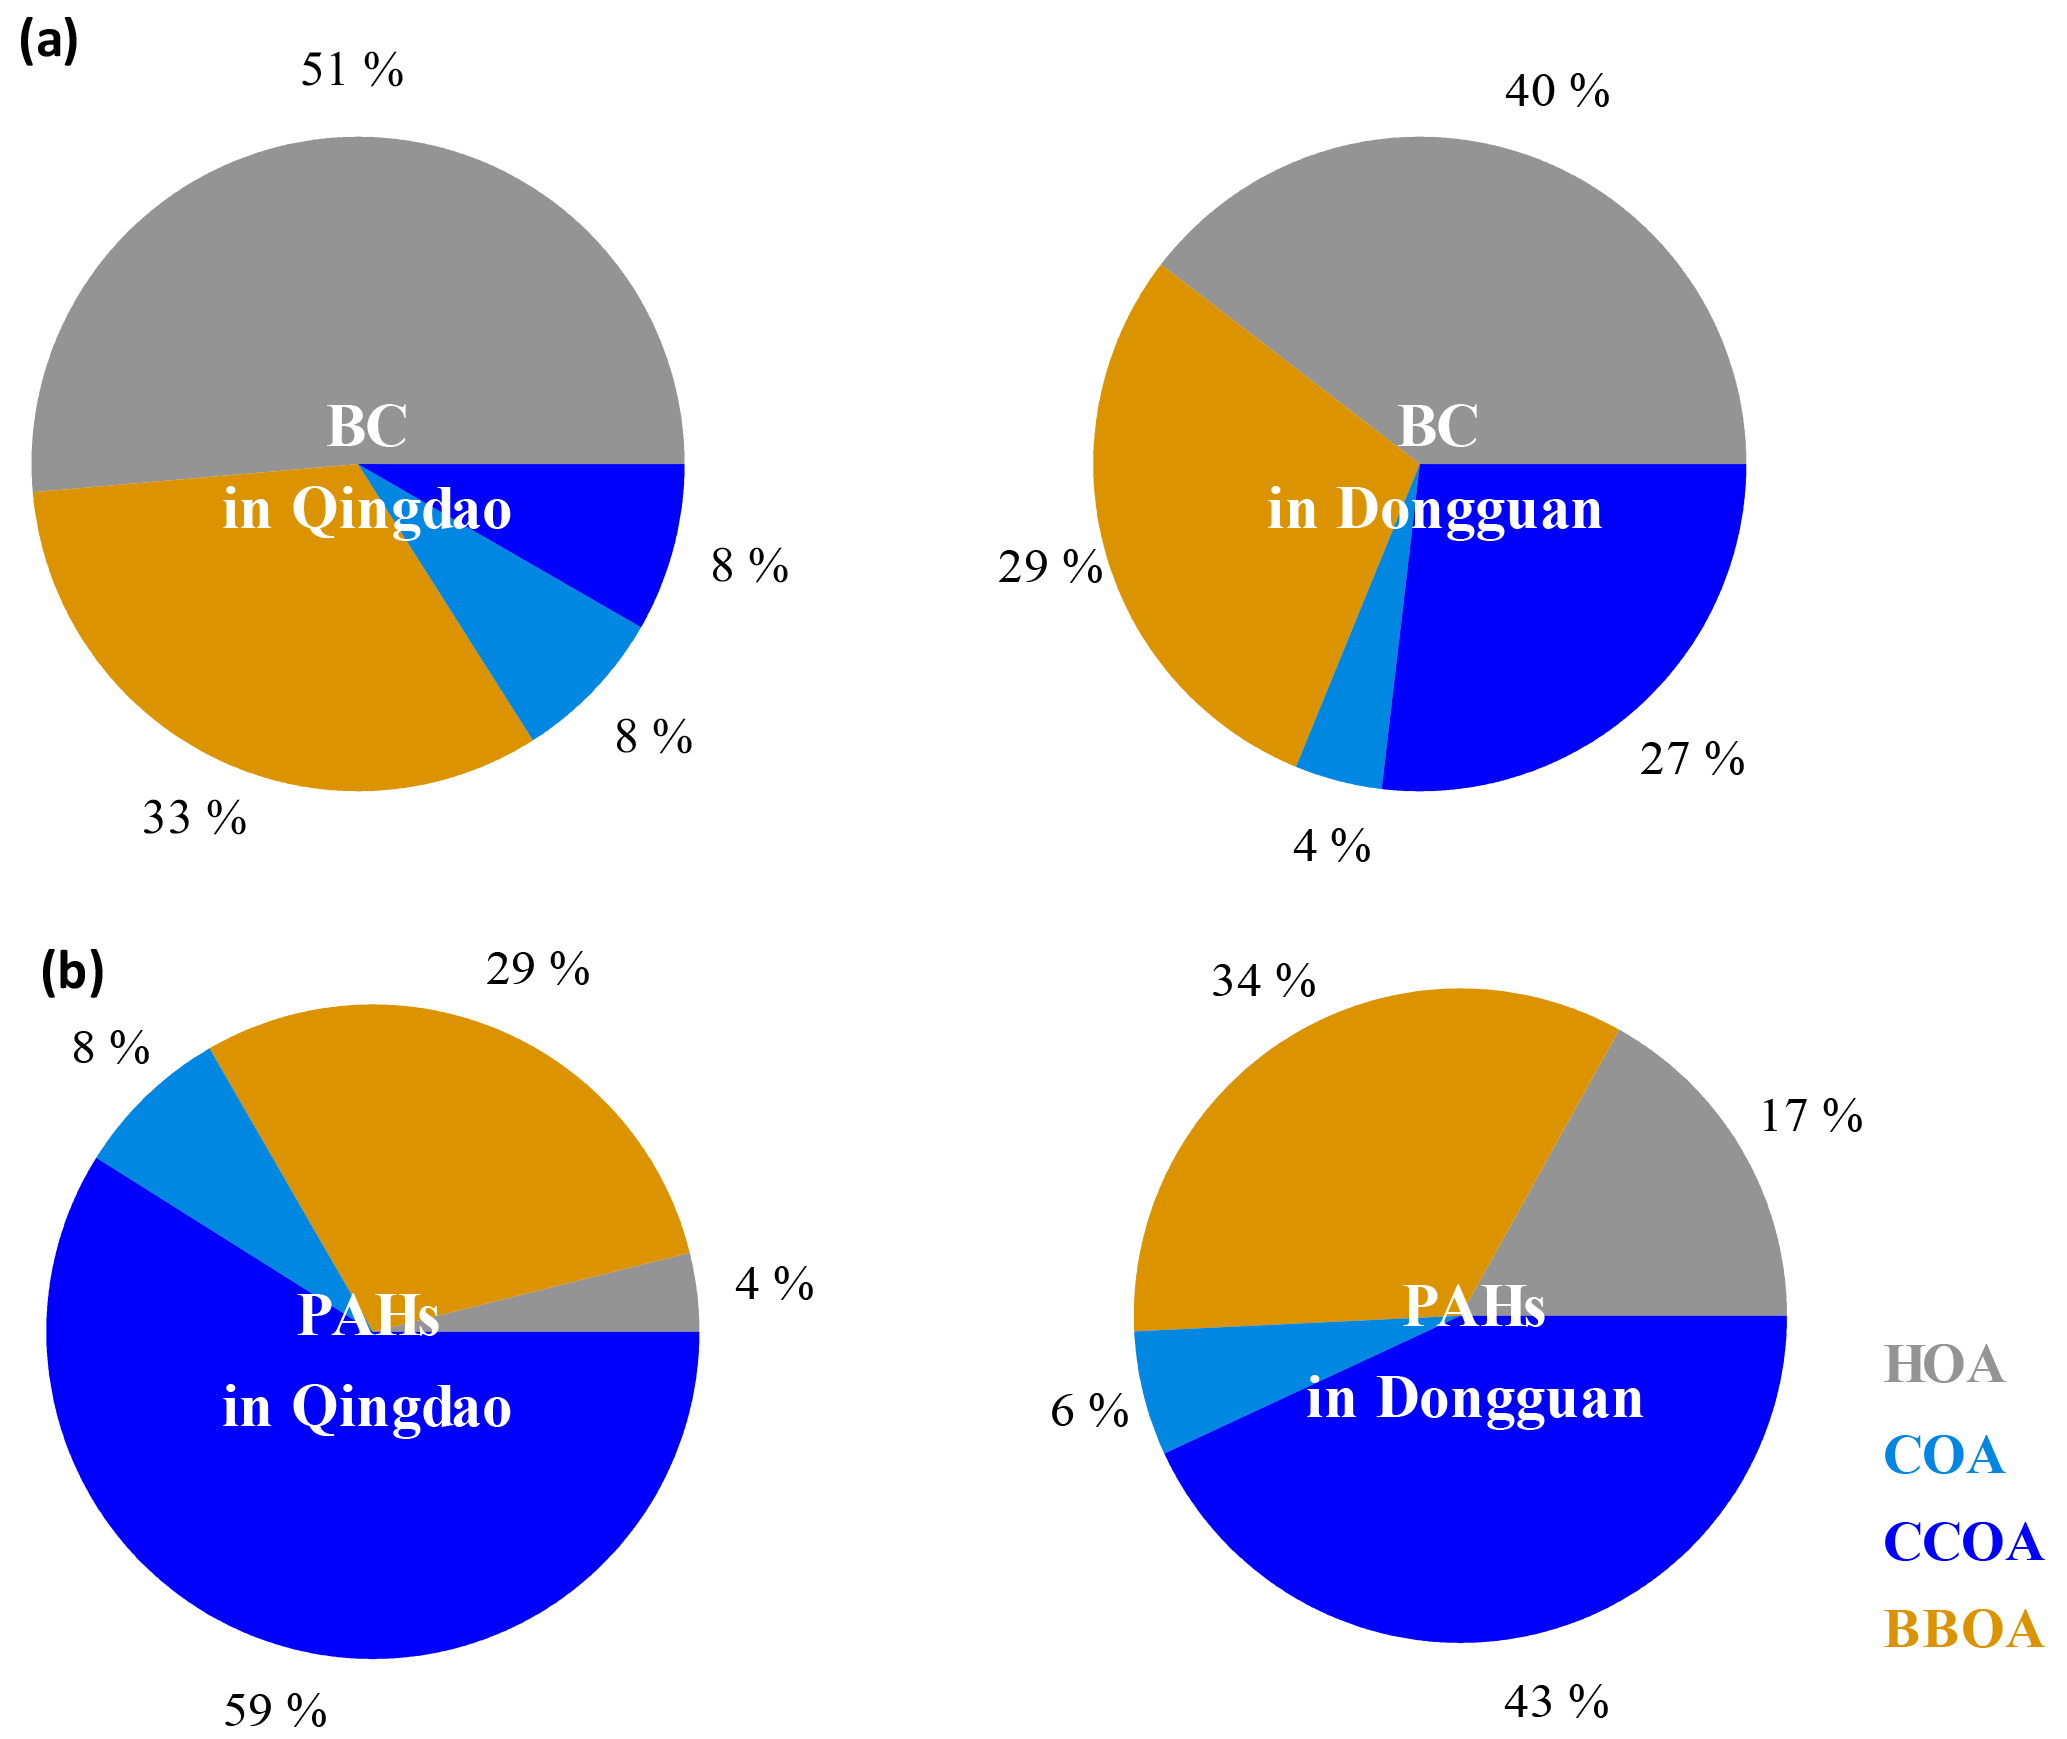
Figure 4(a) Average contributions of POA factors to BC; (b) average contributions of POA factors to PAHs.
In this study, we used PMF to interpret the organic aerosol sources at two Chinese urban sites in winter, and found that PMF did not work properly (i.e., it did not allow for the separation of several primary sources of OAs). Therefore, we adopted the ME-2 approach, which yields more reliable solutions. Technically, there are three important steps when using the ME-2 method to interpret the sources of OAs. The first step is to investigate the mixed and unidentified factors that are constrained according to issues in the unconstrained PMF results. Generally, we constrained one or more POA factors (i.e., HOA, COA, BBOA and CCOA) for the polluted urban sites. The second step is to search for a reasonable anchor profile for each constrained factor. Two approaches were used: searching for anchor profiles via an increase in the number of unconstrained PMF factors from the same dataset and using mass profiles derived from other similar studies. The third step is to choose the criteria for obtaining the optimal results. The choice of a reasonable range of O ∕ C ratios may represent a good criterion for HR-OA apportionment since the O ∕ C ratio is a significant and distinctive characteristic for different OA factors. In addition, correlations between the resolved OA factors and their tracers were also suggested.
Data are available by contacting the corresponding author at huangxf@pku.edu.cn.
The supplement related to this article is available online at: https://doi.org/10.5194/amt-11-1049-2018-supplement.
The authors declare that they have no conflict of interest.
This work was supported by the National Natural Science Foundation of China
(91744202, 41622304) and the Science and Technology Plan of Shenzhen
Municipality (JCYJ20170412150626172, JCYJ20170306164713148).
Edited by: Mingjin Tang
Reviewed by: two anonymous referees
Aiken, A. C., Salcedo, D., Cubison, M. J., Huffman, J. A., DeCarlo, P. F., Ulbrich, I. M., Docherty, K. S., Sueper, D., Kimmel, J. R., Worsnop, D. R., Trimborn, A., Northway, M., Stone, E. A., Schauer, J. J., Volkamer, R. M., Fortner, E., de Foy, B., Wang, J., Laskin, A., Shutthanandan, V., Zheng, J., Zhang, R., Gaffney, J., Marley, N. A., Paredes-Miranda, G., Arnott, W. P., Molina, L. T., Sosa, G., and Jimenez, J. L.: Mexico City aerosol analysis during MILAGRO using high resolution aerosol mass spectrometry at the urban supersite (T0) – Part 1: Fine particle composition and organic source apportionment, Atmos. Chem. Phys., 9, 6633–6653, https://doi.org/10.5194/acp-9-6633-2009, 2009.
Alfarra, M. R., Prevot, A. S. H., Szidat, S., Sandradewi, J., Weimer, S., Lanz, V. A., Schreiber, D., Mohr, M., and Baltensperger, U.: Identification of the Mass Spectral Signature of Organic Aerosols from Wood Burning Emissions, Environ Sci. Technol., 41, 5770–5777, https://doi.org/10.1021/es062289b, 2007.
Allan, J. D., Delia, A. E., Coe, H., Bower, K. N., Alfarra, M. R., Jimenez, J. L., Middlebrook, A. M., Drewnick, F., Onasch, T. B., Canagaratna, M. R., Jayne, J. T., and Worsnop, D. R.: A generalised method for the extraction of chemically resolved mass spectra from Aerodyne aerosol mass spectrometer data, J. Aerosol Sci., 35, 909–922, https://doi.org/10.1016/j.jaerosci.2004.02.007, 2004.
Bougiatioti, A., Stavroulas, I., Kostenidou, E., Zarmpas, P., Theodosi, C., Kouvarakis, G., Canonaco, F., Prévôt, A. S. H., Nenes, A., Pandis, S. N., and Mihalopoulos, N.: Processing of biomass-burning aerosol in the eastern Mediterranean during summertime, Atmos. Chem. Phys., 14, 4793–4807, https://doi.org/10.5194/acp-14-4793-2014, 2014.
Bruns, E. A., Krapf, M., Orasche, J., Huang, Y., Zimmermann, R., Drinovec, L., Mocnik, G., El-Haddad, I., Slowik, J. G., Dommen, J., Baltensperger, U., and Prévôt, A. S. H.: Characterization of primary and secondary wood combustion products generated under different burner loads, Atmos. Chem. Phys., 15, 2825–2841, https://doi.org/10.5194/acp-15-2825-2015, 2015.
Canagaratna, M. R., Jayne, J. T., Jimenez, J. L., Allan, J. D., Alfarra, M. R., Zhang, Q., Onasch, T. B., Drewnick, F., Coe, H., Middlebrook, A., Delia, A., Williams, L. R., Trimborn, A. M., Northway, M. J., DeCarlo, P. F., Kolb, C. E., Davidovits, P., and Worsnop, D. R.: Chemical and microphysical characterization of ambient aerosols with the aerodyne aerosol mass spectrometer, Mass Spectrom. Rev., 26, 185–222, https://doi.org/10.1002/mas.20115, 2007.
Canagaratna, M. R., Jimenez, J. L., Kroll, J. H., Chen, Q., Kessler, S. H., Massoli, P., Hildebrandt Ruiz, L., Fortner, E., Williams, L. R., Wilson, K. R., Surratt, J. D., Donahue, N. M., Jayne, J. T., and Worsnop, D. R.: Elemental ratio measurements of organic compounds using aerosol mass spectrometry: characterization, improved calibration, and implications, Atmos. Chem. Phys., 15, 253–272, https://doi.org/10.5194/acp-15-253-2015, 2015.
Canonaco, F., Crippa, M., Slowik, J. G., Baltensperger, U., and Prévôt, A. S. H.: SoFi, an IGOR-based interface for the efficient use of the generalized multilinear engine (ME-2) for the source apportionment: ME-2 application to aerosol mass spectrometer data, Atmos. Meas. Tech., 6, 3649–3661, https://doi.org/10.5194/amt-6-3649-2013, 2013.
Crippa, M., DeCarlo, P. F., Slowik, J. G., Mohr, C., Heringa, M. F., Chirico, R., Poulain, L., Freutel, F., Sciare, J., Cozic, J., Di Marco, C. F., Elsasser, M., Nicolas, J. B., Marchand, N., Abidi, E., Wiedensohler, A., Drewnick, F., Schneider, J., Borrmann, S., Nemitz, E., Zimmermann, R., Jaffrezo, J.-L., Prévôt, A. S. H., and Baltensperger, U.: Wintertime aerosol chemical composition and source apportionment of the organic fraction in the metropolitan area of Paris, Atmos. Chem. Phys., 13, 961–981, https://doi.org/10.5194/acp-13-961-2013, 2013.
Crippa, M., Canonaco, F., Lanz, V. A., Äijälä, M., Allan, J. D., Carbone, S., Capes, G., Ceburnis, D., Dall'Osto, M., Day, D. A., DeCarlo, P. F., Ehn, M., Eriksson, A., Freney, E., Hildebrandt Ruiz, L., Hillamo, R., Jimenez, J. L., Junninen, H., Kiendler-Scharr, A., Kortelainen, A.-M., Kulmala, M., Laaksonen, A., Mensah, A. A., Mohr, C., Nemitz, E., O'Dowd, C., Ovadnevaite, J., Pandis, S. N., Petäjä, T., Poulain, L., Saarikoski, S., Sellegri, K., Swietlicki, E., Tiitta, P., Worsnop, D. R., Baltensperger, U., and Prévôt, A. S. H.: Organic aerosol components derived from 25 AMS data sets across Europe using a consistent ME-2 based source apportionment approach, Atmos. Chem. Phys., 14, 6159–6176, https://doi.org/10.5194/acp-14-6159-2014, 2014.
Docherty, K. S., Stone, E. A., Ulbrich, I. M., DeCarlo, P. F., Snyder, D. C., Schauer, J. J., Peltier, R. E., Weber, R. J., Murphy, S. M., Seinfeld, J. H., Grover, B. D., Eatough, D. J., and Jimenez, J. L.: Apportionment of Primary and Secondary Organic Aerosols in Southern California during the 2005 Study of Organic Aerosols in Riverside (SOAR-1), Environ Sci. Technol., 42, 7655–7662, https://doi.org/10.1021/es8008166, 2008.
Drewnick, F., Hings, S. S., DeCarlo, P., Jayne, J. T., Gonin, M., Fuhrer, K., Weimer, S., Jimenez, J. L., Demerjian, K. L., Borrmann, S., and Worsnop, D. R.: A New Time-of-Flight Aerosol Mass Spectrometer (TOF-AMS) – Instrument Description and First Field Deployment, Aerosol Sci. Tech., 39, 637–658, https://doi.org/10.1080/02786820500182040, 2005.
Elser, M., Huang, R.-J., Wolf, R., Slowik, J. G., Wang, Q., Canonaco, F., Li, G., Bozzetti, C., Daellenbach, K. R., Huang, Y., Zhang, R., Li, Z., Cao, J., Baltensperger, U., El-Haddad, I., and Prévôt, A. S. H.: New insights into PM2.5 chemical composition and sources in two major cities in China during extreme haze events using aerosol mass spectrometry, Atmos. Chem. Phys., 16, 3207–3225, https://doi.org/10.5194/acp-16-3207-2016, 2016.
Fröhlich, R., Crenn, V., Setyan, A., Belis, C. A., Canonaco, F., Favez, O., Riffault, V., Slowik, J. G., Aas, W., Aijälä, M., Alastuey, A., Artiñano, B., Bonnaire, N., Bozzetti, C., Bressi, M., Carbone, C., Coz, E., Croteau, P. L., Cubison, M. J., Esser-Gietl, J. K., Green, D. C., Gros, V., Heikkinen, L., Herrmann, H., Jayne, J. T., Lunder, C. R., Minguillón, M. C., Mocnik, G., O'Dowd, C. D., Ovadnevaite, J., Petralia, E., Poulain, L., Priestman, M., Ripoll, A., Sarda-Estève, R., Wiedensohler, A., Baltensperger, U., Sciare, J., and Prévôt, A. S. H.: ACTRIS ACSM intercomparison – Part 2: Intercomparison of ME-2 organic source apportionment results from 15 individual, co-located aerosol mass spectrometers, Atmos. Meas. Tech., 8, 2555–2576, https://doi.org/10.5194/amt-8-2555-2015, 2015.
Ge, X., Setyan, A., Sun, Y., and Zhang, Q.: Primary and secondary organic aerosols in Fresno, California during wintertime: Results from high resolution aerosol mass spectrometry, J. Geophys. Res.-Atmos., 117, 161–169, https://doi.org/10.1029/2012JD018026, 2012.
Hallquist, M., Wenger, J. C., Baltensperger, U., Rudich, Y., Simpson, D., Claeys, M., Dommen, J., Donahue, N. M., George, C., Goldstein, A. H., Hamilton, J. F., Herrmann, H., Hoffmann, T., Iinuma, Y., Jang, M., Jenkin, M. E., Jimenez, J. L., Kiendler-Scharr, A., Maenhaut, W., McFiggans, G., Mentel, Th. F., Monod, A., Prévôt, A. S. H., Seinfeld, J. H., Surratt, J. D., Szmigielski, R., and Wildt, J.: The formation, properties and impact of secondary organic aerosol: current and emerging issues, Atmos. Chem. Phys., 9, 5155–5236, https://doi.org/10.5194/acp-9-5155-2009, 2009.
He, L.-Y., Lin, Y., Huang, X.-F., Guo, S., Xue, L., Su, Q., Hu, M., Luan, S.-J., and Zhang, Y.-H.: Characterization of high-resolution aerosol mass spectra of primary organic aerosol emissions from Chinese cooking and biomass burning, Atmos. Chem. Phys., 10, 11535–11543, https://doi.org/10.5194/acp-10-11535-2010, 2010.
Hofzumahaus, A., Rohrer, F., Lu, K., Bohn, B., Brauers, T., Chang, C.-C., Fuchs, H., Holland, F., Kita, K., Kondo, Y., Li, X., Lou, S., Shao, M., Zeng, L., Wahner, A., and Zhang, Y.: Amplified Trace Gas Removal in the Troposphere, Science, 324, 1702, https://doi.org/10.1126/science.1164566, 2009.
Hu, W. W., Hu, M., Yuan, B., Jimenez, J. L., Tang, Q., Peng, J. F., Hu, W., Shao, M., Wang, M., Zeng, L. M., Wu, Y. S., Gong, Z. H., Huang, X. F., and He, L. Y.: Insights on organic aerosol aging and the influence of coal combustion at a regional receptor site of central eastern China, Atmos. Chem. Phys., 13, 10095–10112, https://doi.org/10.5194/acp-13-10095-2013, 2013.
Hu, W. W., Hu, M., Hu, W., Jimenez, J. L., Yuan, B., Chen, W., Wang, M., Wu, Y., Chen, C., Wang, Z., Peng, J., Zeng, L., and Shao, M.: Chemical composition, sources, and aging process of submicron aerosols in Beijing: Contrast between summer and winter, J. Geophys. Res.-Atmos., 121, 1955–1977, https://doi.org/10.1002/2015JD024020, 2016.
Huang, R. J., Zhang, Y., Bozzetti, C., Ho, K. F., Cao, J. J., Han, Y., Daellenbach, K. R., Slowik, J. G., Platt, S. M., Canonaco, F., Zotter, P., Wolf, R., Pieber, S. M., Bruns, E. A., Crippa, M., Ciarelli, G., Piazzalunga, A., Schwikowski, M., Abbaszade, G., Schnelle-Kreis, J., Zimmermann, R., An, Z., Szidat, S., Baltensperger, U., El Haddad, I., and Prévôt, A. S. H.: High secondary aerosol contribution to particulate pollution during haze events in China, Nature, 514, 218–222, https://doi.org/10.1038/nature13774, 2015.
Huang, X.-F., He, L.-Y., Hu, M., Canagaratna, M. R., Sun, Y., Zhang, Q., Zhu, T., Xue, L., Zeng, L.-W., Liu, X.-G., Zhang, Y.-H., Jayne, J. T., Ng, N. L., and Worsnop, D. R.: Highly time-resolved chemical characterization of atmospheric submicron particles during 2008 Beijing Olympic Games using an Aerodyne High-Resolution Aerosol Mass Spectrometer, Atmos. Chem. Phys., 10, 8933–8945, https://doi.org/10.5194/acp-10-8933-2010, 2010.
Huang, X.-F., He, L.-Y., Xue, L., Sun, T.-L., Zeng, L.-W., Gong, Z.-H., Hu, M., and Zhu, T.: Highly time-resolved chemical characterization of atmospheric fine particles during 2010 Shanghai World Expo, Atmos. Chem. Phys., 12, 4897–4907, https://doi.org/10.5194/acp-12-4897-2012, 2012.
IPCC: Climate Change 2013: The Physical Science Basis. Contribution of Working Group I to the Fifth Assessment Report of the Intergovernmental Panel on Climate Change, edited by: Stocker, T., Plattner, G. K., Tignor, M., Allen, S., Boschung, J., Nauels, A., Xia, Y., Bex, V., and Midgley, P., Cambridge University Press, Cambridge, UK and New York, NY, USA, 1535 pp., 2013.
Jayne, J. T., Leard, D. C., Zhang, X., Davidovits, P., Smith, K. A., Kolb, C. E., and Worsnop, D. R.: Development of an Aerosol Mass Spectrometer for Size and Composition Analysis of Submicron Particles, Aerosol Sci. Tech., 33, 49–70, https://doi.org/10.1080/027868200410840, 2000.
Jimenez, J. L., Canagaratna, M. R., Donahue, N. M., Prevot, A. S. H., Zhang, Q., Kroll, J. H., DeCarlo, P. F., Allan, J. D., Coe, H., Ng, N. L., Aiken, A. C., Docherty, K. S., Ulbrich, I. M., Grieshop, A. P., Robinson, A. L., Duplissy, J., Smith, J. D., Wilson, K. R., Lanz, V. A., Hueglin, C., Sun, Y. L., Tian, J., Laaksonen, A., Raatikainen, T., Rautiainen, J., Vaattovaara, P., Ehn, M., Kulmala, M., Tomlinson, J. M., Collins, D. R., Cubison, M. J., Dunlea, J., Huffman, J. A., Onasch, T. B., Alfarra, M. R., Williams, P. I., Bower, K., Kondo, Y., Schneider, J., Drewnick, F., Borrmann, S., Weimer, S., Demerjian, K., Salcedo, D., Cottrell, L., Griffin, R., Takami, A., Miyoshi, T., Hatakeyama, S., Shimono, A., Sun, J. Y., Zhang, Y. M., Dzepina, K., Kimmel, J. R., Sueper, D., Jayne, J. T., Herndon, S. C., Trimborn, A. M., Williams, L. R., Wood, E. C., Middlebrook, A. M., Kolb, C. E., Baltensperger, U., and Worsnop, D. R.: Evolution of Organic Aerosols in the Atmosphere, Science, 326, 1525–1529, https://doi.org/10.1126/science.1180353, 2009.
Kondo, Y., Matsui, H., Moteki, N., Sahu, L., Takegawa, N., Kajino, M., Zhao, Y., Cubison, M. J., Jimenez, J. L., Vay, S., Diskin, G. S., Anderson, B., Wisthaler, A., Mikoviny, T., Fuelberg, H. E., Blake, D. R., Huey, G., Weinheimer, A. J., Knapp, D. J., and Brune, W. H.: Emissions of black carbon, organic, and inorganic aerosols from biomass burning in North America and Asia in 2008, J. Geophys. Res.-Atmos., 116, 353–366, https://doi.org/10.1029/2010JD015152, 2011.
Lanz, V. A., Alfarra, M. R., Baltensperger, U., Buchmann, B., Hueglin, C., and Prévôt, A. S. H.: Source apportionment of submicron organic aerosols at an urban site by factor analytical modelling of aerosol mass spectra, Atmos. Chem. Phys., 7, 1503–1522, https://doi.org/10.5194/acp-7-1503-2007, 2007.
Lanz, V. A., Prévôt, A. S. H., Alfarra, M. R., Weimer, S., Mohr, C., DeCarlo, P. F., Gianini, M. F. D., Hueglin, C., Schneider, J., Favez, O., D'Anna, B., George, C., and Baltensperger, U.: Characterization of aerosol chemical composition with aerosol mass spectrometry in Central Europe: an overview, Atmos. Chem. Phys., 10, 10453–10471, https://doi.org/10.5194/acp-10-10453-2010, 2010.
Matthew, B. M., Middlebrook, A. M., and Onasch, T. B.: Collection Efficiencies in an Aerodyne Aerosol Mass Spectrometer as a Function of Particle Phase for Laboratory Generated Aerosols, Aerosol Sci. Tech., 42, 884–898, https://doi.org/10.1080/02786820802356797, 2008.
Middlebrook, A. M., Bahreini, R., Jimenez, J. L., and Canagaratna, M. R.: Evaluation of Composition-Dependent Collection Efficiencies for the Aerodyne Aerosol Mass Spectrometer using Field Data, Aerosol Sci. Tech., 46, 258–271, https://doi.org/10.1080/02786826.2011.620041, 2012.
Mohr, C., DeCarlo, P. F., Heringa, M. F., Chirico, R., Slowik, J. G., Richter, R., Reche, C., Alastuey, A., Querol, X., Seco, R., Peñuelas, J., Jiménez, J. L., Crippa, M., Zimmermann, R., Baltensperger, U., and Prévôt, A. S. H.: Identification and quantification of organic aerosol from cooking and other sources in Barcelona using aerosol mass spectrometer data, Atmos. Chem. Phys., 12, 1649–1665, https://doi.org/10.5194/acp-12-1649-2012, 2012.
Ng, N. L., Canagaratna, M. R., Jimenez, J. L., Zhang, Q., Ulbrich, I. M., and Worsnop, D. R.: Real-Time Methods for Estimating Organic Component Mass Concentrations from Aerosol Mass Spectrometer Data, Environ Sci. Technol., 45, 910–916, https://doi.org/10.1021/es102951k, 2011.
Paatero, P.: The Multilinear Engine: A Table-Driven, Least Squares Program for Solving Multilinear Problems, including the n-Way Parallel Factor Analysis Model, J. Comput. Graph. Stat., 8, 854–888, https://doi.org/10.2307/1390831, 1999.
Paatero, P. and Tapper, U.: Positive matrix factorization: A non-negative factor model with optimal utilization of error estimates of data values, Environmetrics, 5, 111–126, https://doi.org/10.1002/env.3170050203,1994.
Pope, C. A. and Dockery, D. W.: Health Effects of Fine Particulate Air Pollution: Lines that Connect, J. Air Waste Manage., 56, 709–742, https://doi.org/10.1080/10473289.2006.10464485, 2006.
Pratt, K. A. and Prather, K. A.: Mass spectrometry of atmospheric aerosols – Recent developments and applications. Part II: On-line mass spectrometry techniques, Mass Spectrom. Rev., 31, 17–48, https://doi.org/10.1002/mas.20330, 2012.
Qin, Y. M., Tan, H. B., Li, Y. J., Schurman, M. I., Li, F., Canonaco, F., Prévôt, A. S. H., and Chan, C. K.: Impacts of traffic emissions on atmospheric particulate nitrate and organics at a downwind site on the periphery of Guangzhou, China, Atmos. Chem. Phys., 17, 10245–10258, https://doi.org/10.5194/acp-17-10245-2017, 2017.
Reddy, C. M., Pearson, A., Xu, L., McNichol, A. P., Benner, B. A., Wise, S. A., Klouda, G. A., Currie, L. A., and Eglinton, T. I.: Radiocarbon as a Tool To Apportion the Sources of Polycyclic Aromatic Hydrocarbons and Black Carbon in Environmental Samples, Environ Sci. Technol., 36, 1774–1782, https://doi.org/10.1021/es011343f, 2002.
Reyes-Villegas, E., Green, D. C., Priestman, M., Canonaco, F., Coe, H., Prévôt, A. S. H., and Allan, J. D.: Organic aerosol source apportionment in London 2013 with ME-2: exploring the solution space with annual and seasonal analysis, Atmos. Chem. Phys., 16, 15545–15559, https://doi.org/10.5194/acp-16-15545-2016, 2016.
Schmidt, M. W. I. and Noack, A. G.: Black carbon in soils and sediments: Analysis, distribution, implications, and current challenges, Global Biogeochem. Cy., 14, 777–793, https://doi.org/10.1029/1999GB001208, 2000.
Schwarz, J. P., Gao, R. S., Spackman, J. R., Watts, L. A., Thomson, D. S., Fahey, D. W., Ryerson, T. B., Peischl, J., Holloway, J. S., Trainer, M., Frost, G. J., Baynard, T., Lack, D. A., de Gouw, J. A., Warneke, C., and Del Negro, L. A.: Measurement of the mixing state, mass, and optical size of individual black carbon particles in urban and biomass burning emissions, Geophys Res. Lett., 35, L13810, https://doi.org/10.1029/2008GL033968, 2008.
Sun, Y., Du, W., Fu, P., Wang, Q., Li, J., Ge, X., Zhang, Q., Zhu, C., Ren, L., Xu, W., Zhao, J., Han, T., Worsnop, D. R., and Wang, Z.: Primary and secondary aerosols in Beijing in winter: sources, variations and processes, Atmos. Chem. Phys., 16, 8309–8329, https://doi.org/10.5194/acp-16-8309-2016, 2016.
Tian, H., Cheng, K., Wang, Y., Zhao, D., Lu, L., Jia, W., and Hao, J.: Temporal and spatial variation characteristics of atmospheric emissions of Cd, Cr, and Pb from coal in China, Atmos. Environ., 50, 157–163, https://doi.org/10.1016/j.atmosenv.2011.12.045, 2012.
Ulbrich, I. M., Canagaratna, M. R., Zhang, Q., Worsnop, D. R., and Jimenez, J. L.: Interpretation of organic components from Positive Matrix Factorization of aerosol mass spectrometric data, Atmos. Chem. Phys., 9, 2891–2918, https://doi.org/10.5194/acp-9-2891-2009, 2009.
Wang, X., Williams, B. J., Wang, X., Tang, Y., Huang, Y., Kong, L., Yang, X., and Biswas, P.: Characterization of organic aerosol produced during pulverized coal combustion in a drop tube furnace, Atmos. Chem. Phys., 13, 10919–10932, https://doi.org/10.5194/acp-13-10919-2013, 2013.
White, H.: Black carbon in the environment, J. Wiley, New York, USA, 1985.
Xu, J., Zhang, Q., Chen, M., Ge, X., Ren, J., and Qin, D.: Chemical composition, sources, and processes of urban aerosols during summertime in northwest China: insights from high-resolution aerosol mass spectrometry, Atmos. Chem. Phys., 14, 12593–12611, https://doi.org/10.5194/acp-14-12593-2014, 2014.
Xu, L., Suresh, S., Guo, H., Weber, R. J., and Ng, N. L.: Aerosol characterization over the southeastern United States using high-resolution aerosol mass spectrometry: spatial and seasonal variation of aerosol composition and sources with a focus on organic nitrates, Atmos. Chem. Phys., 15, 7307–7336, https://doi.org/10.5194/acp-15-7307-2015, 2015.
Zhang, Q., Jimenez, J. L., Canagaratna, M. R., Allan, J. D., Coe, H., Ulbrich, I., Alfarra, M. R., Takami, A., Middlebrook, A. M., Sun, Y. L., Dzepina, K., Dunlea, E., Docherty, K., DeCarlo, P. F., Salcedo, D., Onasch, T., Jayne, J. T., Miyoshi, T., Shimono, A., Hatakeyama, S., Takegawa, N., Kondo, Y., Schneider, J., Drewnick, F., Borrmann, S., Weimer, S., Demerjian, K., Williams, P., Bower, K., Bahreini, R., Cottrell, L., Griffin, R. J., Rautiainen, J., Sun, J. Y., Zhang, Y. M., and Worsnop, D. R.: Ubiquity and dominance of oxygenated species in organic aerosols in anthropogenically-influenced Northern Hemisphere midlatitudes, Geophys. Res. Lett., 34, L13801, https://doi.org/10.1029/2007GL029979, 2007.
Zhang, Q., Jimenez, J. L., Canagaratna, M. R., Ulbrich, I. M., Ng, N. L., Worsnop, D. R., and Sun, Y.: Understanding atmospheric organic aerosols via factor analysis of aerosol mass spectrometry: a review, Anal. Bioanal. Chem., 401, 3045–3067, https://doi.org/10.1007/s00216-011-5355-y, 2011.
Zhang, Y., Schauer, J. J., Zhang, Y., Zeng, L., Wei, Y., Liu, Y., and Shao, M.: Characteristics of Particulate Carbon Emissions from Real-World Chinese Coal Combustion, Environ Sci. Technol., 42, 5068–5073, https://doi.org/10.1021/es7022576, 2008.
Zheng, J., Hu, M., Du, Z., Shang, D., Gong, Z., Qin, Y., Fang, J., Gu, F., Li, M., Peng, J., Li, J., Zhang, Y., Huang, X., He, L., Wu, Y., and Guo, S.: Influence of biomass burning from South Asia at a high-altitude mountain receptor site in China, Atmos. Chem. Phys., 17, 6853–6864, https://doi.org/10.5194/acp-17-6853-2017, 2017.
Zhou, S., Collier, S., Jaffe, D. A., Briggs, N. L., Hee, J., Sedlacek III, A. J., Kleinman, L., Onasch, T. B., and Zhang, Q.: Regional influence of wildfires on aerosol chemistry in the western US and insights into atmospheric aging of biomass burning organic aerosol, Atmos. Chem. Phys., 17, 2477–2493, https://doi.org/10.5194/acp-17-2477-2017, 2017.
less meaningful or mixed factorsproblems for organic aerosol using the traditional method (PMF).