the Creative Commons Attribution 4.0 License.
the Creative Commons Attribution 4.0 License.
 | 12 Jan 2018
Intercomparison of AIRS and HIRDLS stratospheric gravity wave observations
Manfred Ern
Lars Hoffmann
Quang Thai Trinh
M. Joan Alexander
We investigate stratospheric gravity wave observations by the Atmospheric InfraRed Sounder (AIRS) aboard NASA's Aqua satellite and the High Resolution Dynamics Limb Sounder (HIRDLS) aboard NASA's Aura satellite. AIRS operational temperature retrievals are typically not used for studies of gravity waves, because their vertical and horizontal resolution is rather limited. This study uses data of a high-resolution retrieval which provides stratospheric temperature profiles for each individual satellite footprint. Therefore the horizontal sampling of the high-resolution retrieval is 9 times better than that of the operational retrieval. HIRDLS provides 2-D spectral information of observed gravity waves in terms of along-track and vertical wavelengths. AIRS as a nadir sounder is more sensitive to short-horizontal-wavelength gravity waves, and HIRDLS as a limb sounder is more sensitive to short-vertical-wavelength gravity waves. Therefore HIRDLS is ideally suited to complement AIRS observations. A calculated momentum flux factor indicates that the waves seen by AIRS contribute significantly to momentum flux, even if the AIRS temperature variance may be small compared to HIRDLS. The stratospheric wave structures observed by AIRS and HIRDLS often agree very well. Case studies of a mountain wave event and a non-orographic wave event demonstrate that the observed phase structures of AIRS and HIRDLS are also similar. AIRS has a coarser vertical resolution, which results in an attenuation of the amplitude and coarser vertical wavelengths than for HIRDLS. However, AIRS has a much higher horizontal resolution, and the propagation direction of the waves can be clearly identified in geographical maps. The horizontal orientation of the phase fronts can be deduced from AIRS 3-D temperature fields. This is a restricting factor for gravity wave analyses of limb measurements. Additionally, temperature variances with respect to stratospheric gravity wave activity are compared on a statistical basis. The complete HIRDLS measurement period from January 2005 to March 2008 is covered. The seasonal and latitudinal distributions of gravity wave activity as observed by AIRS and HIRDLS agree well. A strong annual cycle at mid- and high latitudes is found in time series of gravity wave variances at 42 km, which has its maxima during wintertime and its minima during summertime. The variability is largest during austral wintertime at 60∘ S. Variations in the zonal winds at 2.5 hPa are associated with large variability in gravity wave variances. Altogether, gravity wave variances of AIRS and HIRDLS are complementary to each other. Large parts of the gravity wave spectrum are covered by joint observations. This opens up fascinating vistas for future gravity wave research.
- Article
(21483 KB) - Full-text XML
- BibTeX
- EndNote


By driving the general circulation, the thermal structure and middle-atmosphere chemistry are influenced significantly by atmospheric gravity waves (Lindzen, 1973; Holton, 1982, 1983; McLandress, 1998; Fritts and Alexander, 2003; Eyring et al., 2007). The generation and propagation of gravity waves depend on the sources and atmospheric conditions. Gravity waves are primarily generated due to orography, like mountain waves (Smith, 1985; Durran and Klemp, 1987; Nastrom and Fritts, 1992; Dörnbrack et al., 1999), and as a result of deep convection (Pfister et al., 1986; Tsuda et al., 1994; Alexander and Pfister, 1995; Vincent and Alexander, 2000). Additionally, gravity waves originate due to body forcing, which comes along with localized wave dissipation, and wave–wave interaction (Fritts and Alexander, 2003; Vadas et al., 2003) and due to wind shear, adjustment of unbalanced flows near jet streams and frontal systems (Fritts and Nastrom, 1992; Wu and Zhang, 2004; Plougonven et al., 2003). Gravity wave source processes can emit a broad spectrum of waves. For example, it is known that deep convection excites a broad spectrum of gravity wave phase speeds (e.g., Beres et al., 2004), as well as a broad range of gravity wave vertical and, in particular, horizontal wavelengths. There are indications that the horizontal scales range from several tens to several hundreds of kilometers (e.g., Choi et al., 2012; Trinh et al., 2016; Kalisch et al., 2016; Ern et al., 2017). Similarly, gravity waves emitted from jets and fronts cover horizontal wavelengths from less than 100 km to more than 500 km (e.g., Plougonven and Zhang, 2014, and references therein), and the horizontal scales of mountain waves cover a range of less than 10 km to several hundred kilometers (e.g., Fritts et al., 2016; Smith et al., 2016; Ehard et al., 2017, and references therein). Most global atmospheric models use gravity wave parameterizations because gravity waves are small-scale phenomena and cannot be resolved or are only poorly resolved in the models. Satellite observations are well suited to validate gravity wave parametrization schemes of general circulation models. In addition, characteristics of gravity waves can be investigated in global studies with satellite observations (Geller et al., 2013).
Fetzer and Gille (1994) were the first to demonstrate that satellite remote sensors can observe gravity waves. The number of instruments with sufficient spatial resolution to observe gravity waves has increased over the last years. An important limitation of satellite observations is that each instrument type can only detect a certain part of the full vertical and horizontal wave number spectrum of gravity waves. Wu et al. (2006), Preusse et al. (2008), and Alexander et al. (2010) give overviews and comparisons of different observation methods and the range of detectable vertical and horizontal wavelengths. Advantages and disadvantages of limb measurements vary in contrast to nadir instruments. Limb instruments have a good vertical resolution, which leads to high sensitivity to short-vertical-wavelength waves. However, the sensitivity for short horizontal wavelengths is reduced due to the limited horizontal resolution of current limb sounders (Preusse et al., 2009b). Furthermore, a single measurement track cannot be used to identify the horizontal propagation direction of the waves. Nadir instruments observe only gravity waves with long vertical wavelengths, but the horizontal resolution is better than that of limb instruments. Given the sensitivity limitations of different atmospheric sounding techniques from satellite, it is evident that a single technique is not capable of covering the whole spectral range of atmospheric gravity waves. As has been discussed by, for example, Preusse et al. (2008) and Alexander et al. (2010), combination of different measurement techniques can help to obtain a more complete picture of the whole spectrum of gravity waves. Still, the range of very short horizontal wavelengths (< 30 km) and vertical wavelengths around 5–10 km is not covered by these standard satellite measurement techniques and requires other techniques such as radiosondes or airborne observations (e.g., Fritts et al., 2016).
For studies of atmospheric gravity waves, Atmospheric InfraRed Sounder (AIRS) radiance measurements are suitable. The long-term time series of AIRS radiance measurements offers the opportunity to study gravity wave occurrence frequencies and other characteristics climatologically and on a global scale (Gong et al., 2012; Hoffmann et al., 2013, 2014). AIRS operational temperature retrievals are typically not used for gravity wave research. A main drawback is their limited horizontal resolution related to the cloud-clearing procedure. This procedure facilitates retrievals in the troposphere by combining radiance measurements of 3 × 3 footprints to reconstruct a single cloud-free spectrum. This causes a substantial loss of horizontal resolution. Nevertheless, stratospheric 3-D temperature fields with a high spatial resolution can be retrieved from AIRS radiances. The AIRS high-resolution retrieval of Hoffmann and Alexander (2009) provides a temperature data set which is considered optimal for stratospheric gravity wave studies. Meyer and Hoffmann (2014) performed a comparison between the AIRS high-resolution stratospheric temperature retrieval, the AIRS operational Level 2 data, and the ERA-Interim reanalysis (Dee et al., 2011) on the basis of nine measurement years (2003–2011). That study showed that the AIRS high-resolution retrievals reproduce mean and standard deviations of ERA-Interim stratospheric temperatures with good accuracy. Zonal average differences tend to be mostly below ±2 K. Sato et al. (2016) used the AIRS high-resolution retrievals to study interactions of gravity waves with the El Niño–Southern Oscillation (ENSO). Tsuchiya et al. (2016) investigated interactions of gravity waves with the Madden–Julian Oscillation (MJO) using the same data set. Ern et al. (2017) and Wright et al. (2017) applied 3-D spectral analysis techniques to the AIRS high-resolution retrievals, thereby estimating directional gravity wave momentum flux.
By using the limb sounding technique, the High Resolution Dynamics Limb Sounder (HIRDLS) is sensitive to short-vertical-wavelength gravity waves and is therefore ideally suited to complement AIRS observations. HIRDLS temperature observations have been widely used to study the global distribution of gravity waves. In particular, absolute gravity wave momentum fluxes are derived from information about gravity wave vertical and horizontal wavelengths (Alexander et al., 2008; Wright et al., 2010; Ern et al., 2011). Based on these momentum fluxes, the intermittency in gravity wave global distributions was studied (e.g., Hertzog et al., 2012; Wright et al., 2013), as well as the interaction of gravity waves with the background circulation (e.g., Ern et al., 2014, 2015). In addition Geller et al. (2013) used HIRDLS data to compare gravity wave momentum fluxes in models and those derived from observations. The main advantage of HIRDLS is that 2-D spectral information of observed gravity waves is provided in terms of along-track and vertical wavelengths. This information has been utilized for studying the average spectrum of gravity waves in different regions (e.g., Lehmann et al., 2012; Ern and Preusse, 2012; Trinh et al., 2016). We will use this information here to comprehensively compare AIRS and HIRDLS gravity wave observations, which is the main aim of our study.
The AIRS and HIRDLS instrument characteristics and the gravity wave observations are introduced in Sect. 2. We explain the detrending method and noise corrections that we used to estimate gravity wave variances from AIRS and HIRDLS observations. Further, nadir and limb observation geometries are compared regarding their sensitivities to gravity horizontal and vertical wavelengths. In Sect. 3 we present case studies of coincident AIRS and HIRDLS gravity wave observations and comparisons of time series of gravity wave variances from AIRS and HIRDLS during 2005 to 2008. In addition, the influence of the AIRS observational filter is investigated. In Sect. 4 we will draw conclusions and give an outlook.
2.1 AIRS and HIRDLS observations and temperature retrievals
The Aqua satellite is part of NASA's Earth Observing System and the first satellite in the A-Train constellation. The flight altitude of Aqua is 705 km, and it performs in a sun-synchronous polar orbit with an inclination of 98∘ and a period of 99 min. On board NASA's Aqua satellite, six instruments are included, and one of them is AIRS (Aumann et al., 2003; Chahine et al., 2006). Thermal emissions of atmospheric properties in the nadir and sub-limb geometry are measured by AIRS. AIRS completes 14.5 orbits per day. At 01:30 (descending orbit) and 13:30 (ascending orbit) local time the Equator crossing occurs. AIRS has across-track scanning capabilities. One scan covers 1780 km ground distance with 90 individual footprints. The scans are performed in 2.667 s, and the along-track distance is 18 km. Granules of 6 min measurement time, i.e., 135 scans or 12 150 footprints, are accumulated in the AIRS measurements. A total of 2.9 million radiance spectra are globally detected by AIRS within 1 day. The measurement coverage of the AIRS instrument is almost complete since the observations started in September 2002. The analysis of this study is based on measurements during January 2005 to March 2008, which is the measurement period of HIRDLS.
Aqua carries different instruments, which measure radiation in the near and mid-infrared and the microwave spectral regions (Aumann et al., 2003; Gautier et al., 2003; Lambrigtsen, 2003). Several retrieval algorithms transform the calibrated radiances into geophysical quantities (Susskind et al., 2003; Goldberg et al., 2003). The original resolution of the AIRS radiance measurements (Level 1 data) is reduced during the operational retrieval (Level 2 data) by a factor of 3 × 3 (along track × across track). In doing so, the retrievals are extended into the troposphere and cloud clearing is performed (Barnet et al., 2003; Susskind et al., 2003; Cho and Staelin, 2006). Several linear and nonlinear operations on the infrared and microwave channels are required for the cloud-clearing algorithm. The algorithm performs on blocks of 3 × 3 AIRS footprints. The clearest field of view in the 3 × 3 block is selected, and a single cloud-cleared infrared spectrum for the block is computed (Cho and Staelin, 2006). Validation of AIRS operational retrievals for the troposphere provide an accuracy which is near the anticipated absolute accuracy of 1 K root mean square over a 1 km layer (Fetzer et al., 2003; Divakarla et al., 2006; Tobin et al., 2006). A root mean square deviation of 1.2 and 1.7 K is found in the troposphere and lower stratosphere, respectively, by comparing AIRS with radiosondes (Divakarla et al., 2006).
A high-resolution retrieval scheme for stratospheric temperatures based on AIRS radiance measurements was developed by Hoffmann and Alexander (2009). This retrieval scheme provides a temperature profile for each individual footprint, corresponding to a horizontal sampling that is 3 × 3 times better than the operational retrieval data provided by NASA. While the operational retrievals are tightly constrained in the stratosphere, the high-resolution retrieval configuration offers an optimal opportunity for gravity wave analyses, because spatial resolution and retrieval noise are balanced in the results by an optimized retrieval configuration. The altitude range of the retrieval is from 10 to 70 km with a 3 km sampling below 60 km altitude and 5 km above. In the stratosphere the high-resolution retrieval has a vertical sampling which is the same as the AIRS operational retrieval grid. Based on the assumption of hydrostatic equilibrium and using a given reference pressure from the AIRS operational retrieval at 30 km altitude, the pressure profile is calculated, whereas the temperature profile is retrieved. In the altitude range between 20 and 60 km the noise of the high-resolution retrieval is about 1.4 to 2.1 K, and the total retrieval error, which includes several systematic errors, is 1.6 to 3.0 K. In this altitude range the retrieval achieves the most reliable results, which is indicated by the retrieval diagnostics. There are about 5–6 degrees of freedom for signal in the retrieved profiles. The vertical resolution varies between 7 km at 20 km altitude and about 15 km at 60 km altitude.
The retrieval setup of the AIRS high-resolution retrieval distinguishes between day- and nighttime conditions. The Juelich Rapid Spectral Simulation Code (JURASSIC) model (Hoffmann and Alexander, 2009) is used for radiative transfer calculations. This model assumes local thermodynamic equilibrium (LTE), which restricts the study of daytime measurements to the 15 µm channels. The 4.3 µm channels are affected in the daytime by non-LTE effects due to solar excitation of CO2 molecules (de Souza-Machado et al., 2007; Strow et al., 2006). Non-LTE effects are not noticed in nighttime measurements of AIRS. Therefore the nighttime retrieval uses both wavebands. Lower retrieval noise and better vertical resolution of the nighttime retrievals than the daytime retrievals is the consequence. The data in this study were split into day- and nighttime, depending on the solar zenith angle, and only the nighttime data were used. The retrievals consider values larger than 108∘ as nighttime data. Note that especially throughout polar summer at high latitudes this restriction leads to data gaps.
HIRDLS is a 21-channel infrared limb-scanning radiometer aboard NASA's Aura satellite (Gille et al., 2003, 2008), which is part of the A-Train constellation of NASA satellites, too. Therefore AIRS and HIRDLS cross the same geographic locations within a few minutes. Aura was launched on 15 July 2004 in a sun-synchronous polar orbit. Aura has an inclination of 98∘ at a flight altitude of 705 km. During launch, HIRDLS was damaged and it was not possible to scan in azimuth, which would have given 3-D capabilities (Gille et al., 2003). Instead, the line of sight of HIRDLS is fixed to an azimuth of −47∘ with respect to the orbit plane, resulting in a latitudinal coverage of about 63∘ S to 80∘ N. In order to resolve the issues that were caused by this damage, extensive corrections to the processing algorithms have been performed (Gille et al., 2008, 2011). Along-track distances between subsequent altitude profiles are down to only 100 km because the line of sight of HIRDLS is fixed. This remarkably fine along-track sampling offers a great opportunity for the analysis of gravity waves. Measurements of thermal emissions with 1 km vertical resolution are made in four channels on the long-wave side of the 15 µm bands, from which the temperature is retrieved as a function of pressure (Khosravi et al., 2009a, b). The fractional cover-up of HIRDLS's field of view induces perturbations of the measured atmospheric limb radiances, which have been eliminated (Gille et al., 2008). Temperature retrievals are provided for January 2005 to March 2008. HIRDLS measures in an altitude range between the tropopause region and the upper mesosphere on a pressure grid with 121 levels. The vertical field of view of the instrument is 1 km, which is achieved as vertical resolution between 13 and 60 km from the measured temperature–altitude profiles (Gille et al., 2008). Our analysis uses retrieval products obtained with NASA processing software. HIRDLS temperature retrievals are carefully validated. Comparisons between HIRDLS and SABER (Sounding of the Atmosphere using Broadband Emission Radiometry) and between HIRDLS and ECMWF (European Centre for Medium-Range Weather Forecasts) temperatures indicate that HIRDLS has a warm bias at the tropical tropopause. In the stratosphere HIRDLS temperatures are within 1 K of ECMWF temperatures, within 1–2 K of Microwave Limb Sounder temperatures, and within 2 K of lidar temperatures (Gille et al., 2011).
2.2 Removal of background signals to extract gravity wave information
This paper partly focuses on statistical comparisons of temperature variances related to stratospheric gravity wave activity. The total variance () of the satellite temperature measurements typically consists of three components: the variance of gravity waves (), of background signals (), and of noise ().
To eliminate the background signals from the temperature measurements and to receive gravity wave signals, a detrending procedure is necessary. Large-scale latitudinal temperature gradients and planetary wave activity are linked with the background signals. For AIRS a local detrending method is applied, whereas a global detrending method has been used for HIRDLS. Both methods are standard methods that have been optimized for each instrument. The removal of background signals in AIRS temperature measurements follows the detrending method described by Wu and Zhang (2004), Eckermann et al. (2006), and Alexander and Teitelbaum (2007). A fourth-order polynomial fit in the across-track direction is used in this method for defining the background. Perturbations are calculated by subtracting the polynomial fit from the raw brightness temperature data. Here we transferred the method to temperature retrievals and applied the fit independently for each altitude. Note that this procedure tends to suppress wave fronts which are parallel to the across-track direction, but only if the wave patterns cover most of the AIRS measurement track. Small-scale wave patterns of gravity waves with short along-track wavelengths are typically not affected. This effect can possibly be reduced if the background is smoothed along-track. However, in the case of extreme latitudinal gradients in the temperature fields, e.g., at the polar vortex edge, other problems can be introduced by smoothing. Therefore along-track smoothing was not considered here.
The background removal applied to HIRDLS temperatures comprises several steps. For a fixed latitude and altitude, the data set is subdivided into overlapping time windows of 31 days length. For these 31-day time windows, the zonal mean temperature and trend are removed, and 2-D spectra in longitude and time are estimated. By back-transformation of these spectra for the spectral components exceeding an amplitude threshold, the contribution of planetary waves with zonal wave numbers up to 6 and periods as short as about 1.4 days is calculated for the precise location and time of each HIRDLS observation and subtracted. Further, the altitude profiles are vertically filtered in order to remove oscillations with vertical wavelengths longer than about 25 km. The whole procedure is described in more detail in Ern et al. (2011). At the end of the procedure quasi-stationary zonal wave numbers 0–4 are subtracted to remove the significant tidal modes, thereby distinguishing ascending and descending orbits (Ern et al., 2013). The final altitude profiles of temperature fluctuations thus obtained are traced back to mesoscale gravity waves.
It is difficult and always some kind of trade-off to distinguish in observations between planetary waves and gravity waves. Therefore for both AIRS and HIRDLS a minor contribution of the background variances is caused by gravity waves, depending on the method of background removal. For AIRS, the background may contain minor contributions of gravity waves with long horizontal wavelength, while for HIRDLS the background will contain minor contributions due to gravity waves with long vertical wavelengths. Still, at most latitudes the background variances will be dominated by global-scale waves. The variances are calculated from the fluctuations relative to a zonal average for a fixed altitude and latitude . Figure 1 shows latitudinal time series of the AIRS and HIRDLS background variances during the measurement period between 2005 and 2008 at 42 km altitude. The overall structure of the background signals in both data sets is rather similar. An annual cycle at high latitudes is detected which has its maxima during wintertime and its minima during summertime. The maximum in both data sets is up to 270 K2 around 50 to 60∘ N/S. The activity of planetary waves is weaker in the Southern Hemisphere winter, and in the Southern Hemisphere the polar vortex is more invariant than in the Northern Hemisphere (e.g., Day et al., 2011). This is represented by the background variances, which are larger in Northern Hemisphere winter than in Southern Hemisphere winter.
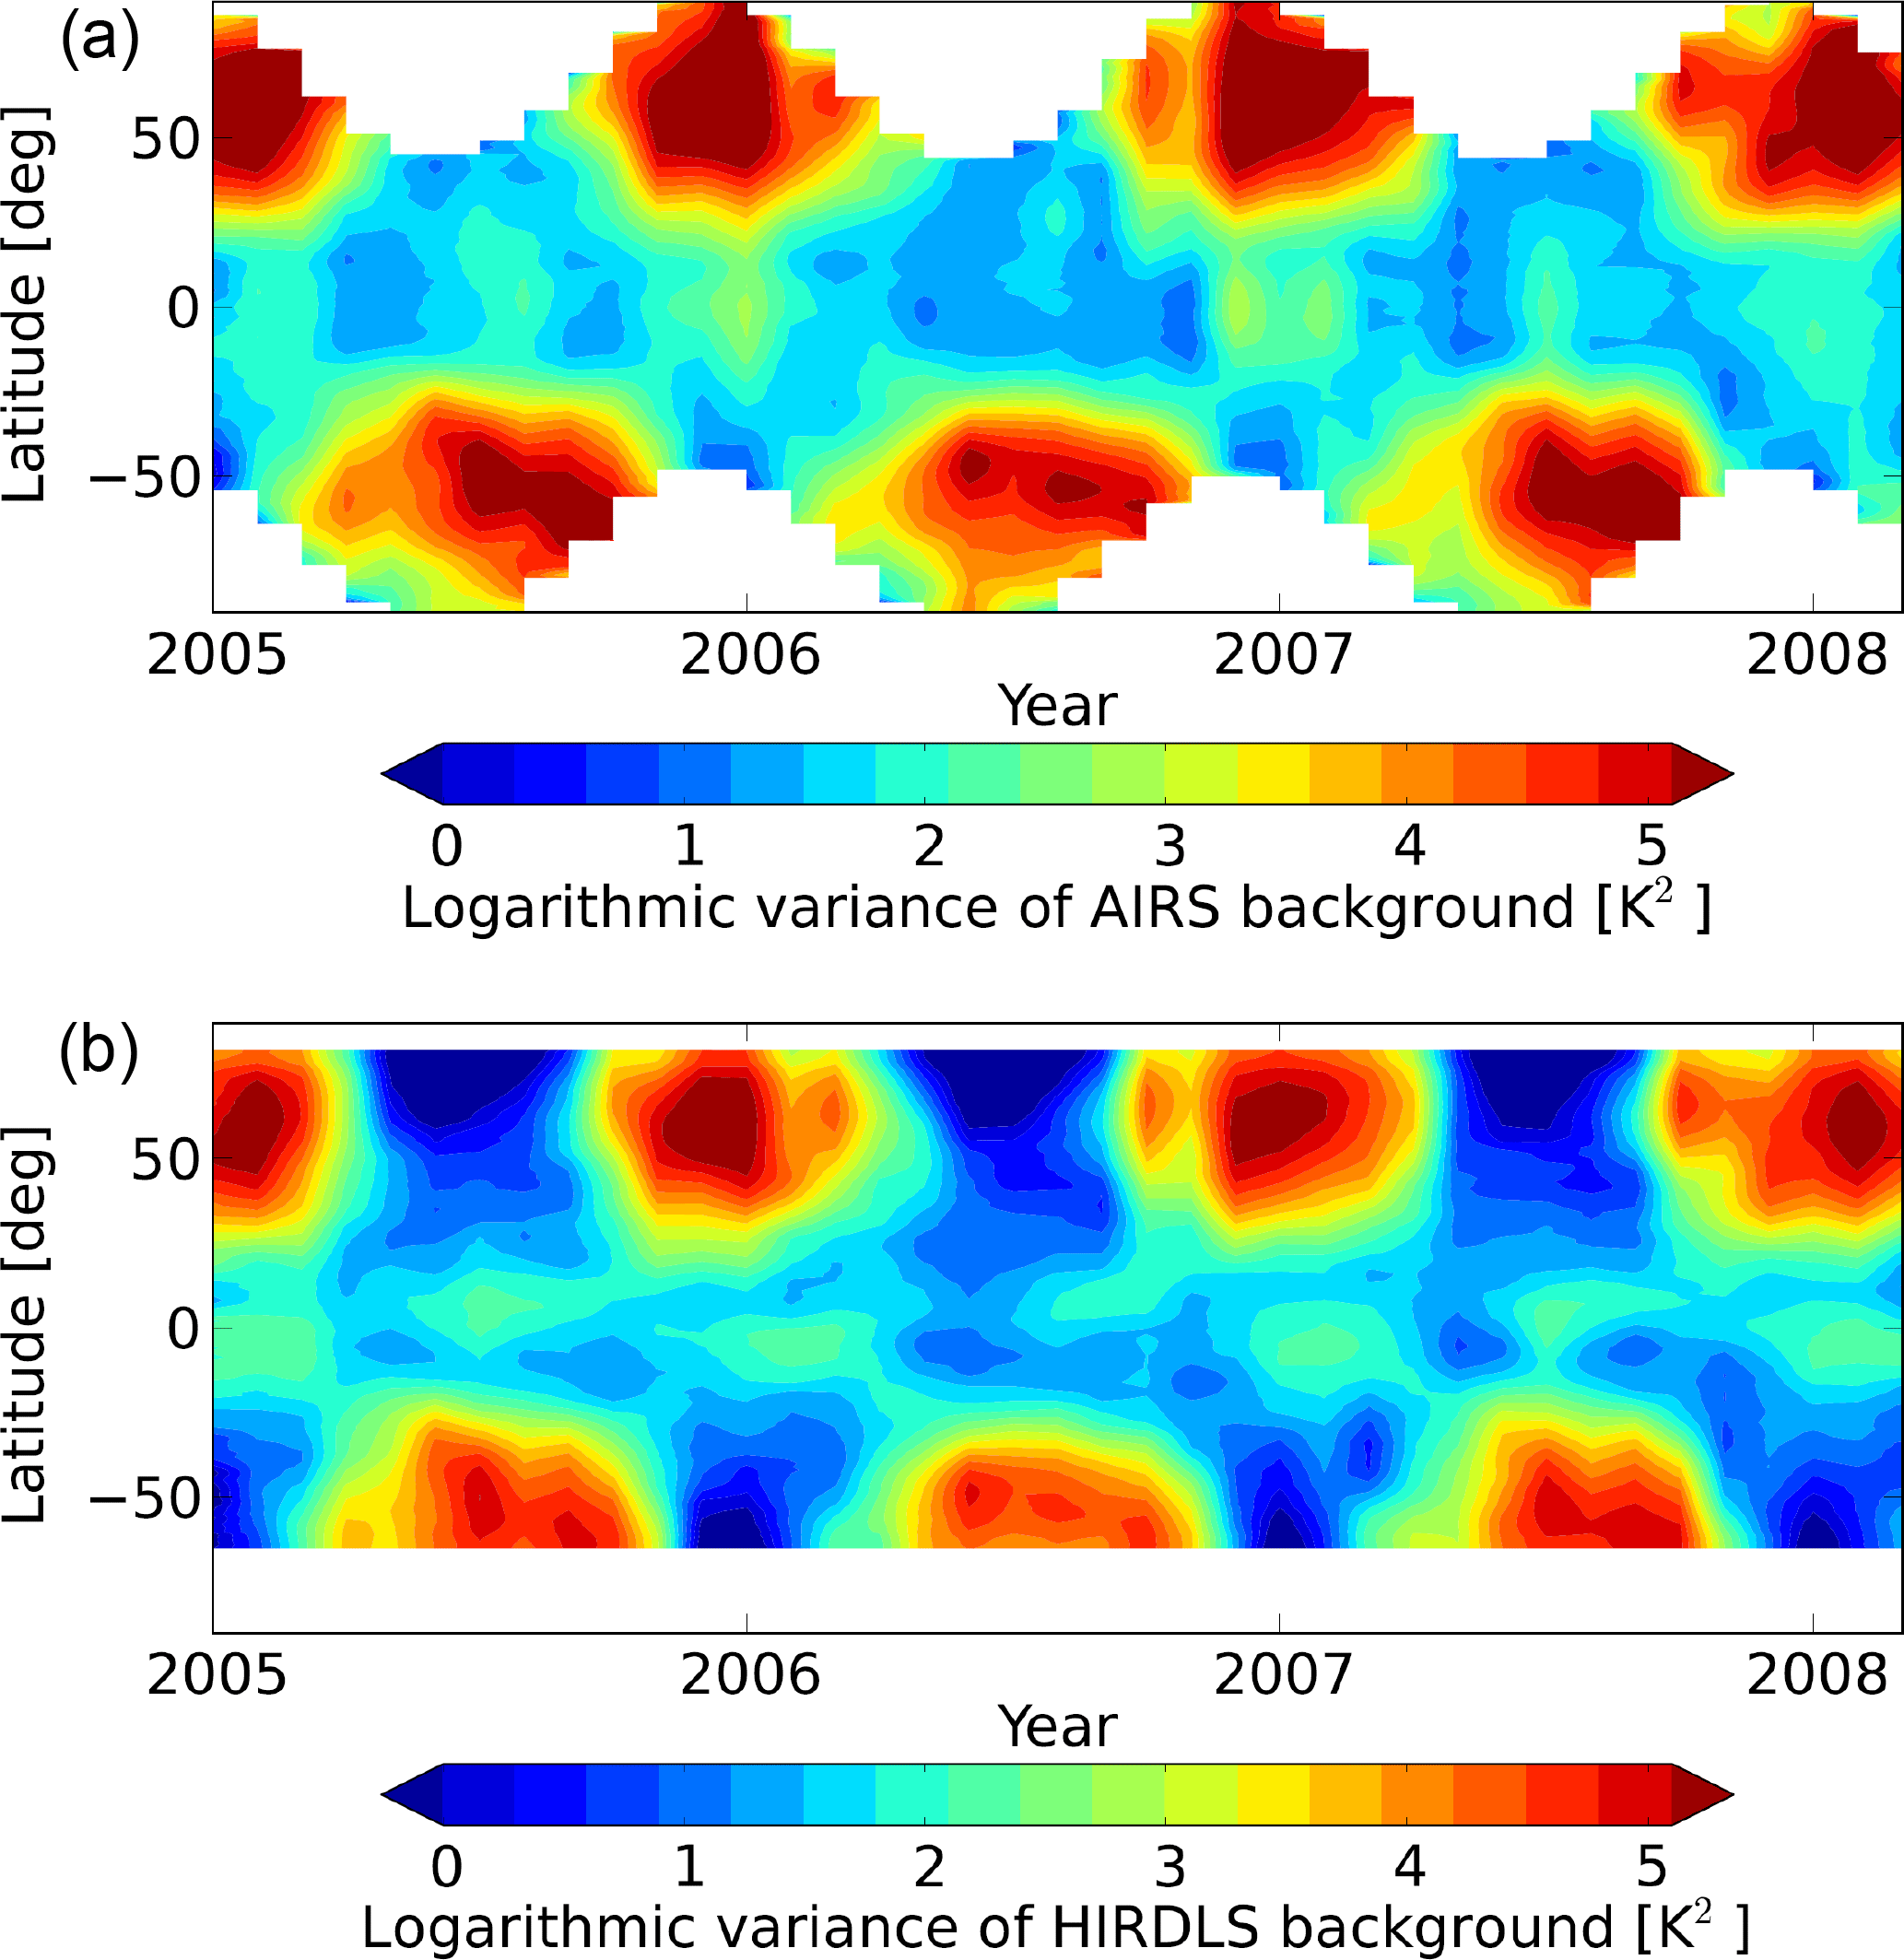
Figure 1Time series of monthly mean temperature background variances for measurements between 2005 and 2008 at 42 km altitude. (a) AIRS high-resolution retrieval. (b) HIRDLS operational retrieval. Data gaps in AIRS data (white areas) are related to the restriction to nighttime measurements.
2.3 Estimation of retrieval noise
Temperature variances are notably affected by noise if long time spans or large areas are analyzed. Therefore it is fundamental to carefully characterize retrieval noise. For AIRS the noise was estimated directly from the measurements using the method of Immerkær (1996), following the approach of Hoffmann et al. (2014). Immerkær (1996) presented a generic technique for noise estimation developed for image analysis. Individual noise estimates are obtained for each AIRS granule and each altitude. The temperature data are convolved with a 3 × 3 pixel filter mask which eliminates image structures. The variance of the filtered data is calculated, which gives an approximation of the noise. Note that it is possible to misinterpret plane waves with very short horizontal wavelengths as noise with the method of Immerkær (1996), because thin lines are eventually recognized as noise. However, based on inspection of the data, we concluded that this issue does not affect our analysis.
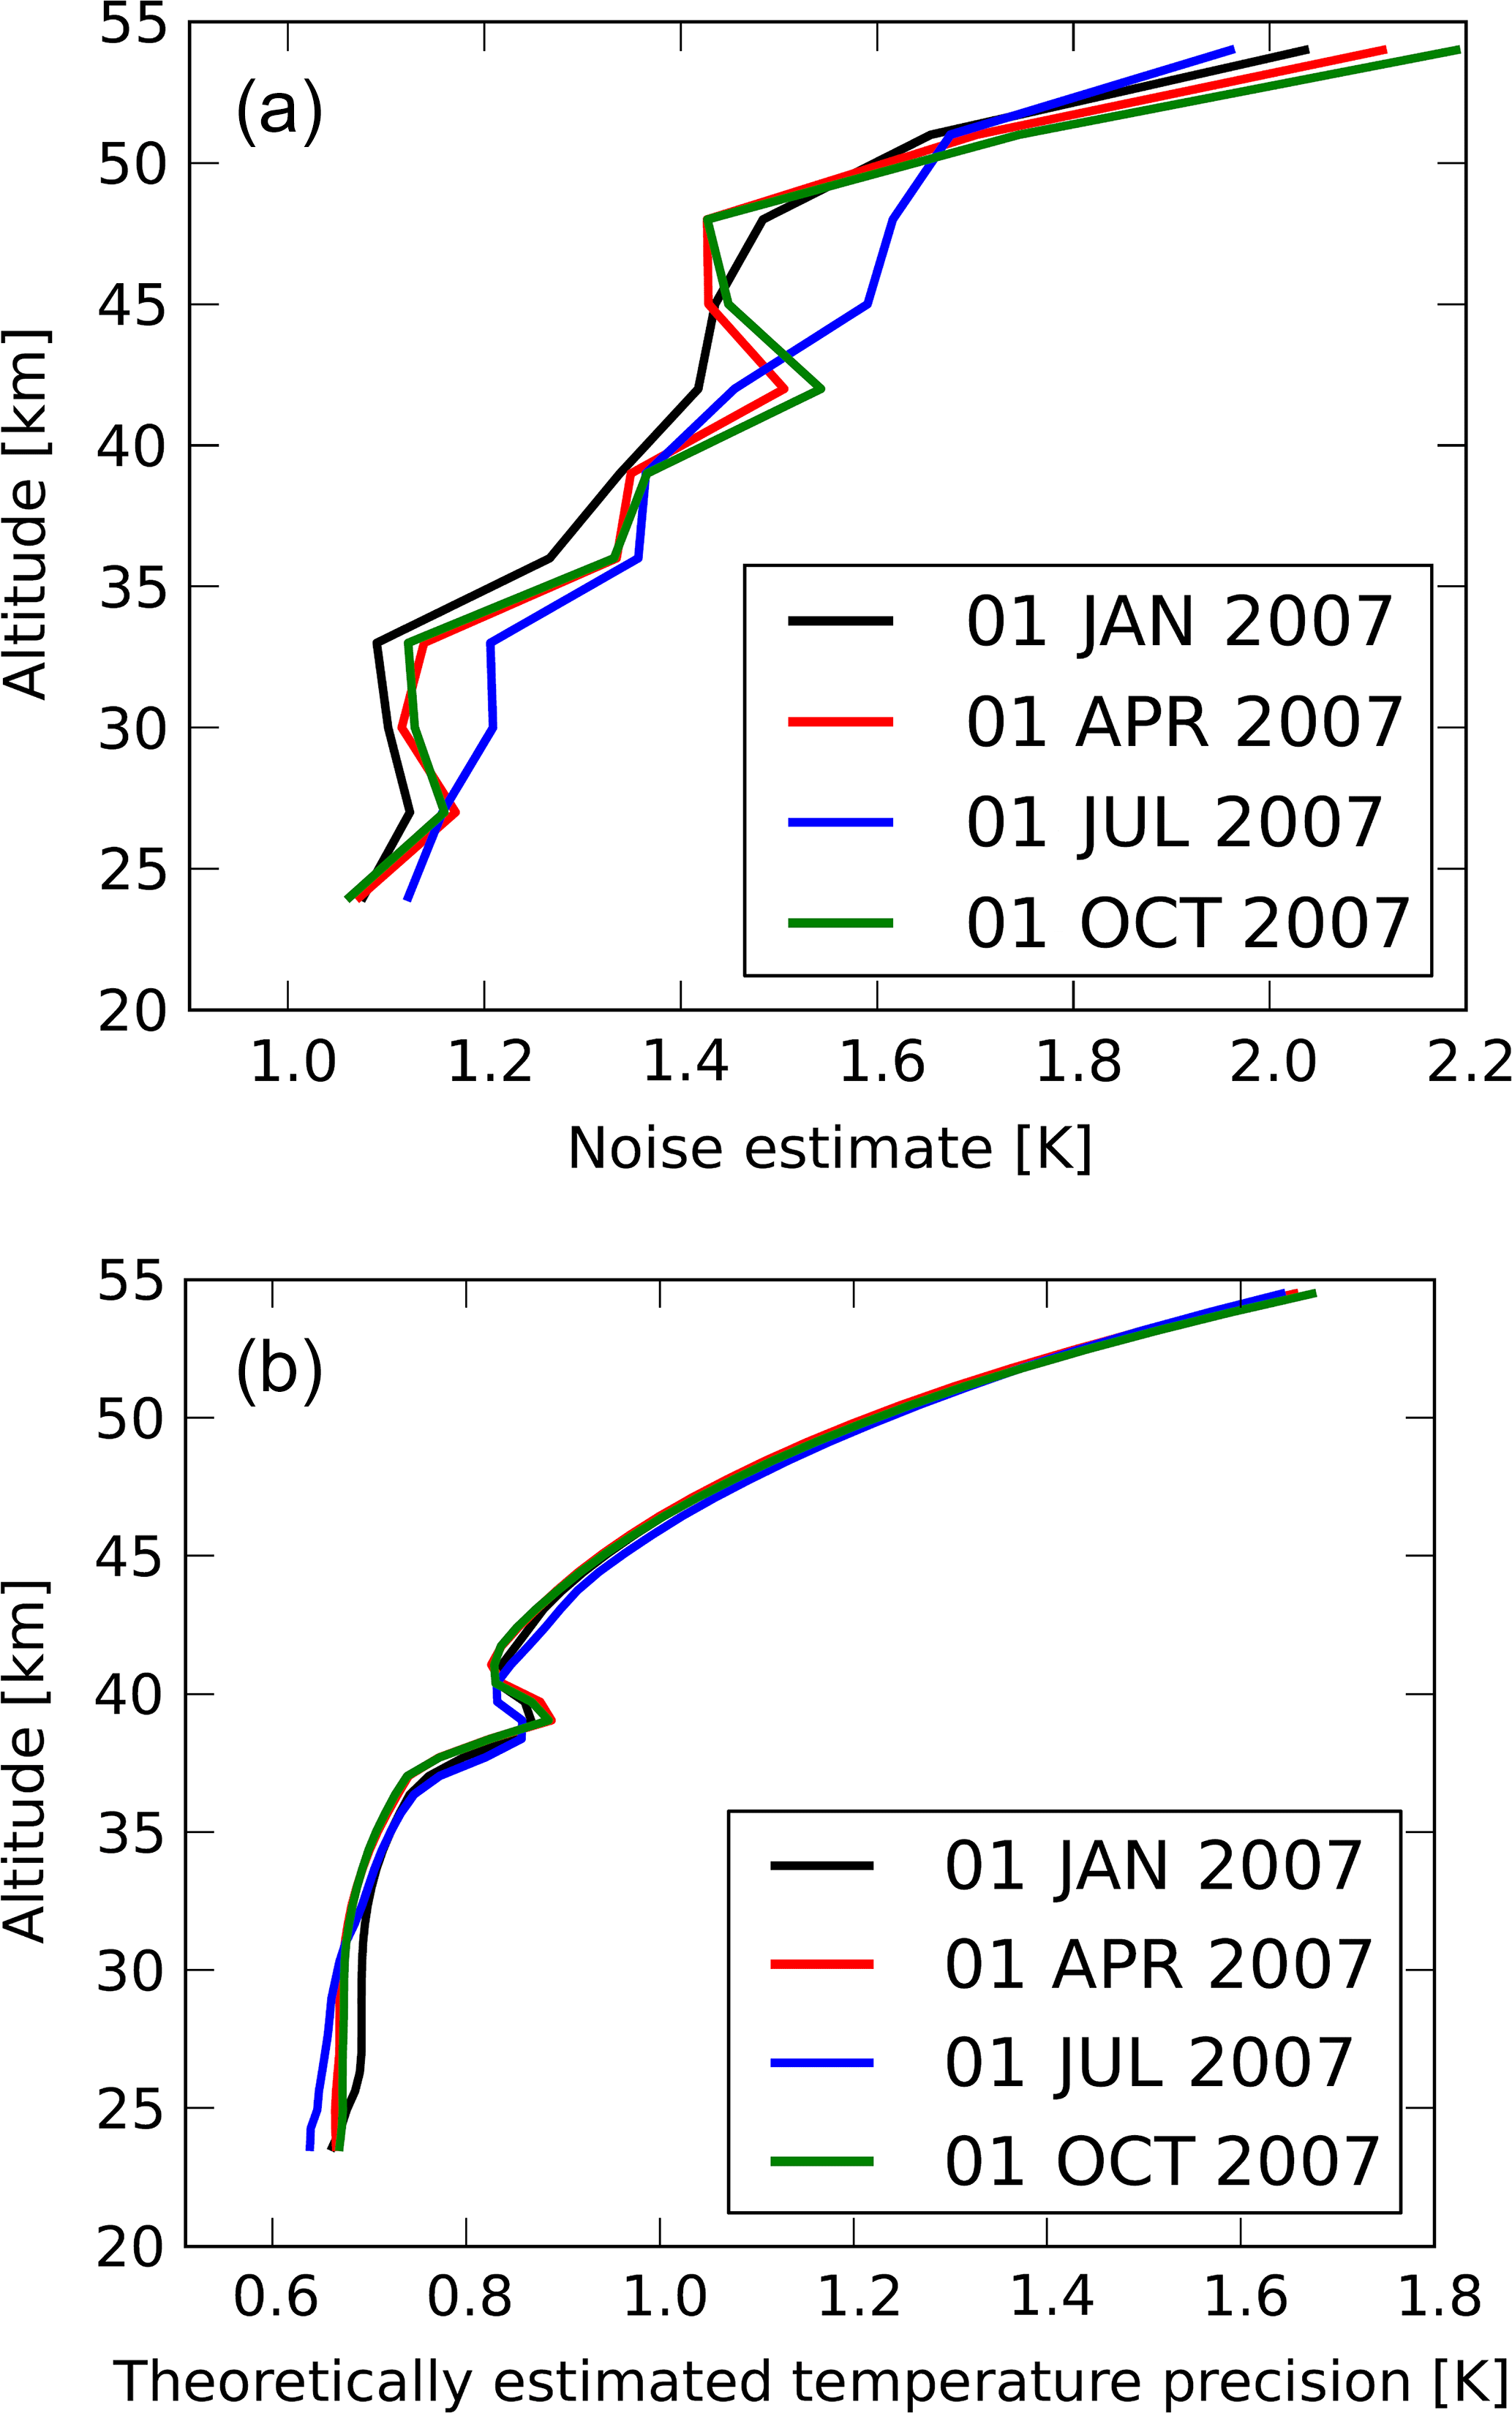
Figure 2 shows global mean noise estimates for the temperature measurements of AIRS and HIRDLS on individual days. The noise estimate for AIRS is about 1.0 K at 24 km altitude and increases to 2.2 K at 55 km altitude. Seasonal differences of 10 % are found, with lowest values in January and highest values in July. Noise profiles for April and October are similar and located in between. These direct noise estimates from the temperature data agree well with the estimated retrieval noise, which is about 1.4 to 2.1 K in the altitude range between 20 and 60 km (Hoffmann and Alexander, 2009). Gravity wave variances of AIRS are corrected by subtracting the squared noise estimate from the temperature variances. For HIRDLS both a measured and a predicted precision are provided. The predicted precision corresponds to the expected uncertainty of the retrievals based on uncertainty of the input parameters. This includes not only the radiance noise but also other parameters, e.g., forward-model errors (Khosravi et al., 2009a, b; Gille et al., 2011). The theoretically estimated temperature precision of HIRDLS has no seasonal variability and is about 0.6 to 1.7 K, increasing with altitude (see Fig. 2). When the noise estimate of HIRDLS and AIRS is compared, the values of HIRDLS are quite low, and therefore noise is not corrected for in our HIRDLS analysis.
2.4 Sensitivity functions of AIRS and HIRDLS
Each type of current satellite instruments can detect only a certain part of the full vertical and horizontal wave number spectrum of gravity waves, which is determined by its observational filter (Alexander, 1998; Preusse et al., 2008; Alexander et al., 2010; Trinh et al., 2015). For AIRS the sensitivity to vertical and horizontal wavelengths was determined using an approach similar to Hoffmann et al. (2014). In the vertical direction, temperature profiles representing wave perturbations have been convolved with the averaging kernel functions of the retrieval to take into account the smoothing effects. In the horizontal direction, the polynomial fit detrending method has been applied to simulated wave perturbations in the across-track direction in order to quantify the potential filtering of large-scale features. In both cases, the sensitivity to the given wavelengths was determined by calculating the ratio of the variances of the filtered and unfiltered perturbation data. Here we varied the wave phases over all possible values when we calculated the variances.
The sensitivity function of the current generation of limb sounders is really two-dimensional and the sensitivity for horizontal, and vertical wavelengths cannot be estimated independently. The calculation of the HIRDLS sensitivity function follows the approach of Preusse et al. (2002) and Trinh et al. (2015), with additional vertical filtering being applied. This additional filtering was added because in the analysis by Ern et al. (2011) gravity wave amplitudes are determined in sliding windows of 10 km vertical extent. Amplitudes with vertical wavelengths longer than 25 km cannot be reliably determined from those windows, and therefore only vertical wavelengths up to 25 km are used in the vertical analysis of altitude profiles. This vertical analysis is a two-step approach utilizing the maximum-entropy method for identifying the dominant vertical oscillations, followed by a harmonic analysis (MEM/HA). For more details see Preusse et al. (2002). As a secondary aspect, the vertical filtering will further reduce contamination by planetary waves in the polar vortex. These waves usually have long vertical wavelengths of around 40 km or longer.
Figure 3 illustrates the sensitivity functions for AIRS and HIRDLS for gravity wave temperature variances. Only waves with horizontal wavelength longer than 20 km can propagate from the troposphere into the stratosphere (Preusse et al., 2008); therefore the horizontal wavelength in the plots are cut below 20 km. The sensitivity of AIRS exceeds the 20 % level for vertical wavelengths longer than 15 km and horizontal wavelengths shorter than 1280 km. Highest sensitivity is found for long vertical and short horizontal wavelengths, as expected for a nadir sounder. In contrast, the observational filter of HIRDLS shows the typical picture for limb sounders with high sensitivity for short vertical and long horizontal wavelengths. The 20 % level of sensitivity is exceeded for vertical wavelengths longer than 2 km and shorter than 39 km and for horizontal wavelengths longer than 140 km. The horizontal wavelengths considered in the HIRDLS sensitivity function are the wavelengths along the line of sight of the satellite. The true wavelength is usually shorter than this projection. Therefore limb sounders can detect gravity waves with even shorter horizontal wavelength than suggested by the sensitivity function. When assuming that horizontal wave vectors of observed gravity waves are randomly distributed, the average horizontal wave number is underestimated by a factor of , giving a rough measure of how much shorter observed true horizontal wavelengths could be on average. Similar values for HIRDLS are found by Wright et al. (2015).

Figure 3AIRS (a) and HIRDLS (b) observational filters indicate the sensitivity of temperature variances to gravity waves with different horizontal and vertical wavelengths. The black lines show a momentum flux factor (see text for details).
Supposing the same relative potential temperature amplitudes for two waves with different values of horizontal and vertical wavelengths, waves with short horizontal and long vertical wavelength can potentially carry more gravity wave momentum flux. We calculated a momentum flux factor M(kh,m), which gives a rough estimate of how much waves of different horizontal and vertical wave numbers kh and m could possibly contribute to momentum flux,
for a given normalized wave amplitude . Following Ern et al. (2004), the momentum flux factor is calculated according to
with density ρ, gravity acceleration g, buoyancy frequency N, intrinsic frequency , scale height H, sound speed cs, Coriolis parameter f, and potential temperature Θ. The black contour lines shown in both panels of Fig. 3 indicate the normalized momentum flux factor, , which is normalized by the maximum value Mmax that occurs in the range of horizontal and vertical wavelengths shown. The normalized momentum flux factor can attain values between near 0 and 1. Of course the normalized momentum flux factor is just a scaling factor that does not provide information about the relative occurrence rate of waves with given horizontal and vertical wavelengths in the atmosphere. Here we give an example of the importance of the momentum flux factor in interpreting the AIRS and HIRDLS gravity wave observations. When assuming that HIRDLS observes a gravity wave with 600 km horizontal wavelength and 6 km vertical wavelength (which is well within its sensitivity range), the corresponding normalized momentum flux factor is 0.02. Further, assuming that AIRS observes a gravity wave with 200 km horizontal wavelength and 30 km vertical wavelength, the corresponding normalized momentum flux factor is 0.26. The gravity wave observed by AIRS would contribute a factor 10 more momentum flux than HIRDLS if both had the same amplitude.
3.1 Case studies of individual wave events
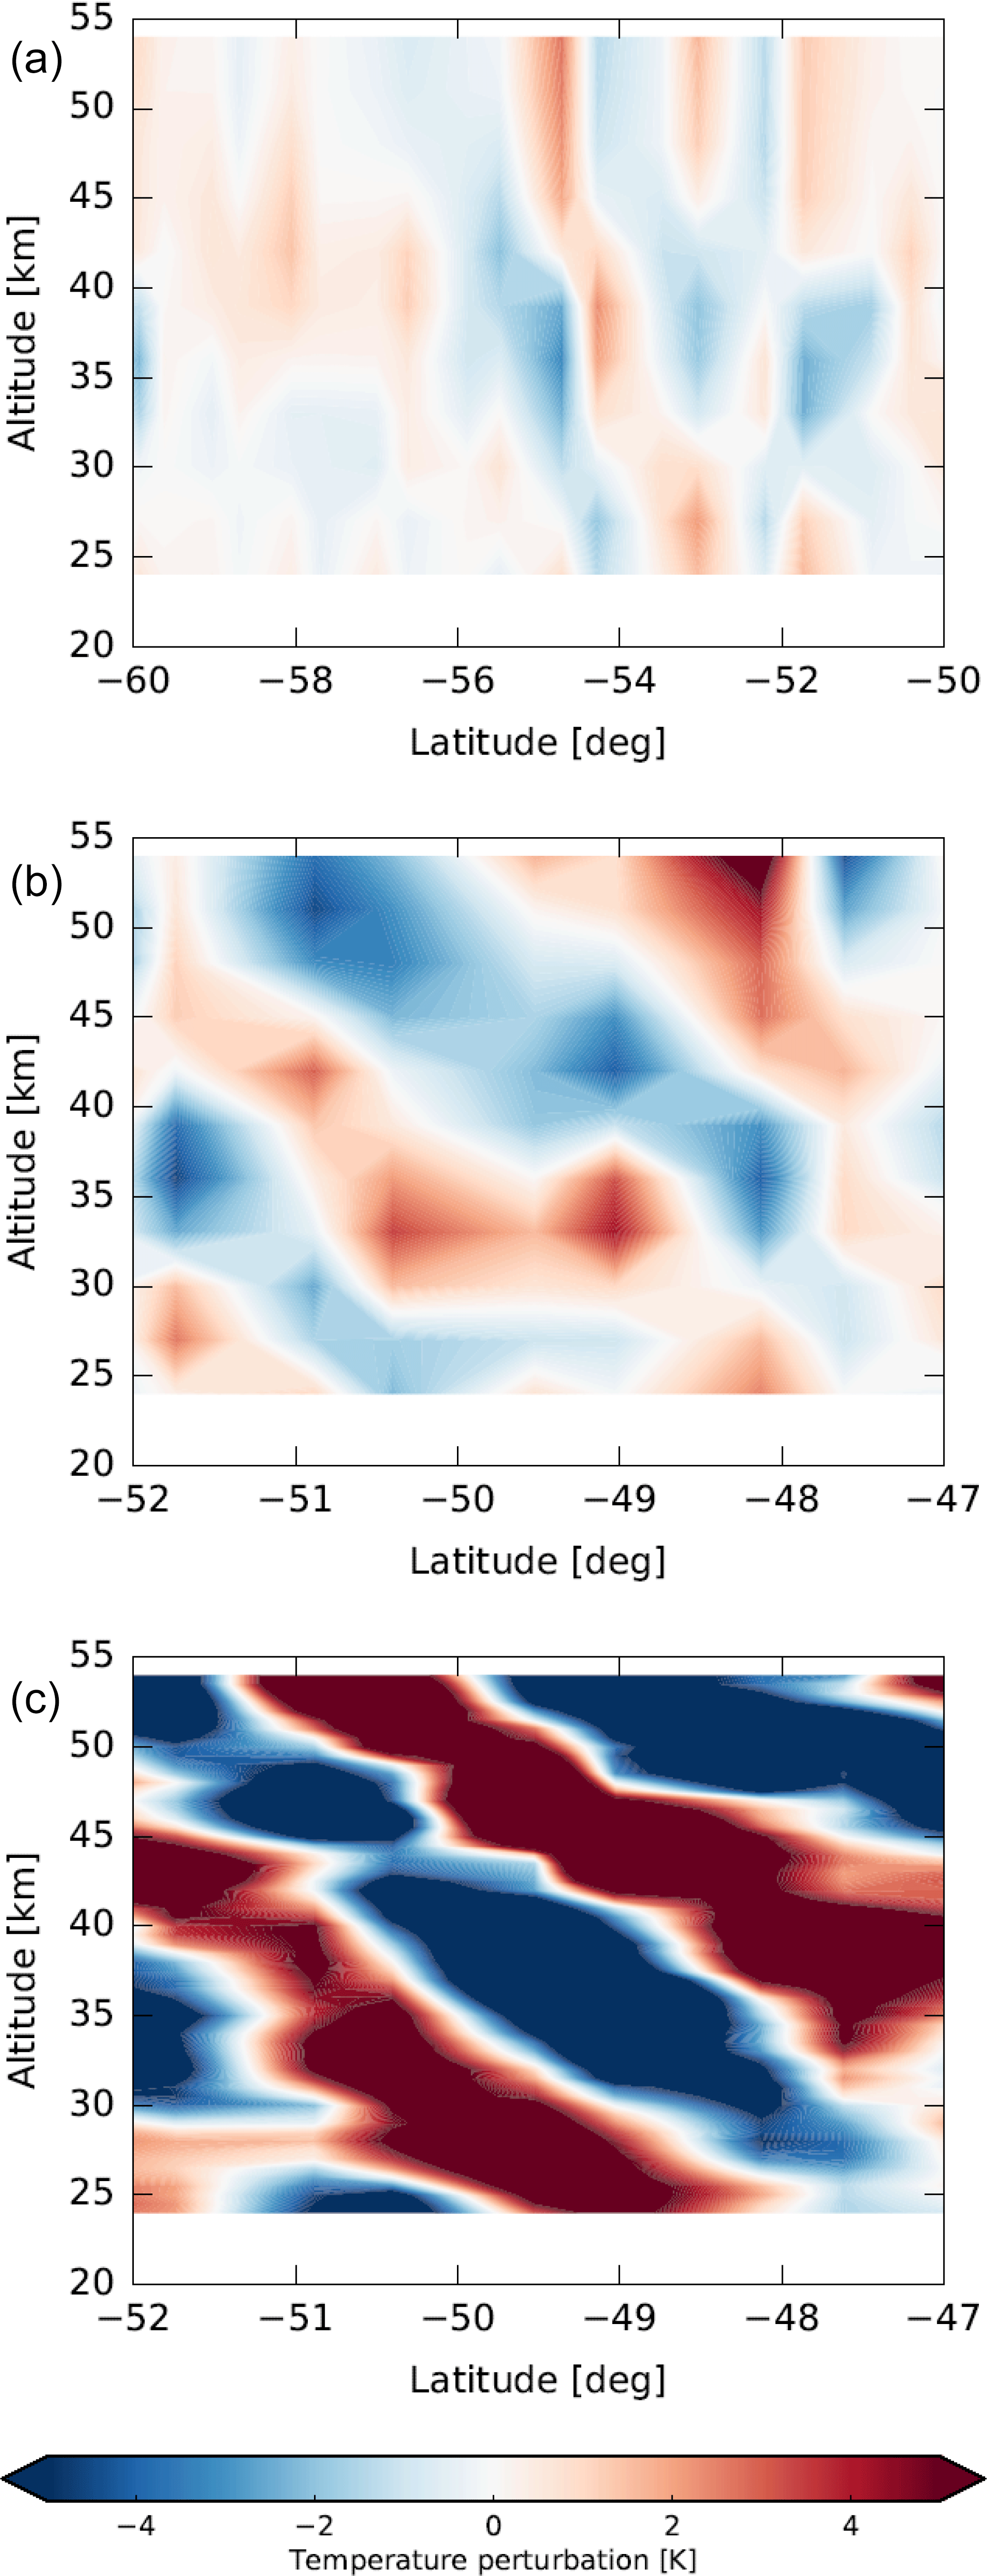
Following Hoffmann and Alexander (2009), in this section individual gravity wave events in the AIRS data are compared with HIRDLS observations at the same location and at a similar time. Overpass times of the same geographic locations are within minutes of each other for AIRS and HIRDLS, because both are members of the A-Train constellation of NASA satellites. However, based on their different viewing geometries, AIRS as a nadir sounder and HIRDLS as a limb sounder with fixed azimuth angle of −47∘, the times where AIRS and HIRDLS see the same geographic locations differ by about 100 min. The gravity wave patterns can change substantially on timescales of 100 min, in particular in the case of gravity waves from non-orographic sources with high frequencies and fast group velocities. The phase structure of mountain waves is more likely invariant in a 100 min interval than that of waves from other sources, because they are stationary relative to the ground. Mountain waves are therefore best suited for a direct comparison of AIRS and HIRDLS data. Additionally to the effect due to the local time differences between the two data sets a second effect due to the considered data has to be taken into account. For AIRS only the descending node is considered (only nighttime data), while for HIRDLS both ascending and descending nodes are considered (daytime data and nighttime data are averaged). This may have some effect in the tropics where a diurnal cycle in the gravity wave sources is expected, but should not have much effect in the polar vortex region during wintertime. We analyzed several gravity wave events from different sources, which are observed by both AIRS and HIRDLS. Figures 4 and 6 show temperature perturbation maps of the AIRS operational retrieval and the AIRS high-resolution retrieval, as well as HIRDLS measurement locations at 30 and 42 km altitude. In Figs. 5 and 7 the corresponding vertical cross sections of the AIRS operational retrieval, the AIRS high-resolution retrieval, and HIRDLS are presented. The AIRS measurements have been linearly interpolated to the HIRDLS track for this comparison.
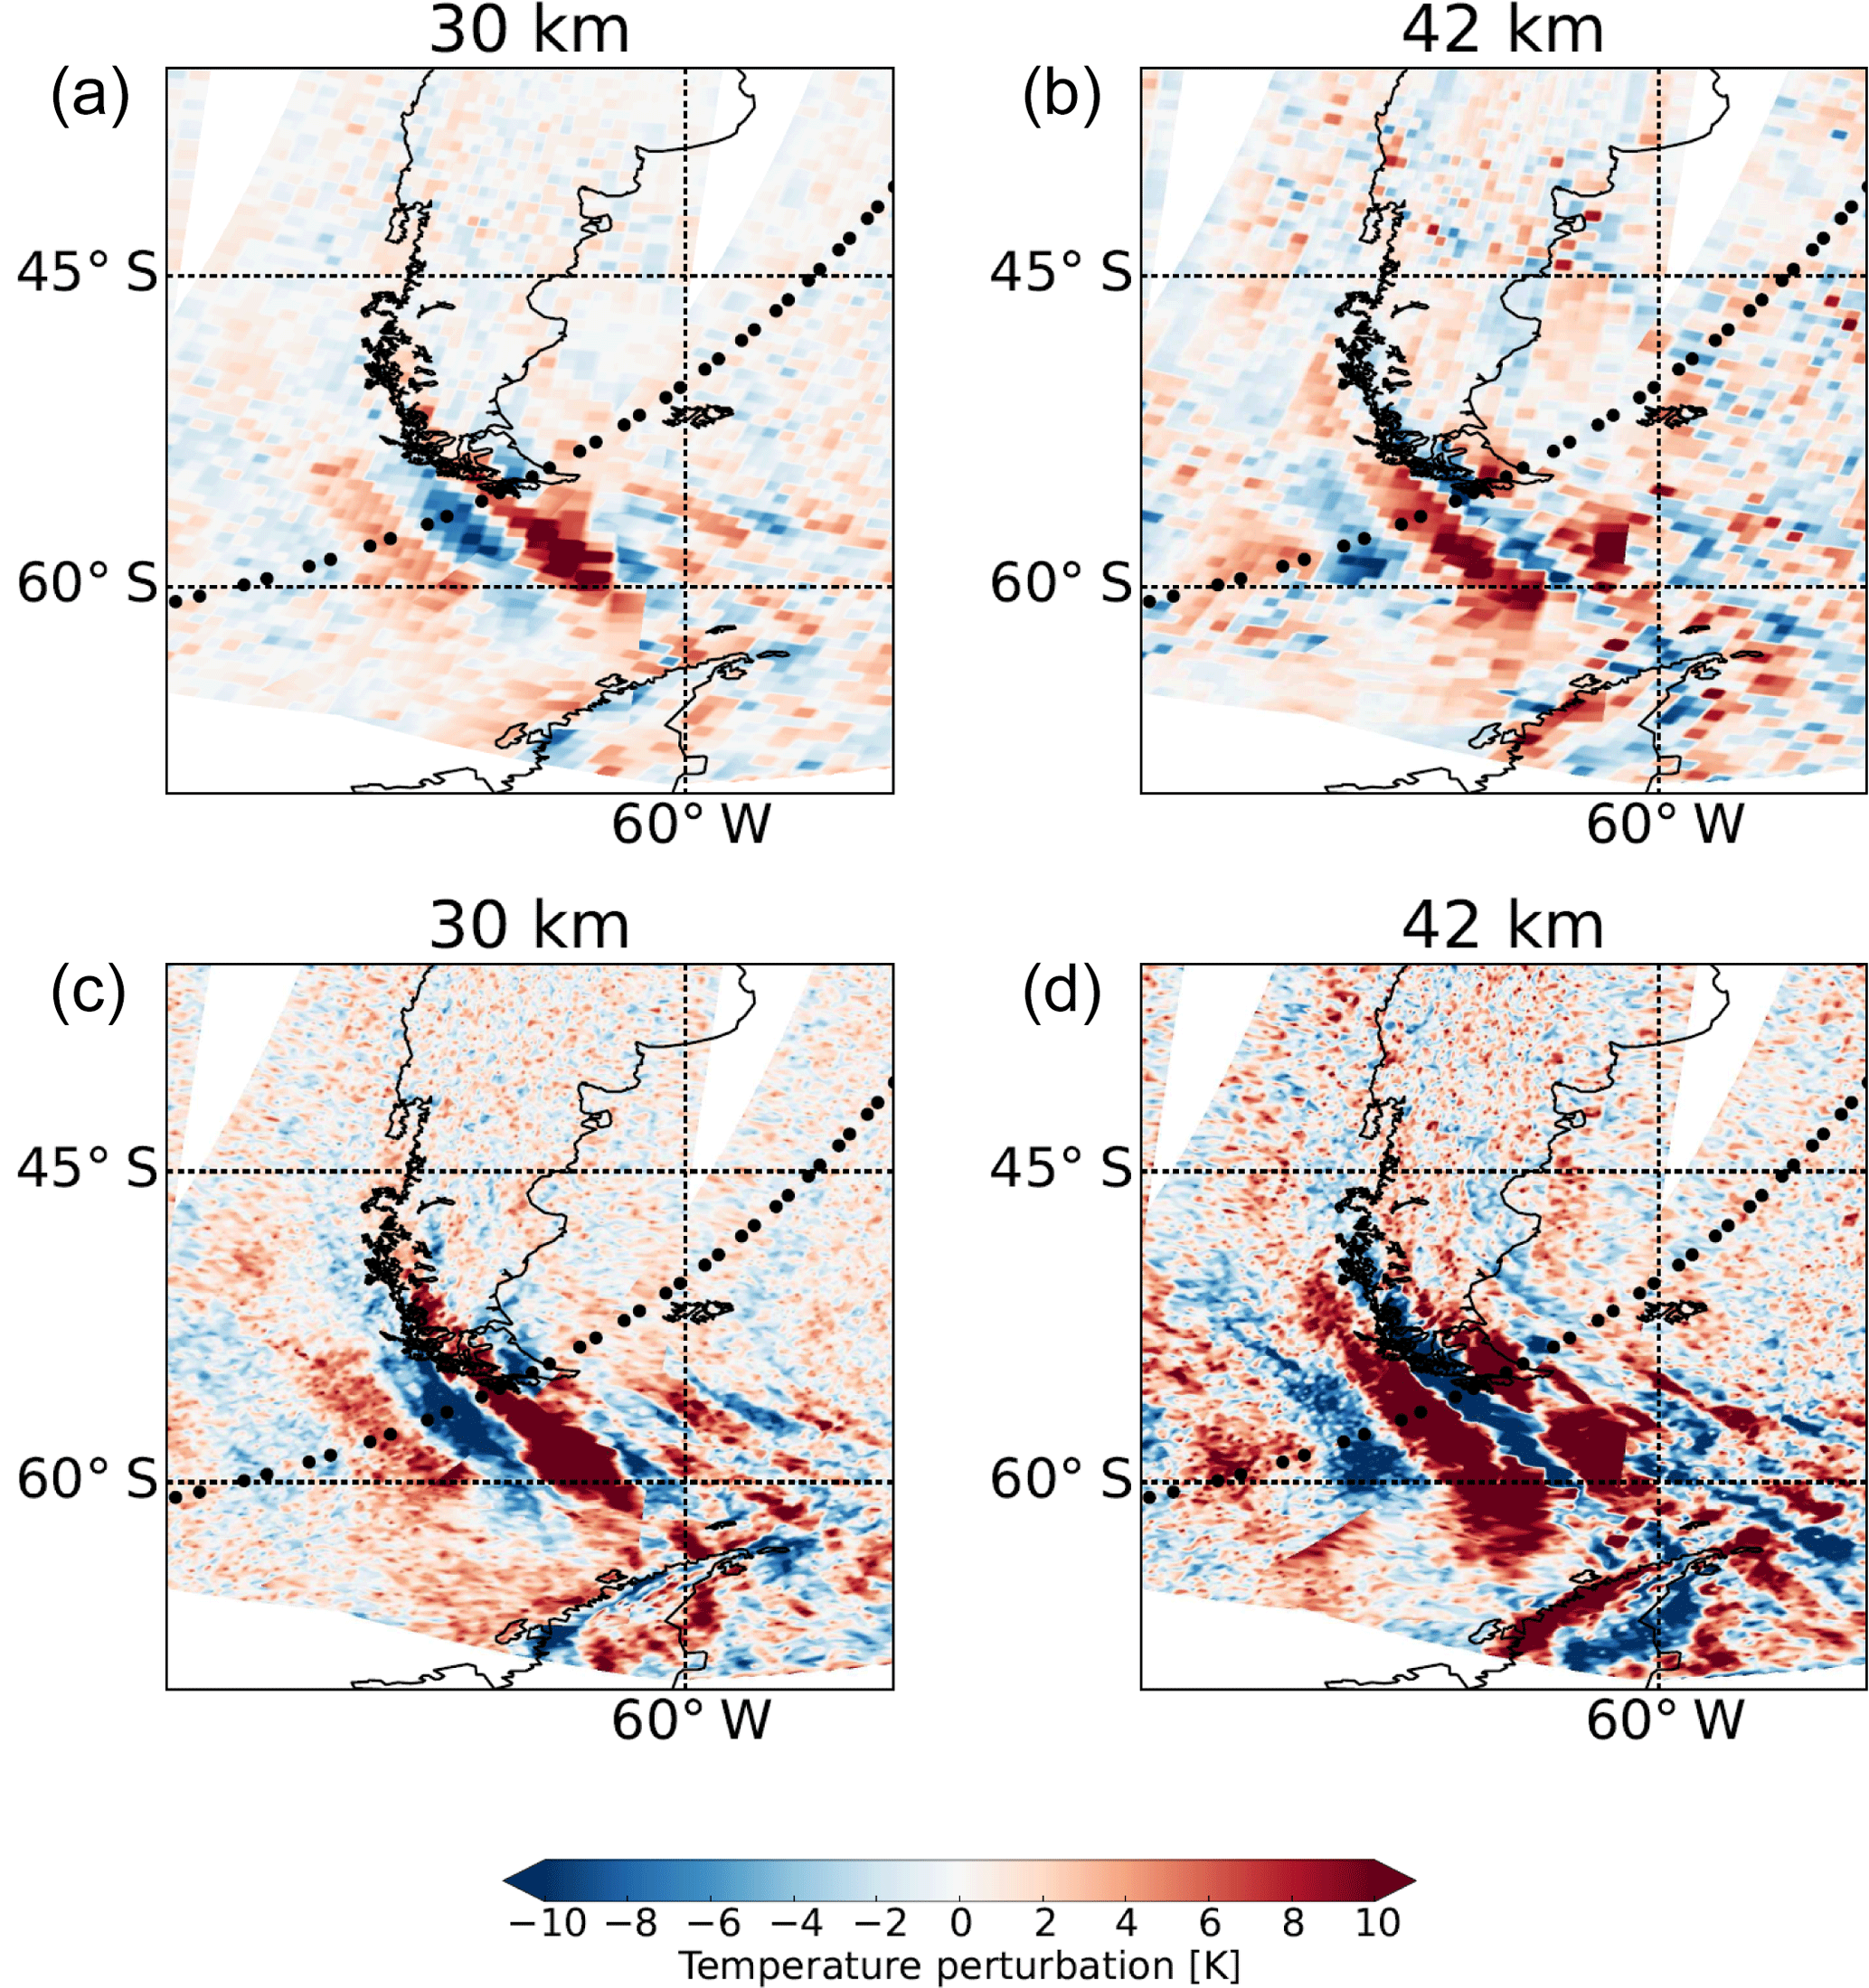
Figure 4Temperature perturbations from AIRS retrievals on 29 September 2006 at about 03:00 UTC at 30 km (a, c) and 42 km (b, d) for a mountain wave event near Tierra del Fuego. (a, b) AIRS operational retrieval. (c, d) AIRS high-resolution retrieval. Black circles indicate the locations of HIRDLS profiles.
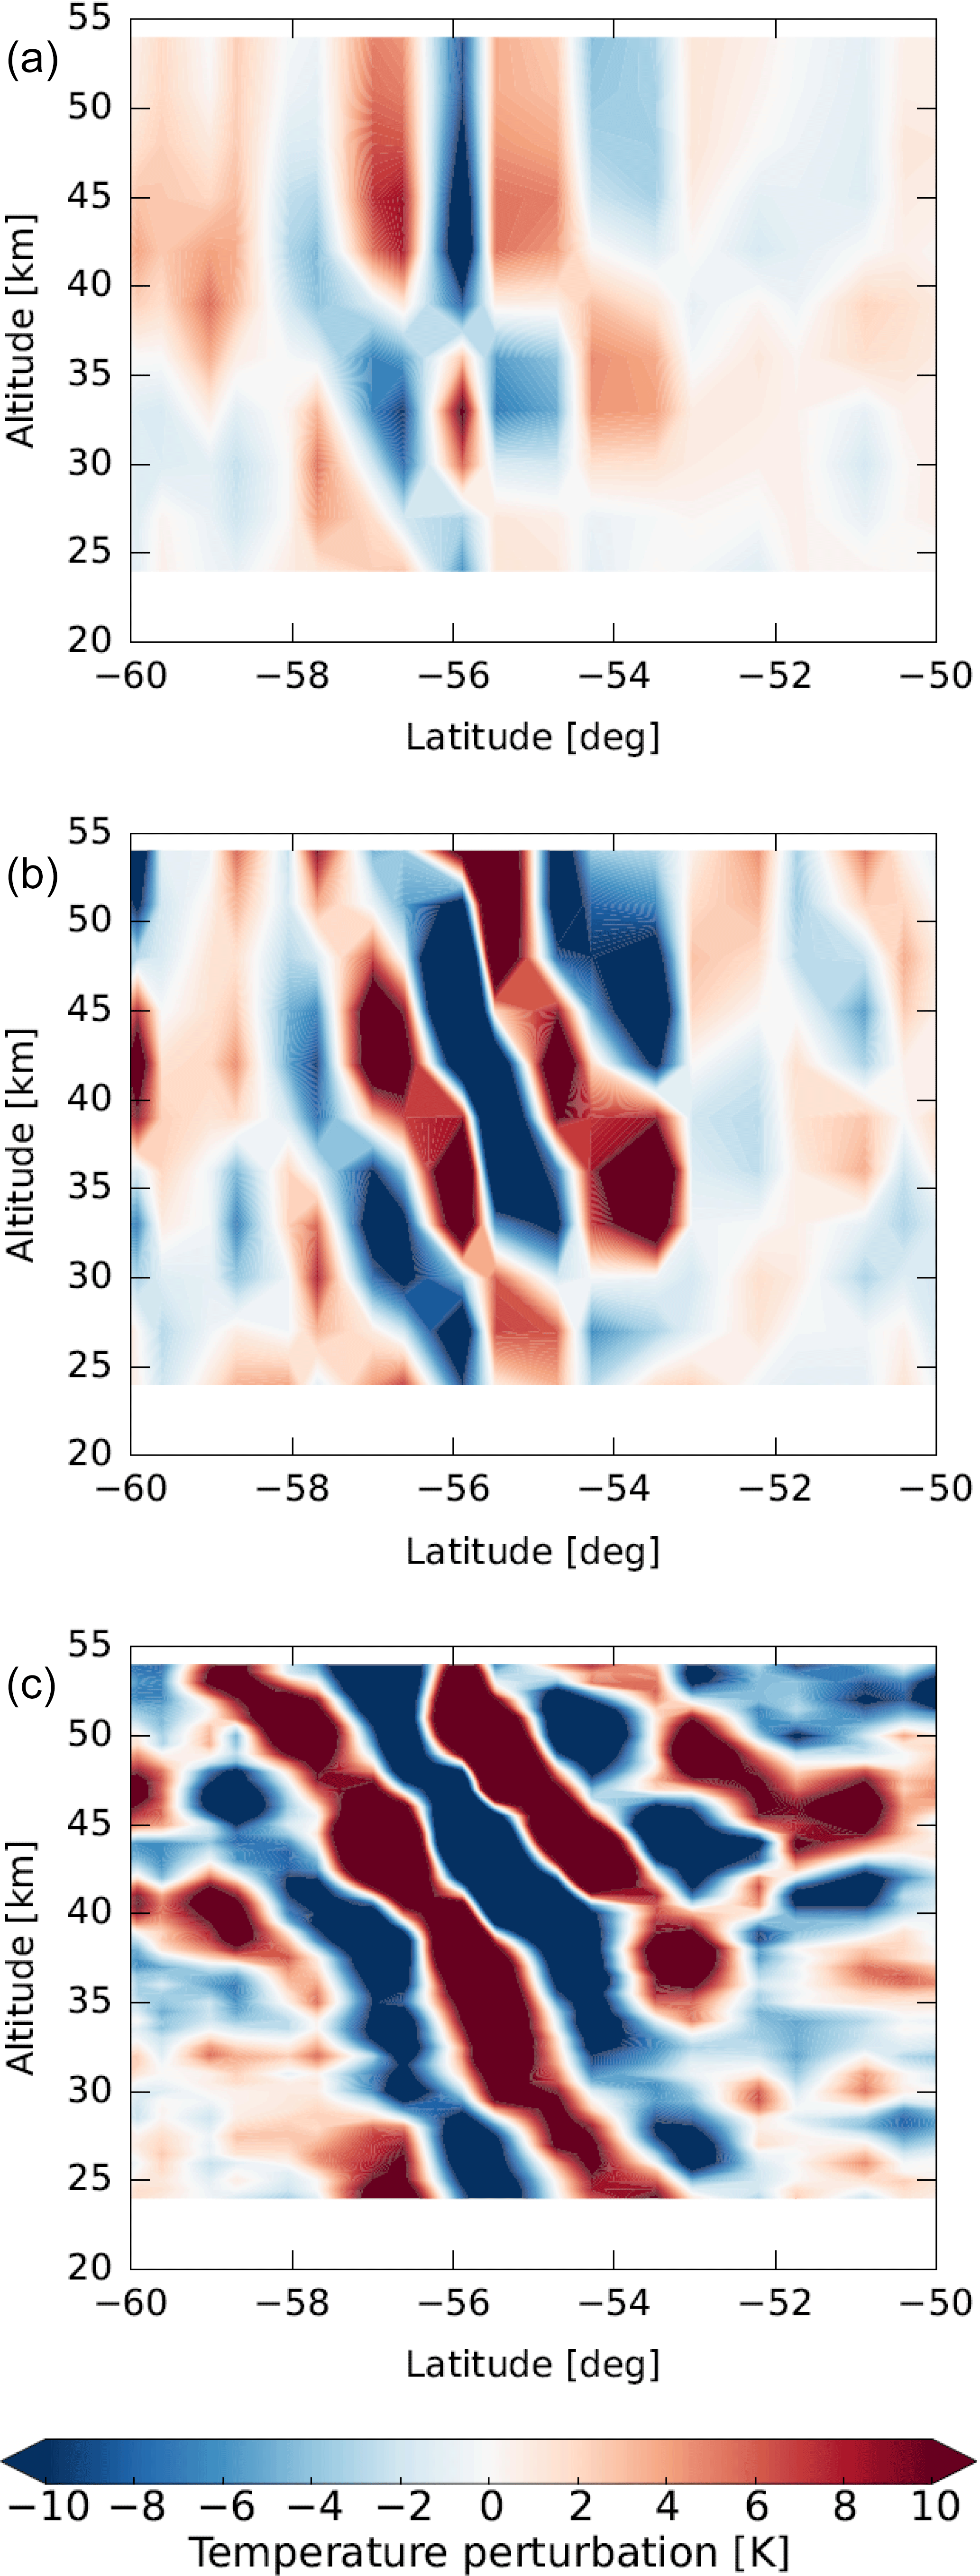
Figure 5Vertical cross sections of temperature perturbations on 29 September 2006 at about 03:00 UTC for a mountain wave event derived from the AIRS operational retrieval (a), the AIRS high-resolution retrieval (b), and HIRDLS (c).
The first case shows a mountain wave event at Tierra del Fuego, South America, on 29 September 2006 (Figs. 4 and 5). This case was also investigated by Hoffmann and Alexander (2009), but a different analysis of the HIRDLS data is used in this study. The results found by Hoffmann and Alexander (2009) are reproduced successfully. The vertical maps and cross sections of the temperature perturbations from the AIRS high-resolution retrieval and HIRDLS agree well in amplitude and phase structure of the mountain wave event. Hoffmann and Alexander (2009) attributed remaining small differences in the vertical phase structure of the observed waves to the different vertical resolution of both instruments. Note that the AIRS operational retrieval also shows this event, but the retrieved wave amplitudes are significantly lower. The vertical resolution of the operational retrieval is also significantly degraded compared with the high-resolution retrieval above 40–45 km. Hoffmann and Alexander (2009) attributed this to stronger smoothing constraints in the operational retrieval.
The second case study shows a non-orographic wave event over the southern Indian Ocean on 8 August 2007 (Figs. 6 and 7), which was likely initiated by jet or storm sources. Figure 8 shows in the upper panel (a) a zonal average of the horizontal wind of ERA-Interim and in the lower panels (b, c) the horizontal winds at 243 hPa (about 10 km) and 13.9 hPa (about 30 km). In the zonal average of the horizontal wind the jets at the upper troposphere lower stratosphere and in the polar stratosphere are clearly seen. The maps at 243 and 13.9 hPa show the polar front jet, too. The exit region of the jets, where gravity wave generation is common, is located at the position of the wave event. Figure 9 shows 8.1 µm brightness temperature measurements of AIRS, which cover a spectral window region and are sensitive to surface or cloud emissions. Low brightness temperatures indicate the presence of high clouds associated with a storm system in the study area, which could also be a source for the gravity wave event. The temperature perturbation maps show that the HIRDLS track is at the edge and catches mostly the western part of the wave event. Nevertheless, the vertical cross sections of the AIRS high-resolution and HIRDLS retrievals show a similar structure, with larger amplitudes in HIRDLS and slightly larger vertical wavelengths in AIRS. The coarser vertical resolution of AIRS is obvious in the vertical cross section and results in an attenuation of the amplitudes and coarser vertical structures than for HIRDLS. This effect increases with altitude, which can be attributed to decreasing vertical resolution of the AIRS retrieval with height. The observed phase shift with altitude is expected, because of the time difference between AIRS and HIRDLS measurements of 100 min and the non-orographic source of the gravity waves. A comparison between the AIRS operational and high-resolution retrieval shows a severe attenuation of the amplitude of the wave event and the coarser horizontal resolution of the operational data. These case studies illustrate that despite the rather different sensitivity functions AIRS and HIRDLS are capable of observing gravity waves from the same sources in individual events.
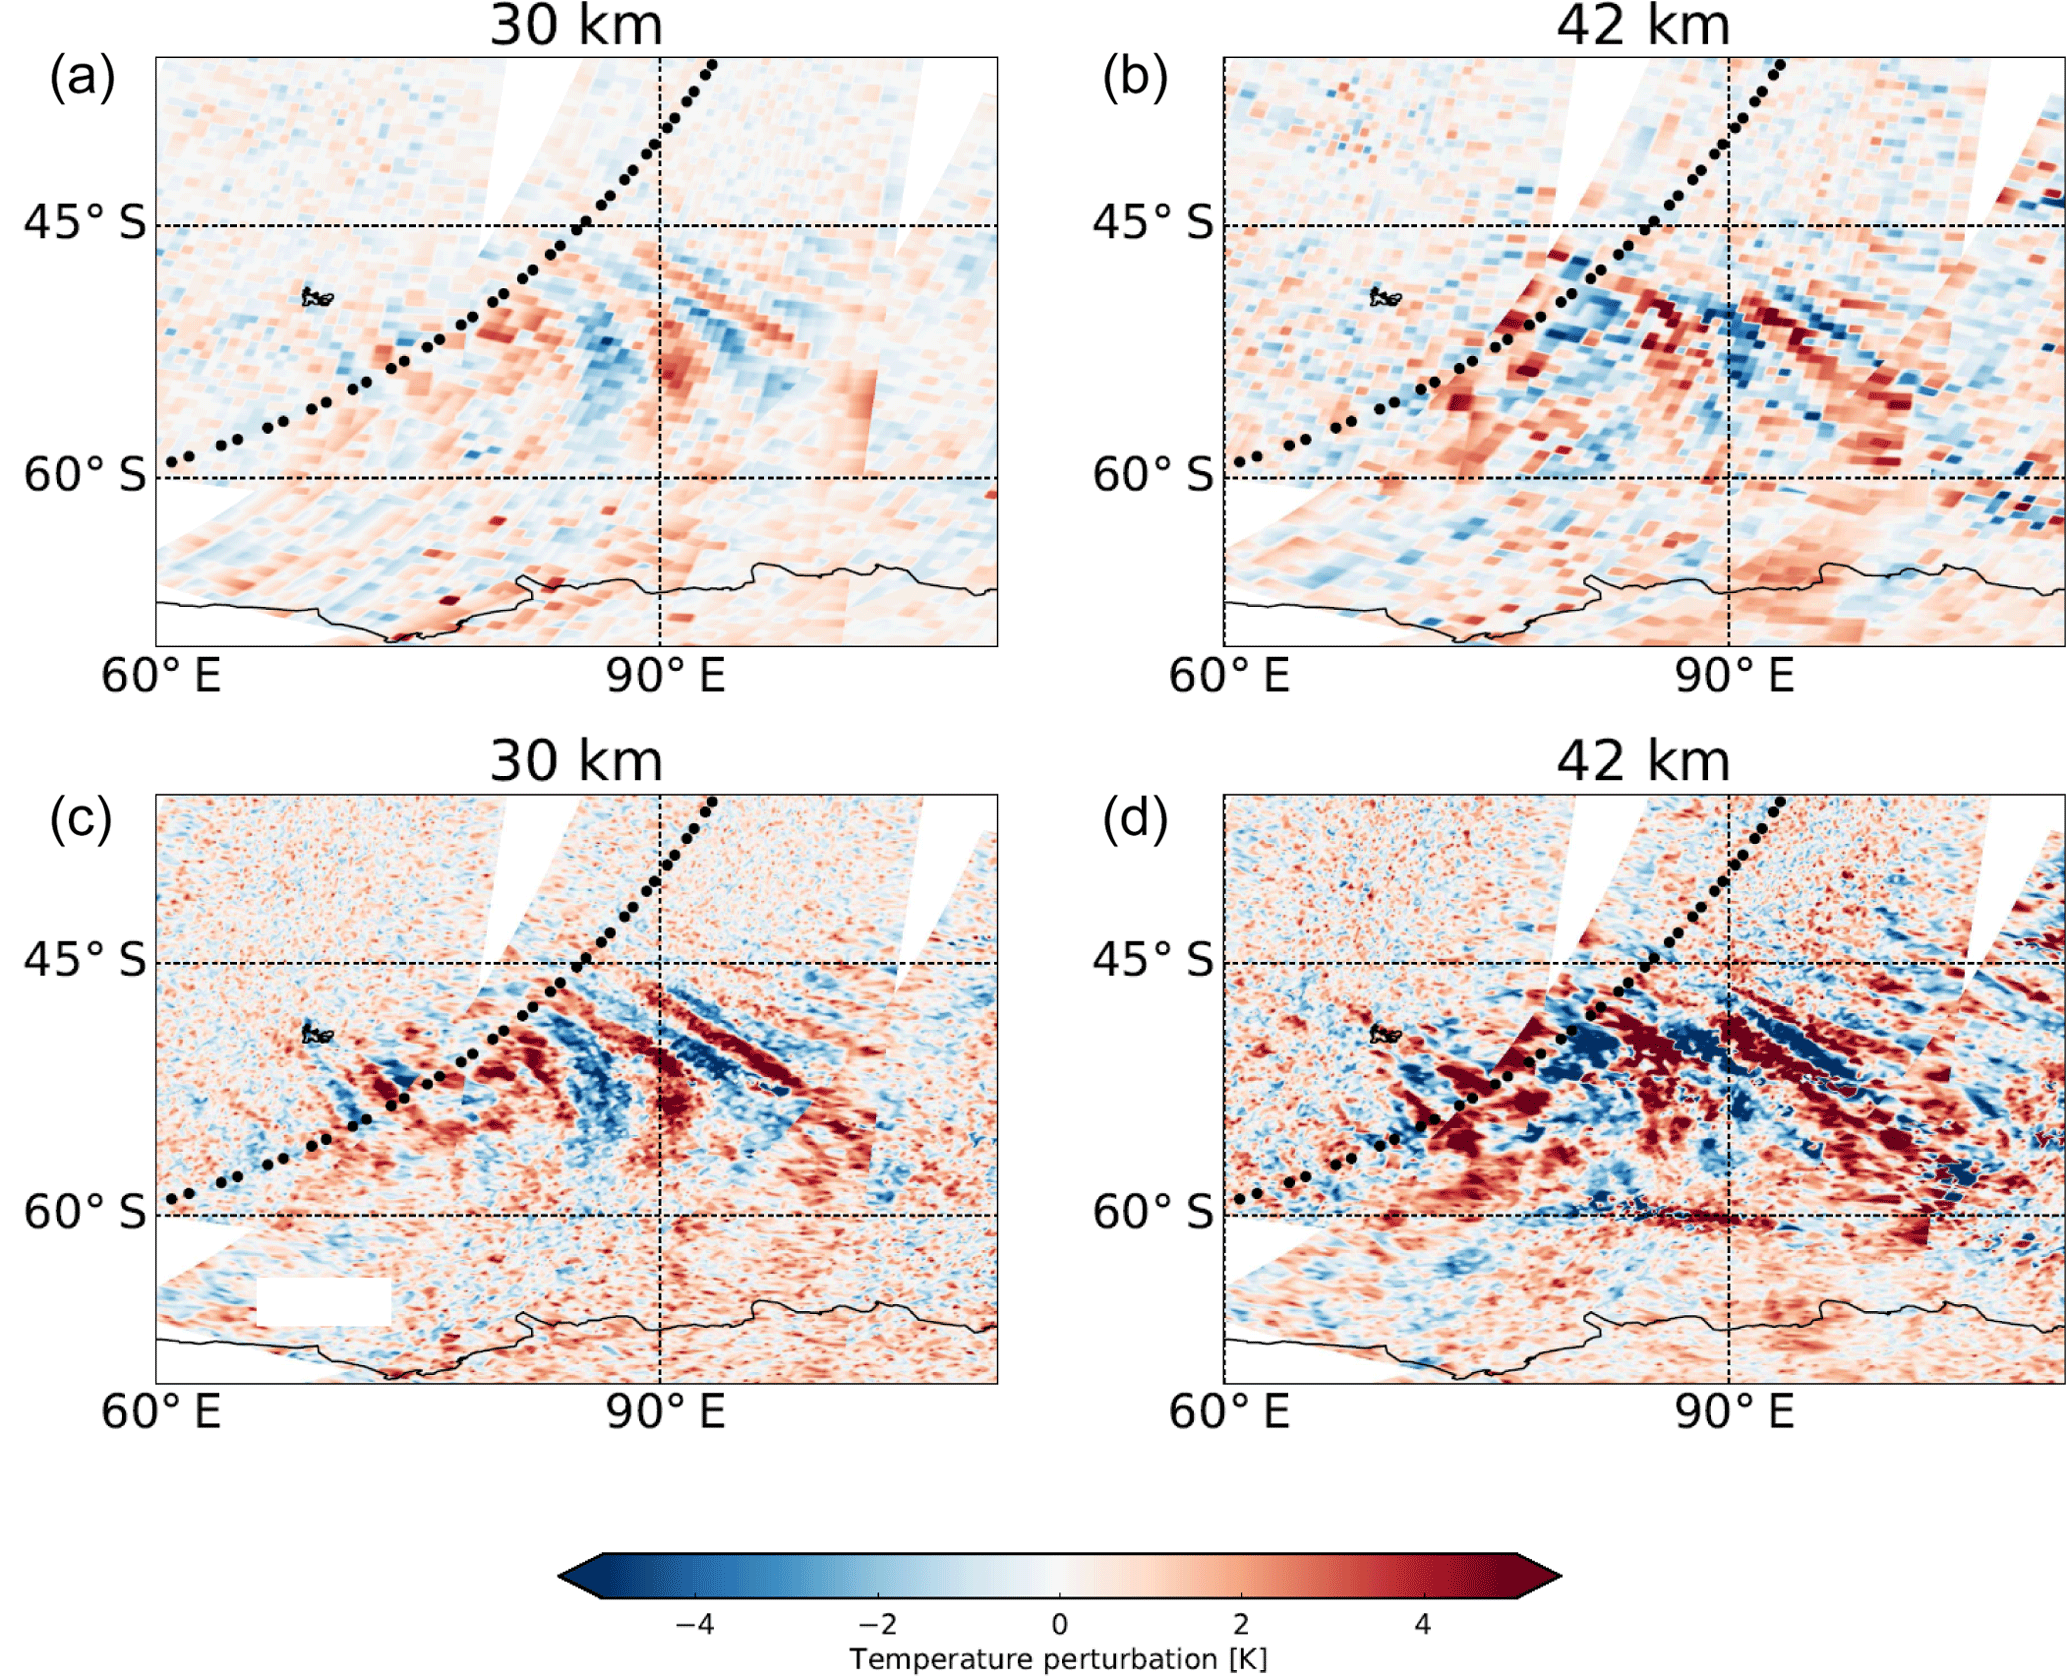
Figure 6Same as Fig. 4 but for a non-orographic gravity wave event over the southern Indian Ocean on 8 August 2007 at about 17:00 UTC.
3.2 Time series of gravity wave variances
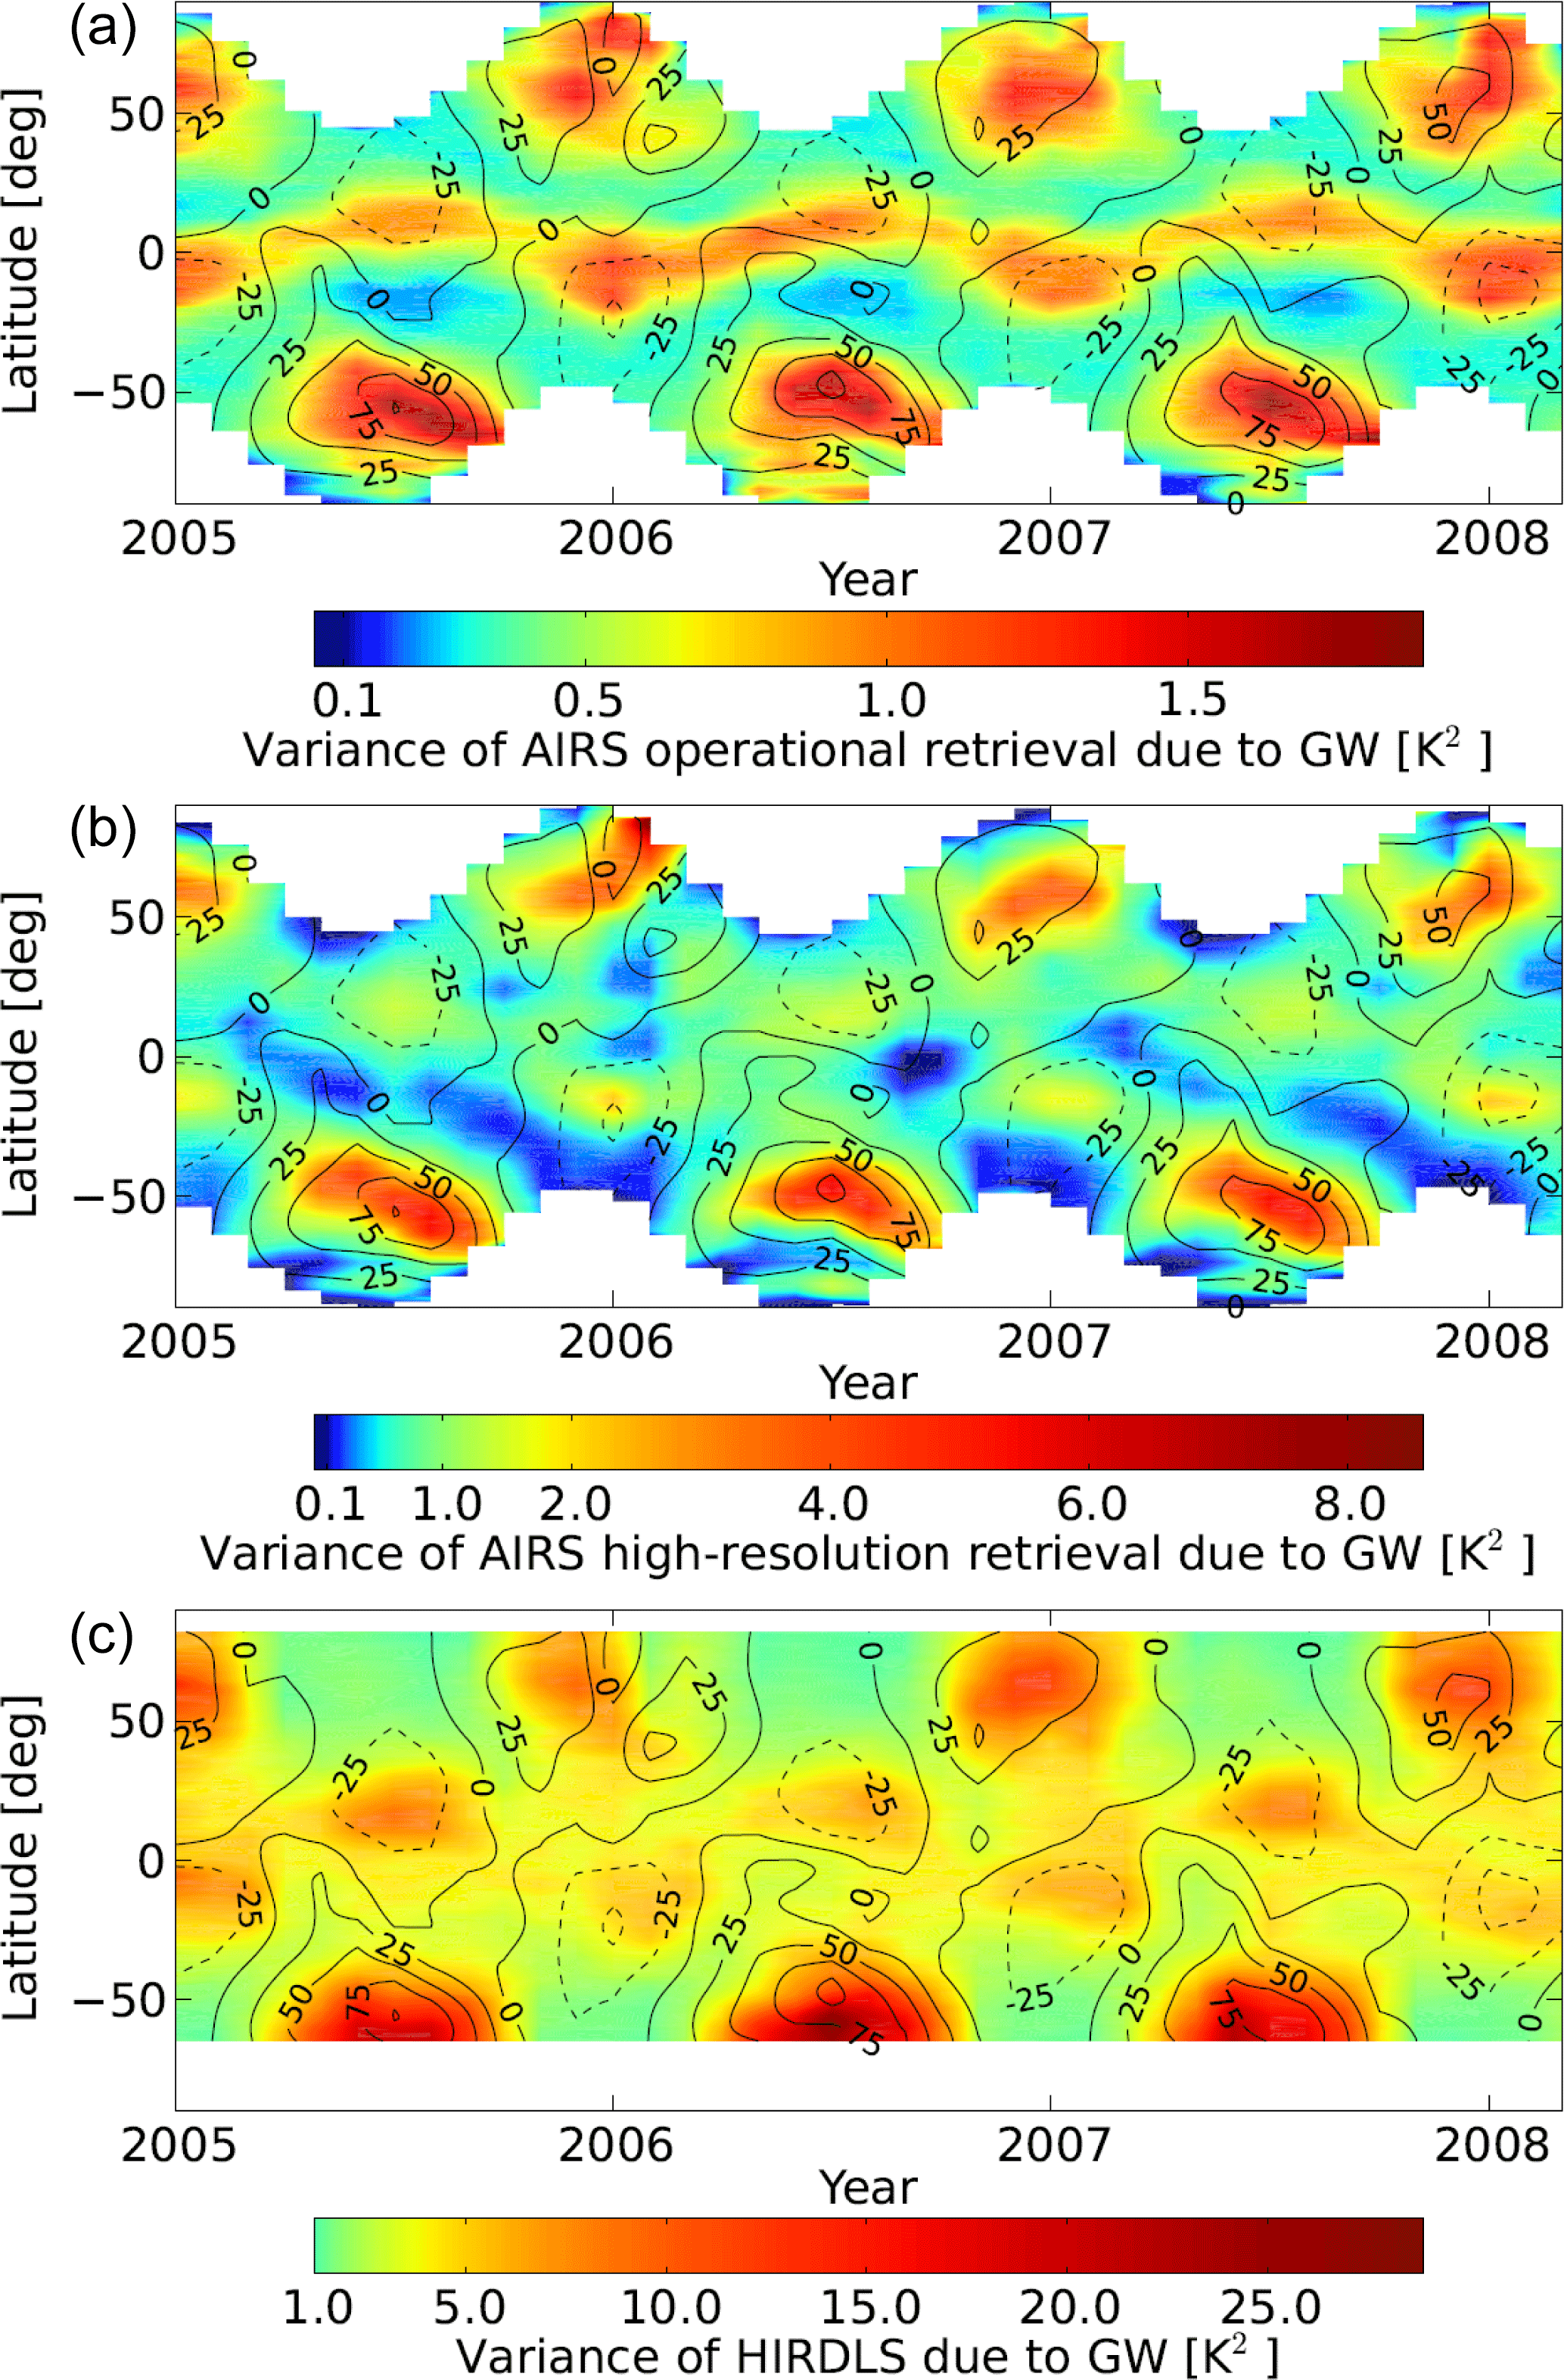
This section focuses on time series of gravity wave variance of AIRS and HIRDLS at about 30 and 42 km altitude during January 2005 to March 2008. The temporal development and latitudinal structure of the gravity wave variance at 30 km is shown in Fig. 10 and at 42 km in Fig. 11. A detailed picture for four selected latitudes at 42 km is given by Fig. 12. Additionally, in all figures the zonal mean wind of ERA-Interim at the chosen altitude is shown. Latitudes 44∘ N and 47∘ S in Fig. 12 are chosen, because they are the maximum and minimum latitudes, which are completely covered by AIRS measurements. We found that the seasonal cycle is captured very well in the AIRS and HIRDLS data sets and the structure is rather similar. Apart from the wintertime maxima in the polar regions, gravity wave variance between 50∘ S and 50∘ N is usually between 0.1 and 0.5 K2 (30 km) and 0.5 and 2 K2 (42 km) for AIRS high-resolution retrieval and between 1 and 2 K2 (30 km) and 2 and 5 K2 (42 km) for HIRDLS. In the subtropics a weaker annual cycle with maxima during summertime and minima during wintertime is found. These summertime maxima have been observed before (e.g., Jiang et al., 2004b; Ern and Preusse, 2012; Hoffmann et al., 2014), and they have been attributed to stronger activity of deep convective sources during summer (e.g., Choi et al., 2012; Trinh et al., 2016). Additionally, a major effect is the modulation of wave amplitudes by the background winds. We found an annual cycle at high latitudes, which has its maxima during wintertime and its minima during summertime. The highest values are found at the polar vortex in the Southern Hemisphere with values up to 9 K2 for AIRS high-resolution retrieval and up to 29 K2 for HIRDLS. Between December 2006 and February 2007 a double-peaked maximum at 44∘ N is seen in AIRS high-resolution retrieval and HIRDLS. The second peak in both data sets could be related to a strong warming in the beginning of January 2007 (Rösevall et al., 2007). The enlarged peak in the HIRDLS data is mainly caused by short-vertical- and long-horizontal-wavelength waves that are not visible for AIRS. This becomes clear if Fig. 12 is compared to Fig. 13. The HIRDLS data which are filtered with the AIRS sensitivity function show a strongly reduced second peak which is more similar to the AIRS time series. AIRS high-resolution retrievals detected a double-peaked maximum between December 2005 and February 2006 at 44∘ N, which is not seen in HIRDLS at this latitude but somewhat further north. The same behavior was found by Wright et al. (2010) in zonal mean momentum flux measurements of HIRDLS. In January 2006 a major sudden stratospheric warming (SSW) occurred and the double-peak structure is likely related to the SSW. In the high-resolution retrieval of AIRS it could be seen, with a small delay, that the gravity wave activity is strengthening after the SSW when the zonal wind increases again. For an overview of gravity wave activity in the Northern Hemisphere polar region during recent winters see Ern et al. (2016). Hoffmann et al. (2016) discussed gravity wave activity located at Southern Hemisphere orographic hotspots and their correlation with background winds in more detail.
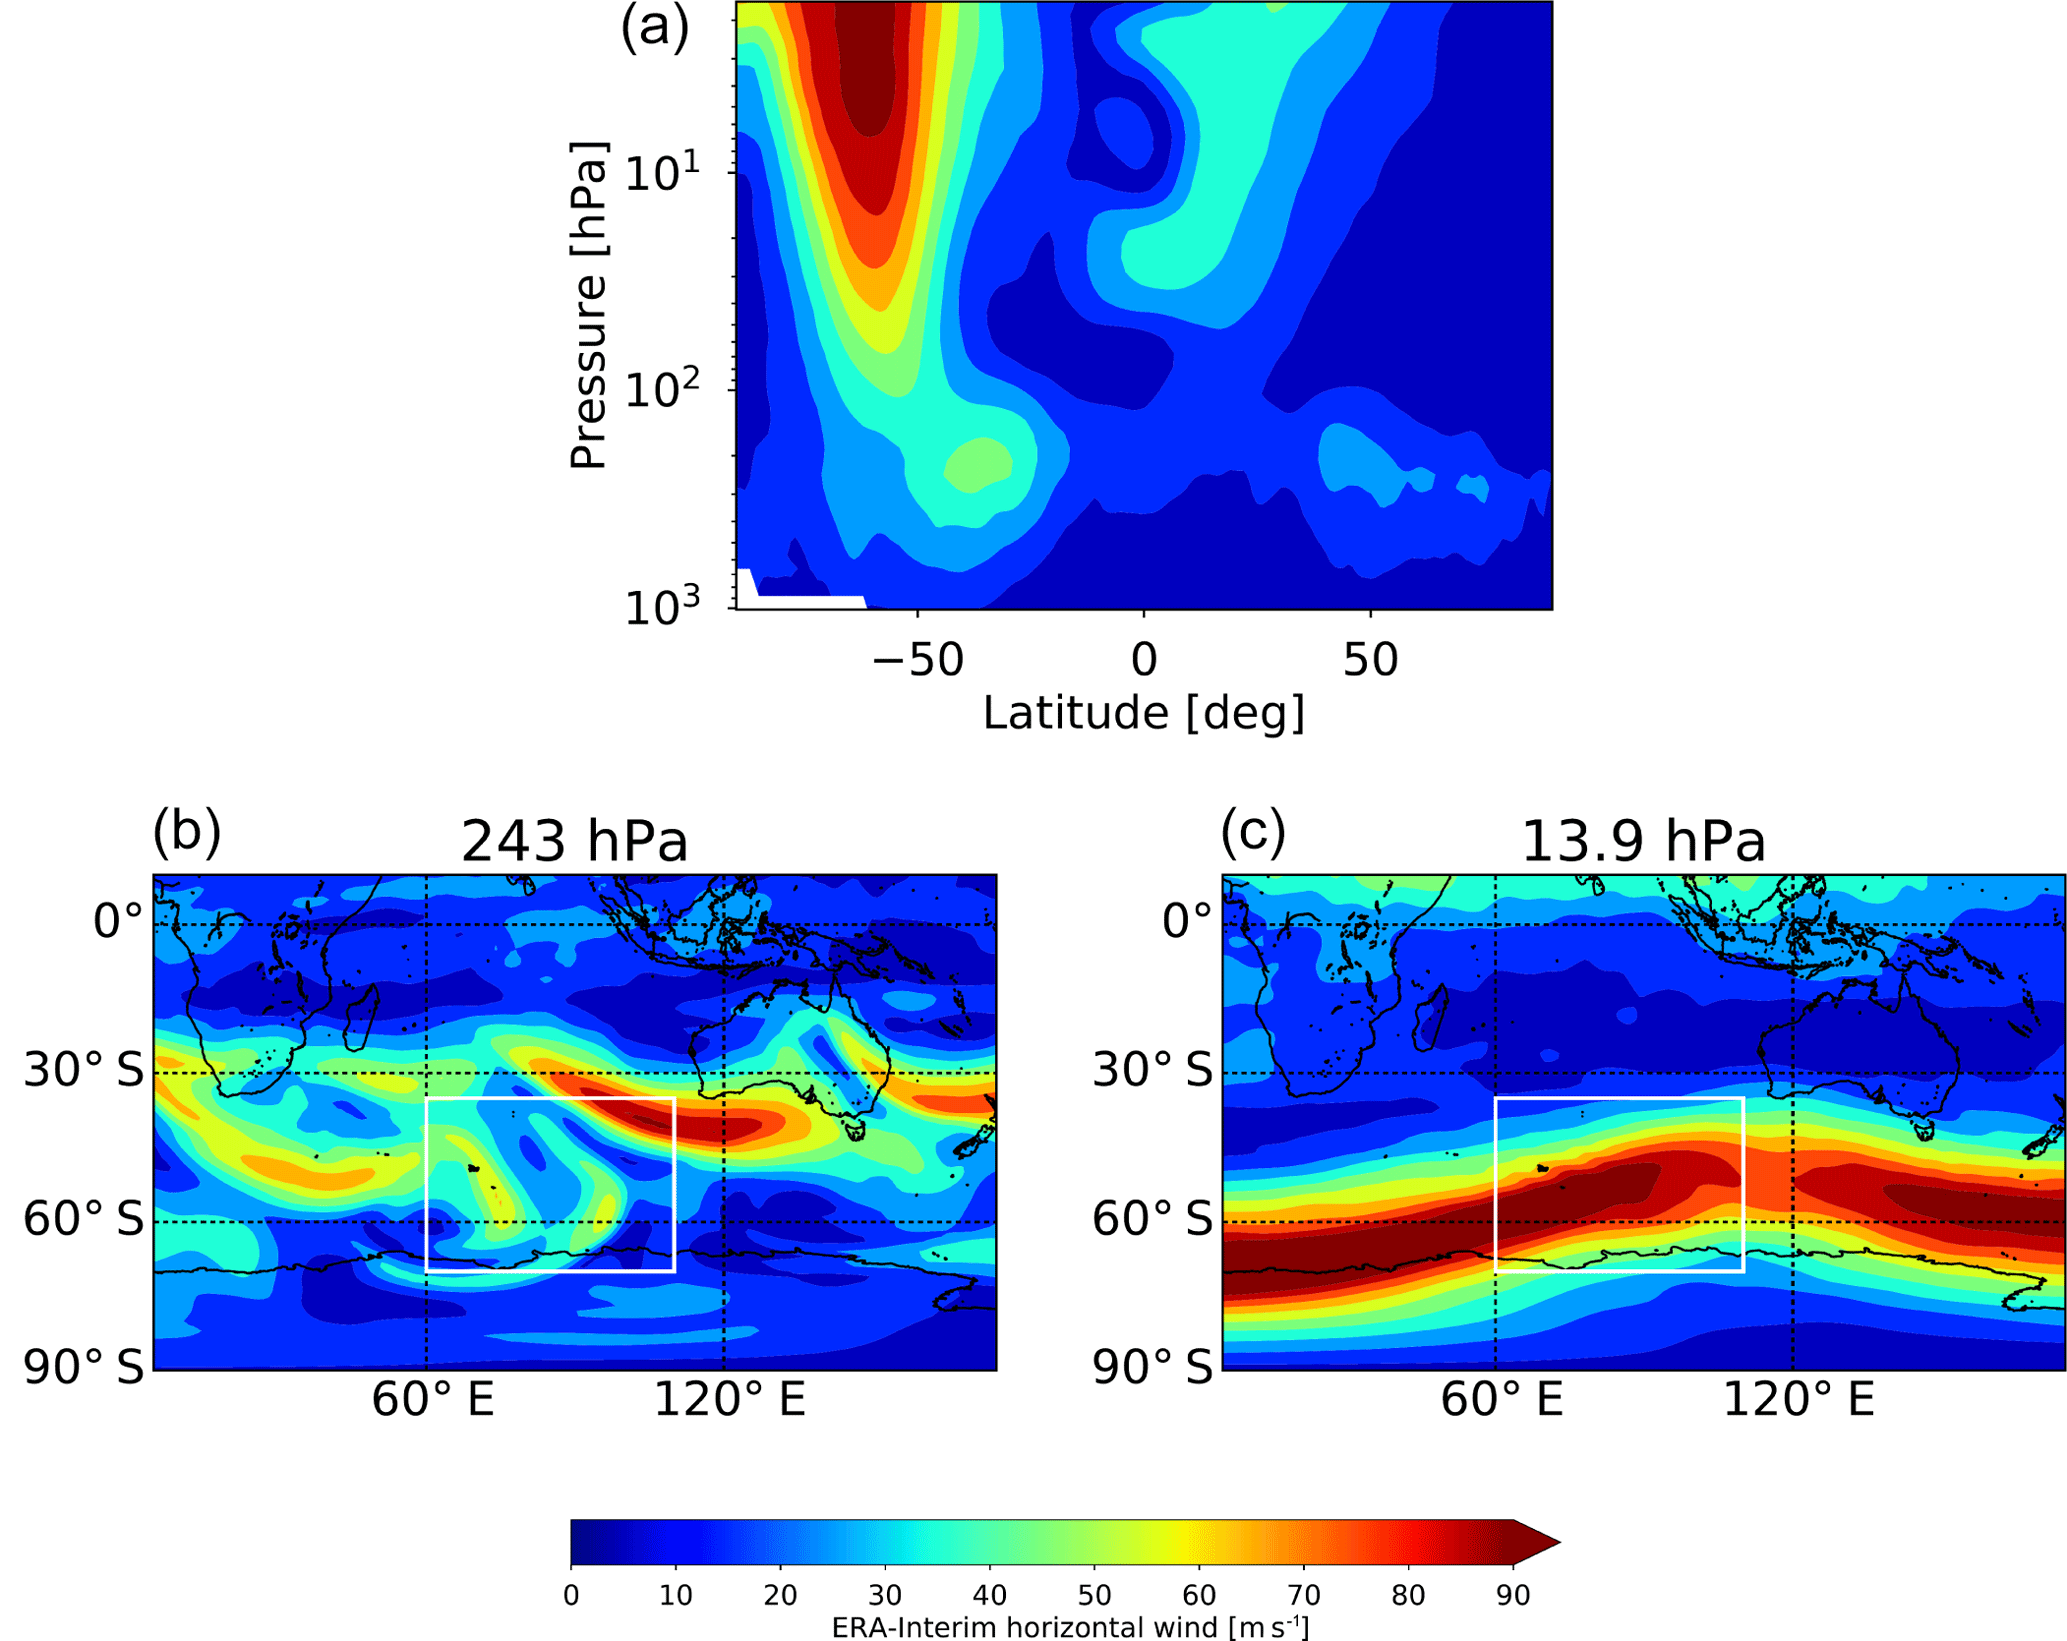
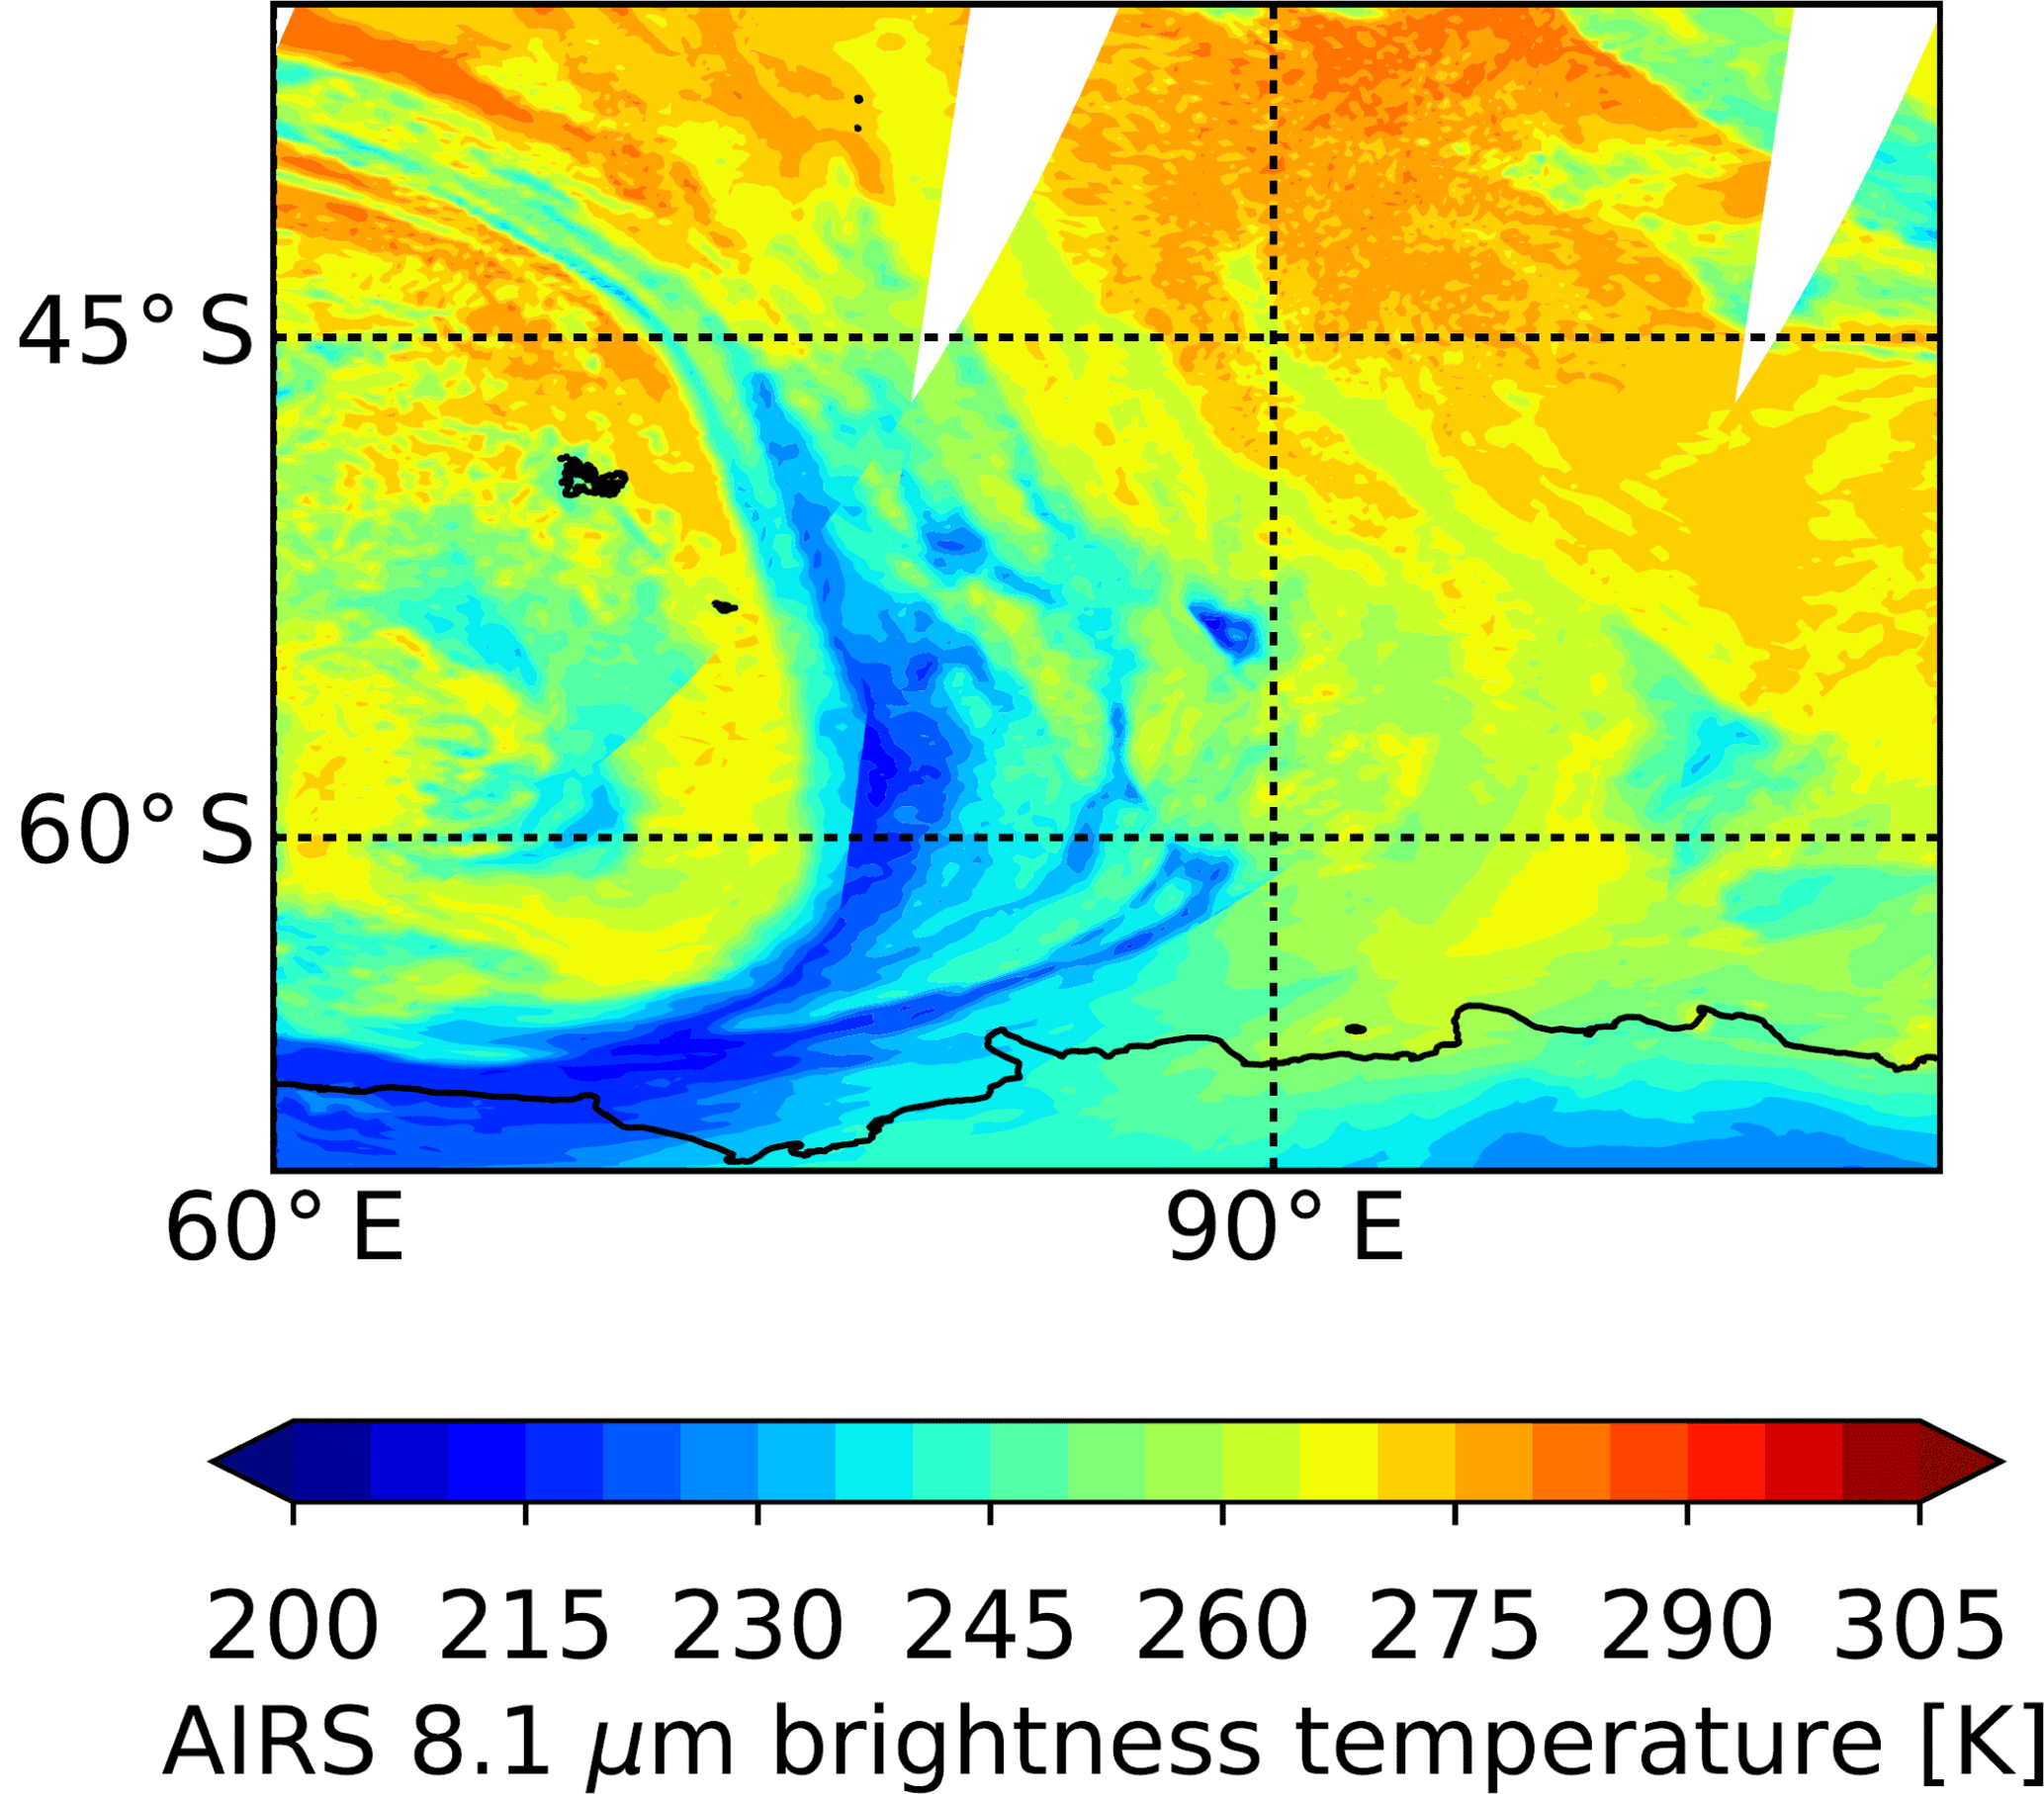
Figure 98.1 µm brightness temperature measurements of AIRS for a non-orographic gravity wave event over the southern Indian Ocean on 8 August 2007. Low brightness temperatures indicate the presence of high clouds associated with a storm system in the study area.
Comparing zonal winds at 2.5 hPa (about 42 km) and stratospheric gravity wave variances a strong correlation can be found for both AIRS and HIRDLS. The largest gravity wave variances occur in mid- to high-latitude regions where stratospheric zonal mean winds are ∼ 25 m s−1 or greater. At 44∘ N and 47∘ S the maxima during wintertime correspond with strong westerly zonal winds, up to 110 m s−1 at 47∘ S. At 20∘ N and 20∘ S maxima during summertime match well with strong easterly zonal winds. It is often observed that gravity wave activity is amplified in the presence of strong background winds (e.g., Wu and Waters, 1996a, b; Jiang and Wu, 2001; Wang and Geller, 2003). If the phase speeds of gravity waves are opposite to the background wind their saturation amplitudes are enlarged. An additional effect is that the vertical wavelength of these gravity waves is Doppler-shifted towards longer vertical wavelengths, which are better visible in particular for AIRS. A more detailed discussion of this effect can be found, for example, in Ern et al. (2015) and Hoffmann et al. (2016). This also means that long-vertical-wavelength gravity waves are preferentially found in regions of strong background winds. This is the likely reason why in Fig. 11 the patterns of AIRS gravity wave variances match the distribution of the background winds somewhat better than the HIRDLS variances.
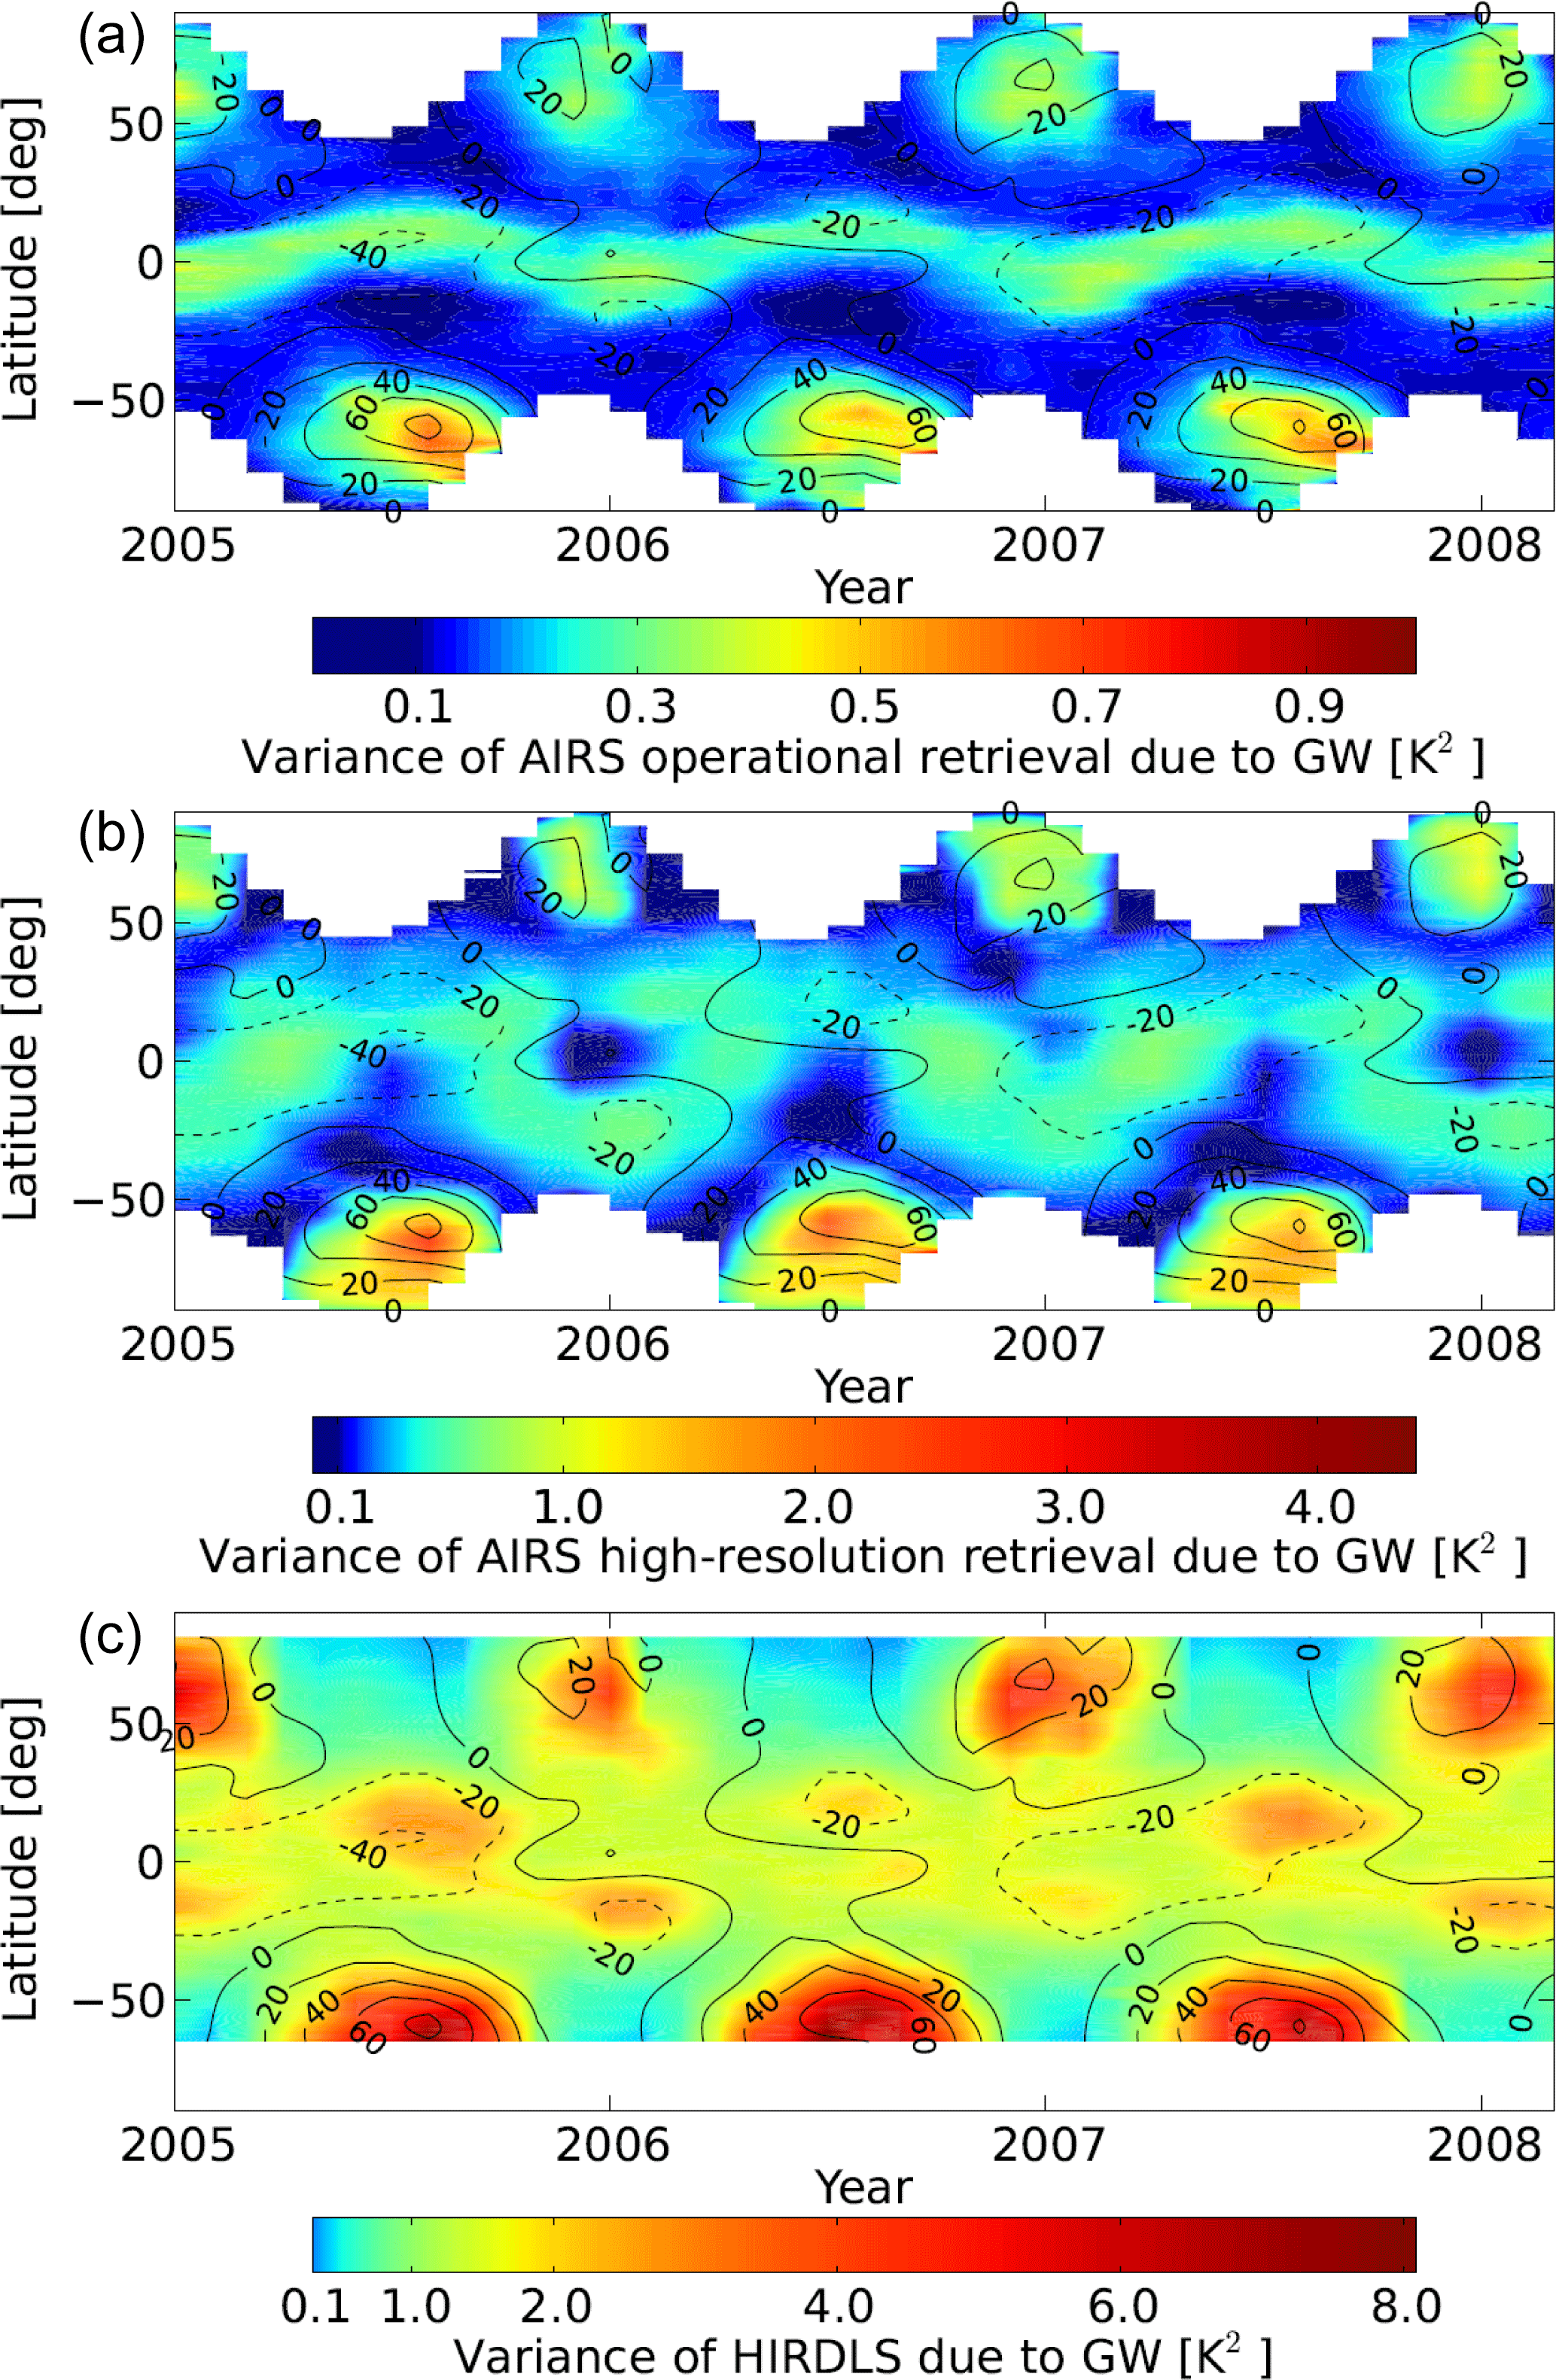
Figure 10Time series of monthly temperature variances due to gravity waves between 2005 and 2008 at 30 km altitude. (a) AIRS operational retrieval. (b) AIRS high-resolution retrieval. (c) HIRDLS. Contour lines indicate zonal mean wind from ERA-Interim. Please note the different color bar ranges.
The values of the operational retrieval are a factor of 2 lower if they are compared to the AIRS high-resolution retrieval. At 44∘ N no double peak related to the SSW is seen in AIRS operational retrieval values between December 2005 and February 2006 and December 2006 and February 2007. At 20∘ N and 20∘ S gravity wave variances during wintertime are not increasing, which is seen in both the AIRS high-resolution retrieval and in the HIRDLS data. Obviously, the AIRS high-resolution retrieval is more suitable for the analysis of gravity waves than the AIRS operational retrieval due to the better horizontal resolution and improved vertical resolution.
3.3 Influence of sensitivity functions on gravity wave variances
As we conducted a full spectral analysis of the HIRDLS data, we are able to apply the AIRS sensitivity functions to the HIRDLS data in order to estimate the fraction of variances that is actually observed by both instruments. For this procedure horizontal and vertical wavelengths of the gravity waves are required. From the HIRDLS measurement track consecutive altitude profiles, which observe the same gravity wave, are used to determine horizontal wavelengths. This approach has been used before to estimate gravity wave momentum fluxes from satellite data (e.g., Ern et al., 2004). The average sampling distance between these consecutive altitude profiles is 90 km, and the profiles are observed within only about 15 s. Therefore often the same gravity wave should be observed in consecutive profiles, and due to the short sampling times the wave field should not change due to the oscillation frequency of the wave. The horizontal structure of the wave is responsible for phase differences. Nevertheless, to ensure that in successive profiles the same gravity wave is looked at, only waves with the vertical wavelengths differing by no more than 40 % in the two profiles of a pair are selected. The fraction of selected pairs with respect to the total number of possible pairs is thereby reduced to about 60–70 % at low latitudes, and to about 50–60 % at high latitudes. Gravity wave variances due to the strongest gravity wave components in all single profiles without pair selection and of the selected pairs are almost exactly the same. Therefore the selected pairs are considered to be representative for the global distribution of all gravity waves. However, there will always be an angle α between the horizontal wave vector of the gravity waves kGW and the sampling track of the satellite. The observed horizontal wave number kobs will therefore underestimate kGW by a factor cos (α), and the horizontal wavelength will be overestimated by a factor 1∕cos (α).
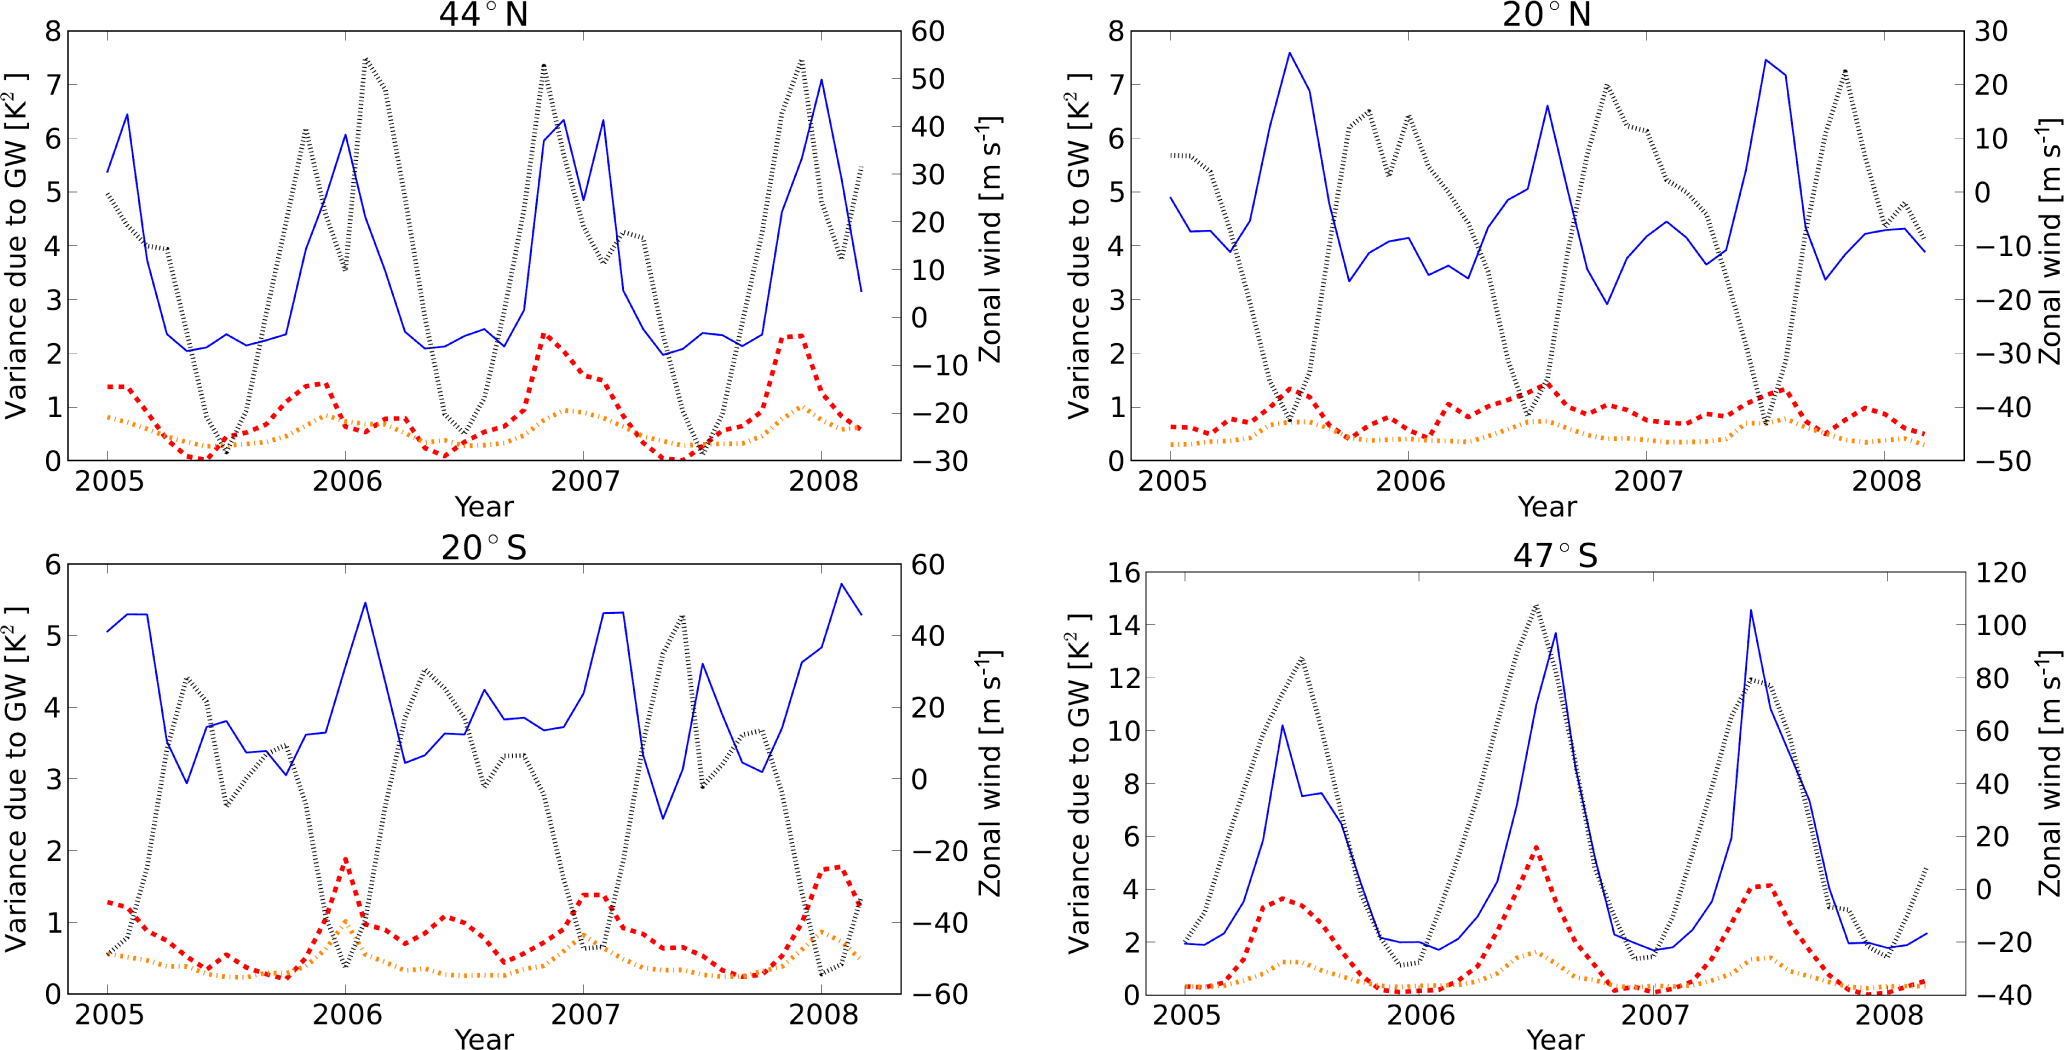
Figure 12Time series of monthly mean gravity wave variances for measurements between 2005 and 2008 at 42 km altitude and different latitudes (see plot titles). Orange dash-dotted lines: AIRS operational retrieval. Red dashed lines: AIRS high-resolution retrieval. Blue lines: HIRDLS. Black dotted lines indicate zonal mean winds at 2.5 hPa from ERA-Interim.
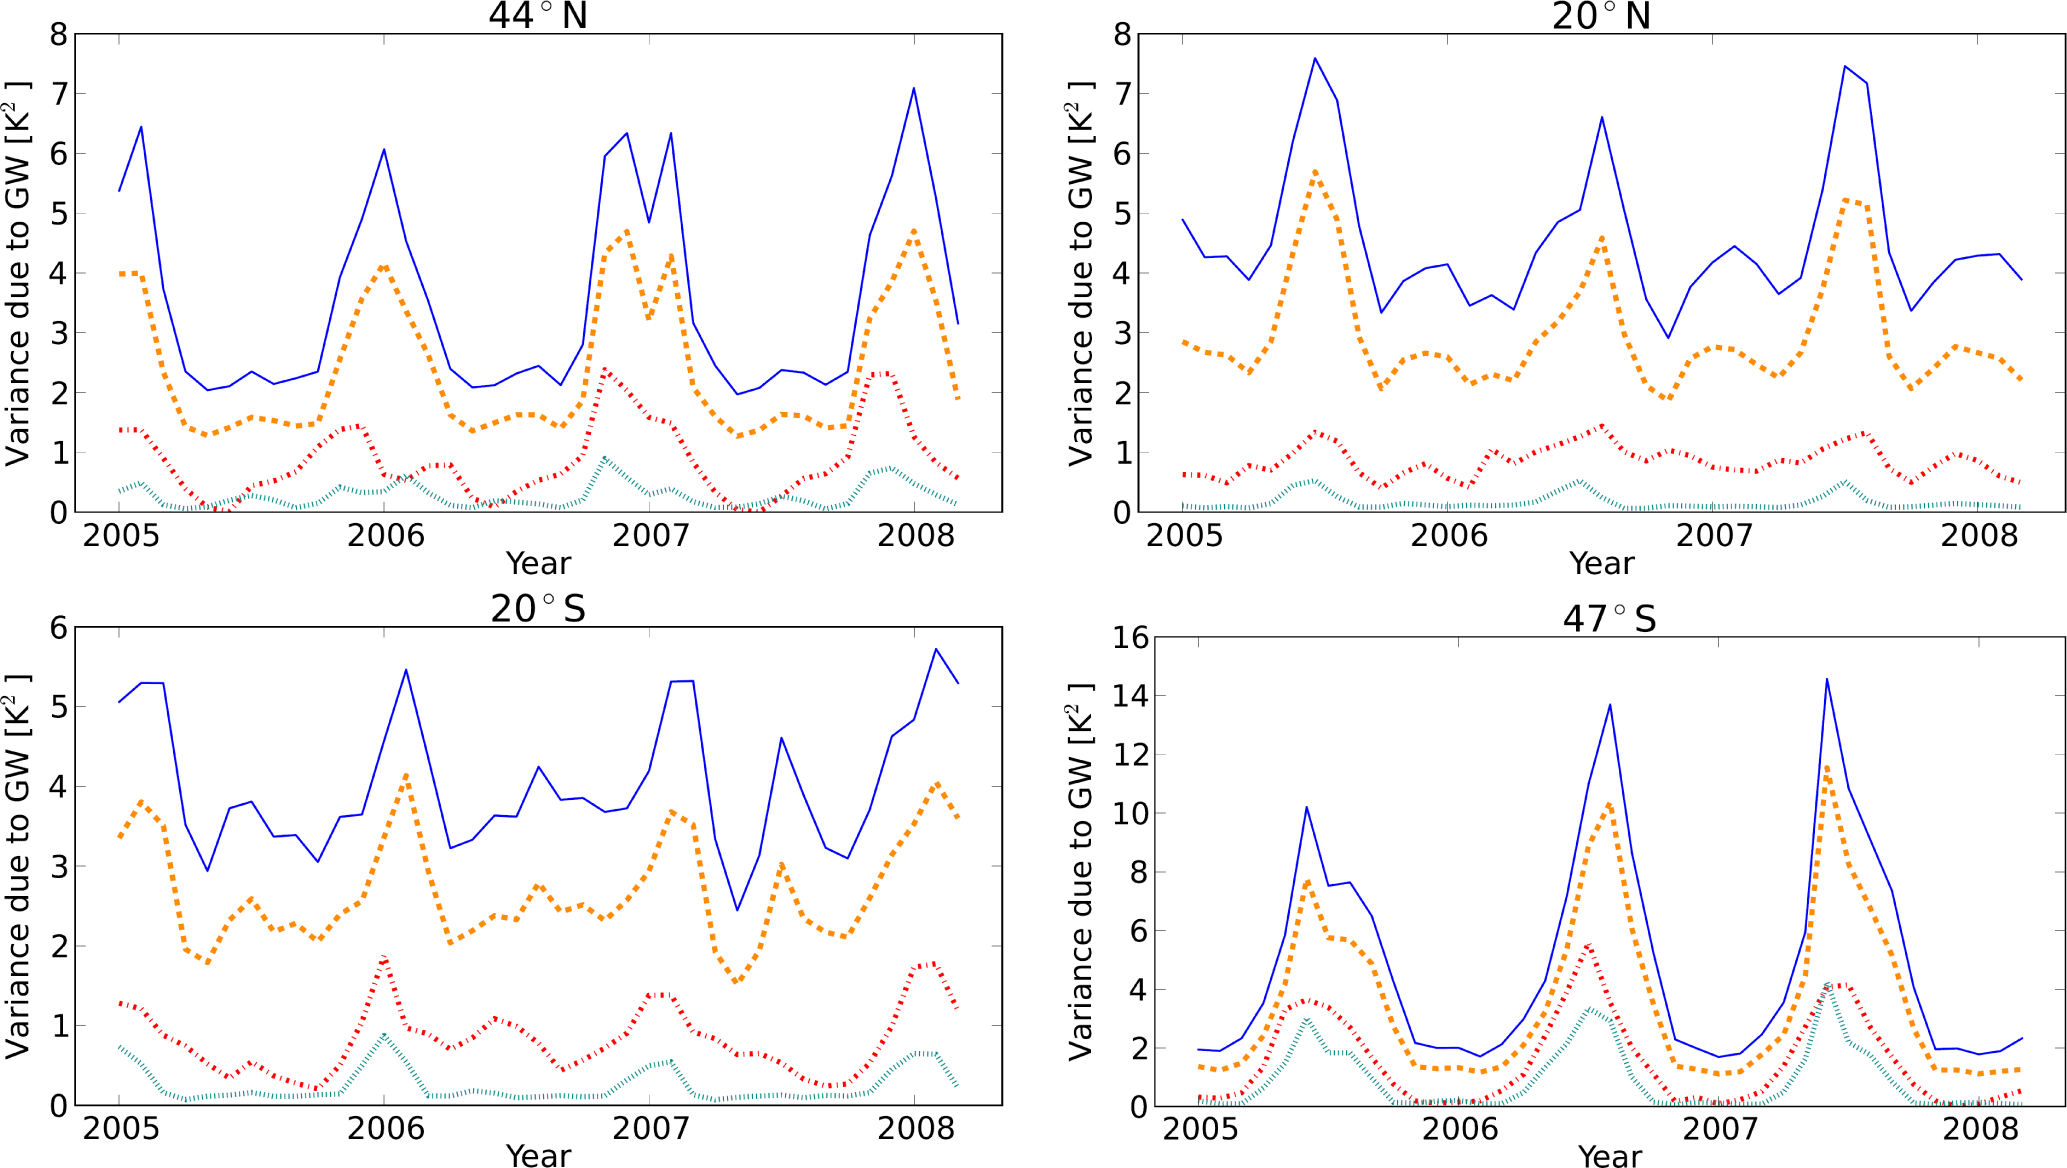
Figure 13Time series of gravity wave variances at 42 km altitude and different latitudes (see plot titles). Red dash-dotted lines: AIRS high-resolution retrieval. Blue lines: HIRDLS. Orange dashed lines: HIRDLS with MEM/HA. Cyan dotted lines: HIRDLS filtered with AIRS sensitivity function. Note that filtered HIRDLS data are scaled by a factor of 5.
Figure 13 illustrates the influence of the observational filter of AIRS to the HIRDLS gravity wave variances by showing HIRDLS gravity wave variances with and without the AIRS observational filter being applied. Additionally, gravity wave variances of the AIRS high-resolution retrieval are shown. Plotted are time series of the gravity wave variance at 42 km altitude for the same latitudes as in Sect. 3.2 from HIRDLS, HIRDLS with MEM/HA, AIRS high-resolution retrieval and HIRDLS filtered with AIRS sensitivity function. Note that for a better identification the results from HIRDLS filtered data sets were scaled by a factor of 5. The HIRDLS gravity wave variance is significantly reduced after the AIRS observational filter is applied. HIRDLS filtered with AIRS sensitivity function reproduces at the maximum 8 % at 47∘ S and at the minimum 3 % at 20∘ N of the HIRDLS gravity wave variance. Values of HIRDLS including the AIRS observational filter are considerably lower than values directly from the AIRS high-resolution retrieval. This confirms that there is only small spectral overlap of the HIRDLS and AIRS sensitivity functions and points to an under-representation of small horizontal-scale waves in HIRDLS data compared with AIRS. Still, relative variations are very similar, and some structures seen in AIRS became visible in HIRDLS gravity wave variances after including AIRS observational filter. At 44∘ N the filtered HIRDLS gravity wave variances show the double-peak structure between December 2005 and February 2006, which is not seen in unfiltered data. The gravity wave activity is strengthening after the SSW when the zonal wind increases again in both filtered HIRDLS gravity wave variances. This is also seen in AIRS, albeit somewhat delayed. Between December 2005 and February 2006 and between December 2006 and February 2007 the filtered HIRDLS gravity wave variances are more gradually decreasing with time at 44∘ N after the peak value than in the unfiltered HIRDLS gravity wave variances. This behavior is very similar to the AIRS gravity wave variances. The analysis confirms that AIRS and HIRDLS gravity wave measurements can be considered complementary to each other, because they observe different sections of the gravity wave spectrum. The relative variations in all time series are similar, which indicates that these variations are induced by similar physical processes (e.g., wind effects and source mechanisms). Therefore it might be possible to transfer directional information obtained for AIRS to HIRDLS observations.
In this study we compared temperature variances of AIRS and HIRDLS to evaluate the relationship of their stratospheric gravity wave observations. Our analyses are performed on the HIRDLS operational retrievals, AIRS operational retrievals, and a dedicated AIRS high-resolution data set. AIRS (nadir) and HIRDLS (limb) have different measurement geometries, and therefore they have opposite sensitivities to horizontal and vertical wavelengths, which is shown by their sensitivity functions. However, a comparison of individual orographic and non-orographic gravity wave events showed that stratospheric wave structures of AIRS and HIRDLS agree very well, which is consistent with earlier work of Hoffmann and Alexander (2009). With respect to the AIRS high-resolution retrievals, the case studies demonstrate that AIRS and HIRDLS agree generally well in amplitude and phase structure for a mountain wave event and a non-orographic wave event. AIRS has coarser vertical resolution, which results in an attenuation of the amplitude and coarser vertical structures than for HIRDLS, which is much more evident for the AIRS operational retrieval. However, AIRS has a much higher horizontal resolution, and the propagation direction of the wave can be clearly identified in geographical maps of the wave events. The horizontal orientation of the phase fronts can be deduced from AIRS 3-D temperature fields. This is a restricting factor for gravity wave analyses of current limb measurements.
A comparison of time series of gravity wave variances of AIRS and HIRDLS revealed that HIRDLS gravity wave variances show an offset due to regular background activity of gravity waves and are typically about a factor of 3–5 larger than for AIRS. This is attributed to the different measurement geometries and the limitation to long vertical wavelengths for AIRS in particular. We calculated a momentum flux factor, which gives a rough estimate of how much waves of given horizontal and vertical wavelengths and amplitude contribute to momentum flux if they exist in the real atmosphere. It indicates that the waves with short horizontal and long vertical wavelengths seen by AIRS contribute significantly to momentum flux, even if the AIRS temperature variance may be small compared to HIRDLS. Despite this systematic difference, the seasonal and latitudinal distributions of stratospheric gravity wave activity found in both data sets are rather similar. Overall, these variations are related to the well-known seasonal patterns of gravity wave activity with summertime maxima in the subtropics and wintertime maxima at high latitudes (e.g., Ern et al., 2011, 2013; Hoffmann et al., 2013, 2014). Several sources of gravity waves can produce these maxima. The summertime maxima in the subtropics occur because of the stronger activity of deep convective sources during summer. Gravity wave variances show great enhancement in the winter hemisphere over mid- and high latitudes where the polar night jet is strongest (Plougonven and Zhang, 2014), and due to strong mountain wave activity (Jiang et al., 2004a). The seasonal distribution of stratospheric gravity wave activity found in this study agrees well with other satellite climatologies based on limb measurements (e.g., Preusse et al., 2009a). The gravity wave variances agree qualitatively well with the AIRS climatology of Gong et al. (2012), which is based on 15 µm radiance measurements, and of Hoffmann et al. (2013), which is based on 4.3 µm brightness temperature variances.
Wright et al. (2011) compared HIRDLS, COSMIC, and SABER detections of stratospheric gravity waves during the years 2006–2007 and concluded that, when allowing for their different vertical resolution capabilities, the three instruments reproduce each other's results for magnitude and vertical scale of perturbations to within their resolution limits in approximately 50 % of the cases. In a second study (Wright et al., 2016a) investigated whether the dissimilar results of many gravity wave studies are primarily of instrumental or methodological origin. Their analysis is located around the southern Andes and Drake Passage with different gravity-wave-resolving instruments. Their results show important similarities and differences. Limb sounder measurements show high intercorrelation between any instrument pair. AIRS and radiosonde observations tend to be uncorrelated or anticorrelated with the other data sets, suggesting very different behavior of the wave field in the different spectral regimes accessed by each instrument. Evidence of wave dissipation is seen and varies strongly with season. A first combination of nadir instrument (AIRS) and limb instrument (MLS) observations was done by Wright et al. (2016b), who analyzed the wave momentum flux and the full 3-D direction of propagation for a mountain wave case study over the Andes. In contrast to these three studies, we focus on a global statistical comparison of a nadir instrument (AIRS) and a limb instrument (HIRDLS) over a measurement period of 3 years. The data sets of AIRS and HIRDLS are found to be complementary to each other. AIRS primarily observes only the short-horizontal- and long-vertical-wavelength waves, and HIRDLS primarily observes only the long-horizontal- and short-vertical-wavelength waves. To address the differences between the AIRS and HIRDLS distribution in terms of the different sensitivity functions, a simple approach of filtering HIRDLS data with the AIRS sensitivity function was used. Still, relative variations are very similar, and some structures seen in AIRS became visible in HIRDLS gravity wave variances after including the AIRS sensitivity function. Of course, not all differences can be explained by this simple approach, but it might be possible to transfer directional information obtained for AIRS to HIRDLS observations for case studies.
In summary, despite the different sensitivity function, AIRS and HIRDLS are capable of observing gravity waves from the same sources in individual events, and their relative distributions of gravity wave variances agree well. The analysis confirms that AIRS and HIRDLS observe largely different sections of the gravity wave spectrum, but they complement each other, and thus larger parts of the gravity wave spectrum can be observed. Combining the observations would be a great chance for gravity wave research in the future.
AIRS and HIRDLS data are distributed by the NASA Goddard Earth Sciences Data Information and Services Center (GES DISC; https://disc.gsfc.nasa.gov/). ERA-Interim data were obtained from the European Centre for Medium-Range Weather Forecasts (ECMWF; http://apps.ecmwf.int/datasets/data/interim-full-daily/).
All authors contributed to the design of the study and provided input to the manuscript. The data for the study were processed by CIM, and additionally she produced all figures and drafted the text. The 3-D AIRS retrieval scheme was developed and the 3-D AIRS data used were produced by LH and MJA. ME produced the HIRDLS data set used. QTT provided the HIRDLS observational filter data.
The authors declare that they have no conflict of interest.
The work by Manfred Ern was partly supported by Deutsche
Forschungsgemeinschaft (DFG) grant no. PR 919/4-1 (MS-GWaves/SV).
The article processing charges for this open-access
publication were covered
by a Research
Centre of the Helmholtz Association.
Edited by: Markus Rapp
Reviewed by: Marvin A. Geller and two anonymous referees
Alexander, M. J.: Interpretations of observed climatological patterns in stratospheric gravity wave variance, J. Geophys. Res.-Atmos., 103, 8627–8640, https://doi.org/10.1029/97JD03325, 1998. a
Alexander, M. J. and Pfister, L.: Gravity wave momentum flux in the lower stratosphere over convection, Geophys. Res. Lett., 22, 2029–2032, https://doi.org/10.1029/95GL01984, 1995. a
Alexander, M. J. and Teitelbaum, H.: Observation and analysis of a large amplitude mountain wave event over the Antarctic peninsula, J. Geophys. Res.-Atmos., 112, D21103, https://doi.org/10.1029/2006JD008368, 2007. a
Alexander, M. J., Gille, J., Cavanaugh, C., Coffey, M., Craig, C., Eden, T., Francis, G., Halvorson, C., Hannigan, J., Khosravi, R., Kinnison, D., Lee, H., Massie, S., Nardi, B., Barnett, J., Hepplewhite, C., Lambert, A., and Dean, V.: Global estimates of gravity wave momentum flux from High Resolution Dynamics Limb Sounder observations, J. Geophys. Res.-Atmos., 113, D15S18, https://doi.org/10.1029/2007JD008807, 2008. a
Alexander, M. J., Geller, M., McLandress, C., Polavarapu, S., Preusse, P., Sassi, F., Sato, K., Eckermann, S., Ern, M., Hertzog, A., Kawatani, Y., Pulido, M., Shaw, T. A., Sigmond, M., Vincent, R., and Watanabe, S.: Recent developments in gravity-wave effects in climate models and the global distribution of gravity-wave momentum flux from observations and models, Q. J. Roy. Meteor. Soc., 136, 1103–1124, https://doi.org/10.1002/qj.637, 2010. a, b, c
Aumann, H. H., Chahine, M. T., Gautier, C., Goldberg, M. D., Kalnay, E., McMillin, L. M., Revercomb, H., Rosenkranz, P. W., Smith, W. L., Staelin, D. H., Strow, L. L., and Susskind, J.: AIRS/AMSU/HSB on the Aqua Mission: Design, Science Objective, Data Products, and Processing Systems, IEEE T. Geosci. Remote, 41, D21103, https://doi.org/10.1109/TGRS.2002.808356, 2003. a, b
Barnet, C., Datta, S., and Strow, L.: Trace gas measurements from the Atmospheric Infrared Sounder (AIRS), Optical Remote Sensing, OSA Tech. Digest, 89–92, https://doi.org/10.1364/ORS.2003.OWB2, 2003. a
Beres, J. H., Alexander, M. J., and Holton, J. R.: A Method of Specifying the Gravity Wave Spectrum above Convection Based on Latent Heating Properties and Background Wind, J. Atmos. Sci., 61, 324–337, https://doi.org/10.1175/1520-0469(2004)061<0324:AMOSTG>2.0.CO;2, 2004. a
Chahine, M. T., Pagano, T. S., Aumann, H. H., Atlas, R., Barnet, C., Blaisdell, J., Chen, L., Divakarla, M., Fetzer, E. J., Goldberg, M., Gautier, C., Granger, S., Hannon, S., Irion, F. W., Kakar, R., Kalnay, E., Lambrigtsen, B. H., Lee, S.-Y., Le Marshall, J., McMillan, W. W., McMillin, L., Olsen, E. T., Revercomb, H., Rosenkranz, P., Smith, W. L., Staelin, D., Strow, L. L., Susskind, J., Tobin, D., Wolf, W., and Zhou, L.: AIRS: Improving Weather Forecasting and Providing New Data on Greenhouse Gases, J. Atmos. Sci., 87, 911–926, https://doi.org/10.1175/BAMS-87-7-911, 2006. a
Cho, C. and Staelin, D. H.: Cloud clearing of Atmospheric Infrared Sounder hyperspectral infrared radiances using stochastic methods, J. Geophys. Res., 111, D09S18, https://doi.org/10.1029/2005JD006013, 2006. a, b
Choi, H.-J., Chun, H.-Y., Gong, J., and Wu, D. L.: Comparison of gravity wave temperature variances from ray-based spectral parameterization of convective gravity wave drag with AIRS observations, J. Geophys. Res.-Atmos., 117, D05115, https://doi.org/10.1029/2011JD016900, 2012. a, b
Day, K. A., Hibbins, R. E., and Mitchell, N. J.: Aura MLS observations of the westward-propagating s=1, 16-day planetary wave in the stratosphere, mesosphere and lower thermosphere, Atmos. Chem. Phys., 11, 4149–4161, https://doi.org/10.5194/acp-11-4149-2011, 2011. a
Dee, D. P., Uppala, S. M., Simmons, A. J., Berrisford, P., Poli, P., Kobayashi, S., Andrae, U., Balmaseda, M. A., Balsamo, G., Bauer, P., Bechtold, P., Beljaars, A. C. M., van de Berg, L., Bidlot, J., Bormann, N., Delsol, C., Dragani, R., Fuentes, M., Geer, A. J., Haimberger, L., Healy, S. B., Hersbach, H., Holm, E. V., Isaksen, L., Kallberg, P., Köhler, M., Matricardi, M., McNally, A. P., Monge-Sanz, B. M., Morcrette, J.-J., Park, B.-K., Peubey, C., de Rosnay, P., Tavolato, C., Thepaut, J.-N., and Vitart, F.: The ERA-Interim reanalysis: configuration and performance of the data assimilation system, Q. J. Roy. Meteor. Soc., 137, 553–597, https://doi.org/10.1002/qj.828, 2011. a
de Souza-Machado, S., Strow, L. L., Hannon, S. E., Motteler, H., López-Puertas, M., Funke, B., and Edwards, D. P.: Fast Forward Radiative Transfer Modeling of 4.3 μm Non-Local Thermodynamic Equilibrium effects for the Aqua/AIRS Infrared Temperature Sounder, Geophys. Res. Lett., 34, L01802, https://doi.org/10.1029/2006GL026684, 2007. a
Divakarla, M. G., Barnet, C. D., Goldberg, M. D., McMillin, L. M., Maddy, E., Wolf, W., Zhou, L., and Liu, X.: Validation of Atmospheric Infrared Sounder temperature and water vapor retrievals with matched radiosonde measurements and forecasts, J. Geophys. Res.-Atmos., 111, D09S15, https://doi.org/10.1029/2005JD006116, 2006. a, b
Dörnbrack, A., Leutbecher, M., Kivi, R., and Kyrö, E.: Mountain-wave-induced record low stratospheric temperatures above northern Scandinavia, Tellus A, 51, 951–963, https://doi.org/10.1034/j.1600-0870.1999.00028.x, 1999. a
Durran, D. R. and Klemp, J. B.: Another Look at Downslope Winds. Part II: Nonlinear Amplification Beneath Wave Overturning Layers, J. Atmos. Sci., 44, 3402–3412, https://doi.org/10.1175/1520-0469(1987)044<3402:ALADWP>2.0.CO;2, 1987. a
Eckermann, S. D., Wu, D. L., Doyle, J. D., Burris, J. F., McGee, T. J., Hostetler, C. A., Coy, L., Lawrence, B. N., Stephens, A., McCormack, J. P., and Hogan, T. F.: Imaging gravity waves in lower stratospheric AMSU-A radiances, Part 2: Validation case study, Atmos. Chem. Phys., 6, 3343–3362, https://doi.org/10.5194/acp-6-3343-2006, 2006. a
Ehard, B., Kaifler, B., Dörnbrack, A., Preusse, P., Eckermann, S. D., Bramberger, M., Gisinger, S., Kaifler, N., Liley, B., Wagner, J., and Rapp, M.: Horizontal propagation of large-amplitude mountain waves into the polar night jet, J. Geophys. Res., 122, 1423–1436, https://doi.org/10.1002/2016JD025621, 2016JD025621, 2017. a
Ern, M. and Preusse, P.: Gravity wave momentum flux spectra observed from satellite in the summertime subtropics: Implications for global modeling, Geophys. Res. Lett., 39, L15810, https://doi.org/10.1029/2012GL052659, 2012. a, b
Ern, M., Preusse, P., Alexander, M. J., and Warner, C. D.: Absolute values of gravity wave momentum flux derived from satellite data, J. Geophys. Res.-Atmos., 109, D20103, https://doi.org/10.1029/2004JD004752, 2004. a, b
Ern, M., Preusse, P., Gille, J. C., Hepplewhite, C. L., Mlynczak, M. G., Russell, J. M., and Riese, M.: Implications for atmospheric dynamics derived from global observations of gravity wave momentum flux in stratosphere and mesosphere, J. Geophys. Res.-Atmos., 116, D19107, https://doi.org/10.1029/2011JD015821, 2011. a, b, c, d
Ern, M., Preusse, P., Kalisch, S., Kaufmann, M., and Riese, M.: Role of gravity waves in the forcing of quasi two-day waves in the mesosphere: An observational study, J. Geophys. Res.-Atmos., 118, 3467–3485, https://doi.org/10.1029/2012JD018208, 2013. a, b
Ern, M., Ploeger, F., Preusse, P., Gille, J. C., Gray, L. J., Kalisch, S., Mlynczak, M. G., Russell, J. M., and Riese, M.: Interaction of gravity waves with the QBO: A satellite perspective, J. Geophys. Res.-Atmos., 119, 2329–2355, https://doi.org/10.1002/2013JD020731, 2014. a
Ern, M., Preusse, P., and Riese, M.: Driving of the SAO by gravity waves as observed from satellite, Ann. Geophys., 33, 483–504, https://doi.org/10.5194/angeo-33-483-2015, 2015. a, b
Ern, M., Trinh, Q. T., Kaufmann, M., Krisch, I., Preusse, P., Ungermann, J., Zhu, Y., Gille, J. C., Mlynczak, M. G., Russell III, J. M., Schwartz, M. J., and Riese, M.: Satellite observations of middle atmosphere gravity wave absolute momentum flux and of its vertical gradient during recent stratospheric warmings, Atmos. Chem. Phys., 16, 9983–10019, https://doi.org/10.5194/acp-16-9983-2016, 2016. a
Ern, M., Hoffmann, L., and Preusse, P.: Directional gravity wave momentum fluxes in the stratosphere derived from high-resolution AIRS temperature data, Geophys. Res. Lett., 44, 475–485, https://doi.org/10.1002/2016GL072007, 2017. a, b
Eyring, V., Waugh, D. W., Bodecker, G. E., Cordero, E., Akiyoshi, H., Austin, J., Beagley, S. R., Boville, B. A., Braesicke, P., Bruhl, C., Butchart, N., Chipperfield, M. P., Dameris, M., Deckert, R., Deushi, M., Frith, S. M., Garcia, R. R., Gettelman, A., Giorgetta, M. A., Kinneson, D. E., Mancini, E., Manzini, E., Marsh, D. R., Matthes, S., Nagashima, T., Newman, P. A., Pawson, S., Pitari, G., Plumber, D. A., Rozenov, E., Schraner, M., Scinocca, J. F., Seminiuk, K., Shepherd, T. G., Shibata, K., Steil, B., Stolarski, R. S., Tian, W., and Yoshiki, M.: Multimodel projections of stratospheric ozone in the 21st century, J. Geophys. Res., 112, D16303, https://doi.org/10.1029/2006JD008332, 2007. a
Fetzer, E. J. and Gille, J. C.: Gravity Wave Variance in LIMS Temperatures. Part I: Variability and Comparison with Background Winds., J. Atmos. Sci., 51, 2461–2483, https://doi.org/10.1175/1520-0469(1994)051<2461:GWVILT>2.0.CO;2, 1994. a
Fetzer, E. J., McMillin, L. M., Tobin, D. C., Aumann, H., Gunson, M. R., McMillan, W. W., Hagan, D., Hofstadter, M. D., Yoe, J., Whiteman, D. N., Barnes, J. E., Bennartz, R., Vömel, H., Walden, V., Newchurch, M., Minnett, P. J., Atlas, R., Schmidlin, F., Olsen, E. T., Goldberg, M. D., Zhou, S., Ding, H., Smith, W. L., and Revercomb, H.: AIRS/AMSU/HSB validation, IEEE T. Geosci. Remote, 41, 418–431, https://doi.org/10.1109/TGRS.2002.808293, 2003. a
Fritts, D. C. and Alexander, M. J.: Gravity wave dynamics and effects in the middle atmosphere, Rev. Geophys., 41, 1003, https://doi.org/10.1029/2001RG000106, 2003. a, b
Fritts, D. C. and Nastrom, G. D.: Sources of mesoscale variability of gravity waves. part II: frontal,convective, and jet stream excitation, J. Atmos. Sci., 49, 111–127, https://doi.org/10.1175/1520-0469(1992)049<0111:SOMVOG>2.0.CO;2, 1992. a
Fritts, D. C., Smith, R. B., Taylor, M. J., Doyle, J. D., Eckermann, S. D., Dörnbrack, A., Rapp, M., Williams, B. P., Pautet, P.-D., Bossert, K., Criddle, N. R., Reynolds, C. A., Reinecke, P. A., Uddstrom, M., Revell, M. J., Turner, R., Kaifler, B., Wagner, J. S., Mixa, T., Kruse, C. G., Nugent, A. D., Watson, C. D., Gisinger, S., Smith, S. M., Lieberman, R. S., Laughman, B., Moore, J. J., Brown, W. O., Haggerty, J. A., Rockwell, A., Stossmeister, G. J., Williams, S. F., Hernandez, G., Murphy, D. J., Klekociuk, A. R., Reid, I. M., and Ma, J.: The Deep Propagating Gravity Wave Experiment (DEEPWAVE): An Airborne and Ground-Based Exploration of Gravity Wave Propagation and Effects from Their Sources throughout the Lower and Middle Atmosphere, B. Am. Meteorol. Soc., 97, 425–453, https://doi.org/10.1175/BAMS-D-14-00269.1, 2016. a, b
Gautier, C., Shiren, Y., and Hofstadter, M.: AIRS/Vis near IR instrument, IEEE T. Geosci. Remote, 41, 330–342, https://doi.org/10.1109/TGRS.2002.808242, 2003. a
Geller, M. A., Alexander, M. J., Love, P. T., Bacmeister, J., Ern, M., Hertzog, A., Manzini, E., Preusse, P., Sato, K., Scaife, A. A., and Zhou, T.: A Comparison between Gravity Wave Momentum Fluxes in Observations and Climate Models, J. Climate, 26, 6383–6405, https://doi.org/10.1175/JCLI-D-12-00545.1, 2013. a, b
Gille, J. C., Barnett, J. J., Whitney, J. G., Dials, M. A., Woodard, D., Rudolf, W. P., Lambert, A., and Mankin, W.: The High-Resolution Dynamics Limb Sounder (HIRDLS) experiment on AURA, in: Infrared Spaceborne Remote Sensing XI, Vol. 162, Proc. SPIE 5152, https://doi.org/10.1117/12.2066967, 2003. a, b
Gille, J. C., Barnett, J., Arter, P., Barker, M., Bernath, P., Boone, C., Cavanaugh, C., Chow, J., Coffey, M., Craft, J., Craig, C., Dials, M., Dean, V., Eden, T., Edwards, D. P., Francis, G., Halvorson, C., Harvey, L., Hepplewhite, C., Khosravi, R., Kinnison, D., Krinsky, C., Lambert, A., Lee, H., Lyjak, L., Loh, J., Mankin, W., Massie, S., McInerney, J., Moorhouse, J., Nardi, B., Packman, D., Randall, C., Reburn, J., Rudolf, W., Schwartz, M., Serafin, J., Stone, K., Torpy, B., Walker, K., Waterfall, A., Watkins, R., Whitney, J., Woodard, D., and Young, G.: High Resolution Dynamics Limb Sounder: Experiment overview, recovery, and validation of initial temperature data, J. Geophys. Res., 113, D16S43, https://doi.org/10.1029/2007JD008824, 2008. a, b, c, d
Gille, J. C., Cavanaugh, C., Coffey, M., Karol, S., Khosravi, R., Massie, S., Rivas, M. B., Waterfall, A., Gray, L., Choi, K. Y., Craig, C., Hepplewhite, C., Nardi, D. K. B., Smith, L., and Wright, C.: High Resolution Dynamics Limb Sounder Earth Observing System (EOS): Data description and quality, Version 6 (V6), available at: http://archive-eos.acom.ucar.edu/hirdls/data/products/HIRDLS-DQD_V6-1.pdf (last access date: 10 January 2018), 2011. a, b, c
Goldberg, M., Qu, Y., McMillin, L., Wolf, W., Zhou, L., and Divakarla, M.: AIRS near-real-time products and algorithms in support of operational numerical weather prediction, IEEE T. Geosci. Remote, 41, 379–389, https://doi.org/10.1109/TGRS.2002.808307, 2003. a
Gong, J., Wu, D. L., and Eckermann, S. D.: Gravity wave variances and propagation derived from AIRS radiances, Atmos. Chem. Phys., 12, 1701–1720, https://doi.org/10.5194/acp-12-1701-2012, 2012. a, b
Hertzog, A., Alexander, M. J., and Plougonven, R.: On the Intermittency of Gravity Wave Momentum Flux in the Stratosphere, J. Atmos. Sci., 69, 3433–3448, https://doi.org/10.1175/JAS-D-12-09.1, 2012. a
Hoffmann, L. and Alexander, M. J.: Retrieval of stratospheric temperatures from Atmospheric Infrared Sounder radiance measurements for gravity wave studies, J. Geophys. Res.-Atmos., 114, D07105, https://doi.org/10.1029/2008JD011241, 2009. a, b, c, d, e, f, g, h, i, j
Hoffmann, L., Xue, X., and Alexander, M. J.: A Global View of Stratospheric Gravity Wave Hotspots Located with Atmospheric Infrared Sounder Observations, J. Geophys. Res.-Atmos., 118, 416–434, https://doi.org/10.1029/2012JD018658, 2013. a, b, c
Hoffmann, L., Alexander, M. J., Clerbaux, C., Grimsdell, A. W., Meyer, C. I., Rößler, T., and Tournier, B.: Intercomparison of stratospheric gravity wave observations with AIRS and IASI, Atmos. Meas. Tech., 7, 4517–4537, https://doi.org/10.5194/amt-7-4517-2014, 2014. a, b, c, d, e
Hoffmann, L., Grimsdell, A. W., and Alexander, M. J.: Stratospheric gravity waves at Southern Hemisphere orographic hotspots: 2003–2014 AIRS/Aqua observations, Atmos. Chem. Phys., 16, 9381–9397, https://doi.org/10.5194/acp-16-9381-2016, 2016. a, b
Holton, J. R.: The Role of Gravity Wave Induced Drag and Diffusion in the Momentum Budget of the Mesosphere, J. Atmos. Sci., 39, 791–799, https://doi.org/10.1175/1520-0469(1982)039<0791:TROGWI>2.0.CO;2, 1982. a
Holton, J. R.: The Influence of Gravity Wave Breaking on the General Circulation of the Middle Atmosphere, J. Atmos. Sci., 40, 2597–2507, https://doi.org/10.1175/1520-0469(1983)040<2497:TIOGWB>2.0.CO;2, 1983. a
Immerkær, J.: Fast Noise Variance Estimation, Comput. Vis. Image Und., 64, 300–302, https://doi.org/10.1006/cviu.1996.0060, 1996. a, b, c
Jiang, J. H. and Wu, D. L.: UARS MLS observations of gravity waves associated with the Arctic Winter Stratospheric Vortex, Geophys. Res. Lett., 28, 527–530, https://doi.org/10.1029/2000GL011800, 2001. a
Jiang, J. H., Eckermann, S. D., Wu, D. L., and Ma, J.: A search for mountain waves in MLS stratospheric limb radiances from the winter Northern Hemisphere: Data analysis and global mountain wave modeling, J. Geophys. Res.-Atmos., 109, D03107, https://doi.org/10.1029/2003JD003974, 2004a. a
Jiang, J. H., Wang, B., Goya, K., Hocke, K., Eckermann, S. D., Ma, J., Wu, D. L., and Read, W. G.: Geographical distribution and interseasonal variability of tropical deep convection: UARS MLS observations and analyses, J. Geophys. Res.-Atmos., 109, D03111, https://doi.org/10.1029/2003JD003756, 2004b. a
Kalisch, S., Chun, H.-Y., Ern, M., Preusse, P., Trinh, Q. T., Eckermann, S. D., and Riese, M.: Comparison of simulated and observed convective gravity waves, J. Geophys. Res., 121, 13474–13492, https://doi.org/10.1002/2016JD025235, 2016JD025235, 2016. a
Khosravi, R., Lambert, A., Lee, H., Gille, J., Barnett, J., Francis, G., Edwards, D., Halvorson, C., Massie, S., Craig, C., Krinsky, C., McInerney, J., Stone, K., Eden, T., Nardi, B., Hepplewhite, C., Mankin, W., and Coffey, M.: Overview and characterization of retrievals of temperature, pressure, and atmospheric constituents from the High Resolution Dynamics Limb Sounder (HIRDLS) measurements, J. Geophys. Res.-Atmos., 114, D20304, https://doi.org/10.1029/2009JD011937, 2009a. a, b
Khosravi, R., Lambert, A., Lee, H., Gille, J., Barnett, J., Francis, G., Edwards, D., Halvorson, C., Massie, S., Craig, C., Krinsky, C., McInerney, J., Stone, K., Eden, T., Nardi, B., Hepplewhite, C., Mankin, W., and Coffey, M.: Correction to “Overview and characterization of retrievals of temperature, pressure, and atmospheric constituents from High Resolution Dynamics Limb Sounder (HIRDLS) measurements”, J. Geophys. Res.-Atmos., 114, D23399, https://doi.org/10.1029/2009JD013507, 2009b. a, b
Lambrigtsen, B.: Calibration of the AIRS microwave instruments, IEEE T. Geosci. Remote, 41, 369–378, https://doi.org/10.1109/TGRS.2002.808247, 2003. a
Lehmann, C. I., Kim, Y.-H., Preusse, P., Chun, H.-Y., Ern, M., and Kim, S.-Y.: Consistency between Fourier transform and small-volume few-wave decomposition for spectral and spatial variability of gravity waves above a typhoon, Atmos. Meas. Tech., 5, 1637–1651, https://doi.org/10.5194/amt-5-1637-2012, 2012. a
Lindzen, R. S.: Wave-mean flow interactions in the upper atmosphere, Bound.-Lay. Meteorol., 4, 327–343, https://doi.org/10.1007/BF02265242, 1973. a
McLandress, C.: On the importance of gravity waves in the middle atmosphere and their parameterization in general circulation models, J. Atmos. Sol.-Terr. Phy., 60, 1357–1383, https://doi.org/10.1016/S1364-6826(98)00061-3, 1998. a
Meyer, C. I. and Hoffmann, L.: Validation of AIRS high-resolution stratospheric temperature retrievals, in: Remote Sensing of Clouds and the Atmosphere XIX; and Optics in Atmospheric Propagation and Adaptive Systems XVII, Vol. 92420L, Proc. SPIE 9242, https://doi.org/10.1117/12.2066967, 2014. a
Nastrom, G. D. and Fritts, D. C.: Sources of Mesoscale Variability of Gravity Waves. Part I: Topographic Excitation, J. Atmos. Sci., 49, 101–110, https://doi.org/10.1175/1520-0469(1992)049<0101:SOMVOG>2.0.CO;2, 1992. a
Pfister, L., Starr, W., Craig, R., Loewenstein, M., and Legg, M.: Small-Scale Motions Observed by Aircraft in the Tropical Lower Stratosphere: Evidence for Mixing and its Relationship to Large-Scale Flows, J. Atmos. Sci., 43, 3210–3225, https://doi.org/10.1175/1520-0469(1986)043<3210:SSMOBA>2.0.CO;2, 1986. a
Plougonven, R. and Zhang, F.: Internal gravity waves from atmospheric jets and fronts, Rev. Geophys., 52, 33–76, https://doi.org/10.1002/2012RG000419, 2014. a, b
Plougonven, R., Teitelbaum, H., and Zeitlin, V.: Inertia gravity wave generation by the tropospheric midlatitude jet as given by the Fronts and Atlantic Storm-Track Experiment radio sounding, J. Geophys. Res.-Atmos., 108, 4686, https://doi.org/10.1029/2003JD003535, 2003. a
Preusse, P., Dörnbrack, A., Eckermann, S. D., Riese, M., Schaeler, B., Bacmeister, J. T., Broutman, D., and Grossmann, K. U.: Space-based measurements of stratospheric mountain waves by CRISTA 1. Sensitivity, analysis method, and a case study, J. Geophys. Res.-Atmos., 107, 8178, https://doi.org/10.1029/2001JD000699, 2002. a, b
Preusse, P., Eckermann, S. D., and Ern, M.: Transparency of the atmosphere to short horizontal wavelength gravity waves, J. Geophys. Res.-Atmos., 113, D24104, https://doi.org/10.1029/2007JD009682, 2008. a, b, c, d
Preusse, P., Eckermann, S. D., Ern, M., Oberheide, J., Picard, R. H., Roble, R. G., Riese, M., Russell, J. M., and Mlynczak, M. G.: Global ray tracing simulations of the SABER gravity wave climatology, J. Geophys. Res.-Atmos., 114, D08126, https://doi.org/10.1029/2008JD011214, 2009a. a
Preusse, P., Schroeder, S., Hoffmann, L., Ern, M., Friedl-Vallon, F., Ungermann, J., Oelhaf, H., Fischer, H., and Riese, M.: New perspectives on gravity wave remote sensing by spaceborne infrared limb imaging, Atmos. Meas. Tech., 2, 299–311, https://doi.org/10.5194/amt-2-299-2009, 2009b. a
Rösevall, J. D., Murtagh, D. P., and Urban, J.: Ozone depletion in the 2006/2007 Arctic winter, Geophys. Res. Lett., 34, L21809, https://doi.org/10.1029/2007GL030620, 2007. a
Sato, K., Tsuchiya, C., Alexander, M. J., and Hoffmann, L.: Climatology and ENSO-related interannual variability of gravity waves in the southern hemisphere subtropical stratosphere revealed by high-resolution AIRS observations, J. Geophys. Res.-Atmos., 121, 7622–7640, https://doi.org/10.1002/2015JD024462, 2016. a
Smith, R. B.: On Severe Downslope Winds, J. Atmos. Sci., 42, 2597–2603, https://doi.org/10.1175/1520-0469(1985)042<2597:OSDW>2.0.CO;2, 1985. a
Smith, R. B., Nugent, A. D., Kruse, C. G., Fritts, D. C., Doyle, J. D., Eckermann, S. D., Taylor, M. J., Dörnbrack, A., Uddstrom, M., Cooper, W., Romashkin, P., Jensen, J., and Beaton, S.: Stratospheric Gravity Wave Fluxes and Scales during DEEPWAVE, J. Atmos. Sci., 73, 2851–2869, https://doi.org/10.1175/JAS-D-15-0324.1, 2016. a
Strow, L. L., Hannon, S. E., Machado, S. D.-S., Motteler, H. E., and Tobin, D. C.: Validation of the Atmospheric Infrared Sounder radiative transfer algorithm, J. Geophys. Res., 111, D09S06, https://doi.org/10.1029/2005JD006146, 2006. a
Susskind, J., Barnett, C. D., and Blaisdell, J. M.: Retrieval of atmospheric and surface parameters from AIRS/AMSU/HSB data in the precense of clouds, IEEE T. Geosci. Remote, 41, 390–409, https://doi.org/10.1109/TGRS.2002.808236, 2003. a, b
Tobin, D. C., Revercomb, H. E., Knuteson, R. O., Lesht, B. M., Strow, L. L., Hannon, S. E., Feltz, W. F., Moy, L. A., Fetzer, E. J., and Cress, T. S.: Atmospheric Radiation Measurement site atmospheric state best estimates for Atmospheric Infrared Sounder temperature and water vapor retrieval validation, J. Geophys. Res.-Atmos., 111, D09S14, https://doi.org/10.1029/2005jd006103, 2006. a
Trinh, Q. T., Kalisch, S., Preusse, P., Chun, H.-Y., Eckermann, S. D., Ern, M., and Riese, M.: A comprehensive observational filter for satellite infrared limb sounding of gravity waves, Atmos. Meas. Tech., 8, 1491–1517, https://doi.org/10.5194/amt-8-1491-2015, 2015. a, b
Trinh, Q. T., Kalisch, S., Preusse, P., Ern, M., Chun, H.-Y., Eckermann, S. D., Kang, M.-J., and Riese, M.: Tuning of a convective gravity wave source scheme based on HIRDLS observations, Atmos. Chem. Phys., 16, 7335–7356, https://doi.org/10.5194/acp-16-7335-2016, 2016. a, b, c
Tsuchiya, C., Sato, K., Alexander, M. J., and Hoffmann, L.: MJO-related intraseasonal variation of gravity waves in the Southern Hemisphere tropical stratosphere revealed by high-resolution AIRS observations, J. Geophys. Res.-Atmos., 121, 7641–7651, https://doi.org/10.1002/2015JD024463, 2015JD024463, 2016. a
Tsuda, T., Murayama, Y., Wiryosumarto, H., Harijono, S. W. B., and Kato, S.: Radiosonde observations of equatorial atmosphere dynamics over Indonesia: 2. Characteristics of gravity waves, J. Geophys. Res.-Atmos., 99, 10507–10516, https://doi.org/10.1029/94JD00354, 1994. a
Vadas, S. L., Fritts, D. C., and Alexander, M. J.: Mechanism for the Generation of Secondary Waves in Wave Breaking Regions, J. Atmos. Sci., 60, 194–214, https://doi.org/10.1175/1520-0469(2003)060<0194:MFTGOS>2.0.CO;2, 2003. a
Vincent, R. A. and Alexander, M. J.: Gravity waves in the tropical lower stratosphere: An observational study of seasonal and interannual variability, J. Geophys. Res.-Atmos., 105, 17971–17982, https://doi.org/10.1029/2000JD900196, 2000. a
Wang, L. and Geller, M. A.: Morphology of gravity-wave energy as observed from 4 years (1998–2001) of high vertical resolution U.S. radiosonde data, J. Geophys. Res., 108, 4489, https://doi.org/10.1029/2002JD002786, 2003. a
Wright, C. J., Osprey, S. M., Barnett, J. J., Gray, L. J., and Gille, J. C.: High Resolution Dynamics Limb Sounder measurements of gravity wave activity in the 2006 Arctic stratosphere, J. Geophys. Res.-Atmos., 115, D02105, https://doi.org/10.1029/2009JD011858, 2010. a, b
Wright, C. J., Rivas, M. B., and Gille, J. C.: Intercomparisons of HIRDLS, COSMIC and SABER for the detection of stratospheric gravity waves, Atmos. Meas. Tech., 4, 1581–1591, https://doi.org/10.5194/amt-4-1581-2011, 2011. a
Wright, C. J., Osprey, S. M., and Gille, J. C.: Global observations of gravity wave intermittency and its impact on the observed momentum flux morphology, J. Geophys. Res.-Atmos., 118, 10980–10993, https://doi.org/10.1002/jgrd.50869, 2013. a
Wright, C. J., Osprey, S. M., and Gille, J. C.: Global distributions of overlapping gravity waves in HIRDLS data, Atmos. Chem. Phys., 15, 8459–8477, https://doi.org/10.5194/acp-15-8459-2015, 2015. a
Wright, C. J., Hindley, N. P., and Mitchell, N. J.: Combining AIRS and MLS observations for three-dimensional gravity wave measurement, Geophys. Res. Lett., 43, 884–893, 2015GL067233, https://doi.org/10.1002/2015GL067233, 2016a. a
Wright, C. J., Hindley, N. P., Moss, A. C., Fritts, D. C., Janches, D., and Mitchell, N. J.: Multi-instrument gravity-wave measurements over Tierra del Fuego and the Drake Passage – Part 1: Potential energies and vertical wavelengths from AIRS, COSMIC, HIRDLS, MLS-Aura, SAAMER, SABER and radiosondes, Atmos. Meas. Tech., 9, 877–908, https://doi.org/10.5194/amt-9-877-2016, 2016b. a
Wright, C. J., Hindley, N. P., Hoffmann, L., Alexander, M. J., and Mitchell, N. J.: Exploring gravity wave characteristics in 3-D using a novel S-transform technique: AIRS/Aqua measurements over the Southern Andes and Drake Passage, Atmos. Chem. Phys., 17, 8553–8575, https://doi.org/10.5194/acp-17-8553-2017, 2017. a
Wu, D. L. and Waters, J. W.: Gravity-wave-scale temperature fluctuations seen by the UARS MLS, Geophys. Res. Lett., 23, 3289–3292, https://doi.org/10.1029/96GL02924, 1996a. a
Wu, D. L. and Waters, J. W.: Satellite observations of atmospheric variances: A possible indication of gravity waves, Geophys. Res. Lett., 23, 3631–3634, https://doi.org/10.1029/96GL02907, 1996b. a
Wu, D. L. and Zhang, F.: A study of mesoscale gravity waves over the North Atlantic with satellite observations and a mesoscale model, J. Geophys. Res.-Atmos., 109, D22104, https://doi.org/10.1029/2004JD005090, 2004. a, b
Wu, D. L., Preusse, P., Eckermann, S. D., Jiang, J. H., de la Torre, M., Juarez, L. C., and Wang, D. Y.: Remote sounding of atmospheric gravity waves with satellite limb and nadir techniques, Adv. Space Res., 37, 2269–2277, https://doi.org/10.1016/j.asr.2005.07.031, 2006. a