the Creative Commons Attribution 3.0 License.
the Creative Commons Attribution 3.0 License.
Mid-IR spectrometer for mobile, real-time urban NO2 measurements
P. Morten Hundt
Michael Müller
Markus Mangold
Béla Tuzson
Philipp Scheidegger
Herbert Looser
Christoph Hüglin
Lukas Emmenegger
Detailed knowledge about the urban NO2 concentration field is a key element for obtaining accurate pollution maps and individual exposure estimates. These are required for improving the understanding of the impact of ambient NO2 on human health and for related air quality measures. However, city-scale NO2 concentration maps with high spatio-temporal resolution are still lacking, mainly due to the difficulty of accurate measurement of NO2 at the required sub-ppb level precision. We contribute to close this gap through the development of a compact instrument based on mid-infrared laser absorption spectroscopy. Leveraging recent advances in infrared laser and detection technology and a novel circular absorption cell, we demonstrate the feasibility and robustness of this technique for demanding mobile applications. A fully autonomous quantum cascade laser absorption spectrometer (QCLAS) has been successfully deployed on a tram, performing long-term and real-time concentration measurements of NO2 in the city of Zurich (Switzerland). For ambient NO2 concentrations, the instrument demonstrated a precision of 0.23 ppb at one second time resolution and of 0.03 ppb after 200 s averaging. Whilst the combined uncertainty estimated for the retrieved spectroscopic values was less than 5 %, laboratory intercomparison measurements with standard CLD instruments revealed a systematic NO2 wall loss of about 10 % within the laser spectrometer. For the field campaign, the QCLAS has been referenced to a CLD using urban atmospheric air, despite the potential cross sensitivity of CLD to other nitrogen containing compounds. However, this approach allowed a direct comparison and continuous validation of the spectroscopic data to measurements at regulatory air quality monitoring (AQM) stations along the tram-line. The analysis of the recorded high-resolution time series allowed us to gain more detailed insights into the spatio-temporal concentration distribution of NO2 in an urban environment. Furthermore, our results demonstrate that for reliable city-scale concentration maps a larger data set and better spatial coverage is needed, e.g., by deploying more mobile and stationary instruments to account for mainly two shortcomings of the current approach: (i) limited residence time close to sources with large short-term NO2 variations, and (ii) insufficient representativeness of the tram tracks for the complex urban environment.
- Article
(3151 KB) - Full-text XML
- BibTeX
- EndNote


Numerous studies relate the exposure to nitrogen dioxide (NO2) to adverse health effects (e.g., Adam et al., 2014; Gehring et al., 2013; WHO, 2013). Despite this threat to human health, limit values are regularly exceeded in European cities, mainly at locations directly impacted by traffic emissions (EEA, 2016). It is, therefore, highly relevant to provide spatially and temporally resolved NO2 fields for the assessment of related health effects, for the guidance of efficient air quality measures, and for urban air quality planning. The true exposure of an individual is composed of the encountered pollutant concentration at a particular location and time as well as breathing rate. So far, the individual's exposure is mostly derived from land use regression models representing seasonal or annual mean concentrations at the individual's home or working address (e.g., Brauer et al., 2008; Cyrys et al., 2012). Obviously, these values may be significantly biased depending on the mobility pattern of an individual, because NO2 concentrations in the urban environment are highly variable in space and time.
Spatially and temporally highly resolved pollution maps, (< 20 m, < 1 h) based on statistical modeling, can enhance the accuracy of exposure estimates. However, such statistical models require accurate input data that represent the concentration levels at a set of different locations at an adequate temporal resolution. Up to date, accurate (±1 ppb) and continuous NO2 measurements are mainly performed at air quality monitoring (AQM) stations equipped with chemiluminescence detectors (CLD). However, data from such AQM stations do not provide sufficient spatial resolution for detailed pollution maps due to the high variability of influencing factors such as the traffic situation and the built environment.
One approach to overcome this challenge is the deployment of denser measurement networks. Mueller et al. (2015), for instance, used data from a dense network of passive diffusion samplers in Zurich (Switzerland) as input for statistical models. However, such passive samplers provide only average values over their exposure period, which is days to weeks, and therefore lack the necessary temporal resolution. The replacement of passive samplers by low-cost electrochemical sensors is being investigated, but has not yet been shown to be feasible for long-term deployment (Mead et al., 2013; Mueller et al., 2017).
Mobile measurements are an attractive alternative for increasing the spatial resolution (Hagemann et al., 2014; Hasenfratz et al., 2015; Kehl, 2007). However, this approach requires highly sensitive – typical concentrations range from 5 to 200 ppb – and selective measurement devices with a temporal resolution of a few seconds. Portable electrochemical sensors are currently not suited for such applications as their reproducibility, long-term stability, and response time (typically 60 s) do not fulfill the requirements (Mueller et al., 2017).
Finally, a common issue with the widely used CLD technique is cross sensitivity to other nitrogen containing species as an artefact of the conversion from NO2 to NO prior detection by CLD. This is known for catalytic conversion using molybdenum converters (Dunlea et al., 2007; Steinbacher et al., 2007) and to a smaller extent cross sensitivities to HONO, PAN and VOCs were reported for photolytic conversion (Reed et al., 2016; Villena et al., 2012). This issue motivated the development of alternative measurement techniques of NO2 that have less or no interference such as luminol chemiluminescence (Sluis et al., 2010), laser induced fluorescence (LIF) (Dari-Salisburgo et al., 2009; Thornton et al., 2000) and long path absorption photometry (LOPAP) (Villena et al., 2011).
In this context, laser spectroscopy is a highly promising measurement technique as it determines, in contrast to CLD, the concentration of NO2 directly and with sampling rates of 1 Hz and higher. Previous studies have shown the applicability of diode-lasers in the visible (blue) spectral region for measuring NO2 by various cavity enhanced techniques (Courtillot et al., 2006; Fuchs et al., 2009; Kebabian et al., 2005; Osthoff et al., 2006). For high precision NO2 measurements, the mid-infrared region is also often chosen due to the larger absorption cross section. Here, photoacoustic spectroscopy (Pushkarsky et al., 2006), quartz-enhanced photoacoustic spectroscopy (Patimisco et al., 2014) and direct absorption spectroscopy (McManus et al., 2015) were applied and demonstrated detection limits to the ppt levels (e.g Tuzson et al., 2013b).
Motivated by our latest developments regarding power-efficient laser driving (Fischer et al., 2014) and compact multipass cell designs (Mangold et al., 2016; Tuzson et al., 2013a), as well as the availability of compact and collimated mid-infrared laser sources, i.e., TO-3 or HHL packaged quantum cascade lasers (QCLs), we developed a portable and robust instrument for mobile and direct measurements of NO2. We challenged this technique by the harsh environment on the roof of a tram operating as public transport service in the city of Zurich. Aside from the mechanical vibrations and large temperature variations, the instrument was to be exposed to severe weather conditions (rain and snowfall, direct sunshine, etc.) as well as sudden changes in electrical power delivery, including regular shut-down during nighttime or maintenance. In addition, footprint- and available voltage supply put stringent requirements on the instrumental design. The very limited access demanded a high-degree of autonomous functionalities.
In this article, we present the laser spectrometer, demonstrate its performance under laboratory conditions, and validate the NO2 measurements during the field campaign. Finally, the recorded NO2 time series are investigated with respect to their use in highly resolved statistical models.
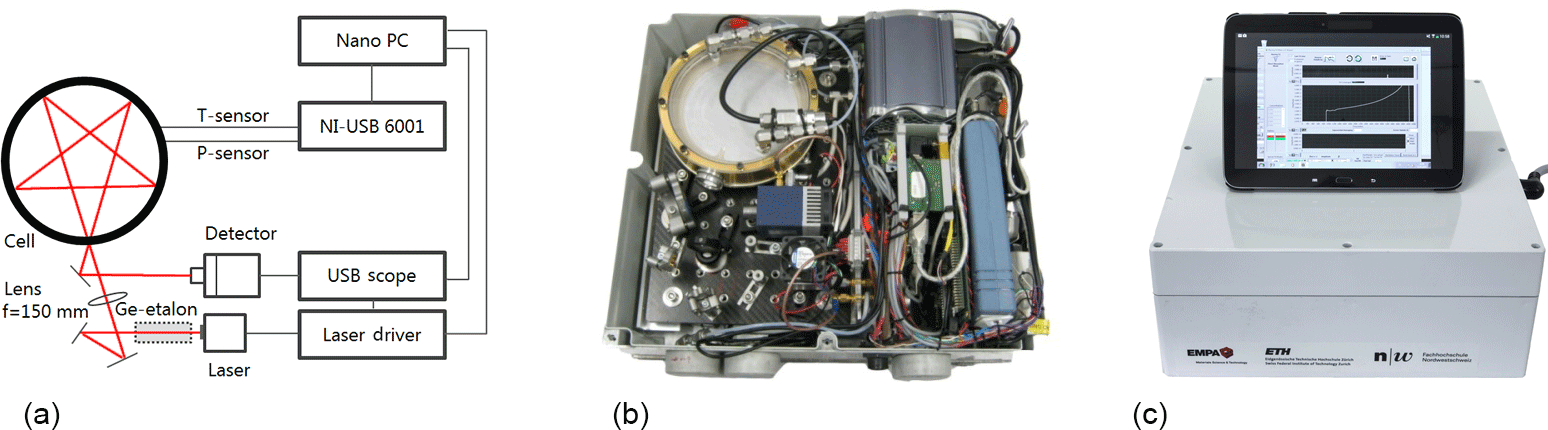
Figure 1(a) Schematic of the instrument with the key optical and hardware elements. (b, c) Photograph of the QCLAS with the top cover removed and in the final layout. The overall weight is 10 kg and it operates on 12 V DC.
2.1 Quantum cascade laser spectrometer
The instrument was specifically designed and built for this particular measurement campaign. Figure 1 shows the schematics of the main elements and the photographs of the QCLAS. The whole spectrometer is mounted into a 40 cm × 36 cm × 15 cm waterproof box with four metal springs at the bottom to dampen mechanical vibrations. A custom-made carbon fiber reinforced polymer breadboard (CarbonVision GmbH, Germany) is used as low-weight and sturdy support for the optics. Its low thermal expansion coefficient makes it well suited for varying thermal environments. The main optical components of the instrument are a continuous wave (cw) distributed feedback (DFB) QCL (Alpes Lasers, Switzerland), a cylindrical multipass cell (Mangold et al., 2016) and a thermoelectrically cooled MCT detector (PVI-4TE-6, Vigo Systems, Poland). The laser is encapsulated in a high-heat load (HHL) housing including a Peltier element and collimating optics. The QCL is operated at room temperature and emits at 1600 cm−1 with an output optical power of about 3 mW. It is driven in intermittent continuous-wave (iCW) mode (Fischer et al., 2014) with a pulse duration of 160 µs and a duty cycle of 50 %. Thereby, the driving current of the QCL is dropped to zero between individual pulses leading to rapid heating and thus frequency tuning over 1.5 cm−1 during each current pulse. By shaping the current pulse form with several RC-elements, a near linear tuning was achieved. The accurate frequency calibration was done using a 2 inch solid Ge-etalon (Egorov Scientific, USA).
As discussed by Fischer et al. (2014), the main advantages of the iCW driving mode are as follows: (i) a significant reduction of the laser's heat dissipation such that air cooling is sufficient, and (ii) decoupling of the laser driving current from the external power supply during laser driving, which strongly facilitates the design of the low-noise current driver. These elements are crucial in the design of compact and lightweight hardware.
The collimated output of the QCL has a beam diameter of 1 mm and is focused into the multipass cell (MPC) with a plano-convex CaF2 lens (f = 150 mm, Thorlabs Inc, USA). The light passes an optical path of 12.2 m within the cylindrical 14.5 cm diameter MPC, which corresponds to 89 reflections in a star-like pattern, before it leaves the cell through the same hole and is coupled into the infrared detector. The circular MPC concept is described elsewhere in detail (Mangold et al., 2016) and only a brief summary is given here. The employed design consists of a single monolithic metal ring, which also serves as a circular mirror reflecting the optical beam. In harsh environments, this is particularly favorable because of the simple alignment and the mechanical robustness towards vibration or temperature changes. To minimize interference fringes, an absorption mask with holes of 4 mm diameter at positions where laser reflections are expected, is inserted in the cell. Additionally, the beam is coupled into the cell in an off-axis configuration leading to further separation of neighboring reflections on the mirror and thus less interference fringes (Mangold et al., 2016).
In order to enhance selectivity and reduce spectral interferences, the pressure in the cell is reduced to 100 hPa using a small diaphragm pump (Typ N 85.3, KNF, Germany). The air flow is limited to 180 sccm by a critical orifice placed at the inlet. The gas exchange time in the cell was determined to be 9.6 s by exponentially fitting the NO2 transmission signal while switching from ambient air to NO2-free air.

Figure 2Transmission spectra recorded by the instrument: NO2-scrubbed air (grey) and ambient air with 49 ppb of NO2 (black). Both samples contained 0.5 % water. The red trace represents the least-square fit to the ambient air spectrum. The dark blue and light blue bars indicate the line strength of NO2 and H2O absorption lines, respectively.
The detector signal is digitized by an USB oscilloscope (Picoscope 4000 Series, Pico Technology, UK) at 12-bit resolution and with 20 MS s−1 sampling rate. The data acquisition is triggered by a TTL signal generated by the laser driver. After continuous acquisition of 1000 spectra at a rate of 2 kHz in the digitizer's buffer, the data is transferred via a USB-port to a nano PC (Zero Pro, Xi3 Corporation, USA), where the spectra are then averaged and analyzed in real-time by a custom-written LabVIEW program. The NO2 absorption spectrum is fitted by a Voigt profile considering pressure, temperature, path length and line strength. The corresponding spectroscopic parameters were taken from the HITRAN database (Rothman et al., 2013). For the NO2 concentration measurement, we used the group of lines in the vicinity of 1599.9 cm−1. This range was also proposed by Tuzson et al. (2013b) as the best compromise between maximal NO2 absorption cross sections and minimal spectral interference from water vapor or other trace gases. Figure 2 shows the transmission spectra recorded using NO2-free air and ambient air (49 ppb NO2), respectively.
Although, the instrument was conceived for highest stability and robustness, the large ambient temperature variations (−5 to 20 ∘C) to which it was exposed in the field still induced significant drift in the retrieved NO2 concentration. To account for this, we applied two strategies: first, the set-point of the laser heat-sink temperature is continuously adjusted via a feedback-loop to lock the laser frequency with respect to a H2O ro-vibrational absorption line in the neighborhood of the NO2 absorption feature (1600.47 cm−1). This approach allowed maintaining the laser emission frequency within ±0.01 cm−1. Second, a repeated determination of the spectral baseline without NO2 absorption was found to be very efficient to account for long-term instrumental drifts. For the field campaign, the zero-point offset was determined measuring NO2-free air for 2 min every 20 min. This zero air was obtained by pumping ambient air through a stainless-steel filter of 20 mL volume filled with chemisorbant and active charcoal mix (Purafil, Inc. USA).
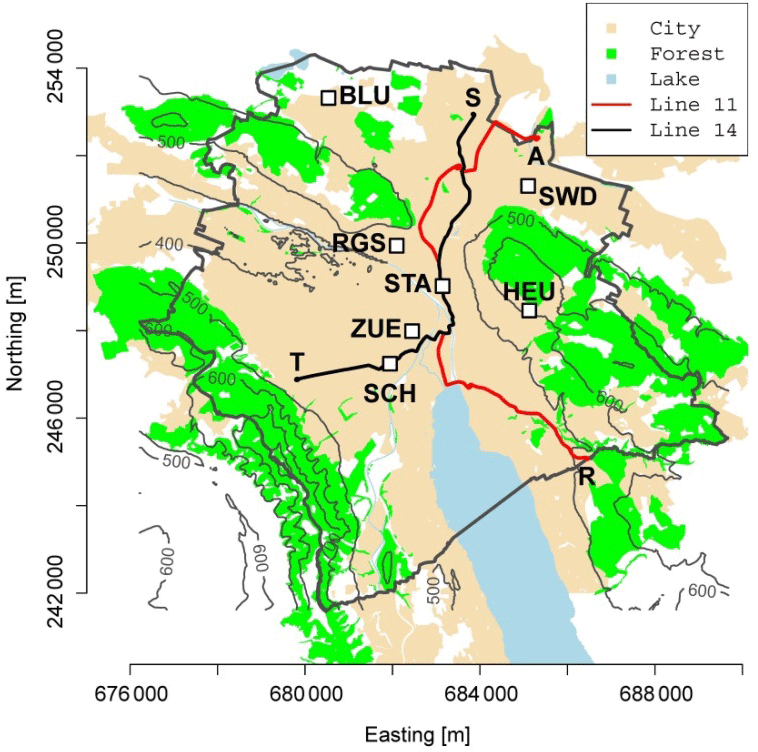
Figure 3Map showing the city of Zurich. The tram line no. 11 from Rehalp (R) to Auzelg (A) is depicted by a red line, the tram line no. 14 from Triemli (T) to Seebach (S) is depicted by a black line. The white squares depict the air quality monitoring sites operated in Zurich. Light grey lines are contour lines indicating the elevation of Zurich and the municipal boarder is shown in dark grey.
2.2 Sampling site
The QCLAS was placed on the roof of a tram of the public transport company of the city of Zurich (VBZ) from 21 September 2015 to 9 March 2016. This tram ran most of the time on the tracks no. 11 and 14 according to the operation schedule defined by VBZ (see Fig. 3 for a detailed map). Tram services in Zurich operate from 5 a.m. to 1 a.m. at varying intervals. Consequently, the set of daily measurements (time period, number and location) varies from day to day. The cross-city tram services no. 11 and 14 link areas between 400 and 520 (above sea level), while elevated residential areas in Zurich are up to 640 The routes of these services are mostly on regular roads with little to heavy traffic, but include short passages that are free of motorized traffic.
NO2 concentrations encountered in Zurich are moderate compared to other cities. Largest emission sources contributing to ambient NO2 concentrations in Zurich are motorized traffic (47 % of NOx) and heating systems (28 % of NOx), followed by industry (15 %), construction (9 %), and other (1 %) (Brunner and Scheller, 2014). Traffic emissions are by far dominant with respect to the spatial variability measured by our mobile instrument as the release points of the emissions from heating systems are usually well above street level.
2.3 NO2 concentration measurements at stationary sites
The municipal (Department for Environment and Health Protection (UGZ), City of Zurich) and federal (Federal Office for the Environment, FOEN) authorities operate seven AQM stations with CLDs for regulatory purposes in the city (see Fig. 3). These stations cover background as well as highly polluted locations and provide a comprehensive overview of the pollution situation encountered in Zurich with respect to the range of concentration levels and thus to the intra-urban variability. However, the spatial representation is too coarse for the generation of spatially highly resolved pollution maps. We had access to the data with the highest-temporal resolution (1 min) from all sites for the time period 1 January 2015–1 June 2016. Two of the stations, STA and SCH, are located next to the tram tracks at a distance of 8 and 20 m, respectively. Five stations were operational during the complete campaign period. Operation of station BLU started on 1 January 2016. Station SWD was closed on 1 February 2016. The reported annual mean NO2 concentrations in 2015 for the AQM sites were: HEU: 18 µg m−3, ZUE: 31 µg m−3, STA: 33 µg m−3, SCH: 45 µg m−3, SWD: 47 µg m−3, and RGS: 50 µg m−3 (OSTLUFT, 2016).
2.4 Mobile NO2 concentration measurements
The measured NO2 concentration data (3 s average) from the QCLAS are transferred via a serial interface to a measurement unit with GPS that is part of the “OpenSense” network. This unit is installed next to our instrument and described in detail by Hasenfratz et al. (2015). The NO2 concentration and GPS position data are transmitted via GSM (Global System for Mobile communications) and stored in a central database.
An overview of the recorded NO2 data is shown in Fig. 4. For analysis purposes the period 9 October 2015–15 February 2016 for which good quality measurements are available has been considered. The gap between 27 December 2015 and 5 February 2016 is due to optical misalignment of the instrument. Further data were excluded for situations when the tram was located within the depot area or when the GPS position was not clearly attributable to the tram track. Overall, 37 % of the study period was represented by data that could be used for further analysis.
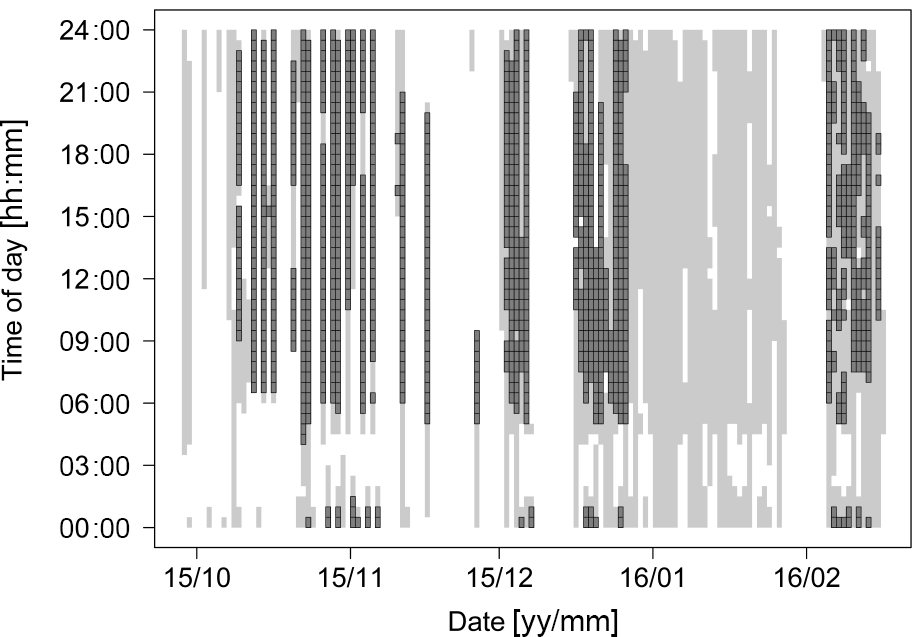
Figure 4Overview of the field campaign period. Time periods when the QCLAS was in operation and NO2 data were transmitted to the database are depicted in light gray. Thirty minutes periods for which the QCLAS delivered high quality NO2 data and the tram was in regular operation are depicted in dark gray.
The GPS receiver provided a position every 3 s, which was orthogonally projected on the nearest tram track after the route of the tram had been determined. We discarded all the positions with corrections exceeding 10 m. The NO2 measurements and GPS positions were not synchronous. Therefore, the locations of the NO2 measurements were linearly interpolated from the matched GPS positions. Considering the traveling speed of the tram, the NO2 measurements correspond to a route segment and not to a single point. The length of the covered segment is the product of the averaging time and the speed of the tram. Tram speed associated with the mobile NO2 measurements was smaller than 5 m s−1 for 64 % and smaller than 10 m s−1 for 92 % of the time.
3.1 Instrument performance and stability
The precision of the instrument was determined by applying the Allan variance technique (Werle et al., 1993) to the measured NO2 concentration time series. Figure 5 shows an Allan deviation plot for measurements of NO2-free (“zero”) air in the laboratory. The minimum in the Allan deviation plot indicates that the maximum useful averaging time is reached after 200 s and corresponds to a 1σ precision of 30 ppt. We also estimated the noise-floor of the detection system (combined detector and DAQ noise) by blocking the laser beam and analyzing the normalized noise signal. The Allan deviation for dark-noise is very close to the zero-air measurement, indicating that the NO2 precision at short time scales (< 100 s) is basically limited by the detection system. For longer time scales, the Allan deviation of the zero-air measurement levels off, indicating that instrumental drifts start to dominate. These are mostly due to temperature variations and optical instability. Nevertheless, the Allan deviation remains at a low level even after 1000 s. This indicates that the instrument can run stably without recalibration for about 20 min. Based on these results, we performed zero-air measurements for 2 min at every 18 min interval during the field campaign. This allows us to apply a drift correction, which basically involves a simple offset-correction by subtracting the linear interpolation of the mean of the zero-air measurements before and after each 18 min measurement period. Such an offset-correction is necessary as optical interference fringes, which can be seen as periodic “ripples” in the spectrum in Fig. 2, can cause an offset of the measured zero-air signal by up to ±5 ppb.
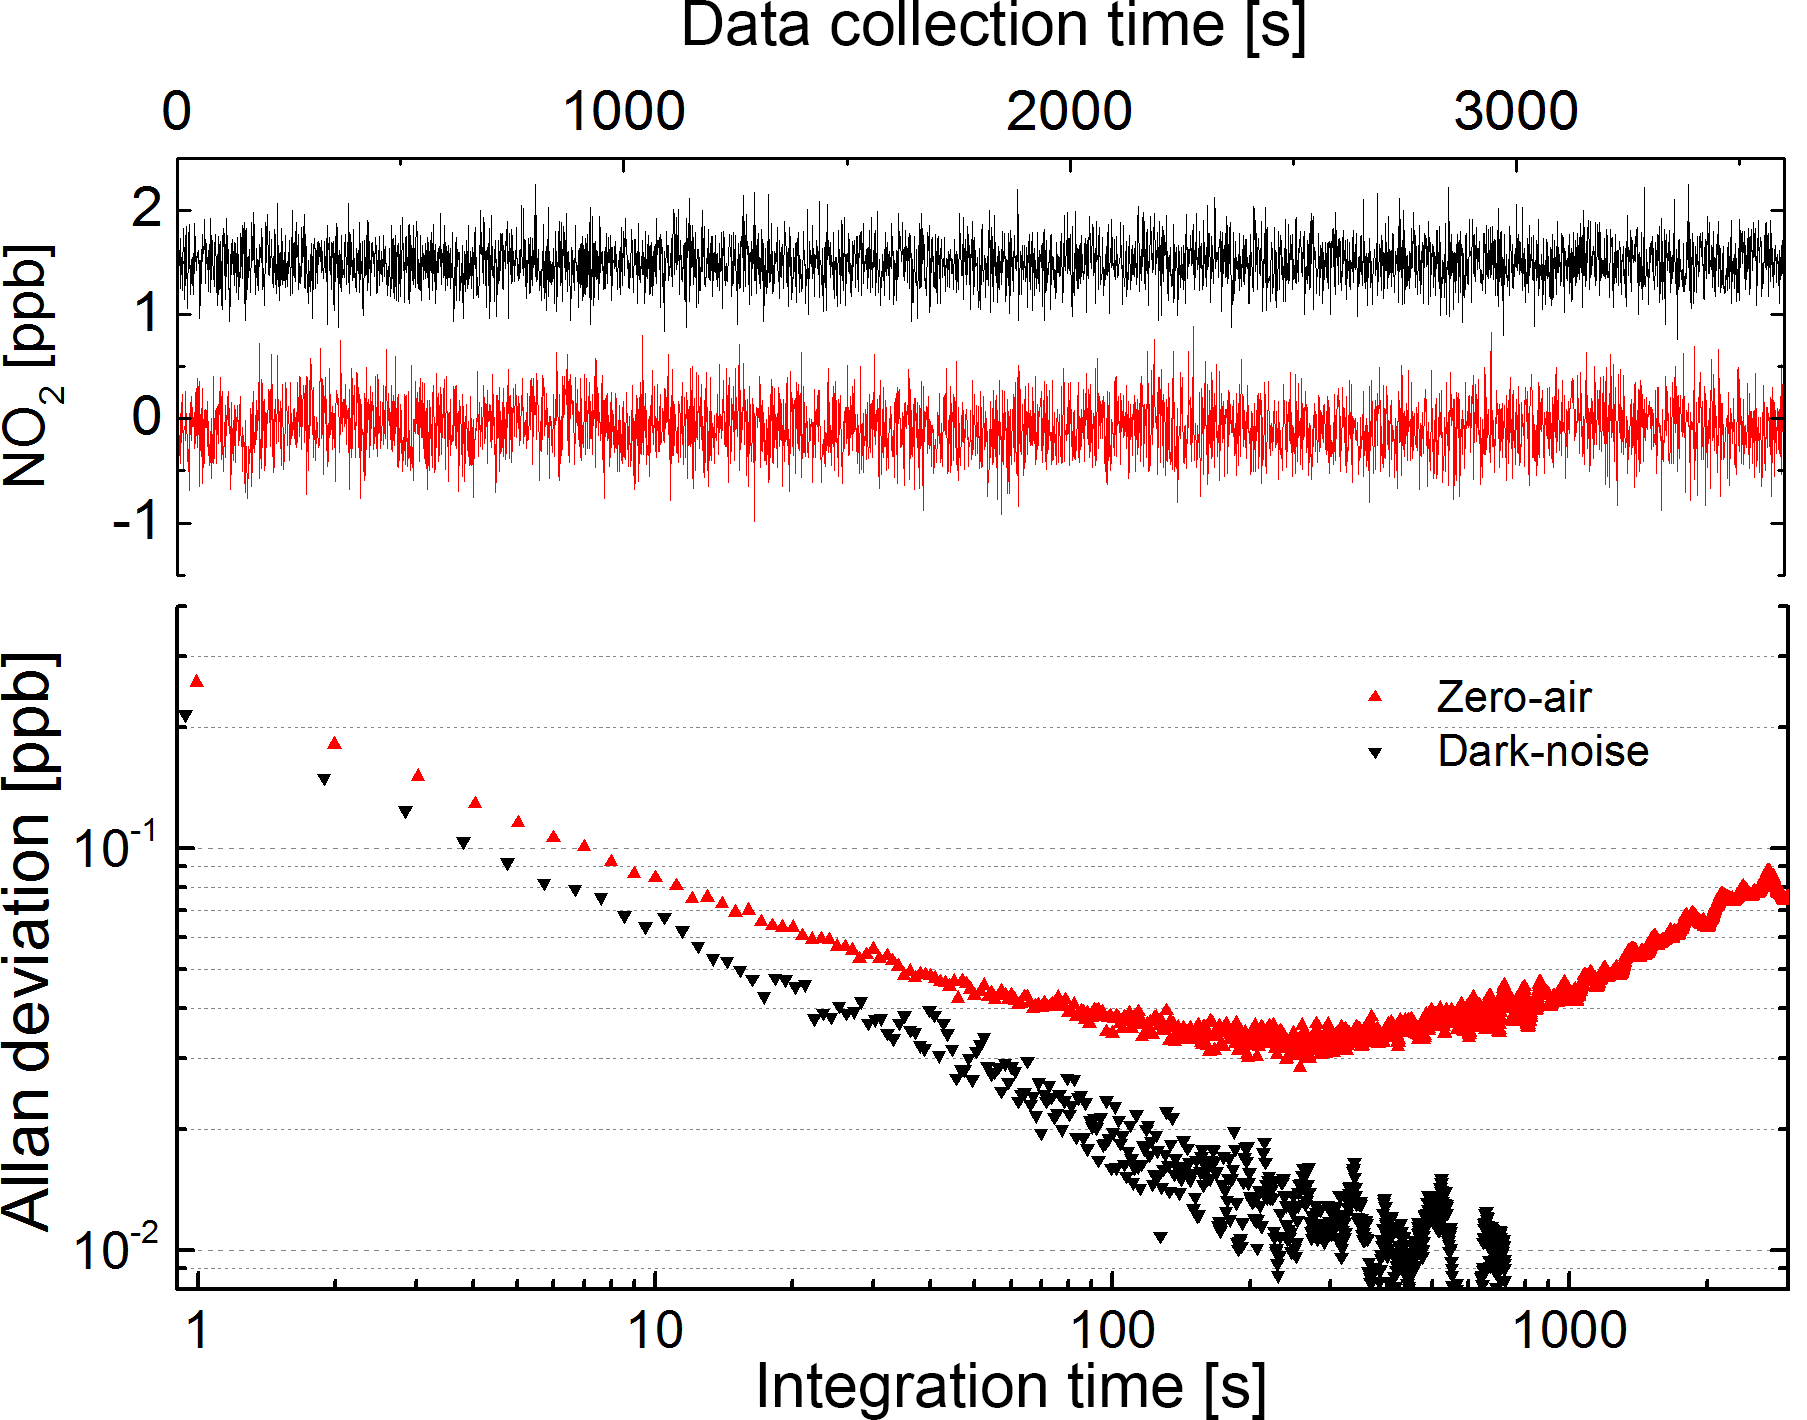
Figure 5Determination of the instrument precision and stability: time series of zero-air (red) and detector dark-noise (black) and the associated Allan deviation plots. The detector dark-noise trace in the top graph is offset by 1.5 ppb from zero for clarity.
As QCLAS determines compound concentration from the direct absorption signal based on Beer–Lambert's law, it can be considered an absolute method. The uncertainty of the retrieved concentration should only depend on the uncertainties of the input parameters, i.e., temperature, pressure, optical path length, and the spectroscopic parameters such as air broadening coefficient and line strength. A sensitivity analysis showed that the accuracies of temperature, pressure, and path length led to systematic uncertainties below 1 %. However, the spectroscopic line parameters are reported with 5 % maximum uncertainty (Perrin et al., 1992; Rothman et al., 2013). Due to its reactivity, calibration of direct and specific NO2 instruments is still an unsolved issue. Therefore, we chose to determine an overall calibration factor by comparison with a CLD, which is the reference method for regulatory AQM of NO2 in Europe (European Norm EN 14211:2005). More specifically, the QCLAS was compared to the chemiluminescence detector (CLD, APNA 370, Horiba) of a fixed air quality monitoring site (NABEL, located in Dübendorf, Switzerland), which is regularly calibrated to traceable NO standards. The CLD has a stated limit of detection of 0.1 ppb and a verified total uncertainty of 1.25 ppb at 30 ppb (NABEL, 2016). For comparison, the QCLAS was installed on the roof of the air quality monitoring site next to the gas inlet of the CLD (distance between the gas inlets < 1 m). A scatter-plot of concentration measurements of both instruments over a 48 h period is shown in Fig. 6. The linear fit with a slope of 0.83 reveals that the QCLAS measures about 17 % lower values than the CLD. Furthermore, there is an intercept of 0.5 ppb of the QCLAS relative to the CLD. The offset and part of the deviation of the slope from unity may be explained by cross-sensitivities of the CLD to other nitrogen containing compounds such as HNO3 and PAN. Such cross sensitivities have been studied for rural Switzerland by Steinbacher et al. (2007) and were reported also for an AQM station in Zurich (ZUE) which is comparable to the station in Duebendorf (DUE) in terms of NOx pollution level. In ZUE about 10 % of the annual measured “NO2” concentration in 2010 was found to be caused by cross sensitivities. As such, cross sensitivity of the CLD and spectroscopic uncertainty alone cannot completely explain the difference between QCLAS and CLD.

Figure 6Scatter plot of NO2 measurement (1 min averages) in ambient air using QCLAS and CLD techniques. The linear fit to the data (red line) has a slope 0.83 ± 0.004, intersect −0.49 ± 0.04, (errors are given in 1σ) and an R2 of 0.985.
The most plausible explanation to rationalize the observed difference is that NO2 is systematically lost in the case of the QCLAS. Indeed, laboratory tests with the multipass cell confirmed about 10 % loss of NO2 in a flow through experiment. The loss was reproducible and we found similar values before and after the field campaign. As the multipass cell is completely coated with gold, the most probable candidate for the NO2 loss is the absorption mask that is placed into the cell to suppress the optical fringes. Given this issue, we decided to use the average calibration factor from several parallel measurements during a one month campaign. An example of such a parallel measurement is plotted in Fig. 6. This has the advantage that it includes to some extent effects that may be dependent on air constituents that are not present in synthetic calibration gases. Finally, referencing our QCLAS measurements to a CLD (with a catalytic converter) despite its known cross sensitivities allows direct comparison to the measurements at the regulatory AQM sites that are located next to the tram tracks (SCH and STA) where the mobile QCLAS was operated.
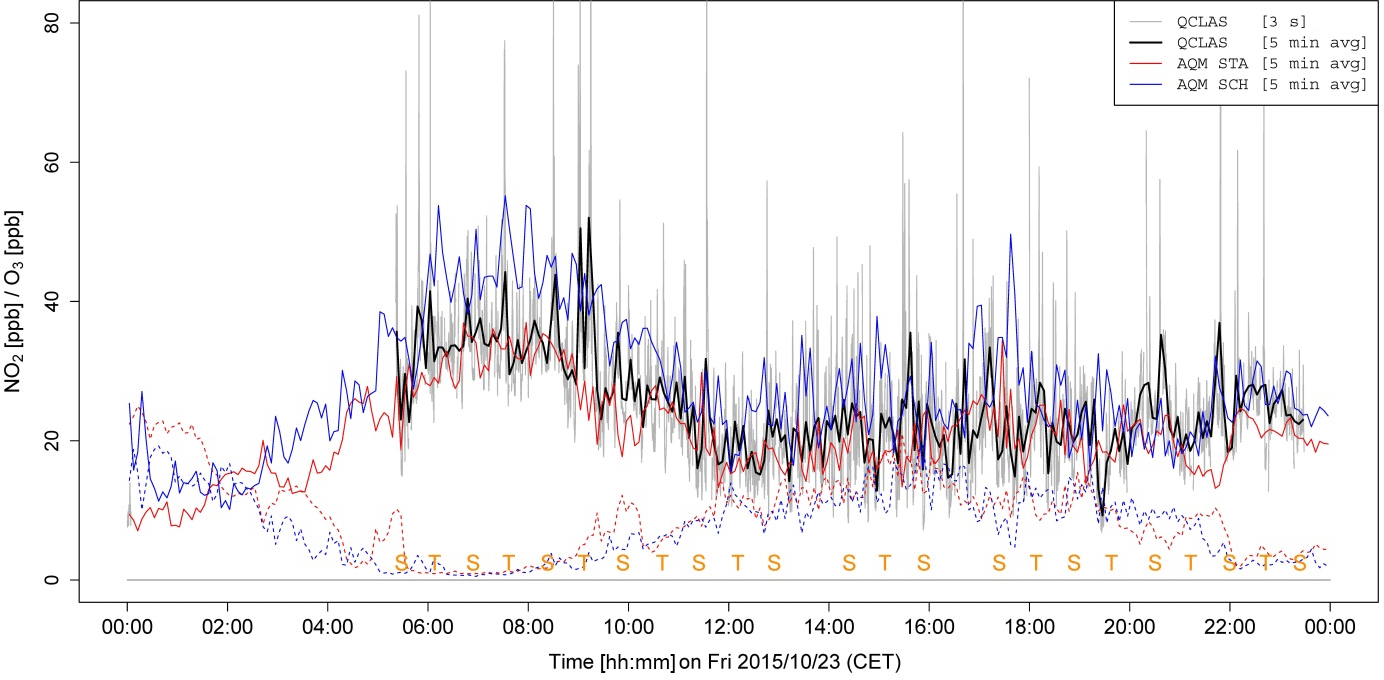
Figure 7NO2 time series of the tram based QCLAS (single values and 5 min averages) as well as of NO2 and O3 measurements from the AQM stations STA and SCH (5 min averages). The letters “S” and “T” depict when the tram passes the terminal stations Seebach and Triemli.
3.2 Tram based NO2 measurements
Operation conditions during the mobile application are significantly more demanding than in the laboratory due to the harsh environmental conditions involving large temperature variations, vibrations, changing humidity, and precipitation. We analyzed the quality of the data obtained in the mobile application in two ways: first, we compared the tram measurements to measurements from a fixed air quality monitoring site. Second, we explored NO2 patterns within defined spatial segments exploiting the fact that the tram traveled the same track several times.
The NO2 time series recorded by the mobile QCLAS during the campaign reveal the spatio-temporal variation of the urban pollutant concentration field. As an example, Fig. 7 shows one day of tram measurements (3 s and 5 min averages) along with the CLD measurements (5 min averages) from the fixed monitoring stations SCH and STA. Site SCH is impacted by heavier traffic than site STA, resulting in higher NO2 concentrations on average. Annual mean concentrations at SCH and STA in 2015 were 23.6 and 17.3 ppb, respectively. Traffic activities in Zurich are comparable during the morning and evening rush hours. Hence, a large part of the diurnal variation in NO2 concentration is due to meteorology, e.g., the development of the boundary layer height during the course of the day.
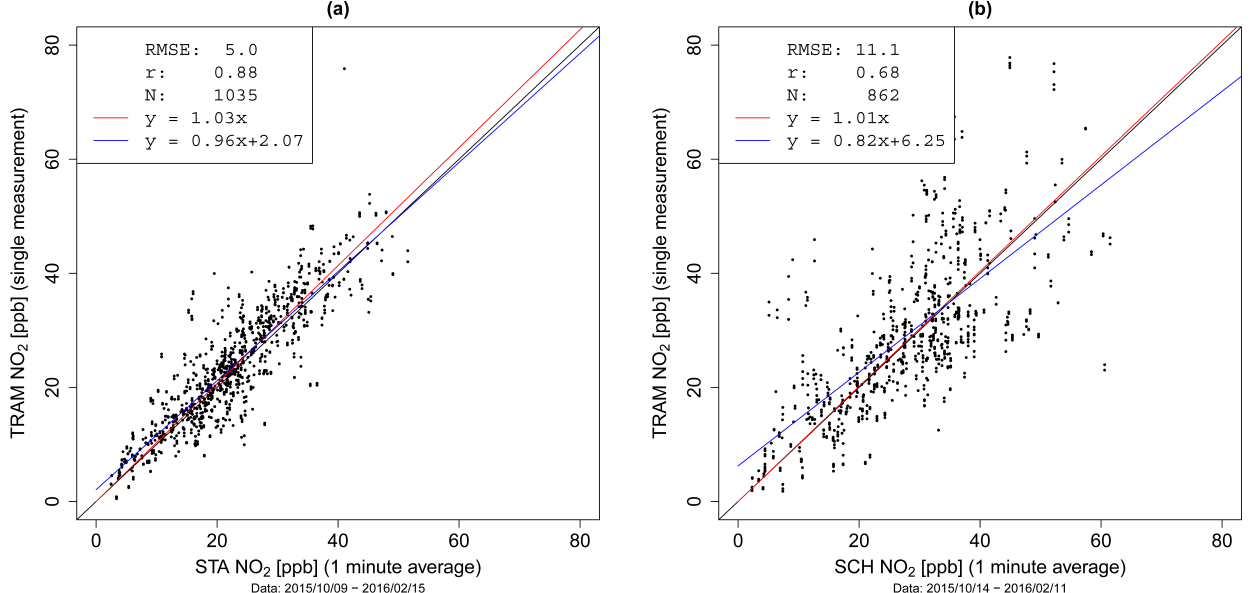
Figure 8Comparison of QCLAS data with measurement values (1 min average) from the AQM sites STA (a) and SCH (b) when the tram is within a 30 m radius from the respective AQM site.
The tram carrying the QCLAS regularly passed the fixed AQM sites about every 30 min on the selected day. This provided the opportunity to compare the NO2 concentration values. In Fig. 8, we plotted the data from the mobile instrument that were obtained in a 30 m radius around the fixed station STA and SCH vs. the corresponding CLD values from these AQM stations. While an excellent agreement is seen for site STA, the agreement is less pronounced for the station SCH. This could be for two reasons: (i) the larger distance between tram-track and monitoring station, and (ii) the location of site SCH at a crossroad, where traffic flow is controlled by traffic lights and therefore, a larger short-term variability of NO2 is expected. From a more general perspective, this is of importance when mobile sensor data is corrected based on data from nearby fixed reference sites, as suggested by Arfire et al. (2015) and Saukh et al. (2015). The parameters for data correction as determined from such an approach depend on the local concentration variability and the time response of the sensor and the reference instrument. Probing different air parcels may concur with concentration differences as it is observed for the data set obtained for AQM site SCH.
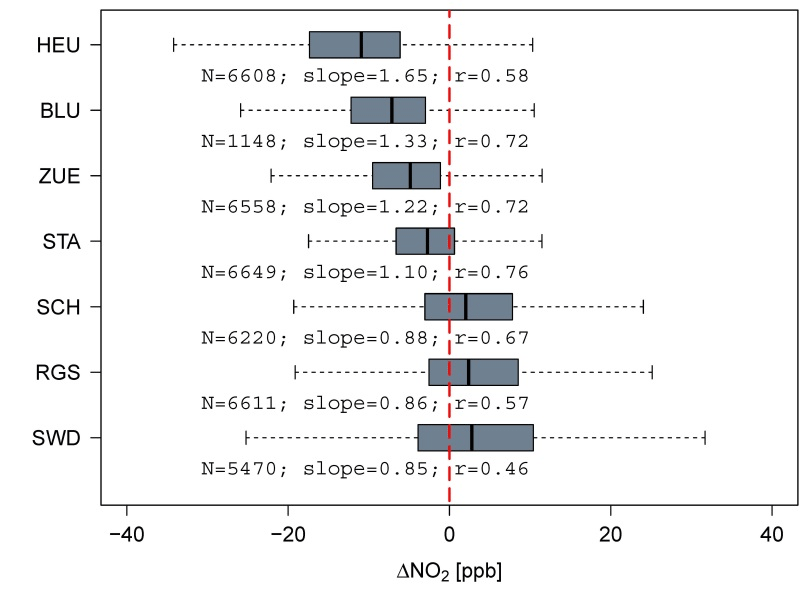
Figure 9Comparison of simultaneously measured NO2 (5 min average) from the mobile QCLAS and from the CLD in AQM sites irrespective of the location of the tram. N denotes the number of measurements, r is the Pearson correlation coefficient, and slope refers to a regression line through the origin (QCLAS vs. AQM).
Figure 9 summarizes the comparison between the tram measurements and data from all the AQM sites (5 min average). The comparison was performed individually for each site. We computed box-plots of the differences between the values from AQM sites and the values from the tram and calculated the slope of a linear regression through the origin.
Overall, the tram based NO2 measurements match well with the NO2 concentrations reported at different AQM sites. Best agreement was found with measurements from site STA. This site is most similar in terms of the average environment situation encountered by the tram, i.e., traffic loads and built environment. Sites SCH and RGS are located next to busy streets, site SWD next to a motorway and, thus, these three frequently encounter higher NO2 concentrations. As the tram operates most of the time on regular roads, the NO2 concentrations at AQM sites HEU and BLU are significantly lower on average than measured by the mobile QCLAS. Both sites are located at the outskirts of the city. Site HEU is about 200 m elevated with respect to the city center.
We analyzed the tram measurements in terms of their relation to traffic which is the main NO2 source in Zurich. Hereby, we consider the NO2 concentration as the sum of a background concentration level and a local emission signal (Heimann et al., 2015; Ruckstuhl et al., 2012).
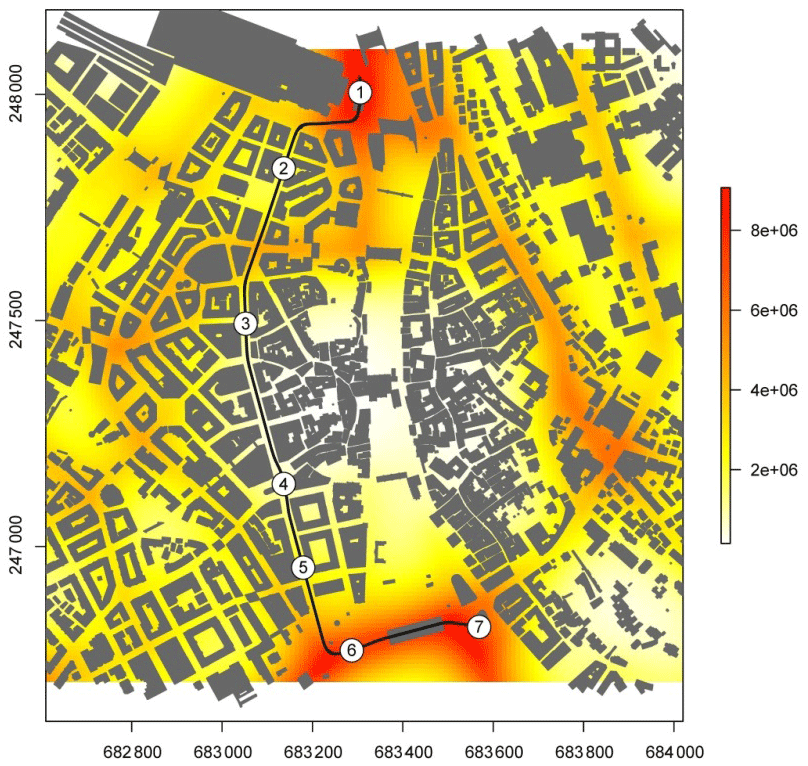
Figure 10Traffic intensity map. The tram track of line 11 between the stations Bahnhofquai (1) and Bellevue (7) is indicated by the black line.
The NO2 background signal for the city of Zurich was computed from the NO2 measurements from the AQM sites in the city center (RGS, SCH, STA, ZUE; see Fig. 3). The urban background site ZUE has the lowest concentration on average and therefore is most similar to the background signal. The NO2 measurements from each of these four AQM sites were averaged to 30 min mean values and the minimum 30 min mean value was taken as the 30 min NO2 background concentration. The local emission signal is then computed as the difference between the tram-based NO2 measurement and the background concentration.
Traffic intensity was calculated for all the locations in the city of Zurich based on annual mean values of the daily number of vehicles for particular roads as provided by the municipal authority. The data comes from 2013, which is well representative for the period observed in this study. The traffic intensity is based on the cumulated distance (CDi) traveled by all light- and heavy vehicles (multiplied by a factor 10) within 10 m × 10 m grid cells. Traffic intensity at a particular location is the sum of the products of CDi and weight Wi. We used for Wi the function with dij being the distance between location j and grid cell i and d0 equaling 50 m. Traffic intensity as used in this study does not take into account the built environment. Although, the traffic load follows daily and weekly patterns, we can still assume that the ranking of traffic loads of roads in the same part of the city remain proportional.
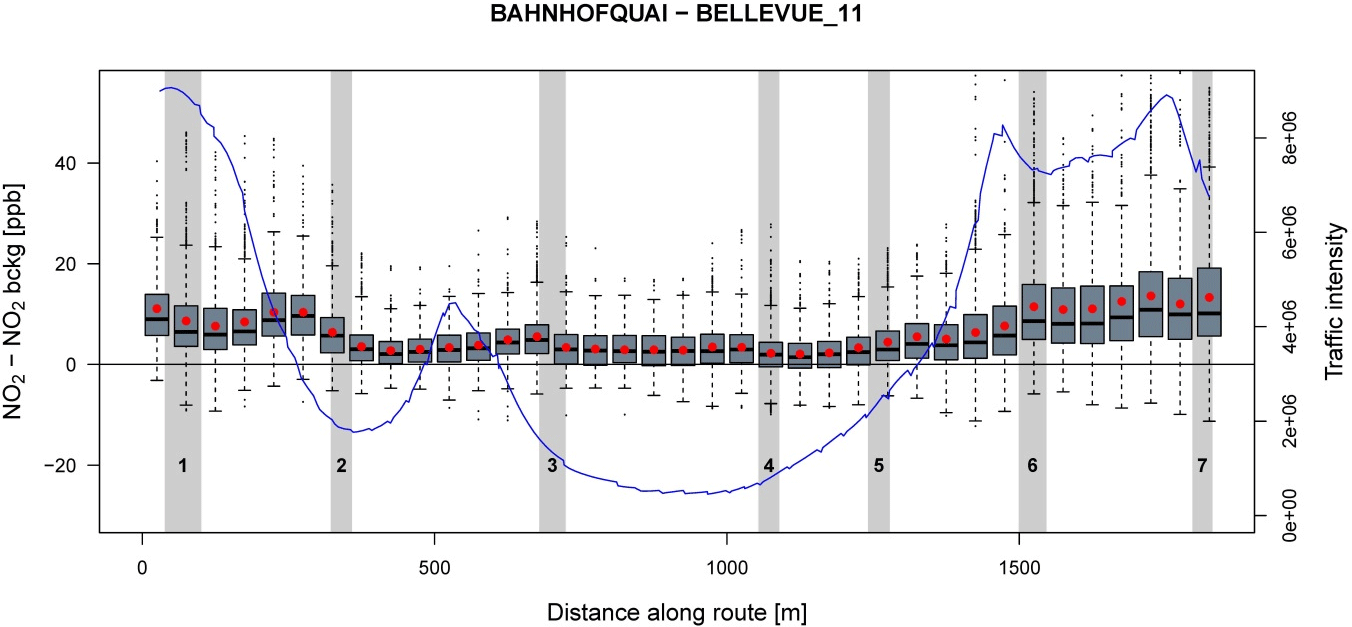
Figure 11Estimated local emission signal (i.e., difference between measured NO2 and background NO2) between stations Bahnhofquai (1) and Bellevue (7) aggregated by 50 m track length. The traffic intensity is indicated by the blue line.
Figure 10 shows the track segment between the stations Bahnhofquai and Bellevue as well as the traffic intensity. Correspondingly, Fig. 11 depicts the local emission signal aggregated by 50 m track length. The relation between traffic and the local emission signal is obvious. As expected, the local emission signal is highly variable in space and time corresponding to traffic loads and meteorological conditions.
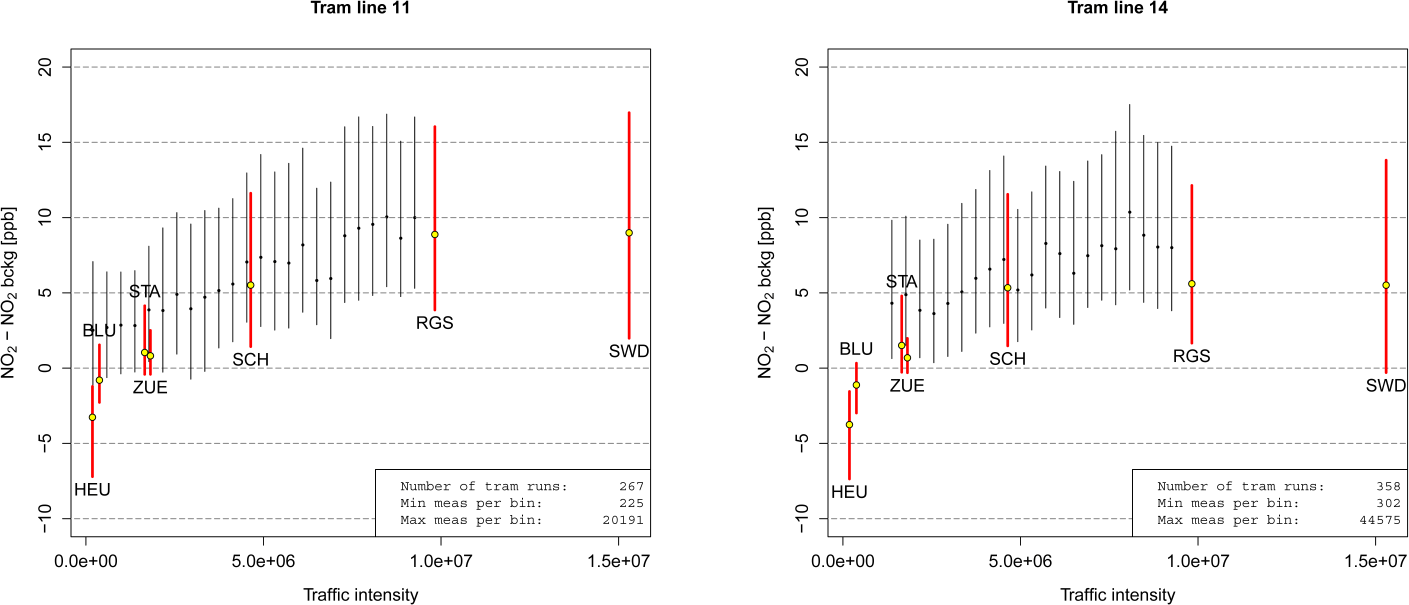
Figure 12Local emission signal (i.e., difference between measured- and the background NO2 concentration) related to the traffic intensity. The values from the tram instrument (QCLAS) are aggregated by equally spaced bins and depicted in black. The values from the AQM sites (CLD) are shown in red. The lines span the 25 to the 75 % quantiles, the dots represent the 50 % quantile.
Figure 12 shows the distribution of the local emission signal for all complete tram runs between two terminal stations on lines 11 and 14 aggregated with respect to traffic intensity. In addition, the distribution of the local emission signal at the AQM sites is shown. The AQM measurements were temporally filtered in order to correspond to the mobile measurements. Compared to the fix AQM sites, the tram based mobile measurements have a much higher spatial coverage and can extend the information about the air quality situation in an urban environment.
Although, measurements from one single instrument operating on a tram are not representative for the entire city, mobile instruments can be used for the validation of (urban-scale) atmospheric models or for delivering input data for mapping of air pollutants with high spatio-temporal resolution (Mueller et al., 2016). Mobile NO2 measurements with an accuracy of 1–3 ppb and a fast response time as provided by the developed QCLAS are certainly fit for this purpose.
We presented a compact and robust QCLAS for high-precision ambient NO2 measurements and successfully demonstrated its mobile deployment in an urban environment. Laboratory characterization and validation experiments showed a 1σ precision of the NO2 measurement of 0.23 ppb at 1 Hz resolution and of 0.03 ppb after 200 s averaging time. The spectroscopic uncertainty of the retrieved NO2 concentration was estimated to be less than 5 %; however, a systematic NO2 loss of about 10 % within the absorption cell has been observed. Therefore, the QCLAS was calibrated before deployment on the tram by comparison with traceable CLD measurements using urban atmospheric air. Under field conditions, temperature dependent drift of optical interference fringes caused up to ±5 ppb additional bias in the NO2 measurements. This was corrected by regular baseline measurements with NO2 free air. Thus, the mobile calibration infrastructure consisted only of an additional NO2 scrubber and a valve. The instrument operated autonomously on the roof of a tram measuring in situ and real-time NO2 concentrations across the city of Zurich over a period of four months. Regular comparison with reference CLD instruments from stationary AQM sites allowed assessing the quality of the retrieved values. The agreement was found to be better than 2 ppb.
The data revealed large spatio-temporal variability in NO2 concentration in the vicinity of emission sources. This clearly identifies the main shortcoming of the obtained data set with respect to statistical modeling: sparse sampling for particular location types related to the accessibility of the measurement locations that were limited to the tram tracks (few background locations, no elevated locations). Improvements to this mobile approach would require the installation of additional instruments on further trams and on other public transport vehicles (e.g., buses connecting residential areas on roads with very low traffic) or a combination of mobile and stationary instruments operated at background sites or at highly polluted locations. This would allow the mapping of the entire NO2 concentration field in a city with high spatio-temporal resolution and, concurrently, the refinement and validation of urban-scale modeling techniques.
Finally, the development of dual-wavelength QCL devices (Jagerska et al., 2014; Süess et al., 2016) opens the path towards mobile laser instruments that could measure NO and NO2 simultaneously within the same compact footprint. Such measurements would give valuable insights into urban NOx chemistry. Similarly, other target species, such as CO, CO2, O3 or CH4 could be included in the near future.
The data used in this study can be obtained from the authors upon request.
The authors declare that they have no conflict of interest.
The support from the group of Computer Engineering & Networks Lab of ETH Zurich in the transfer and storage of the
mobile NO2 measurements is gratefully acknowledged. In this context, we thank Balz Maag for his help
installing
the instrument on the tram. The Department of Environment and Health Protection (UGZ) of the City of Zurich, the
Department for Waste, Water, Energy and Air (AWEL) of the Canton of Zurich and the Swiss Federal Office for the
Environment (FOEN) is acknowledged for providing NO2 concentration measurements from air quality monitoring
sites and/or spatial data. We gratefully acknowledge the support of the transport company of Zurich (VBZ). The project was
financially supported by http://www.nano-tera.ch (last access: 28 April 2018) (IRSENS II and Opensense II).
Edited by: Andreas Hofzumahaus
Reviewed by: four anonymous referees
Adam, M., Schikowski, T., Carsin, A. E., Cai, Y., Jacquemin, B., Sanchez, M., Vierkotter, A., Marcon, A., Keidel, D., Sugiri, D., Kanani, Z. A., Nadif, R., Siroux, V., Hardy, R., Kuh, D., Rochat, T., Bridevaux, P. O., Eeftens, M., Tsai, M. Y., Villani, S., Phuleria, H. C., Birk, M., Cyrys, J., Cirach, M., de Nazelle, A., Nieuwenhuijsen, M. J., Forsberg, B., de Hoogh, K., Declerq, C., Bono, R., Piccioni, P., Quass, U., Heinrich, J., Jarvis, D., Pin, I., Beelen, R., Hoek, G., Brunekreef, B., Schindler, C., Sunyer, J., Kramer, U., Kauffmann, F., Hansell, A. L., Kunzli, N., and Probst-Hensch, N.: Adult lung function and long-term air pollution exposure. ESCAPE: a multicentre cohort study and meta-analysis, Eur. Respir. J., 45, 38–50, 2014.
Arfire, A., Marjovi, A., and Martinoli, A.: Model-based rendezvous calibration of mobile sensor networks for monitoring air quality, IEEE Sens. J., 1–4, https://doi.org/10.1109/ICSENS.2015.7370258, 2015.
Brauer, M., Lencar, C., Tamburic, L., Koehoorn, M., Demers, P., and Karr, C.: A cohort study of traffic-related air pollution impacts on birth outcomes, Environ. Health Persp., 116, 680–686, 2008.
Brunner, J. and Scheller, M.: Luftbilanz Stadt Zurich (Air quality report of the city of Zurich), Gesundheits- und Umweltdepartement Zürich, Zurich, Switzerland, 2014.
Courtillot, I., Morville, J., Motto-Ros, V., and Romanini, D.: Sub-ppb NO2 detection by optical feedback cavity-enhanced absorption spectroscopy with a blue diode laser, Appl. Phys. B-Lasers O., 85, 407–412, 2006.
Cyrys, J., Eeftens, M., Heinrich, J., Ampe, C., Armengaud, A., Beelen, R., Bellander, T., Beregszaszi, T., Birk, M., Cesaroni, G., Cirach, M., de Hoogh, K., Nazelle, A. D., de Vocht, F., Declercq, C., Dedele, A., Dimakopoulou, K., Eriksen, K., Galassi, C., Grauleviciene, R., Grivas, G., Gruzieva, O., Gustafsson, A. H., Hoffmann, B., Iakovides, M., Ineichen, A., Krämer, U., Lanki, T., Lozano, P., Madsen, C., Meliefste, K., Modig, L., Mölter, A., Mosler, G., Nieuwenhuijsen, M., Nonnemacher, M., Oldenwening, M., Peters, A., Pontet, S., Probst-Hensch, N., Quass, U., Raaschou-Nielsen, O., Ranzi, A., Sugiri, D., Stephanou, E. G., Taimisto, P., Tsai, M.-Y., Vaskövi, E., Villani, S., Wang, M., Brunekreef, B., and Hoek, G.: Variation of NO2 and NOx concentrations between and within 36 European study areas: results from the ESCAPE study, Atmos. Environ., 62, 374–390, 2012.
Dari-Salisburgo, C., Di Carlo, P., Giammaria, F., Kajii, Y., and D'Altorio, A.: Laser induced fluorescence instrument for NO2 measurements: observations at a central Italy background site, Atmos. Environ., 43, 970–977, 2009.
Dunlea, E. J., Herndon, S. C., Nelson, D. D., Volkamer, R. M., San Martini, F., Sheehy, P. M., Zahniser, M. S., Shorter, J. H., Wormhoudt, J. C., Lamb, B. K., Allwine, E. J., Gaffney, J. S., Marley, N. A., Grutter, M., Marquez, C., Blanco, S., Cardenas, B., Retama, A., Ramos Villegas, C. R., Kolb, C. E., Molina, L. T., and Molina, M. J.: Evaluation of nitrogen dioxide chemiluminescence monitors in a polluted urban environment, Atmos. Chem. Phys., 7, 2691–2704, https://doi.org/10.5194/acp-7-2691-2007, 2007.
EEA: Air Quality in Europe – 2016 Report, EEA – European Environment Agency, Luxembourg, 2016.
Fischer, M., Tuzson, B., Hugi, A., Broennimann, R., Kunz, A., Blaser, S., Rochat, M., Landry, O., Mueller, A., and Emmenegger, L.: Intermittent operation of QC-lasers for mid-IR spectroscopy with low heat dissipation: tuning characteristics and driving electronics, Opt. Express, 22, 7014–7027, 2014.
Fuchs, H., Dube, W. P., Lerner, B. M., Wagner, N. L., Williams, E. J., and Brown, S. S.: A sensitive and versatile detector for atmospheric NO2 and NOx based on blue diode laser cavity ring-down spectroscopy, Environ. Sci. Technol., 43, 7831–7836, 2009.
Gehring, U., Gruzieva, O., Agius, R. M., Beelen, R., Custovic, A., Cyrys, J., Eeftens, M., Flexeder, C., Fuertes, E., Heinrich, J., Hoffmann, B., de Jongste, J. C., Kerkhof, M., Klümper, C., Korek, M., Mölter, A., Schultz, E. S., Simpson, A., Sugiri, D., Svartengren, M., von Berg, A., Wijga, A. H., Pershagen, G., and Brunekreef, B.: Air pollution exposure and lung function in children: the ESCAPE project, Environ. Health Persp., 12, 1357–1364, 2013.
Hagemann, R., Corsmeier, U., Kottmeier, C., Rinke, R., Wieser, A., and Vogel, B.: Spatial variability of particle number concentrations and NOx in the Karlsruhe (Germany) area obtained with the mobile laboratory “AERO-TRAM”, Atmos. Environ., 94, 341–352, 2014.
Hasenfratz, D., Saukh, O., Walser, C., Hueglin, C., Fierz, M., Arn, T., Beutel, J., and Thiele, L.: Deriving high-resolution urban air pollution maps using mobile sensor nodes, Pervasive Mob. Comput., 16, 268–285, 2015.
Heimann, I., Bright, V. B., McLeod, M. W., Mead, M. I., Popoola, O. A. M., Stewart, G. B., and Jones, R. L.: Source attribution of air pollution by spatial scale separation using high spatial density networks of low cost air quality sensors, Atmos. Environ., 113, 10–19, 2015.
Jagerska, J., Jouy, P., Hugi, A., Tuzson, B., Looser, H., Mangold, M., Beck, M., Emmenegger, L., and Faist, J.: Dual-wavelength quantum cascade laser for trace gas spectroscopy, Appl. Phys. Lett., 105, 161109, https://doi.org/10.1063/1.4899061, 2014.
Kebabian, P. L., Herndon, S. C., and Freedman, A.: Detection of nitrogen dioxide by cavity attenuated phase shift spectroscopy, Anal. Chem., 77, 724–728, 2005.
Kehl, P.: GPS based dynamic monitoring of air pollutants in the city of Zurich, Switzerland, 2007, ETH Zurich, Zurich, Switzerland, 2007.
Mangold, M., Tuzson, B., Hundt, M., Jágerská, J., Looser, H., and Emmenegger, L.: Circular paraboloid reflection cell for laser spectroscopic trace gas analysis, J. Opt. Soc. Am. A, 33, 913–919, 2016.
McManus, J. B., Zahniser, M. S., Nelson, D. D., Shorter, J. H., Herndon, S. C., Jervis, D., Agnese, M., McGovern, R., Yacovitch, T. I., and Roscioli, J. R.: Recent progress in laser-based trace gas instruments: performance and noise analysis, Appl. Phys. B-Lasers O., 119, 203–218, 2015.
Mead, M. I., Popoola, O. A. M., Stewart, G. B., Landshoff, P., Calleja, M., Hayes, M., Baldovi, J. J., McLeod, M. W., Hodgson, T. F., Dicks, J., Lewis, A., Cohen, J., Baron, R., Saffell, J. R., and Jones, R. L.: The use of electrochemical sensors for monitoring urban air quality in low-cost, high-density networks, Atmos. Environ., 70, 186–203, 2013.
Mueller, M., Meyer, J., and Hueglin, C.: Design of an ozone and nitrogen dioxide sensor unit and its long-term operation within a sensor network in the city of Zurich, Atmos. Meas. Tech., 10, 3783–3799, https://doi.org/10.5194/amt-10-3783-2017, 2017.
Mueller, M. D., Wagner, M., Barmpadimos, I., and Hueglin, C.: Two-week NO2 maps for the City of Zurich, Switzerland, derived by statistical modelling utilizing data from a routine passive diffusion sampler network, Atmos. Environ., 106, 1–10, 2015.
Mueller, M. D., Hasenfratz, D., Saukh, O., Fierz, M., and Hueglin, C.: Statistical modelling of particle number concentration in Zurich at high spatio-temporal resolution utilizing data from a mobile sensor network, Atmos. Environ., 126, 171–181, 2016.
NABEL: Technischer Bericht zum Nationalen Beobachtungsnetz für Luftfremdstoffe (NABEL), BAFU – Bundesamt für Umwelt, available at: https://www.empa.ch/documents/56101/246436/Technischer+Bericht+2015/7df814b3-960c-4045-990f-987671802f71 (last access: 28 April 2018), 2016.
Osthoff, H. D., Brown, S. S., Ryerson, T. B., Fortin, T. J., Lerner, B. M., Williams, E. J., Pettersson, A., Baynard, T., Dube, W. P., Ciciora, S. J., and Ravishankara, A. R.: Measurement of atmospheric NO2 by pulsed cavity ring-down spectroscopy, J. Geophys. Res.-Atmos., 111, D12305, https://doi.org/10.1029/2005jd006942, 2006.
OSTLUFT: Luftqualität 2015, Die Luftqualitätsüberwachung der Ostschweizer Kantone und des Fürstentums Liechtenstein, Zurich, Switzerland, 2016.
Patimisco, P., Scamarcio, G., Tittel, F. K., and Spagnolo, V.: Quartz-enhanced photoacoustic spectroscopy: a review, Sensors, 14, 6165–6206, 2014.
Perrin, A., Flaud, J. M., Camy-Peyret, C., Vasserot, A. M., Guelachvili, G., Goldman, A., Murcray, F. J., and Blatherwick, R. D.: The ν1, 2ν2, and ν3 interacting bands of 14N16O2: line positions and intensities, J. Mol. Spectrosc., 154, 391–406, 1992.
Pushkarsky, M., Tsekoun, A., Dunayevskiy, I. G., Go, R., and Patel, C. K. N.: Sub-parts-per-billion level detection of NO2 using room-temperature quantum cascade lasers, P. Natl. Acad. Sci. USA, 103, 10846–10849, 2006.
Reed, C., Evans, M. J., Di Carlo, P., Lee, J. D., and Carpenter, L. J.: Interferences in photolytic NO2 measurements: explanation for an apparent missing oxidant?, Atmos. Chem. Phys., 16, 4707–4724, https://doi.org/10.5194/acp-16-4707-2016, 2016.
Rothman, L. S., Gordon, I. E., Babikov, Y., Barbe, A., Benner, D. C., Bernath, P. F., Birk, M., Bizzocchi, L., Boudon, V., Brown, L. R., Campargue, A., Chance, K., Cohen, E. A., Coudert, L. H., Devi, V. M., Drouin, B. J., Fayt, A., Flaud, J. M., Gamache, R. R., Harrison, J. J., Hartmann, J. M., Hill, C., Hodges, J. T., Jacquemart, D., Jolly, A., Lamouroux, J., Le Roy, R. J., Li, G., Long, D. A., Lyulin, O. M., Mackie, C. J., Massie, S. T., Mikhailenko, S., Mueller, H. S. P., Naumenko, O. V., Nikitin, A. V., Orphal, J., Perevalov, V., Perrin, A., Polovtseva, E. R., Richard, C., Smith, M. A. H., Starikova, E., Sung, K., Tashkun, S., Tennyson, J., Toon, G. C., Tyuterev, V. G., and Wagner, G.: The HITRAN2012 molecular spectroscopic database, J. Quant. Spectrosc. Ra., 130, 4–50, 2013.
Ruckstuhl, A. F., Henne, S., Reimann, S., Steinbacher, M., Vollmer, M. K., O'Doherty, S., Buchmann, B., and Hueglin, C.: Robust extraction of baseline signal of atmospheric trace species using local regression, Atmos. Meas. Tech., 5, 2613–2624, https://doi.org/10.5194/amt-5-2613-2012, 2012.
Saukh, O., Hasenfratz, D., and Thiele, L.: Reducing multi-hop calibration errors in large-scale mobile sensor networks, in: Proceedings of the 14th International Conference on Information Processing in Sensor Networks, 14–16 April 2015, Seattle, Washington, USA, 274–285, 2015.
Sluis, W. W., Allaart, M. A. F., Piters, A. J. M., and Gast, L. F. L.: The development of a nitrogen dioxide sonde, Atmos. Meas. Tech., 3, 1753–1762, https://doi.org/10.5194/amt-3-1753-2010, 2010.
Steinbacher, M., Zellweger, C., Schwarzenbach, B., Bugmann, S., Buchmann, B., Ordóñez, C., Prevot, A. S. H., and Hueglin, C.: Nitrogen oxide measurements at rural sites in Switzerland: bias of conventional measurement techniques, J. Geophys. Res.-Atmos., 112, D11307, https://doi.org/10.1029/2006JD007971, 2007.
Süess, M., Hundt, P., Tuzson, B., Riedi, S., Wolf, J., Peretti, R., Beck, M., Looser, H., Emmenegger, L., and Faist, J.: Dual-Section DFB-QCLs for Multi-Species Trace Gas Analysis, Photonics, 3, 24, https://doi.org/10.3390/photonics3020024, 2016.
Thornton, J. A., Wooldridge, P. J., and Cohen, R. C.: Atmospheric NO2: in situ laser-induced fluorescence detection at parts per trillion mixing ratios, Anal. Chem., 72, 528–539, 2000.
Tuzson, B., Mangold, M., Looser, H., Manninen, A., and Emmenegger, L.: Compact multipass optical cell for laser spectroscopy, Opt. Lett., 38, 257–259, 2013a.
Tuzson, B., Zeyer, K., Steinbacher, M., McManus, J. B., Nelson, D. D., Zahniser, M. S., and Emmenegger, L.: Selective measurements of NO, NO2 and NOy in the free troposphere using quantum cascade laser spectroscopy, Atmos. Meas. Tech., 6, 927–936, https://doi.org/10.5194/amt-6-927-2013, 2013b.
Villena, G., Bejan, I., Kurtenbach, R., Wiesen, P., and Kleffmann, J.: Development of a new Long Path Absorption Photometer (LOPAP) instrument for the sensitive detection of NO2 in the atmosphere, Atmos. Meas. Tech., 4, 1663–1676, https://doi.org/10.5194/amt-4-1663-2011, 2011.
Villena, G., Bejan, I., Kurtenbach, R., Wiesen, P., and Kleffmann, J.: Interferences of commercial NO2 instruments in the urban atmosphere and in a smog chamber, Atmos. Meas. Tech., 5, 149–159, https://doi.org/10.5194/amt-5-149-2012, 2012.
Werle, P., Mucke, R., and Slemr, F.: The limits of signal averaging in atmospheric trace-gas monitoring by tuneable diode-laser absorption-spectroscopy (TDLAS), Appl. Phys. B-Photo., 57, 131–139, 1993.
WHO: Review of Evidence on Health Aspects of Air Pollution – REVIHAAP project: final technical reportk, World Health Organization (WHO) Regional Office for Europe, Copenhagen, Denmark, 2013.