the Creative Commons Attribution 4.0 License.
the Creative Commons Attribution 4.0 License.
A UAV-based active AirCore system for measurements of greenhouse gases
Truls Andersen
Bert Scheeren
Wouter Peters
We developed and field-tested an unmanned aerial vehicle (UAV)-based active AirCore for atmospheric mole fraction measurements of CO2, CH4, and CO. The system applies an alternative way of using the AirCore technique invented by NOAA. As opposed to the conventional concept of passively sampling air using the atmospheric pressure gradient during descent, the active AirCore collects atmospheric air samples using a pump to pull the air through the tube during flight, which opens up the possibility to spatially sample atmospheric air. The active AirCore system used for this study weighs ∼ 1.1 kg. It consists of a ∼ 50 m long stainless-steel tube, a small stainless-steel tube filled with magnesium perchlorate, a KNF micropump, and a 45 µm orifice working together to form a critical flow of dried atmospheric air through the active AirCore. A cavity ring-down spectrometer (CRDS) was used to analyze the air samples on site not more than 7 min after landing for mole fraction measurements of CO2, CH4, and CO. We flew the active AirCore system on a UAV near the atmospheric measurement station at Lutjewad, located in the northwest of the city of Groningen in the Netherlands. Five consecutive flights took place over a 5 h period on the same morning, from sunrise until noon. We validated the measurements of CO2 and CH4 from the active AirCore against those from the Lutjewad station at 60 m. The results show a good agreement between the measurements from the active AirCore and the atmospheric station (N = 146; : 0.97 and : 0.94; and mean differences: ΔCO2: 0.18 ppm and ΔCH4: 5.13 ppb). The vertical and horizontal resolution (for CH4) at typical UAV speeds of 1.5 and 2.5 m s−1 were determined to be ±24.7 to 29.3 and ±41.2 to 48.9 m, respectively, depending on the storage time. The collapse of the nocturnal boundary layer and the buildup of the mixed layer were clearly observed with three consecutive vertical profile measurements in the early morning hours. Besides this, we furthermore detected a CH4 hotspot in the coastal wetlands from a horizontal flight north to the dike, which demonstrates the potential of this new active AirCore method to measure at locations where other techniques have no practical access.
- Article
(6663 KB) - Full-text XML
- BibTeX
- EndNote
Since the 18th-century industrial revolution, greenhouse gas (GHG) mole fractions have been increasing due to anthropogenic activity. Rapid increases in carbon dioxide (CO2) and methane (CH4) have occurred since the 1950s, contributing to global climate change (IPCC, 2014a, b). Understanding and quantifying both natural and anthropogenic fluxes of the two major GHGs, namely CO2 and CH4, is vital to predict future mole fraction levels and to help monitor the effectiveness of the emissions reduction efforts.
Both CO2 and CH4 are naturally occurring greenhouses gases in our atmosphere, with CO2 the more abundant of the two. Today, natural production of CO2 happens mainly through decay of organic matter and respiration by aerobic organisms. Besides the natural sources of atmospheric CO2, there are additional anthropogenic contributions to the total atmospheric CO2 mole fractions, mainly from burning of fossil fuels. In recent years the mole fractions of atmospheric CO2 have been increasing by ∼ 2 ppm (parts per million) per year (Tans and Keeling, 2017; Hartmann et al., 2013). Methane has a shorter lifetime in the atmosphere than that of CO2, but CH4 is more efficient at trapping radiation. The comparative impact of CH4 on climate change is 20–30 times greater than that of CO2 over a 100-year period (Saunois et al., 2016; Dlugokencky et al., 2011). Methane is naturally produced and emitted to the atmosphere when organic matter decomposes in low-oxygen environments, and natural sources include wetlands, swamps, marshes, termites, and oceans. From 2007 to 2016, the increase of the global methane mole fractions has been ∼ 7 ppb (parts per billion) per year (Hartmann et al., 2013). The main contributors to anthropogenic methane emissions are leakages from coal mining and the oil and gas industry, ruminant animals, rice agriculture, waste management, and biomass burning (Kirschke et al., 2013; Saunois et al., 2016). The quantification of CH4 emissions is highly important in studying the global methane cycle where vertical profiling with high resolution provides further information on the contributions from CH4 sources and sinks (Berman et al., 2012).
In 2010, the National Oceanic and Atmospheric Administration (NOAA) developed the first AirCore, an innovative atmospheric air sampling system (Karion et al., 2010) from an idea originally developed and patented by Pieter Tans (Tans, 2009). The AirCore consists of long, thin-wall stainless-steel tubing capable of sampling and preserving atmospheric profile information. The AirCore is evacuated as it is lifted up to a high altitude (∼ 30 km) by a balloon, and then during descent after the balloon bursts it is passively filled with atmospheric air samples due to the increasing ambient pressure. The samples are analyzed on the ground to retrieve the GHG vertical profiles. The length and diameter of the tubes and the time it takes from sampling until analysis ultimately determine the vertical resolution. Since the first development of the AirCore (Karion et al., 2010), additional augmentations of the AirCore has been developed and tested. This includes smaller and lighter AirCores developed at Goethe University Frankfurt (Engel et al., 2017) and the University of Groningen (Paul et al., 2016; Chen et al., 2018), and a high-resolution (HR) AirCore developed at École Polytechnique, Université Paris-Saclay (Membrive et al., 2017). Other applications using the AirCore technique include measurements of δ13CH4 and C2H6 ∕ CH4 ratios, using the AirCore to store a rapidly acquired sample and analyze the sample at a lower flow rate while maintaining the sample integrity (Rella et al., 2013).
In recent years, the use of unmanned aerial vehicles (UAVs) has become a new complementary platform for GHG measurements. Previous studies include the investigation of temporal and spatial variations of atmospheric CO2 using a unique CO2 measurement device attached to a small UAV (kite plane) (Watai et al., 2006); atmospheric monitoring of point source fossil fuel CO2 and CH4 from a gas treatment plant using a Helikite (Turnbull et al., 2014); CO2, CH4, and H2O measurements on board the National Aeronautics and Space Administration (NASA) Sensor Integrated Environmental Remote Research Aircraft (SIERRA) UAV (Berman et al., 2012); a small atmospheric sensor measuring CO2, CH4, and H2O attached to a robotic helicopter (Khan et al., 2012); the quantification of CH4 mole fractions and isotopic compositions from heights up to 2700 m on Ascension Island using a remotely piloted octocopter (Lowry et al., 2015; Brownlow et al., 2016); and a dedicated CO2 analyzer, COmpact Carbon dioxide analyzer for Airborne Platforms (COCAP), capable of being flown onboard small UAVs (Kunz et al., 2018).
For this study, we combine the flexibility and mobility of UAVs, and the AirCore's ability to capture and preserve the spatial resolution of atmospheric air samples to design and develop an alternative AirCore version, named active AirCore. Instead of passively sampling air due to the changing ambient pressure during flight, the active AirCore pulls atmospheric air samples through the tube at a certain flow rate using a micropump. This allows for a highly mobile system that can obtain both vertical and horizontal profiles with a high spatial resolution. Unlike the original AirCore (Karion et al., 2010) and the newer versions (Membrive et al., 2017; Engel et al., 2017; Chen et al., 2018) that are all made to sample the atmospheric column including the stratosphere, the active AirCore has been designed to fulfill a different purpose and does not aim to reach a height well above the troposphere like its predecessors. The active AirCore provides a powerful tool to fill the vertical gap of GHG measurements between the surface and the lowest altitude usually reachable by aircraft. The flexibility and mobility of the system makes it possible to make GHG observations at locations where tall-tower measurements are not readily available.
With the capability of sampling horizontal transects, the active AirCore can help quantify CO2 and CH4 emissions from local areas such as wetlands, landfills, and other CH4 hot spots, and quantify point sources emissions such as power plant plumes. It can also provide highly accurate and precise measurements to be used for validation of measurements of remote-sensing techniques.
The instrument design is presented in the Method section, together with the experimental setup and the data processing method. The Results section presents the measurements made by the active AirCore during five flights in a day. Section 4 discusses the horizontal and vertical resolution. Section 5 presents the conclusions.
The active AirCore, designed to fly with a lightweight UAV (total weight below 4 kg), consists of ∼ 50 m thin-wall stainless-steel tubing, a dryer, a micropump, and a data logger. It is placed in a carbon fiber box and attached to the UAV using two carbon fiber rods. Prior to every flight, the active AirCore is flushed with a calibrated fill gas that is spiked with ∼ 10 ppm CO, which helps to identify the starting point of ambient air sampling during later analysis. The active AirCore starts to collect air samples when the micropump is turned on using a switch located outside the box shortly before a UAV flight, and the pump is turned off after the UAV lands. Air samples are collected during the flight and retained within the active AirCore. The active AirCore samples are then immediately analyzed with a trace gas analyzer (CRDS, Picarro, Inc., CA, USA, model G2401).
2.1 Active AirCore
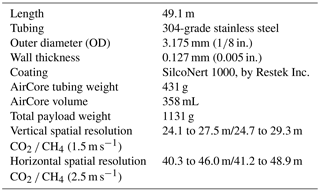
The dimensions of the active AirCore, along with some key parameters, are given in Table 1.
As the thin-wall tubing is very fragile, we have used custom-made stainless-steel connectors to reinforce the connection with the coiled tube and Swagelok fittings at both ends. These connectors have an inner diameter (ID) of 3.275 mm on one end and an outer diameter (OD) of 3.175 mm on the other. The 3.175 mm ID of the connector is inserted onto the thin-walled AirCore tubing and fastened using glue for ceramics, leaving the 3.175 mm OD side open and usable by Swagelok fittings. To obtain a constant flow through the AirCore, an orifice (OD 1∕4 in., orifice diameter 45 ± 10 % µm, Lenox laser Inc.) is placed between the pump and the coiled tube. The upstream pressure of the orifice is close to ambient, or more accurately the ambient pressure minus a small pressure drop across the whole coiled tube, while the downstream pressure of the orifice is mainly determined by the pumping capacity and was measured at 380 hPa with the pump (KNF micropump, model 020L). Thus, the flow across the coiled tube is expected to be critical as long as the upstream pressure is above ∼ 760 hPa (2 × 380 hPa), or below ∼ 2.4 km above the sea level, and was measured to be 21.5 sccm (standard cubic centimeters per minute) in the laboratory. The pressure between the orifice and the pump is constantly monitored through a stainless-steel Swagelok tee junction (Honeywell TruStability High-accuracy Silicon Ceramic (HSC) Series). The pump and the tee junction are connected via flexible fluorinated ethylene propylene (Tygon) tubing (1∕8 in. ID). This same type of tubing is also connected to the outlet of the pump and leads to a hole on the side of the AirCore box, venting the pump exhaust outside of the box. Air samples are dried with a 7.5 cm long stainless-steel tube (1∕4 in. OD) filled with magnesium perchlorate before they are sampled into the coiled tube. The inlet of the active AirCore system is placed at the bottom of the carbon fiber AirCore box and is attached through a hole to the dryer tube with a small piece of flexible 1∕4 in. ID nylon tubing.
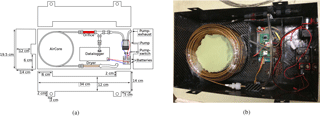
The AirCore box itself is made from 0.5 mm thick carbon fiber plate with a density of 1600 kg m−3, providing a sturdy and lightweight box to house the active AirCore system. The AirCore box has a length of 34 cm, a width of 19.5 cm, and a height of 12 cm. The total weight of the active AirCore system, including the AirCore box, is 1.1 kg. Figure 1a shows a schematic design of the active AirCore system, while Fig. 1b shows a photo of the prototype product.
The data logger is made using an Arduino MEGA 2650 board that records meteorological data via two pressure sensors, five temperature sensors, a relative humidity sensor, and a GPS (Global Positioning System) receiver. The pressure sensors are silicon pressure sensors of the model Honeywell TruStability HSC. One pressure sensor monitors the pressure between the pump and the orifice, while the other measures the outside ambient pressure through a flexible nylon tube going through the bottom of the box. These sensors have an accuracy of ±0.25 % in the range of 67–1034 hPa (1–15 psi). The relative humidity is a model DHT22, which measures in the range of 0–100 % with an uncertainty of 2.5 %. The temperature sensor embedded in the relative humidity sensor can measure in a range of −40 to 125 ∘C with an uncertainty of 0.5 ∘C. During the day of this study, however, we did not have relative humidity measurements, due to the sensor being placed inside the enclosed AirCore box. This has been resolved in the latest version of the active AirCore system, where the relative humidity sensor is now placed underneath the AirCore box. The external temperature sensors are all PT100 elements from Innovative Sensor Technology and have an uncertainty of 0.15 ∘C. The GPS coordinates and time are measured using a GPS model ATM2.5 NEO-6M module with EEPROM built-in activity.
The data logger is powered by one 9 V battery, while the micropump is powered by 12 V, four 3 V batteries connected in series. The micropump was controlled via an on–off switch mounted on the outside of the carbon fiber box for easy use before takeoff.
2.2 The trace gas analyzer
All mole fraction analyses of air samples from the active AirCore are conducted using a cavity ring-down spectrometer (CRDS, Picarro, Inc., CA, USA, model G2401) (Crosson, 2008), situated close to the landing site of the UAV. The cavity of the analyzer is strictly maintained at a pressure of ∼ 186 hPa (140 Torr) and a temperature of 45 ∘C to achieve a precision (1σ, 0.5 Hz) better than 0.03 ppm for CO2, 0.5 ppb for CH4, and 7 ppb for CO, based on cylinder measurements before and after analysis of the AirCore. We control the sample flow of the analyzer operating in the inlet valve control mode at a constant rate using a needle valve between the analyzer and the vacuum pump. We set the flow rate during all the analyses of active AirCore samples at ∼ 20.5 sccm. The flow rate was monitored using an Alicat MB-100SCCM-D/5M flowmeter located at the exhaust of the pump and was noted down at the beginning of the analysis and assumed constant throughout the analysis of the AirCore. After each analysis, the analyzer is switched to measure fill gas through the active AirCore at a higher flow rate of ∼ 120 sccm by fully opening the needle valve. In this way, we are able to shorten the time interval between one flight to the next to 50 min.
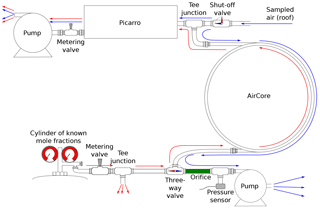
Figure 2Schematic of the roof air test setup in the laboratory. The blue lines indicate the time at which both the Picarro and the AirCore sample the roof air, while the red lines indicate the time at which the Picarro analyzes the sampled air from the AirCore.
2.3 Laboratory tests
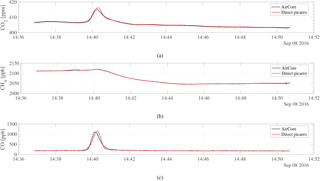
Prior to the flights, we validated the active AirCore measurements in laboratory experiments against in situ mole fraction measurements of CO2, CH4, and CO using a CRDS analyzer. Figure 2 shows a schematic of the experimental setup. During the experiments, the CRDS analyzer and the active AirCore were set up to sample the roof air through the same inlet via a tee junction. The roof air was partially dried, having a water vapor content of ∼ 0.1 %. The water vapor effects were corrected based on Chen et al. (2010) and Rella et al. (2013) for CO2 and CH4, and Chen et al. (2013) for CO to obtain dry-mole fractions of CO2, CH4, and CO, respectively. Both the analyzer and the AirCore were flushed with dry cylinder air prior to the start of the test, until the measured water vapor level was below 0.005 %. Once the active AirCore was fully sampled, the micropump was turned off and a shutoff valve was switched to close the inlet. This was followed by the analysis of the active AirCore samples using the same CRDS analyzer. A three-way valve at the end of the active AirCore was also turned so that the sample was chased by dry cylinder air with known mole fractions. The flow rate through the CRDS analyzer during analysis was 19.2 sccm, while the air samples were collected into the active AirCore at a flow rate of 21.5 sccm. Once the test was complete, the active AirCore data were processed as described in Sect. 2.6. Three experiments were performed to verify the consistency of the results, and we observed a strong correlation between the direct CRDS analyzer measurements and the sampled active AirCore mole fraction values. The R2 values were 0.99, 0.97, and 0.97, with the mean differences of 0.04 ± 0.21 ppm, 0.58 ± 0.67 ppb, and 0.86 ± 27.37 ppb for CO2, CH4, and CO, respectively. Figure 3 shows the time series of one of the experiments; the mole fractions during the three tests ranged from 394 to 417 ppm for CO2, 2009 to 2120 ppb for CH4, and 118 to 1657 ppb for CO. The large standard deviation in CO is due to a sharp spike of several hundred parts per billion during three experiments, as seen in Fig. 3c. During the roof air tests, the data logger tracked the inside pressure, outside pressure, and the temperature of the AirCore, which are the essential parameters that go into the processing. From Fig. 3a and c, a small time lag between the AirCore measurement and the direct measurement can be seen. This is believed to be due to water vapor effects, as the air was not fully dried. Figure 3b also shows a small CH4 spike around 14:39 UTC. This is likely due to metal-to-metal friction, generated by touching the stainless-steel tubing during analysis.
2.4 The UAV
The active AirCore system has been flown aboard a small quadcopter UAV (model DJI Inspire 1 Pro). The UAV (including battery and propellers) weighs ∼ 2.9 kg, has a maximum flight time of approximate 15 min, and is capable of flying at wind speeds up to 10 m s−1. With zero wind, the UAV is capable of ascending with a speed up to 5 m s−1 and descending with a speed up to 4 m s−1, and it has a maximum horizontal speed of up to 22 m s−1. When carrying the active AirCore as payload, the UAV system weighed ∼ 4 kg and was able to make a ∼ 12 min flight. The payload was attached to the bottom of the UAV, so that the inlet was facing downwards towards the ground, using two 10 mm carbon fiber rods that were fixed to the UAV using zip ties and duct tape.
2.5 The analysis box
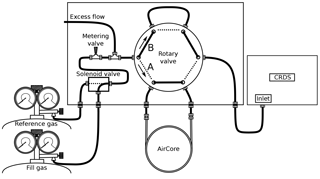
We constructed an analysis box to simplify the analysis of the air samples from the active AirCore and to reduce the potential contamination of the sample from non-sampled air. A schematic of the analysis box is shown in Fig. 4. Two female Swagelok quick connectors (QC series) for the reference and the fill gas are placed on the left side of the box. One of the two cylinders is selected via a Fluid Automation Systems solenoid valve (model CH-1290) by the software of the Picarro CRDS analyzer. A Swagelok metering valve (model SS-SS2) and an excess flow path are situated between the solenoid and the six-port Vici rotary valve (model EUDB-26UWE). The metering valve is used to restrict the total airflow that is set slightly larger than the flow rate through the CRDS analyzer, with the rest venting through the excess flow path. The rotary valve provides two positions, namely position A (analysis) and position B (bypass). The position is controlled via buttons outside the analysis box. Two 1∕8 in. Swagelok bulkhead connectors are fixed to the middle of the box where the active AirCore is connected. On the right side of the analysis box is the outlet, which is connected directly to the CRDS analyzer.
2.6 Data processing
One of the major advantages of the UAV-based active AirCore is that, in contrast to a free balloon-based AirCore, the UAV normally lands next to the operator. This allows for immediate analysis of the air samples after landing and thus minimizes the spatial resolution degradation due to molecular diffusion of air samples in the tube. During flight, the CRDS analyzer runs a reference gas through a bypass path so that once the active AirCore is connected the analysis can begin immediately. Switching from bypass to analysis makes the reference gas “push” the active AirCore sample, while the analyzer drags the sample with a constant flow rate of 20.5 sccm. The sample is in fact analyzed in reverse, with the first measured mole fractions linked to the landing of the UAV. The spiked CO mole fractions are seen towards the end of the analysis until finally the reference gas mole fractions are seen on the analyzer. This leads to a well-defined sample between the two cylinder gas mole fraction values, seen as a “plug” between the reference gas mole fraction values. Since the active AirCore is open on both ends, a small contamination from water vapor and ambient air is seen at the ends of each sample. Table 2 shows the mole fractions for the reference and fill gas, calibrated with respect to the WMO 2007, 2004A, and 2004A scales for CO2, CH4, and CO, respectively.
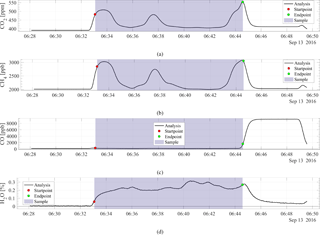
During the processing of the data the measured mole fraction values are corrected for water vapor as stated in Sect. 2.3. A pre-determined calibration curve is applied to the measured dry-mole fractions to correct for drift in the linear calibration curve, and finally the mole fractions are corrected with a single bias between the measured and calibrated values of the reference gas. Figure 5 shows the analysis of CO2 (a), CH4 (b), CO (c), and H2O (d) for the second flight made on 13 September 2016. The green and red dots indicate the start and the end point of the sample, respectively. The start point was selected as three-fourths of the way into the water vapor increase, where the analysis goes from dried cylinder air to AirCore, while the end point was selected as the last point before the mole fractions goes above 2000 ppb CO, a little into the CO-spiked fill gas. These points were empirically determined from the fifth flight, where the maximum correlation between the active AirCore and the 60 m continuous measurements was found. These points were consistently selected for all the flights.
The air entering the tube will quickly equilibrate with the mean active AirCore temperature. The pump creates a low pressure of ∼ 380 hPa at the downstream end of the active AirCore, which is more than 2 times lower than the ambient upstream pressure, forming a critical flow through the orifice. The length and the diameter of the active AirCore remain constant, and thus the only parameters that influence the sampling flow rate are the ambient pressure and the temperature of the AirCore and the orifice. Based on this and the ideal gas law, we estimate the number of moles of air (Δn) that flows into the active AirCore within a time step Δt at any given time as the sum of the change of the number of moles of total air in the active AirCore and the number of moles of air flowing out of the AirCore:
where Δn is the number of moles of air sampled into the active AirCore, P is the ambient pressure, V is the total volume of the active AirCore, R is the universal gas constant, T is the temperature of the active AirCore, t is the time, and f is the volumetric flow rate given by
where Cd is the dimensionless discharge coefficient that can be empirically determined, A is the area of the orifice, R is the universal gas constant, T is the temperature of the orifice in kelvin, and M is the molar mass of air in kilograms per mole. During the analysis of the air samples by the CRDS analyzer, the flow is set at a constant rate. Therefore, the number of moles of air analyzed within a time step Δt′ at any given time t′ can be expressed as
where f′ is the analysis flow rate, and P′ and T′ are the ambient pressure and temperature in the laboratory, respectively. The number of moles of air samples that entered into the active AirCore during flight and the equal number of moles of air samples analyzed by the CRDS analyzer are used to establish the link between the time it took to collect the sample and the time it took to analyze it.
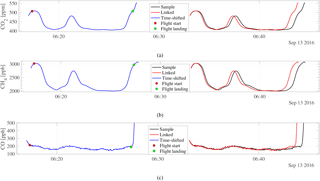
Figure 6The analysis of CO2 (a), CH4 (b), and CO (c) for the second flight on 13 September 2016 with its original analysis time, the data-logger-linked time series, and the shifted data-logger-linked time series of the analysis. The red and the green dots represent the time when the drone took off and landed, respectively.
Using Eqs. (1), (2), and (3), an approximated flight-linked analysis time can be obtained, having effectively linked the number of moles going into the sample with the analysis time. The measured mole fractions can then be directly linked to the time series of the data logger. Figure 6 shows the CRDS analyzer analysis with the original analysis time vs. the flight-linked analysis time.
2.7 Atmospheric station
The atmospheric measurement station Lutjewad was established in the year 2000 by the Centre for Isotope Research (CIO), University of Groningen, and an aerial photograph is shown in Fig. 7. The station is located 30 km from the city of Groningen, is easily accessible via roads, and is located on the northern coast of the Netherlands (6.3529∘ E, 53.4037∘ N, 1 m a.s.l.) situated roughly 50 m behind the Wadden Sea dike. In analyzing wind direction data for the years 2006 to 2014, it was found that the station received 16 % of the time northerlies (315–45∘ sector), 34 % southerlies (135–225∘ sector), 22 % easterlies, and 28 % westerlies. Hence, about half of the time the station receives relatively polluted continental air masses. On the seaside, sporadically flooded salt marshes next to the dike pass into the Wadden Sea with its tidal flats. It stretches about 6 km to the north, where the island Schiermonnikoog marks the transition to the North Sea. The observatory itself is surrounded by low shrubs and grass. The rural landscape to the south consists mainly of pasture and cropland with patches of forested land. The livestock in the area is dominated by dairy cows and sheep. The nearest large town is the city of Groningen (200 000 inhabitants) at a distance of about 30 km in the east-southeast (ESE) direction. The annual frequency of ESE winds, which could carry pollution from the city directly, is usually less than 1 % (van der Laan et al., 2009).
CO2 and CH4 were continuously monitored at 60 m a.g.l. via humid-air analysis from a Picarro CRDS system model 2301, while measurements of CO2, CH4, and CO at 7 m were similarly measured using a Picarro CRDS system model 2401. The Picarro CRDS measurements at the 7 m inlet were started a week prior to this campaign. The atmospheric station maintains continuous temperature, relative humidity, and atmospheric pressure measurements at 7, 40, and 60 m. At 7 and 40 m the wind speed is also measured, and at 60 m, the wind speed and wind direction. However, during the day of this study the wind speed and wind direction measurements at 60 m malfunctioned and were not recorded.
3.1 Flight trajectories
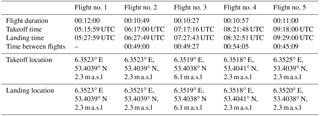
All flights conducted for this study were performed on 13 September 2016. The first three flights aimed to obtain vertical profile measurements of CO2, CH4, and CO. Information regarding the flight duration, time between flights, takeoff location, landing location, and mean speeds can be found in Table 3. The first flight took place at 06:15 UTC. The sunrise occurred at 06:05 UTC. The UAV ascended up to 210 m and hovered at this altitude for 45 s before ascending up to 500 m. The UAV hovered at this altitude for 20 s before descending back down to the landing zone. During the second flight, the UAV ascended up to an altitude of 300 m and, upon reaching this altitude, immediately started its descent towards an altitude of 60 m. Once this altitude was reached, it ascended back up to 180 m before starting its final descent towards the landing zone. The third flight trajectory was similar to the first flight, ascending from the takeoff zone up to 500 m at a steady pace before descending back down to the landing zone. The data logger malfunctioned during this flight, causing the micro SD card to appear empty upon retrieval. This led to no stored temperature, relative humidity, or pressure readings during this flight. For the processing of this flight, ambient pressure readings from the first flight were used to approximate similar altitude pressures. The temperature profile from the first flight was used as the measured active AirCore temperature but adjusted according to measured temperature profiles from the atmospheric station. The time series from the UAV flight log was used together with noted-down times of when the pump was running to link with the analysis time. The GPS coordinates and altitude were also obtained from the UAV log.
The area between the northern dike and the coastal sea is covered with wetlands, and flight no. 4 measured the CO2 and CH4 enhancement by flying from the dike to the sea. The takeoff zone was located on the dike, having an elevation of 6.1 m. The UAV started at the takeoff zone and ascended to an altitude of 22 m before flying horizontally over the wetlands towards the sea (northwestern direction). The horizontal speed was averaging at 12 m s−1 for this leg of the flight. Once the UAV reached the sea, it descended to an altitude of 10 m and flew along the coastline (southwestern direction) at an average speed of 4 m s−1. Right before the UAV reached a critical battery level beyond the point of no return, it changed its direction and headed back towards the landing zone, cruising at an average speed of 5 m s−1 at an altitude of 10 m. At the landing site, the UAV hovered for 2 min before landing.
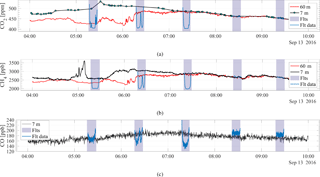
Figure 8The continuous CO2 (a), CH4 (b), and CO (c) measurements from the atmospheric tower at 7 m (black) and 60 m (red), along with the mole fractions measured with the active AirCore (blue). The highlighted areas indicate the time span for each of the flights, approximately spaced 1 h apart. The altitude covered during the flights was 485, 301, 478, and 23 m for flight nos. 1, 2, 3, and 4, respectively, transecting both the 7 and 60 m altitudes. Flight no. 5 hovered at 60 m close to the 60 m tower inlet.
The fifth and final flight was a verification flight for the active AirCore system. The UAV hovered close to the 60 m tower inlet at the atmospheric station, sampling with the active AirCore while air at the 60 m inlet was pumped down to be analyzed by a CRDS analyzer in the ground station. Ascending to an altitude of 60 m, the UAV positioned itself next to the tower and hovered for 9 min before starting its descent towards the landing zone.
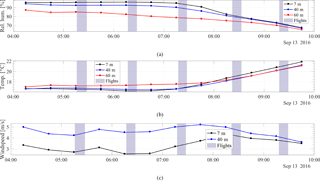
Figure 9The meteorological data measured at the atmospheric station during 13 September 2016. Panel (a) shows the relative humidity, (b) the temperature, and (c) the wind speed. The black curve indicates measurements at 7 m, the blue curve at 40 m, and the red curve at 60 m. The highlighted areas indicate the times of the five flights.
3.2 Tower measurements
Figure 8a, b, and c show the continuous measurements of CO2, CH4, and CO, respectively, on the full day of 13 September 2016. The 7 m inlet measurements are indicated with the black curves, while the 60 m inlet measurements are indicated by the red curves. The vertical shaded lines represent the time interval of each of the five flights, and the blue curves indicate the sampled mole fractions during each flight. As shown in Fig. 8a and b, the CO2 and CH4 mole fractions deviated strongly from each other at the times of the first and second flights. During the third flight the 7 and 60 m measurements were almost identical, indicating that the boundary layer below 60 m was well mixed. At the time of the third, fourth, and fifth flight, a clear well-mixed boundary layer had formed. The third flight took place at 07:17:16 UTC, which was 09:17:16 LT.
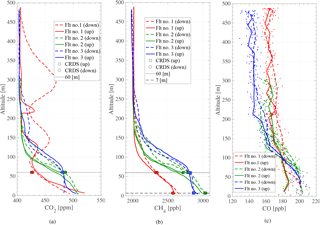
Figure 10Vertical profiles of (a) CO2, (b) CH4, and (c) CO for flight nos. 1–3. Panels (a) and (b) include a dotted line indicating 60 m and shows measured trace gas mole fractions from the Lutjewad atmospheric station at this height. Panel (b) also includes a dotted line to indicate 7 m height and the corresponding CH4 values obtained from the atmospheric station at this height. The square points represent the mole fractions measured at the time of the UAV ascent, and the circular points represent the mole fractions measured during the UAV descent. The color of the markers represents its respective flight. The CO mole fractions shown in panel (c) have been averaged by every fifth data point. The ambient temperature and relative humidity are not shown due to the sensors only being placed inside the box, as discussed in Sect. 2.1.
As mentioned in Sect. 2.7, the atmospheric station maintains continuous measurements of temperature, relative humidity and wind speed at 7, 40, and 60 m. The time series during 13 September 2016 are shown in Fig. 9.
3.3 The vertical profiles of CO2, CH4, and CO
Figure 10a, b, and c show the measured mole fractions of CO2, CH4, and CO against altitude for the first three flights, respectively. Flight no. 1 is indicated by the red curve, the second flight the green curve, and the third flight the blue curve. The solid lines indicate the ascending profiles, while the dotted lines indicate the descending profiles. The figures also show the measured tower mole fractions at 60 and 7 m at the same time the drone was at these altitudes. Tower measurements for CO2 are shown at 60 m in Fig. 10a, tower measurements for CH4 at both 60 m and 7 m are shown in Fig. 10b, and tower measurements of CO at 7 m are shown in Fig. 10c.
The vertical CO2 profiles seen in Fig. 10a show how CO2 mole fractions change throughout the morning hours. The vertical mixing of the boundary layer can be seen from the temporal change of CO2 mole fractions that decrease at ground level from flight nos. 1 to 2, and further from flight nos. 2 to 3, coupled with a simultaneous growth of the CO2 mole fractions between the flights at 60 m. This mole fraction growth at 60 m is also reflected in the CH4 profiles shown in 10b. However, a decrease in CH4 between flight nos. 1 and 2 is not observed at ground level, which suggests an enhancement of methane has taken place between flight nos. 1 and 2. The enhancement in CH4 between flight nos. 1 and 2 is confirmed by the observed CH4 mole fractions at 7 and 60 m from the Lutjewad tower (Fig. 8b). The enhancement is 470 and 450 ppb for CH4 at 7 and 60 m, respectively. These suggest a strong local surface source, likely from ruminants and wetlands from the land surrounding the Lutjewad area. As seen in Fig. 8, a strong decoupling between 7 and 40 m CO2 and CH4 until about 08:00 UTC+1 indicated a very shallow nocturnal boundary layer responsible for the high near-ground mole fractions associated with the local emission sources.
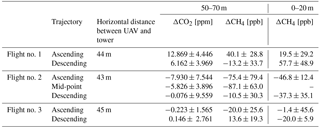
Table 4The differences between the measured active AirCore profiles and the trace gas mole fractions measured at the atmospheric station at 60 and 7 m. An average mole fraction from the AirCore profile between 50 and 70 m is compared to an average mole fraction of the 60 m tower measurements within the same time frame. Similarly, the average mole fraction from the AirCore profile between 0 and 20 m is compared to average a mole fraction of the 7 m tower measurements within the same time span.
Above 200 m, the mole fractions of both CO2 and CH4 are nearly constant, with the exception of the CO2 profile of flight no. 1. This suggests a stable boundary layer with a height of 200 m. However, we do not have a good explanation for the observed large variability of CO2 seen in the descending profile of flight no. 1. Compared to CO2 and CH4, there is less variability in the mole fractions of CO, as seen in Fig. 10c. The enhancement in CO in the stable boundary layer relative to the CO aloft is seen for all the three profiles.
3.3.1 Validation against the atmospheric station measurements
Figure 10a, b, and c also include the measured atmospheric station mole fractions of CO2 and CH4 at 60 m, and CH4 at 7 m. The square markers indicate that the mole fractions was measured during the time the UAV was ascending, and the round markers indicate mole fractions measured during descent. The differences between the flight profiles and the tower measurements can be seen in Table 4, where an average mole fraction from 50 to 70 m has been compared to the average mole fraction from the 60 m inlet during the same time frame. Similarly, the average 7 m mole fractions within the given time frame were compared to AirCore mole fractions between 0 and 20 m.
3.3.2 The variability of the flights
As seen in Fig. 10a, the behavior of the first flight with respect to the mole fractions of CO2 did not follow expectations, nor did it have the same features as seen in the consecutive flights, and the features that are observed for CO2 also do not occur in the CH4 or CO profiles. The correlation between CO2 and CH4 for flight nos. 2 and 3 is strong, with R2 values of 0.99 for both flights, while the correlation for the first flight yields an R2 of 0.58. This low correlation could be due to CO2 emissions from a nearby power plant. The Eemshaven coal power plant is located 34 km east of Lutjewad and has a stack of 120 m. If the winds were not steady before sunrise, CO2 emissions from the power plant may have dispersed to influence our flight profile, seen as the features in the Fig. 10a.
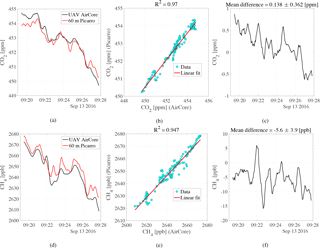
Figure 11The AirCore analysis of the fifth flight and the continuous tower measurements from 60 m. The plot shows the analysis profiles and the correlation between these two measurements from both CO2 and CH4. The differences in CO2 and CH4 between the two measurements are also shown.
Both the descending and ascending mole fraction profiles during all the flights compare well with the continuous measurements of CO2, CH4, and CO at 60 and 7 m. From Table 4, it is seen that the best fit between data and atmospheric tower data occurred during the third flight. A possible explanation for this could be the smaller variability of mole fractions within the boundary layer. The drop in the measured mole fractions at higher altitudes with each successive flight indicates that the boundary layer is transitioning from its nocturnal state to a mixed boundary layer. This is expected as the sun rises (Stull, 1988).
3.4 Verification of the active AirCore
Figure 11a and d show the measured CO2 and CH4 mole fractions from the fifth flight together with the measured mole fractions from the 60 m inlet at the time of flight. Figure 11b and e show the correlation between the measured flight mole fractions and the 60 m inlet measurements for CO2 and CH4, respectively. Figure 11c and f show the mole fraction difference between the flight analysis and the 60 m inlet measurements for CO2 and CH4, respectively.
As seen in Fig. 11a, the measured flight sample and the 60 m inlet measurements are in very good agreement throughout the time of the flight. The first 2 min of the flight measure slightly higher CO2 mole fractions than the continuous tower measurements, averaging 0.5 ppm above. An offset of the same size is also seen towards the end of the flight. Figure 11c shows the difference throughout the flight, having a mean difference of 0.14 ± 0.36 ppm between the active AirCore and the 60 m tower inlet. Although the trend is similar, sharp peaks and troughs have been smoothed in the active AirCore compared to the tower measurements. There is a strong correlation between the active AirCore analysis and the 60 m tower inlet measurements. This correlation is seen in Fig. 11b and yields an R2 of 0.97 for CO2.
As shown in Fig. 11d, the CH4 analysis from the active AirCore and the 60 m inlet measurements follow the same trend. However, there is a consistent offset where the 60 m tower measurements measure higher mole fractions of CH4. The difference throughout the flight is shown in Fig. 11f, having a mean difference of −5.6 ± 3.9 ppb between the active AirCore and the 60 m tower inlet. The same smoothed curve as seen in Fig. 11a is also seen in Fig. 11d. The sharp peaks and troughs measured by the atmospheric station have been smoothed in the active AirCore. A strong correlation is seen between the CH4 measurements of the active AirCore and the 60 m inlet analysis, and is shown in Fig. 11e. The R2 is 0.95 for the CH4 measurements. Figure 11c also shows a slight downward trend in the difference. This can be explained by contamination of the AirCore sample at both ends, where the end has been contaminated by a high mole fraction CO2 spike at one end, likely due to human breath while disconnecting the AirCore and preparing for the flight, and the other side by the reference gas, which held a lower concentration of CO2 than the sampled air.
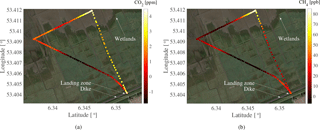
Figure 12The measured mole fractions of CH4 and CO2 during the fourth flight. Takeoff for the flight was on the dike, flying out towards the sea, doing a 90∘ turn, and flying along the coast before heading back to the takeoff spot. The white/yellow and red/black colors indicate high and low mole fraction enhancement, respectively.
3.5 Methane enhancement from wetlands
Figure 12a and b show the measured CH4 and CO2 enhancement relative to the background mole fractions measured at the atmospheric station during the fourth flight, respectively. The white/yellow color indicates a high enhancement of its respective trace gas, while the black/red color indicates a low enhancement. The flight took place over the wetlands, north of the Wadden Sea dike. The wind was from the southeast with a wind speed of 2.5–3.0 m s−1, which provided upwind measurements of CO2 and CH4 at the atmospheric station with respect to the flight. During the time of flight, the upwind measurements had a mean mole fraction of 2647 ppb with a standard deviation of 24 ppb for CH4, and 460.0 ppm with a standard deviation of 1.6 for CO2. The CH4 mole fractions were obtained from the 7 m inlet at the atmospheric tower, while the 60 m inlet provided the CO2 mole fractions due to the low sampling frequency of CO2 at 7 m. The mean altitude of the UAV during the flight was 10.4 m. The mean upwind mole fractions were subtracted from the mole fractions measured during the flight, providing the enhancement seen over the wetlands for each respective trace gas.
As seen in Fig. 12a and b, a clear hotspot for both CO2 and CH4 is seen towards the most northern part of the wetlands. The enhancement of CO2 was at its peak 4.3 ppm over the background upwind measurements, and 85 ppb for CH4, with a ratio ΔCH4 ∕ ΔCO2 of 19.8 ppb/ppm, which suggests that the emissions are from the local wetlands (Nara et al., 2014). The mean enhancement during the course of the flight was 1.2 ppm for CO2 and 22.5 ppb for CH4. The hotspot seen in Fig. 12a and b were measured as the UAV was close to the coast. As mentioned previously, the wind was from the southeast, further supporting that the measured hotspot originated in the wetlands.
3.6 Spatial resolution
The spatial resolution has four contributors, namely smear effects of the analyzer, molecular diffusion, Taylor dispersion, and an innate uncertainty in the GPS measurements. Each contribution is discussed below.
3.6.1 Analyzer smearing effects
The cell of the analyzer also plays a role in the effective spatial resolution, in that it applies an additional smearing effect during the analysis. The sample flow rate through the CRDS analyzer is kept at a constant flow rate of 21.5 sccm. The volume of the analyzer cavity is 35 cc but is maintained at 140 Torr (187 hPa) and 45 ∘C, which makes the effective cavity volume roughly 5.5 cc (at STP).
We use the response time (1∕e exchange) to calculate the contribution of the smearing effect to the total spatial resolution and have determined it to be 15.3 s of the flight time. Considering the smearing effect alone, the spatial resolution of the active AirCore measurements is determined to be 23.0 m with a mean ascent or descent speed of 1.5 m s−1, or 38.3 m with a mean speed of 2.5 m s−1.
3.6.2 GPS uncertainties
While the UAV is at a standstill, the uncertainty of the GPS is given as 0.5 m in the vertical direction and 2.5 m in the horizontal direction.
3.6.3 Diffusion and Taylor dispersion
Molecular diffusion and Taylor dispersion that affects the profiled sample can be expressed with an effective diffusion coefficient, assuming that the flow is laminar through the active AirCore during sampling and analysis (Karion et al., 2010). The effective diffusion is expressed as
where D is the molecular diffusivity of the different molecules in the gas (D is 0.16 cm2 s−1 for CO2 and 0.23 cm2 s−1 for CH4; Massman, 1998), a is the inner radius of the active AirCore tubing, and is the average velocity of the air inside the active AirCore. The distance of diffusion Xrms is then given as
where t represents the storage time from the moment the UAV lands and the analysis is complete. The factor 2 in front of the square root comes from diffusion in both directions. The effective resolution in the horizontal and vertical direction can then be expressed in terms of a fraction of distance traveled in space:
where Δddiff is the effective resolution due to diffusion and dispersion, f is the mass flow rate of the CRDS analyzer, A is the area of the tube, and v′ is the speed of the UAV. Due to the difference in molecular diffusion for CO2 and CH4, the spatial resolution differs between the GHGs. When the UAV is flying at an average speed of 1.5 m s−1, the uncertainties range from 7.6 to 15.2 m for CO2 depending on the storage time, while for CH4 the uncertainty ranges from 9.1 to 18.2 m depending on the storage time. Storage time ranges from 10 to 40 min.
3.6.4 Effective spatial resolution
The effective spatial resolution can be calculated as a product of all the mentioned uncertainties and is given by
Typical spatial resolutions for CO2 are ±40.3 to 46.0 m in the horizontal direction with a mean speed of 2.5 m s−1 and ±24.1 to 27.5 m in vertical direction with a mean speed of 1.5 m s−1, with the major contribution from the Picarro CRDS smearing effect. For CH4 the spatial resolutions with similar mean speeds are slightly lower, having ±41.2 to 48.9 m in the horizontal direction with a mean speed of 2.5 m s−1 and ±24.7 to 29.3 m in vertical direction with a mean speed of 1.5 m s−1.
In this paper, a UAV-based active AirCore was developed and was tested both in the laboratory and during flights.
The laboratory test results show that the mean differences between the measurements of roof air by the active AirCore and a co-located CRDS analyzer are 0.04 ± 0.21 ppm, 0.58 ± 0.67 ppb, and 0.86 ± 27.37 ppb for CO2, CH4, and CO, respectively. The direct comparison between the measurements of atmospheric air samples at 60 m from the active AirCore during flight and from the tower indicates a mean difference of 0.14 ± 0.36 ppm for CO2 and −5.6 ± 3.9 ppb for CH4.
We demonstrate that the buildup of the boundary layer was clearly observed with three consecutive vertical profile measurements in the early morning hours. A clear enhancement in both CO2 and CH4 was captured during a low-altitude horizontal transect flight and was determined to be caused by emissions from the wetlands north of the Wadden Sea dike.
The spatial resolution of the active AirCore samples is comprised of four factors: analyzer smearing effects; GPS uncertainties; and diffusion and Taylor dispersion, where the analyzer smear effect is the largest contributor. At typical speeds of 1.5 m s−1 for ascent and descent, and 2.5 m s−1 for horizontal flying, the effective spatial resolution is determined for CH4 to be 24.7 to 29.3 and 41.2 to 48.9 m, respectively, depending on the storage time. For CO2, the spatial resolution at the same speeds are 24.1 to 27.5 and 40.3 to 46.0 m, respectively, depending on the storage time. Due to the small amount of time between sampling and analysis (10–40 min), samples obtained using the active AirCore experience a low loss of sample resolution due to molecular diffusion. A modified CRDS analyzer with a reduced cavity pressure, e.g., 106 or 53 hPa, would greatly enhance the spatial resolution, since the response time of the CRDS analyzer would go down. Note that with a cavity pressure of 53 hPa the spatial resolution is determined mainly by molecular diffusion, instead of the smearing in the analyzer.
The design of the volume, the length of the active AirCore, and the chosen sampling flow rate provide up to 16 min of flight time. The range of the flights is largely determined by the performance of the UAV; however, the spatial resolution of the measurements is compromised by the speed of the flight.
The light weight of the active AirCore of 1.1 kg, its excellent preservation of the resolution of atmospheric air samples, and the mobility of a UAV lead to an effective sampling tool to measure greenhouse gases CO2 and CH4 mole fractions and a related tracer CO. This study shows the active AirCore's ability to capture both vertical and horizontal trace gas profiles. The usefulness of a UAV platform to quantify instantaneous CH4 fluxes from a landfill has been demonstrated by Allen et al. (2018). Our UAV-based active AirCore system opens up a wide variety of opportunities, including measurements of GHG on a local scale with high resolution; quantifying CH4 emissions from wetlands, landfills, and other CH4 hot spots; and the quantification of CO2 emissions from power plants.
The raw data sets and flight logs, along with the processed data sets for the Lutjewad flights and tower measurements on 13 September 2016, can be accessed at https://doi.org/10.5281/zenodo.1230383 (Andersen et al., 2018).
The authors declare that they have no conflict of interest.
This article is part of the special issue “The 10th International Carbon Dioxide Conference (ICDC10) and the 19th WMO/IAEA Meeting on Carbon Dioxide, other Greenhouse Gases and Related Measurement Techniques (GGMT-2017) (AMT/ACP/BG/CP/ESD inter-journal SI)”. It is a result of the 19th WMO/IAEA Meeting on Carbon Dioxide, Other Greenhouse Gases, and Related Measurement Techniques (GGMT-2017), Empa Dübendorf, Switzerland, 27–31 August 2017.
We would like to acknowledge Guido van der Werf for the loan of the VU CRDS
analyzer; Henk Been, Dipayan Paul, Bert Kers; and Joram Hooghiem for helping
to wind up the coils of the Active AirCore; and Marcel de Vries for creating
the data logger and the analysis box. Their help in the laboratory and with
preparation for the campaign has been invaluable. We would also like to
thank Toine Cornelissen and Vincent Lublink for providing the drone and for
piloting and executing the flights. This work is partially supported by ICOS
NL.
Edited by: Markus Leuenberger
Reviewed by: two anonymous referees
Allen, G., Hollingsworth, P., Kabbabe, K., Pitt, J. R., Mead, M. I., Illingsworth, S., Roberts, G., Bourn, M., Shallcross, D. E., and Percival, C. J.: The development and trial of an unmanned aerial system for the measurement of methane flux from landfill and greenhouse gas emission hotspots, Waste Management, https://doi.org/10.1016/j.wasman.2017.12.024, in press, 2018. a
Andersen, T., Chen, H., Peters, W., and Scheeren, B.: A UAV-based active AirCore system for measurements of greenhouse gases – Raw data (Version 1.0), Data set, Zenodo, https://doi.org/10.5281/zenodo.1230383, 2018. a
Berman, E. S. F., Fladeland, M., Liem, J., Kolyer, R., and Gupta, M.: Greenhouse gas analyzer for measurements of carbon dioxide, methane, and water vapor aboard an unmanned aerial vehicle, Sensor. Actuat. B Chem., 169, 128–135, https://doi.org/10.1016/j.snb.2012.04.036, 2012. a, b
Brownlow, R., Lowry, D., Thomas, R., Fisher, R., France, J., Cain, M., Richardson, T., Greatwood, C., Freer, J., Pyle, J., MacKenzie, A., and Nisbet, E.: Methane mole fraction and δ13C above and below the trade wind inversion at Ascension Island in air sampled by aerial robotics, Geophys. Res. Lett., 43, 11893–11902, https://doi.org/10.1002/2016GL071155, 2016. a
Chen, H., Winderlich, J., Gerbig, C., Hoefer, A., Rella, C. W., Crosson, E. R., Van Pelt, A. D., Steinbach, J., Kolle, O., Beck, V., Daube, B. C., Gottlieb, E. W., Chow, V. Y., Santoni, G. W., and Wofsy, S. C.: High-accuracy continuous airborne measurements of greenhouse gases (CO2 and CH4) using the cavity ring-down spectroscopy (CRDS) technique, Atmos. Meas. Tech., 3, 375–386, https://doi.org/10.5194/amt-3-375-2010, 2010. a
Chen, H., Karion, A., Rella, C. W., Winderlich, J., Gerbig, C., Filges, A., Newberger, T., Sweeney, C., and Tans, P. P.: Accurate measurements of carbon monoxide in humid air using the cavity ring-down spectroscopy (CRDS) technique, Atmos. Meas. Tech., 6, 1031–1040, https://doi.org/10.5194/amt-6-1031-2013, 2013. a
Chen, H., Kivi, R., Heikkinen, P., Kers, B., d. Vries, M., Hatakka, J., Laurila, T., Sweeney, C., and Tans, P.: High-latitude balloon observations of CO2/CH4/CO using AirCore: evaluation of Sodankylä TCCON retrievals, in preparation, 2018. a, b
Crosson, E. R.: A cavity ring-down analyzer for measuring atmospheric levels of methane, carbon dioxide, and water vapor, Appl. Phys. B, 92, 403–408, https://doi.org/10.1007/s00340-008-3135-y, 2008. a
Dlugokencky, E. J., Nisbet, E. G., Fisher, R., and Lowry, D.: Global atmospheric methane: budget, changes and dangers, Philo. T. R. Soc. A, 369, 2058–2072, https://doi.org/10.1098/rsta.2010.0341, 2011. a
Engel, A., Bönisch, H., Ullrich, M., Sitals, R., Membrive, O., Danis, F., and Crevoisier, C.: Mean age of stratospheric air derived from AirCore observations, Atmos. Chem. Phys., 17, 6825–6838, https://doi.org/10.5194/acp-17-6825-2017, 2017. a, b
Hartmann, D. L., Klein Tank, A. M. G., Rusticucci, M., Alexander, L. V., Brönnimann, S., Charabi, Y., Dentener, F. J., Dlugokencky, E. J., Easterling, D. R., Kaplan, A., Soden, B. J., Thorne, P. W., Wild, M., and Zhai, P. M.: Observations: Atmosphere and Surface, Climate Change 2013: The Physical Science Basis. Contribution of Working Group I to the Fifth Assessment Report of the Intergovernmental Panel on Climate Change, Cambridge University Press, Cambridge, UK and New York, NY, USA, 1st edn., 161–218, https://doi.org/10.7892/boris.41386, 2013. a, b
IPCC: Climate Change 2014: Impacts, Adaptation, and Vulnerability, Part A: Global and Sectoral Aspects, Contribution of Working Group II to the Fifth Assessment Report of the Intergovernmental Panel on Climate Change, Tech. Rep., Cambridge University Press, Cambridge, UK and New York, NY, USA, 2014a. a
IPCC: Climate Change 2014: Impacts, Adaptation, and Vulnerability, Part B: Regional Aspects, Contribution of Working Group II to the Fifth Assessment Report of the Intergovernmental Panel on Climate Change, Tech. Rep., Cambridge University Press, Cambridge, UK and New York, NY, USA, 2014b. a
Karion, A., Sweeney, C., Tans, P., and Newberger, T.: AirCore: An Innovative Atmospheric Sampling System, J. Atmos. Ocean. Tech., 27, 1839–1853, https://doi.org/10.1175/2010JTECHA1448.1, 2010. a, b, c, d
Khan, A., Schaefer, D., Tao, L., Miller, D. J., Sun, K., Zondlo, M. A., Harrison, W. A., Roscoe, B., and Lary, D. J.: Low Power Greenhouse Gas Sensors for Unmanned Aerial Vehicles, Remote Sens., 4, 1355–1368, https://doi.org/10.3390/rs4051355, 2012. a
Kirschke, S., Bousquet, P., Ciais, P., Saunois, M., Canadell, J. G., Dlugokencky, E. J., Bergamaschi, P., Bergmann, D., Blake, D. R., Bruhwiler, L., Cameron-smith, P., Castaldi, S., Chevallier, F., Feng, L., Fraser, A., Heimann, M., Hodson, E. L., Houweling, S., Josse, B., Fraser, P. J., Krummel, P. B., Lamarque, J.-F., Langenfelds, R. L., Quéré, C. L., Naik, V., O'doherty, S., Palmer, P. I., Pison, I., Plummer, D., Poulter, B., Prinn, R. G., Rigby, M., Ringeval, B., Santini, M., Schmidt, M., Shindell, D. T., Simpson, I. J., Spahni, R., Steele, P. L., Strode, S. A., Sudo, K., Szopa, S., Van Der Werf, G. R., Voulgarakis, A., Weele, M. V., Weiss, R. F., Williams, J. E., and Zeng, G.: Three decades of global methane sources and sinks, Nat. Geosci, 6, 813–823, https://doi.org/10.1038/ngeo1955, 2013. a
Kunz, M., Lavric, J. V., Gerbig, C., Tans, P., Neff, D., Hummelgård, C., Martin, H., Rödjegård, H., Wrenger, B., and Heimann, M.: COCAP: a carbon dioxide analyser for small unmanned aircraft systems, Atmos. Meas. Tech., 11, 1833–1849, https://doi.org/10.5194/amt-11-1833-2018, 2018. a
Lowry, D., Brownlow, R., Fisher, R., Nisbet, E., Lanoisellé, M., France, J., Thomas, R., Mackenzie, R., Richardson, T., Greatwood, C., Freer, J., Cain, M., Warwick, N., and Pyle, J.: Methane at Ascension Island, southern tropical Atlantic Ocean: continuous ground measurement and vertical profiling above the Trade Wind Inversion, EGU General Assembly Conference Abstracts, 12–17 April 2015, Vienna, Austria, 17, p. 7100, 2015. a
Massman, W. J.: A review of the molecular diffusivities of H2O, CO2, CH4, CO, O3, SO2, NH3, N2O, NO, and NO2 in air, O2 and N2 near STP, Atmos. Environ., 32, 1111–1127, https://doi.org/10.1016/S1352-2310(97)00391-9, 1998. a
Membrive, O., Crevoisier, C., Sweeney, C., Danis, F., Hertzog, A., Engel, A., Bönisch, H., and Picon, L.: AirCore-HR: a high-resolution column sampling to enhance the vertical description of CH4 and CO2, Atmos. Meas. Tech., 10, 2163–2181, https://doi.org/10.5194/amt-10-2163-2017, 2017. a, b
Nara, H., Tanimoto, H., Tohjima, Y., Mukai, H., Nojiri, Y., and Machida, T.: Emissions of methane from offshore oil and gas platforms in Southeast Asia, Sci. Rep., 4, 6503–6509, https://doi.org/10.1038/srep06503, 2014. a
Paul, D., Chen, H., Been, H. A., Kivi, R., and Meijer, H. A. J.: Radiocarbon analysis of stratospheric CO2 retrieved from AirCore sampling, Atmos. Meas. Tech., 9, 4997–5006, https://doi.org/10.5194/amt-9-4997-2016, 2016. a
Rella, C. W., Chen, H., Andrews, A. E., Filges, A., Gerbig, C., Hatakka, J., Karion, A., Miles, N. L., Richardson, S. J., Steinbacher, M., Sweeney, C., Wastine, B., and Zellweger, C.: High accuracy measurements of dry mole fractions of carbon dioxide and methane in humid air, Atmos. Meas. Tech., 6, 837–860, https://doi.org/10.5194/amt-6-837-2013, 2013. a, b
Saunois, M., Bousquet, P., Poulter, B., Peregon, A., Ciais, P., Canadell, J. G., Dlugokencky, E. J., Etiope, G., Bastviken, D., Houweling, S., Janssens-Maenhout, G., Tubiello, F. N., Castaldi, S., Jackson, R. B., Alexe, M., Arora, V. K., Beerling, D. J., Bergamaschi, P., Blake, D. R., Brailsford, G., Brovkin, V., Bruhwiler, L., Crevoisier, C., Crill, P., Covey, K., Curry, C., Frankenberg, C., Gedney, N., Höglund-Isaksson, L., Ishizawa, M., Ito, A., Joos, F., Kim, H.-S., Kleinen, T., Krummel, P., Lamarque, J.-F., Langenfelds, R., Locatelli, R., Machida, T., Maksyutov, S., McDonald, K. C., Marshall, J., Melton, J. R., Morino, I., Naik, V., O'Doherty, S., Parmentier, F.-J. W., Patra, P. K., Peng, C., Peng, S., Peters, G. P., Pison, I., Prigent, C., Prinn, R., Ramonet, M., Riley, W. J., Saito, M., Santini, M., Schroeder, R., Simpson, I. J., Spahni, R., Steele, P., Takizawa, A., Thornton, B. F., Tian, H., Tohjima, Y., Viovy, N., Voulgarakis, A., van Weele, M., van der Werf, G. R., Weiss, R., Wiedinmyer, C., Wilton, D. J., Wiltshire, A., Worthy, D., Wunch, D., Xu, X., Yoshida, Y., Zhang, B., Zhang, Z., and Zhu, Q.: The global methane budget 2000–2012, Earth Syst. Sci. Data, 8, 697–751, https://doi.org/10.5194/essd-8-697-2016, 2016. a, b
Stull, R. B.: Introduction to Boundary Layer Meteorology, Springer, Dordrecht, the Netherlands, 1st edn., https://doi.org/10.1007/978-94-009-3027-8, 1988. a
Tans, P. P.: System and method for providing vertical profile measurements of atmospheric gases, US Patent Office, Washington, D.C., USA, 2009. a
Tans, P. P. and Keeling, R.: Trends in Atmospheric Carbon Dioxide, National Oceanic and Atmospheric Administration, Earth System Research Laboratory, Global Monitoring Division, available at: http://www.esrl.noaa.gov/gmd/ccgg/trends/, last access: April 2017. a
Turnbull, J. C., Keller, E. D., Baisden, T., Brailsford, G., Bromley, T., Norris, M., and Zondervan, A.: Atmospheric measurement of point source fossil CO2 emissions, Atmos. Chem. Phys., 14, 5001–5014, https://doi.org/10.5194/acp-14-5001-2014, 2014. a
van der Laan, S., Neubert, R. E. M., and Meijer, H. A. J.: A single gas chromatograph for accurate atmospheric mixing ratio measurements of CO2, CH4, N2O, SF6 and CO, Atmos. Meas. Tech., 2, 549–559, https://doi.org/10.5194/amt-2-549-2009, 2009. a
Watai, T., Machida, T., Ishizaki, N., and Inoue, G.: A Lightweight Observation System for Atmospheric Carbon Dioxide Concentration Using a Small Unmanned Aerial Vehicle, J. Atmos. Ocean. Tech., 23, 700–710, https://doi.org/10.1175/JTECH1866.1, 2006. a


