the Creative Commons Attribution 4.0 License.
the Creative Commons Attribution 4.0 License.
 | 11 Jun 2018
Sensitivity study of the instrumental temperature corrections on Brewer total ozone column measurements
Alberto Berjón
Meelis-Mait Sildoja
Saulius Nevas
Keith Wilson
Sergio F. León-Luis
Omar el Gawhary
Ilias Fountoulakis
The instrumental temperature corrections to be applied to the ozone measurements by the Brewer spectrophotometers are derived from the irradiance measurements of internal halogen lamps in the instruments. These characterizations of the Brewer spectrophotometers can be carried out within a thermal chamber, varying the temperature from −5 to +45 ∘C, or during field measurements, making use of the natural change in ambient temperature. However, the internal light source used to determine the thermal sensitivity of the instrument could be affected in both methods by the temperature variations as well, which may affect the determination of the temperature coefficients. In order to validate the standard procedures for determining Brewer's temperature coefficients, two independent experiments using both external light sources and the internal halogen lamps have been performed within the ATMOZ Project. The results clearly show that the traditional methodology based on the internal halogen lamps is not sensitive to the temperature-caused changes in the spectrum of the internal light source. The three methodologies yielded equivalents results, with differences in total ozone column below 0.08 % for a mean diurnal temperature variation of 10 ∘C.
- Article
(4614 KB) - Full-text XML
- BibTeX
- EndNote


The Brewer spectrophotometer has been used for decades as a reference instrument to retrieve total ozone column (TOC) and for the validation of satellite-based measurements. TOC is retrieved from direct sun measurements at four wavelengths in the ultraviolet (UV) spectral range, from 310.1 to 320.1 nm. To be able to make such measurements, this instrument should be suitable for outdoor use. Moreover, it should operate at any temperature, since it is installed in a wide range of environments, from subtropical deserts to polar zones. Changes in the ambient temperature may affect the Brewer instrument in two different ways: change its spectral responsivity and cause a wavelength shift.
Preventing errors in the wavelength selection is of highest importance for the ozone determination. Therefore, different strategies had been already implemented to minimize this problem and the impact of temperature on the spectral shift is expected to be minimal. The spectrophotometer contains a temperature-compensated monochromator that allows accurate measurements in the UV range (McElroy, 2014). Materials used in the monochromator are selected to minimize the effect of the internal temperature changes on the spectrum position relative to the exit slits. Nevertheless, mechanical tolerances in the manufacturing may cause imperfections in this temperature compensation. Thus, the Brewer operational procedure recommends to perform an internal Hg-lamp test (HG test) when the internal temperature, which is registered for each ozone measurement by a sensor located near the photomultiplier tube (PMT), varies more than 3 ∘C (Environment Canada, 2008). The HG test uses a mercury discharge lamp (line 302.15 or 296.73 nm) to check the stability of the wavelength calibration during Brewer instrument operations. During the test, the diffraction grating is positioned such that the operating wavelengths are dispersed onto the appropriate exit slits (Kipp & Zonen, 2008). Finally, wavelengths used to determine the TOC were selected at stationary points in the solar spectrum in order to minimize the effect of any residual spectrum shift (Brewer, 1973).
The Brewer spectrophotometer quality assurance protocol includes the thermal characterization of the instrument. This characterization is initially carried out inside a thermal chamber at Kipp & Zonen (K&Z hereafter), manufacturer of the Brewer spectrophotometer, by measuring the output of an internal halogen lamp while varying the temperature of the chamber from −5 to +45 ∘C during a period of 72 h. Temperature coefficients are determined during this characterization at all Brewer operating wavelengths using a linear approximation.
If an appreciable temperature dependence in the retrieved ozone is detected during the calibration campaigns, the temperature coefficients are adjusted using the in-field data of the internal halogen lamp measurements along the diurnal temperature variation (Redondas and Rodríguez-Franco, 2015). A drawback of this method is the narrower temperature range that is available for the field measurements compared with the thermal chamber method. However, the natural ambient temperature variation applies to the instrument during its normal operation mode, which generally yields acceptable temperature coefficients.
The determination of the thermal sensitivity of the instrument by means of the internal halogen lamp, used in both described procedures, implies that the internal lamp itself and the power supply circuit are also subjected to temperature changes and that they can also exhibit some temperature sensitivity. This can potentially modify the lamp irradiance or its alignment, hampering the determination of the temperature coefficients. In addition, there are different elements involved in the direct sun measurements but not in the measurement of the internal halogen lamp, such as the quartz window and the neutral density filters, which can make the results of the characterization to be ineffective when applied to the operational measurements.
While the temperature effect on the global UV irradiance measurements by the Brewer spectrometer has been studied by different authors (Fountoulakis et al., 2017; Siani et al., 2003; Weatherhead et al., 2001), so far no validation of the temperature sensitivity of the TOC retrieved from the Brewer measurements has been reported. On this basis, a validation of the standard procedures used for the retrieval of the temperature coefficients was included as one of the objectives within the European Metrology Research Programme (EMRP) project “Traceability for atmospheric total column ozone” (ATMOZ).
In this work, we report on a comparative study of the temperature coefficients retrieved by the standard procedures (using internal halogen lamps in a thermal chamber and during field measurements) and by using two alternatives setups employing external lamps for thermal chamber measurements. For this purpose, we have made measurements with MkIII Brewer spectrophotometers (serial numbers 185 and 233) at PTB (Physikalisch-Technische Bundesanstalt) in Braunschweig, Germany, and Kipp & Zonen in Delft, Netherlands, respectively. For comparison purpose, field data from the EUBREWNET (COST Action ES1207) database are also used (Rimmer et al., 2018).
In order to understand how the temperature correction is applied to the measurement data by the Brewer spectrophotometers, in this section we review the basic measurement principles that are used to obtain the TOC from this instrument. A comprehensive description of the Brewer instrument and the TOC calculation from the results of the measurements can be found in Kerr et al. (1985).
TOC is the main product derived from direct solar irradiance measurements by the Brewer spectrophotometers. The direct irradiance measurement is performed by pointing the direct entrance port normally to the sun based on an azimuth tracker and a rotating quartz prism which follows the sun's elevation. These measurements are made through a quartz window covering the direct irradiance port. To select the different wavelengths used in the TOC derivation, the Brewer spectrophotometer maintains a fixed position of the diffraction grating and uses a rotating slit mask to select successively each wavelength. The rapid movement of the slit mask assures that all wavelengths are measured almost simultaneously. TOC, in Dobson units (DU) or milli-atm-cm, is obtained from Eq. (1) (following manufacturer's nomenclature):
where R6 is usually defined on the basis of double ratios of measured intensities, Ic(λi), at certain wavelengths (Kipp & Zonen, 2008), but it can be also written as the linear combination of the common logarithm of the intensity:
The coefficients, ωi, take values of −1.0, 0.5, 2.2 and −1.7 for the wavelength of 310.1, 313.5, 316.8 and 320.1 nm, respectively. These wavelengths correspond to slits 2 to 5 in the rotating slit mask of the monochromator. Ic(λi) are obtained from the Brewer raw signal counts after dark count, dead time, temperature and filter transmittance corrections. The wavelengths, λi, used in Eqs. (2) and (3) have been specially selected to minimize effects of any small shift in the wavelength (Fioletov et al., 2005). Moreover, coefficients ωi have been determined to suppress any influence of the aerosol and the SO2 on the ozone retrieval (Dobson, 1957; Kerr et al., 1981). In general, any linear effects with wavelength are also suppressed, as λi and ωi satisfy the conditions defined by Eqs. (4) and (5).
ETC is a linear combination (Eq. 6) of the extraterrestrial constants of the instrument, Fext(λi), which can be obtained from a comparison with a calibrated instrument or from the Langley plot method (Redondas, 2007).
B is a linear combination of the Rayleigh transmittances of the air, β(λi), corrected by the Rayleigh air mass, ν, and the ratio of the pressure at the observation position, p, and the standard pressure at sea level, p0.
A is a linear combination of the ozone absorption coefficients, α(λi).
Both the Rayleigh air mass, ν, and the ozone air mass, μ, are calculated assuming an effective altitude of 5 and 22 km, respectively (Bernhard et al., 2005).
R6 is derived from the intensity ratios or equivalently from Eq. (2) and, therefore, it has no units, just like ETC and B.
Most photodetectors have some sensitivity to temperature. If the sensitivity can be linearly approximated, the intensity I (c s−1) of a stable light source measured by the detector at different temperatures T (∘C) can be expressed as
where T0 is the reference temperature, Ic is the intensity of the source measured at the reference temperature, and τ0 is the variation rate of the intensity with the temperature (). We can rewrite this expression as
where is the temperature coefficient in units of ∘C−1. This last expression has an advantage that, while τ0 depends on the intensity of the light source, τ is independent and we can use it to determine the intensity of the source at the reference temperature. This process is generally referred to as temperature correction.
The temperature coefficient is usually determined in a laboratory measuring a stable light source while the detector temperature is varied. τ is calculated from the linear regression between measured intensity and the temperature. From the previous equation and applying the natural logarithm, we can write
For Brewer spectrophotometers ∘C−1, then , and we can approximate the natural logarithm ln(1+x) to the first-order term of its Taylor expansion:
In the Brewer data processing, this expression is multiplied by 104, the natural logarithm is replaced by common logarithm and T0 is set to 0 ∘C.
where τb=104log(e)τ is the Brewer temperature coefficient. Using Eq. (3) we can rewrite this expression as
We can define a Brewer relative temperature coefficient, , by subtracting the reference coefficient from coefficients derived for other spectral channels. Usually the reference coefficient is the one corresponding to the wavelength λ0= 303.2 nm. In terms of the Brewer temperature coefficient we can express the relative coefficient as
Since the weights used in the common Brewer algorithm to calculate ozone are chosen to satisfy the Eq. (4), we can rewrite the Eq. (2) as
Equation (16) shows that we can use interchangeably τb(λi) or to calculate R6 and, therefore, TOC.
The relative temperature coefficients, , can be calculated from Eq. (15), but they can also be experimentally retrieved by the linear regression between the ratio of intensities, expressed as F(λi)−F(λ0), and the temperature:
The relative coefficients have the advantage that they can be reliably derived even if the illumination condition is not stable. The only requirement for the determination of the relative coefficients is that the change of the light source is proportional at all wavelengths.
Furthermore, from the previous equations we can see that the temperature effect over R6 can be reduced to the linear combination of the temperature coefficients, .
where τb(λi) can refer indistinctly to the Brewer temperature coefficients or to the relative temperature coefficients. is expected to be more robust to changes in the light source than the relative coefficients . Since wi satisfy the Eq. (5), can be correctly determined not only if the change of the light source is proportional at all wavelengths, but also if the change is linear with the wavelength.
In order to determine the most suitable temperature range for the experiments, a statistical analysis of the Brewer operating temperatures using the EUBREWNET database was performed. The standard operating ambient temperature range provided by the manufacturer of the Brewer spectrophotometer is from 0 to +40 ∘C. These range limits are related to the operating temperature range of the PMT, which is from 0 to +50 ∘C. As the heat dissipated by the internal electronics increases the temperature in the instrument by about 5 ∘C, the operating temperature range of the Brewer has a safety margin of 5 ∘C.
In the case that the ambient temperature drops below 0 ∘C, the equipment should be operated using an internal heater that allows us to extend the operating ambient temperature range down to −20 ∘C. In practice, the internal heater is activated when instrument temperature drops below 10 or 20 ∘C depending of the instrument configuration. Additionally, a cold-weather cover is furnished by the manufacturer for extreme weather conditions, which allows operating the instrument at ambient temperatures as low as −50 ∘C.
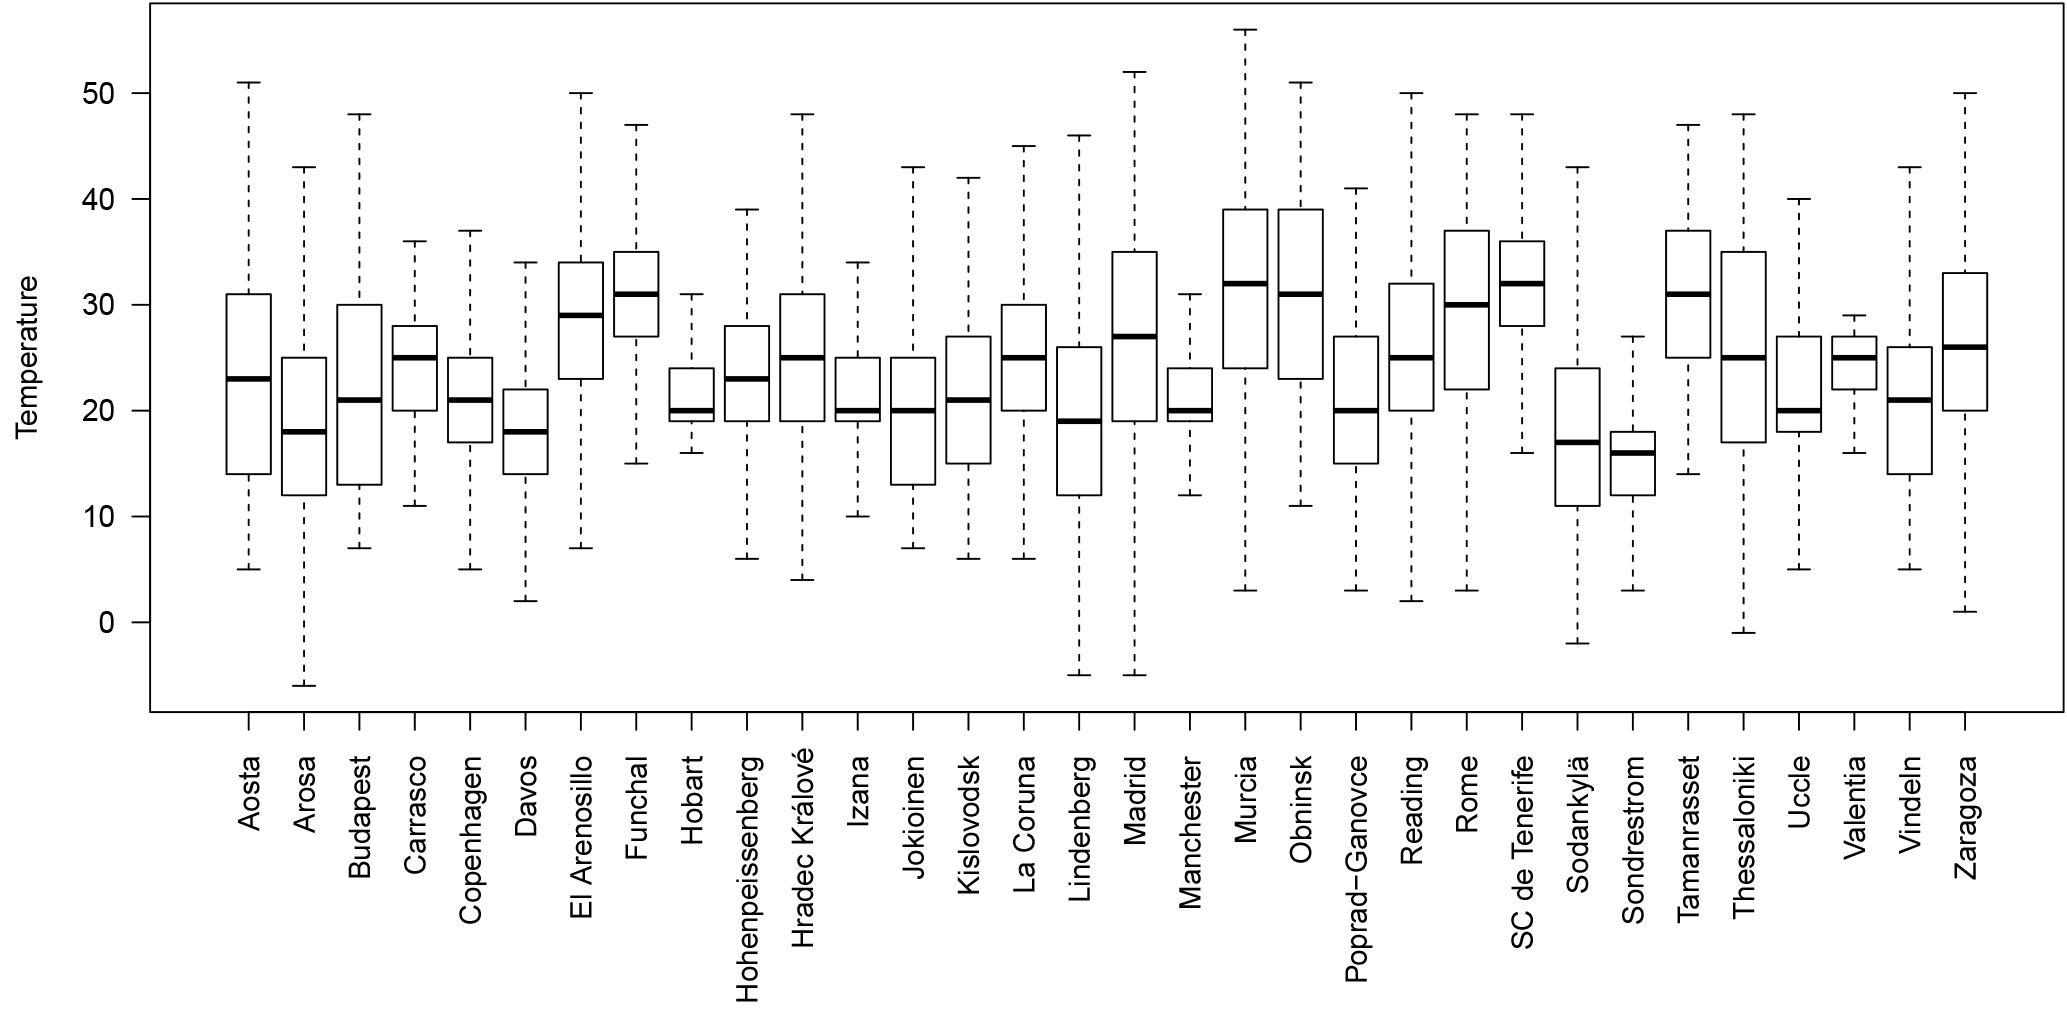
Figure 1Statistics of each of the 32 stations used for the analysis of the operational instrumental temperatures. Median temperatures are represented by lines within boxes determined by the first and third quartiles. Whiskers represent Tukey's limits. The first and third quartiles are always above 11 and below 39 ∘C respectively.
From the EUBREWNET database (http://rbcce.aemet.es/eubrewnet, last access: 1 June 2018) we have studied the Brewer spectrophotometer internal temperatures at which the ozone measurements have been made in 32 measurement stations worldwide from 1996 to 2017. For this analysis, 4.2 million recorded temperatures were used. The stations involved in the study are mainly in Europe, but there are also data from Greenland, Australia, Uruguay and Algeria. They are, therefore, very representative samples of the different environmental conditions under which the Brewer spectrophotometers are measuring throughout the world. Figure 1 shows a box plot for all the stations. The median temperature values for all the stations are between 16 and 32 ∘C, while the first and third quartiles are always above 11 and below 39 ∘C, respectively. The mean diurnal temperature variation is 12 ∘C. Figure 2 shows a histogram with data from all stations together. Considering all the data, the mean temperature value is 23.0 ∘C and a median value is 22 ∘C, with a standard deviation of 16.6 ∘C. The 1 and 99 percentiles are estimated to correspond to 5 and 44 ∘C. Only a small number of measurements (0.04 %) are outside the safety limits for the PMT that we discussed earlier (0, 50 ∘C).
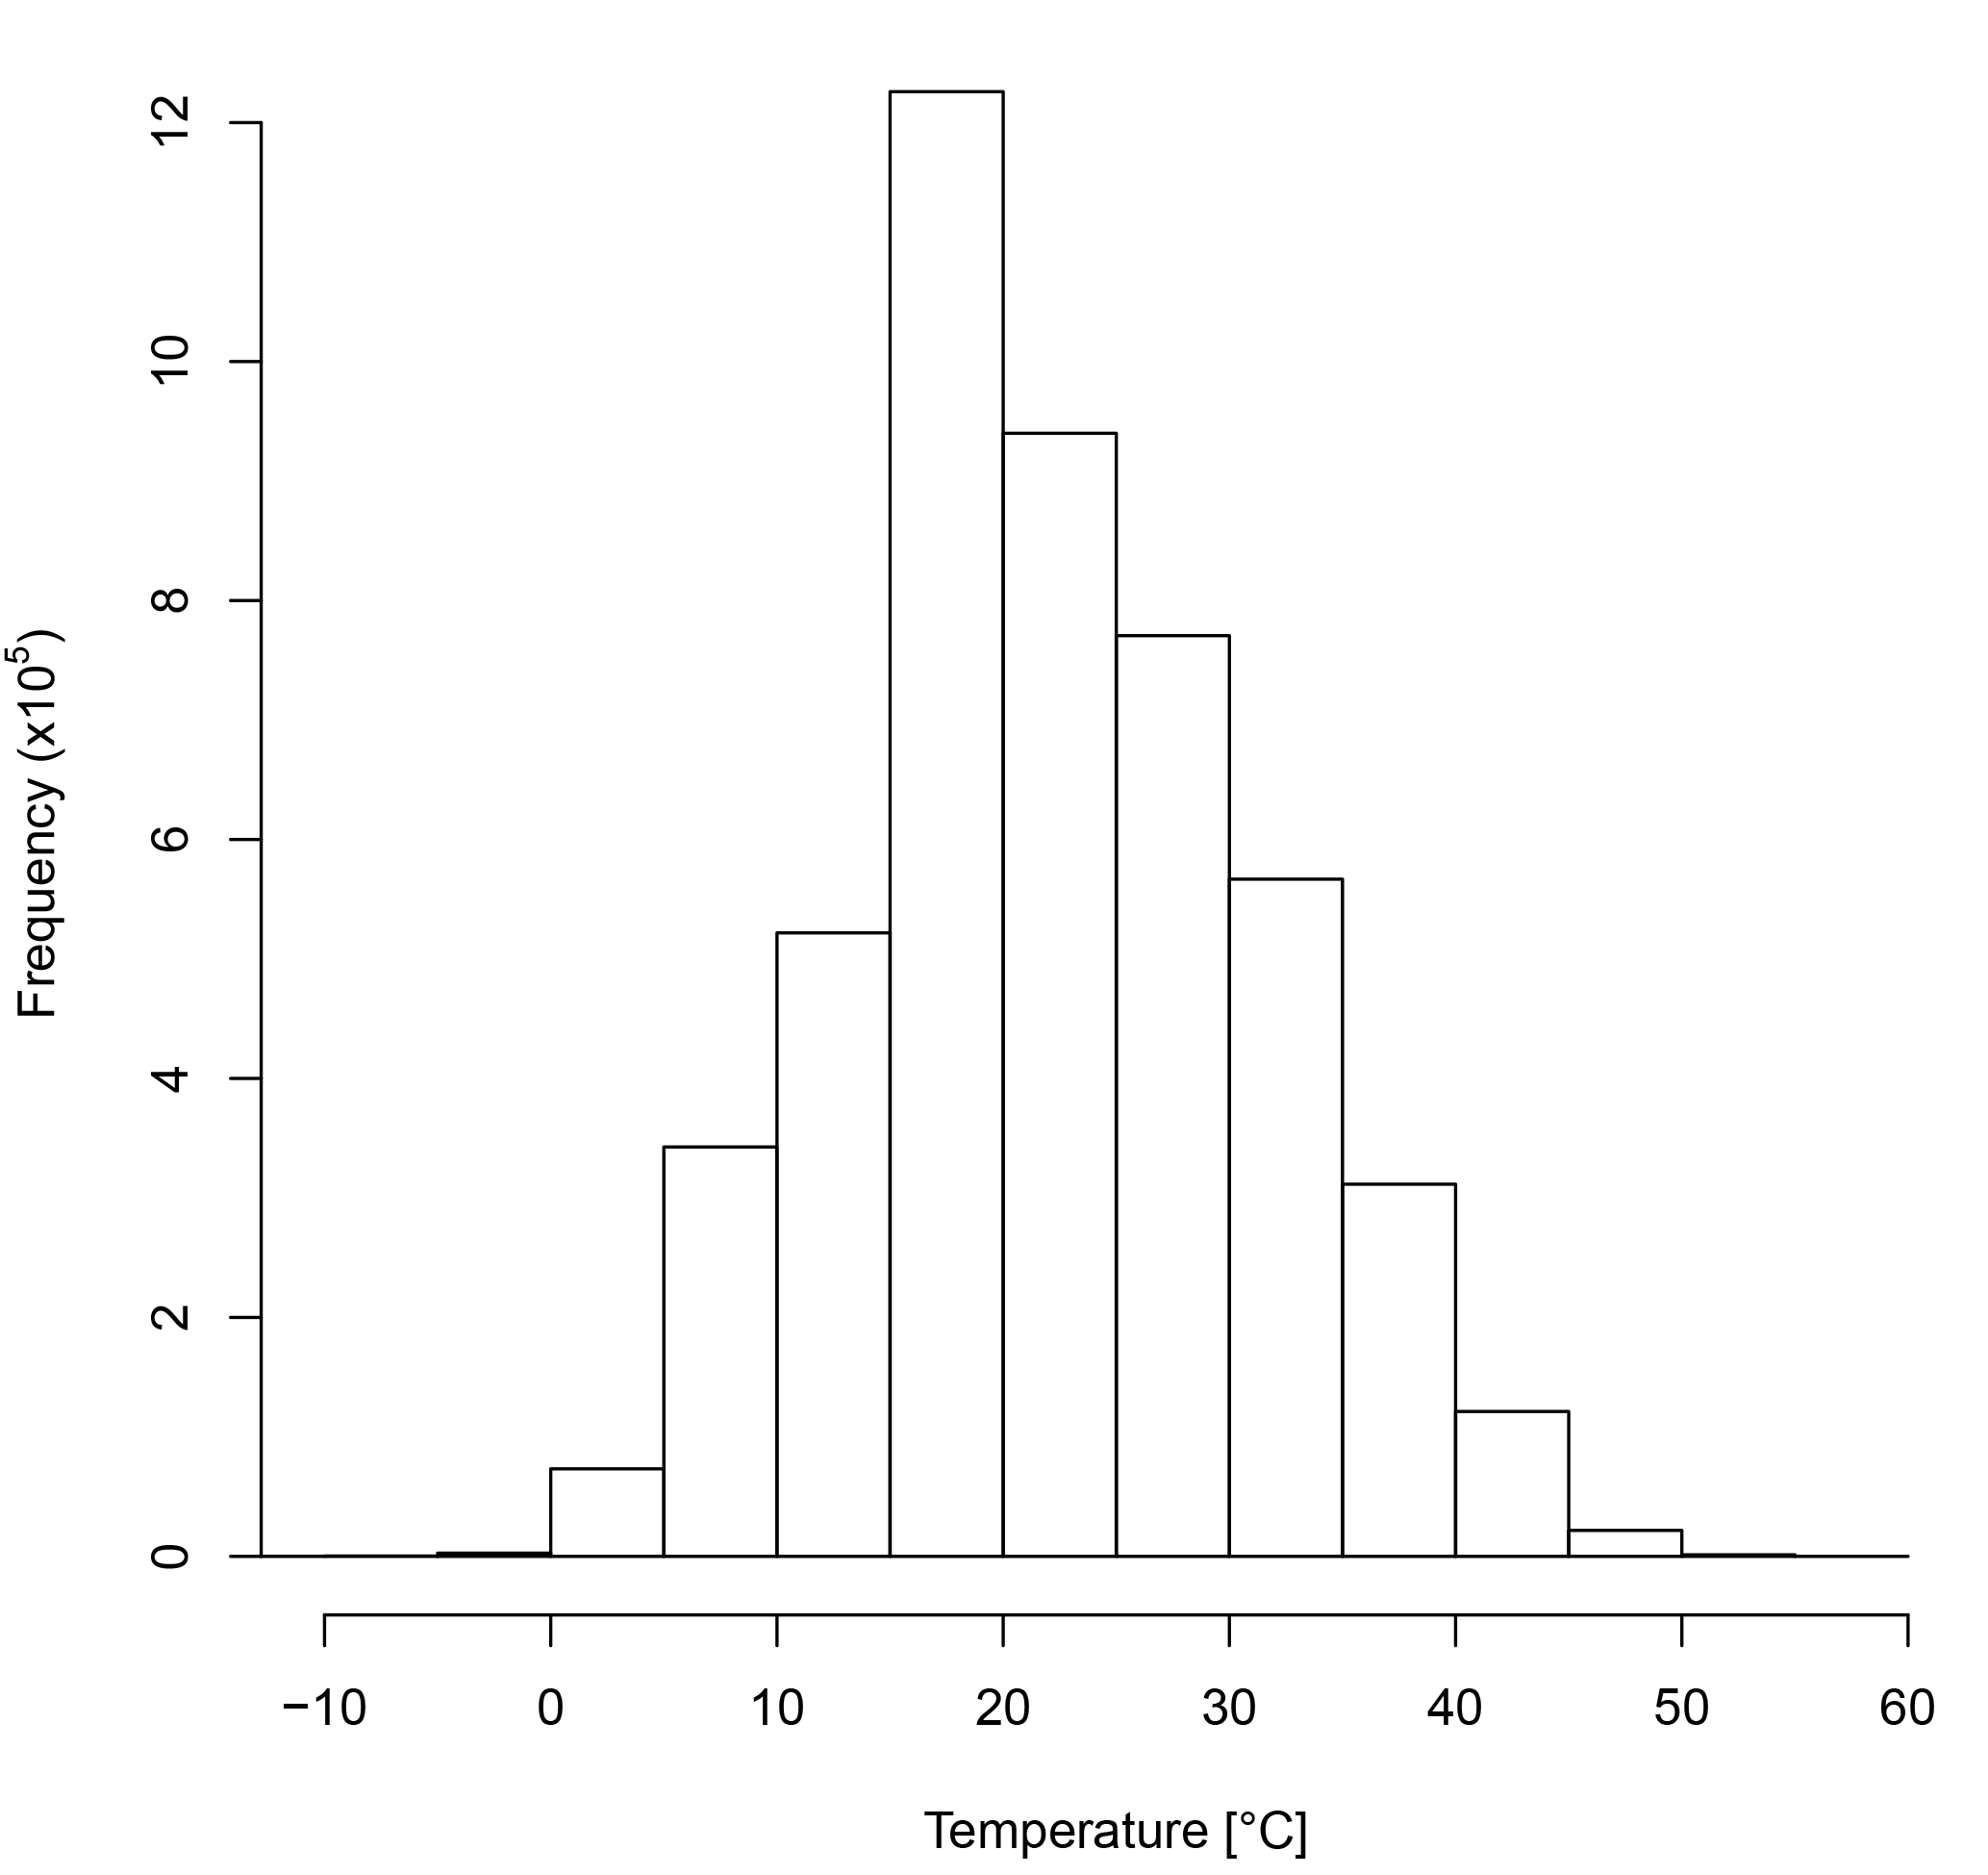
Figure 2Frequency distribution of instrument temperatures from EUBREWNET database: 4.2 million temperature data points have been used. Only a 0.04 % of measurements are outside the recommended limits (0 and 50 ∘C).
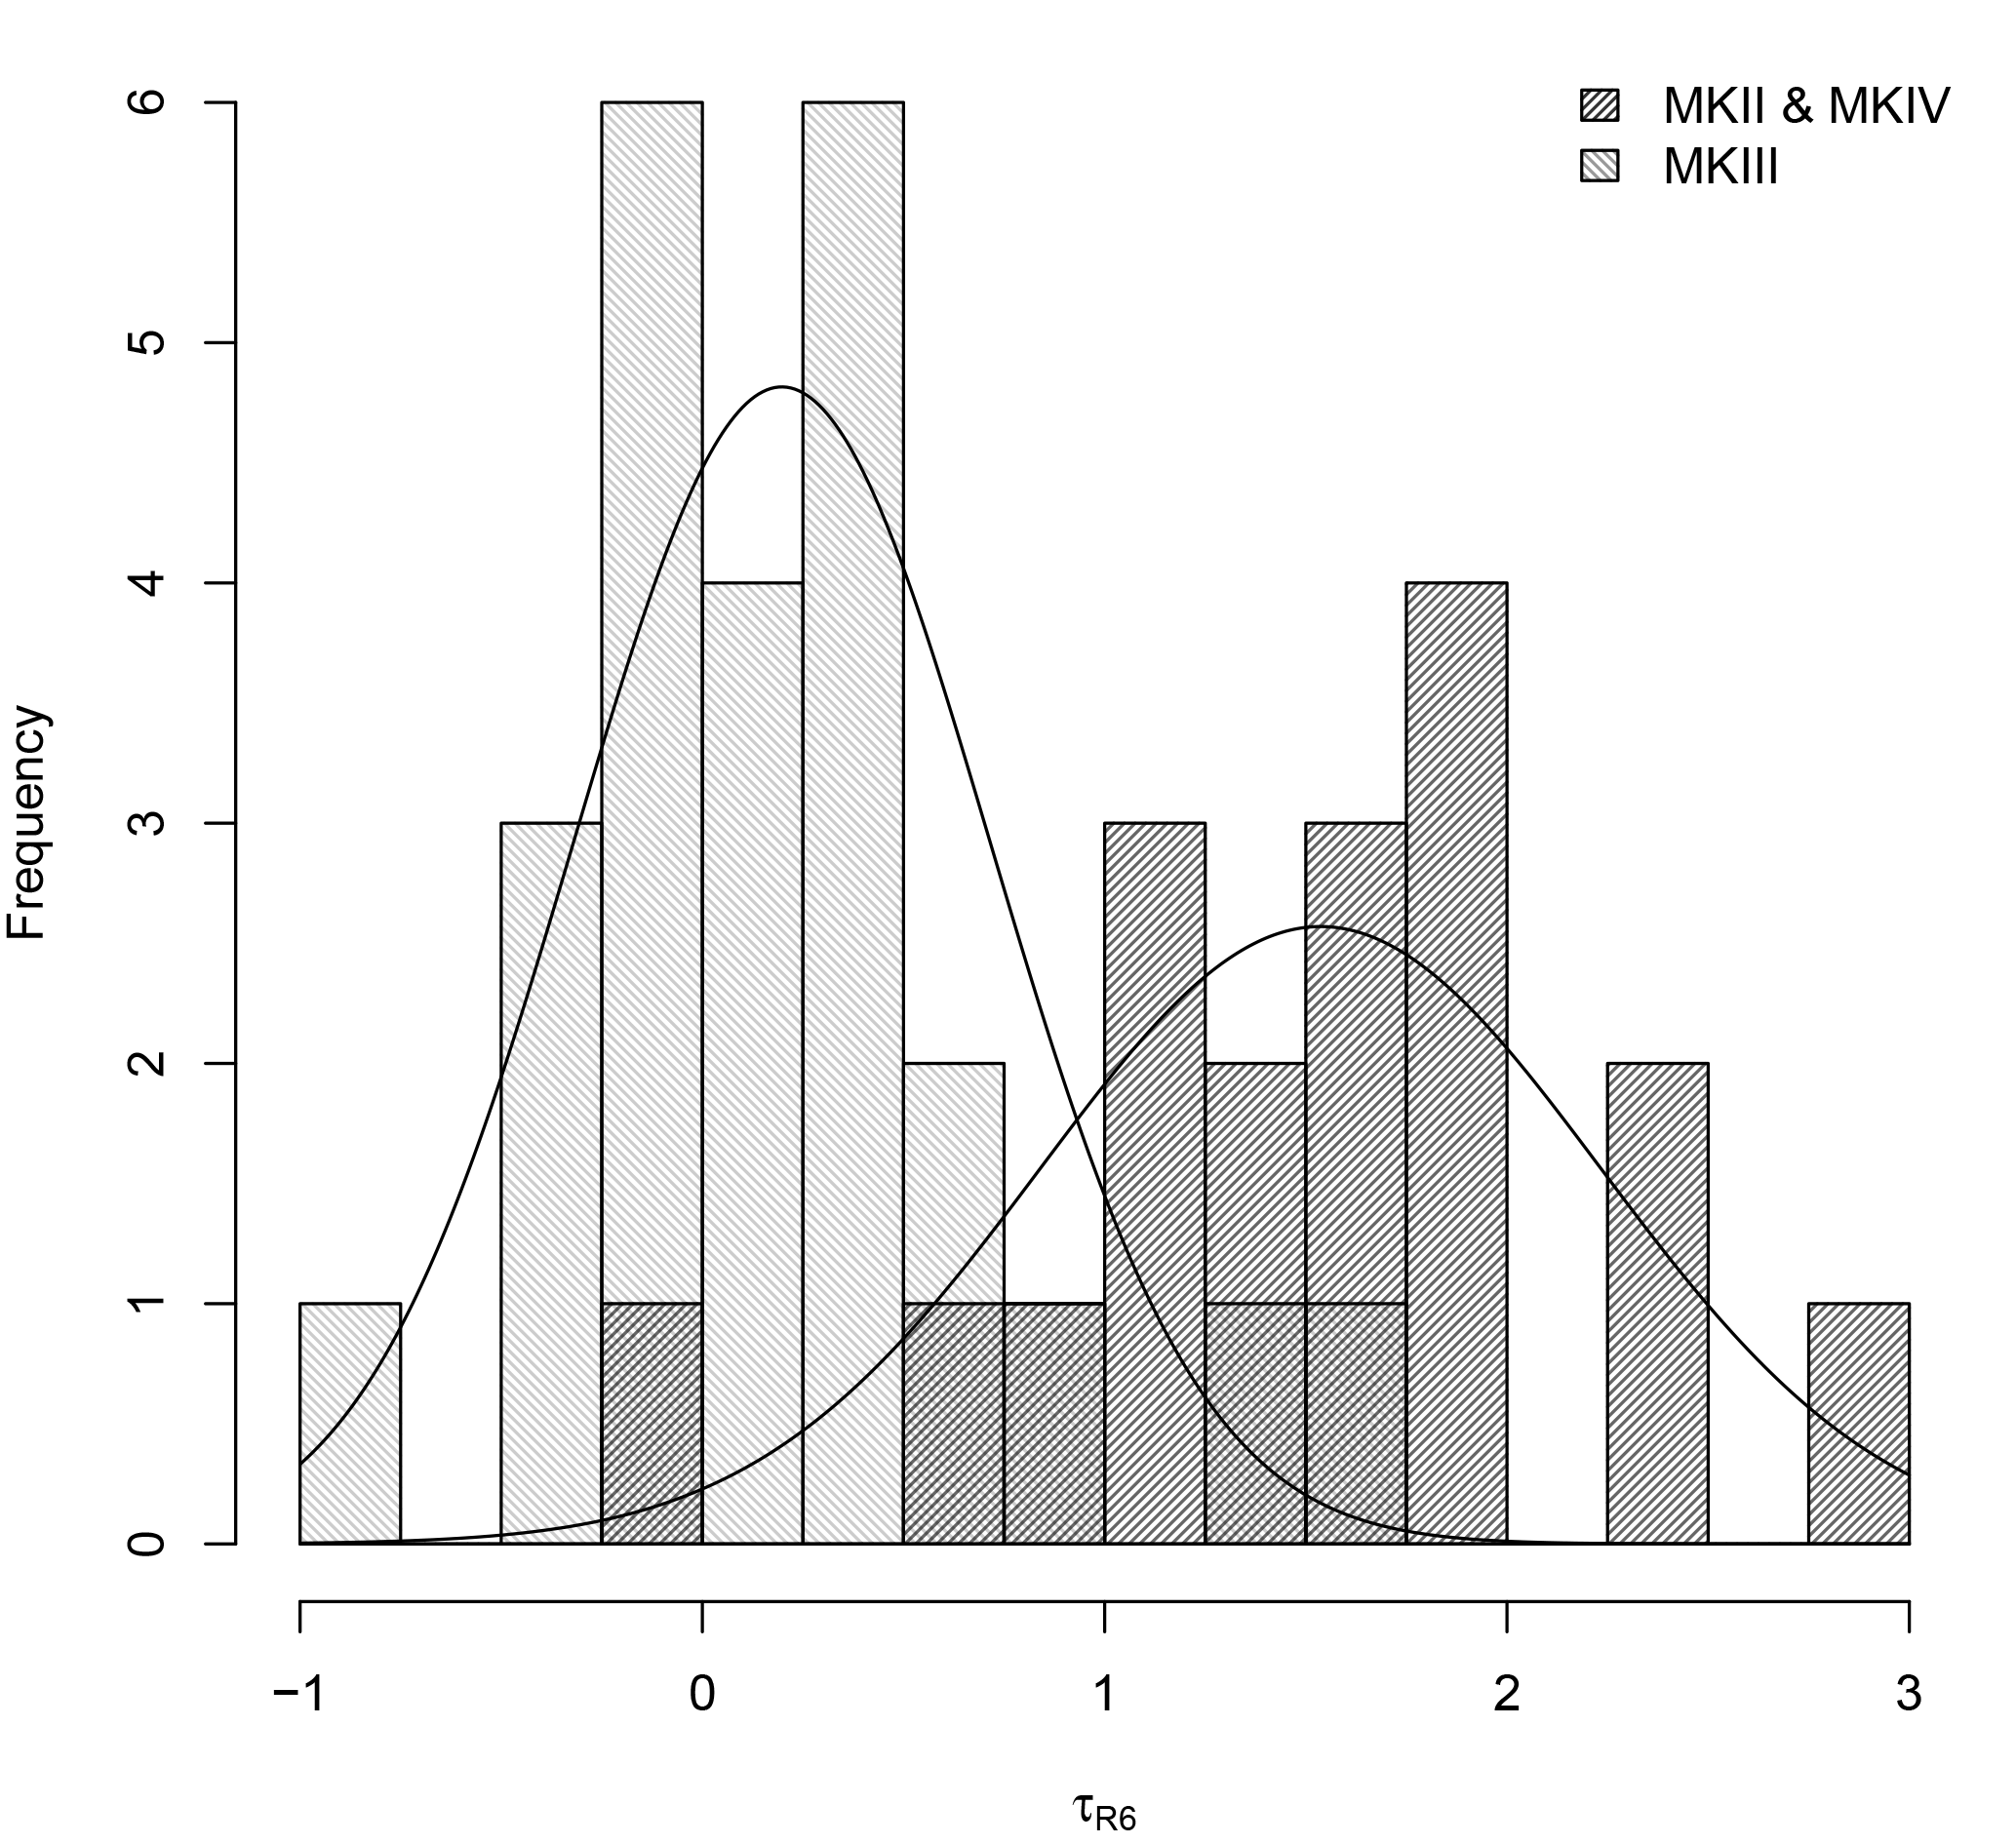
We have also analyzed the thermal sensitivity, , of 44 Brewer spectrophotometers included in the EUBREWNET database (Fig. 3). These values range from −0.9 to 4.0 ∘C−1. Two different distributions appear to be clearly related to the different Brewer models. MkIII model has a mean value of 0.20 ∘C−1 and a standard deviation of 0.52 ∘C−1. In the case of MkII and MkIV, the mean value rises to 1.54 ∘C−1 and the standard deviation is 0.70 ∘C−1. While Brewer MkIII has a double monochromator to assure a low stray light influence in UV, MkII and MkIV have a single monochromator, so that they use a NiSO4/UG11 filter in front of the PMT to eliminate the effect of visible light on the measurements, i.e., to reduce the stray light in the UV range. The higher temperature dependence observed in the single-monochromator Brewer is commonly attributed to this NiSO4/UG11 filter (Cappellani and Kochler, 2000; Fountoulakis et al., 2017).
To study the temperature sensitivity of the Brewer spectrophotometers by using external lamps, two different experimental setups have been used: a first one at PTB in Braunschweig, Germany, and a second one at K&Z in Delft, Netherlands (both shown in Fig. 4). For these studies, two MkIII Brewer spectrophotometers (nos. 185 and 233) were chosen. These instruments are the traveling master instrument of the Regional Brewer Calibration Center for Europe (RBCC-E) triad at the Izaña observatory of the Spanish National Meteorological Agency (AEMET) and a research instrument of K&Z, respectively.
During the experiments the internal heater was turned off, but the air circulation fan was left on to evenly distribute the air inside the Brewer instrument, allowing a uniform heating up and cooling down of the internal components.
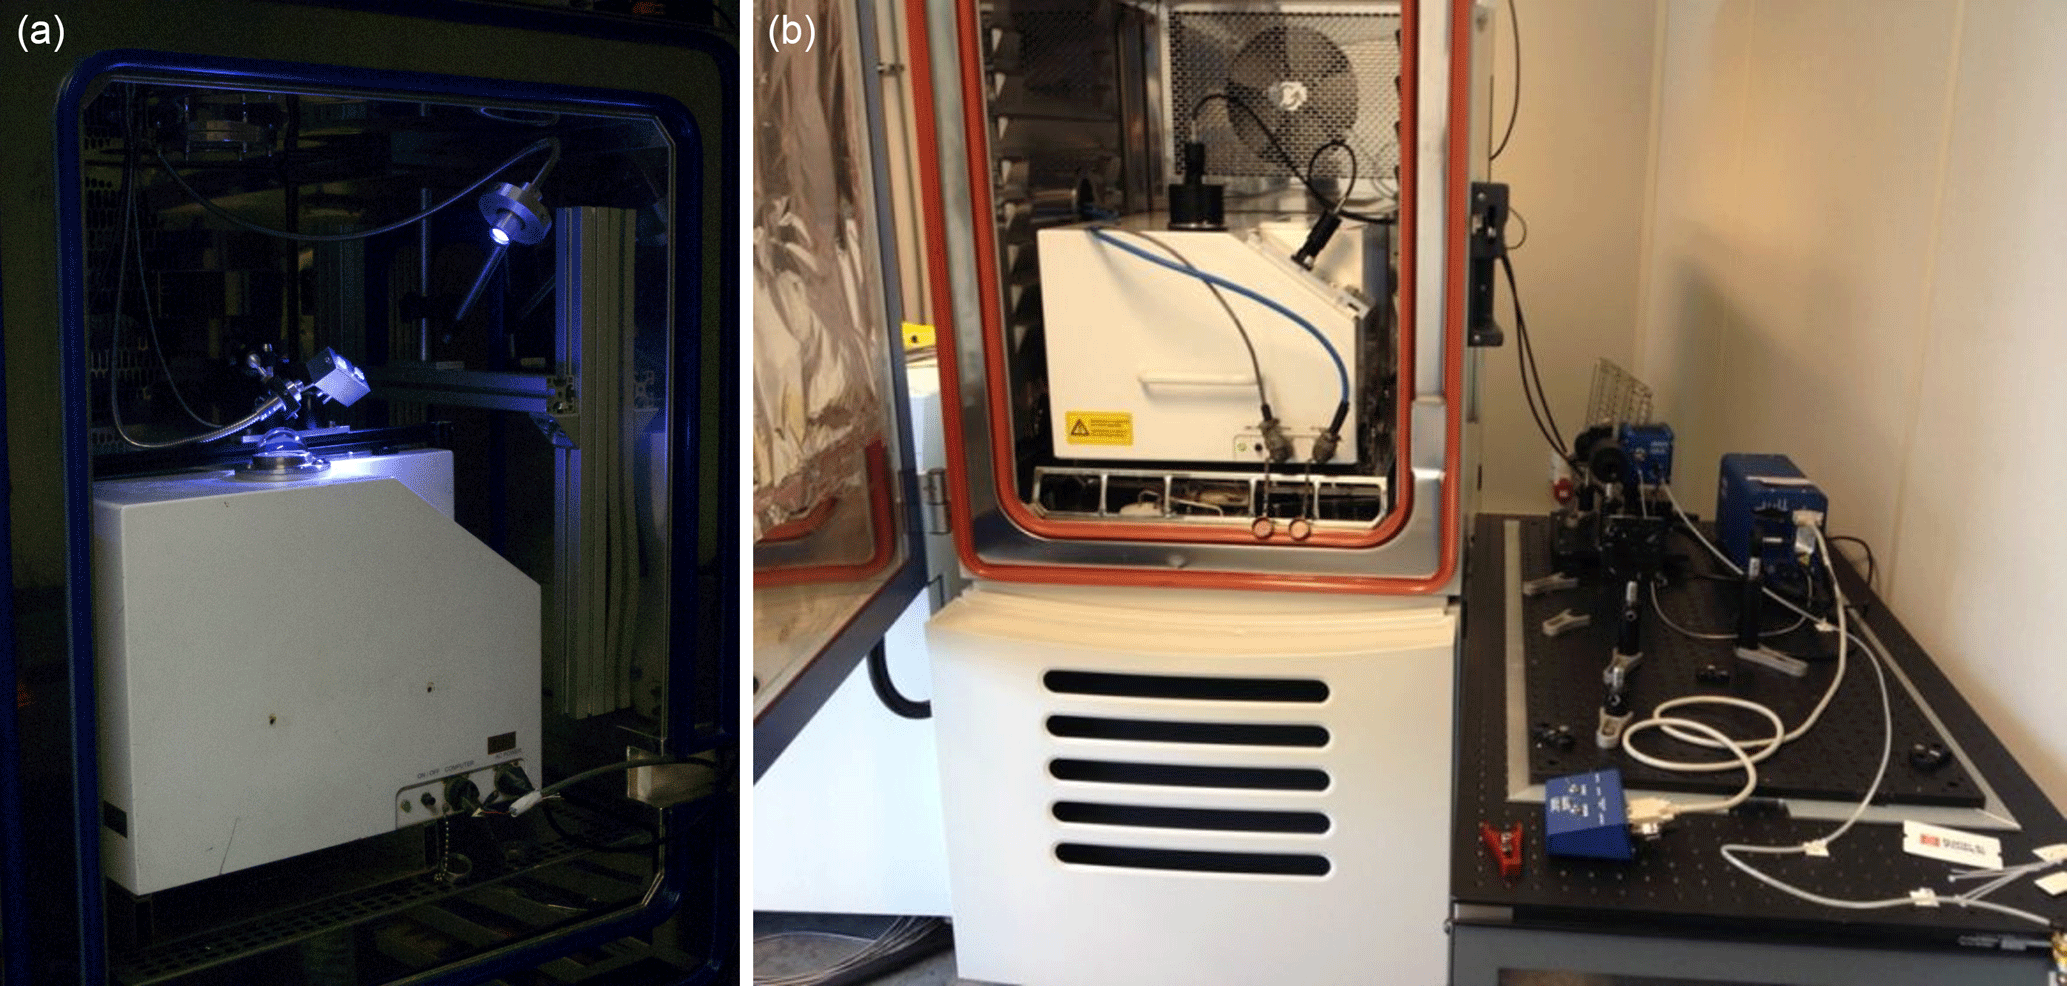
Figure 4Pictures showing Brewer instruments in the controlled environment chambers for the measurements at the PTB (a) and at the Kipp & Zonen facilities (b).
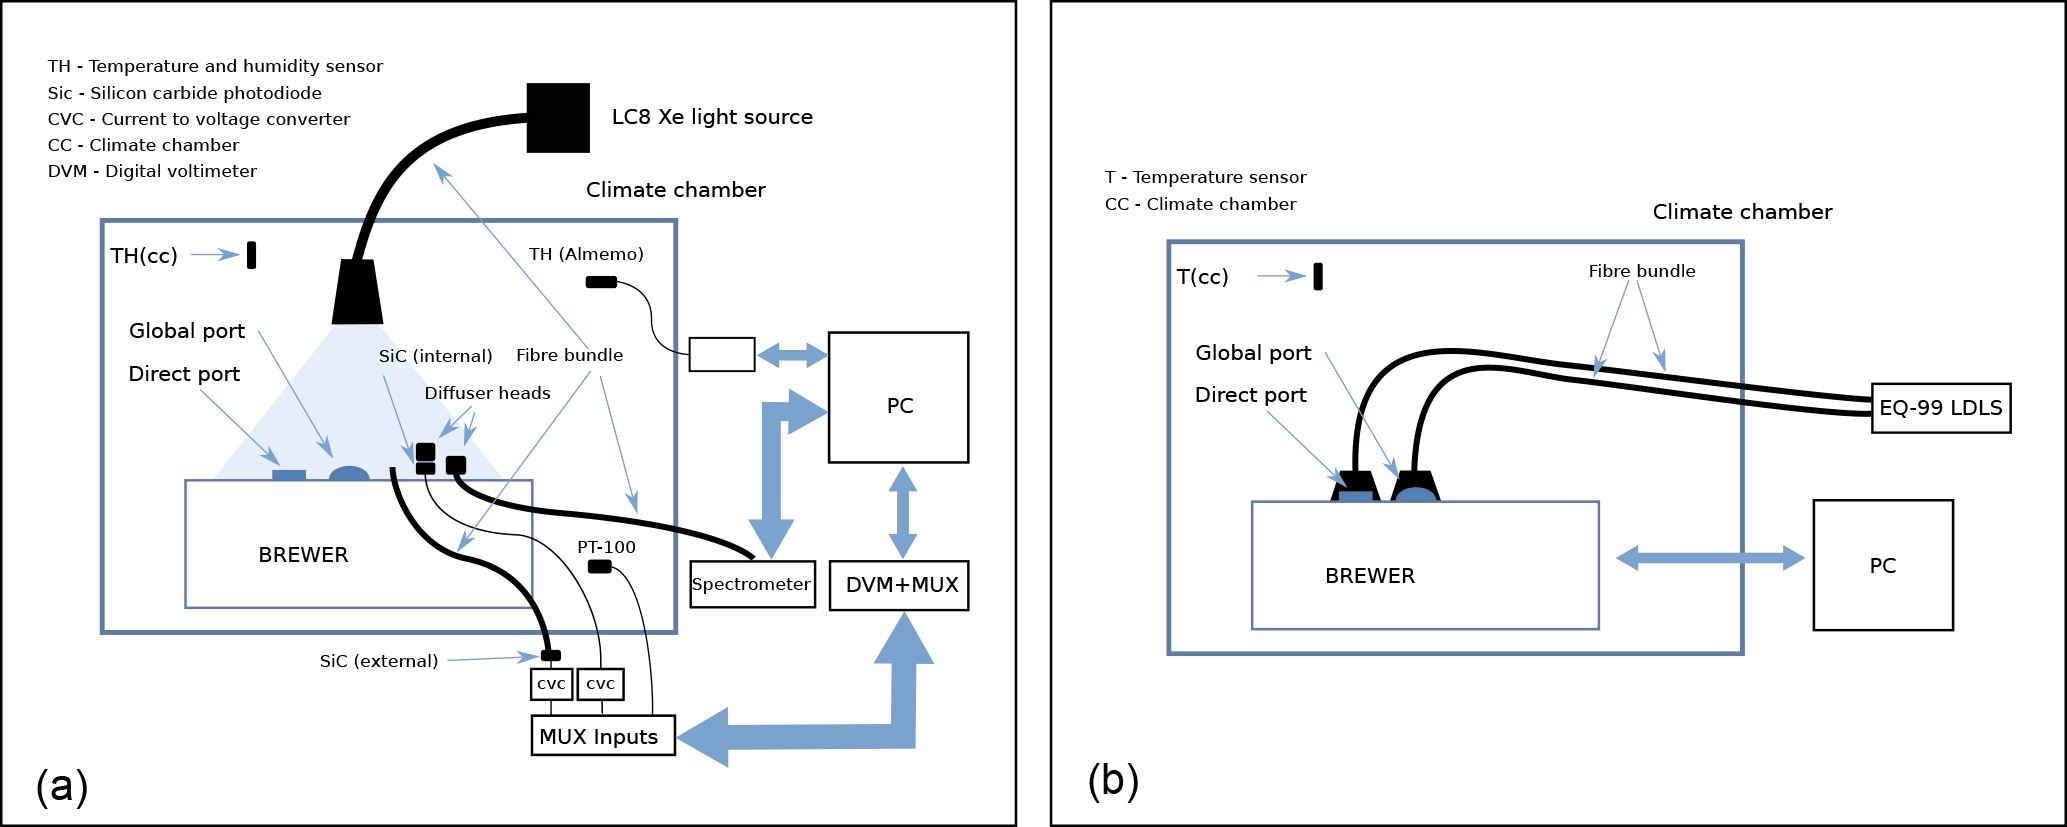
Figure 5Measurement setups for used for the Brewer characterizations at PTB (a) and at Kipp & Zonen (b).
For the Brewer no. 185 characterization, a dedicated climate chamber at PTB was used to provide the necessary conditions. The schematic of the measurement system is presented in Fig. 5a. The temperature and humidity of the chamber was monitored using the built-in sensors of the chamber and two extra sensors, one PT-100 thermometer and one Almemo humidity and temperature sensor. A Hamamatsu model LC8 UV source with a built-in Xe lamp and equipped with a quartz fiber bundle as a light guide was used to illuminate simultaneously both the global and the direct input ports of the Brewer spectrophotometer. The light guide was terminated with light-shaping diffuser to provide a uniform illumination. To monitor the output stability of the UV source, a set of monitor detectors were placed close to the Brewer input ports. Those included two SiC photodiodes and a entrance optics of a calibrated spectroradiometer, which was outside of the chamber. One of the SiC photodiodes was located inside the chamber and the other one outside. To direct the UV radiation onto the external SiC diode a similar light guide was used as for the Xe lamp system. For optimal irradiation conditions the internal SiC photodiode and the entrance optics of the spectroradiometer included special quartz-based Primusil diffusers. For the external SiC photodiode, no diffuser was used to compare the readings with the diffuser-covered detectors and register any possible change of the diffuser transmittance due to the change of the temperature or the relative humidity in the chamber during the experiment. The Brewer observations consisted of alternately measuring the internal and the external lamps. The external Xe lamp was continuously on during the whole cycle of the characterizations while the internal halogen lamp was turned on and off for each measurement. The drift of the Xe source irradiance at the Brewer entrance port was corrected by using the calculated mean of the normalized integrated spectral data from the monitor spectroradiometer and the temperature-corrected SiC detector readings.
The experiment was done twice at the PTB facilities. On the first occasion in January 2016, referred in the results as PTB1, the quartz fiber bundle was used to illuminate simultaneously both the global and the direct input ports of the Brewer instrument. The temperature of the climate chamber was varied between −5 and +40 ∘C over a 70 h period. Separate cycles were used above and below 0 ∘C to achieve a better control over the temperature and the humidity. Due to some inconsistencies in the retrieved results of the first experiment, the temperature characterizations were repeated at the PTB facilities in February 2017. On this second occasion, referred to as PTB2, the light guide of the external lamp was aligned to illuminate only the direct entrance port. The global port was not used for the measurements. In addition, the internal halogen lamp was replaced since anomalous behavior was observed during its operation at the time of the first measurements in January 2016 and later also at the RBCC-E. Two different temperatures cycles were used at different temperature change rates. First, the temperature of the climate chamber was varied between and 45 ∘C over a 64 h period with a temperature change rate of 1.2 ∘C h−1. A second cycle was done varying the temperature from −8 to 30 ∘C over 50 h with a temperature change rate of 2.8 ∘C h−1.
The experimental setup for characterizing Brewer 233 is shown in Fig. 5b. The temperature in the chamber was varied from −5 to +45 during a period of 72 h. A Laser-Driven Light Source (LDLS) Energetiq EQ-99, from Dutch Metrology Institute (VSL), was used as an external lamp. By means of an optical fiber bundle, the light was guided into the chamber, collimated by a 25 mm lens and then illuminated the Brewer's quartz window at normal incidence. The collimated beam illuminated the rotating prism, which was aligned in accordance with the incoming light. During the external lamp measurements, no lamp monitor was used, as one of the main characteristics of the LDLS is its high stability (Islam et al., 2013). The other components in the beam delivery part were assumed to be stable and independent of temperature. Two separate experiments were performed using the internal halogen lamp in the first case and the external LDLS via the quartz window in the second case. The respective lamps were continuously turned on during each experiments.
In all cases, each measurement cycle included an HG test, repositioning of the micrometer of the diffraction grating to locate the 302.15 nm line of the mercury discharge lamp.
Since different instruments have been used in each experiment (185 at PTB and 233 at K&Z) the differences in results may be due not only to the differences of the experiment setup but also to the different Brewer instruments.
In this work we also include an analysis of the measurements based on the internal halogen lamp during field measurements at dates close to the characterizations in the temperature chambers.
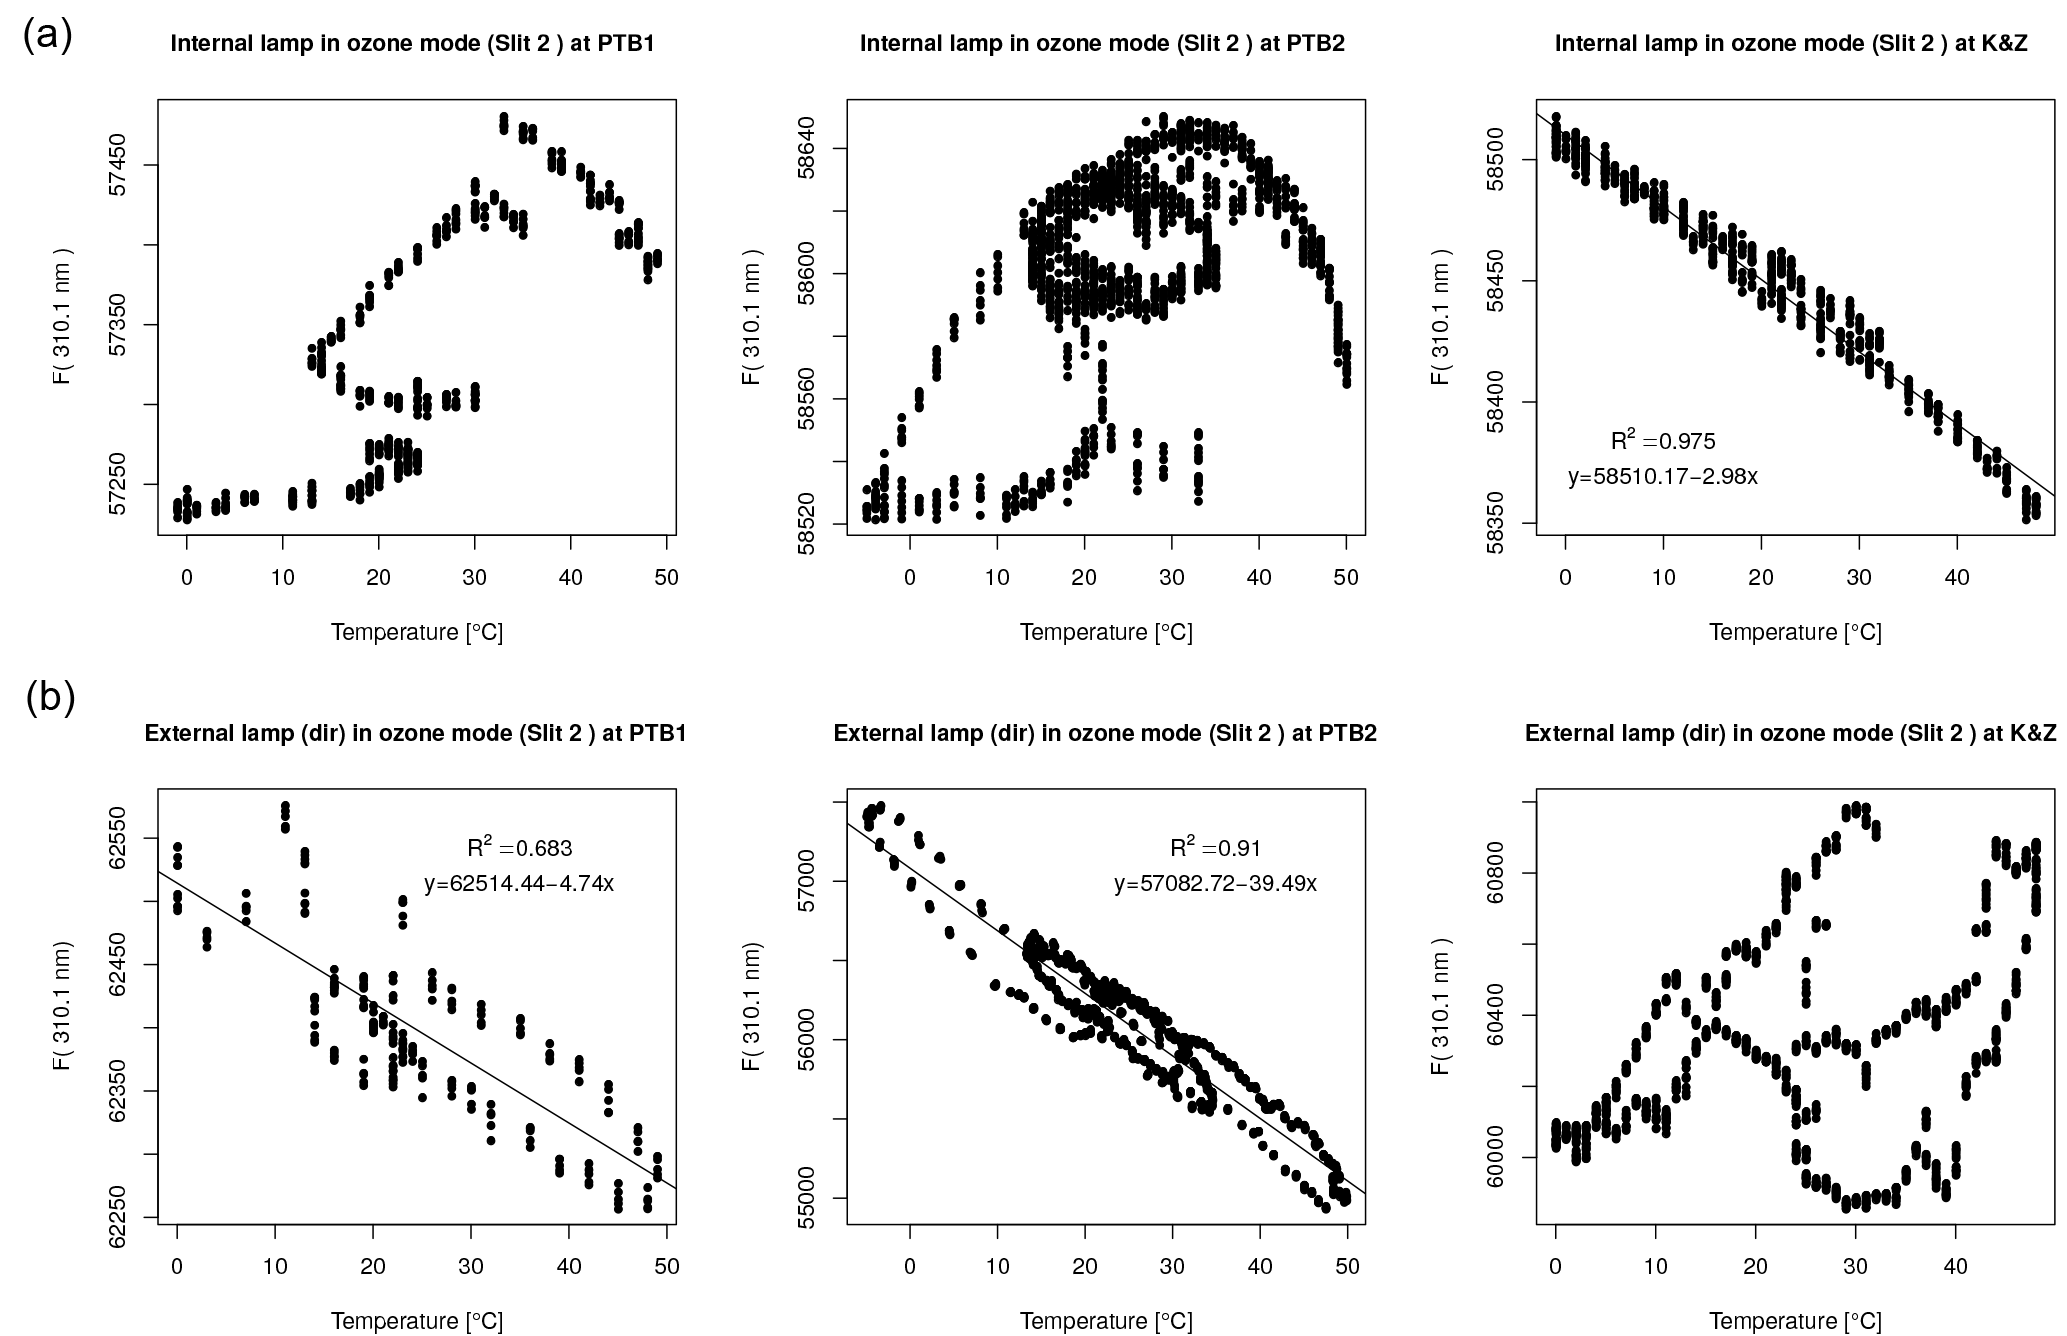
Figure 6Scatter plot of Brewer measurement data (slit 2) versus temperature in the temperature chambers from PTB1, PTB2 and K&Z experiments when illuminating with the internal (a) and the external lamps (b).
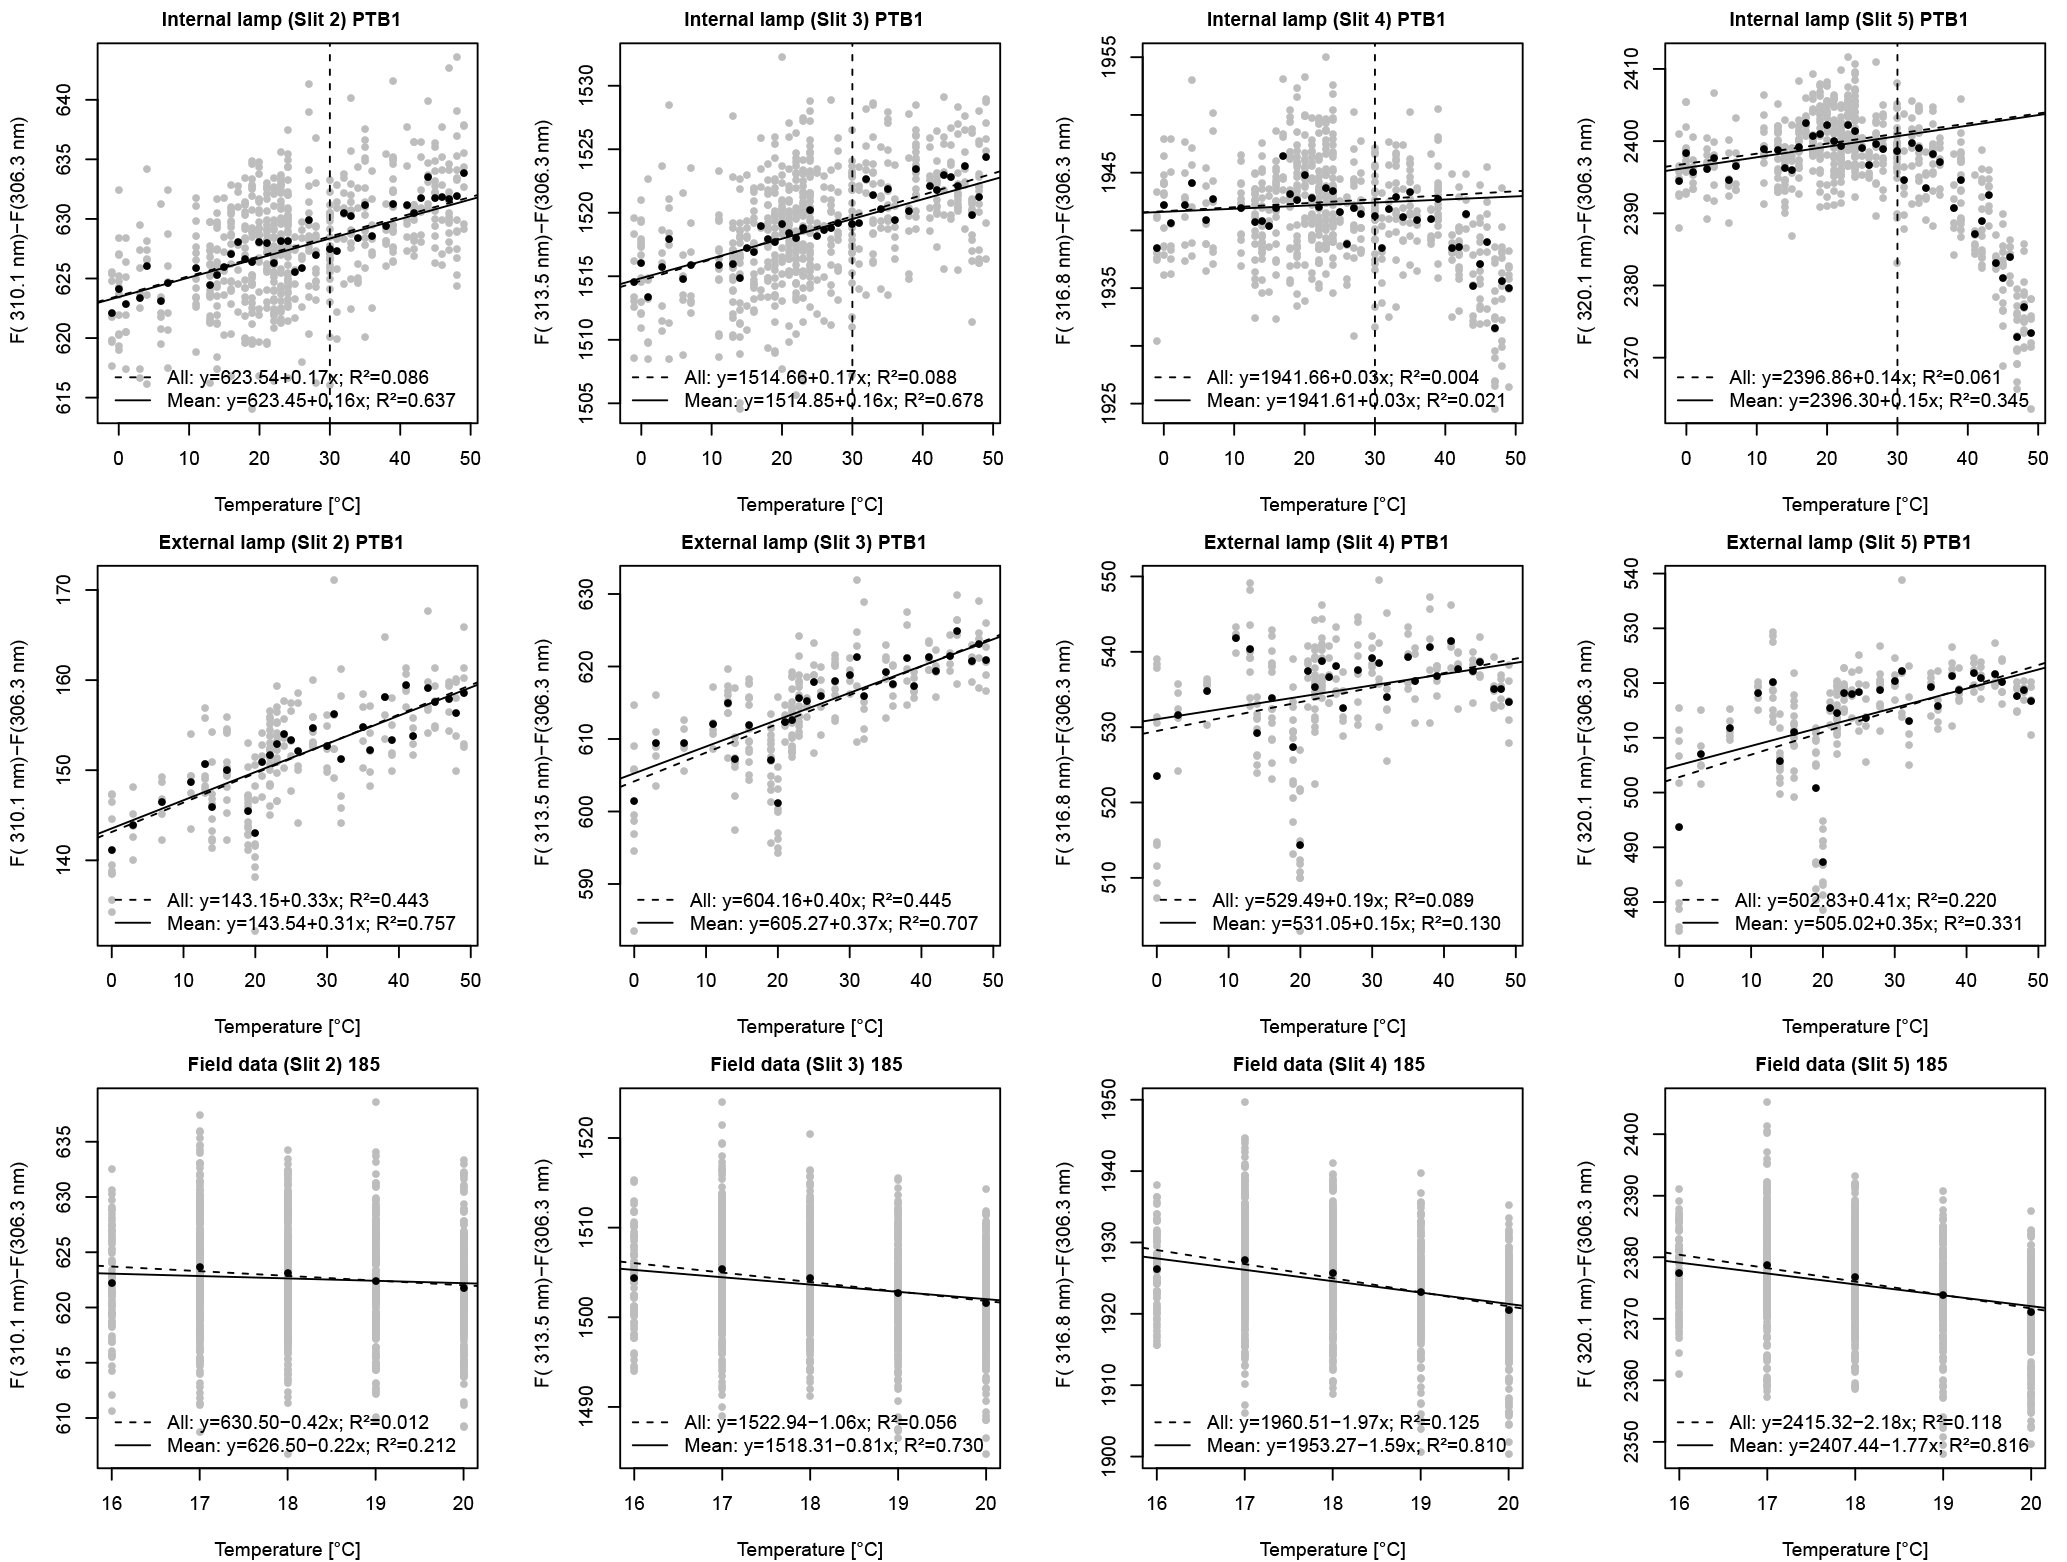
Figure 7PTB1 experiment. Linear regressions between relative Brewer data (slits 2, 3, 4 and 5 relative to slit 1) and temperature. Coefficients are determined from internal and external lamp measurements in the temperature chamber and from field data. Linear regression using individual measurements (grey points) is represented by dashed lines, while solid lines represent the linear regression when using average values at each temperature.
Results from the experiments carried out at PTB and at K&Z, as well as analysis of the field measurements, are presented in this section.
In Fig. 6 we show results of the Brewer measurements of both the external sources and the internal halogen lamps at different temperatures. For the sake of brevity, only the data for 310.1 nm wavelength are shown. The measurements at the other wavelengths show a very similar behavior. The first evident thing apparent in the figures is the difficulty of assuming a linear behavior in these measurements. Despite of using different experimental setups and instruments, the results are not as expected. Only the relation between the measurement results of the internal halogen lamp and the temperature in the K&Z experiment can be considered linear. Nevertheless, some behaviors are repeated in the two experiments at PTB, which makes us assume that they are probably due to real changes in the behavior of lamps, detectors or the different mechanical elements during the experiments. One of these clearly observed behaviors is the presence of hysteresis cycles. This is possibly related to an inhomogeneous temperature distribution within the instrument. In any case, it is difficult to extract information from the data presented in this way.
The total variation shown in the plots in Fig. 6 is only about 1 % for a temperature change of more than 50 ∘C over nearly 3 days. Under these conditions it is difficult to ensure sufficient stability of the light sources and the required precision in the alignment. Any uncontrolled effect during the measurements may negatively impact the determination of the absolute temperature coefficients. These results reflect the difficulty of determining the absolute temperature coefficients for the Brewer spectrophotometer.
As stated in Sect. 3, the relative coefficients are intended to be more robust against variations of the experimental conditions. Figures 7, 8 and 9 show results of the relative analysis of the measurements presented versus temperature and the relative temperature coefficients derived from both the external and the internal lamps in the three experiments. The analysis of the internal halogen lamp data from field measurements is also presented.
Table 1Temperature coefficients obtained from the linear regression of the individual measurements, for slits 2, 3, 4 and 5 retrieved from Brewer measurements relative to slit 1 () and temperature coefficient for R6 (). Rows are grouped in three blocks representing the tree experiments (PTB1, PTB2 and K&Z). For each experiment, results from external (top row) and internal (middle row) lamp measurements in the temperature chamber and derived from field data (bottom row) are shown.
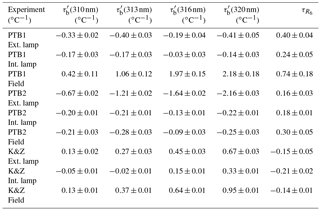
Table 2Temperature coefficients obtained from the linear regression of the mean values for each temperature, for slits 2, 3, 4 and 5 retrieved from Brewer measurements relative to slit 1 () and temperature coefficient for R6 (). Rows are grouped in three blocks representing the tree experiments (PTB1, PTB2 and K&Z). For each experiment, results from external (top row) and internal (middle row) lamp measurements in the temperature chamber and derived from field data (bottom row) are shown.
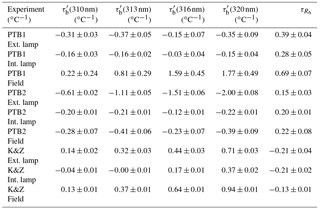
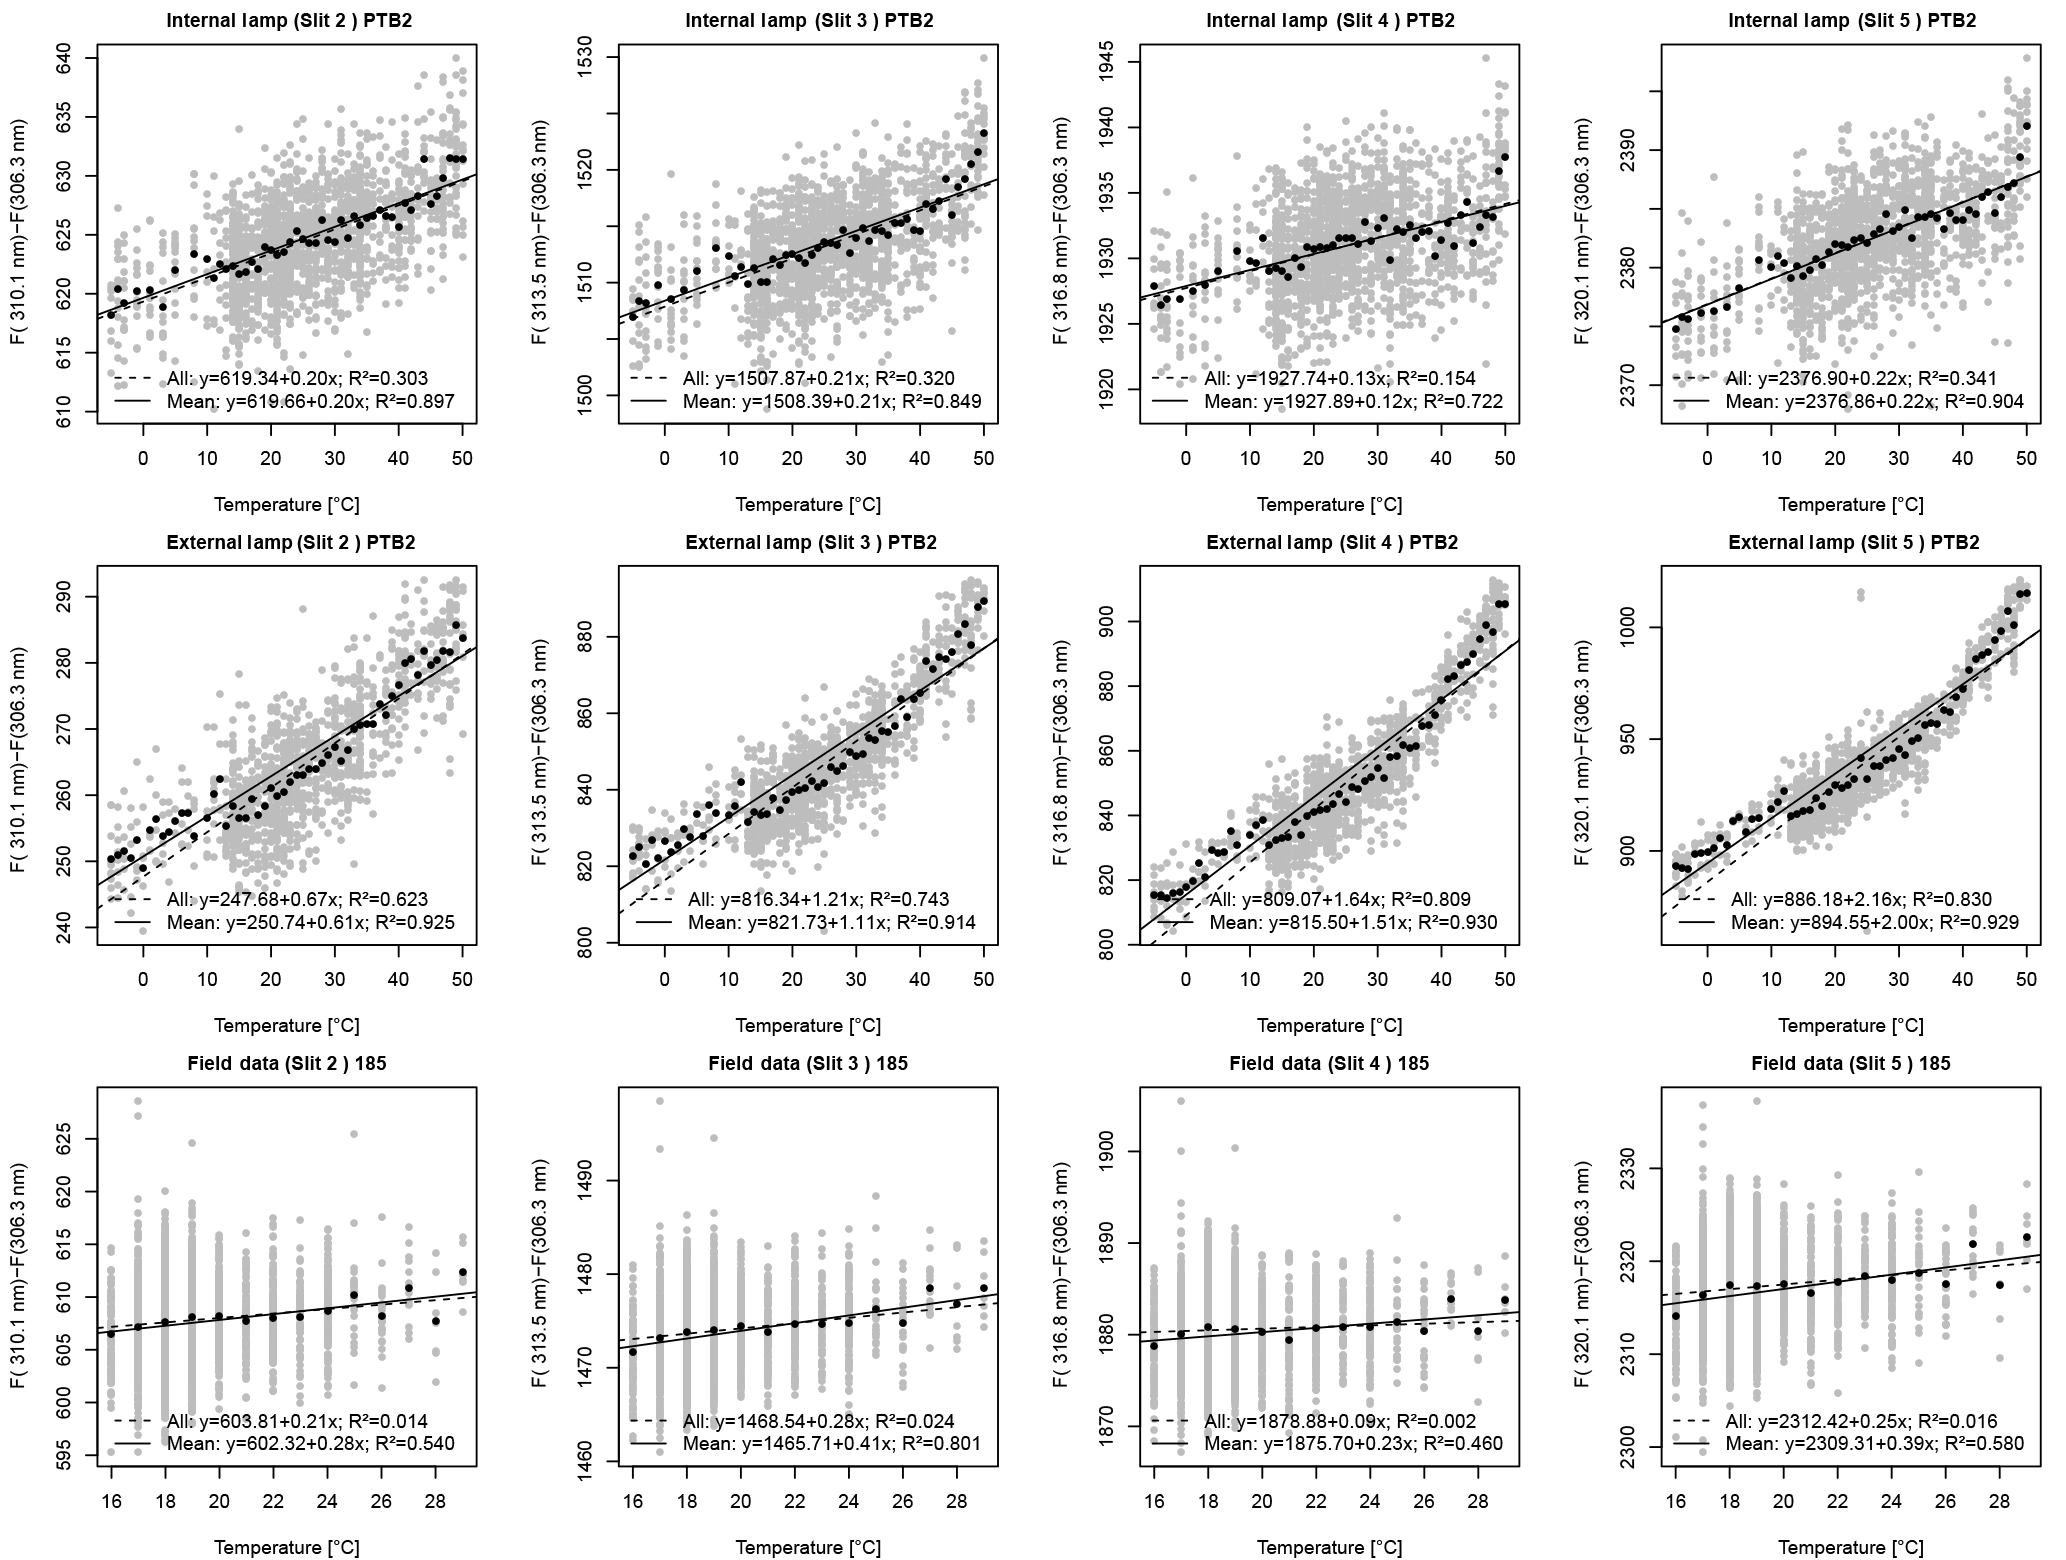
Figure 8PTB2 experiment. Linear regression between relative Brewer data (slits 2, 3, 4 and 5 relative to slit 1) and temperature. Coefficients are determined from internal and external lamp measurements in the temperature chamber and from field data. Linear regression using individual measurements (grey points) is represented by dashed lines, while solid lines represent the linear regression when using average values at each temperature.
We can clearly see the improvement when using the analysis of the relative coefficients. In most of the cases we can assume a linear relationship between relative Brewer measurements and the temperatures. Figures 7, 8 and 9 show two different linear regressions for each data sets. In a first approximation we use the individual relative Brewer measurements. In a second step, a linear regression is performed with respect to the average values at each temperature. This is done to avoid overrepresentation of any of the temperatures since the number of measurements at certain temperatures is much higher than at the others. A summary of the results obtained by both linear regressions methods is shown in Tables 1 and 2.
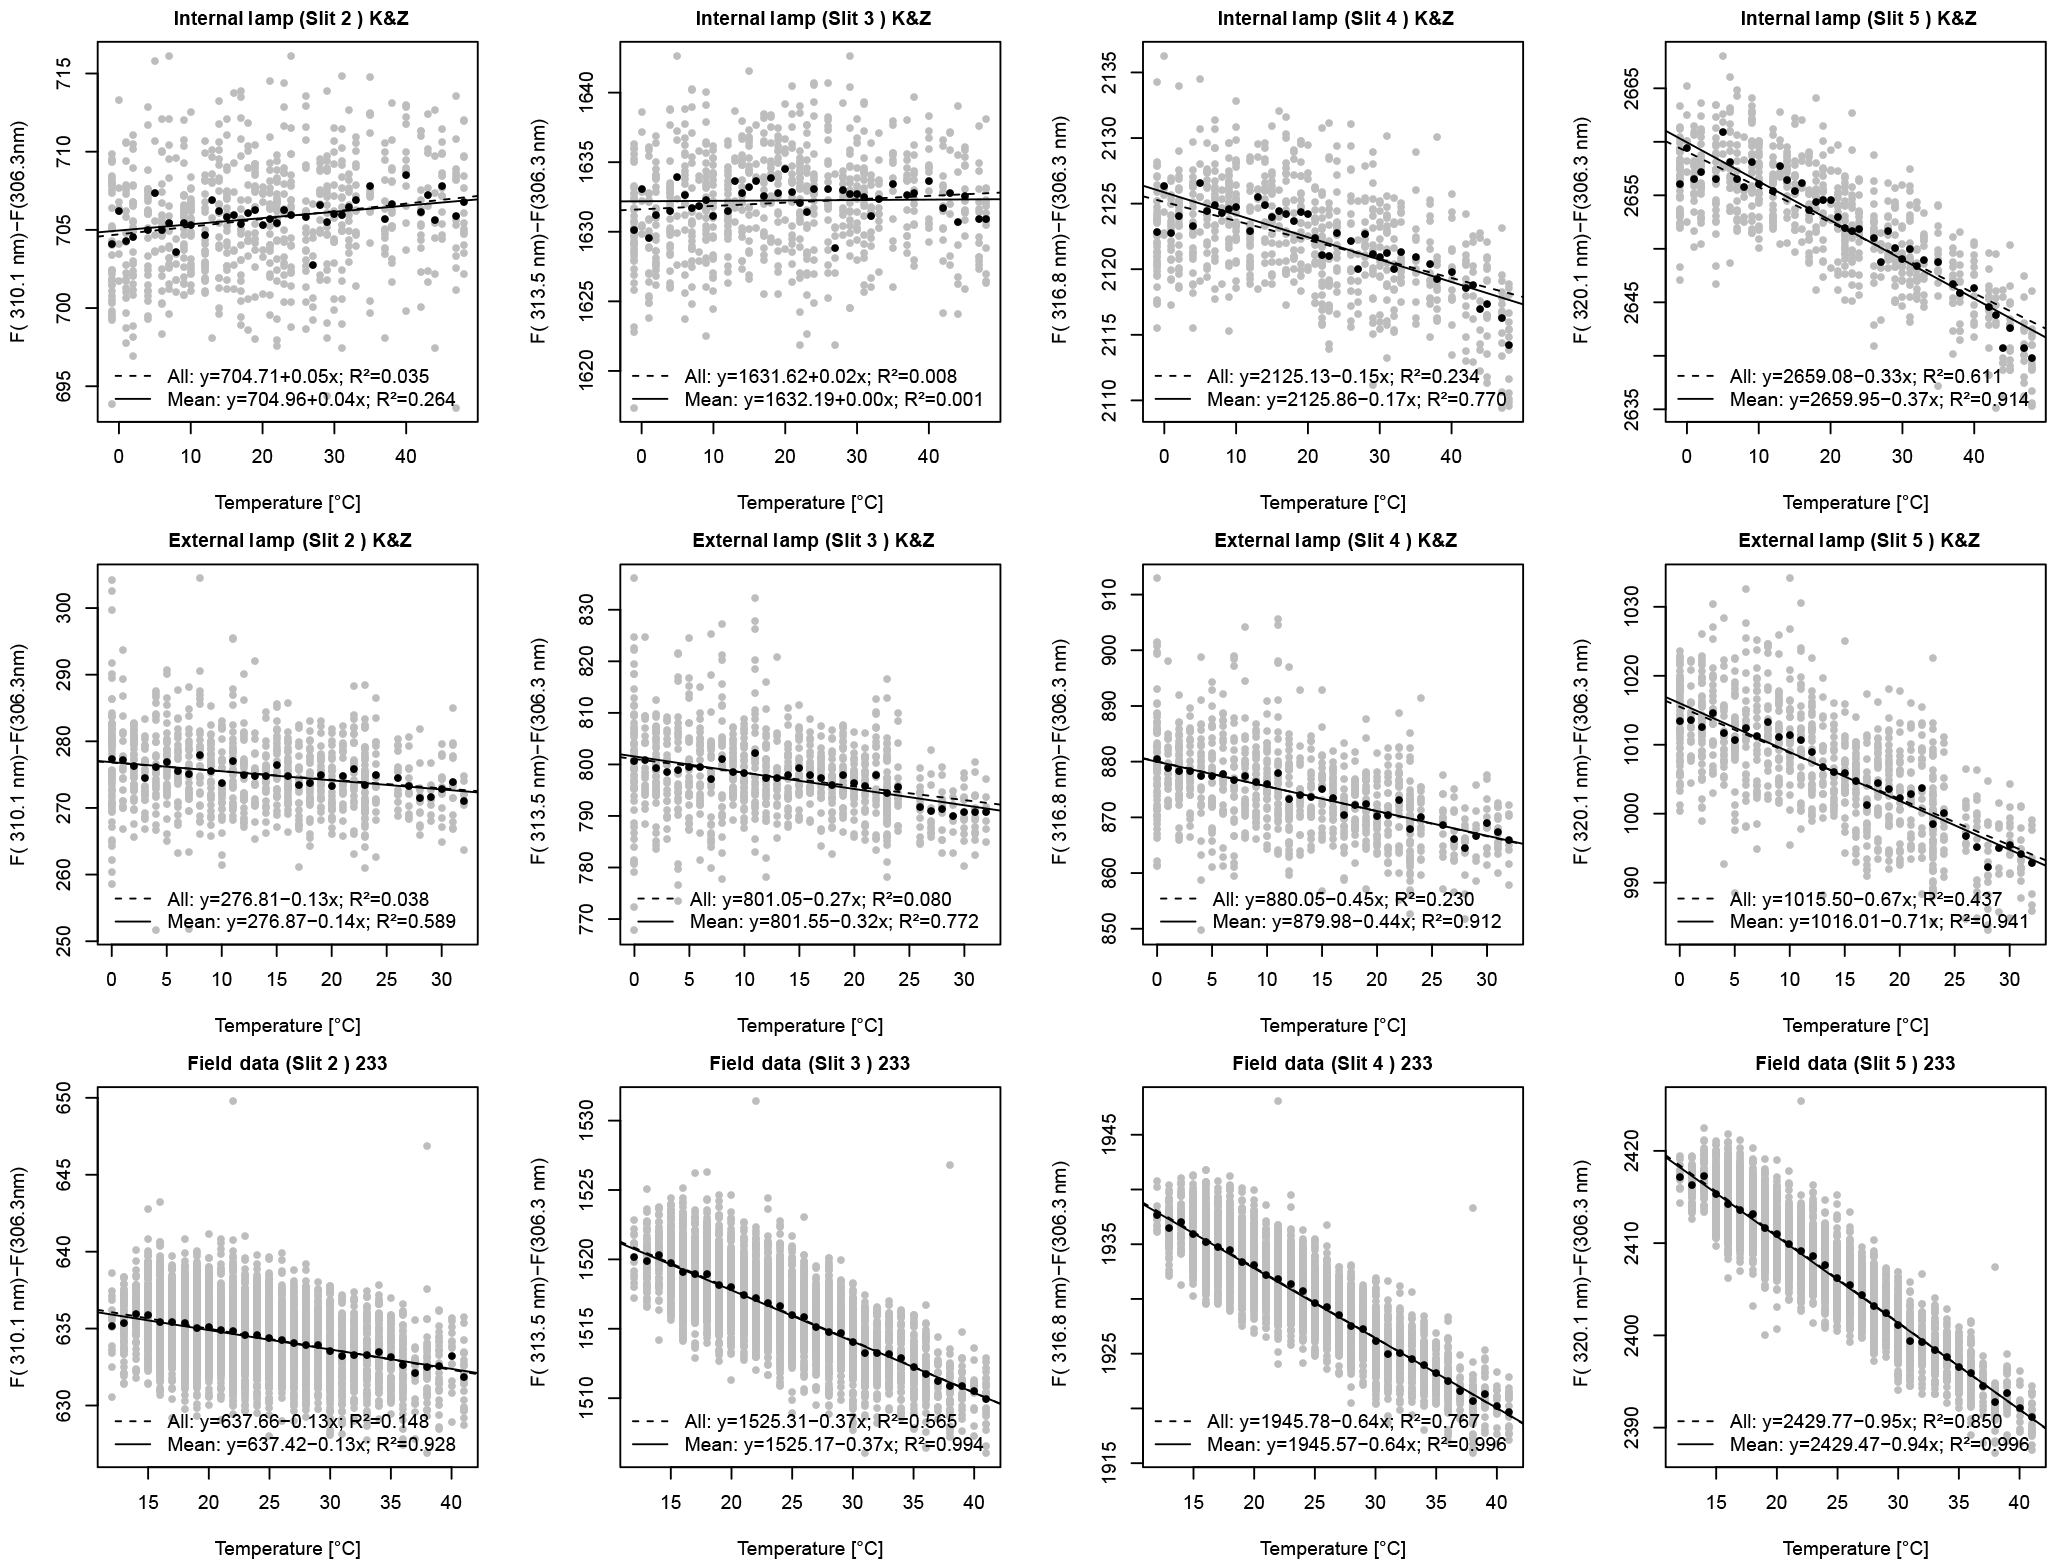
Figure 9K&Z experiment. Linear regression between relative Brewer data (slits 2, 3, 4 and 5 relative to slit 1) and temperature. Coefficients are determined from internal and external lamp measurements in the temperature chamber and from field data. Linear regression using individual measurements (grey points) is represented by dashed lines, while solid lines represent the linear regression when using average values at each temperature.
The analysis of the internal halogen lamp measurements in PTB1 shows a very marked nonlinear behavior when using data from slits 4 and 5 relative to measurements with slit 1. Due to this, only data below 30 ∘C have been used to make the linear regression to obtain the relative temperature coefficients. This behavior was not repeated in PTB2. This change in the behavior must have been due to the replacement of the internal halogen lamp between both experiments. One week before the PTB1 experiment, the internal halogen lamp was burned out and it had to be replaced. However, this replaced lamp used in the PTB1 experiment did not show a stable behavior also during later field measurements. Therefore, it was replaced again in March 2016. This is also the reason why we have only a few number of measurement points to make the field data analysis shown in Fig. 7. Moreover, differences between external lamp measurements in PTB1 and PTB2 may be due to the alignment changes to couple the external lamp radiation into the direct entrance port. All these problems led us to consider Brewer 185 to be unstable during the PTB1 experiment and, therefore, its results will not be included in the final analysis.
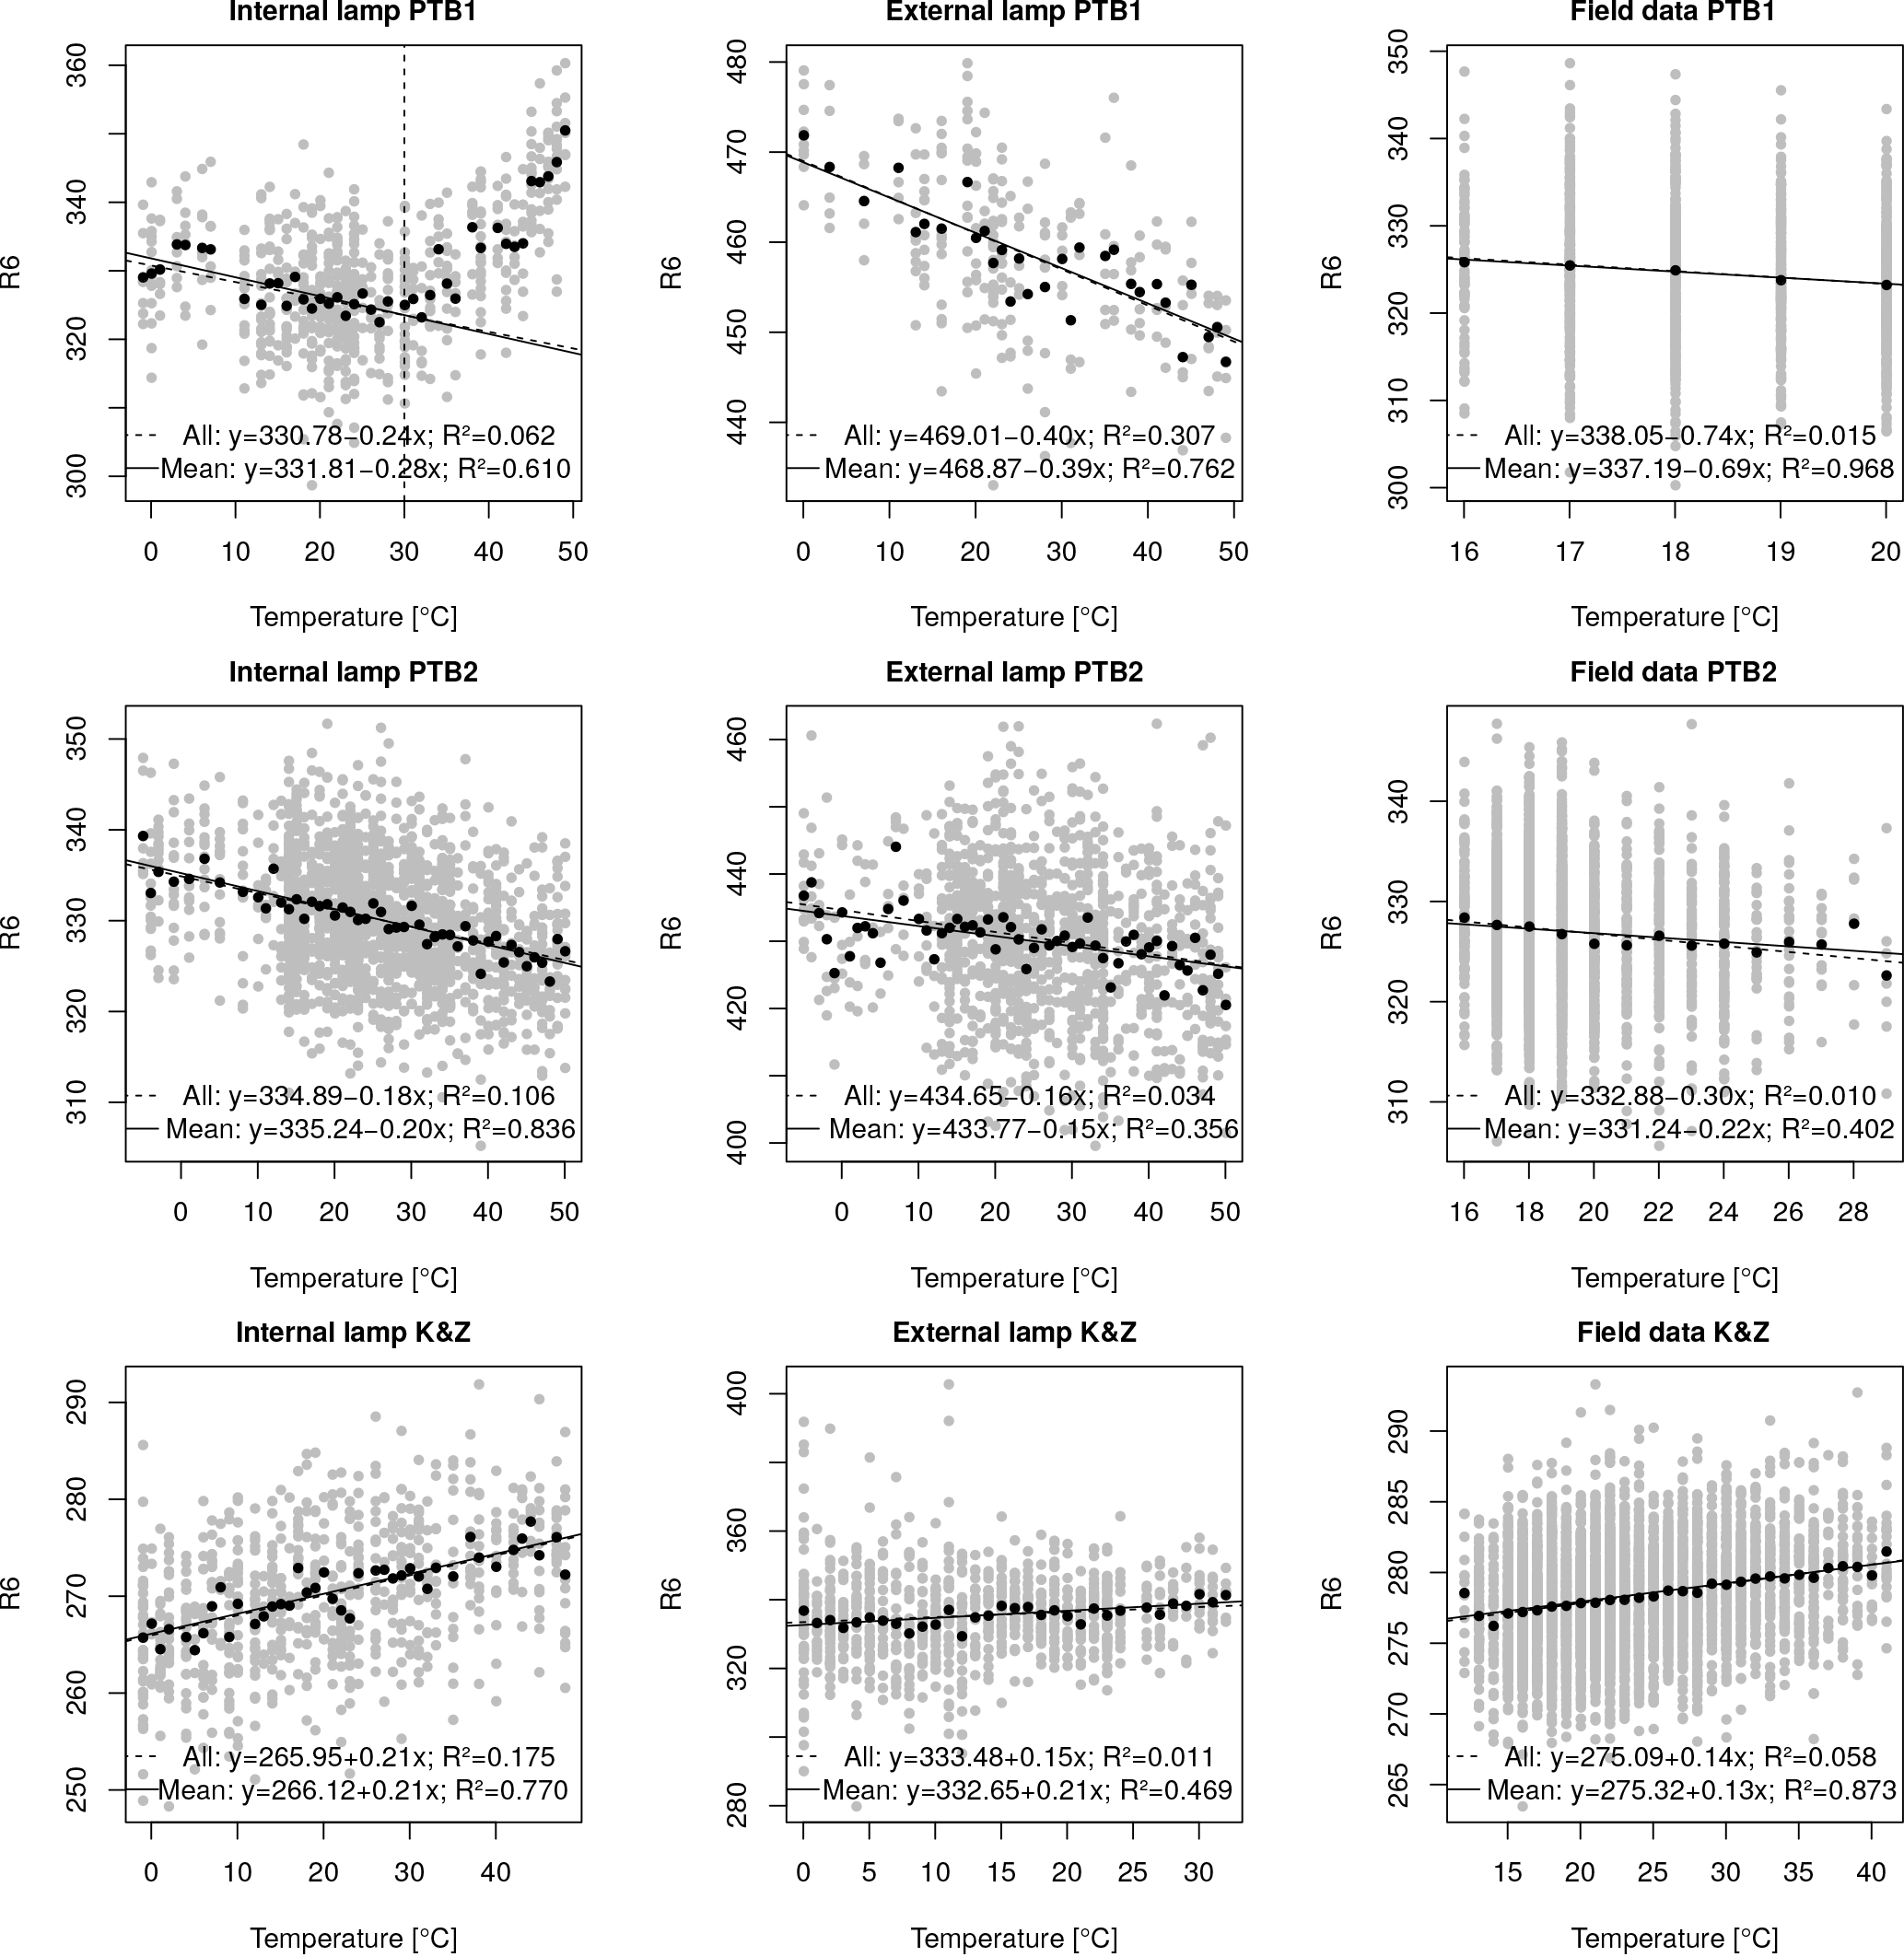
Figure 11Linear regressions between and temperature for PTB1, PTB2 and K&Z experiments using internal and external lamp in the temperature test chamber and from field data. Linear regression using individual measurements (grey points) is represented by dashed lines, while solid lines represent the linear regression when using average values at each temperature.
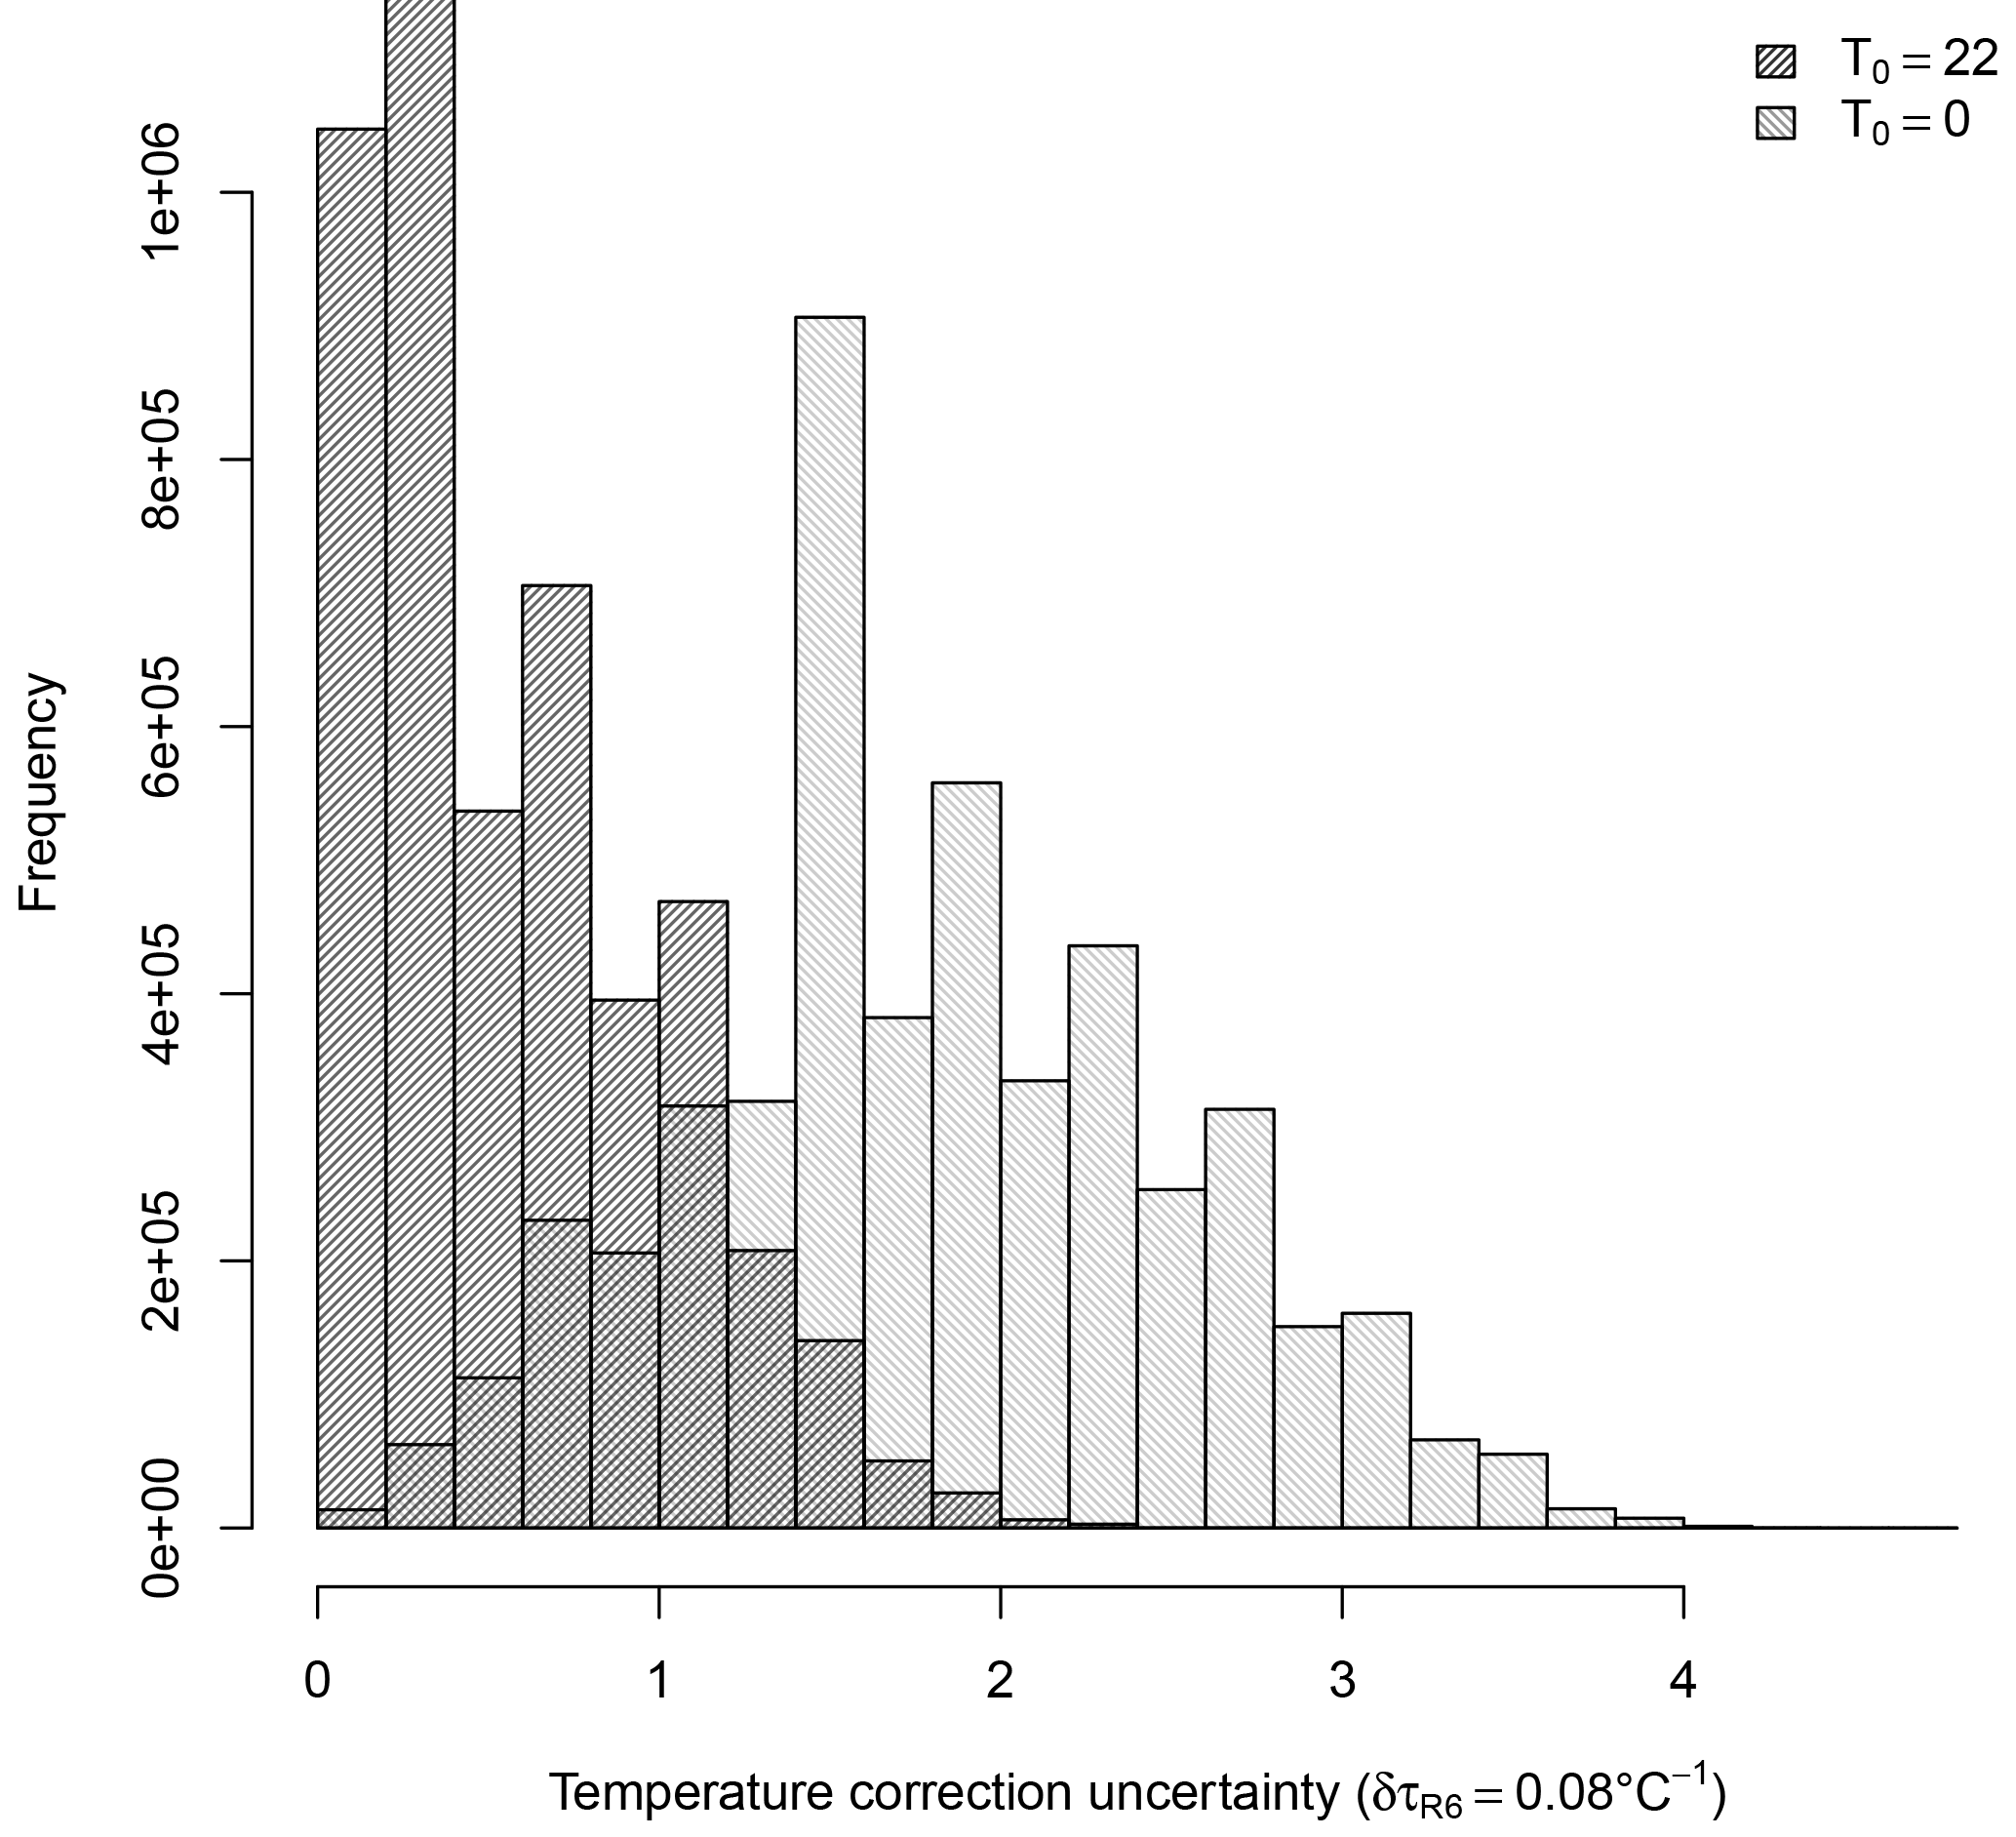
Figure 12Distribution of the temperature correction uncertainties using ∘C−1 for the reference temperature T0=0 and T0=22 ∘C.
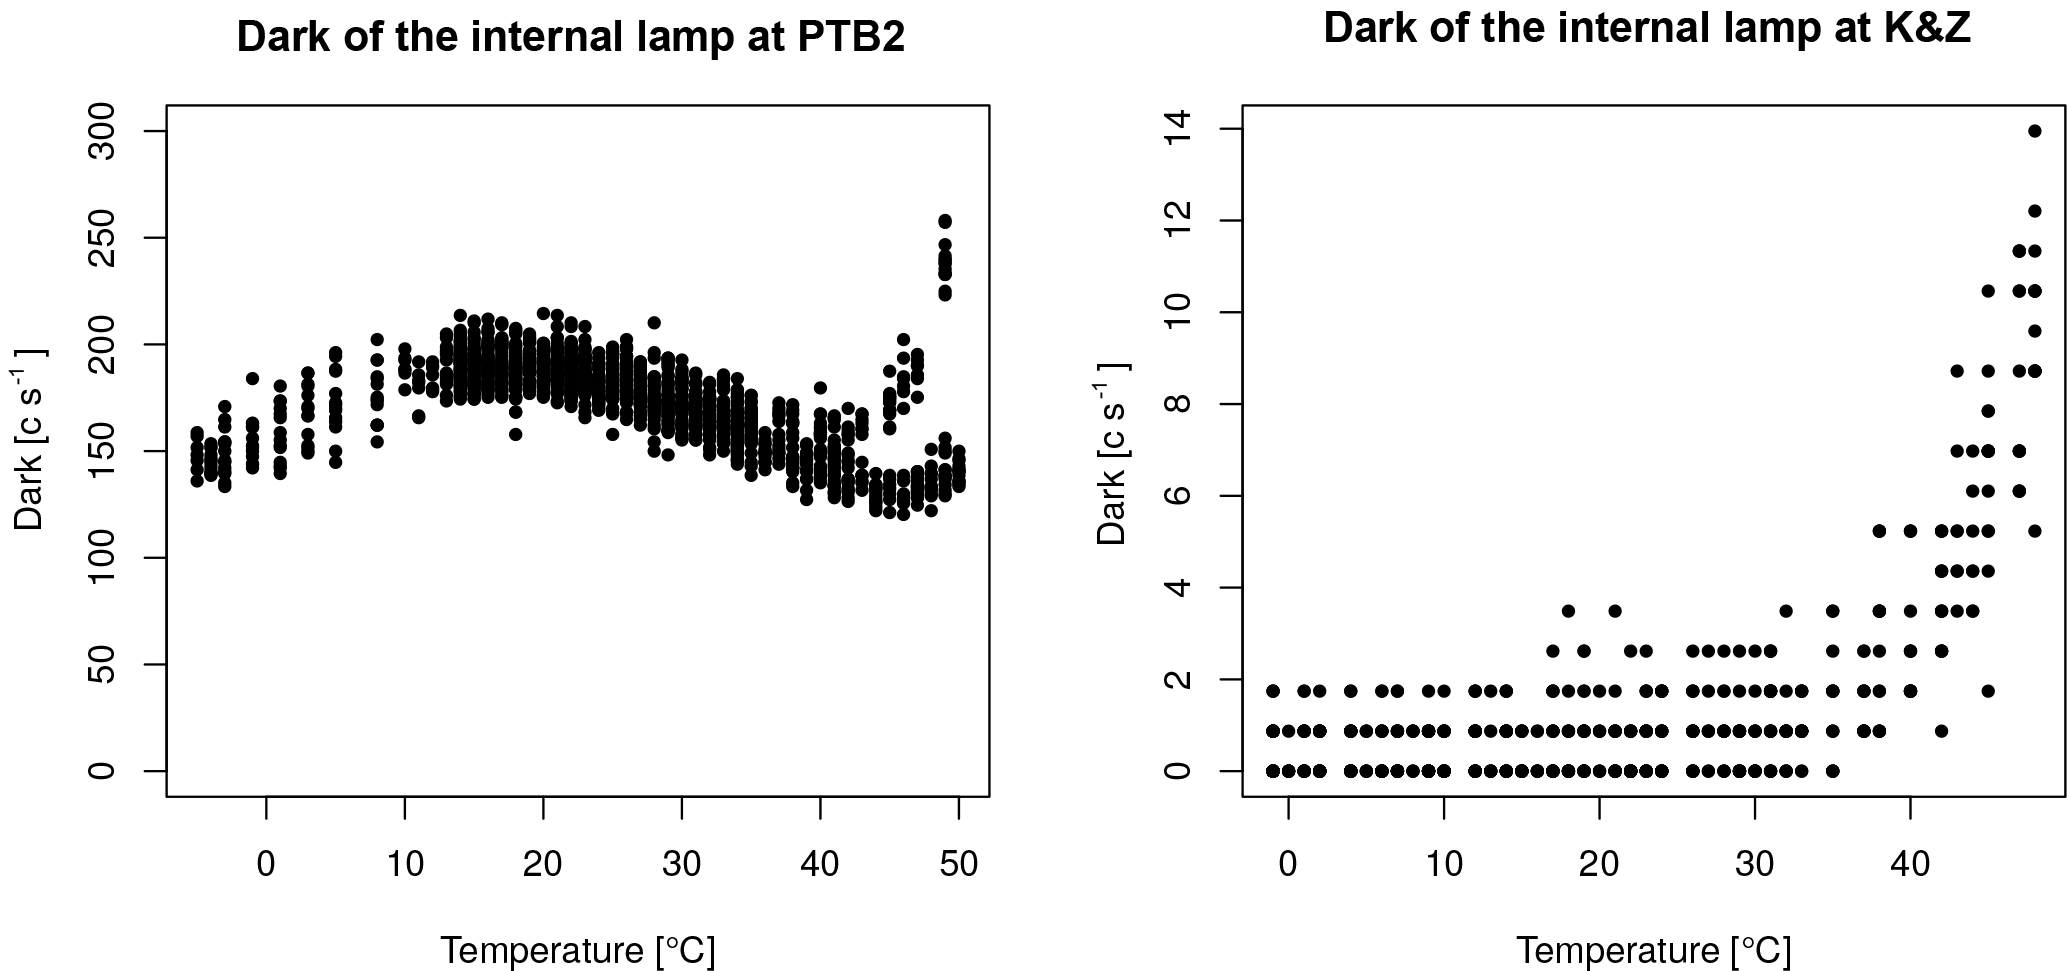
Fortunately, the PTB2 experiment (Fig. 8) showed more consistent results. Here, the relationship between the relative measurement results and the temperature are mainly linear, although some nonlinearities are observed for both the internal and the external lamp measurements between 40 and 50 ∘C. This nonlinearity for high temperatures may be explained by the PMT behavior at these temperatures. Figure 10 shows the dark signals for Brewer spectrophotometers nos. 185 and 233 measured during PTB2 and K&Z experiments. They demonstrate different behaviors in the operating temperature range. Moreover, at temperatures between 40 and 50 ∘C both show an increase in the dark signals. Additionally, dark signals of no. 185 show two different trends between 40 and 50 ∘C along the whole experiment time. From the data sets of the EUBREWNET database we can see that the most usual behavior corresponds to the one shown by no. 233. The K&Z experiment gives also a linear relation between the relative data and the temperature for both the internal and the external lamp measurements (Fig. 9).
From Tables 1 and 2 we can see that the determined relative temperature coefficients present important differences depending on the used data set (thermal chamber measurements with internal halogen lamp and external lamp or field measurements with internal lamp) in both PTB2 and K&Z experiments. However, when calculating the differences are strongly reduced and very similar values are obtained, as shown in Fig. 11.
Differences between the values retrieved from the internal and the external lamp measurements are less than 0.06 for both PTB2 and K&Z experiments, independently if the linear regression is done using individual values or mean values at each temperature. Including the field data retrieval, differences are within about 0.08 in both PTB2 and K&Z experiments when the linear regression is done using mean values at each temperature. For the regression using individual values, difference rise to 0.14 and 0.07 for the PTB2 and K&Z data sets, respectively. The higher coefficient found in the case of the PTB2 field data set when the linear regression is done using individual values indicates that the greatest number of measurements taken at lower temperatures has a negative impact on the estimated coefficient.
The typical value of the numerator in Eq. (1), ETC, is about 1000 for an optical air mass of 1; thus differences in of 0.08 represent a 0.08 % of TOC for a temperature variation of 10 ∘C. As the mean diurnal variation is close to 10 ∘C, that value can be considered the diurnal uncertainty due to the temperature correction. This result might be useful when analyzing different operating issues, such as wrong temperature coefficients or incorrect values of ETC, that may introduce diurnal cycles in the final ozone values.
Note that the uncertainty associated with the different coefficients in Tables 1 and 2 corresponds to the standard uncertainty of the slopes from the linear regressions in Figs. 7, 8, 9 and 11. coefficients can also be calculated as a linear combination of the relative coefficients or directly from the linear regressions in Fig. 11. However, to derive the associated uncertainty of from the uncertainties of the relative coefficients we should assume they are not independent variables. Therefore, the calculation of uncertainty is more direct from the linear regressions.
It is worth noting that temperature correction is usually applied to measurement data using a reference temperature close to the most frequently faced operation temperature. A reference temperature close to the mean operational temperature means that the applied temperature correction is most of the time small and, thus, a low accuracy estimation of the temperature sensitivity will not have a high effect on the TOC retrieval. However, this is not the case with the Brewer spectrophotometer, which uses a reference temperature of 0 ∘C, mean operation temperature of 23 ∘C and a median value of 22 ∘C. Considering the negligible uncertainty of the temperature measurements, we can write the uncertainty associated with the temperature correction as , where is the uncertainty associated with the coefficient . Figure 12 shows an estimation of the uncertainties of the temperature corrections applied to the measurements in EUBREWNET database using the distribution of temperatures previously shown in Fig. 2 and the mean value of ∘C−1 that we have obtained from the differences between the methods. As we can see, the estimated uncertainties are close to zero for most of the cases when T0=22 ∘C and the maximum uncertainty would only be half the maximum uncertainty in the case of T0=0 ∘C. While a change of temperature reference form to T0=22 ∘C may increase the uncertainty associated with some measurements made at low temperatures, in general it would result in a reduction of the uncertainty.
Two experiments were conducted at PTB (in January 2016 and in February 2017) and the Kipp & Zonen (in October 2016) facilities to validate the standard methods for the determination of the temperature dependence of measurements by the Brewer MkIII instruments used to retrieve atmospheric TOC. We have prioritized the MkIII model in this study since it is the most extended model and generally used as reference, as in the case of the RBCC-E.
The first experiment performed at PTB in January 2016 with an unstable internal lamp in the Brewer spectrophotometer led to unusable results but it showed that it is necessary to guarantee a good performance of the Brewer instrument before carrying out the temperature sensitivity analysis. This highlights the importance of the method based on the internal halogen lamp measurement data in the field since it presents the best way to ensure the correct functioning of the spectrophotometer throughout its operation. In order to apply this method, it is advisable to schedule internal halogen lamp measurements throughout the day to record as wide a range of temperature variation as possible.
The absolute temperature coefficients obtained through the different methods present important inconsistencies that prevent their use. These problems are probably due to the difficulties in controlling the whole system with the required precision. The total variation of the measurement results is only about 1 % with a temperature change of more than 50 ∘C. Uncontrolled effects during the measurements may negatively impact the determination of the absolute temperature coefficients.
The relative results seem to be more robust against uncontrolled systematic effects and they present an approximately linear behavior with the temperature. However, the derived relative temperature coefficients show important differences depending on the data used for their calculation.
The calculated values are very much stable. The combination of the four wavelengths clearly increase the stability in all the experiments. This is probably because the linear combination removes any linear effect with wavelength, as it satisfies the conditions defined by Eq. (5). Instead, the relative coefficients does not satisfy this property.
Better results are found when the linear regression is done using the mean value at each temperature. The TOC differences due to the method used to calculate the temperature coefficients are below 0.08 % for a mean diurnal temperature variation of 10 ∘C.
These experiments confirm that the characterizations performed in a thermal chamber using either the internal halogen lamp of the Brewer instrument or an external lamp as well as those carried out with the internal halogen lamp during field measurements lead to small differences in the retrieved . This is the case even though the values of the relative coefficients are obtained using different types of lamps.
The analysis of the EUBREWNET data shows some temperature sensitivity differences between Brewer MkIII model and the MkII and MkIV models, which may be related to NiSO4/UG11 filter. Therefore, the conclusions of this work may not be directly applicable to the MkII and MkIV models. Further studies are necessary in order to analyze these specific models.
Finally, it is advisable to consider a change of the reference temperature from the actual 0 to 22 ∘C. While this could increase the uncertainty associated with some measurements made at low temperatures, in general it would result in a reduction of the uncertainty associated with the temperature correction.
The data used for the present study can be made available after personal communication with the authors of the present paper.
Keith Wilson is an employee of Kipp & Zonen, the manufacturer of the Brewer spectrometer used in this study.
This article is part of the special issue “Quadrennial Ozone Symposium 2016 – Status and trends of atmospheric ozone (ACP/AMT inter-journal SI)”. It is a result of the Quadrennial Ozone Symposium 2016, Edinburgh, United Kingdom, 4–9 September 2016.
This work has been supported by the European Metrology Research Programme
(EMRP) within the joint research project ENV59 “Traceability for atmospheric
total column ozone” (ATMOZ). The EMRP is jointly funded by the EMRP
participating countries within EURAMET and the European Union. We thank the
European Brewer Network (http://rbcce.aemet.es/eubrewnet/, last access: 1 June 2018) for providing
access to the data and the PI investigators and their staff for establishing
and maintaining the 32 sites used in this investigation. We further
acknowledge the support of the Fundación General de la Universidad de La
Laguna.
Edited by: Irina Petropavlovskikh
Reviewed by: Vladimir Savastiouk, John Rimmer,
and two anonymous referees
Bernhard, G., Evans, R. D., Labow, G. J., and Oltmans, S. J.: Bias in Dobson total ozone measurements at high latitudes due to approximations in calculations of ozone absorption coefficients and air mass, J. Geophys. Res.-Atmos., 110, D10305, https://doi.org/10.1029/2004JD005559, 2005. a
Brewer, A. W.: A replacement for the Dobson spectrophotometer?, Pure Appl. Geophys., 106, 919–927, https://doi.org/10.1007/BF00881042, 1973. a
Cappellani, F. and Kochler, C.: Temperature effects correction in a Brewer MKIV spectrophotometer for solar UV measurements, J. Geophys. Res.-Atmos., 105, 4829–4831, https://doi.org/10.1029/1999JD900254, 2000. a
Dobson, G. M. B.: Observers' handbook for the ozone spectrophotometer, in: Annals of the International Geophysical Year, 5, 46–89, Pergamon Press, 1957. a
Environment Canada: Standard Operating Procedures Manual for the Brewer Spectrophotometer, Tech. rep., Environment and Climate Change Canada, available at: http://woudc.org/resources/sop.php (last access: 1 June 2018), 2008. a
Fioletov, V. E., Kerr, J. B., McElroy, C. T., Wardle, D. I., Savastiouk, V., and Grajnar, T. S.: The Brewer reference triad, Geophys. Res. Lett., 32, L20805, https://doi.org/10.1029/2005GL024244, 2005. a
Fountoulakis, I., Redondas, A., Lakkala, K., Berjon , A., Bais, A. F., Doppler, L., Feister, U., Heikkila, A., Karppinen, T., Karhu, J. M., Koskela, T., Garane, K., Fragkos, K., and Savastiouk, V.: Temperature dependence of the Brewer global UV measurements, Atmos. Meas. Tech., 10, 4491–4505, https://doi.org/10.5194/amt-10-4491-2017, 2017. a, b
Islam, M., Ciaffoni, L., Hancock, G., and Ritchie, G. A. D.: Demonstration of a novel laser-driven light source for broadband spectroscopy between 170 nm and 2.1 µm, Analyst, 138, 4741–4745, https://doi.org/10.1039/C3AN01020A, 2013. a
Kerr, J. B., McElroy, C. T., and Olafson, R. A.: Measurements of ozone with the Brewer ozone spectrophotometer, in: Proceedings of the Quadrennial Ozone Symposium held in Boulder, edited by: London, J., Colorado, August 1980, 74–79, 1981. a
Kerr, J. B., McElroy, C. T., Wardle, D. I., Olafson, R. A., and Evans, W. F. J.: The Automated Brewer Spectrophotometer, in: Atmospheric Ozone: Proceedings of the Quadrennial Ozone Symposium held in Halkidiki, Greece 3–7 September 1984, edited by: Zerefos, C. S. and Ghazi, A., Springer Netherlands, Dordrecht, 396–401, https://doi.org/10.1007/978-94-009-5313-0_80, 1985. a
Kipp & Zonen: Brewer MKIII Spectrophotometer Operators Manual, Tech. rep., Kipp & Zonen Inc., available at: http://www.kippzonen.com/Download/207/Brewer-MkIII-Operator-s-Manual (last access: 1 June 2018), 2008. a, b
McElroy, C. T.: Brewer Ozone Spectrophotometer Mechanical Design Principles, Izaña Atmospheric Research Center, Tenerife, Spain, available at: http://kippzonen-brewer.com/wp-content/uploads/2014/10/BrewMechDesign1_McElroy.pdf (last access: 1 June 2018), 14th WMO-GAW Brewer Users Group Meeting/COST Action ES1207 EUBREWNET Open Congress, 2014. a
Redondas, A.: Ozone absolute Langley calibration, The Tenth Biennial WMO Consultation on Brewer Ozone and UV Spectrophotometer Operation, Calibration and Data Reporting, edited by: McElroy, C. T. and Hare, E. W., Gaw Report. No. 176, WMO TD No. 1420, 12–14, 2007. a
Redondas, A. and Rodríguez-Franco, J.: Ninth Intercomparison Campaign of the Regional Brewer Calibration Center Europe (RBCC-E), no. 224 in WMO/GAW Reports, World Meteorological Organization, available at: http://www.wmo.int/pages/prog/arep/gaw/documents/Final_GAW_224.pdf (last access: 1 June 2018), 2015. a
Rimmer, J. S., Redondas, A., and Karppinen, T.: EuBrewNet – A European Brewer network (COST Action ES1207), an overview, Atmos. Chem. Phys. Discuss., https://doi.org/10.5194/acp-2017-1207, in review, 2018. a
Siani, A. M., Benevento, G., and Casale, G. R.: Temperature dependence of Brewer UV measurements at Rome station, in: Proceedings Volume 5156, Ultraviolet Ground- and Space-based Measurements, Models, and Effects III, San Diego, United States, https://doi.org/10.1117/12.505389, optical Science and Technology, SPIE's 48th Annual Meeting, 2003. a
Weatherhead, E., Theisen, D., Stevermer, A., Enagonio, J., Rabinovitch, B., Disterhoft, P., Lantz, K., Meltzer, R., Sabburg, J., DeLuisi, J., Rives, J., and Shreffler, J.: Temperature dependence of the Brewer ultraviolet data, J. Geophys. Res.-Atmos., 106, 34121–34129, https://doi.org/10.1029/2001JD000625, 2001. a