the Creative Commons Attribution 4.0 License.
the Creative Commons Attribution 4.0 License.
Kinetically controlled glass transition measurement of organic aerosol thin films using broadband dielectric spectroscopy
Yue Zhang
Shachi Katira
Andrew Lee
Andrew T. Lambe
Timothy B. Onasch
William A. Brooks
Manjula R. Canagaratna
Andrew Freedman
John T. Jayne
Doug R. Worsnop
Paul Davidovits
David Chandler
Glass transitions from liquid to semi-solid and solid phase states have important implications for reactivity, growth, and cloud-forming (cloud condensation nuclei and ice nucleation) capabilities of secondary organic aerosols (SOAs). The small size and relatively low mass concentration of SOAs in the atmosphere make it difficult to measure atmospheric SOA glass transitions using conventional methods. To circumvent these difficulties, we have adapted a new technique for measuring glass-forming properties of atmospherically relevant organic aerosols. Aerosol particles to be studied are deposited in the form of a thin film onto an interdigitated electrode (IDE) using electrostatic precipitation. Dielectric spectroscopy provides dipole relaxation rates for organic aerosols as a function of temperature (373 to 233 K) that are used to calculate the glass transition temperatures for several cooling or heating rates. IDE-enabled broadband dielectric spectroscopy (BDS) was successfully used to measure the kinetically controlled glass transition temperatures of aerosols consisting of glycerol and four other compounds with selected cooling and heating rates. The glass transition results agree well with available literature data for these five compounds. The results indicate that the IDE-BDS method can provide accurate glass transition data for organic aerosols under atmospheric conditions. The BDS data obtained with the IDE-BDS technique can be used to characterize glass transitions for both simulated and ambient organic aerosols and to model their climate effects.
- Article
(6104 KB) - Full-text XML
-
Supplement
(196 KB) - BibTeX
- EndNote
Aerosol particles have important climate and health effects because they can scatter sunlight, form clouds by acting as cloud condensation nuclei (CCN), alter visibility, and affect human health (Hallquist et al., 2009; Jimenez et al., 2009). Recent studies have confirmed that organic aerosols, which comprise approximately half of the total submicron aerosol mass in the atmosphere, can change from liquid to glassy state at ambient humidity levels and temperatures (Zobrist et al., 2008; Virtanen et al., 2010; Shrestha et al., 2014; Zhang et al., 2015). The effect of temperature may be especially important when aerosol particles are lifted into the free troposphere, where the temperature change can rapidly alter their phase from liquid to glass (Koop et al., 2011). The physical state of the aerosol strongly influences air quality and aerosol climate effects. Evidence suggests that secondary organic aerosols, formed through oxidation of gas phase organic compounds, have much lower vaporization rates than previously assumed, which changes the reactivity of the gas phase species as well as their fate in the atmosphere. The phase state of aerosol particles also influences the diffusion of the gas phase species into the atmosphere, affecting the oxidation extent and multiphase reactions of the particles. For example, Shiraiwa and Seinfeld (2012) used models to predict that when aerosol particles are in certain semi-solid and glassy phase states, the reactive uptake of gas phase species will be kinetically limited. Kuwata and Martin (2012) showed that the phase state of secondary organic aerosols (SOAs) affects the uptake of ammonia into the particles. Zhang et al. (2018) provided experimental and modeling evidence that the reactive uptake of isoprene-derived epoxydiols (IEPOX) into acidic sulfate particles is influenced by the phase state, which can contribute to at least a 30 % reduction in isoprene-derived SOAs in the southeastern USA.
The phase state of the aerosols also affects their climate properties. For example, in the glassy state, the water vapor uptake by the SOAs is greatly reduced, limiting the ability of particles to have liquid water condense on them and thus hampering the formation of liquid cloud droplets (Shiraiwa et al., 2011; Zobrist et al., 2011; Price et al., 2015). However, there is evidence that glassy SOAs are effective ice nucleation agents. Their ability to nucleate ice crystals to form cirrus clouds in the upper troposphere may be particularly important given the key role of these clouds in global warming (Wilson et al., 2012; Berkemeier et al., 2014). A lack of adequate data describing these processes contributes to the high uncertainty of atmospheric aerosol impact on climate change (Shiraiwa et al., 2017).
The importance of the phase state of organic aerosols in the evaluation of their climate effects has motivated several studies in this field. However, these studies are difficult to perform and the data obtained so far are limited. Renbaum-Wolff et al. (2013) studied the phase state and viscosity of the water-soluble part of α-pinene SOAs at several humidity levels and phase separation effects. Zhang et al. (2015) characterized the viscosity of α-pinene SOAs across a wide range of relative humidity levels. Rothfuss and Petters (2017) studied the viscosities of sucrose particles with sodium dodecyl sulfate (SDS) particles up to 107 Pa under subfreezing temperature regimes. There have also been a few studies exploring the glass transition temperature of atmospherically relevant organic compounds by using differential scanning calorimetry (DSC) (Koop et al., 2011; Lienhard et al., 2012; Dette et al., 2014; Dette and Koop, 2015).
Despite past studies, very little information is available on how organic aerosols become glass as temperature and the rates of cooling and heating change. This information is required to model the aerosol phase when aerosols are transported from one region of the atmosphere to another (Murray et al., 2010; Wilson et al., 2012). In an early 2011 study Koop and co-workers performed experiments that led them to estimate glass transition temperature (Tg) values of 268–290 K for a range of surrogate biogenic SOA compounds by utilizing the DSC method. The results show that oxidation and/or oligomerization reactions leading to higher oxygen to carbon ratios (O : C) yield higher Tg values. Dette et al. (2014) used the “metastable aerosol by the low temperature evaporation of solvent” (MARBLES) technique to provide information on the glass-to-liquid transition temperatures of pure organic compounds and organic–inorganic binary mixtures. Their results show that the glass transition temperatures of these mixtures can be accurately described by the Gordon–Taylor equation, which describes the glass transition of binary mixtures. However, to evaluate the impact of SOAs and its possible phase transitions on climate and air quality issues, the current techniques need to be improved in order to adapt to the atmospheric aerosol sampling requirements.
The small particle size and relatively low concentration of SOAs in the atmosphere make it difficult to measure atmospheric SOA glass transitions using conventional methods. First, a reliable measurement of glass transitions with currently used techniques requires a relatively large mass, typically milligram levels of the compound, while reasonable field collection methods yield organic aerosols in the femtogram mass range (Dette et al., 2014; Dette and Koop, 2015). Second, it is difficult to collect suspended aerosols and transfer them to the analysis apparatus without contaminating the sample with trace water. Trace amounts of water absorbed by SOAs can substantially alter glass transition properties (Bateman et al., 2015; Price et al., 2015; Rothfuss and Petters, 2017; Shiraiwa et al., 2017). To circumvent these difficulties, we have adopted a new technique for measuring glass-forming properties of atmospherically relevant organic compounds. The technique combines broadband dielectric spectroscopy (BDS) utilizing interdigitated electrodes (IDE) (Chen et al., 2012) with organic aerosol sample deposition using electrostatic precipitation (Liu et al., 2013).
BDS is one of the most widely used techniques for measuring the dynamics and glass transition of liquids and semi-solids (Richert, 2014). In the usual arrangement, dielectric spectroscopy instruments consist of two parallel metallic plates with the sample filling the space between the plates. As was stated, the traditional dielectric method usually requires mass in the milligram range for the measurement (Richert, 2014). Such high mass loading cannot be reasonably attained with aerosol collected under normal atmospheric conditions. A relatively new technique, using IDE, which requires only one surface for samples and requires mass only in the femtogram range (Chen et al., 2012), is suitable for atmospheric aerosol phase studies. A thin film is deposited on the IDE first, then the dielectric spectra are recorded to characterize the glass transition of aerosol particles at variable cooling or heating rates.
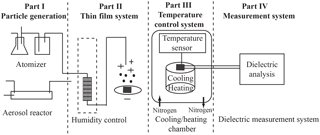
Figure 1A schematic diagram of the experimental setup and procedure. The experimental approach consists of four parts: aerosol generation, thin-film deposition using an electrostatic precipitator, the temperature control system, and the broadband dielectric spectroscopy measurement system.
The purpose of this study is to demonstrate the new IDE-BDS analysis technique by presenting results of the glass transition of SOA surrogates using this technique. In Sect. 2 below, we first describe the experimental setup including aerosol generation, thin-film deposition on the IDE, temperature conditioning chamber, and the BDS measurement system. Then data analysis, including glass transition determination, is discussed in Sect. 3. Section 4 includes a discussion of the advantages of the IDE-BDS method, as well as caveats associated with its current implementation.
A schematic diagram of the experimental setup is shown in Fig. 1. The setup is conveniently divided into four parts: (1) aerosol sample generation, (2) thin-film formation via electrostatic precipitation on the interdigitated electrodes (IDE) with associated humidity control, (3) temperature conditioning chamber, and (4) a broadband dielectric spectroscopy measurement system.
2.1 Aerosol generation
Two types of aerosol generation systems are used in our experiments. The first is a home-made self-nucleation generation device used for producing liquid organic aerosol samples including glycerol, 1,2,6-hexanetriol, di-n-butyl phthalate, and dioctyl phthalate. About 0.5 g of the glycerol is placed at the bottom of a round flask and the temperature of the flask is heated to 20 ∘C below the boiling temperature of the organic liquid. A condenser is connected to the top of the flask to cool the temperature of that region. A flow of 2 liters per minute (L min−1) of dry air passes through the condenser and brings the aerosol particles to the region where the aerosols are precipitated onto the IDE.
The second method utilizes a commercial unit (TSI, 3076) to generate atomized citric acid aerosols. About 0.5 g of citric acid is dissolved in 100 mL of high-purity water to form the atomizing solution. About 30 psi pressure of dry air is applied on one end of the atomizer to generate a constant 3 L min−1 aerosol-containing flow to the second part of the system, which is the thin-film generation system that will be described below.
2.2 Interdigitated electrode (IDE) and thin-film formation
An IDE (NIB003744, MS-01/60, NETZSCH Instrument North America) is used in this study as a substrate for measuring the dielectric constants of organic materials. The IDE consists of two thin electrodes that are interdigitated together like entwined finger tips, as shown in Fig. 2. Each interdigitated pair serves as a small capacitor for dielectric analysis. The thin electrodes are made from platinum (Pt) and are arrayed on a quartz substrate. The electrodes utilized in this study are spaced 1 µm apart and are able to withstand temperatures up to 200 ∘C. The combination of multiple interdigitated pairs of electrodes greatly enhances the sensitivity of the technique compared to a single pair of electrodes that would have been used in the conventional technique.
An electrostatic deposition method is used to deposit organic films on the IDE (Liu et al., 2013). The electrostatic precipitator has one inlet and one outlet. A stream of aerosolized oxygenated organic liquid droplets to be studied is passed through an inlet with a high voltage corona discharger (−5000 V) so that all the droplets are negatively charged to varying degrees. The flow is directed above the substrate held at +3000 V within the precipitator. Due to opposite charges, the charged particles are electrostatically deposited onto the substrate and gradually merged together to form thin films. The remaining flow is then withdrawn from the precipitator and flows through a HEPA filter connected to a pump. The flow rate through the precipitator is maintained between 1.7 and 1.9 L min−1. Depending on the amount of aerosol material being deposited onto the surface, the deposition can either remain as discrete aerosol droplets or, at higher droplet depositions, form a uniform thin film, as shown in Fig. 2. For this study thin films are formed. The volume concentration of the aerosol particles at the inlet of the precipitator was 4.5 × 10¹¹ nm3 cm−3. After collecting for 5 h, the film thickness is estimated to be 1–2 µm on a 1 mm × 8 mm substrate based on the difference in volume concentration between the inlet and the outlets of the precipitator, the flow rate, the collection time, and assuming 50 % collection efficiency.
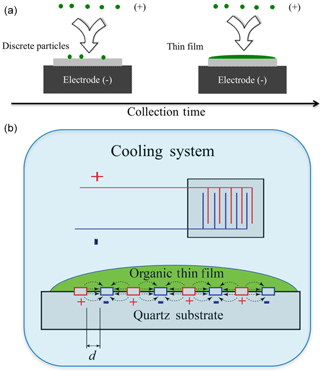
Figure 2A schematic diagram of the key experimental setup. Panel (a) shows the formation of organic thin films though electrostatic deposition. Panel (b) shows the working principle of broadband dielectric spectroscopy (BDS) with an interdigitated electrode sensor. A compound is placed on an array of interdigitated electrodes with a periodic voltage, and the compound's impedance is recorded.
2.3 Temperature conditioning chamber
The IDE substrate coated with organic material is then transported to the temperature conditioning chamber using tweezers. The temperature conditioning chamber consists of a stainless steel cap and a heating–cooling surface using either a liquid nitrogen cooler or a heating furnace. The sample temperature can be controlled from ∼ −150 to +200 ∘C. Details of the chamber are shown in Fig. 1. The cooling/heating rate can be varied from 1 to 25 K min−1. The chamber is flushed with dry nitrogen gas to reduce the relative humidity (RH) prior to temperature conditioning. A K-type thermocouple is located on top of a reference cell inside the conditioning chamber to monitor sample temperature. The typical cooling cycle starts around 20 ∘C and ends at about −140 ∘C, while the heating cycle starts at −140 ∘C and ends at 30 ∘C. The cooling and heating cycle is adjusted to the desired cooling and heating rates between 2 and 10 K min−1.
2.4 Broadband dielectric spectroscopy (BDS) measurement system
The BDS instrument used in this study is manufactured by NETZSCH Inc. (DEA 288 model). A periodic signal from the instrument is applied to the IDE electrodes. The frequency of the signal ranges from 10−3 Hz to 1 MHz. The data acquisition part of the instrument then measures the impedance, Zsample, of the sample as a function of the applied frequency. The impedance measurement yields the capacitance of the sample on top of the IDE. By measuring the impedance of the uncoated and organic-coated IDE, three IDE capacitances can be obtained; i.e., when the IDE is uncoated, Zempty, when it is coated with organic compounds, Zcoated, and the geometric capacitance of the IDE without any substrate, Zgeo. Approximate values of the real and imaginary parts of the sample permittivity, εsample, can be obtained using Eq. (1) (Chen et al., 2012):
For demonstration and data comparison purposes, we have used glycerol, 1,2,6-hexanetriol, di-n-butyl phthalate, and dioctyl phthalate (99 %, Sigma Aldrich, St. Louis, MO, USA) as the test compounds for homogeneous nucleation and citric acid (99 %, Sigma Aldrich, St. Louis, MO, USA) as the surrogate organic aerosol generated by atomizing solutions. For atomizing solutions, the surrogate compound is mixed with high-purity water. All reagents were used as provided without further purification.
3.1 Calculating relaxation time τ
The thin film on the IDE is usually cooled at a selected cooling rate and then heated back to 30 ∘C. After a cooling–heating cycle, the dielectric constant at each temperature measured, ε (ω), is recorded by instrument. The relaxation time, τ, can be obtained by curve fitting the Havriliak–Negami equation of the real and imaginary parts (ε′(ω) and ) with the frequency ω, as shown in Fig. 3 (Chen et al., 2012). The detailed equation for ε′(ω) and is shown in Eqs. (2) and (S1) in the Supplement. At each temperature, the dielectric spectra often show peaks at specific frequencies, designated as dielectric relaxation peaks. Different peaks give different τ values after fitting Eq. (2) with the data points.
with , where εs is the permittivity at lower frequency, ε∞ is the permittivity at the high-frequency limit, α, β are fitting parameters, and τ is the characteristic relaxation time of the medium (Adrjanowicz et al., 2009; Chen et al., 2012).
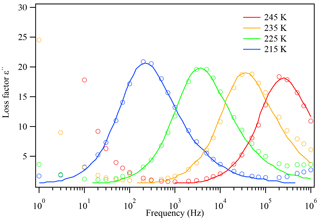
Figure 3The dielectric relaxation spectrum of glycerol at different temperatures. The open circles are measured experimental data and the solid lines are literature data from Chen et al. (2012). As temperature decreases, the dielectric peaks shift towards lower frequencies, indicating that the relaxation timescale increases.
Logτ is then plotted as a function of the inverse of the temperature to further examine how relaxation time changes as a function of temperature. The error bar represents twice the standard deviation of the fitting result. The resulting curve can be used to calculate the glass transition temperature of the compound, as described in Sect. 3.2.
3.2 Glass transition determination
The glass transition temperature is defined as the temperature at which a compound changes from liquid to glass. Several methods have been used to indirectly determine the glass transition temperatures. A common way to calculate the glass transition temperature using BDS is to measure relevant parameters and to calculate the dielectric relaxation τ described in Sect. 3.1 at several equilibrium temperatures T, and then plot logτ as a function of 1000∕T. The data points are fitted using the Vogel–Fulcher–Tammann (VFT) formula (Vogel, 1921; Fulcher, 1925; Tammann and Hesse, 1926). The glass transition is customarily defined as the temperature at which τ=100 s in the fitted curve (Chen et al., 2012; Richert, 2014). The result usually agrees with the DSC measurement within a few degrees (Richert, 2014). However, the method is limited, because not all compounds become glass as τ=100 s (Saiter et al., 2007; Bahous et al., 2014). Furthermore, this method does not take into account kinetic effects on glass transition, specifically the effect of cooling and heating rates (Elmatad et al., 2009, 2010; Keys et al., 2013; Limmer and Chandler, 2014; Hudson and Mandadapu, 2018), as the glass transition temperature changes with cooling and heating rates.
The method used in our studies is based on dynamical facilitation theory (Elmatad et al., 2009; Chandler and Garrahan, 2010; Keys et al., 2011, 2013; Hudson, 2016; Hudson and Mandadapu, 2018), which also takes into account the effect of cooling rate on the glass transition. According to this theory, as a compound is cooled and transitions from a liquid to a supercooled liquid, it exhibits super-Arrhenius relaxation given by the following equation:
where J is an energy scale intrinsic to each material related to the rate of motion of individual molecules, To is termed the “onset temperature” and refers to the temperature at which a liquid showing Arrhenius relaxation becomes a supercooled liquid showing super-Arrhenius relaxation, and τ0 is a temperature-independent reference timescale of the order of the time taken for molecules to locally rearrange (Keys et al., 2011).
As temperature further decreases, the supercooled liquid becomes glass-like, exhibiting Arrhenius behavior. The temperature at which the supercooled liquid changes to glass is the glass transition temperature of the compound at the specific cooling rate studied. As the sample is continuously cooled at a specific cooling rate, the dielectric relaxation peaks can be generated as a function of the sample temperature. The experimentally obtained data are plotted in the form logτ vs. 1∕T. The data obtained at the higher temperature range are fitted to the super-Arrhenius function and the data obtained at the lower temperature range are fitted to the Arrhenius function. Figure 4 shows a typical relationship between the dielectric relaxation timescale and the temperature, as a compound is cooled down or warmed up between the liquid state and glassy state. As illustrated in Fig. 4, the kinetically controlled glass transition temperature (or the true glass transition temperature) is the temperature at the intersection of the two functions. The traditional method determines the glass transition temperature as shown in dashed lines where τ=100 s. Depending on the compound, the true glass transition temperature may not be the same as the glass transition temperature determined by using τ=100 s, as shown in Sect. 4 below. The uncertainty of the glass transition temperature is estimated based on varying the fitting parameters of the super-Arrhenius curve and Arrhenius line within a 1σ range.
For glycerol, measurements of glass transitions were taken at three cooling rates: 2, 5, and 10 K min−1. At each cooling rate the compound is cooled from approximately 300 to 125 K, while the dielectric peaks are measured simultaneously as a function of temperature. The organic film is thin enough so that its temperature reaches equilibrium with the cooling/heating medium, reducing the errors caused by heat transfer within the sample itself. These measurements are difficult to take with conventional techniques due to slow heat transfer in large mass samples, which often leads to inaccurate results. The effect of cooling rates on glass transition measurements will be discussed in the following section.
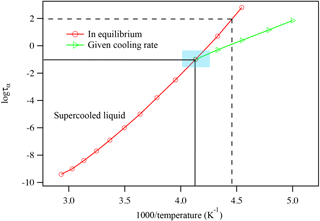
Figure 4An illustrated plot of the relationship between dielectric relaxation timescale and temperature. The logarithm of the relaxation is plotted against inverse T, i.e., logτ vs. 1000∕T. By linking the data points together, one can plot the super-Arrhenius curve (red) and the Arrhenius line (green). Using a consistent cooling rate, the intersection of the two regions identifies the compound's glass transition temperature, as indicated by the blue-shaded region. The intersection of the two black lines represents the glass transition point. The intersection of the two black dashed lines shows the glass transition temperature determined using the traditional method of identifying the temperature when τ=100 s.
4.1 Glass transition temperature of selected organic compounds
Aerosols are generated by two methods in this study, and in each method, we measured the glass transition of a compound that has been studied in the literature. Glycerol, 1,2,6-hexanetriol, di-n-butyl phthalate, dioctyl phthalate, and citric acid particles were generated through the homogeneous nucleation method or the atomizer method. The measured dielectric spectra of each compound show distinct relationships between their dielectric relaxation timescales with a 5 K min−1 cooling rate, as shown in Fig. 5. This is a confirmation of the expected behavior.
Table 1Glass transition temperatures for selected organic species measured by broadband dielectric spectroscopy with a thin-film interdigitated electrode array.
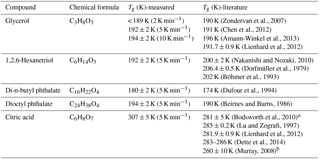
a The data were based on modeling result. b The data were based on extrapolation of a fit to the data.
By calculating the corresponding temperature when the super-Arrhenius curve intersects with the Arrhenius curve, the glass transition of each compound can be derived. As is shown in Table 1, the kinetically controlled glass transition data agree well with previously measured literature values of glycerol (Zondervan et al., 2007; Chen et al., 2012; Amann-Winkel et al., 2013), 1,2,6-hexanetriol (Dorfmüller et al., 1979; Böhmer et al., 1993; Nakanishi and Nozaki, 2010), di-n-butyl phthalate (Dufour et al., 1994), dioctyl phthalate (Beirnes and Burns, 1986), and measured values are mostly within 4 % of the cited literature value, except for one study by Dorfmüller et al. (1979). The comparison of the dielectric relaxation timescale of glycerol measured in this study with literature values is shown in Fig. S1 in the Supplement for several different temperatures. The results show that our measurements match the previously published results in the super-Arrhenius region when the compound is in equilibrium at a given temperature, with almost identical values. As the temperature continues to drop, glycerol and other compounds we tested fall out of equilibrium and become glass, which exhibits Arrhenius behavior. The transition from super-Arrhenius to Arrhenius behavior in this study provides the kinetically controlled glass transition as the compounds change from liquid to glassy state.
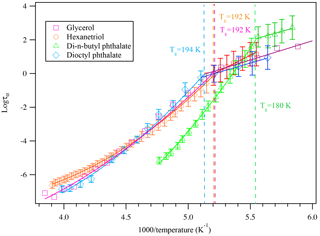
Figure 5A plot of superimposed data points and curves constructed for glycerol, 1,2,6-hexanetriol, di-n-butyl phthalate, and dioctyl phthalate cooled at 5 K min−1. The solid colored lines represent the fitted curves for the super-Arrhenius and Arrhenius region. The intersection between the two lines indicates the kinetically controlled glass transition region for each compound. The glass transition at a 5 K min−1 cooling rate for each compound is shown in the plot.
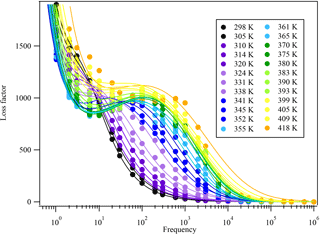
Figure 6The dielectric relaxation spectrum of citric acid at different temperatures. The solid circles are measured experimental data and the solid lines are fitted curves parameterized from Eq. (S2) and Adrjanowicz et al. (2009).
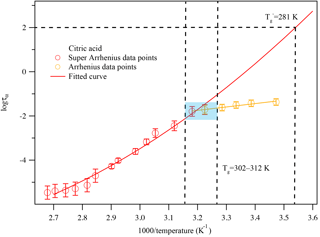
Figure 7A plot of superimposed data points and curves constructed for citric acid warmed at 5 K min−1. The solid colored lines represent the fitted curves for the super-Arrhenius and Arrhenius region. The blue-shaded area shows the glass transition region. The two vertical black lines associated with the blue-shaded area indicate the corresponding temperature range where the super-Arrhenius curve intersects with the Arrhenius line. The traditional glass transition temperature, i.e., the temperature when τ=100 s, is also marked.
For citric acid, there is no dielectric measurement available. The kinetically controlled dielectric spectra fitted using Eq. (S2) are shown in Fig. 6. From the fitting results in Fig. 6, the dielectric relaxation timescales τ are derived as a function of temperature, as shown in Fig. 7. The kinetically controlled glass transition temperature derived from Fig. 7 agrees reasonably well (within 10 % error) with four literature results (Lu and Zografi, 1997; Bodsworth et al., 2010; Dette et al., 2014; Lienhard et al., 2014). The fifth set of literature data (Murray, 2008) is based on extrapolation of a fit to experimental data and is about 20 K lower than other values reported by the literature. The differences can be explained by the following reasons: (1) to date there have been no measurements of the dielectric spectra for citric acid to our knowledge. The citric acid references in Table 1 are based on DSC measurements, which may not be in exact agreement with the dielectric measurement. Angell (2002) pointed out that there are at least three different definitions of the glass transition and the Tg determined by each can be 50 K different from each other. DSC uses heat capacity changes to measure the glass transition while dielectric relaxation uses molecular movements to define the glass transition. Due to the difference in measurement parameters and the definition of the glass transition, these two measurements can provide different Tg values of the same compound by up to 10 K (Shinyashiki et al., 2008). (2) This study focuses on the kinetically controlled glass transition temperature at a given cooling rate, i.e., the transition between the Arrhenius and super-Arrhenius relaxation regimes to determine the glass transition temperature. If the more conventional method, i.e., fitting the super-Arrhenius curve to obtain the glass transition temperature when τ=100 s, is applied to the data, as shown in Fig. 7, the obtained glass transition temperature would be 281 ± 3 K, which is within 1 % difference compared with the two nearest literature values. However, as previous publications have pointed out (Keys et al., 2013; Bahous et al., 2014; Limmer and Chandler, 2014; Hudson, 2016), using the transition from super-Arrhenius to Arrhenius region is likely to reflect the true glass transition when taking kinetic factors, such as cooling and heating rates, into consideration. (3) Moreover, glass transition data on citric acid are rather limited and there are differences between each study. For instance, from the literature data, the differences between three reported glass transition temperatures are up to 10 %, which is about the same difference obtained by comparing our data to the other two nearest literature results. (4) The heating and cooling rates may also contribute to the difference in the Tg of citric acid between the literature and this study, as this study uses a lower cooling rate than the ones reported by the literature. Moynihan et al. (1974) reported that a change from 2 to 10 K min−1 cooling rate could alter the glass transition temperature of borosilicate by 15 K. It is possible that citric acid is a less fragile liquid, similar to borosilicate; i.e., the glass transition temperature depends strongly on cooling or heating rates. Therefore, the difference herein is likely due to including kinetic considerations such as heating/cooling rates in the measurement of the glass transition. We report the citric acid glass transition temperature as 307 ± 5 K at 5 K min−1 warming rate, which is likely a more accurate way of reflecting the glass transition, as the kinetic process is considered, as shown in Fig. 7.
Even though the issues listed above are likely to be the primary reasons leading to a ∼ 10 % difference in the glass transition temperature of citric acid between our results and the literature, the following factors may play a role: (1) atomizing the citric acid solution and redepositing citric acid particles via electrostatic precipitation could introduce impurities during the atomization process that may affect the glass transition temperatures; (2) the glass transition of citric acid was measured during a warming cycle. A fast nonrecordable cooling cycle at 20 K min−1 was performed prior to warming in order to inhibit the citric acid crystal formation. The hysteresis effect will lead to an increase in the glass transition temperature from the warming cycle compared with data obtained from the cooling cycle (Wang et al., 2011); (3) Lu and Zografi (1997) have shown that different ways of preparing the citric acid can lead to differences in glass transition measurements. The thicknesses of the thin films are equal to or less than 1 µm, leading to confinement effects and differences in glass transition temperature measured from bulk compounds (Park and McKenna, 2000). The results show that the thin-film IDE-BDS method can accurately measure the glass transition temperatures of various organic compounds that are comparable to the composition of organic aerosols.
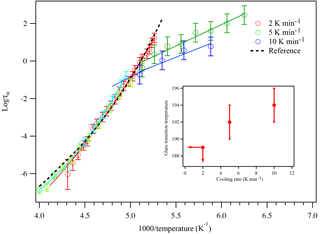
Figure 8A plot of superimposed data points and curves constructed for glycerol cooled at 2, 5, and 10 K min−1. The black dashed line represents literature data from the super-Arrhenius region from Elmatad et al. (2009). The open circles are experimental data and the solid lines are fitting results. The inset shows the glass transition temperature of glycerol as a function of cooling rates. At 2 K min−1 cooling, the glass transition temperature has a higher bound of 189 K.
4.2 The influence of cooling rates on glass transition temperatures
One advantage of this study is the introduction of cooling and heating rates as variables for glass transition temperature measurement for organic compounds. For BDS studies, the glass transition temperature of a compound is often deduced by measuring the sample at a few isothermal temperatures and fitting the curve of temperature and relaxation time in order to identify the temperature when relaxation time corresponds to 100 s. This traditional approach makes it difficult to directly compare the result with glass transition temperatures deduced from DSC studies with variable cooling rates. One of the advantages of our technique is that variable cooling rate measurements are taken on the thin film and the cooling-rate-dependent glass transition temperature of the target species is determined.
The influence of cooling rate on glass transition temperature was carefully examined by repeating the glycerol experiment at two additional cooling rates. The resulting super-Arrhenius curve for each cooling rate is plotted against the Arrhenius lines of that cooling rate, as shown in Fig. 8. As a compound remains in the supercooled liquid stage, the relaxation time is short enough that it is constantly in equilibrium with external perturbations, leading the super-Arrhenius region totally reversible so it should behave the same for all cooling rates. The super Arrhenius part of the data from all three different cooling rates all collapse into one single trend, indicating that the data collected agree well with the theory. The super-Arrhenius curve in Eq. (3) from Elmatad et al. (2009) is also plotted as the black dashed line and it also agrees well with our experimental results. As the cooling continues, the relaxation time gets longer until it cannot keep up with the external temperature change, leading to the compound falling out of equilibrium and forming a glass. Therefore, a faster cooling rate often leads to a quick falling out of equilibrium and a higher glass transition temperature for the compounds studied, as demonstrated in Fig. 8. Based on the intercept of the super-Arrhenius curve and the Arrhenius line, the glass transition temperatures for 5 and 10 K min−1 cooling are determined to be 192 ± 2 and 194 ± 2 K. For 2 K min−1 cooling, because an Arrhenius line does not appear within our range of measurement, the glass transition temperature will likely be lower than 189 K. This study reports an increase of 5 K or more in the glass transition of glycerol as the cooling rate changes from 2 to 10 K min−1. The reported increase in glass transition temperature during these cooling rates agrees with the behavior of sorbitol and fructose in another study performed by Simatos et al. (1996), which also measured the dependence of glass transition temperature on cooling rate with small organic molecules.
Our results agree reasonably well with other studies for the glass transition temperatures of the five compounds chosen. However, there are a couple possible caveats for this study. One is the influence of humidity during the cooling process. Even though dry nitrogen is used to flush through the cooling chamber to remove any extra water vapor present prior to cooling, there is still the possibility that the chamber wall surface can degas and release water vapor to the system during the cooling process. The effect of water vapor on the testing materials is likely to be small but should be considered when the organic compound tested can readily absorb water at low RH conditions. The other potential caveat is the influence of nonequilibrium heat transfer within the thin film on the measurement of the glass transition temperature. Because the sample is being cooled from underneath, the heat transfer between the upper and lower boundaries of the film can lead to uncertainties in measuring the glass transition temperature. The organic thin films made during the experiments are within the micrometer range. Therefore the thermal gradient across the film is small enough to likely be insignificant compared with other systematic errors. Moreover, theoretical models to predict the glass transition of compounds with variable cooling rates are needed in further studies to verify and explain these experimental measurements.
In this work, we have demonstrated a novel method using interdigitated electrodes, broadband dielectric spectroscopy, and electrostatic precipitation together as an efficient and powerful approach for studying the phase and glass transitions of organic particles under various cooling rates. The method is particularly suitable for studying the glass transition of submicron organic particles of which the mass loading is generally too small for other kinds of glass transition measurement techniques. The results from this technique agree well with published studies using other methods. Future publications will report glass transition measurements for simulated SOA mixtures as well as laboratory-produced SOA particles.
The dielectric relaxation peaks of glycerol and four other compounds were recorded, and the logarithm of characteristic relaxation time was calculated and plotted as a function of inverse temperature. The transition between the super-Arrhenius and Arrhenius curves was used to determine the temperature at which the supercooled liquid fell out of equilibrium to become glass, which is defined as the true experimental glass transition temperature. Furthermore, cooling rates are demonstrated to have an effect on the glass transition temperature. By changing the cooling rate from 2 to 10 K min−1, the glass transition temperature increases by at least 5 K for glycerol.
Data used in this paper can be provided upon request by email to Charles Kolb (kolb@aerodyne.com).
The supplement related to this article is available online at: https://doi.org/10.5194/amt-11-3479-2018-supplement.
The authors declare that they have no conflict of interest.
We acknowledge James Brogan, Yatish Parmar, Leonid Nichman, Ranko Richert, Lindsay Renbaum-Wolff, Wade Robinson, Paul Kebabian, Jason D. Surratt, and Andrew Ault for useful discussions and assistance with the experiments.
This material is based upon work supported by the National Science
Foundation Environmental Chemistry Program in the Division of Chemistry
under grant nos. 1506768, 1507673, and 1507642.
Edited by: Joachim Curtius
Reviewed by: two anonymous referees
Adrjanowicz, K., Wojnarowska, Z., Wlodarczyk, P., Kaminski, K., Paluch, M., and Mazgalski, J.: Molecular mobility in liquid and glassy states of Telmisartan (TEL) studied by Broadband Dielectric Spectroscopy, Eur. J. Pharm. Sci., 38, 395–404, https://doi.org/10.1016/j.ejps.2009.09.009, 2009.
Amann-Winkel, K., Gainaru, C., Handle, P. H., Seidl, M., Nelson, H., Böhmer, R., and Loerting, T.: Water's second glass transition, P. Natl. Acad. Sci. USA, 110, 17720–17725, https://doi.org/10.1073/pnas.1311718110, 2013.
Angell, C. A.: Liquid Fragility and the Glass Transition in Water and Aqueous Solutions, Chem. Rev., 102, 2627–2650, 2002.
Bahous, H., Soufi, M. M., Meuret, L., and Benzohra, M.: Relaxation Time at Glass Transition Temperature Measured by Simplex Thermo Stimulated Depolarisation Current, Macromol. Sy., 341, 45–50, https://doi.org/10.1002/masy.201300158, 2014.
Bateman, A. P., Bertram, A. K., and Martin, S. T.: Hygroscopic Influence on the Semisolid-to-Liquid Transition of Secondary Organic Materials, J. Phys. Chem. A, 119, 4386–4395, https://doi.org/10.1021/jp508521c, 2015.
Beirnes, K. J. and Burns, C. M.: Thermal analysis of the glass transition of plasticized poly(vinyl chloride), J. Appl. Polym. Sci., 31, 2561–2567, https://doi.org/10.1002/app.1986.070310815, 1986.
Berkemeier, T., Shiraiwa, M., Pöschl, U., and Koop, T.: Competition between water uptake and ice nucleation by glassy organic aerosol particles, Atmos. Chem. Phys., 14, 12513–12531, https://doi.org/10.5194/acp-14-12513-2014, 2014.
Bodsworth, A., Zobrist, B., and Bertram, A. K.: Inhibition of efflorescence in mixed organic-inorganic particles at temperatures less than 250 K, Phys. Chem. Chem. Phys., 12, 12259–12266, https://doi.org/10.1039/C0CP00572J, 2010.
Böhmer, R., Ngai, K. L., Angell, C. A., and Plazek, D. J.: Nonexponential relaxations in strong and fragile glass formers, J. Chem. Phys., 99, 4201–4209, https://doi.org/10.1063/1.466117, 1993.
Chandler, D. and Garrahan, J. P.: Dynamics on the Way to Forming Glass: Bubbles in Space-Time, Annu. Rev. Phys. Chem., 61, 191–217, https://doi.org/10.1146/annurev.physchem.040808.090405, 2010.
Chen, Z., Sepúlveda, A., Ediger, M. D., and Richert, R.: Dielectric spectroscopy of thin films by dual-channel impedance measurements on differential interdigitated electrode arrays, Eur. Phys. J. B, 85, 1–5, https://doi.org/10.1140/epjb/e2012-30363-0, 2012.
Dette, H. P. and Koop, T.: Glass Formation Processes in Mixed Inorganic/Organic Aerosol Particles, J. Phys. Chem. A, 119, 4552–4561, https://doi.org/10.1021/jp5106967, 2015.
Dette, H. P., Qi, M., Schröder, D. C., Godt, A., and Koop, T.: Glass-Forming Properties of 3-Methylbutane-1,2,3-tricarboxylic Acid and Its Mixtures with Water and Pinonic Acid, J. Phys. Chem. A, 118, 7024–7033, https://doi.org/10.1021/jp505910w, 2014.
Dorfmüller, T., Dux, H., Fytas, G., and Mersch, W.: A light scattering study of the molecular motion in hexanetriol 1,2,6, J. Chem. Phys., 71, 366–375, https://doi.org/10.1063/1.438079, 1979.
Dufour, J., Jorat, L., Bondeau, A., Siblini, A., and Noyel, G.: Shear viscosity and dielectric relaxanon time of dibutyl phthalate down to glass transition temperature, J. Mol. Liq., 62, 75–82, https://doi.org/10.1016/0167-7322(94)00764-0, 1994.
Elmatad, Y. S., Chandler, D., and Garrahan, J. P.: Corresponding States of Structural Glass Formers, J. Phys. Chem. B, 113, 5563–5567, https://doi.org/10.1021/jp810362g, 2009.
Elmatad, Y. S., Chandler, D., and Garrahan, J. P.: Corresponding States of Structural Glass Formers. II, J. Phys. Chem. B, 114, 17113–17119, https://doi.org/10.1021/jp1076438, 2010.
Fulcher, G. S.: Analysis Of Recent Measurements Of The Viscosity Of Glasses, J. Am. Ceram. Soc., 8, 339–355, https://doi.org/10.1111/j.1151-2916.1925.tb16731.x, 1925.
Hallquist, M., Wenger, J. C., Baltensperger, U., Rudich, Y., Simpson, D., Claeys, M., Dommen, J., Donahue, N. M., George, C., Goldstein, A. H., Hamilton, J. F., Herrmann, H., Hoffmann, T., Iinuma, Y., Jang, M., Jenkin, M. E., Jimenez, J. L., Kiendler-Scharr, A., Maenhaut, W., McFiggans, G., Mentel, Th. F., Monod, A., Prévôt, A. S. H., Seinfeld, J. H., Surratt, J. D., Szmigielski, R., and Wildt, J.: The formation, properties and impact of secondary organic aerosol: current and emerging issues, Atmos. Chem. Phys., 9, 5155–5236, https://doi.org/10.5194/acp-9-5155-2009, 2009.
Hudson, A.: Statistical Mechanics and Dynamics of Liquids in and out of Equilibrium, PhD, University of California, Berkeley, USA, 2016.
Hudson, A. and Mandadapu, K. K.: On the nature of the glass transition in atomistic models of glass formers, arXiv, arXiv:1804.03769, 2018.
Jimenez, J. L., Canagaratna, M. R., Donahue, N. M., Prevot, A. S. H., Zhang, Q., Kroll, J. H., DeCarlo, P. F., Allan, J. D., Coe, H., Ng, N. L., Aiken, A. C., Docherty, K. S., Ulbrich, I. M., Grieshop, A. P., Robinson, A. L., Duplissy, J., Smith, J. D., Wilson, K. R., Lanz, V. A., Hueglin, C., Sun, Y. L., Tian, J., Laaksonen, A., Raatikainen, T., Rautiainen, J., Vaattovaara, P., Ehn, M., Kulmala, M., Tomlinson, J. M., Collins, D. R., Cubison, M. J., E, Dunlea, J., Huffman, J. A., Onasch, T. B., Alfarra, M. R., Williams, P. I., Bower, K., Kondo, Y., Schneider, J., Drewnick, F., Borrmann, S., Weimer, S., Demerjian, K., Salcedo, D., Cottrell, L., Griffin, R., Takami, A., Miyoshi, T., Hatakeyama, S., Shimono, A., Sun, J. Y., Zhang, Y. M., Dzepina, K., Kimmel, J. R., Sueper, D., Jayne, J. T., Herndon, S. C., Trimborn, A. M., Williams, L. R., Wood, E. C., Middlebrook, A. M., Kolb, C. E., Baltensperger, U., and Worsnop, D. R.: Evolution of organic aerosols in the atmosphere, Science, 326, 1525–1529, 2009.
Keys, A. S., Hedges, L. O., Garrahan, J. P., Glotzer, S. C., and Chandler, D.: Excitations Are Localized and Relaxation Is Hierarchical in Glass-Forming Liquids, Phys. Rev. X, 1, 021013, https://doi.org/10.1103/PhysRevX.1.021013, 2011.
Keys, A. S., Garrahan, J. P., and Chandler, D.: Calorimetric glass transition explained by hierarchical dynamic facilitation, P. Natl. Acad. Sci. USA, 110, 4482–4487, https://doi.org/10.1073/pnas.1302665110, 2013.
Koop, T., Bookhold, J., Shiraiwa, M., and Pöschl, U.: Glass transition and phase state of organic compounds: dependency on molecular properties and implications for secondary organic aerosols in the atmosphere, Phys. Chem. Chem. Phys., 13, 19238–19255, 2011.
Kuwata, M. and Martin, S. T.: Phase of atmospheric secondary organic material affects its reactivity, P. Natl. Acad. Sci. USA, 109, 17354–17359, https://doi.org/10.1073/pnas.1209071109, 2012.
Lienhard, D. M., Zobrist, B., Zuend, A., Krieger, U. K., and Peter, T.: Experimental evidence for excess entropy discontinuities in glass-forming solutions, J. Chem. Phys., 136, 074515, https://doi.org/10.1063/1.3685902, 2012.
Lienhard, D. M., Huisman, A. J., Bones, D. L., Te, Y.-F., Luo, B. P., Krieger, U. K., and Reid, J. P.: Retrieving the translational diffusion coefficient of water from experiments on single levitated aerosol droplets, Phys. Chem. Chem. Phys., 16, 16677–16683, https://doi.org/10.1039/c4cp01939c, 2014.
Limmer, D. T. and Chandler, D.: Theory of amorphous ices, P. Natl. Acad. Sci. USA, 111, 9413–9418, https://doi.org/10.1073/pnas.1407277111, 2014.
Liu, P., Zhang, Y., and Martin, S. T.: Complex refractive indices of thin films of secondary organic materials by spectroscopic ellipsometry from 220 to 1200 nm, Environ. Sci. Technol., 47, 13594–13601, https://doi.org/10.1021/es403411e, 2013.
Lu, Q. and Zografi, G.: Properties of citric acid at the glass transition, J. Pharm. Sci., 86, 1374–1378, https://doi.org/10.1021/js970157y, 1997.
Moynihan, C. T., Easteal, A. J., Wilder, J., and Tucker, J.: Dependence of the glass transition temperature on heating and cooling rate, J. Phys. Chem., 78, 2673–2677, https://doi.org/10.1021/j100619a008, 1974.
Murray, B. J.: Inhibition of ice crystallisation in highly viscous aqueous organic acid droplets, Atmos. Chem. Phys., 8, 5423–5433, https://doi.org/10.5194/acp-8-5423-2008, 2008.
Murray, B. J., Wilson, T. W., Dobbie, S., Cui, Z., Al-Jumur, S. M. R. K., Mohler, O., Schnaiter, M., Wagner, R., Benz, S., Niemand, M., Saathoff, H., Ebert, V., Wagner, S., and Karcher, B.: Heterogeneous nucleation of ice particles on glassy aerosols under cirrus conditions, Nat. Geosci., 3, 233–237, 2010.
Nakanishi, M. and Nozaki, R.: Dynamics and structure of hydrogen-bonding glass formers: Comparison between hexanetriol and sugar alcohols based on dielectric relaxation, Phys. Rev. E, 81, 041501, https://doi.org/10.1103/PhysRevE.81.041501, 2010.
Park, J.-Y. and McKenna, G. B.: Size and confinement effects on the glass transition behavior of polystyrene/o-terphenyl polymer solutions, Phys. Rev. B, 61, 6667–6676, 2000.
Price, H. C., Mattsson, J., Zhang, Y., Bertram, A., Davies, J. F., Grayson, J. W., Martin, S. T., O'Sullivan, D., Reid, J. P., Rickards, A. M. J., and Murray, B. J.: Water diffusion in atmospherically relevant α-pinene secondary organic material, Chem. Sci., 6, 4876–4883, https://doi.org/10.1039/C5SC00685F, 2015.
Renbaum-Wolff, L., Grayson, J. W., Bateman, A. P., Kuwata, M., Sellier, M., Murray, B. J., Shilling, J. E., Martin, S. T., and Bertram, A. K.: Viscosity of α-pinene secondary organic material and implications for particle growth and reactivity, P. Natl. Acad. Sci. USA, 110, 8014–8019, https://doi.org/10.1073/pnas.1219548110, 2013.
Richert, R.: Supercooled Liquids and Glasses by Dielectric Relaxation Spectroscopy, Adv. Chem. Phys., John Wiley & Sons, Inc., 156, 101–195, 2014.
Rothfuss, N. E. and Petters, M. D.: Characterization of the temperature and humidity-dependent phase diagram of amorphous nanoscale organic aerosols, Phys. Chem. Chem. Phys., 19, 6532–6545, https://doi.org/10.1039/C6CP08593H, 2017.
Saiter, J. M., Grenet, J., Dargent, E., Saiter, A., and Delbreilh, L.: Glass Transition Temperature and Value of the Relaxation Time at Tg in Vitreous Polymers, Macromol. Sy., 258, 152–161, https://doi.org/10.1002/masy.200751217, 2007.
Shinyashiki, N., Shinohara, M., Iwata, Y., Goto, T., Oyama, M., Suzuki, S., Yamamoto, W., Yagihara, S., Inoue, T., Oyaizu, S., Yamamoto, S., Ngai, K. L., and Capaccioli, S.: The Glass Transition and Dielectric Secondary Relaxation of Fructose-Water Mixtures, J. Phys. Chem. B, 112, 15470–15477, https://doi.org/10.1021/jp807038r, 2008.
Shiraiwa, M. and Seinfeld, J. H.: Equilibration timescale of atmospheric secondary organic aerosol partitioning, Geophys. Res. Lett., 39, L24801, https://doi.org/10.1029/2012GL054008, 2012.
Shiraiwa, M., Ammann, M., Koop, T., and Pöschl, U.: Gas uptake and chemical aging of semisolid organic aerosol particles, P. Natl. Acad. Sci. USA, 108, 11003–11008, https://doi.org/10.1073/pnas.1103045108, 2011.
Shiraiwa, M., Li, Y., Tsimpidi, A. P., Karydis, V. A., Berkemeier, T., Pandis, S. N., Lelieveld, J., Koop, T., and Pöschl, U.: Global distribution of particle phase state in atmospheric secondary organic aerosols, Nat. Commun., 8, 15002, https://doi.org/10.1038/ncomms15002, 2017.
Shrestha, M., Zhang, Y., Upshur, M. A., Liu, P., Blair, S. L., Wang, H., Nizkorodov, S. A., Thomson, R. J., Martin, S. T., and Geiger, F. M.: On surface order and disorder of α-pinene-derived secondary organic material, J. Phys. Chem. A, 119, 4609–4617, https://doi.org/10.1021/jp510780e, 2014.
Simatos, D., Blond, G., Roudaut, G., Champion, D., Perez, J., and Faivre, A. L.: Influence of heating and cooling rates on the glass transition temperature and the fragility parameter of sorbitol and fructose as measured by DSC, J. Therm. Anal., 47, 1419–1436, https://doi.org/10.1007/BF01992837, 1996.
Tammann, G. and Hesse, W.: Die Abhängigkeit der Viscosität von der Temperatur bie unterkühlten Flüssigkeiten, Z. Anorg. Allg. Chem., 156, 245–257, https://doi.org/10.1002/zaac.19261560121, 1926.
Virtanen, A., Joutsensaari, J., Koop, T., Kannosto, J., Yli-Pirila, P., Leskinen, J., Makela, J. M., Holopainen, J. K., Pöschl, U., Kulmala, M., Worsnop, D. R., and Laaksonen, A.: An amorphous solid state of biogenic secondary organic aerosol particles, Nature, 467, 824–827, https://doi.org/10.1038/nature09455, 2010.
Vogel, H.: The law of the relation between the viscosity of liquids and the temperature, Phys. Z., 22, 4001983, available at: https://babel.hathitrust.org/cgi/pt?id=mdp.39015020056829;view=1up;seq=7 (last access: 15 June 2018), 1921.
Wang, Y. Z., Li, Y., and Zhang, J. X.: Scaling of the hysteresis in the glass transition of glycerol with the temperature scanning rate, J. Chem. Phys., 134, 114510, https://doi.org/10.1063/1.3564919, 2011.
Wilson, T. W., Murray, B. J., Wagner, R., Möhler, O., Saathoff, H., Schnaiter, M., Skrotzki, J., Price, H. C., Malkin, T. L., Dobbie, S., and Al-Jumur, S. M. R. K.: Glassy aerosols with a range of compositions nucleate ice heterogeneously at cirrus temperatures, Atmos. Chem. Phys., 12, 8611–8632, https://doi.org/10.5194/acp-12-8611-2012, 2012.
Zhang, Y., Sanchez, M. S., Douet, C., Wang, Y., Bateman, A. P., Gong, Z., Kuwata, M., Renbaum-Wolff, L., Sato, B. B., Liu, P. F., Bertram, A. K., Geiger, F. M., and Martin, S. T.: Changing shapes and implied viscosities of suspended submicron particles, Atmos. Chem. Phys., 15, 7819–7829, https://doi.org/10.5194/acp-15-7819-2015, 2015.
Zhang, Y., Chen, Y., Lambe, A. T., Olson, N. E., Lei, Z., Craig, R. L., Zhang, Z., Gold, A., Onasch, T. B., Jayne, J. T., Worsnop, D. R., Gaston, C. J., Thornton, J. A., Vizuete, W., Ault, A. P., and Surratt, J. D.: Effect of Aerosol-Phase State on Secondary Organic Aerosol Formation from the Reactive Uptake of Isoprene-Derived Epoxydiols (IEPOX), Environ. Sci. Technol. Lett., 5, 167–174, https://doi.org/10.1021/acs.estlett.8b00044, 2018.
Zobrist, B., Marcolli, C., Pedernera, D. A., and Koop, T.: Do atmospheric aerosols form glasses?, Atmos. Chem. Phys., 8, 5221–5244, https://doi.org/10.5194/acp-8-5221-2008, 2008.
Zobrist, B., Soonsin, V., Luo, B. P., Krieger, U. K., Marcolli, C., Peter, T., and Koop, T.: Ultra-slow water diffusion in aqueous sucrose glasses, Phys. Chem. Chem. Phys., 13, 3514–3526, https://doi.org/10.1039/C0CP01273D, 2011.
Zondervan, R., Kulzer, F., Berkhout, G. C. G., and Orrit, M.: Local viscosity of supercooled glycerol near Tg probed by rotational diffusion of ensembles and single dye molecules, P. Natl. Acad. Sci. USA, 104, 12628–12633, https://doi.org/10.1073/pnas.0610521104, 2007.


