the Creative Commons Attribution 4.0 License.
the Creative Commons Attribution 4.0 License.
 | 25 Jun 2018
Laboratory and in-flight evaluation of measurement uncertainties from a commercial Cloud Droplet Probe (CDP)
Spencer Faber
Robert Jackson
Laboratory and in-flight evaluations of uncertainties of measurements from a Cloud Droplet Probe (CDP) are presented. A description of a water-droplet-generating device, similar to those used in previous studies, is provided along with validation of droplet sizing and positioning. Seven experiments with droplet diameters of 9, 17, 24, 29, 34, 38, and 46 µm tested sizing and counting performance across a 10 µm resolution grid throughout the sample area of a CDP. Results indicate errors in sizing that depend on both droplet diameter and position within the sample area through which a droplet transited. The CDP undersized 9µm droplets by 1–4 µm. Droplets with diameters of 17 and 24 µm were sized to within 2 µm, which is the nominal CDP bin width for droplets of that size. The majority of droplets larger than 17 µm were oversized by 2–4 µm, while a small percentage were severely undersized, by as much as 30 µm. This combination led to an artificial broadening and skewing of the spectra such that mean diameters from a near-monodisperse distribution compared well (within a few percent), while the median diameters were oversized by 5–15 %. This has implications on how users should calibrate their probes. Errors in higher-order moments were generally less than 10 %. Comparisons of liquid water content (LWC) calculated from the CDP and that measured from a Nevzorov hot-wire probe were conducted for 17 917 1 Hz in-cloud points. Although some differences were noted based on volume-weighted mean diameter and total droplet concentration, the CDP-estimated LWC exceeded that measured by the Nevzorov by approximately 20 %, more than twice the expected difference based on results of the laboratory tests and considerations of Nevzorov collection efficiency.
- Article
(4405 KB) - Full-text XML
- BibTeX
- EndNote


In situ cloud studies often utilize measurements from forward-scattering optical particle counters (OPCs) to provide size and concentration information about cloud hydrometeors up to a few tens of microns in diameter. The Forward Scattering Spectrometer Probe (FSSP; Dye and Baumgardner, 1984) and the Cloud Droplet Probe (CDP; Lance et al., 2010) are forward-scattering OPCs used to measure hydrometeors of 2–50 µm in diameter. These instruments measure the intensity of light scattered from particles transiting an open-path laser and relate that to particle size utilizing Lorenz–Mie theory and assumptions about the particles (typically that they are liquid and spherical). The instruments output measurements as cumulative binned counts of droplet diameter. Some instruments – including certain versions of the CDP, Fast CDP (FCDP), and Fast FSSP (Brenguier et al., 1998) – are also capable of providing the sizes and interarrival times of individual particles. Cloud particle sizes and counts are used to construct size distributions and calculate higher distribution moments.
Several sources may contribute to OPC sizing and counting errors that in turn propagate through to higher moments (Dye and Baumgardner, 1984; Baumgardner et al., 1985; Cooper, 1988; Baumgardner and Spowart, 1990; Brenguier et al., 1998; Schmidt et al., 2004; Wendisch and Brenguier, 2013; McFarquhar et al., 2017). Sizing error can also result in artificial broadening of hydrometeor size distributions, which can mistakenly be attributed to distribution-modifying cloud processes (Baumgardner et al., 1990). The nonlinear relationship between droplet diameter and the intensity of light scattered by a droplet limits the resolution of size bins (Pinnick et al., 1981). The CDP has a default bin width of 2 µm for diameters larger than 14 µm, which can result in as great as 15 % uncertainty in diameter (Nagel et al., 2007). Lorenz–Mie resonance, which is more pronounced for the CDP's unimodal laser, also introduces sizing uncertainty for droplet diameters smaller than 14 µm (Knollenberg, 1976; Nagel et al., 2007).
Laser intensity and droplet scattering angles vary based on droplet transit location (Dye and Baumgardner, 1985; Brenguier et al., 1998). Therefore, droplets are only counted and sized if they pass through the qualified sample area – an elliptical region within the depth of field (DOF) where laser intensity and droplet scattering angles are relatively homogenous. Nonetheless, laser intensity and scattering angles are somewhat variable within the qualified sample area, resulting in counting and sizing error that is dependent on droplet transit location (Brenguier et al., 1998; Wendisch et al., 1996). For the geometry of the CDP, one may expect a variation of 2∘ in collection angles along the DOF, introducing uncertainty as large as 20 % in sizing along the beam (Baumgardner et al., 2017). Uncertainty in collection angles can also be a result of variations in optical component placement for individual probes (Dye and Baumgardner, 1984). The cross-sectional area of the DOF is included in calculations of sample volume, such that errors in the length of the DOF will propagate as a scaling bias in concentration (Wendisch et al., 1996).
Coincidence error is a concentration-dependent phenomenon that occurs when multiple droplets are simultaneously within the sensitive area of an OPC's laser. Coincidence can affect sizing and counting accuracy, but errors can be difficult to characterize because they depend on many factors, including particle concentration, particle size, the location that particles transit the laser, and instrument optical design (Baumgardner et al., 1985; Cooper, 1988; Brenguier, 1988).
Historically, FSSP electronic limitations required an “electronic delay sequence” for a period after particle detection. Particles passing through the sample area during the delay sequence were not detected, resulting in undercounting, or “dead-time losses”, which required algorithmic corrections to FSSP-measured concentration (Baumgardner et al., 1985; Brenguier et al., 1998, 1998; Baumgardner and Spowart, 1990). Improved electronics introduced in the 1990s negated dead-time losses in FSSP measurements. Likewise, dead-time losses do not impact newer OPCs such as the Fast FSSP, CDP, and FCDP.
Forward-scattering OPC measurements requires that several assumptions be made about cloud particles. OPC techniques assume that measured particles are primarily composed of water and therefore have refractive indices equal to that of pure water (Pinnick et al., 1981). Due to the relationship between particle diameters and wavelength of incident radiation used in most OPCs, full Lorenz–Mie theory calculations must be considered to accurately relate particle size to scattered intensity. Particle shape affects scattering behaviour, so it is assumed that liquid hydrometeors are spherical (Nagel et al., 2007). Several researchers have used the FSSP to study ice hydrometeors, but such measurements are subject to uncertainty imposed by the variability in ice particle shape (Gardiner and Hallett, 1985; Field et al., 2003).
In mixed-phase and ice phase cloud, ice particles are prone to shattering on contact with OPC structures. If passed through the sample area, ice fragments can be erroneously identified as natural particles, leading to errors in counting and sizing and an artificial bimodality in hydrometeor distributions (Gardiner and Hallett, 1985; Korolev and Isaac, 2005). FSSP measurements can be greatly affected by shattering artifacts because the probe's laser is housed in a cylindrical shroud (Heymsfield, 2007; McFarquhar et al., 2007). The CDP features an open-path laser that is passed between two arms that are often outfitted with anti-shattering tips. As a result, particle shattering introduces negligible uncertainty in CDP measurements, as demonstrated in work by Lance et al. (2010) and Khanal (2013).
The FSSP and CDP are often calibrated by passing glass microbeads or polystyrene spheres through the sample area. These methods have crude control of calibration media placement and concentration such that they are only capable of testing OPC sizing response. Because these methods have limited control of particle concentration, coincidence can compromise calibrations (Wendisch et al., 1996). Furthermore, the refractive indices for glass and polystyrene differ from that of water, requiring a correction be applied to calibration measurements (Nagel et al., 2007). Wendisch et al. (1996), Korolev et al. (1991), Nagel et al. (2007), and Lance et al. (2010, 2012) developed droplet-generating calibration systems that can produce and precisely place a monodisperse stream of droplets of a known size/frequency at discrete locations within an instrument's sample area. These systems can test locationally dependent sizing/counting accuracy at specific locations throughout an instrument's sample area and in turn provide measurements of sample area dimensions.
This work uses a water-droplet-generating system to assess CDP counting and sizing performance and to provide measurements of sample area dimensions. Seven droplet generator experiments with droplets of 9–46 µm in diameter provide data for detailed evaluations of CDP performance at locations throughout the sampling area of the probe. This work is similar to the earlier work reported by Lance et al. (2010) but utilizes a wider range of droplet sizes over the entire qualified sample area and a much higher resolution of measurements across that area. This in turn provides a more comprehensive estimate of uncertainties associated with droplet sizing throughout the sample area for the entire range of droplet sizes measured by the CDP. Estimates of how errors in sizing and counting affect higher-order moments are provided. Comparisons of in situ CDP-derived liquid water content (LWC) and bulk LWC measurements from a hot-wire device provide an additional means of evaluating probe performance.
The CDP features two forward-protruding arms. One houses a 658 nm unimodal laser diode intended to provide a more uniform distribution of laser intensity compared to the multimodal laser used in the FSSP. The other arm contains a series of collecting optics and photodetectors. As the CDP is flown through cloud, some droplets transit the laser beam projected between the arms of the probe and scatter energy. The collecting optics are designed to capture forward-scattered light over a solid angle of 4–12∘. Collected photons are focused onto a beam splitter that divides the scattered light before passing it to a sizer photodetector that is covered by an 800 µm diameter pinhole mask and a qualifier photodetector that is masked by a rectangular slit. Lance et al. (2010) and Baumgardner et al. (2017) provide optical schematics that demonstrate the operating principles of the CDP. Responses from the two photodetectors are converted to digital counts ranging from 1 to 4095 counts. Sizer responses are used to estimate droplet diameter through Lorenz–Mie theory. A droplet is considered to be within the qualified sample area (or a “qualified droplet”) if the signal from the qualifier is greater than one-half of the signal from the sizer. The CDP uses a rectangular qualifier mask, instead of the circular design found in legacy FSSPs, to more precisely constrain the sample area to regions of relatively homogenous laser intensity (Lance et al., 2010). The CDP employs a dynamic sizer signal threshold in order to minimize false counting events resulting from impinging solar radiation or other sources of noise. This is accomplished by considering all sizer responses within a 10 Hz period that result in fewer than 512 digital counts. A noise band is defined as the region that contains at least 75 % of responses with fewer than 512 counts. Sizing/counting events are rejected if sizer response is less than the determined noise band.
Standard coincidence occurs when multiple droplets are simultaneously within the qualified sample area of a CDP. OPCs are designed to count/measure a single particle at a time so standard coincidence results in undercounting and can also lead to oversizing due to the additional light scattered by coincident hydrometeors (Baumgardner et al., 1985; Cooper, 1988). Because the qualified sample area of the CDP laser is relatively small (of the order of 0.3 mm2), the probability of standard coincidence has been estimated to be less than 5 % for a droplet concentration of 500 cm−3 (Lance et al., 2010).
Originally, the sizer detector was unmasked, meaning that it was sensitive to light scattered by droplets transiting through a region surrounding the qualified sample area, called the extended sample area. Droplets passing through the extended sample area cause insignificant qualifier detector responses, so they are not counted or sized. A specialized form of coincidence, called extended coincidence, occurs when droplets are simultaneously within the qualified and extended sample areas (Lance et al., 2010, 2012). Coincident droplets within the extended sample area scatter additional light that can in turn result in oversizing of qualified droplets. Extended coincidence can also lead to undercounting if sizer response exceeds a threshold value. Lance et al. (2010) used a droplet-generating calibration system to measure the qualified and extended sample areas (SAQ and SAE) using droplets with 12 and 22 µm diameters. The researchers found that SAE can be much larger than SAQ (20.1 vs. 0.3 mm2), resulting in errors from extended coincidence up to 60 % oversizing and 50 % undercounting in concentrations as low as 400 cm−3 (Lance et al., 2010). Results from the 2010 study by Lance et al. motivated the addition of an 800 µm diameter sizer pinhole mask that decreases the size of the extended sample area to ∼ 2.7 mm2, thus reducing the occurrence of extended coincidence (Lance et al., 2012). It was concluded that extended coincidence introduces negligible uncertainty in droplet concentrations less than 650 cm−3 for CDPs featuring the sizer mask modification.
The droplet generator work by Lance et al. (2010) also tested CDP sizing and counting accuracy throughout the qualified sample area (at a spatial resolution of 200 × 20 µm) using 12 and 22 µm droplets. Ten additional tests investigated sizing accuracy at the centre of the qualified sample area using droplet diameters of 8–35 µm. It was shown that droplets are systematically oversized by 2 µm at the centre of the qualified sample area and that sizing accuracy for 12 and 22 µm droplets is dependent upon where droplets transit the qualified sample area. Droplets were undersized by as much as 74 % at certain sample locations and oversized by as much as 12 % at others (Lance et al., 2010). It was found that on average 12 and 22 µm droplets were counted to within 95 % accuracy. Counting error is more severe at the edges of the qualified sample area as a result of photodetector signal noise (Lance et al., 2010).
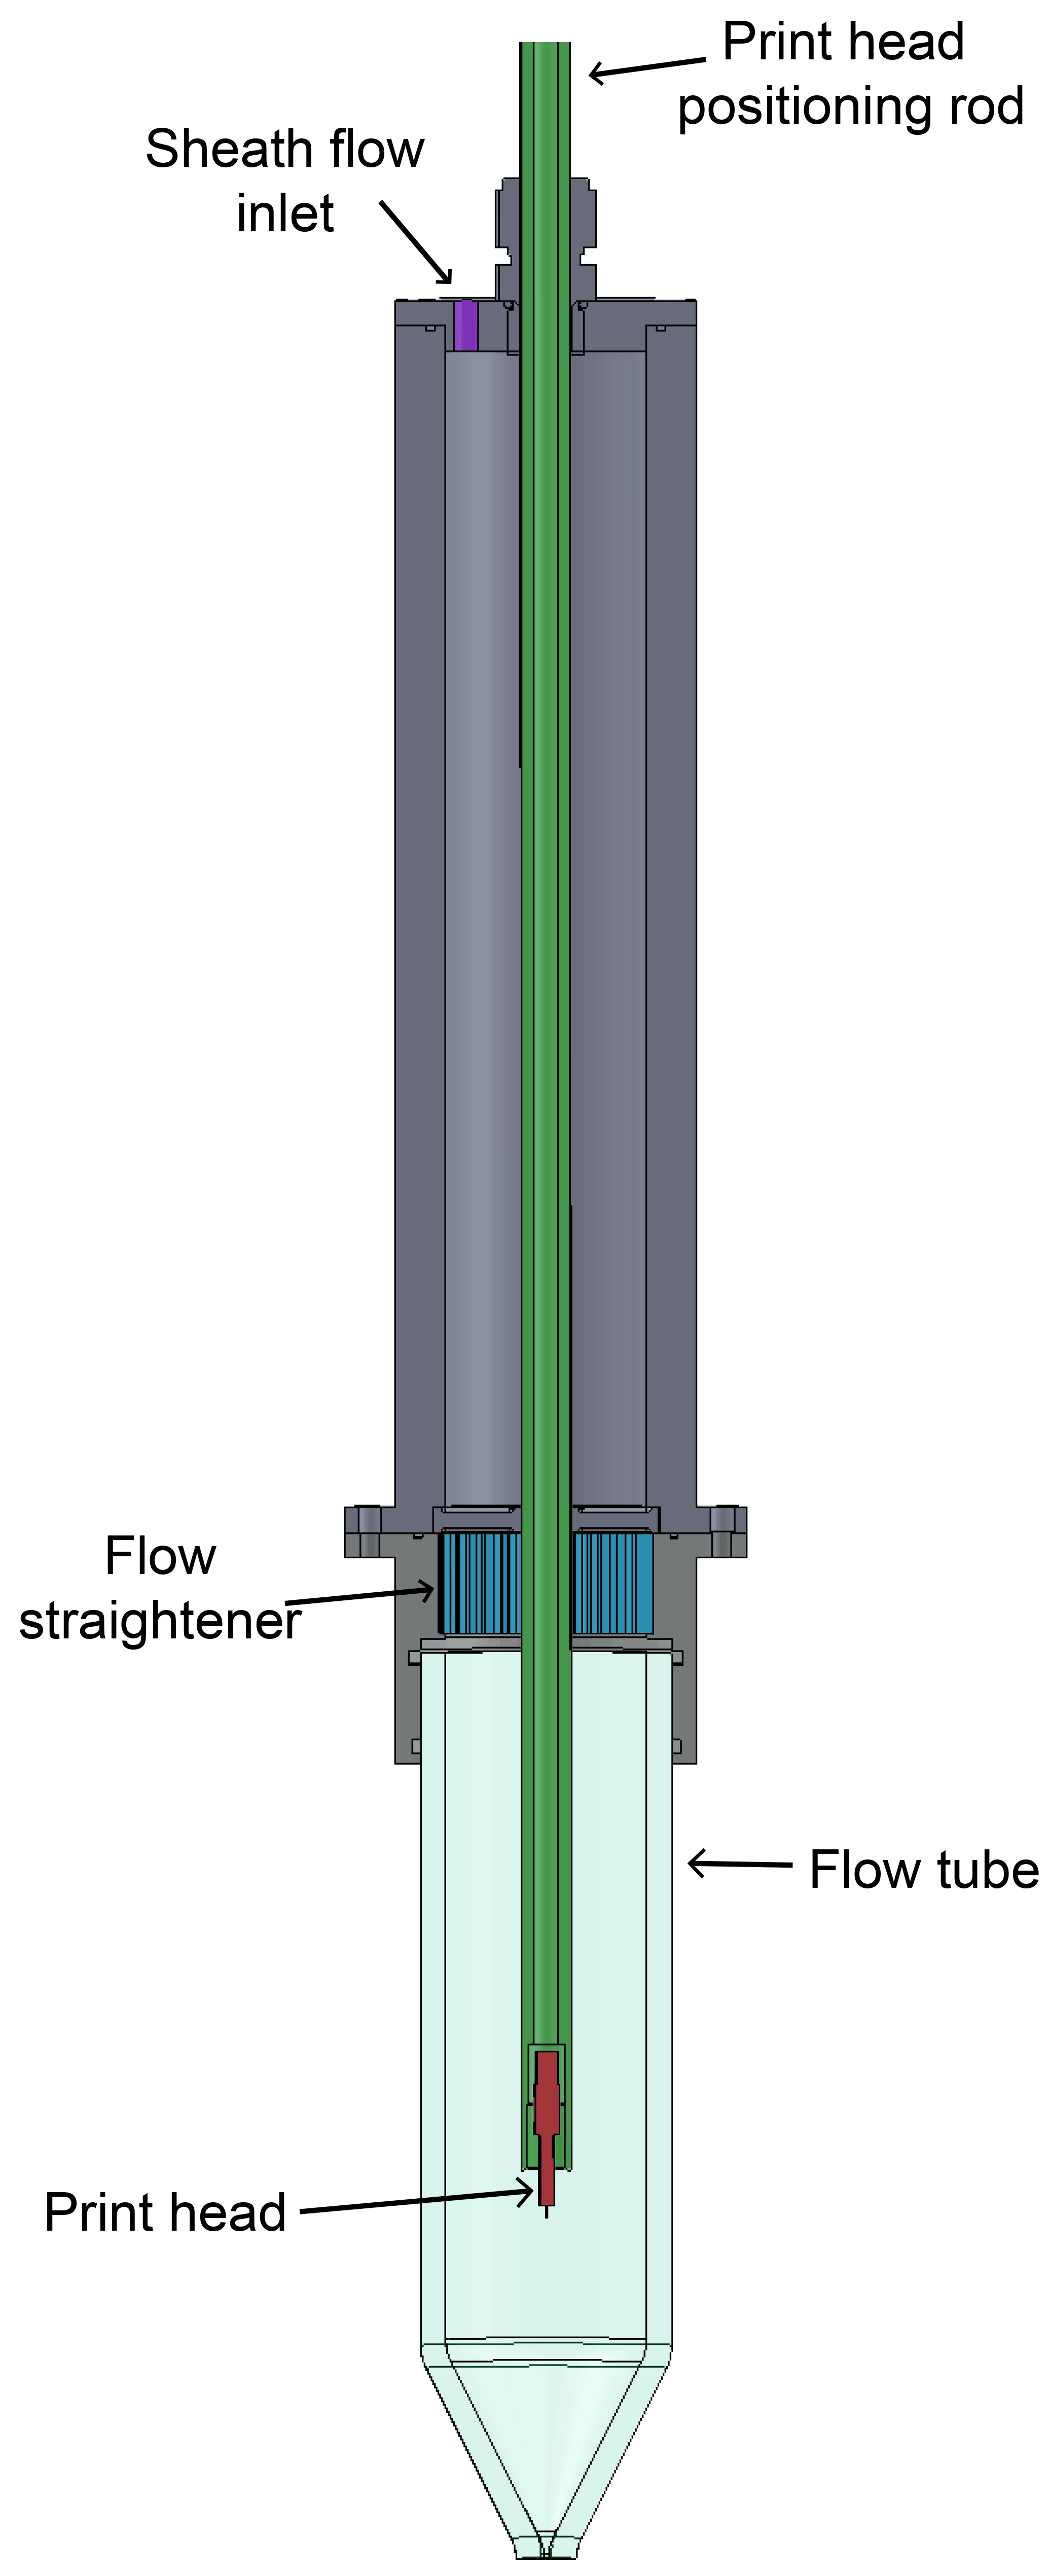
Figure 1Cutaway schematic of the flow tube assembly for the UW droplet generator system with pertinent components labelled.
The University of Wyoming (UW) Atmospheric Science Department developed a droplet-generating calibration system very similar to the system built by Lance et al. (2010, 2012), which is based on work by Korolev et al. (1991), Wendisch et al. (1996), and Nagel et al. (2007). A detailed explanation of the design and operation of a droplet-generating system can be found in Lance et al. (2010). Figure 1 shows a cross-sectional view of the UW droplet generator flow tube assembly. A piezoelectric print head (shown in red) is fixed to the end of the print head positioning rod (green) so that it can produce a consistent stream of droplets within the glass flow tube. Dry air enters the assembly through the sheath flow inlet (purple inlet at the top left) and passes through the honeycomb flow straightener (blue) before entering the flow tube. The sheath flow and suspended droplets travel downward and exit through the tapered region at the end of the flow tube. Here the sheath flow is accelerated, which by extension accelerates and focuses the suspended droplets into a precise stream. The accelerated droplet stream then passes through the CDP's sample area at discrete locations. The CDP is mounted atop a pair of two-axis computer-controlled positioning stages that are used to control the point of droplet injection and provide the coordinates of injection locations.
Droplet size is coarsely adjusted by utilizing print heads with different orifice sizes. Altering droplet residence time within the sheath flow, and thus the degree of evaporation, allows for more precise droplet size adjustments. The print head positioning rod, and by extension the vertical position of the print head, is raised or lowered within the flow tube to vary the droplet residence time and provide fine adjustments to droplet sizes at the point of ejection. During experiments the print head is typically placed 65–120 mm above the flow tube exit.
A high-speed metrology camera outfitted with a 10× microscope objective provides an independent measurement of droplet diameter using the glare technique as described by Korolev et al. (1991), Wendisch et al. (1996), Nagel et al. (2007), and Lance et al. (2010). As droplets pass through the laser of the CDP, the left and right sides of the droplet are illuminated as a result of reflection and refraction. The metrology camera images these illuminated regions (glares), which appear as two parallel lines when using an exposure time of 1 1000 s−1. Estimates of droplet diameter are obtained by considering the pixel separation of glares, a pixel-to-distance conversion, and a formula that accounts for the angle of the camera objective relative to the laser (Wendisch et al., 1996; Korolev et al., 1991). Using this technique, the UW system is capable of determining individual droplet diameters to within ±0.355 µm.
Estimates of droplet velocity are necessary to compare droplet ejection speeds to aircraft airspeeds encountered during research missions and ensure that ejection velocities are within the operational limits of the CDP. The metrology camera is used to estimate droplet velocity by capturing images with exposures of the order of 1 150 000–1 300 000 s−1, which produces glare images with well-defined start and end points. Droplet velocity is estimated by considering glare length, a pixel-to-distance conversion, and exposure time. The longitudinal position of glares can also be used to evaluate droplet placement precision.
Table 1Droplet generator test characteristics including the number of droplets injected at each sample location, longitudinal and latitudinal resolution, test duration, mean droplet diameter from glares (mean Dtrue), and the 5–95th-percentile range of Dtrue. Dtrue statistics are from 80 randomly selected glare images.
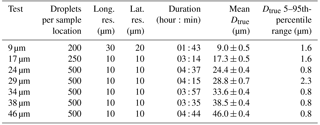
A number of validation tests were performed to ensure that the UW droplet generator can produce droplets of consistent diameter for the amount of time required to conduct a test (∼ 4 h), precisely place droplets at discreet locations within the sample area, and eject droplets at suitable velocities. Seven droplet generator tests that produced droplet diameters of 9–46 µm are used to evaluate accuracy and consistency in droplet diameter. During the course of each test, glare images were captured once every second, and a random sample of 80 images were analysed to provide distributions of true droplet diameter (Dtrue). Table 1 shows that standard deviation of Dtrue is less than 0.7 µm for all seven tests. It also shows that all but one test produce a 5–95th-percentile range of Dtrue less than the 2 µm bin width of the CDP (for droplets larger than 14 µm).
Two tests were conducted that used the deviation of glare position to validate droplet placement precision. To confirm that placement precision is similar along orthogonal axes, glare images of 32 µm droplets were captured for 1 h with the metrology camera placed at 124.9∘ incident to the CDP laser and an additional hour at 214.9∘ incident. Glare position for a random sample of 50 images from each camera angle shows that droplet deviation is similar along orthogonal axes. The absolute deviation of glares is 5.7 µm along both axes, and standard deviations are 1.5 and 1.7 µm for the 124.9 and 214.9∘ camera angles, respectively. A separate experiment tested long-term placement precision by analysing 80 random glare images captured over the course of a 4 h test. Droplet position for the sample has an absolute range of 11.4 µm and a 5–95th-percentile range of 9.3 µm. Approximately 8 % of droplets were placed beyond 10 µm.
Droplet ejection velocity is validated by capturing images using exposure times of 1 150 000–1 300 000 s−1. It was found that, when droplets were created and accelerated in a 13 L min−1 sheath flow, 40 µm diameter droplets crossed the CDP laser at ∼ 32 m s−1. This velocity is only about 30 % of typical University of Wyoming King Air research airspeeds but is greater than the minimum operational airspeed of the CDP (10 m s−1). Droplet exit velocity is limited by turbulence in the vicinity of the flow tube exit, which results in significant deviations of droplet position when sheath flow rate exceeds 13 L min−1.
4.1 Experimental design
To quantify uncertainty in CDP measurements of droplet counting and sizing, seven tests using nominal droplet diameters of 9, 17, 24, 29, 34, 38, and 46 µm provided measurements over most of the size range detectable by the CDP. For each test, droplets were injected at fixed locations through the qualified sample area of the CDP. Droplets were injected at a frequency of 200 Hz for 9 µm droplets and 250 Hz for all other sizes. Following a dwell time at a given location, the position of the droplet injector relative to the CDP sample area was moved a small distance. The tests proceeded in this fashion, injecting droplets throughout the entire qualified sample area of the CDP. The start and end times at each location were recorded. Post-test, 5 Hz data from the CDP were synchronized to match droplet location and CDP measurements.
The time required to complete a full test was in some cases as long as 5 h (see Table 1). Stability of the droplet generator system over this time depends, in part, on the size of droplets being produced. For tests producing droplets with diameters less than about 20 µm, the droplet generator system tended to be less stable, reducing the total time that it could produce drops of a similar size. Thus, for the two tests with droplet diameters less than 20 µm, shorter test periods were required. For the five tests using droplets 24 µm and larger, the dwell time at each sample location was 2 s. This resulted in 500 droplets passing through the CDP sample area at each location. For these same tests, a 10 µm by 10 µm grid of sample locations covered the entire test area, corresponding to 2700 discrete sample locations across the approximately 0.27 mm2 qualified sample area of the CDP. For the test using 17 µm droplets, the dwell time at each location was reduced by a factor of 2, and the grid resolution remained the same. The system was least stable when producing 9 µm droplets and required test times of less than 2 h to ensure consistent droplet sizes and placement throughout the experiment. For this test, dwell time was further reduced such that 200 drops were placed at each location, and the resolution of the grid was reduced to 30 µm by 20 µm, resulting in roughly 450 discrete locations across the qualified CDP sample area.
4.2 CDP sizing
CDP measurements for all droplets detected during a given test were used to produce a distribution of droplet diameters for that test. Droplet distributions were computed using number counts from each of the CDP's 30 pre-determined size bins. Bin widths are 1 µm for diameters less than 14 µm and 2 µm for diameters greater than 14 µm. For each bin, we considered the geometric mean diameter, hereafter referred to as DCDP. Also, for each test, 80 randomly selected droplet glares were analysed to determine a distribution of actual droplet diameters, Dtrue. These droplets, when binned according to CDP size bins, resulted in a distribution of droplets, .
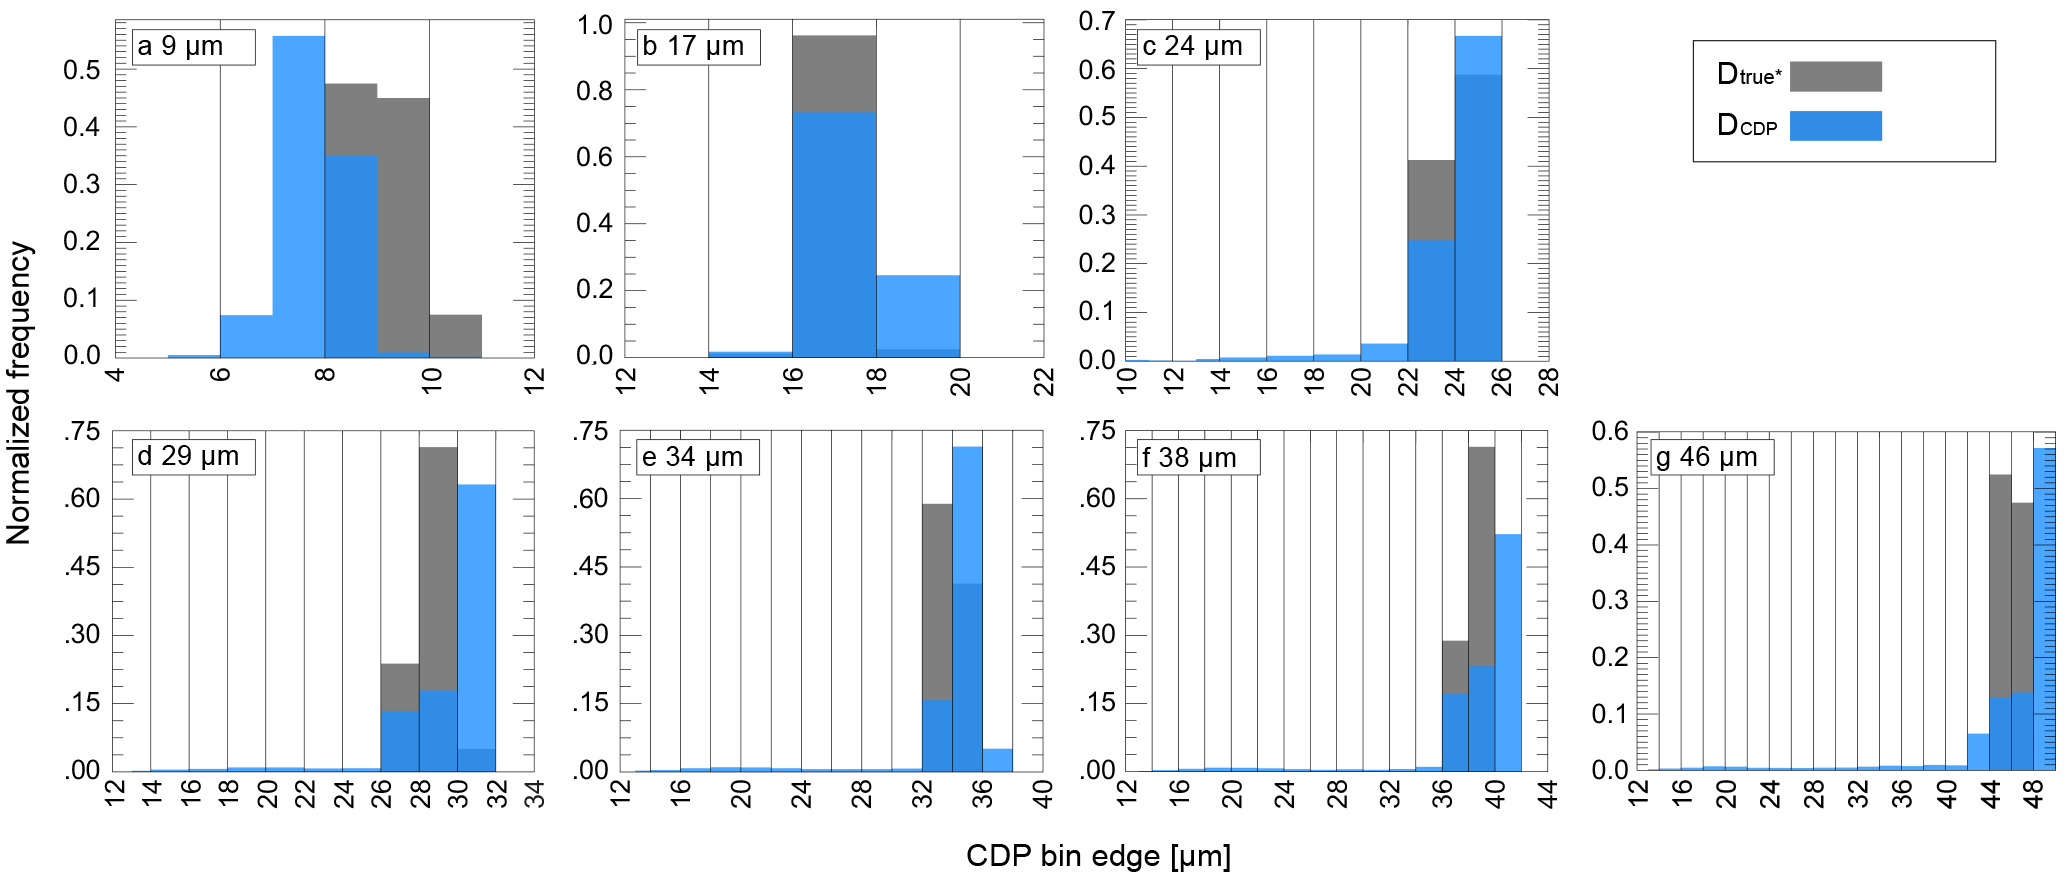
Figure 2Normalized distributions of droplet diameter from 80 random glares rounded to the geometric mean of CDP size bins () in grey and CDP-recorded diameter (DCDP) from all responses during each test in blue. Nominal droplet size used for each test is indicated in upper left corner.
Figure 2 shows distributions of normalized frequency for DCDP and for each of the seven tests. In general, the mode diameter of the distribution based on sizing from the CDP (DCDP) was within one to two size bins (1 to 4 µm) of the mode. For the test using 9 µm droplets, more than 50 % of the droplets detected by the CDP were placed in the 7.5 µm bin, and another 30 % were placed in the 8.5 µm bin. Nearly 90 % of the randomly selected droplets were determined to have actual diameters between 8 and 10 µm, suggesting that the CDP undersized droplets in this range by about 1 to 2 µm. Table 2 shows that the absolute difference between mean DCDP and mean was 1.3 µm.
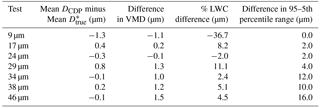
Table 2Comparisons of the difference in several distribution parameters when calculated using CDP-recorded droplet diameter (DCDP) vs. diameter from glares rounded to the geometric mean of CDP size bins (). A positive difference (or positive percent difference) indicates that calculations using DCDP result in a larger value than . Percent LWC difference is calculated by comparing the integrated 3rd moment of normalized DCDP distributions vs. normalized distributions.
Tests using 17 and 24 µm diameter droplets resulted in a better match between DCDP and . For each test, the medians and modes of DCDP and were in the same bin, and more than 95 % of the droplets were contained in the same two bins. However, the breadth of the distribution measured by the CDP was slightly larger than the actual distribution for the 17 µm test. For the 24 µm test, the distribution measured by the CDP was skewed to smaller sizes. For both tests, absolute differences between the means of the distributions were less than 1 µm (Table 2).
For the 29, 34, 38, and 46 µm diameter tests, a steady trend of oversizing with increasing droplet diameter is apparent when comparing the normalized histograms of DCDP and (Fig. 2). In all cases, the mode diameter from CDP measurements was one bin larger than the true diameter mode. For the largest droplet test, 46 µm, 55 % of the droplet diameters from the CDP fell in the 48 to 50 µm bin, and another 10 % fell in each of the 44 to 46 and 46 to 48 µm bins. More than 95 % of the actual diameters were split roughly equally between the 44 to 46 and 46 to 48 µm bins.
Skewing of the CDP-measured distribution to smaller sizes occurred for all tests using droplets 24 µm and larger. Further, the breadth of the CDP-measured distribution increased with increasing droplet diameter. This is perhaps more apparent from the data in the last column in Table 2. Here we compare the difference between the 5th- and 95th percentile for and DCDP. The difference increased significantly for larger diameter tests. Interestingly, even though the difference in both the mode and median diameters of the CDP-measured distributions (compared to ) were larger for these larger diameters, the absolute difference between the means of the distributions was quite small, roughly 0.1 to 0.2 µm. This is because, with the measured distributions skewed to smaller diameters, comparisons of mean diameters appeared to compare more favourably.
By matching the measured response of the CDP to the expected Lorenz–Mie scattering curve, it is possible to investigate whether the errors in sizing observed from the droplet generator tests may be accounted for by limitations due to Lorenz–Mie resonances or by uncertainty in scattering angle collection. The CDP's nominal collection angles are 4 to 12∘. However, collection angle uncertainty can be introduced by variations in the mounting of optical components and the fact that collection angles vary based on droplet transit location. Baumgardner et al. (2017) showed that a 500 µm variation in the longitudinal transit location of a droplet could alter the outer collection angle by as much as 2∘. However, as will be shown later in this section, locationally dependent sizing errors occur across the beam rather than longitudinally along the beam. One may still find differences in scattering angles across the beam; however, due to the much narrower width of the DOF and the geometry of the optics, impacts on scattering angles should be significantly less, and they should be symmetric about the centre of the beam, at least for perfectly aligned optics. Figure 3 shows that the Lorenz–Mie response curve matches reasonably well with the CDP threshold counts that are used to sort droplets into discrete size bins. Two ranges of scattering angles are considered, and both show similar behaviour. In fact, regardless of which range of angles is considered, the error in sizing is expected to be, on average, nearly the same. Errors in drop sizing for individual drops, however, will vary depending on collection angles.
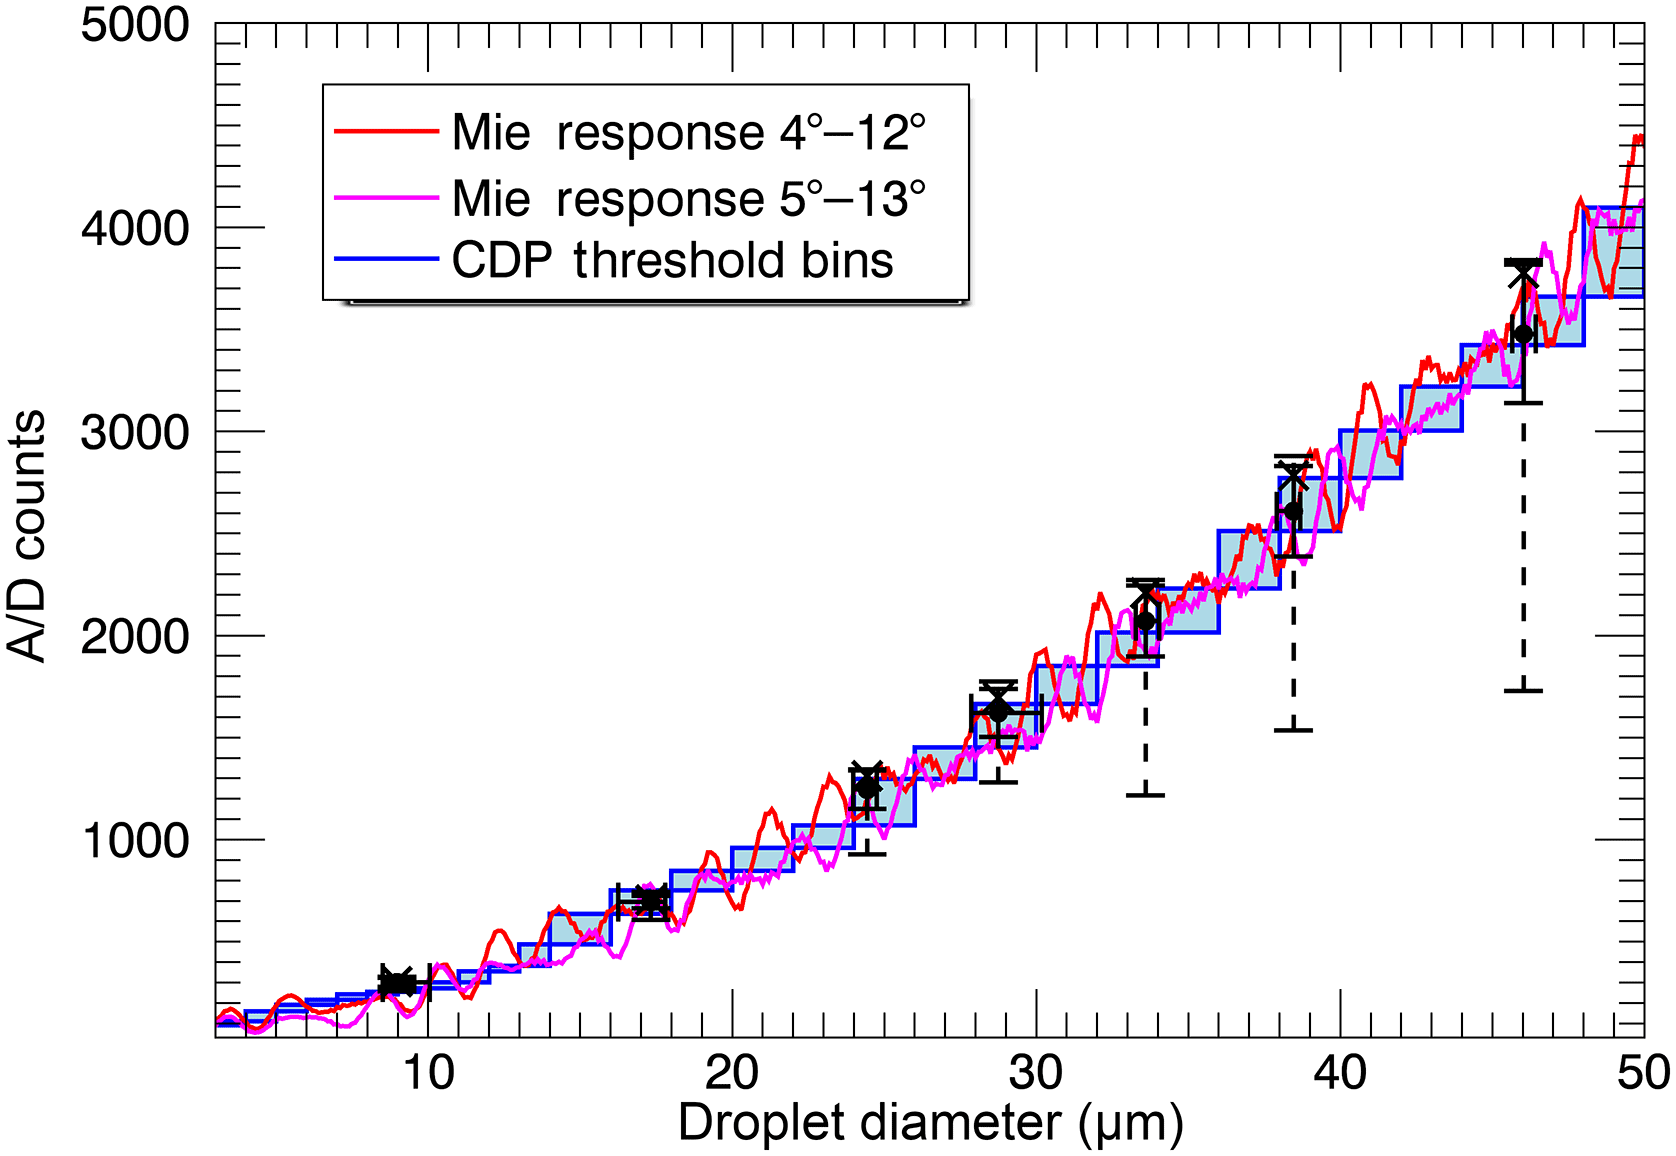
Figure 3Lorenz–Mie response scaled to CDP A/D counts computed for 4–12∘ collection angles (red) and 5—13∘ collection angles overlaid on the CDP A/D threshold (shaded blue) that is used to bin individual drops. Black dots show mean droplet diameter (Dtrue) for the seven droplet generator tests. The horizontal bar with end caps represents the 5–95th-percentile range of Dtrue for each test. The solid (dashed) vertical bar with end caps shows the range of the 25–75th (5–95th)-percentile CDP-measured A/D counts for each test. The vertical location of the black dots (X's) shows the mean (median) A/D counts for each test.
The shaded region in Fig. 3 illustrates the range of threshold counts that the CDP uses to determine the size bin for an individual drop. Regions where the Lorenz–Mie curve(s) lies within the shaded regions are locations where a drop will be sized “correctly”. If the Lorenz–Mie curve is above the shaded region, the drop will be oversized; below the shaded region it will be undersized. The amplitude of the Lorenz–Mie resonances and the locations of the peaks and valleys depend on droplet diameter and vary with collection angles. Generally, the amplitude of the Lorenz–Mie resonances increases with increasing drop size; however, so does the “steepness” of the curve. Therefore larger droplets, 40 to 50 µm in diameter, should not be undersized or oversized by more than about 2 µm. However, smaller droplets less than about 20 µm in diameter may easily be mis-sized by more than 2 µm, accounting for as much as ±20 % error in sizing (Baumgardner et al., 2017).
Results from the droplet generator tests overlaid on Fig. 3 provide additional insight into CDP response. The mean and 5–95th-percentile range of Dtrue illustrate that the droplets being produced nearly all fell within one size bin of the CDP for any given test. The corresponding Lorenz–Mie resonance curves over those same size ranges generally fluctuate over a range of analogue-to-digital (A/D) counts that correspond to threshold values of up to two to three size bins. This can be seen by examining the Lorenz–Mie response (4–12∘) for the test producing 29 µm drops. Over the range of droplet sizes produced, some locations of the Lorenz–Mie curve fall just below the threshold box (for 28–30 µm bin), while others fall slightly above, and still other fall inside the box.
The skewing of CDP-measured distributions to smaller sizes is also apparent by examining the CDP response compared to the threshold curves. For each test, the mean value of A/D counts (Fig. 3) lies either within or very near the appropriate threshold box for that droplet diameter. However, the median value of A/D counts exceeds the threshold box for that droplet diameter for all tests using droplet diameters 29 µm and greater. This suggests that the calibration of the CDP is based upon mean diameter of drops rather than the median or mode diameter. While this may be appropriate, because of the unnatural skewing to smaller sizes, it does have implications on calculations of higher-order moments. The severe undersizing of a small sample of drops for these same tests cannot be explained based on Lorenz–Mie resonance or collection angle considerations.
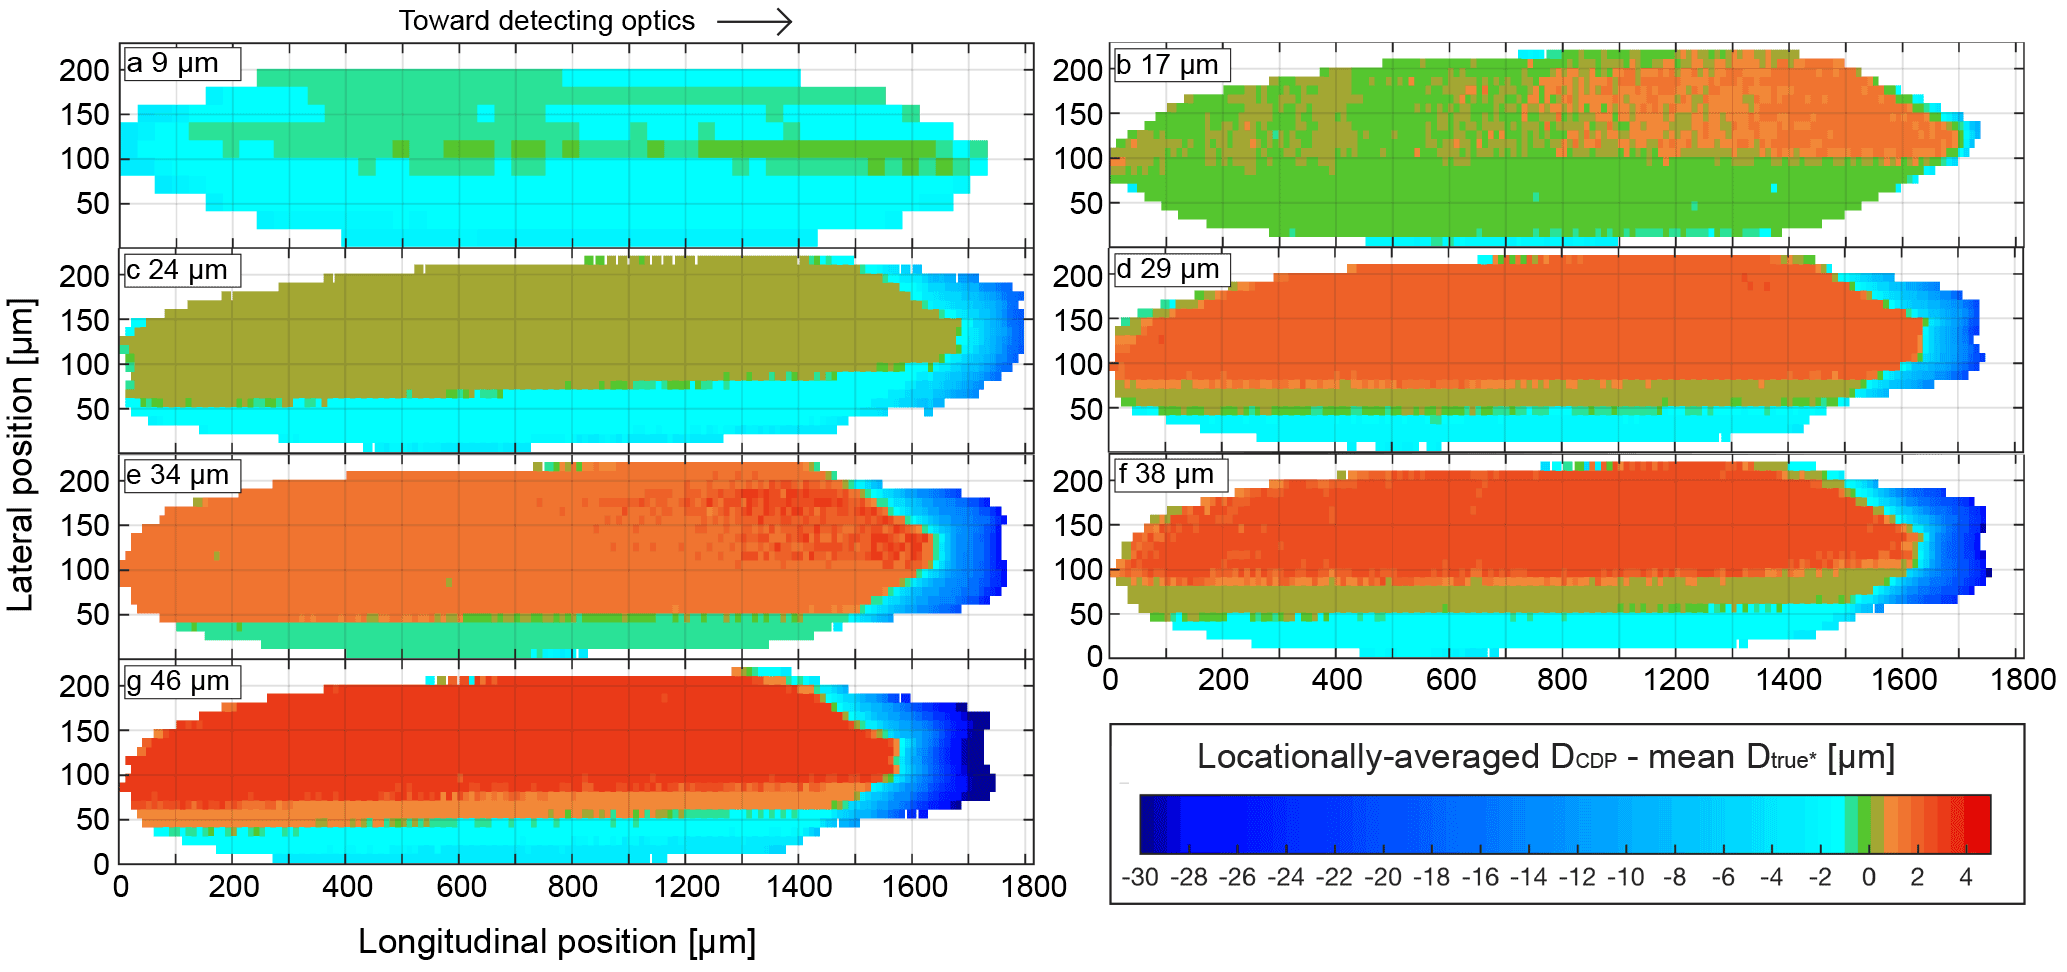
Figure 4Beam maps of spatially dependent sizing accuracy. Colours represent the difference between CDP diameter (DCDP) averaged at each sample location and mean glare diameter rounded to the geometric mean of CDP size bins () from the 80 randomly selected glares. Droplet diameter used for each map is listed in the upper-left corner. The right side of each map is nearest the detecting optics of the CDP.
Figure 4 illustrates sizing from the CDP across the entire qualified sample area. For each sample location, the mean of DCDP is compared to the mean of . A positive difference (warm colours) indicates oversizing by the CDP; negative values (cool colours) indicate undersizing. For the 9 µm diameter tests, undersizing of droplets by 1 to 2 µm was found throughout most of the CDP sample area. Droplets passing through the centre of the beam and laterally towards the top experienced somewhat less undersizing than in other regions. No regions indicated oversizing of droplets. For the 17 µm tests, droplets throughout much of the sample area were sized correctly. In only a small region, laterally towards the top of the beam and towards the detector, were droplets oversized, on average by about 1 µm.
The five remaining droplet tests, 24 µm and larger, all revealed a similar behaviour. In all cases, there was a lateral dependence on sizing from the top to the bottom of the beam along the entire length of the qualified sample area. The magnitude of the sizing difference laterally across the beam increased with increasing droplet size. For the 24 µm test the sizing difference was only about 2 µm across the beam, but for the 46 µm test, the sizing difference was nearly 6 µm across the beam. Also, for each of these five tests, a region near the detector showed significant undersizing of droplets that also increased in magnitude with increasing droplet size. For the 46 µm test, droplets were undersized by as much as 30 µm. This region accounts for the skewing to smaller sizes of the distributions discussed earlier in this section.
Columns three and four in Table 2 provide information about how sizing differences for each test impact higher moments of the droplet size distribution. For the 9 µm test, the volume-weighted mean diameter (VMD) measured by the CDP was 1.1 µm, small compared to that computed from the distribution, resulting in a 36.7 % underestimate in LWC. For the 17 and 24 µm tests, the absolute difference between the actual and measured VMD was less than 0.25 µm and resulted in a roughly 8 % overestimate and 2 % underestimate in LWC for these droplets, respectively. For tests using droplets larger than 24 µm, the CDP oversized VMD from 1 to 1.5 µm, resulting in overestimates of LWC of 2.4–11 %. Readers should note that errors in sizing by a given amount will have a much more significant impact on LWC for smaller droplets. However, for real measurements in cloud, it is often the larger droplets that carry the majority of the liquid mass. Therefore, these middle and larger sizes from 20 µm and greater are expected to have the greatest impact on LWC estimates from the CDP.
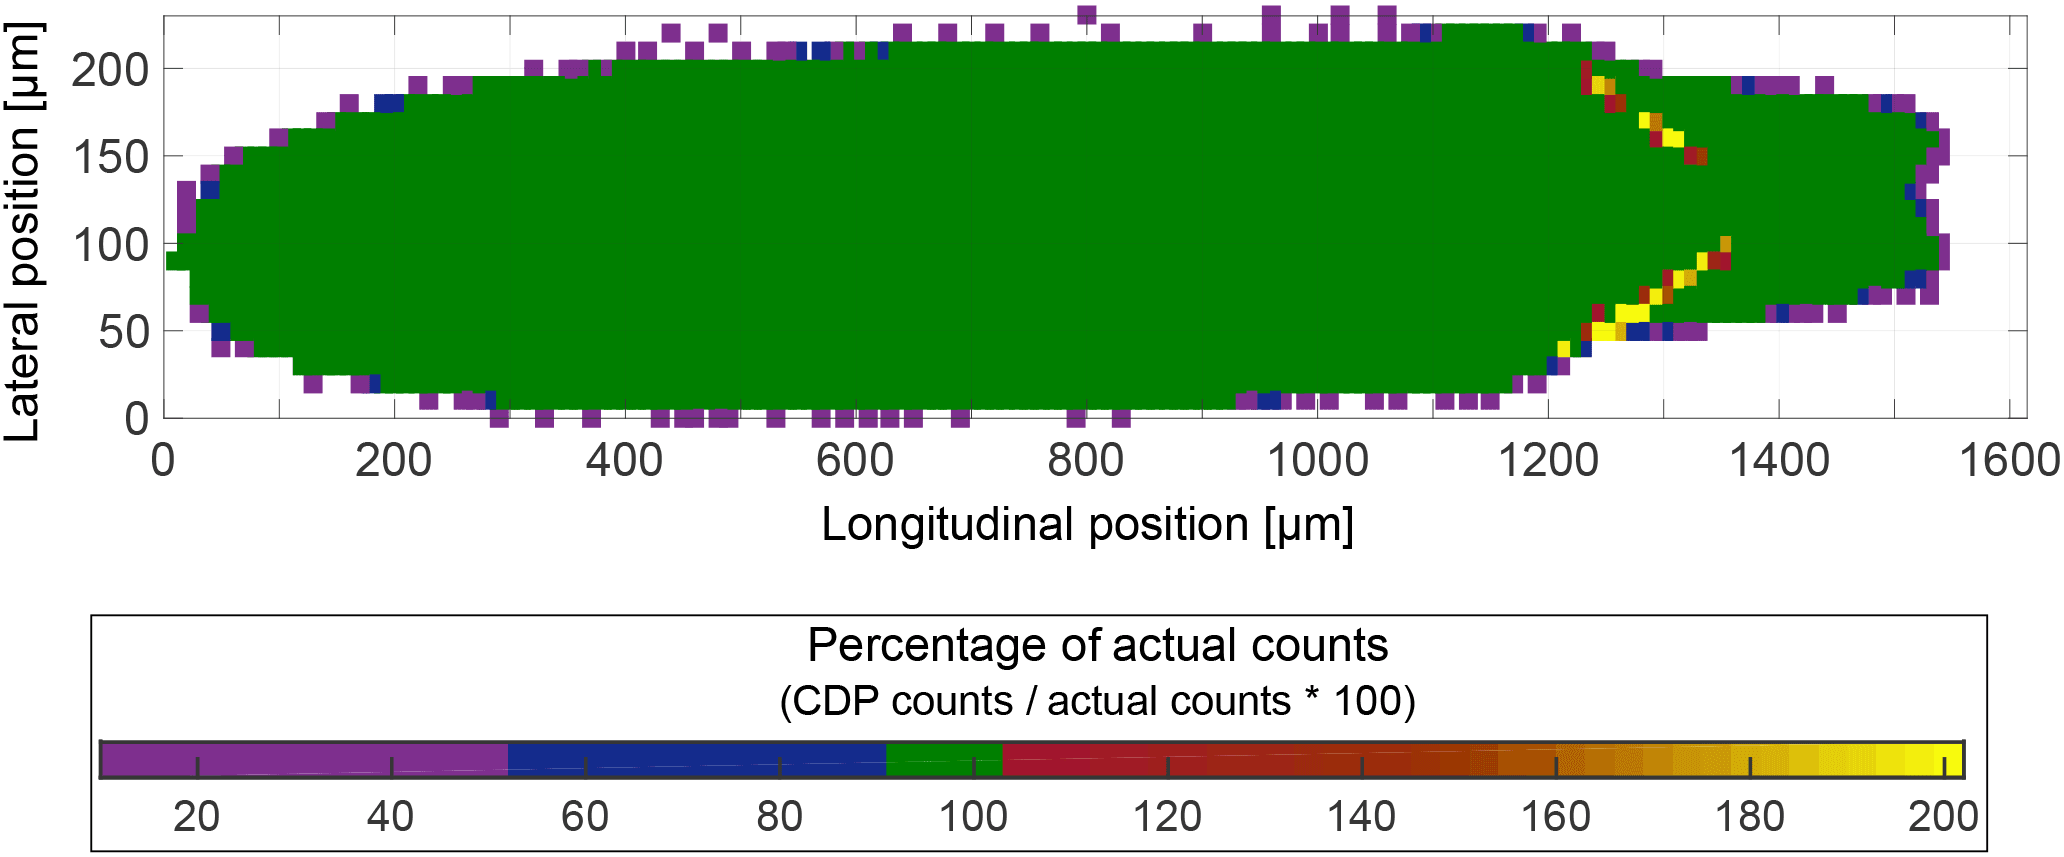
Figure 5Percentage of CDP-recorded counts vs. actual counts (from print head ejection frequency). Purple areas show where at least 10 % of actual counts were reported, blue shows where at least 50 % were reported, and green shows where at least 90 % were reported. Warm colours show areas that received more than 100 % of actual counts.
4.3 Counting accuracy and qualified sample area measurements
Counting accuracy is evaluated by comparing CDP-recorded counts to the actual number of droplets based on print head ejection frequency and dwell time at each sample location. For all tests, droplets are counted to within 98 % accuracy in ∼ 95 % of the sample locations. Experiments indicate that all sizes of droplets are undercounted around the perimeter of the qualified sample area. This behaviour is likely a result of small deviations in droplet placement. Figure 5 shows locationally dependent counting accuracy for 46 µm droplets, where purple areas correspond to locations where the CDP recorded 10–50 % of actual counts, blue shows locations where 50–90 % of actual counts were recorded, and green denotes where at least 90 % actual counts were recorded. Only 46 µm droplets were overcounted, specifically in two isolated regions where droplets were overcounted by as much as 100 %. The regions are located just left of the area where 46 µm droplets were significantly undersized (see Fig. 4g and discussion earlier). Overcounting in these regions contributes to less than 1 % overall count error because they occupy less than 1 % of total SAQ.
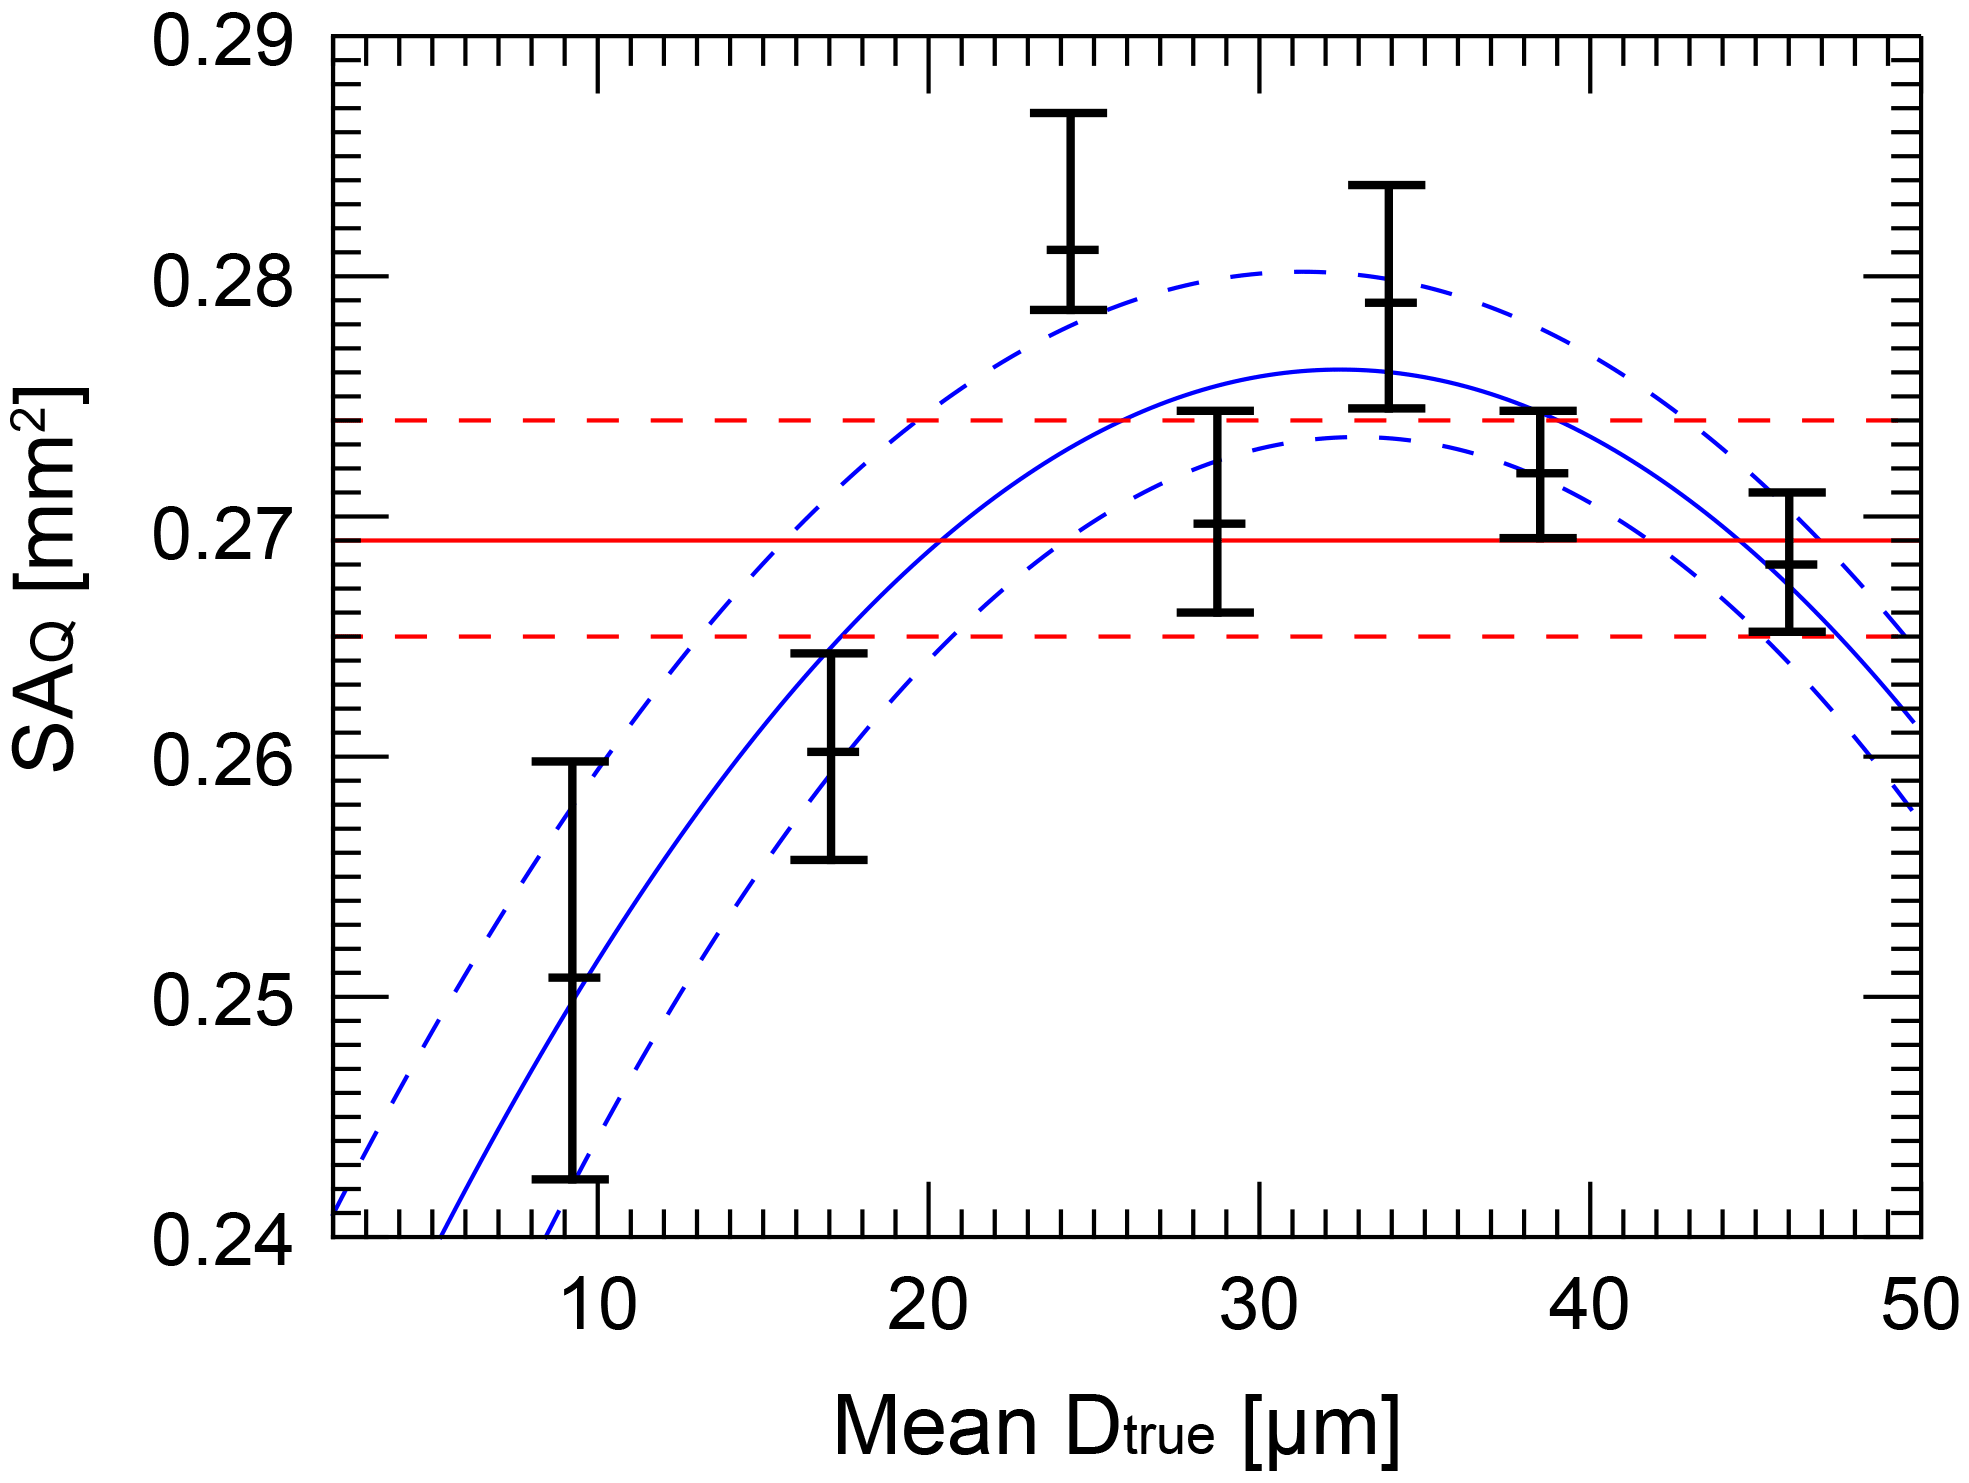
Figure 6Measurements of qualified sample area (SAQ). Horizontal bars represent SAQ calculated using 10, 50, and 90 % true count thresholds. Red lines show mean SAQ for all droplet generator test, and blue lines show a second-degree polynomial fit to SAQ.
Figure 6 shows SAQ calculated by summing the individual areas of sample locations that received a certain percentage of actual counts. SAQ is calculated 3 times for each test by constraining which sample locations are considered to those that received at least 10, 50, and 90 % actual counts (SAQ_10 %, SAQ_50 %, SAQ_90 %). Evaluating SAQ using this count threshold method provides uncertainty ranges of SAQ and accounts for the fact that ∼ 8 % of droplets were placed beyond sample area bounds.
The mean value of SAQ_50 % considering all tests is 0.269 mm2, compared to a value of 0.30 mm2 provided by the manufacturer. SAQ_50 % varies by 0.03 mm2 across the range of droplet diameters tested. It is smallest for 9 and 17 µm droplets, reaches a maximum of 0.28 mm2 for 24 µm droplets, and then decreases to 0.27 mm2 for 46 µm droplets. The range of SAQ_10 % to SAQ_90 % is smallest for the largest droplets, most likely because detector noise is less of a consideration for larger droplets that scatter relatively more light and hence provide a greater detector response. The test using 9 µm droplets shows the greatest difference between SAQ_10 % and SAQ_90 %, but it should be noted that SAQ variability is likely exaggerated by the course spatial resolution used for that experiment.
Table 3Concentration and liquid water content (LWC) for prescribed droplet distributions calculated with fixed and variable qualified sample area thresholded at 50 % actual counts (SAQ_50 %). Fixed SAQ_50 % concentration is not shown because it equals 100 cm−3 for all distributions. Uncertainty is equal to 1/2 the range of each parameter when calculated with SAQ_10 % and SAQ_90 %.
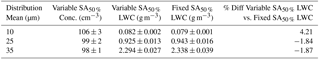
For calculations of number concentration and higher moments, SAQ can be provided by either using a fixed value equal to the mean for all droplet sizes (solid red line in Fig. 6) or by using a variable value based on a second-degree polynomial fit (blue curve in Fig. 6). To explore the impact of employing a fixed vs. variable SAQ, three Poissonian droplet distributions with means of 10, 25, and 35 µm are prescribed. The concentration of each distribution equals 100 cm−3 when calculated with a fixed SAQ_50 % of 0.27 mm2. Table 3 illustrates how using a fixed vs. variable SAQ affects concentration and LWC. It shows that choice of SAQ type most affects concentration and LWC for the distribution with a 10 µm mean diameter. Using a variable SAQ results in 6 % greater concentration and ∼ 4 % greater LWC. For distributions with greater mean diameters, the choice of using a fixed or variable SAQ results in less than 3 % difference in concentration and LWC.
It seems best to calculate higher moments using a fixed SAQ of 0.27 mm2, given that the choice of SAQ type has relatively little impact on concentration or LWC. Furthermore, the second-degree polynomial fit used to model variable SAQ does not completely capture variations in SAQ for droplets with diameters between 20 to 30 µm and requires extrapolation of SAQ for droplets with mean diameter less than 9 µm or greater than 46 µm.
For cloud property studies, closure experiments provide an important means to evaluate uncertainties in one or more cloud microphysical measurements. Here, in situ data collected by aircraft are used to further investigate uncertainty in CDP measurements by comparing LWC derived from CDP measurements to bulk LWC measured by a Nevzorov hot-wire probe. Comparisons of in situ LWC measurements provide an independent evaluation of CDP performance and an indication of how error in real-world CDP measurements compares to laboratory droplet generator results. In our comparisons, we account for known uncertainties in the hot-wire measurements and the uncertainties reported in previous sections of this paper for the CDP.
5.1 The University of Wyoming King Air
The University of Wyoming King Air (UWKA) is a Beechcraft Super King Air modified to carry a variety of atmospheric in situ and remote sensors capable of collecting information about atmospheric thermodynamics, dynamics, and cloud particle properties (Wang et al., 2012). In the following, we utilize measurements from two field campaigns conducted in late 2016 and early 2017. The Precipitation and Cloud Measurements for Instrument Characterization and Evaluation (PACMICE) campaign began in August 2016 and lasted until May 2017, with flights over eastern Wyoming and western Nebraska, USA. It focused on collecting cloud and precipitation measurements in precipitating stratiform and convective systems primarily in the shoulder seasons. The Seeded and Natural Orographic Wintertime clouds – the Idaho Experiment (SNOWIE) occurred during January–March 2017, and focused on wintertime orographic clouds in southwestern Idaho, USA (French et al., 2018). The majority of clouds sampled in both PACMICE and SNOWIE were mixed phase.
5.2 Constant temperature hot-wire probes
The UWKA carries both a LWC-100 and a deep-cone Nevzorov constant temperature hot-wire probe. Both provide estimates of bulk cloud water content utilizing changes in current supplied to heated elements that are exposed to impacts of cloud particles (King et al., 1978; Baumgardner et al., 2017). Element temperature is maintained near 100 ∘C such that impinging particles will vaporize transferring energy from the element through the effects of sensible and latent heating. Control circuitry maintains element temperature by altering the power supplied using element resistance as a proxy for temperature. Measurements of water content are obtained by relating the power required to maintain element temperature as particles are vaporized to the sensible and latent heat capacities of water, and element surface area (King et al., 1978; Korolev et al., 1998).
Convective losses due to moist airflow over the sensor also transfer energy from collector elements and can be quite large at aircraft flight speeds (King et al., 1978; McFarquhar et. al, 2017). The Nevzorov probe features reference elements that are positioned on the devices' trailing edge such that they are aerodynamically shielded from particle impact (Korolev et al., 1998; Strapp et al., 2003). Energy losses from the reference elements are then assumed to arise solely due to convective considerations and thus the total power delivered to the reference elements can be used to estimate the convective heat losses from the sensing (collector) elements. The relationship between collector and reference element convective losses depends on airspeed and density (Korolev et al., 1998; Abel et al., 2014). Data collected during clear air calibration manoeuvres are used to compute the ratio of collector to reference power and determine how the ratio varies with airspeed and density. The manoeuvres are typically flown at several flight levels over a range of airspeeds. Any inaccuracy in the estimate of convective heat losses in the collector sensor based on power delivered to the reference sensor results in baseline drift of the Nevzorov-derived LWC (LWCNEV) measurement (Abel et al., 2014). For the data used herein, the effectiveness of the Nevzorov data processing method was evaluated using ∼ 60 000 out-of-cloud points. LWCNEV residual (i.e. departure from zero when not in-cloud) was used to determine uncertainty in baseline LWC. LWCNEV baseline uncertainty is estimated to be no greater than 0.05 g m−3 (the 5–95th-percentile range of residual LWC) and minimum detectable LWCNEV is +0.02 g m−3 (95th-percentile residual LWC).
The Nevzorov is capable of measuring both LWC and total condensed water content (TWC) using two collector elements with different geometrical designs (Korolev et al., 1998). Estimates of ice water content (IWC) can then be obtained by differencing the two measurements. The LWC element is in the shape of a thin rod designed to only evaporate liquid particles. Ice particles shatter on impact with the sensor and are swept away before significant melting or evaporation can occur (Korolev et al., 1998). The TWC collector has a “deep inverted cone” shape designed to capture both liquid and ice particles (Korolev et al., 2013). Korolev et al. (1998) showed that in mixed-phase conditions, interactions between the LWC collector and ice particles can result in LWC overestimation of the order of 12 % IWC.
In some conditions, collection efficiency may be significantly less than unity, resulting in underestimation of LWCNEV. Because airflow diverges in the vicinity of the LWC collector, LWCNEV may be underestimated by as much as 30 % in droplet populations with VMD less than 8 µm since particles with insignificant mass are unable to cross the divergent streamlines and impact collector elements (Korolev et al., 1998). Collection efficiency also departs from unity for droplets with VMD greater than 30 µm because larger droplets tend to splatter on impact, leading to incomplete evaporation (Schwarzenboeck et al., 2009).
5.3 Dataset overview
Data were used from 29 research flights from both PACMICE and SNOWIE. Measurements from both probes were filtered to 1 Hz. Here we select only those data points in which both LWCNEV and LWCCDP exceeded a threshold value of 0.05 g m−3. To minimize uncertainty due to presence of ice hydrometeors in CDP and Nevzorov LWC measurements, the IWC from the Nevzorov was used to select periods of liquid-phase-only penetrations from PACMICE and SNOWIE missions. However, IWC estimates from the Nevzorov may be affected by as-of-yet uncharacterized sources of uncertainty such that one cannot conclude the dataset used here is completely devoid of mixed-phase penetrations. Nonetheless, uncertainty in LWC resulting from the presence of ice is expected to minimally impact results. LWCNEV is subject to overestimation of less than 12 % IWC, which is often small compared to LWC in mixed-phase cloud (Korolev et al., 1998). It has been also been demonstrated that the CDP is minimally affected by ice-shattering artifacts (Lance et al., 2010; Khanal, 2013).
The resultant data subset used in the comparison contains 17 917 1 Hz in-cloud points. Droplet concentrations encountered during SNOWIE were uncharacteristically low for continental clouds. Mean droplet concentration for the dataset is 113.6 cm−3, with 50 % of data points having concentration less than 50 cm−3. Consequently, droplets were relatively large, with an average VMD of 22.2 µm and 1st and 3rd quartiles of 16.7 and 27.7 µm. Nearly all measurements were taken in supercooled conditions; the environmental temperature range for the 5th and 95th percentile is −18.7 and −1.3 ∘ C.
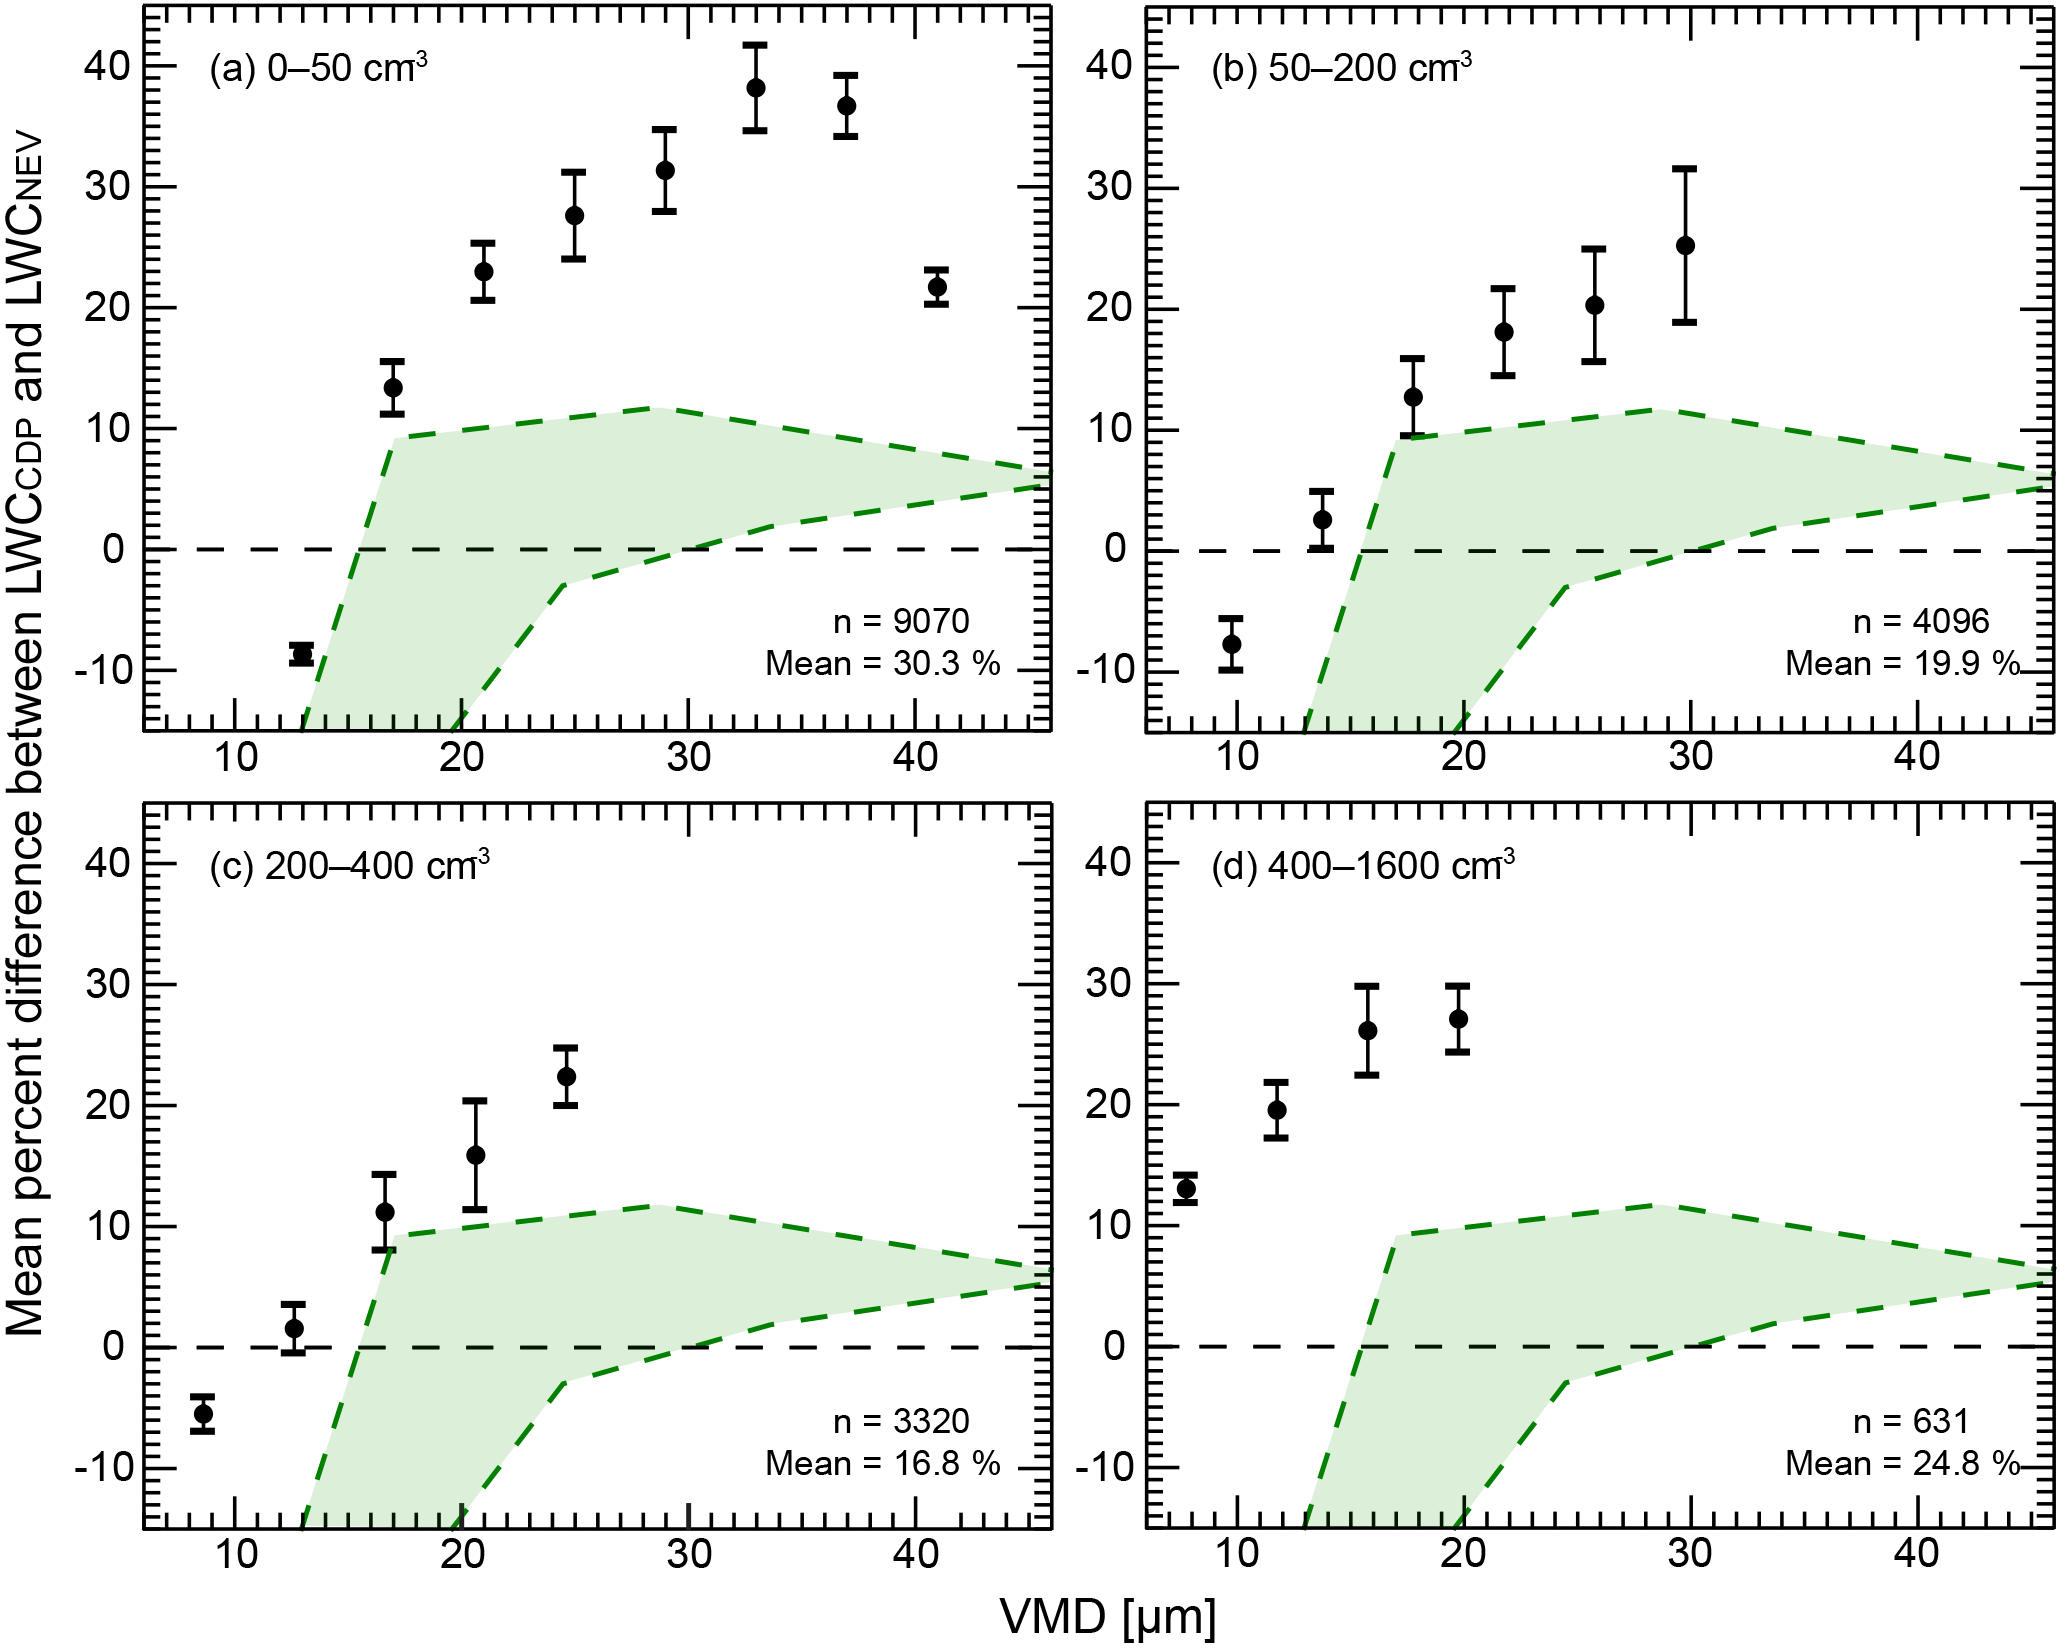
Figure 7Mean percent difference between CDP LWC (LWCCDP) and Nevzorov LWC (LWCNEV) binned by volume-weighted mean diameter (VMD) for four concentration ranges (shown in upper left corner). Mean percent difference is calculated using a linear regression with the intercept forced through the origin. Error bars show root mean square error. Green dashed areas are estimates of percent difference based on droplet generator tests and Nevzorov collection efficiency considerations. The mean percent LWC difference for all data included in each concentration range and the number of data considered (n) are shown in each plot.
5.4 In situ results
For each 1 Hz data point, measured spectra from the CDP were used to compute the total droplet concentration and the VMD of the spectra. The data were first subdivided based on droplet concentration and then further divided based on VMD. For all VMDs larger than 10 µm, LWCCDP exceeded LWCNEV by as much as 40 % (Fig. 7a–d). For VMDs less than 10 µm, LWCCDP was less than LWCNEV by 5–10 % for those cases in which total droplet concentrations were less than about 400 cm−3. The general trend, for all droplet concentrations, suggests increasing LWCCDP (compared to LWCNEV) for increasing VMD. However, the mean difference in LWC, across all VMDs, does not indicate any specific trend when considering different ranges of total droplet concentration.
Estimates of percent LWC difference expected based on results from droplet generator tests and Nevzorov collection efficiency estimates predict that LWCCDP should be at most 11 % greater than LWCNEV (green shaded regions in Fig. 7). However, when all of the data in this study are considered, the mean percent difference is 19.6 %. Two striking features of the data show that the percent difference for large VMD, greater than about 25–30 µm, is considerably larger than expected; for droplet concentrations greater than 400 cm−3, the percent difference is significantly larger than expected for all VMDs. The larger-than-predicted difference between LWCCDP and LWCNEV is unlikely to be a result of coincidence error. The UWKA CDP features a sizer pinhole mask modification such that it is expected to be relatively unaffected by coincidence in concentrations less than 600 cm−3 (Lance et al., 2012). Figure 7d shows that mean percent LWC difference for data with concentration of 400–1600 cm−3 is not significantly different than mean values for much smaller total droplet concentrations. On the other hand, for this concentration range, percent LWC difference is significantly larger for smaller VMDs when compared to similar VMDs for lesser droplet concentrations, suggesting that those CDP measurements may indeed be impacted by coincidence for these higher concentrations. Regardless, these data account for less than 4 % of all points and suggest coincidence is unlikely to account for differences across all ranges of concentration.
The droplet generator tests used a near-constant droplet velocity that was ∼ 30 % of typical UWKA airspeeds. They provide no information about how CDP sizing/counting accuracy and SAQ may vary with airspeed. Some of the discrepancy between estimated and actual percent LWC difference could be a result of a change in CDP performance at typical aircraft flight speeds which could result from limitations in photodetector response (Dye and Baumgardner, 1984). However, in order for airspeed-dependent errors in sizing and/or SAQ to account for the discrepancies shown, increased flight speeds would need to result in an increase in sizing (and hence photodetector output for the sizer signal) and/or an increase in SAQ, both of which are unlikely outcomes; one might expect the opposite behaviour. On the other hand, overcounting could increase with increasing particle velocity if photodetector response limitations result in more significant signal noise. But it seems unlikely that such considerations could cause overcounting of the order of 5–20 % given that only 46 µm droplets were overcounted (by less than 1 %) during droplet generator tests.
It is possible that the discrepancy between estimated and actual percent LWC difference could be a result of a change in counting/sizing behaviour for droplets passing through the qualified sample area region where droplets are severely undersized (blue areas in the rightmost 10 % of the beam maps shown in Fig. 4). Sizer responses are characteristically within the noise band range (fewer than 512 digital counts) for droplets transiting these regions; thus, severely undersized droplets could be rejected during “real-world” operation. If LWCCDP error estimates (as described in Sect. 3.2) are recalculated excluding these regions where droplets are severely undersized, the resultant oversizing throughout the rest of the sensitive sample area could result in as much as 17 % overestimation of LWCCDP (effectively shifting upward the hatched green areas in Fig. 7 for large VMD).
Error in Nevzorov measurements could also contribute to the discrepancy between LWCCDP and LWCNEV. Instrument icing was a common issue during SNOWIE. The 0.05 g m−3 threshold applied to LWCCDP and LWCNEV was used to exclude measurements taken when one (or both) of the instruments was (were) completely unresponsive. In the case of ice accumulation on the Nevzorov sensing element, build-up of rime ice near (or over) the LWC element often results in significant baseline drift along with an accompanying reduction in sensitivity to liquid water (due to changes in airflow and shielding of the sensing element). Such situations would result in an underestimation of LWC by the Nevzorov and could explain some of the differences shown in Fig. 7. However, examination of baselines prior to and after exiting clouds suggests this is not a large problem for the cases examined. Regardless, nearly all measurements were obtained in supercooled conditions, so the data used in this study were not able to be further subdivided to investigate differences in regions where temperature greater than 0 ∘C would exclude the possibility of icing. Future studies should include cloudy regions at temperatures greater than 0 ∘C to mitigate possible contamination cause by ice particles and/or rime ice build-up near the sensing elements.
A droplet-generating calibration system was used to test the sizing and counting performance and provide measurements of the qualified sample area of the UWKA CDP using seven discrete droplet diameters ranging from 9 to 46 µm. Experiments reveal that droplet sizing accuracy varies depending on where droplets transit the sample area and the size of the droplets. Errors in droplet sizing tend to be less than 10 % when comparing modes of the droplet distributions and even less when comparing the mean diameter of the droplet distribution – significantly less than the typically quoted 10–20 % sizing accuracy normally attributed to single-particle scattering probes (Baumgardner et al., 2017).
This study extends the results from previous studies reported by Lance et al. (2010, 2012) by challenging a CDP throughout its sample area using seven droplet diameters ranging from 9 to 46 µm. One of the findings of this study that was unable to be captured by the earlier studies is that locationally dependent errors in sizing vary by droplet diameter and that gradients in sizing error increase with increasing droplet diameter. This study also uses a finer grid spacing to test CDP response than did the Lance et al. studies, providing more precise measurements of sample area dimensions. Finally, the CDP tested in this study contained the pinhole modification reported on by Lance et al. (2012). However, the 2012 study did not report on sizing response, rather only on counting accuracy and coincidence effects.
Errors in sizing for the majority of droplets across the size ranges tested can be accounted for by the amplitude of Lorenz–Mie resonances on the response curve. The Lorenz–Mie resonances often result in a slight broadening of the distribution by one to two bins. How much broadening occurs depends on droplet size and the actual range of collection angles for the probe. This finding confirms results of earlier studies (Rosenberg et al., 2012; Baumgardner et al., 2017). Droplets with nominal diameter of 9 µm are undersized by 1 µm or less for roughly 33 % of the droplets sampled and are undersized by 1–4 µm for the remaining 66 % of droplets. Errors in droplet sizing for 9 µm droplets do not depend strongly on where droplets transited the sample area. The errors in sizing for these smallest droplets are likely related to the amplitude of Lorenz–Mie resonances compared to the relatively shallow slope of the Lorenz–Mie function.
Droplets with diameters of 17 and 24 µm are sized to within 2 µm of the true droplet diameter for nearly all droplets sampled (>90 %), but there appears to be a small lateral dependence within the sample area on errors in sizing, such that droplets passing through the top half of the sample area are sized larger than those transiting through the bottom half. Tests for droplets with diameters 29, 34, 38, and 46 µm reveal more significant oversizing, by as much as 2–4 µm, with an even stronger lateral dependence on sizing error that is relatively symmetric within the qualified sample area. A 0.5∘ uncertainty in outer collection angle could account for the observed degree of oversizing. It is possible that the actual collection angles for the CDP tested deviate from the nominal 4–12∘ collection range provided by the manufacturer (Dye and Baumgardner, 1984; Baumgardner et al., 2017). However, results shown in Fig. 3 indicate that the CDP response for the seven droplet sizes tested fits well with expected scaled response of the Lorenz–Mie curve considering both 4–12 and 5–13∘ collection angles. If one considers 4–12.5∘, for example, or 4–11.5∘, the data appear to fit just as well, given the amplitude of the Lorenz–Mie resonances.
Droplet generator experiments performed by Lance et al. (2010) using 12 and 22 µm droplets also reveal a gradient in sizing accuracy. The sizing accuracy gradients discovered in the their study are less symmetric, with the most severe undersizing occurring in an area in the lower-left 10 % of the qualified sample area. In this region, 12 and 22 µm droplets were undersized by as much as 10 µm (Lance et al., 2010). The researchers attributed this behaviour to a misalignment of the qualifier detector mask. However, in their study as well as in this study, errors in sizing could also be simply due to variations in laser intensity across the beam. Laser intensity was not measured in this study, so we are unable to attribute errors due to this specifically. Follow-on tests using the UW droplet generator on two other CDPs (owned by an outside research group) suggest similar lateral dependencies on sizing accuracy. These data are not presented in this study, but they do suggest a potential for some type of systematic behaviour across different probes.
Tests performed for this work also reveal that, for droplets 24 µm and larger, nearly all droplets passing through 10 % of the qualified sample area (that portion closest to the detector) are undersized, by as much as 30 µm, depending on the droplet diameter. The locationally dependent nature of sizing accuracy results in artificial spectral broadening of droplet size distributions, which is most pronounced for droplets with diameters 34 µm and larger. Although droplets are oversized by 2–4 µm in most locations within the qualified sample area, the resulting errors in higher-order moments – such as mean diameter, VMD, and LWC – are mostly offset by undersizing of droplets throughout the rest of the sample area. This has implications for how sizing should be calibrated for the CDP. For example, matching distribution modes when performing calibrations will result in an underestimation for higher-order moments because distributions are artificially skewed. Conversely, calibrations that match mean droplet diameter will result in an overestimation of the diameter of the droplet distribution mode in real clouds.
Droplets were counted to within 98 % accuracy over roughly 95 % of sample locations. Undercounting only occurred around the perimeter of the sample area and was likely a result of small deviations in droplet placement. Only the largest droplets tested, 46 µm, indicated any significant overcounting. This occurred in two regions bordering the area where these same droplets were significantly undersized. However, these regions account for less than 1 % of the total qualified sample area, so they introduce less than 1 % overall count error. These findings differ from the results of Lance et al. (2010), which show as great as 20 % overcounting of 12 and 24 µm droplets at several sample locations near the perimeter of the qualified sample area as well as significant overcounting of 12 µm droplets in a region located ∼ 300 µm from the left side of the qualified sample area.
All sizes of droplets are undercounted around the perimeter of the qualified sample area, and this must be considered when defining SAQ for higher moment calculations. SAQ_50 % varies only 0.03 mm2 depending on droplet diameter, and thus the use of a mean of SAQ_50 % for all droplet sizes (0.27 mm2) is warranted. SAQ for the CDP used in this work and the CDPs examined by Lance et al. (2010, 2012) agree to within 10 %.
Comparisons of in situ LWC measurements from the CDP and a Nevzorov hot-wire probe provide another means of evaluating CDP performance. In situ comparisons show that, on average, LWCCDP is greater by about 20 %, whereas droplet generator results and Nevzorov collection efficiency considerations predict that LWCCDP should be no more than 12 % larger. Droplet generator tests used a droplet velocity that is ∼ 30 % of typical UWKA airspeeds. The discrepancy between the expected and actual LWCCDP and LWCNEV difference may be a result of CDP performance at higher droplet transiting speeds; however the current design of the UW droplet generator system does not provide enough stability in droplet placement to run tests at higher flow rates. Future testing should aim to increase droplet velocities by a factor of 3. It also cannot be ruled out that the discrepancy may be partially due to rime ice build-up on the Nevzorov element. Further studies should include a concerted effort to incorporate in situ measurements in cloud at temperatures greater than 0 ∘C. Our results indicate, for the data reported here, one must accept uncertainty in LWC greater than that which is suggested based strictly on hot-wire uncertainties reported in the literature and CDP uncertainties suggested by laboratory experiments reported in this study.
Data from the laboratory-based droplet generator tests are archived and accessible at https://doi.org/10.15786/m2h83k. The data archive contains the original CDP output files, droplet glare images, and time-stamped position logs from the computerized stage controller. Processing scripts, written in Interactive Data Language (IDL), are included and used to merge and process the raw data files. Processed data from the CDP and Nevzorov probe on board the UWKA are available at https://doi.org/10.15786/M26309 for PACMICE and https://doi.org/10.15786/M2MW9F for SNOWIE.
SF completed the bulk of this work and wrote the manuscript, which was based on SF's master's thesis from the University of Wyoming. The work was supervised by JF. Significant edits to the original manuscript were completed by JF. RJ constructed the early version of the droplet generator and worked closely on initial testing.
The authors declare that they have no conflict of interest.
The authors wish to thank the crew of the University of Wyoming King Air for
their dedicated work during the PACMICE and SNOWIE campaigns. They also wish
to thank Ben Heesen at the University of Wyoming for his aid in constructing
the droplet generator system. Development of the droplet generator was paid
for by internal funds from the university. The CDP and UWKA flights for
SNOWIE were supported through National Science Foundation grant AGS-1441831.
Edited by: Pierre Herckes
Reviewed by: Darrel Baumgardner and Manfred Wendisch
Abel, S. J., Cotton, R. J., Barrett, P. A., and Vance, A. K.: A comparison of ice water content measurement techniques on the FAAM BAe-146 aircraft, Atmos. Meas. Tech., 7, 3007–3022, https://doi.org/10.5194/amt-7-3007-2014, 2014.
Baumgardner, D., Abel, S. J., Axisa, D., Cotton, R., Crosier, J., Field, P., Gurganus, C., Heymsfield, A., Korolev, A., Kramer, M., Lawson, P., McFarquhar, G., Ulanowski, Z., and Um, J.: Cloud Ice Properties: In Situ Measurement Challenges, Meteorol. Monogr., 58, 9.1–9.23, https://doi.org/10.1175/AMSMONOGRAPHS-D-16-0011.1, 2017
Baumgardner, D. and Spowart, M.: Evaluation of the Forward Scattering Spectrometer Probe, Part III: Time Response and Laser Imhomogeneity Limitations, J. Atmos. Oceanic Technol., 7, 666–672, 1990.
Baumgardner, D., Strapp, J. W., and Dye J. E.: Evaluation of the Forward Scattering Spectrometer Probe, Part II: Corrections for Coincidence and Dead-Time Losses, J. Atmos. Ocean. Technol., 2, 626–632, https://doi.org/10.1175/1520-0426(1985)002<0626:EOTFSS>2.0.CO;2, 1985.
Brenguier, J. L., Baumgardner, D., and Baker, B.: A review and discussion of processing algorithms for FSSP concentration measurements, J. Atmos. Ocean. Technol., 11, 1409–1414, https://doi.org/10.1175/1520-0426(1994)011<1409:ARADOP>2.0.CO;2, 1994.
Brenguier, J. L., Bourrianne, T., De Coelho, A. A., Isbert, J., Peytavi, R., Trevarin, D., and Weschler, P.: Improvements of droplet size distribution measurements with the fast-FSSP (Forward Scattering Spectrometer Probe), J. Atmos. Ocean. Technol., 15, 1077–1090, https://doi.org/10.1175/1520-0426(1998)015<1077:IODSDM>2.0.CO;2, 1998.
Cooper, W. A.: Effects of Coincidence on Measurements with a Forward Scattering Spectrometer Probe, J. Atmos. Ocean. Technol., 5, 823–832, https://doi.org/10.1175/1520-0426(1988)005<0823:EOCOMW>2.0.CO;2, 1988.
Dye, J. E. and Baumgardner, D.: Evaluation of the Forward Scattering Spectrometer Probe, Part I: Electronic and Optical Studies, J. Atmos. Ocean. Technol., 1, 329–344, https://doi.org/10.1175/1520-0426(1984)001<0329:EOTFSS>2.0.CO;2, 1984.
Field, P. R., Wood, R., Brown, P. R. A., Kaye, P. H., Hirst, E., Greenaway, R., and Smith, J. A.: Ice particle interarrival times measured with a fast FSSP, J. Atmos. Ocean. Technol., 20, 249–261, https://doi.org/10.1175/1520-0426(2003)020<0249:IPITMW>2.0.CO;2, 2003.
French, J. R., Friedrich, K., Tessendorf, S., Rauber, R., Geerts, B., Rasmussen, R., Xue, L., Kunkel, M., and Blestrud, D.: Precipitation Formation from Orographic Cloud Seeding, P. Natl. Acad. Sci., 115, 1168–1173, 2018.
Gardiner, B. A. and Hallet, J.: Degradation of In-Cloud Forward Scattering Spectrometer Probe Measurements in the Presence of Ice Particles, J. Atmos. Ocean. Technol., 2.2, 171–180, 1985.
Heymsfield, A. J.: On measurements of small ice particles in clouds. Geophys. Res. Lett. 34, 1–6, https://doi.org/10.1029/2007GL030951, 2007.
Khanal, S.: Evaluation of airborne radar-lidar retrieval of ice water content using in situ probes, M.S. Thesis, University of Wyoming, 2013.
King, W. D., Parkin, D. A., and Handsworth, R. J.: A Hot-Wire Liquid Water Device Having Fully Calculable Response Characteristics, J. Appl. Meteorol., 17, 1809–1813, https://doi.org/10.1175/1520-0450(1978)017<1809:AHWLWD>2.0.CO;2. 1978.
Knollenberg, R. G.: Practical Applications of Low Power Lasers, SPIE, 92, 137–152, 1976.
Korolev, A. V., Kuznetsov, S. V., Makarov, Y. E., and Novikov, V. S.: Evaluation of measurements of particle size and sample area from optical array probes, J. Atmos. Ocean. Technol., 8, 514–522, https://doi.org/10.1175/1520-0426(1991)008<0514:EOMOPS>2.0.CO;2, 1991.
Korolev, A. V, Strapp, J. W., Isaac, G. A., and Nevzorov, A. N.: The Nevzorov airborne hot-wire LWC-TWC probe: Principle of operation and performance characteristics, J. Atmos. Ocean. Technol., 15, 1495–1510, https://doi.org/10.1175/1520-0426(1998)015<1495:TNAHWL>2.0.CO;2, 1998.
Korolev, A. and Isaac, G. A.: Shattering during Sampling by OAPs and HVPS . Part I?: Snow Particles, J. Atmos. Ocean. Technol., 22, 528–542, 2005.
Korolev, A., Strapp, J. W., Isaac, G. A., and Emery, E.: Improved airborne hot-wire measurements of ice water content in clouds, J. Atmos. Ocean. Technol., 30, 2121–2131, https://doi.org/10.1175/JTECH-D-13-00007.1, 2013.
Lance, S., Brock, C. A., Rogers, D., and Gordon, J. A.: Water droplet calibration of the Cloud Droplet Probe (CDP) and in-flight performance in liquid, ice and mixed-phase clouds during ARCPAC, Atmos. Meas. Tech., 3, 1683–1706, https://doi.org/10.5194/amt-3-1683-2010, 2010.
Lance, S.: Coincidence errors in a cloud droplet probe (CDP) and a cloud and aerosol spectrometer (CAS), and the improved performance of a modified CDP, J. Atmos. Ocean. Technol., 29, 1532–1541, https://doi.org/10.1175/JTECH-D-11-00208.1, 2012.
McFarquhar, G. M., Um, J., Freer, M., Baumgardner, D., Kok, G. L., and Mace, G.: Importance of small ice crystals to cirrus properties?: Observations from the Tropical Warm Pool International Cloud Experiment, Geophys. Res. Lett., 34, 1–6, https://doi.org/10.1029/2007GL029865, 2007.
McFarquhar, G. M., Baumgardner, D., Bansemer, A., Abel, S. J., Crosier, J., French, J., Rosenberg, P., Korolev, A., Schwarzoenboeck, A., Leroy, D., Um, J., Wu, W., Heymsfield, A. J., Twohy, C., Detwiler, A., Field, P., Neumann, A. and Axisa, D.: Processing of Ice Cloud In-Situ Data Collected by Bulk Water, Scattering and Imaging Probes: Fundamentals, Uncertainties and Efforts towards Consistency, Meteorol. Monogr., 58, 11.1–11.33, https://doi.org/10.1175/AMSMONOGRAPHS-D-16-0007.1, 2017.
Nagel, D., Maixner, U., Strapp, J. W., and Wasey, M.: Advancements in techniques for calibration and characterization of in situ optical particle measuring probes, and applications to the FSSP-100 probe, J. Atmos. Ocean. Technol., 24, 745–760, https://doi.org/10.1175/JTECH2006.1, 2007.
Pinnick, R. G., Garvey, D. M., and Duncan, L. D.: Calibration of Knollenberg FSSP Light-Scattering Counters for Measurement of Cloud Droplets, J. Appl. Meteor., 20, 1049–1057, 1981.
Rosenberg, P. D., Dean, A. R., Williams, P. I., Dorsey, J. R., Minikin, A., Pickering, M. A., and Petzold, A.: Particle sizing calibration with refractive index correction for light scattering optical particle counters and impacts upon PCASP and CDP data collected during the Fennec campaign, Atmos. Meas. Tech., 5, 1147–1163, https://doi.org/10.5194/amt-5-1147-2012, 2012.
Schmidt, S., Lehmann, K., and Wendisch, M.: Minimizing instrumental broadening of the drop size distribution with the M-Fast-FSSP, J. Atmos. Ocean. Tech., 21, 1855–1867., 2004.
Schwarzenboeck, A., Mioche, G., Armetta, A., Herber, A., and Gayet, J.-F.: Response of the Nevzorov hot wire probe in clouds dominated by droplet conditions in the drizzle size range, Atmos. Meas. Tech., 2, 779–788, https://doi.org/10.5194/amt-2-779-2009, 2009.
Strapp, J. W., Oldenburg, J., Ide, R., Lilie, L., Bacic, S., Vukovic, Z., Oleskiw, M., Miller, D., Emery, E., and Leone, G.: Wind tunnel measurements of the response of hot-wire liquid water content instruments to large droplets, J. Atmos. Ocean. Technol., 20, 791–806, https://doi.org/10.1175/1520-0426(2003)020<0791:WTMOTR>2.0.CO;2, 2003.
Wang, Z., French, J., Vali, G., Wechsler, P. and Haimov, S.: Single Aircraft Integration of Remote Sensing and In-situ Sampling for the Study of Cloud Microphysics and Dynamics, B. Am. Meteorol. Soc., 93, https://doi.org/10.1175/BAMS-D-11-00044.1, 2012.
Wendisch, M., Keil, A., and Korolev, A. V.: FSSP characterization with monodisperse water droplets, J. Atmos. Ocean. Technol., 13, 1152–1165, https://doi.org/10.1175/1520-0426(1996)013<1152:FCWMWD>2.0.CO;2, 1996.
Wendisch, M. and Brenguier, J.-L.: Airborne measurements for environmental research: methods and instruments, John Wiley & Sons, 641, ISBN:978-3-527-40996-9, 2013.
- Abstract
- Introduction
- CDP operating principles
- University of Wyoming droplet-generating system
- Results of droplet generator tests on the CDP
- Comparisons of liquid water content from the CDP and Nevzorov probes
- Summary and discussion
- Data availability
- Author contributions
- Competing interests
- Acknowledgements
- References