the Creative Commons Attribution 4.0 License.
the Creative Commons Attribution 4.0 License.
 | 17 Jan 2018
Modification, calibration, and performance of the Ultra-High Sensitivity Aerosol Spectrometer for particle size distribution and volatility measurements during the Atmospheric Tomography Mission (ATom) airborne campaign
Christina Williamson
Nicholas L. Wagner
Mathews Richardson
Charles A. Brock
Atmospheric aerosol is a key component of the chemistry and climate of the Earth's atmosphere. Accurate measurement of the concentration of atmospheric particles as a function of their size is fundamental to investigations of particle microphysics, optical characteristics, and chemical processes. We describe the modification, calibration, and performance of two commercially available, Ultra-High Sensitivity Aerosol Spectrometers (UHSASs) as used on the NASA DC-8 aircraft during the Atmospheric Tomography Mission (ATom). To avoid sample flow issues related to pressure variations during aircraft altitude changes, we installed a laminar flow meter on each instrument to measure sample flow directly at the inlet as well as flow controllers to maintain constant volumetric sheath flows. In addition, we added a compact thermodenuder operating at 300 ∘C to the inlet line of one of the instruments. With these modifications, the instruments are capable of making accurate (ranging from 7 % for Dp < 0.07 µm to 1 % for Dp > 0.13 µm), precise (< ±1.2 %), and continuous (1 Hz) measurements of size-resolved particle number concentration over the diameter range of 0.063–1.0 µm at ambient pressures of > 1000 to 225 hPa, while simultaneously providing information on particle volatility.
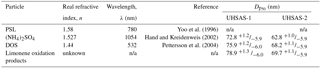
We assessed the effect of uncertainty in the refractive index (n) of ambient particles that are sized by the UHSAS assuming the refractive index of ammonium sulfate (n= 1.52). For calibration particles with n between 1.44 and 1.58, the UHSAS diameter varies by +4/−10 % relative to ammonium sulfate. This diameter uncertainty associated with the range of refractive indices (i.e., particle composition) translates to aerosol surface area and volume uncertainties of +8.4/−17.8 and +12.4/−27.5 %, respectively. In addition to sizing uncertainty, low counting statistics can lead to uncertainties of < 20 % for aerosol surface area and < 30 % for volume with 10 s time resolution. The UHSAS reduction in counting efficiency was corrected for concentrations > 1000 cm−3.
Examples of thermodenuded and non-thermodenuded aerosol number and volume size distributions as well as propagated uncertainties are shown for several cases encountered during the ATom project. Uncertainties in particle number concentration were limited by counting statistics, especially in the tropical upper troposphere where accumulation-mode concentrations were sometimes < 20 cm−3 (counting rates ∼ 5 Hz) at standard temperature and pressure.
- Article
(2723 KB) - Full-text XML
-
Supplement
(283 KB) - BibTeX
- EndNote


The concentration of particles as a function of size is fundamentally related to both direct (aerosol–radiation) and indirect (aerosol–cloud) effects of aerosol on climate. Particles with diameters (Dp) > 0.1 µm efficiently scatter and absorb solar radiation (e.g., Charlson et al., 1992). Particles with Dp > 0.05 µm serve as cloud condensation nuclei (CCN; Clarke and Kapustin, 2002; Dusek et al., 2006; Köhler 1936). CCN play a role in cloud formation and in altering radiative properties and lifetime of existing clouds (Albrecht, 1989; Twomey, 1974, 1977). Measurement of aerosol size-resolved number concentration is crucial for understanding aerosol sources and sinks, optical properties, cloud nucleation potential and chemical transformations, and consequently to constrain models of aerosol–cloud–climate interactions.
There is currently a variety of techniques available for measuring aerosol size distributions (McMurry, 2000), but only some of these are fast enough to sample aboard aircraft. The Ultra-High Sensitivity Aerosol Spectrometer (UHSAS; Droplet Measurement Techniques (DMT) Inc., Longmont, CO, USA) is one such instrument. The UHSAS is an optical particle counter for measuring particles from 0.06 to 1 µm, which is often used for laboratory, ground-based, and airborne measurements. It counts and sizes particles by measuring the amount of light scattered by individual particles as they traverse a focused laser beam. A fraction of the side-scattered light is then collected by the optical system and focused onto two photodetectors where it is converted to a size-proportional voltage pulse. The size of particle is determined from the height of the voltage pulse by using a calibration curve obtained from measurements of spherical particles with known size and composition. Size distributions are obtained by accumulating the individual pulse magnitudes of a population of particles into a histogram.
Two versions of UHSAS are currently commercially available. One, designed for airborne measurements, is enclosed in an underwing canister for in situ sampling, while the other one is intended for ground-based aerosol sampling. Here we focus on the modification, accuracy, and operation of two UHSAS instruments (hereafter referred to as UHSAS-1 and UHSAS-2) during the first and second Atmospheric Tomography Mission (ATom) field campaigns in summer 2016 and winter 2017, respectively. The ground-type UHSAS instruments were chosen for this study over the wing-mounted version because we wished to dry the air sample and to install a thermodenuder used to distinguish non-volatile particles. These sample treatments are not possible with the compact, wing-mounted instrument. The ground-type UHSAS has been deployed in various airborne-based campaigns (Brock et al., 2011, 2016; Kassianov et al., 2015; Yokelson et al., 2011). However, as reported by Brock et al. (2011), modifications to the flow system are required to make them suitable for airborne sampling.
Cai et al. (2008) reported a laboratory evaluation of the UHSAS, and Brock et al. (2011) reported modifications to the flow system; however, a complete evaluation of the accuracy and precision of the UHSAS instrument for airborne operation is lacking. Here we describe modifications to the ground-based UHSAS for airborne operation, detail the installation of a compact thermodenuder in a second UHSAS for aerosol volatility studies, and evaluate the accuracy, precision, and in-flight performance of both UHSAS instruments during the first two of four ATom airborne campaigns.
The ATom mission
The ATom mission uses a DC-8 aircraft to survey the remote atmosphere over the Pacific and Atlantic oceans from ∼ 80∘ N to ∼ 65∘ S while making repeated vertical profiles from 0.15 to 12 km to provide information on greenhouse gases, reactive and tracer species, and aerosol composition and size distribution. At the conclusion of the ATom project in spring 2018, the DC-8 will have made four global circuits, one circuit for each season. The UHSAS instruments are a part of a suite of fast-response aerosol size distribution instruments focusing in particular on the spatial variation in the abundance of particles sized 0.003–4.8 µm (Brock et al., 2018; Williamson et al., 2018). Scientific goals for these instruments include identifying the spatial extent of new particle formation in the remote troposphere and the associated mechanisms and controlling parameters, quantifying the growth of newly formed particles to cloud-active sizes, and determining the importance of aerosols from continental sources to the remote troposphere.
By operating two well-calibrated UHSAS instruments, one with a thermodenuder (UHSAS-1) and one without (UHSAS-2), the size-dependent particle volatility can be determined continuously, which is particularly useful for airborne sampling where fast time response is needed. Volatility is an important physical property defined by the chemical composition of the condensed species and may reflect the origin of the particle (Huffman et al., 2008; Jonsson et al., 2007). Most secondary compounds (such as sulfates, nitrates, or organics) are expected to volatilize below 300 ∘C while primary particles such as soot, sea salt, and soil dust survive heating (e.g., Clarke, 1991; Clarke and Kapustin, 2002; DeCarlo et al., 2008). Measurements of particle volatility help identify the contribution of secondary particles formed in the free troposphere (FT) to the budget of CCN-sized particles in the marine boundary layer (MBL), and how this contribution varies with altitude and location in the remote atmosphere.
2.1 Operating principles
The UHSAS (Cai et al., 2008) measures aerosol size-resolved number concentration between 0.06 and 1 µm in diameter in 99 logarithmically spaced bins with user-selected time resolution. The UHSAS uses a high-intensity infrared laser (semiconductor-diode-pumped solid-state neodymium-doped yttrium lithium fluoride, Nd3+:Y LiF4, operating at 1054 nm with intra-cavity circulating power of ∼ 1 kW cm−2), an inlet jet assembly, and two detection systems: a highly sensitive avalanche photodiode (APD) to detect and size the smallest particles, and a less sensitive secondary PIN photodiode to size larger particles (Fig. 1). These detectors are located at 90∘ on either side of the laser beam, aligned with the intersection of the aerosol stream and the laser beam.
When particles exit the inlet jet assembly in the optical block, they traverse the center of the focused laser beam and scatter light into the detection system. Scattered light collected by two pairs of Mangin optics (over solid angle of 33–147∘) is imaged onto the APD and PIN photodetectors. The center region of the solid angle (72.5–104.8∘) is not sampled due to the hole cut out in the outer of the mirrors, with the detector size being a negligible fraction of this hole area (Brock et al., 2016). This geometry contrasts with that reported by Cai et al. (2008), who used scattering angles from 22 to 158∘ to simulate UHSAS response. The geometry we report was determined in consultation with the manufacturer and agrees with values given by Petzold et al. (2013). The amount of scattered light reaching the detectors is a function of not only particle size but also refractive index (n) and shape.
Each photodiode produces a photocurrent pulse, which is converted to a voltage pulse through analog amplifiers. The signal from each detector is amplified by two different gain circuits (high and low), providing a total of four independent gain stages with some overlap (one particle may be separately sized by each of the two adjacent gain stages). The outputs from these gain stages are combined by linear regression in the overlap regions to provide a single scale for accurate sizing across the full range of the UHSAS response.
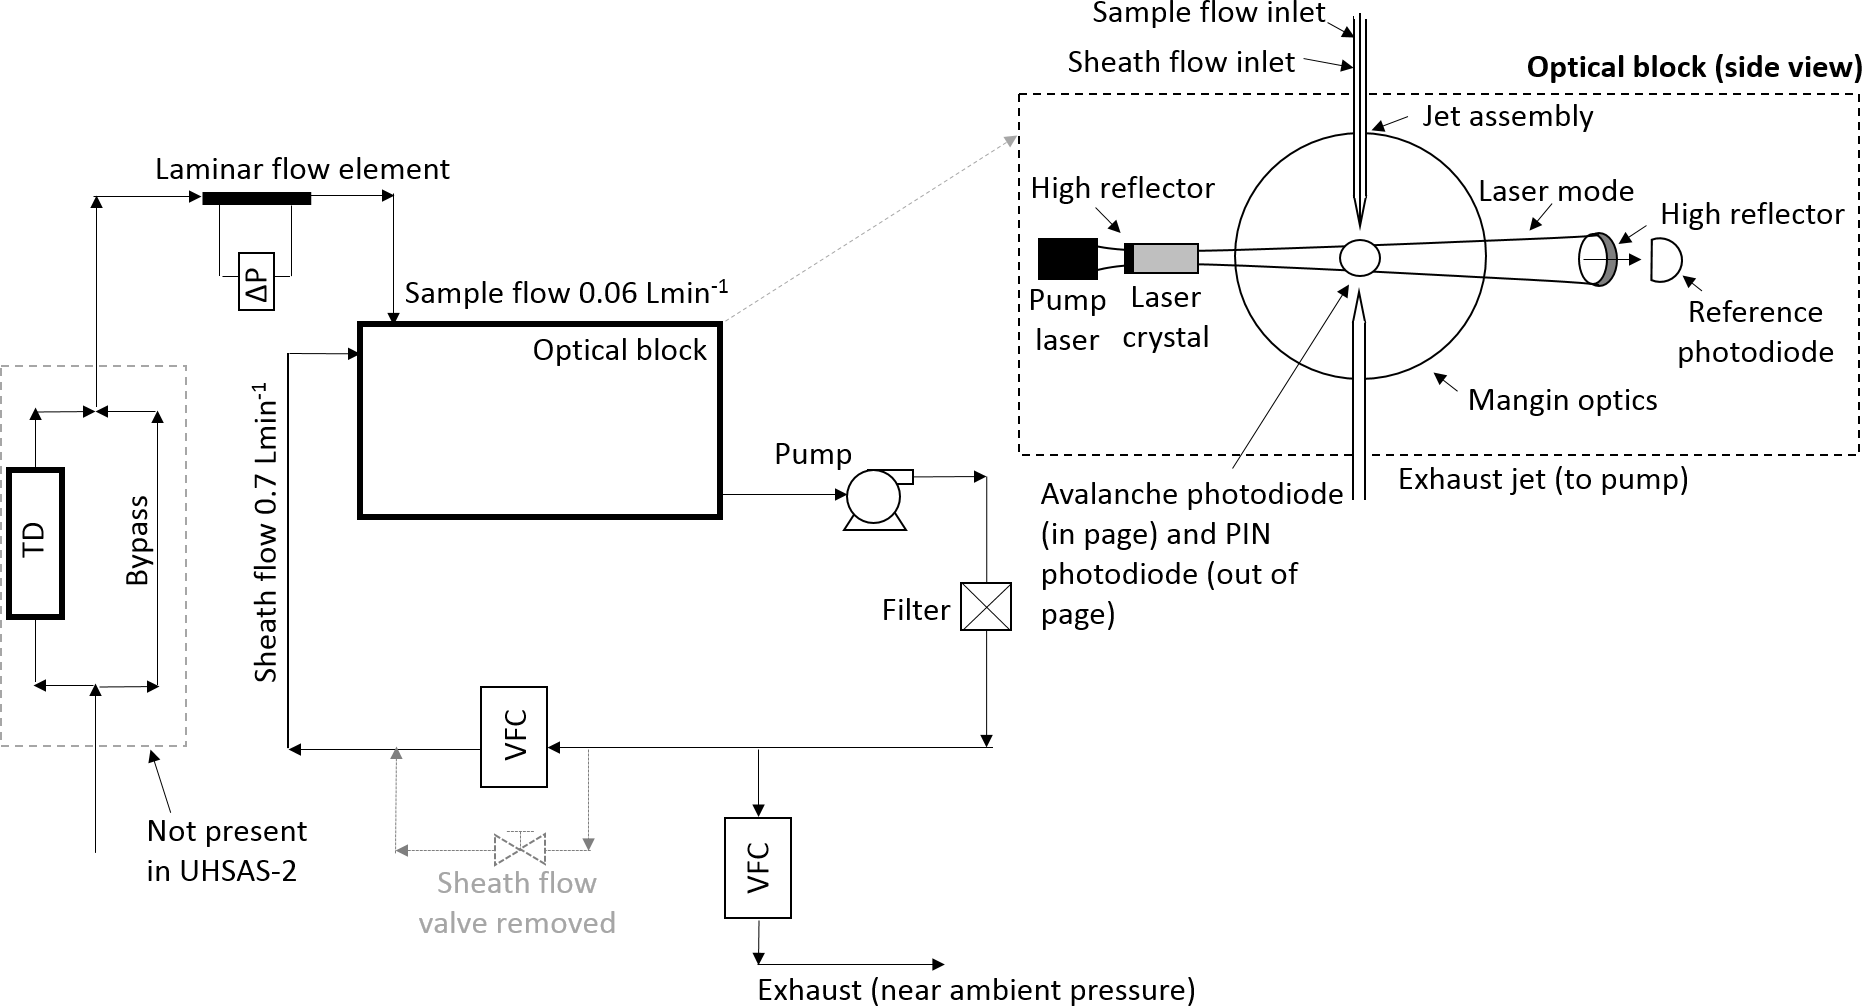
Figure 1UHSAS with its modified flow system including schematic of the UHSAS-1 and UHSAS-2 inlets. The sample air at a flow rate of 60 cm3min−1 enters the inlet and in UHSAS-2 goes directly through the laminar flow element, while in UHSAS-1 additionally a thermodenuder (TD, T= 300 ∘C) was installed so the flow first enters the switching (Hanbay) valve and either bypasses or passes through the TD before it enters the laminar flow element. Optical block schematic adopted from UHSAS User Manual.
2.2 Modified flow system
Because the ground-based version of the UHSAS was not designed for operation on aircraft where pressure changes, flow system modifications are essential for airborne use. In the standard UHSAS configuration the aerosol sample flow is controlled and measured by a mass flow controller mounted on the exhaust side of the pump (Fig. 1). If mass flow were maintained in flight, the volumetric flow rate would change inversely with air density, leading to changes in particle velocity through the laser beam and thus pulse width. A further issue is associated with transient sample flow response to pressure changes during aircraft altitude changes. Because the inlet nozzle restricts the sample flow entering the optical block, there is a time lag between any external pressure change and the pressure within the UHSAS optics block. This pressure disequilibrium changes the inlet flow to the optics block in a way that is dependent on the rate of pressure change and the fluid dynamics of the nozzle flow, which may vary with altitude because it depends upon Reynolds number (Re). Because the particle number concentration is calculated from the measured count rate and sample flow rate, it is essential to account for these transient effects and directly measure the flow rate at the inlet. Finally, using a needle valve to control the split between the aerosol and sheath flows results in the sheath–aerosol flow ratio varying with changing pressure because pressure drop through the valve is also Reynolds-number-dependent and will vary with pressure, even at a constant volumetric flow rate.
Because of the above issues, the flow system of both UHSAS instruments was modified (Fig. 1; Table S1 in the Supplement). The modifications include installation of a laminar flow element with a differential pressure transducer to directly and precisely measure the time-varying sample volumetric flow rate at the optics block inlet, and replacement of the sheath flow valve with a volumetric flow controller (VFC) to directly monitor and control sheath flow. The Alicat mass flow controller on the exhaust side of the instrument, which is connected to an exhaust line near inlet pressure to control the exhaust flow, was switched to operate in volume flow control mode. The inlet laminar flow meter and differential pressure transducer were calibrated together over a flow range of 0–0.1 L min−1 using a volumetric flow calibration standard (DryCal DC-Lite, Bios, Inc., Butler, NJ, USA). The modified UHSAS is operated at ∼ 0.06 L min−1 total inlet flow and 0.7 L min−1 sheath flow. The original UHSAS LabView software was modified to accommodate these changes.
Table 1Detection efficiency of UHSAS-1 and UHSAS-2. n/a: not applicable.
3.1 Aerosol generation method
The sizing performance of the UHSAS and the effects of particle composition and concentration were investigated in the laboratory (Fig. 2). Particles with diameters between 0.05 and 1 µm were generated in two ways: (1) by using an atomizer to produce ammonium sulfate ((NH4)2SO4), polystyrene latex (PSL) spheres, or di-2-ethylhexyl (dioctyl) sebacate (DOS) particles (Table 1) or (2) from new particle formation and condensational growth from limonene ozonolysis products in a flow tube reactor.
3.1.1 Atomized aerosol and DMA
Particles were generated using an HPLC-grade water (or HPLC-grade isopropanol in the case of DOS) solution and a custom-built Collison-type atomizer (May, 1973). Atomized droplets were dried in a silica gel diffusion drier, charged by a Po210 radioactive source, and (except for the PSL) size-selected in a custom-built differential mobility analyzer (DMA) with a recirculating sheath flow. The sizing uncertainty (σS) of the DMA was ±1.6 %, estimated from the sum in quadrature (square root of the sum of squares) of the sheath flow (σQ), pressure (σP), temperature (σT), and voltage (σV) uncertainties as described in Eq. (1).
A sizing bias to smaller diameters was identified when using NIST-traceable polystyrene latex (PSL) microspheres with diameters between 0.07 and 0.4 µm (Thermo Scientific, Inc. Waltham, MA, US). This DMA sizing bias is estimated to be about 7 % at sizes below 0.07 µm and decreases to 1 % for sizes above 0.13 µm. However, we believe that the actual bias is < 7 % as these PSLs were checked against an independent DMA by P. Campuzano-Jost of the University of Colorado, and the results were similar, suggesting a surfactant coating on the smaller PSL sizes rather than a DMA sizing error. No adjustments were made to the DMA diameters, but the potential biases when compared to the PSL sizes are propagated through to the aerosol surface and volume concentration uncertainties discussed below.
The calibration DMA operated at a 1:10 aerosol-to-sheath-flow ratio and sheath flow rates of 3 to 5 L min−1. The monodisperse aerosol flow exiting the DMA was diluted using particle-free air to match the flow rate of the instruments located downstream. The incoming particle-free air was homogeneously mixed with calibration particles in a short section of turbulent (Re > 4000) flow and sampled by the two UHSAS instruments and a condensation particle counter (CPC; Model 3022A; TSI Inc., St. Paul, Minnesota, USA). The relative humidity (RH) of the aerosol flow was monitored by two RH sensors (Vaisala HMP60) installed in the DMA, one on the sample flow exiting the DMA and the other on the sheath flow exiting the DMA column, and was typically < 10 %. It was important to dry the atomized (NH4)2SO4 aerosol prior to size classification to avoid sizing biases due to the uncontrolled evaporation of water in the DMA and UHSAS and refractive index effects in the UHSAS.
3.1.2 Flow tube reactor and DMA
A secondary organic aerosol (SOA) from limonene ozonolysis was generated in a borosilicate glass (Pyrex) flow tube reactor as described in Williamson et al. (2018). Particles formed from limonene oxidation were size selected in a DMA as described above.
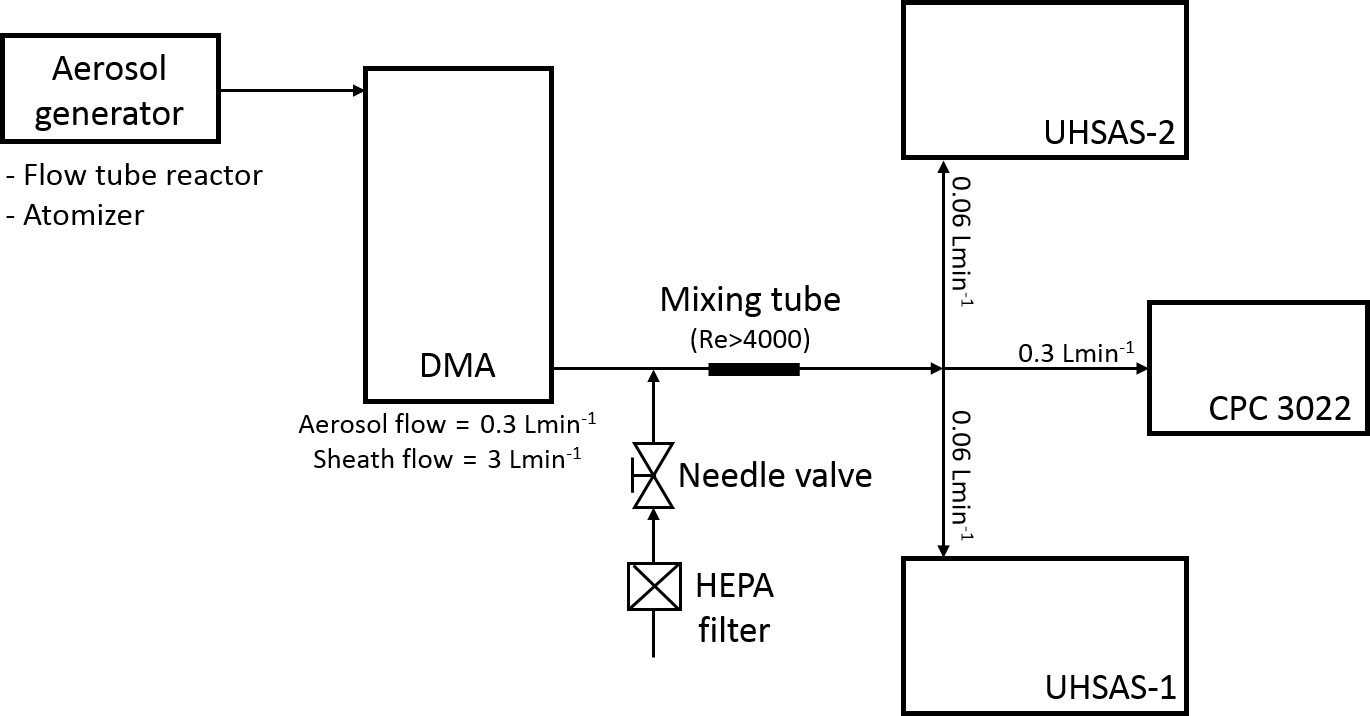
Figure 2A schematic diagram of the aerosol generation and measurement setup at atmospheric pressure conditions. The calibration aerosol was generated either in a flow tube reactor or the atomizer. Apart from PSL, all atomized particles were sent through a diffusion drier to DMA for size selection, while PSL particles were delivered from the atomizer directly to both UHSAS instruments following dilution with dry air.
3.2 The effect of composition on particle sizing
Particle sizing in the UHSAS is a function of the amount of light scattered onto the instrument's photodetectors. The quantity of scattered light, however, is a function not only of size but also of the composition-dependent aerosol refractive index (Bohren and Huffman, 1983). Particles of (NH4)2SO4 were used to relate scattered light intensity to particle size, since their refractive index at 1054 nm (n= 1.527; Hand and Kreidenweis, 2002) lies in the middle of the typical range of refractive indices for atmospheric particles composed of mixed sulfate salts and organic compounds. However, the composition of the atmospheric particles is not known a priori. The refractive index of organic aerosol in particular is not well constrained (Dick, 2007; Kanakidou et al., 2005). Kim and Paulson (2013) suggest values for refractive index (at λ= 532 nm) for biogenic and anthropogenic secondary organic aerosol (SOA) of 1.44 and 1.55, respectively. To constrain the effects of particle refractive index on UHSAS sizing, we investigated a range of nearly monodisperse calibration particles having different known refractive indices (Table 1, Fig. 3), including (NH4)2SO4, PSL microspheres, and DOS, as well as limonene oxidation products (with an unknown refractive index). For particles of Dp < 0.6 µm and a real refractive index (n) of 1.44–1.58, the diameter measured by the UHSAS may vary by +4/−10 % relative to the one based on (NH4)2SO4. The propagation of this potential bias to reported aerosol surface and volume concentrations uncertainties is discussed in Sect. 5.1.
The refractive index of soil dust may exceed the range of real refractive indices considered here. In addition, dust can be both absorbing and aspherical. When dust is an important component of the atmospheric aerosol, uncertainties in both the denuded and thermodenuded UHSAS instruments should be evaluated on a case-by-case basis using best estimates of refractive index and shape based on other measurements, coupled with optical simulations of instrument response. Also, because the thermodenuded UHSAS instrument volatilizes non-refractory particles, the refractive indices in the aerosol measured by the two instruments will differ. This problem is probably minor in the MBL because sea salt aerosol has a refractive index within the range of the calibrants. For the free troposphere, however, there may be substantial sizing biases between the two instruments that should be considered case by case using additional information on aerosol composition.
Finally, we note that light-absorbing black carbon (BC) particles are mis-sized in the UHSAS. The optical cavity laser power is ∼ 1 kW cm−2 at 1054 nm, similar to that in the single-particle soot photometer (SP2; Schwarz et al., 2010), and some limited laboratory studies we performed suggest that BC incandesces and vaporizes in the UHSAS. Even without incandescing, the complex refractive index of BC particles (n= 2.26–1.26i at λ= 1064 nm; Moteki et al., 2010) substantially alters UHSAS sizing compared with the calibration aerosol. Because the number concentration of BC cores with volume-equivalent diameter (assuming void-free density of 1.8 g cm−3) in the range 90–550 nm accounted for less than 5 % of the particle concentration in the same size range during the ATom-1 mission (except for the case of biomass burning plumes off the coast of Africa), mis-sizing due to BC is a minor effect in general in ATom. For cases of specific plumes from combustion sources in which BC is an abundant aerosol component this assumption should be re-evaluated.
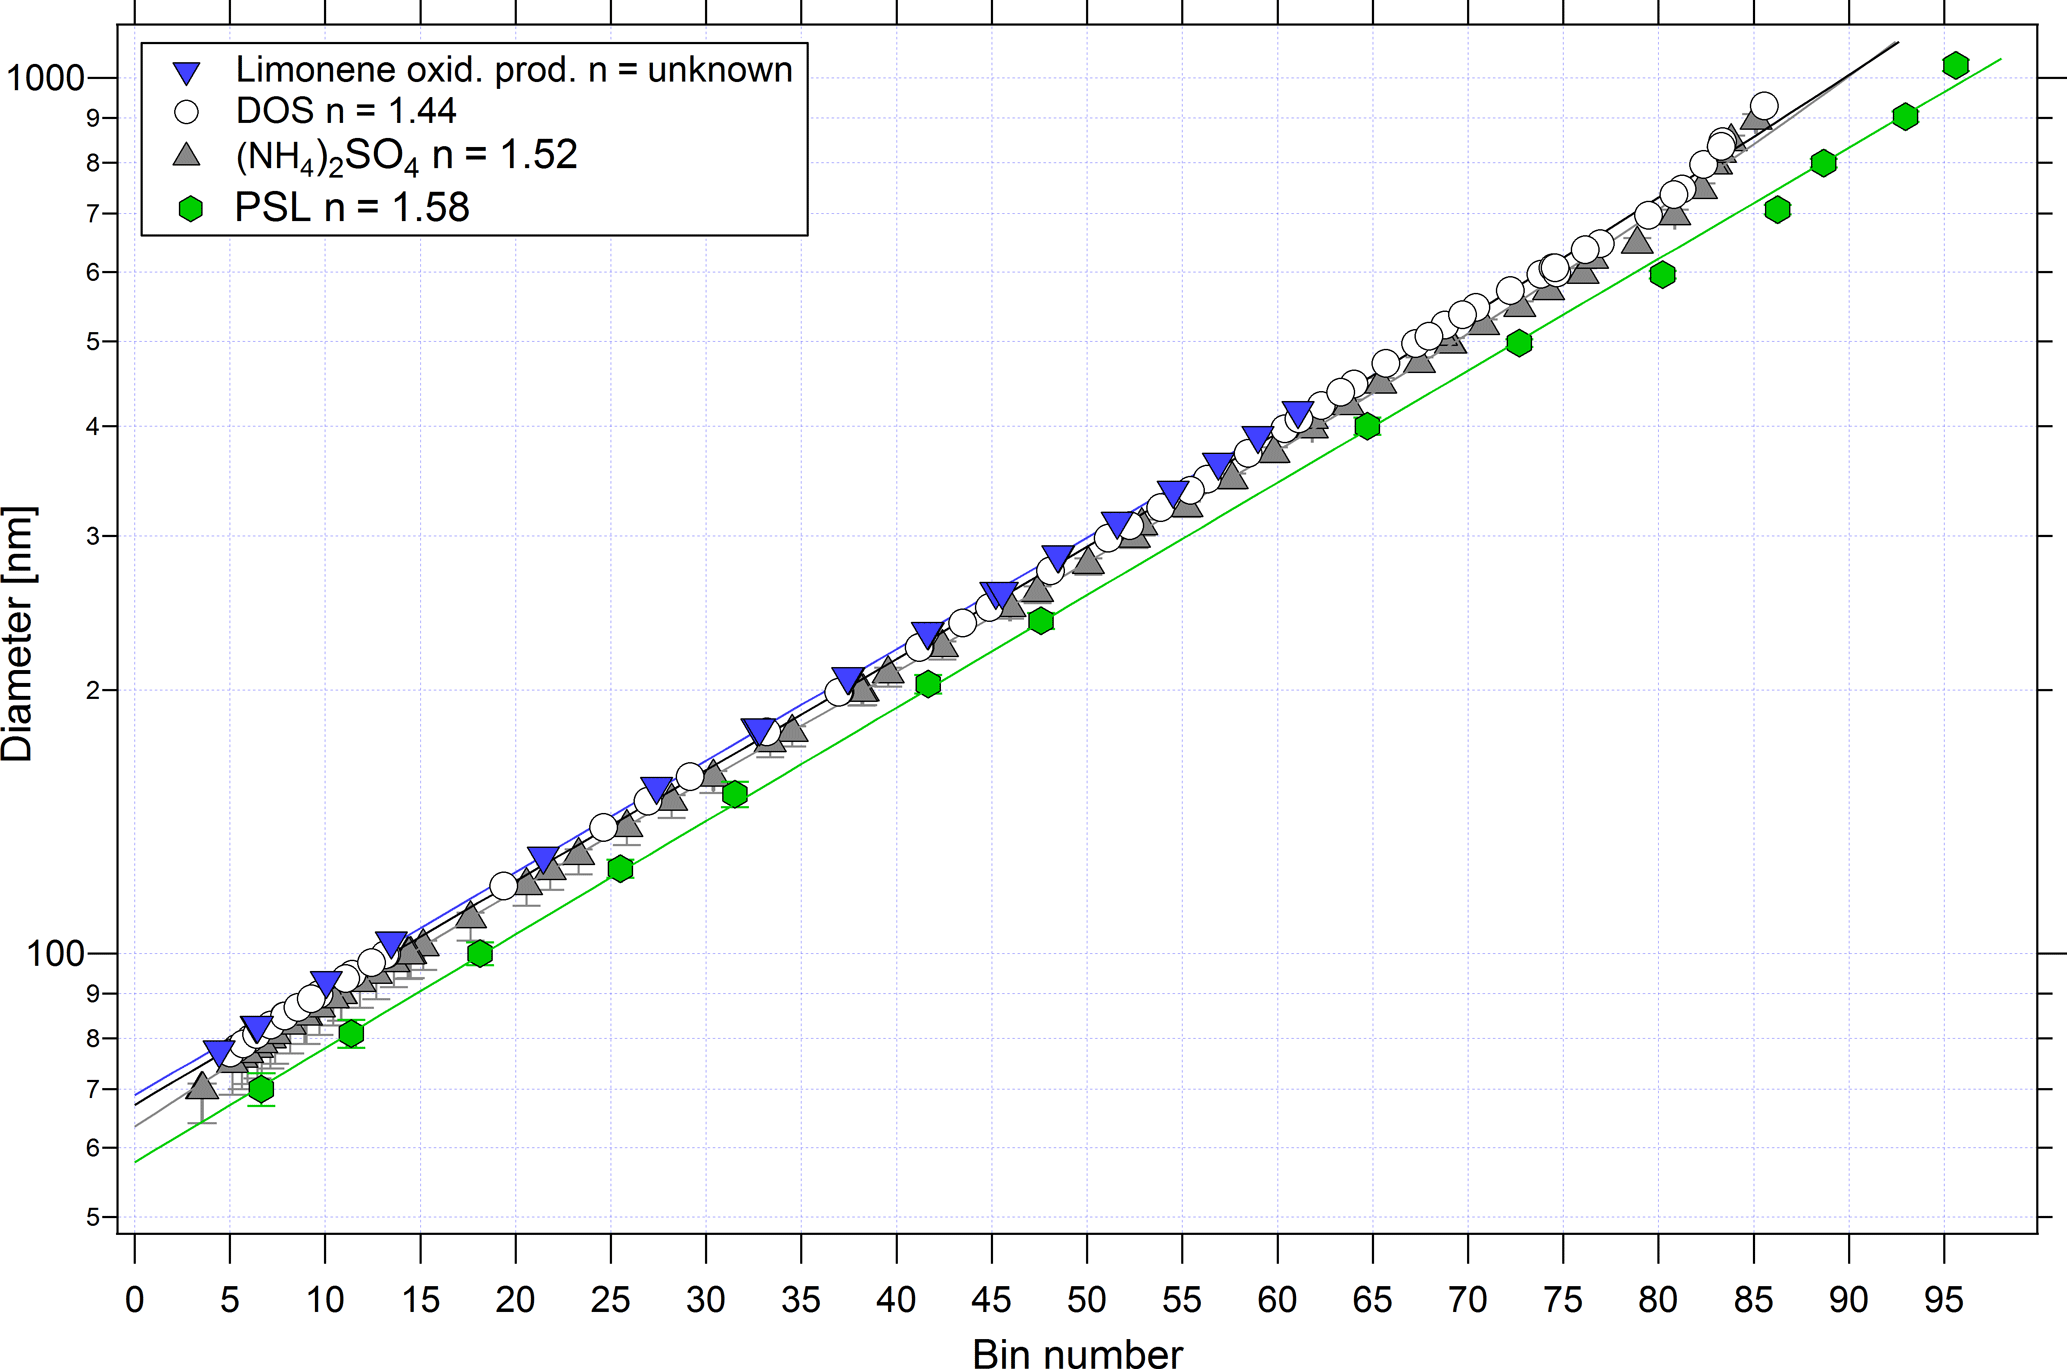
Figure 3Calibration particle diameter as a function of UHSAS-2 (not thermodenuded) bin number for particles composed of PSL, (NH4)2SO4, DOS, and limonene ozonolysis products. Solid lines represent fits to the data. Uncertainties are shown for (NH4)2SO4 and PSL but are often obscured by the symbols.
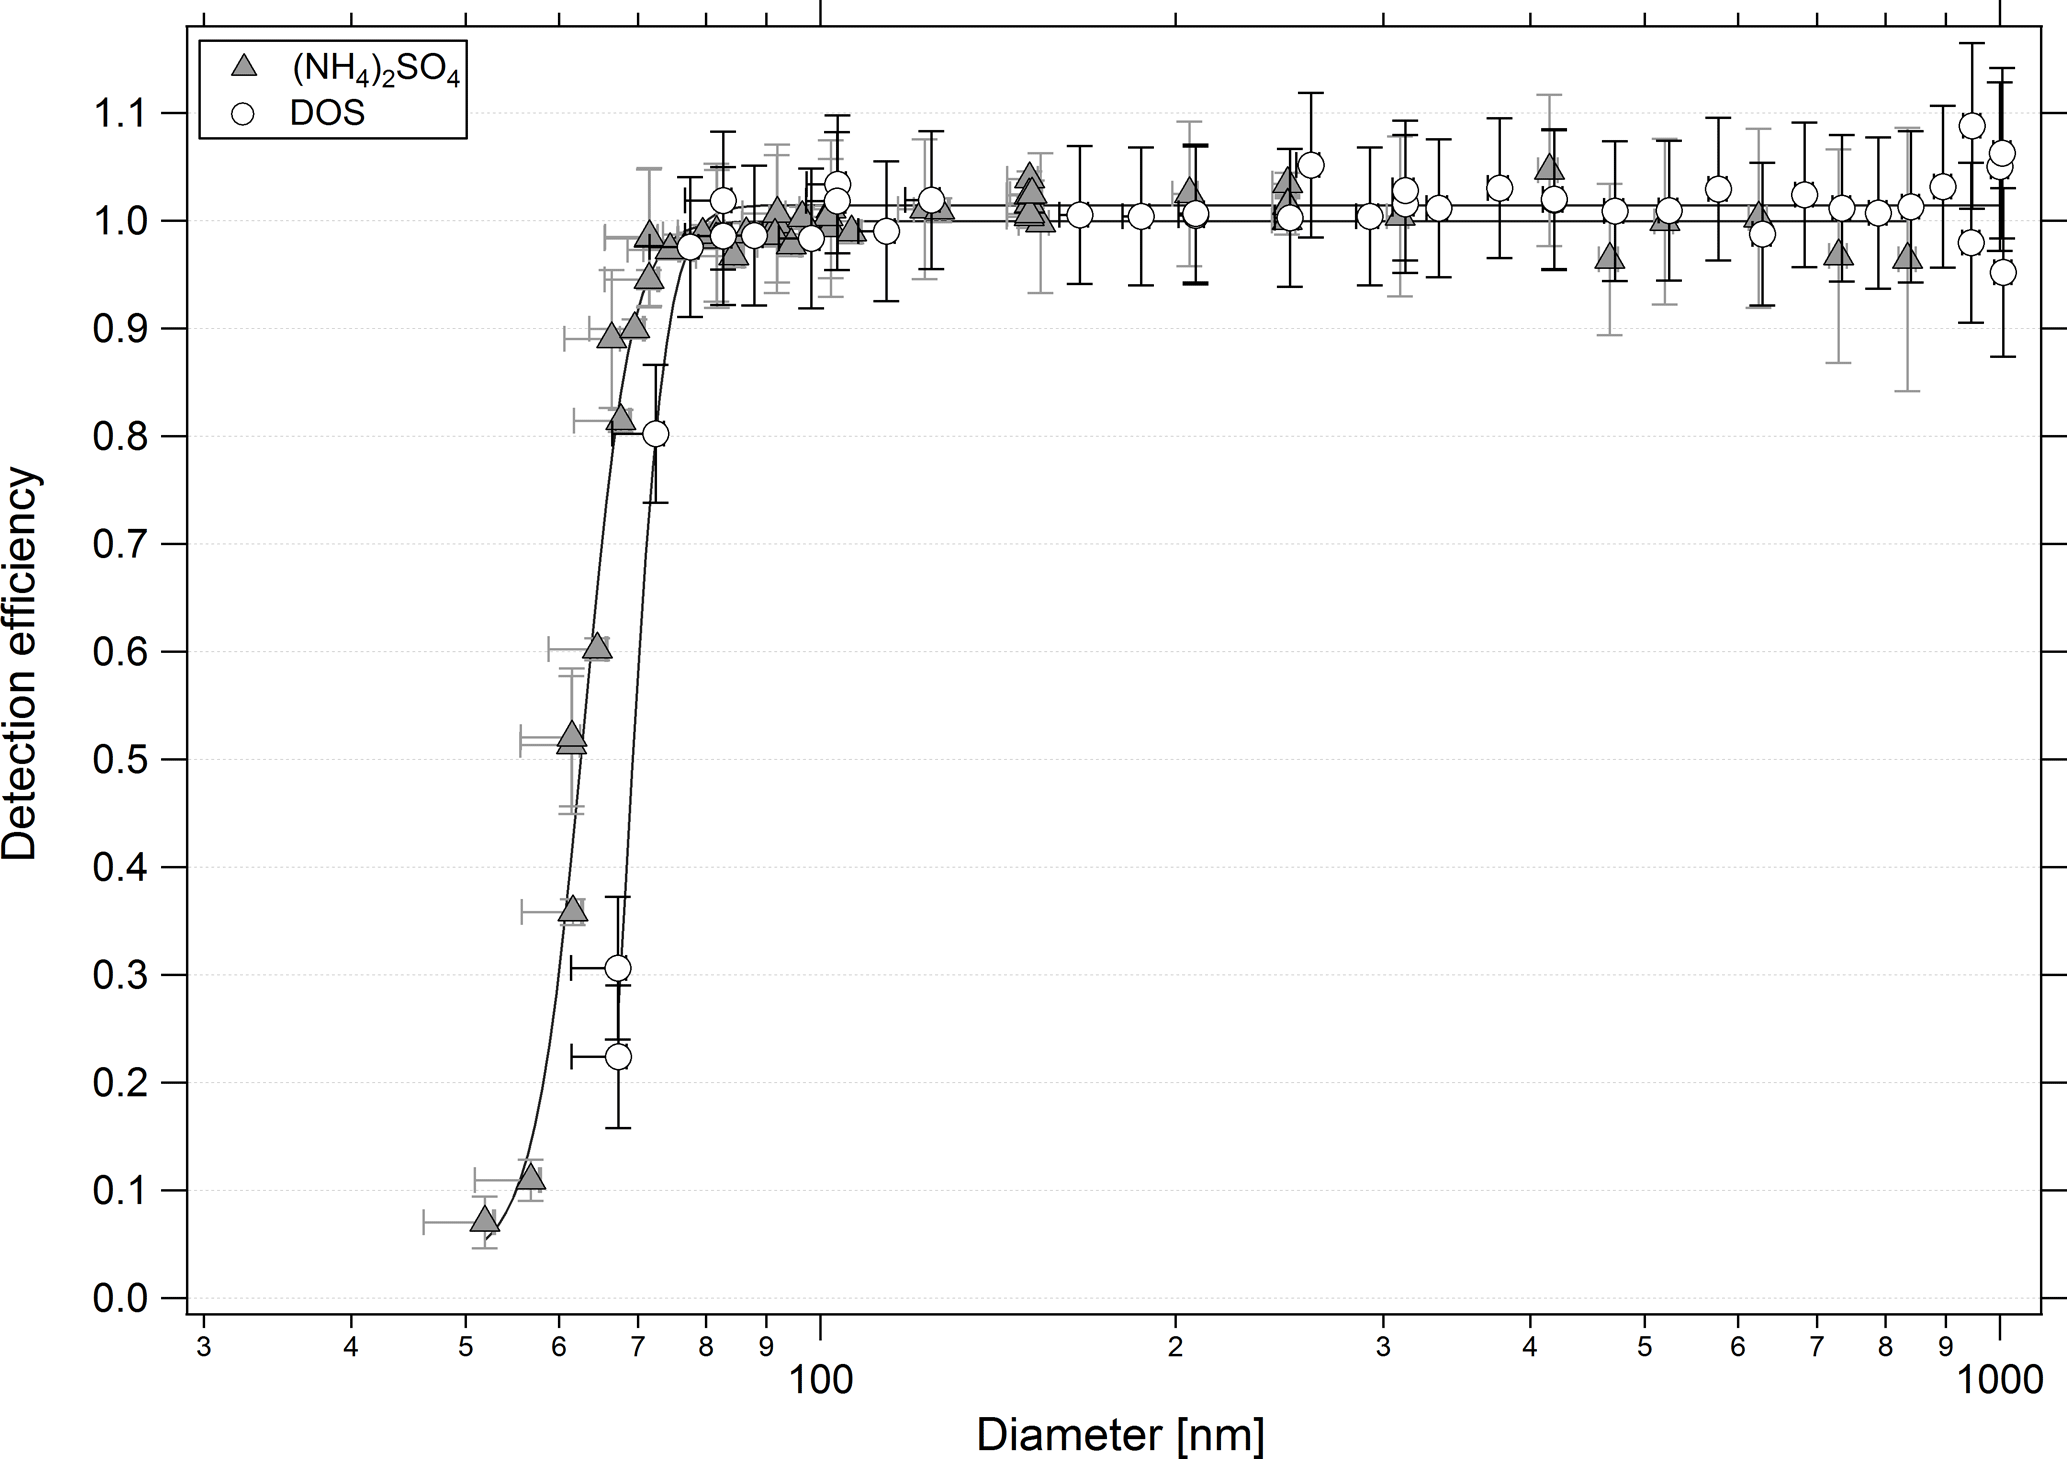
Figure 4Detection efficiency of the non-thermodenuded UHSAS-2 instrument as a function of mobility equivalent diameter for (NH4)2SO4 and DOS aerosol. Data are corrected for coincidence. Solid lines are fits presented to guide the eye.
3.3 Particle detection efficiency
The detection efficiency, the ratio of concentration of particles of a given size measured by the sum of all bins of the non-thermodenuded UHSAS-2 to that measured by a TSI 3022A CPC, depends on the refractive index of the calibration particles used. Figure 4 presents the detection efficiency for the non-thermodenuded UHSAS as a function of mobility equivalent diameter for (NH4)2SO4 and DOS particles, which varies due to the differing refractive indices of these compounds. The diameter uncertainties were calculated as described in Eq. (1), and were corrected for the possible sizing bias observed using PSL standards. In a similar manner the uncertainties in the efficiency were calculated using the UHSAS and CPC uncertainties from the flow and pressure measurements and counting statistics. Detection efficiencies for both UHSASs are provided in Table 1. The thermodenuded UHSAS begins detecting particles at larger diameters than the other instrument.
3.4 The effect of concentration on particle counting
The UHSAS sensitivity to particle concentration was quantified using atomized (NH4)2SO4 particles with diameters > 0.1 µm and concentrations between 1 and 104 cm−3. All concentrations and flow rates presented in this paper are at STP conditions. The UHSAS exhibited a nonlinear reduction in counting efficiency relative to the reference CPC at concentrations > 1000 cm−3 due to particle coincidence in the optical sensing volume (Fig. 5). Since the UHSAS software does not monitor and correct for coincidence effect, or run live-time correction, while the CPC software does, we determined a phenomenological correction based on the observed counting efficiency as a function of count rate (Eq. 2):
where Ntrue is the corrected number concentration (equal to the CPC concentration), Nmeas is the measured number concentration, and Qsamp is the measured volumetric sample flow rate. Based on fitting the data in Fig. 5 to Eq. (2), for the UHSAS-1, τ= 7.81 × 10⁻⁵ s while for the UHSAS-2, τ= 5.36 × 10⁻⁵ s. These values represent the average particle pulse width for each instrument.
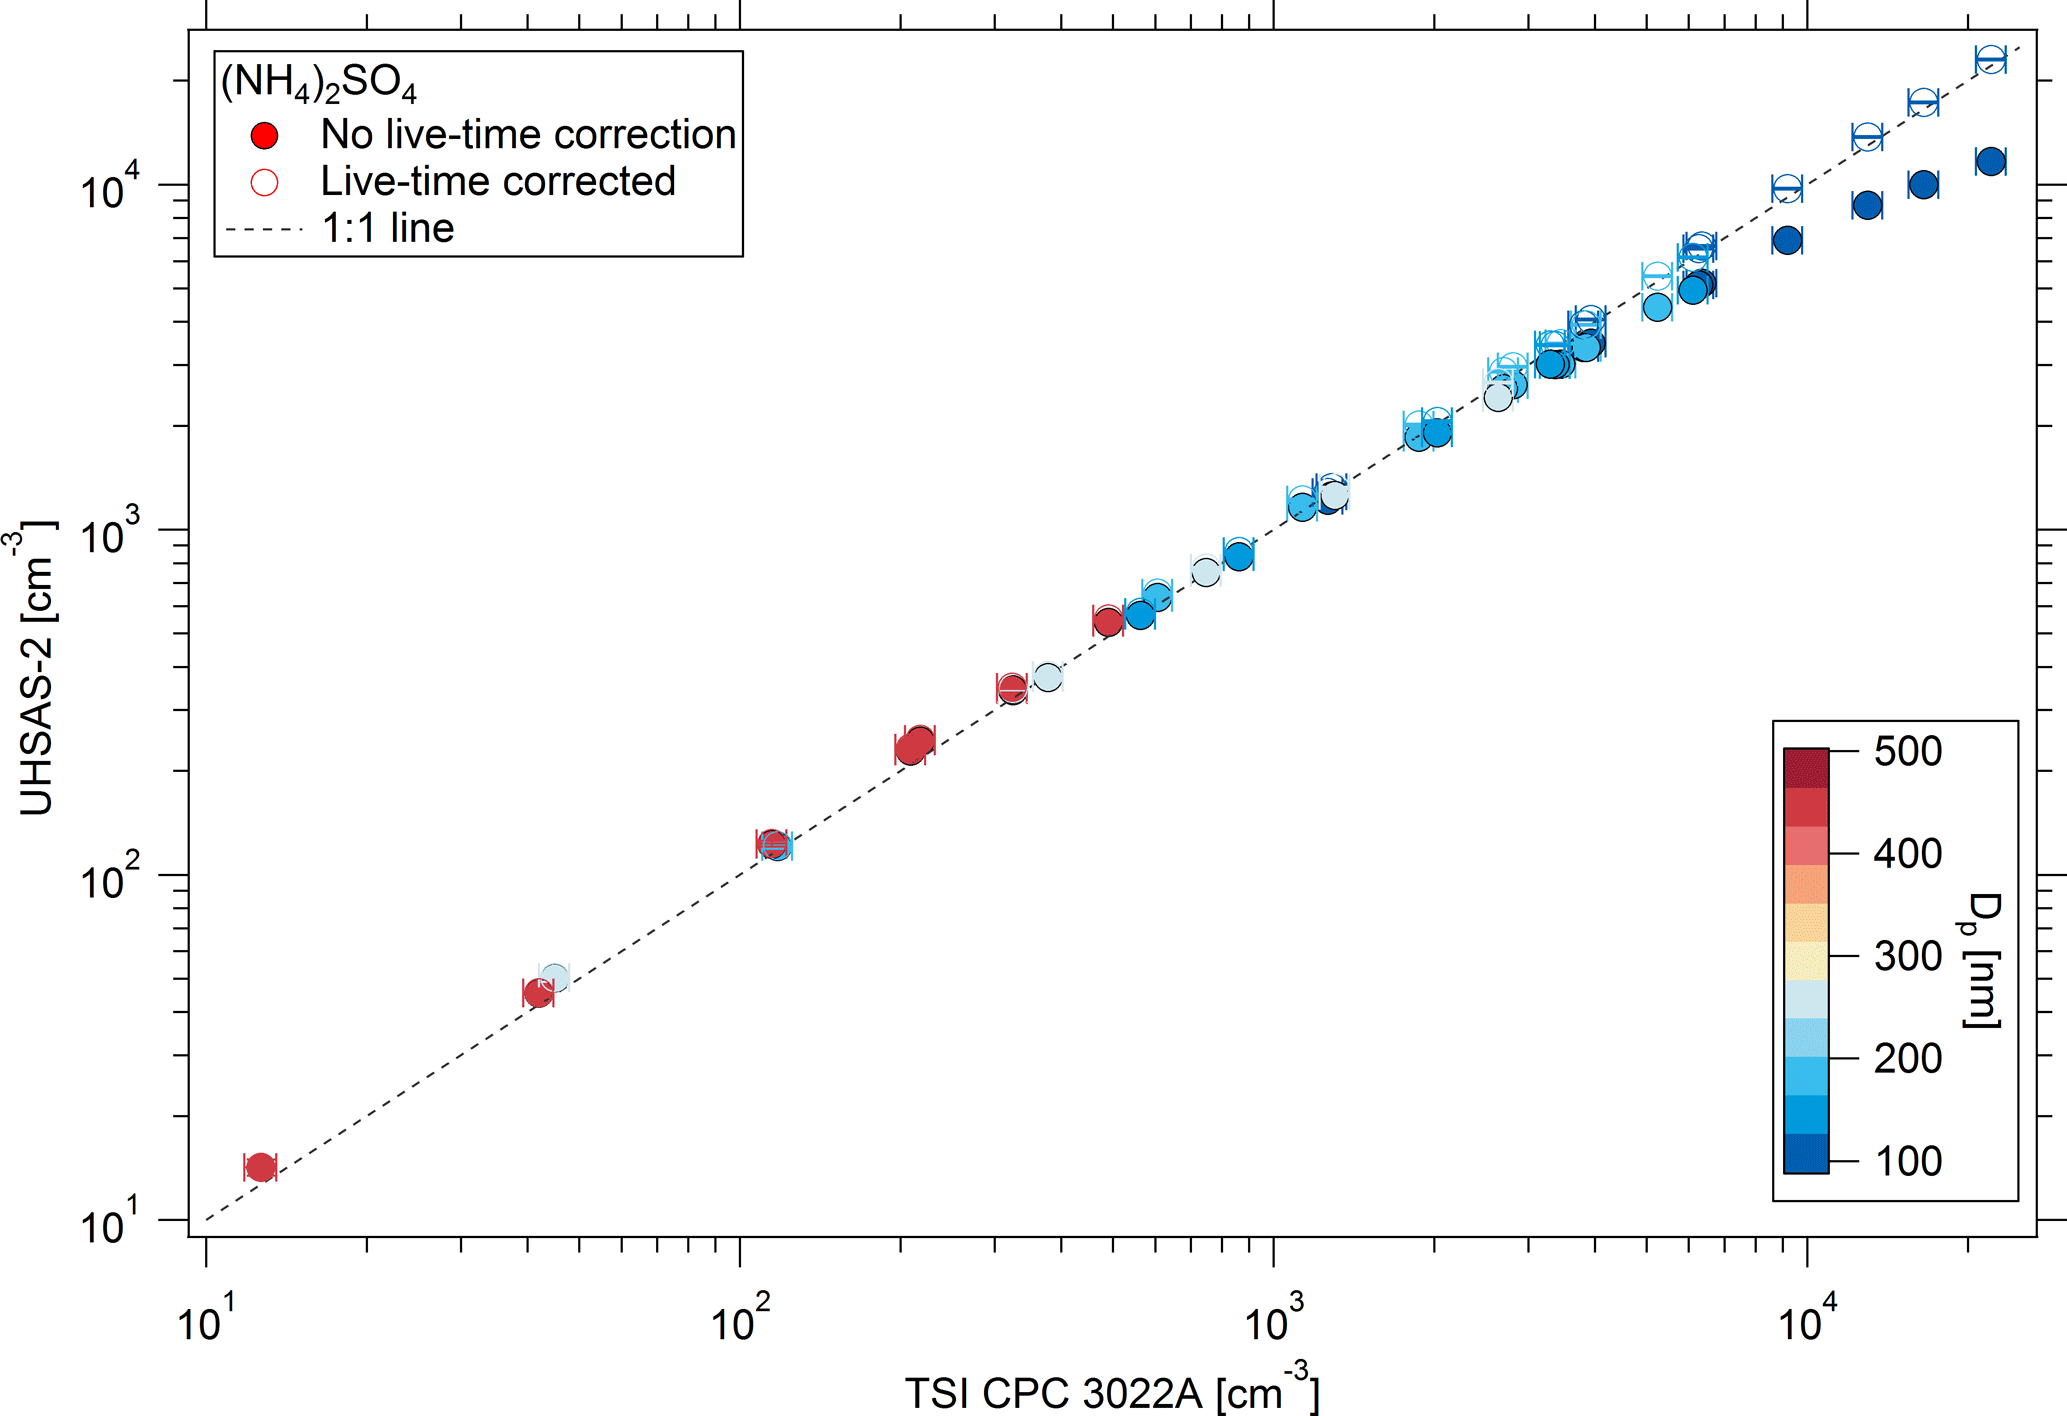
Figure 5Relationship between the UHSAS-2 and the CPC particle number concentration (cm−3) for nearly monodisperse (NH4)2SO4 aerosol of various sizes (> 0.1 µm) at ambient pressure. Dashed line represents 1:1 correspondence line.
3.5 The effect of pressure on sample flow and particle sizing
Laboratory evaluation of the UHSAS operation at reduced pressure conditions is important for the interpretation and validation of the airborne data during the ATom flights. To investigate possible pressure dependencies, a needle valve and an external pump were used to reduce the instrument pressure. The flow passing through a needle valve downstream of the atomizer was split into sample and bypass flows, the latter of which was connected to the pump. The exhausts of the UHSAS instruments were also connected to the bypass flow line to keep them at near-inlet pressure. A mixture of four PSL sizes was atomized and measured as instrument pressure was adjusted to as low as 250 hPa. The sizing of the UHSAS instruments showed no statistically significant pressure dependence (Fig. S1). The mean bin number and replicate standard deviation associated with each of the four PSL sizes at various pressure settings is 10.5 ± 0.19, 24.5 ± 0.24, 47.6 ± 0.2, and 64.5 ± 0.2 for the 81, 125, 240, and 400 nm PSL particles, respectively. Using the standard (NH4)2SO4 calibration curve (Fig. 3), which relates bin number to particle diameter, the equivalent relative standard deviations in diameter were ±0.6, 0.7, 0.5, and 0.7 % for the four diameters, respectively.
Using the same setup, we investigated the effect of changing pressure on the sample flow. The aerosol volumetric flow rate showed a pressure dependence, decreasing from 60 at around 850 hPa to about 35 cm3 min−1 at 250 hPa (near the minimum pressure encountered during ATom). This flow reduction is caused by a small leak in the optics block downstream of the detection region. It was impractical to disassemble the complex optics assembly to find the source of this leak. Therefore, we directly measure the sample flow to account for this effect on concentration, and the leak does not affect UHSAS sizing characteristics (Fig. S1).
A compact thermodenuder was designed and installed in UHSAS-1 to determine the number and volume fraction of volatile particles (Fig. 6; Table S2). This measurement is used to identify particles that are formed from secondary products (e.g., sulfates, nitrates, and organics) from primary particles (e.g., soil dust and sea salt; Clarke, 1991; Huffman et al., 2008). Quantifying the volatile-to-non-volatile aerosol fraction during ATom may help improve understanding of the importance of secondary particles relative to sea salt such as CCN in the MBL, an area of active scientific inquiry (e.g., Bates et al., 2016; Quinn et al., 2017).
4.1 Design
We constructed a custom thermodenuder based on the design principles outlined by Fierz et al. (2007), who improved denuder performance by providing a heated adsorption section. This thermodenuder operates at a lower flow rate and is of a smaller size compared to previous designs. An electric actuator (MDM-060DT, Hanbay Inc., Pointe-Claire, Quebec, Canada), driving a Swagelok valve (SS-43YF2) is used to automatically switch between sampling through the thermodenuder or bypassing it. The thermodenuder consists of a heated section (length, L= 10.16 cm, inner diameter (ID) = 0.48 cm) held at a fixed temperature (T= 300 ∘C) followed by an adsorption section of same dimensions (Fig. 6; Table S2). Both sections are housed in stainless steel tubing (L= 30.48 cm, OD = 1.27 cm) which contains an inner porous, perforated tube of the same length constructed from two pieces and manufactured using a metallic 3-D printing technique, direct metal laser sintering (Xometry, Gaithersburg, MD, USA). This perforated tubing is wrapped with activated carbon fabric (Zorflex; 4.066 g). The outer tube passes through an aluminium housing which holds the tube and temperature sensor in place and is wrapped with a heating tape and fiberglass insulation material. Two fans installed in the outer casing of the heating section the entrance and exit sections of the thermodenuder cool these sections of the outer tube. A thermal process controller monitors a resistance thermal detector (RTD) and controls the temperature of the aluminium block housing using a cylindrical cartridge heater. The temperature of the housing is maintained in flight at 300 ± 0.5 ∘C. The residence time of the aerosol in the thermodenuder as well as the temperature profile in part determine thermodenuder performance. Fierz et al. (2007) developed simple guidelines for selecting an appropriate thermodenuder heated section length for a particular sample flow rate. Our thermodenuder meets these recommendations and provides a residence time in the heated section between 1.59 and 3.7 s. We do not directly measure the thermal profile within the compact thermodenuder.

Figure 6Schematic cross section of the thermodenuder and conceptual temperature profile. Temperature is measured at a single point with a platinum RTD sensor inside the aluminium housing around the heated section. The thermal diffusion length estimate assumes standard pressure and temperature and typical flow in the thermodenuder, small perturbations in temperature, and is used only for qualitative understanding of heat flow in the thermodenuder.
4.2 Thermodenuder performance
Particle losses through the thermodenuder were determined relative to either a TSI 3022A CPC or the second UHSAS instrument. With the thermodenuder operating at room temperature, losses through the sample selection valve and heater plumbing were < 13 % for particles with Dp > 0.15 µm. The mechanism and size dependence of this particle loss is currently unclear and requires further investigation. With the heater on and the thermodenuder operating at 300 ∘C, losses of non-volatile NaCl particles did not change significantly.
The efficiency of volatilizing particles in the thermodenuder was tested using DMA-size-selected particles from the generation of NaCl, (NH4)2SO4, and limonene oxidation products at concentrations < 1000 cm−3. The UHSAS-1 alternated sampling between the thermodenuded and unheated sample lines every 2–3 min. The temperature of the thermodenuder was increased in steps from room temperature up to 310 ∘C and the fraction of particles exiting the thermodenuder (relative to the unheated sample) at three different particle sizes was determined (Fig. 7). Particles composed of (NH4)2SO4 were most volatile, limonene oxidation products were less volatile, while NaCl was not volatile at the temperatures investigated. Smaller particles of (NH4)2SO4 and limonene oxidation products volatilized at lower temperatures than larger particles of the same material, suggesting the particles were highly viscous, glassy, or solid. The effect of particle concentration on performance was checked with particles generated from limonene oxidation products at 0.15 µm in diameter and concentrations of up to 11 000 cm−3. All particles at these concentrations were effectively volatilized, with no “break-through” effects observed. In no cases was there any evidence of recondensation of volatilized material to form new particles or to add material onto partially volatilized or non-volatile particles.
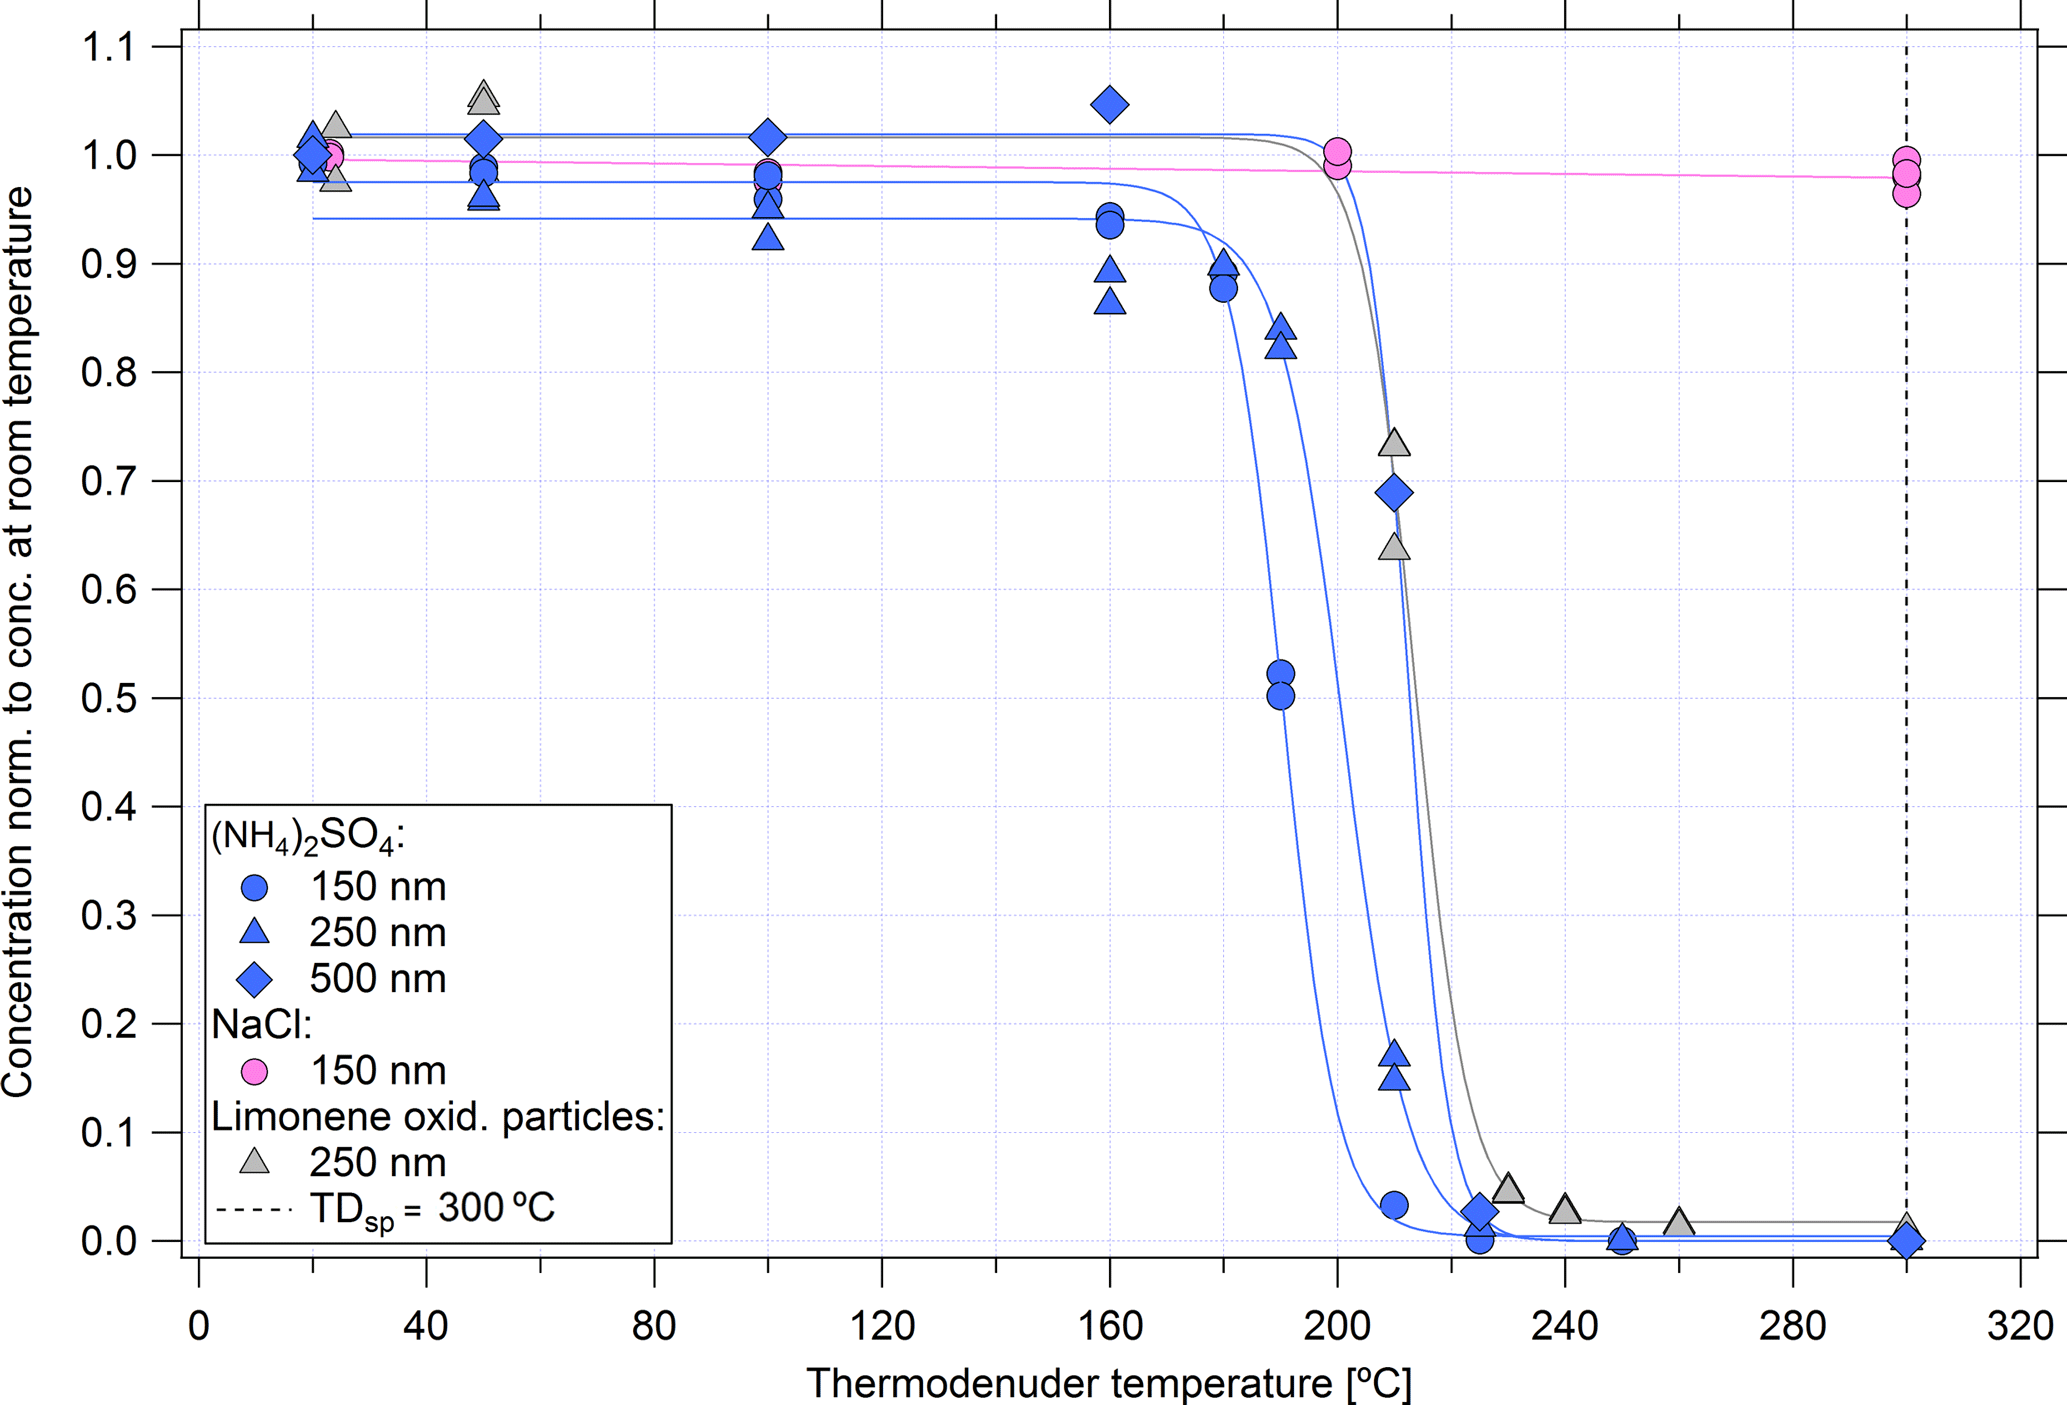
Figure 7Particle response to heating as a function of temperature of the thermodenuder, particle size, and composition. Data normalized to the number measured at ambient temperature. Solid lines are used to guide the eye. The stability of the set temperature (dashed line) was within ±0.5 ∘C.
5.1 Uncertainties due to refractive index
Uncertainties in the aerosol volume and surface calculated from atmospheric dry size distributions depend on possible biases associated with the actual refractive index and shape of the particles vs. the calibration aerosol, as well as on random uncertainties associated with counting statistics, flow rate, pressure, sizing precision, and calibration accuracy. Since the ATom project focuses on the remote atmosphere where well-aged particles are expected to dominate the submicron aerosol (outside of sea salt and dust cases), we did not investigate the effect of particle shape on sizing accuracy. Since the refractive index of organic compounds in the atmosphere is unknown but is likely bounded by our different calibration materials (e.g., Kim and Paulson, 2013), we use the range of instrument responses to the different calibration aerosols to estimate the likely effect of potential refractive index biases on aerosol volume and surface area derived from the UHSAS measurements.
As an example of the effect of these potential sizing biases on measured size distributions, we have selected a period of time from one of the ATom-2 flights (10 February 2017, Christchurch–Punta Arenas) while in the free troposphere (P∼ 200–400 hPa). Using the range of instrument response curves for (NH4)2SO4 (n= 1.52), DOS (n= 1.44), or PSL (n= 1.58), the reasonable range of possible particle diameters associated with each UHSAS channel (bin) could vary by as much as +4/−10 % (as described in Sect. 3.2). These diameter uncertainties propagate into aerosol volume and surface uncertainties of +12.4/−27.5 and +8.4/−17.8 %, respectively, as calculated from each 1 s size distribution (Fig. 8). Examples from this and other cases representative of conditions encountered during ATom flights are summarized in Table S3.
5.2 Uncertainties due to flow and pressure
Random uncertainties may arise from uncertainty in sample flow rates and uncertainty in the pressure measurement used to convert instrument concentrations to standard temperature and pressure (STP; 0 ∘C and 1013 hPa). Uncertainty in the sample flow rate is ± 0.86 % based on repeated calibrations of the sample flow meter over a range of 0–0.1 L min−1 using a reference calibration device (DryCal DC-Lite, Bios, Inc., Butler, NJ, USA). The uncertainty in the STP flow rate is the sum in quadrature of the flow calibration variation, the uncertainty of the DryCal flow calibration device (±0.25 %), the uncertainty in the differential pressure transducer reading (±0.25 %), and the uncertainty in the sample pressure (Eq. 1). The uncertainty of the measurement of the UHSAS-2 sample pressure at sea-level pressure is better than 0.38 % when comparing to a reference pressure gauge. At < 300 hPa, this pressure uncertainty was 3.8 % due to the lower accuracy of the pressure reference standard used for lower pressures. The total propagated random uncertainty for the STP sample flow is < 3.9 %.
5.3 Uncertainties due to counting statistics
Very low concentrations of accumulation-mode particles were often encountered in the free troposphere during the ATom mission. Uncertainties associated with resulting poor counting statistics at 1 s resolution are reduced by averaging over longer time intervals. The uncertainty caused by the counting statistics was estimated for 1, 10, and 60 s data-averaging times using various STP concentrations (20–440 cm−3) representative of typical MBL and the upper-FT conditions encountered (Table S3). As an example, uncertainties for STP concentrations of ∼ 150 and ∼ 30 cm−3 as measured in the MBL for 1 s acquisition intervals were ±8.7 and ±18 %, respectively. In the FT the uncertainties were much greater: ±14 and ±41 % for STP concentrations of ∼ 440 and ∼ 25 cm−3, respectively. Actual instrument counting rates in the FT were much lower than for equivalent STP concentrations measured in the MBL because of lower air density.
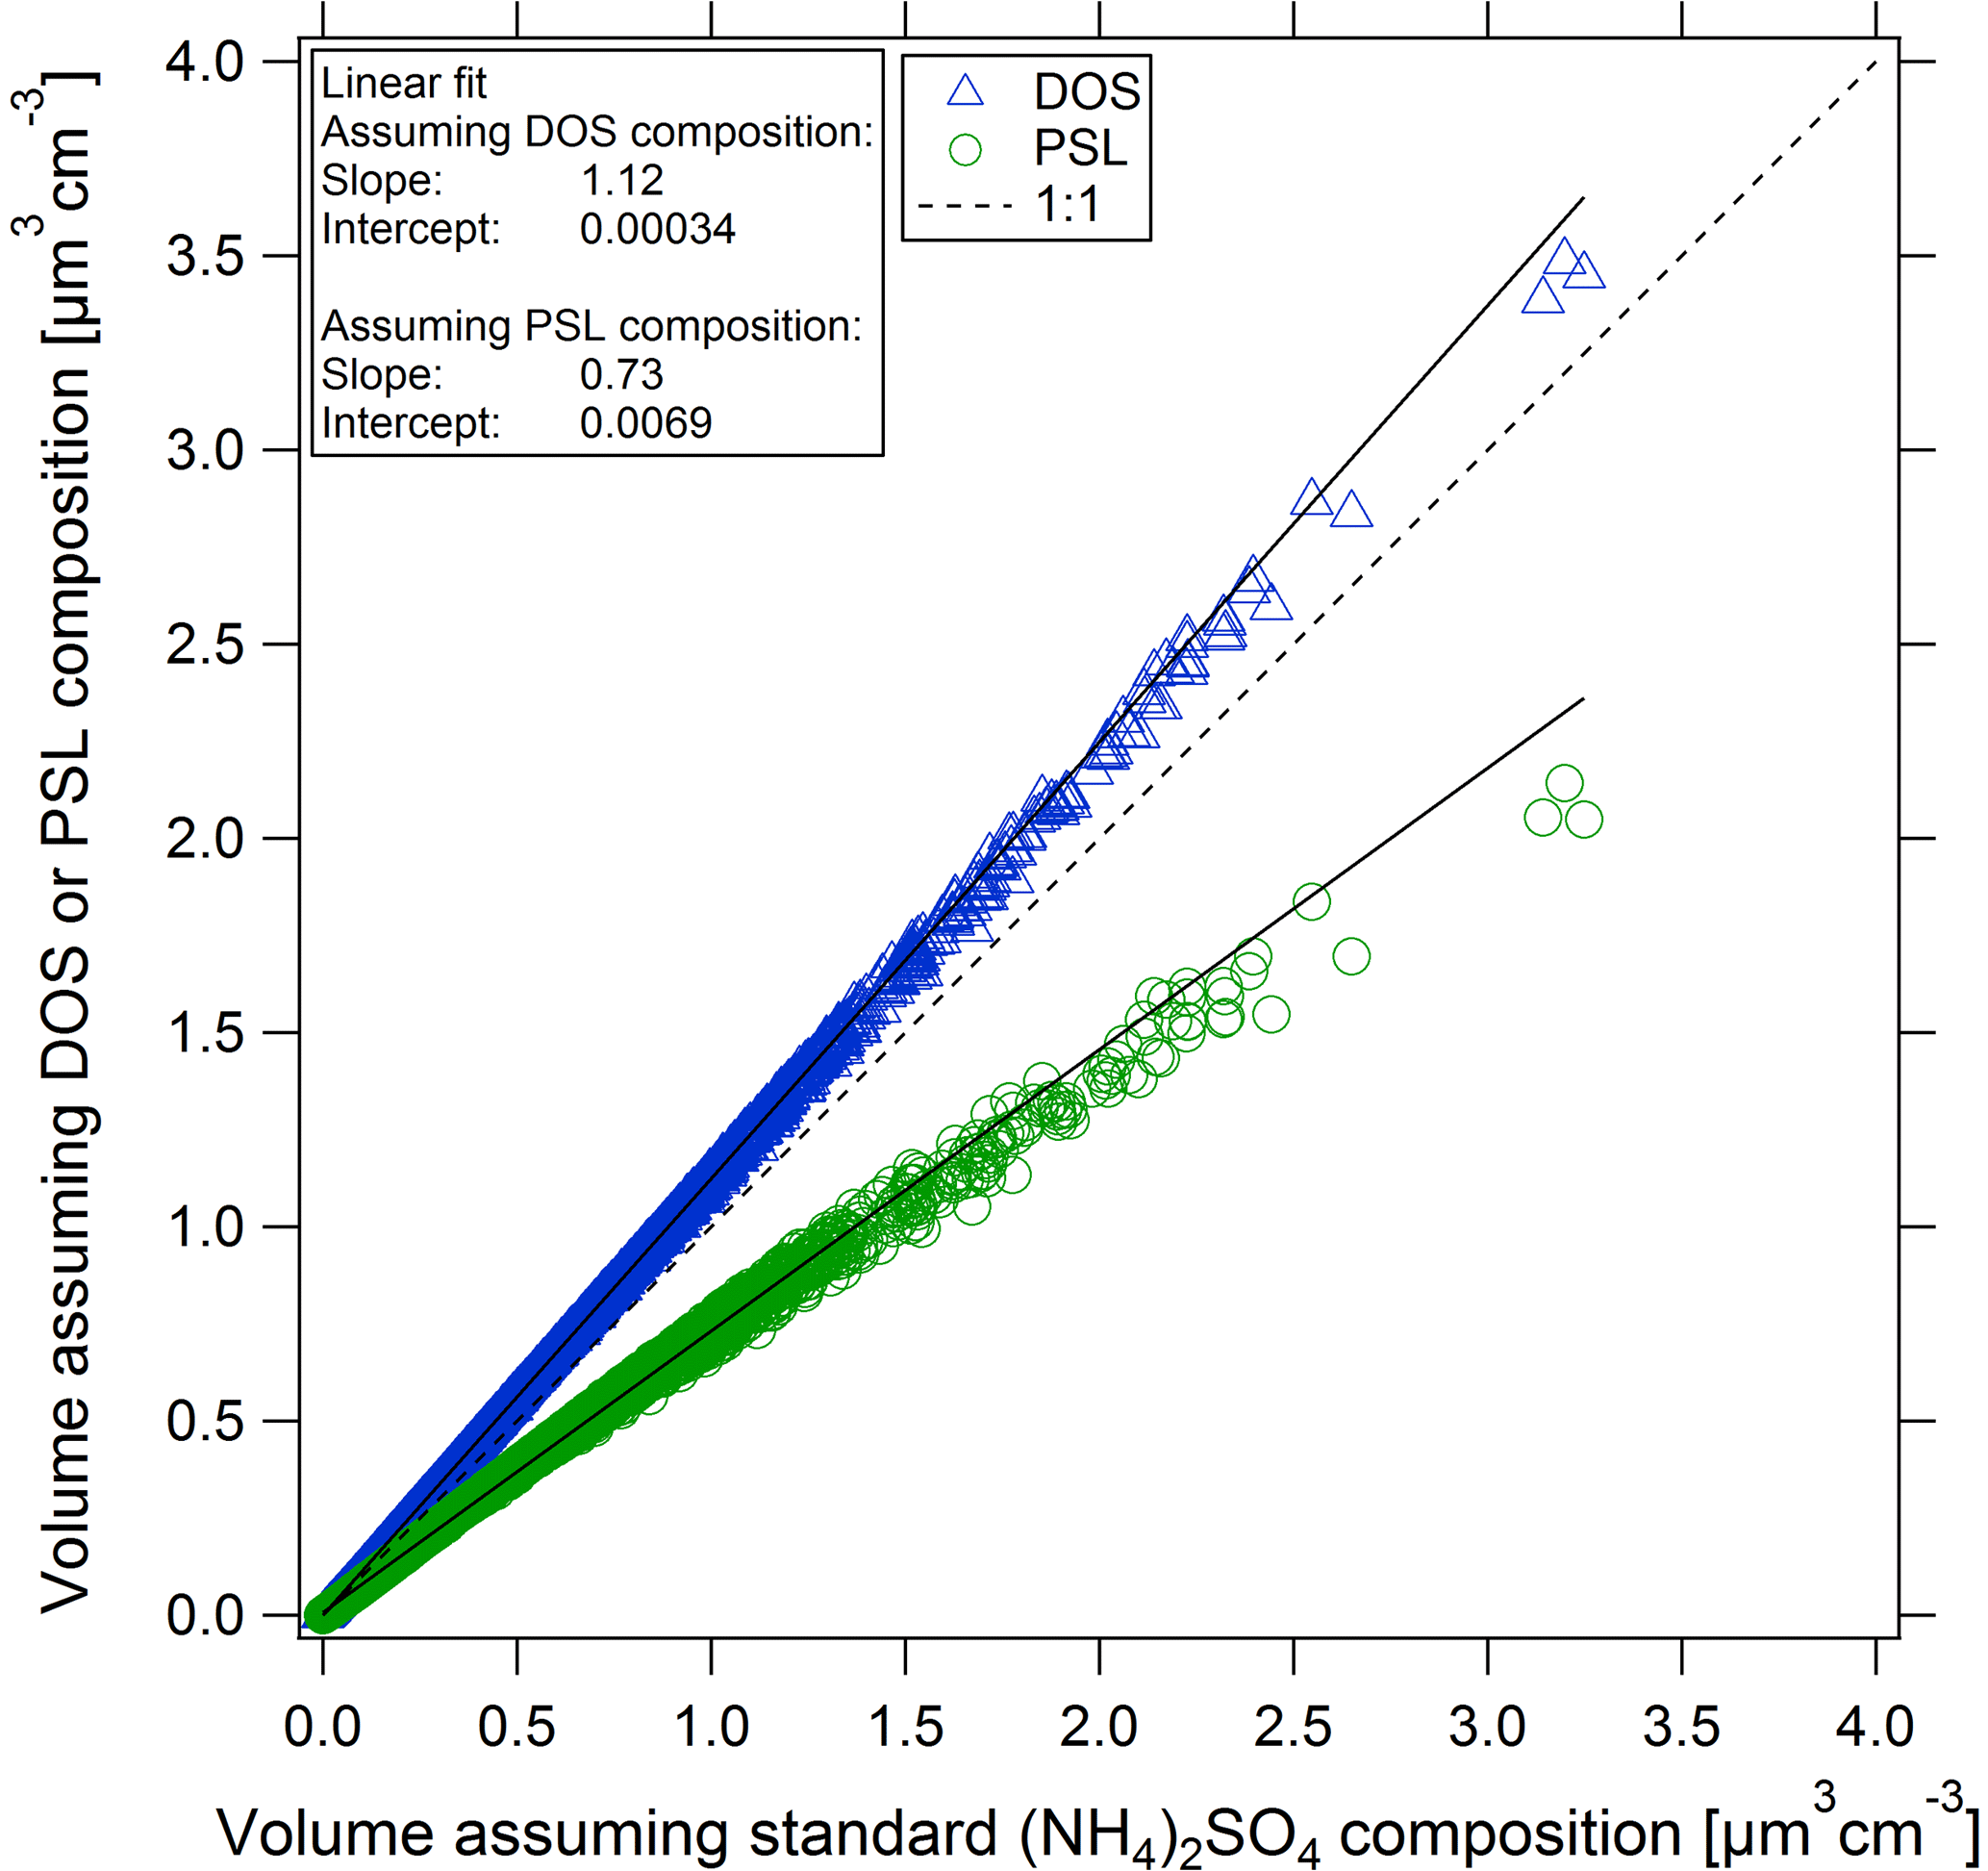
Figure 8Comparison of the calculated aerosol volume from the UHSAS-2 measured dry size distributions based on calibration particles with refractive indices between 1.44 and 1.58: (NH4)2SO4 (n= 1.52), DOS (n= 1.44), and PSL (n= 1.58). Flight data shown (10 February 2017) are from 1 s measurements. Solid lines represent double-sided orthogonal distance regression linear fits.
5.4 Uncertainties due to instrument stability and calibration repeatability
Although careful calibrations undertaken using a DMA in the laboratory provide a precise assessment of UHSAS sizing characteristics, a method to validate the calibration stability of the UHSAS instruments in the field, where the DMA could not be carried out, is critical. A solution of four PSL sizes (81, 125, 240, and 400 nm) in HPLC-grade water was atomized producing an aerosol with four distinct concentration peaks that could be measured by the UHSAS (Fig. 9). The sizing channel associated with each PSL diameter was determined by fitting a Gaussian curve to each peak in the size distribution histogram. The standard deviation of the identified peak bin was determined for a total of 84 calibrations taken before and after each flight, and at high altitude during test flights. The mean bin number and replicate standard deviation associated with each of the four PSL sizes is 10.8 ± 0.4, 25.2 ± 0.3, 47.4 ± 0.2, and 64.6 ± 0.2 for the 81, 125, 240, and 400 nm PSL particles, respectively. Using the standard (NH4)2SO4 calibration curve (Fig. 3), which relates bin number to particle diameter, for the UHSAS-2 instrument the equivalent precisions in diameter were ±1.2, 0.8, 0.7, and 0.7 % for the four PSL sizes, respectively (Fig. 9). Because the power in the optical cavity is sensitive to contamination of the optics, the UHSAS sizing calibration may shift over time. This was observed during the middle of the Atom-1 mission in the UHSAS-1 when optical power dropped by 27 %. Because of the repeated calibration checks with the PSL particles, we were able to correct the observed size distribution with minimal errors despite the shift in calibration. Upon return to the laboratory, the instrument was recalibrated, then cleaned until laser power was restored and then calibrated again.
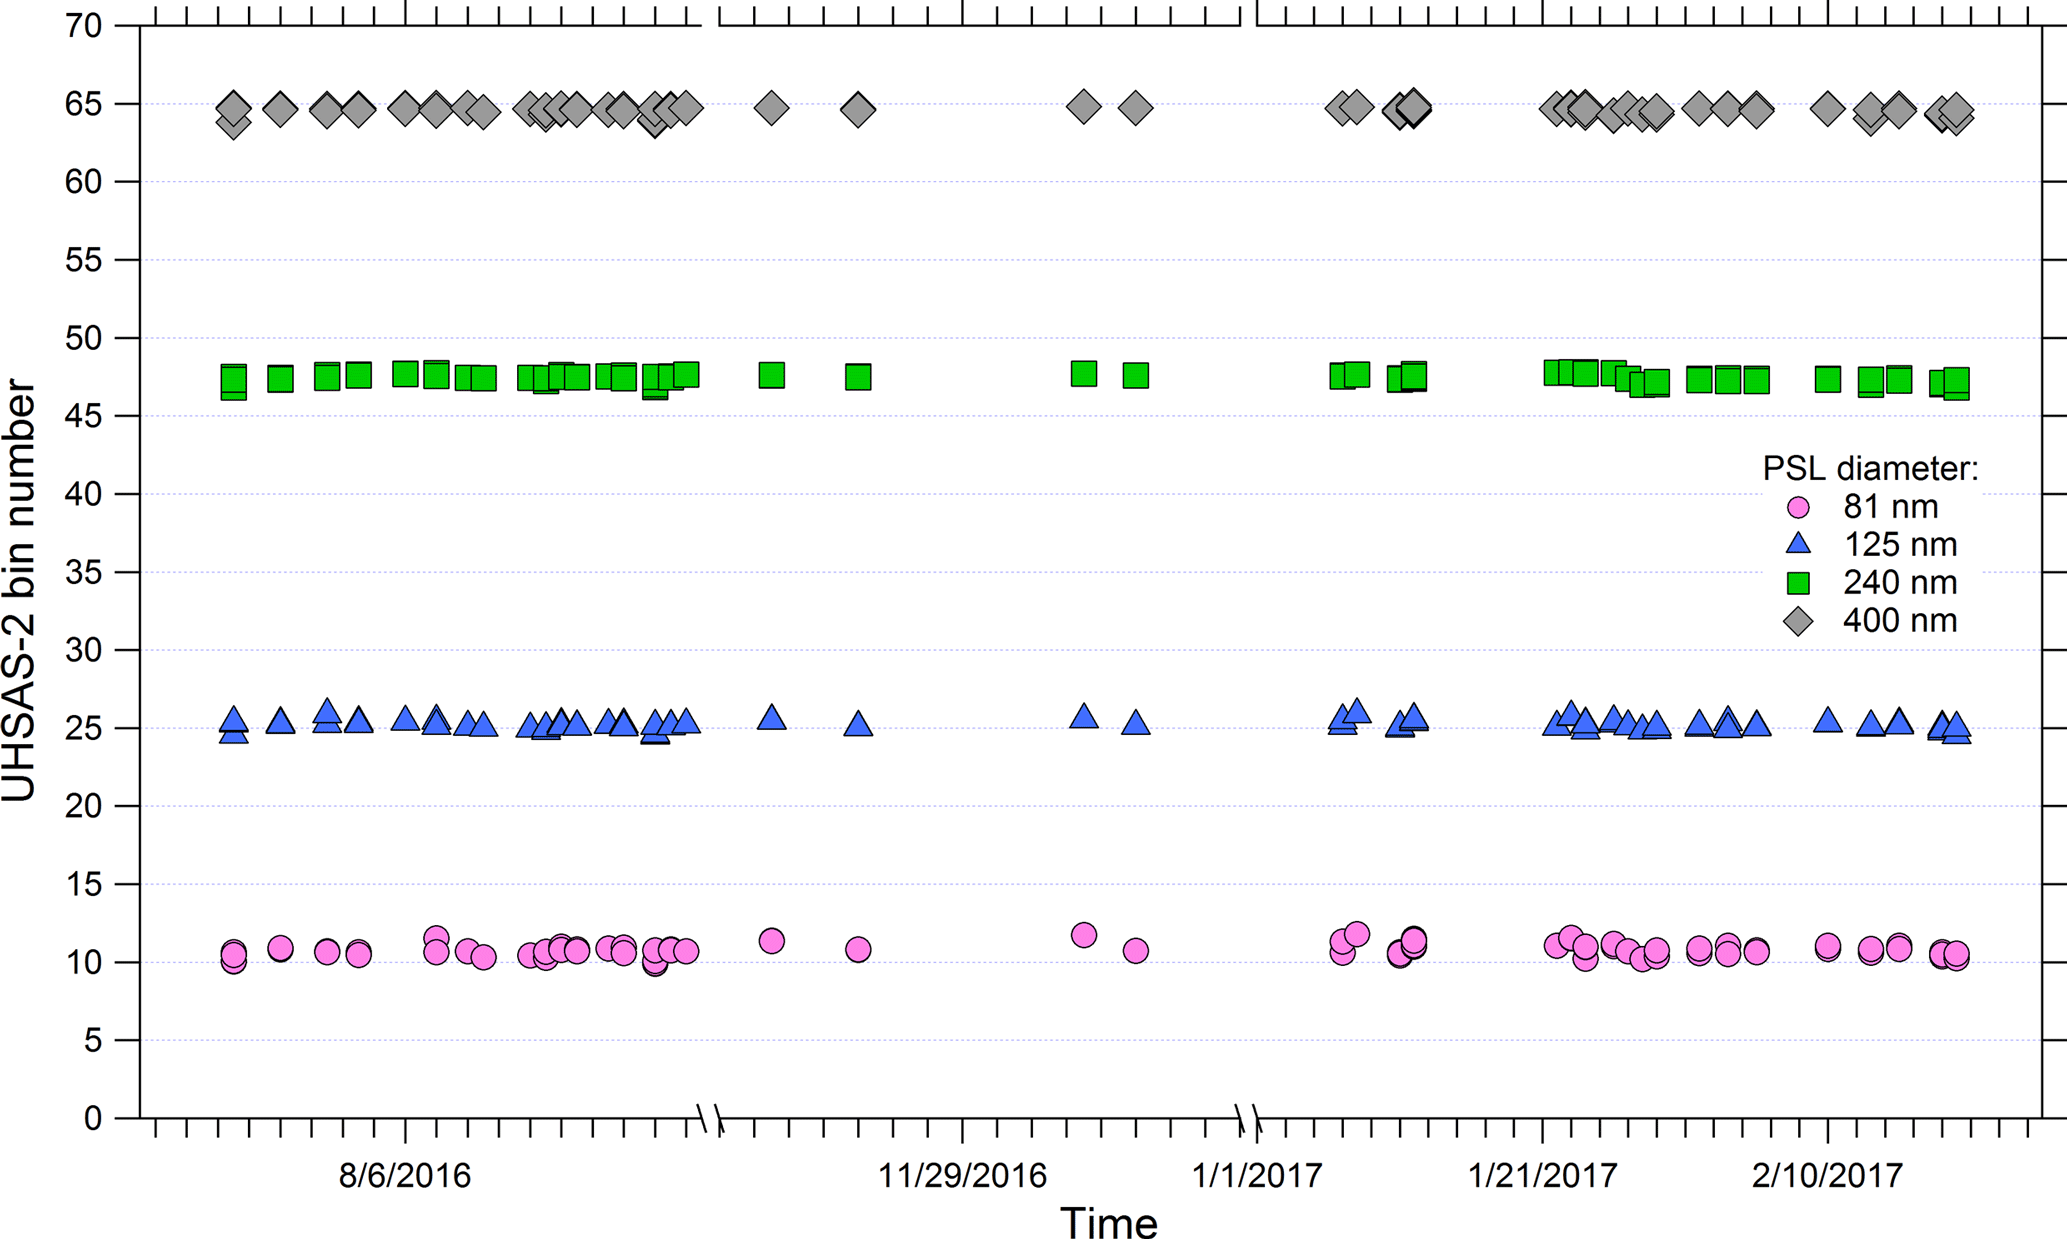
Figure 9Fitted peak bin number for four PSL size standards and as a function of time from July 2016 to February 2017, showing calibration precision and the stability of the UHSAS-2 sizing during ATom-1 and -2.
5.5 Total uncertainties
The total relative uncertainties for aerosol number concentration, surface, and volume for cases of low and high particle number concentration measured in MBL and FT during ATom-2 mission are summarized in Table S3. The total uncertainty consists of random uncertainties due to the counting statistics, sample flow, and pressure measurements, and possible systematic uncertainties due to sizing biases from the unknown refractive index of the atmospheric aerosol. The total uncertainty for aerosol number, surface, and volume represents the sum in quadrature (Eq. 1) of the random uncertainties plus the linear addition of possible systematic sizing biases propagated through the surface and volume calculation.
We have not considered particle shape and homogeneity as a potential source of uncertainty. Given the laser wavelength of 1054 nm, and because most particles encountered in ATom were aged and likely only modestly aspherical, we do not expect shape sizing biases to be significant except for some larger sea salt and fresh dust particles.
In this section, we describe the performance of the modified UHSAS instruments measuring dry aerosol size distributions, both directly sampled and thermodenuded, on the DC-8 aircraft during the ATom-1 (July–August 2016) and ATom-2 (January–February 2017) missions. Brock et al. (2018) more thoroughly describe the inlet and sampling configuration and provide comparisons between several aerosol instruments on the ATom payload. The measured internal UHSAS instrument pressures varied between ∼ 1100 (due to ram pressure) and 225 hPa, which corresponded to 0.15–13 km in altitude. The two UHSAS instruments sampled in parallel at 1 Hz downstream of a Nafion dryer that reduced sample RH to < 20 %. Periods of in-cloud measurement were excluded from the reported data due to aerosol sampling artifacts caused by droplets or ice crystals impacting the inlet, which produced spurious counts in the UHSAS instruments.
6.1 Consistency of aerosol number concentration, surface, and volume measured by UHSAS-1 and UHSAS-2
During the ATom-1 deployment the thermodenuder on the UHSAS-1 instrument was not operated, allowing for direct comparison between the two UHSAS instruments. We compare number, surface, and volume concentrations over the diameter range from 0.1 to 0.9 µm to see if the measurements agree within the estimated uncertainties. We focus on the first five flights of ATom-1, between 29 July and 8 August 2016, before the laser power on the UHSAS-1 instrument shifted. The number, surface, and volume concentrations were highly correlated between the two instruments (r2 > 0.98), with slopes within 5 % of 1 (Fig. 10). This agreement is well within the propagated uncertainties over the full dynamic range of 0–3000 cm−3, 0–380 µm2 cm−3, and 0–16 µm3 cm−3 for number, surface area, and volume concentrations, respectively.
During ATom-2, when the UHSAS-1 was operated with the thermodenuder, the two UHSAS instruments could be compared by periodically switching the UHSAS-1 flow to bypass the thermodenuder when in MBL. During the non-thermodenuded sampling intervals, the agreement in concentration measured during first three flights (29 January–3 February 2017) over the Pacific was found to be between 0.97 ± 0.011 and 1.04 ± 0.01 (for 1 s data). The corresponding slopes for aerosol surface and volume concentration varied between 0.97 and 1.02 and between 0.95 and 1.08, respectively.
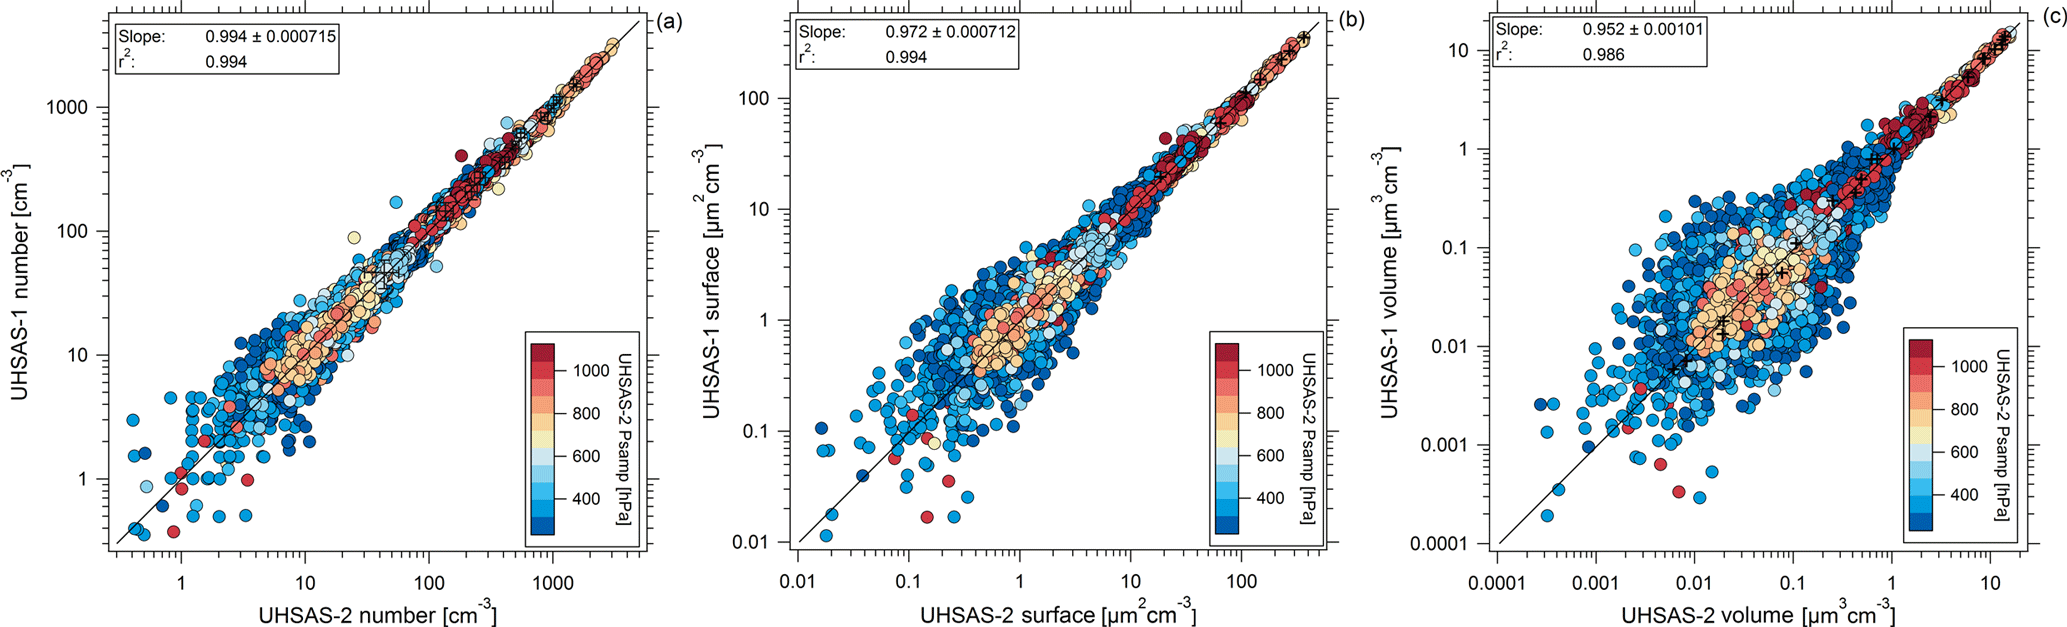
Figure 10Comparison between the UHSAS-1 and UHSAS-2 instruments on ATom-1 from 29 July to 8 August 2016 for (a) dry particle number, (b) surface area, and (c) and volume concentrations for diameters from 0.1 to 0.9 µm. Each point is a 10 s average. The r2 values indicated here refer to one-sided linear fit, while the solid lines represent double-sided orthogonal distance regression linear fits to non-transformed data. Estimated uncertainty is shown on a subset of points.
6.2 Measurements of non-volatile aerosol fraction
The thermodenuded UHSAS was developed to help identify the fraction of particle number and volume (roughly proportional to mass) associated with primary particles such as sea salt and dust as opposed to those that are produced by secondary processes (most particles composed of organic, nitrate, and sulfate species). Several measurements and modeling studies (Clarke and Kapustin, 2002; Korhonen et al., 2008; Mericanto et al., 2010; Quinn et al., 2017; Raes, 1995) suggest that secondary particles formed in the FT play an important role in governing CCN abundance in the MBL, despite the presence of sea salt. It is possible that sea salt may dominate aerosol mass in the MBL, but that CCN concentrations may be controlled by secondary processes, even those occurring in the FT above (Clarke et al., 2013; Raes, 1995; Twomey, 1977; Quinn and Bates, 2011).
To demonstrate the utility of the ATom UHSAS measurements for such investigations, we present examples of thermodenuded and non-thermodenuded aerosol number and volume size distributions for a single MBL case (measured for 50 s at 22∘ N latitude over the central Pacific) and a single FT case (measured for 360 s at 3∘ N over the central Pacific) during ATom-2 on 26 January 2017 (Fig. 11). In the MBL (Fig. 11a, b) volatile aerosol species dominate number concentrations, while non-volatile particles (presumably sea salt) comprise ∼ 52 % of aerosol volume (or mass) for Dp between 0.1 and 0.9 µm. The non-volatile (sea salt) mode was largely > 0.3 µm in diameter, clearly distinct from the smaller mode of volatile particles centered at ∼ 0.15 µm volume mean diameter. Small amounts of non-volatile (sea salt) mass extended down to diameters < 0.1 µm, consistent with prior studies (Bates et al., 1998; Clarke et al., 1997; Mericanto et al., 2010; Middlebrook et al., 1998; Murphy et al., 1998; Quinn et al., 2017).
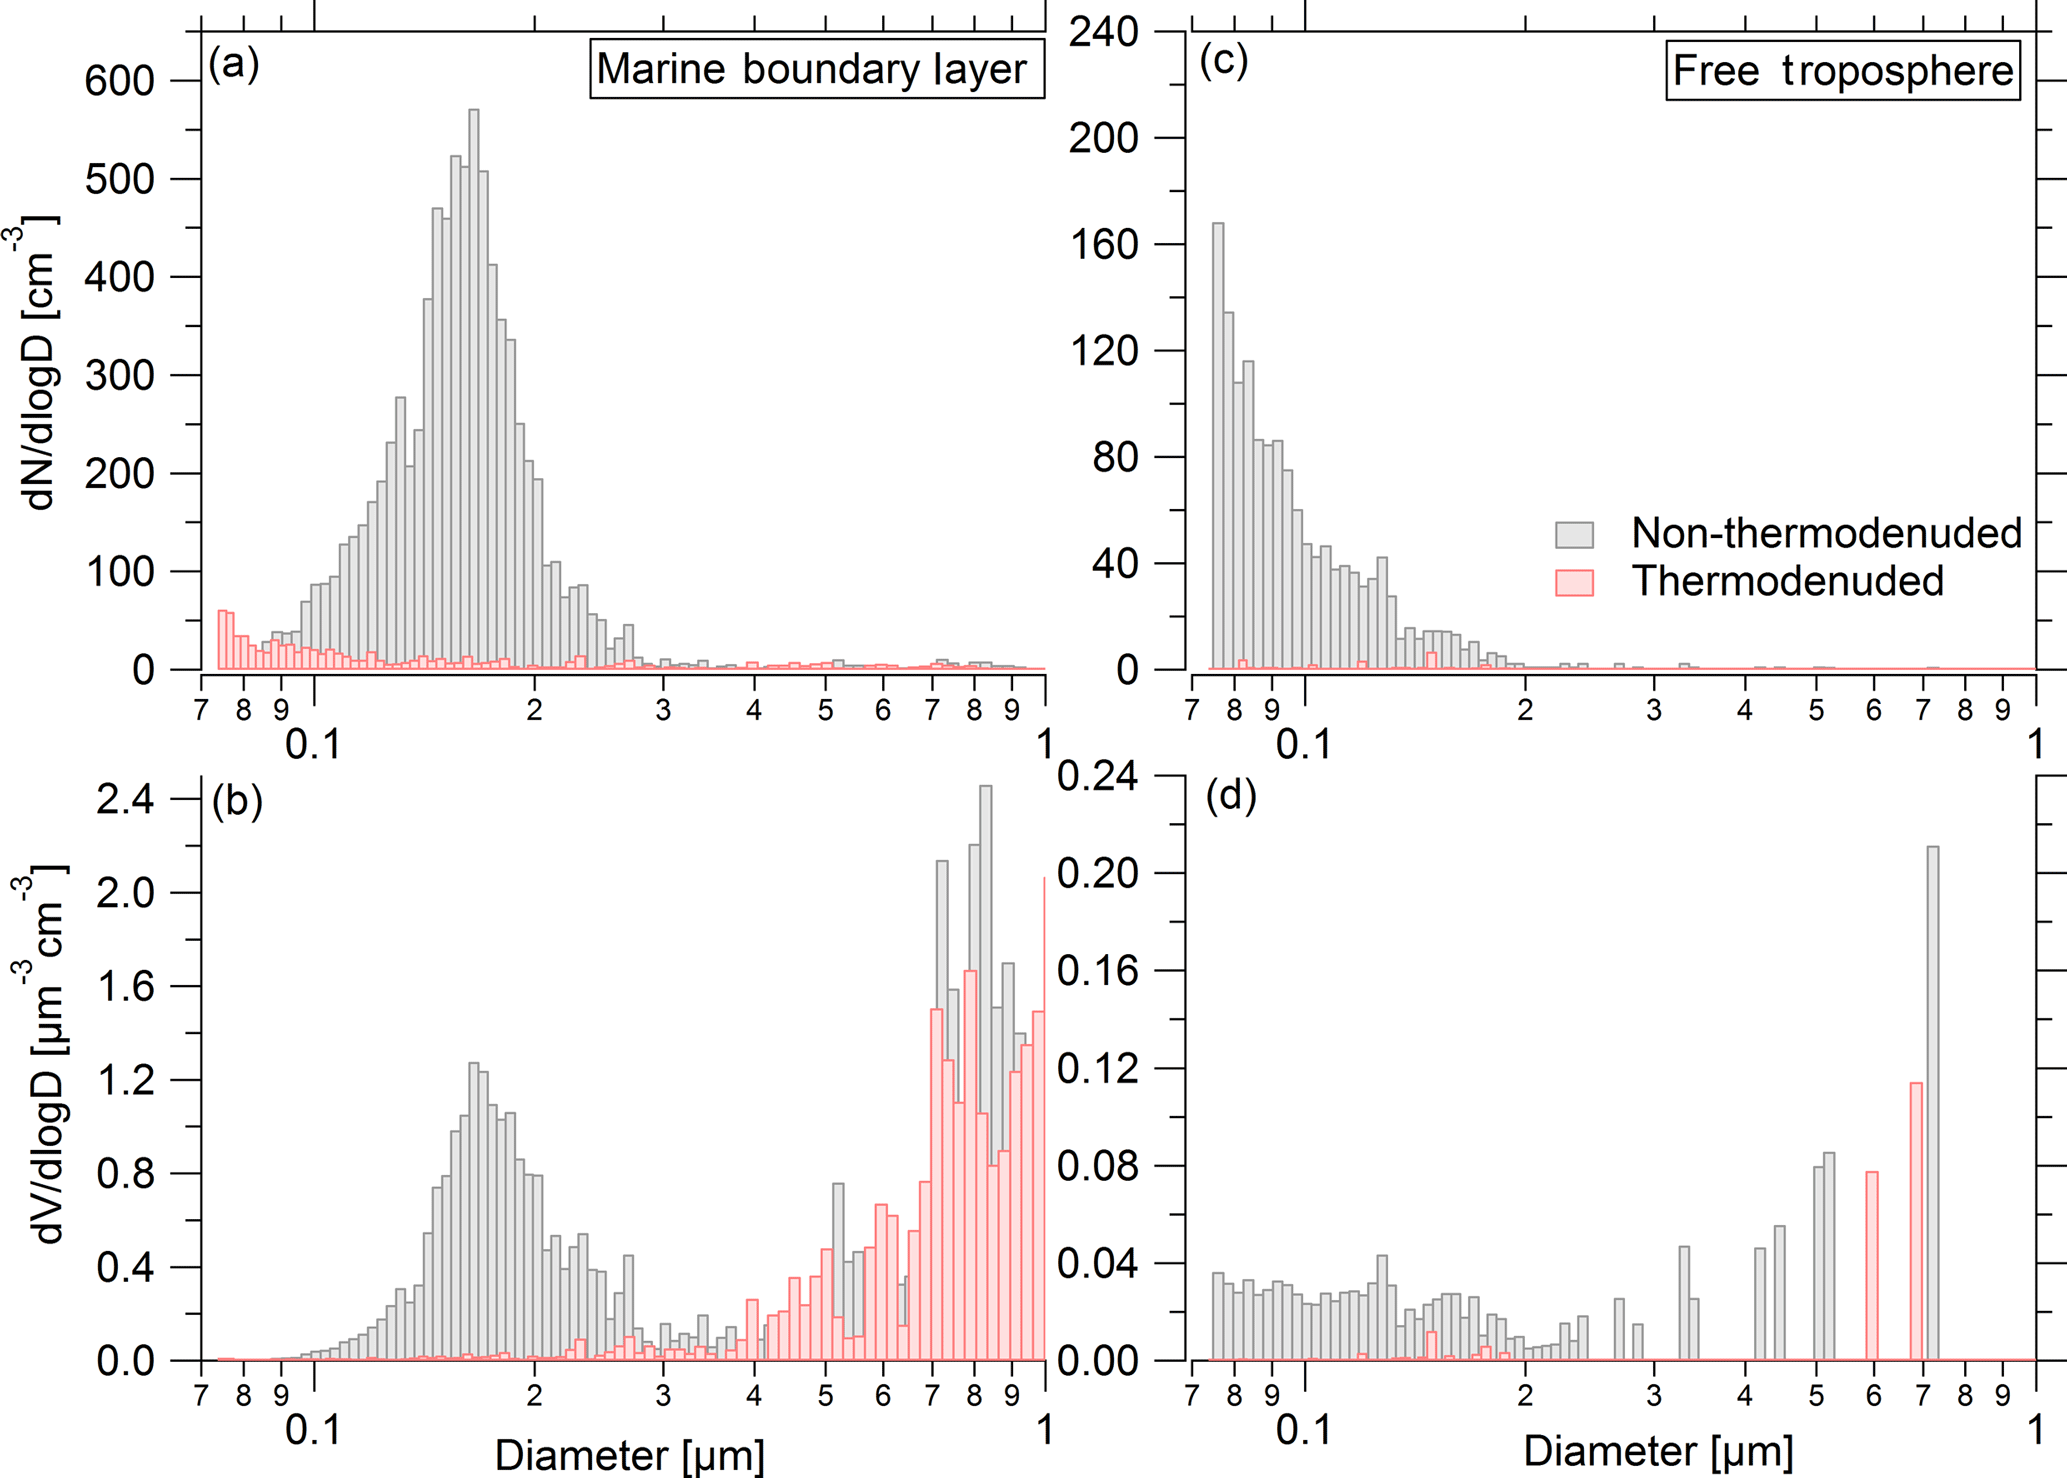
Figure 11Example of an averaged dry aerosol size distribution from UHSAS-1-TD and UHSAS-2 as sampled in the MBL (21.74∘ N, 1080 hPa; 27 January 2017, 01:15:26–01:16:16 UTC) showing (a) number and (b) volume; and for a separate size distribution sampled in the FT (3.4∘ N, 293 hPa; 26 January 2017, 21:32:47–21:38:47 UTC) showing (c) number and (d) volume. For particles with Dp between 0.1 and 0.9 µm, in the MBL case (a, b) 94 % of the total number and 52 % of the total volume volatilized in the thermodenuder, while in the FT case (c, d) 96 % of the number and 74 % of the volume volatilized.
The number concentration of accumulation-mode particles with Dp between 0.1 and 0.9 µm in the clean air of the FT (Fig. 11c, d) was ∼ 7 cm−3 and 96 % of these were volatile. The peak modal diameter was smaller than could be detected by the UHSAS, implying the dominance of the Aitken-mode aerosol (0.012–0.06 µm). These particles were recently formed from gas-phase precursors (Williamson et al., 2018). In the FT, ∼ 26 % of the particle volume was non-volatile, dominated by a few particles with Dp > 0.5 µm and uncertain due to poor counting statistics.
Two UHSAS instruments were modified, calibrated, tested in the laboratory, and operated during the first and second deployments of the ATom mission. The instruments are capable of continuous 1 s measurements of size-resolved particle number concentration with high accuracy and precision over a diameter range of 0.063–1.0 µm from > 1100 to 225 hPa, while simultaneously measuring particle volatility. Precision is limited by counting statistics, especially in the remote FT. The modified flow system of the UHSAS allowed direct monitoring of the sample flow rate and eliminated flow measurement issues associated with the pressure variations during aircraft altitude changes. The sizing of the UHSAS instruments showed no statistically significant pressure dependence, crucial for consistent airborne sampling. Detailed calibrations with laboratory aerosols spanning a range of refractive indices (1.44–1.58) representative of the atmosphere allowed us to constrain the uncertainty associated with the unknown composition of the atmospheric aerosol. An equation to correct for particle coincidence was derived to improve the quantification of the counting accuracy at concentrations from ∼ 1000 to > 20 000 cm−3. Two UHSAS instruments agreed in flight to within 5 % for integrated number, surface, and volume concentrations from sea level to ∼ 13 km altitude. We developed a compact thermodenuder for one of the UHSAS instruments, characterized its performance, and demonstrated its utility for quantifying the size distribution of the nonvolatile fraction of the aerosol. Both modified UHSAS instruments worked well with no significant failures while flying on a DC-8 aircraft during the ATom missions.
The ATom observations taken with these instruments provided representative (non-targeted) measurements, across an unprecedented latitude range over both ocean basins, of vertically resolved, size-dependent aerosol properties that are related to radiative effects, to the ability of aerosols to act as CCN, and to the sources and abundance of primary vs. secondary particles in the MBL and FT. Hence, the size distribution data gathered by the UHSAS instruments over altitudes between ∼ 0.2 and ∼ 13 km will improve our understanding of global aerosol characteristics in the under-sampled regions of the atmosphere that closely resemble natural conditions minimally perturbed by pollution. These new measurements may be placed in the context of similar data gathered over more than 2 decades by Clarke (1991), Clarke et al. (1997, 1998, 2013), Clarke and Kapustin (2002, 2010), and others (e.g., Anderson et al., 1996) to help fill gaps in knowledge of aerosol properties, processes, sources, sinks, and aerosol–cloud–climate interactions.
The ATom measurements in October 2017 and May 2018 will provide data from fall and spring seasons in the Northern Hemisphere. The past and future ATom measurements, placed in the context of chemical and meteorological conditions and combined with size distribution measurements from 0.003 to 4.8 µm (Brock et al., 2018; Williamson et al., 2018), will help constrain model simulations of the processes that govern particle formation and their evolution in remote regions (Lee et al., 2013; Hamilton et al., 2014). Only if aerosol production mechanisms, sinks, and transformations are understood can models accurately simulate global CCN distributions in the pre-industrial, modern, and future atmosphere, and the resulting effects on climate through aerosol–cloud interactions.
Calibration and laboratory testing data are available upon request to the corresponding author. In-flight data are available at the ATom data archive: https://doi.org/10.5067/Aircraft/ATom/TraceGas_Aerosol_Global.
The supplement related to this article is available online at: https://doi.org/10.5194/amt-11-369-2018-supplement.
All authors contributed substantially to the work presented in this paper. AK and CAB modified the instruments. NLW and CAB developed the thermodenuder. MR developed the software. AK designed, carried out experiments, and analyzed data. AK and CW calibrated instruments and collected data during ATom-1 and -2 missions. AK prepared the manuscript with contributions from all co-authors.
The authors declare that they have no conflict of interest.
This publication's contents do not necessarily represent the official views of the respective granting agencies. The use or mention of commercial products or services does not represent an endorsement by the authors or by any agency.
The authors acknowledge support by NASA's Earth System Science Pathfinder
Program under award NNH15AB12I and by NOAA's Health of the Atmosphere and
Atmospheric Chemistry, Carbon Cycle, and Climate Programs. Agnieszka Kupc is
supported by the Austrian Science Fund FWF's Erwin Schrodinger Fellowship
J-3613. Droplet Measurement Technologies kindly provided permission and
source code to allow modification of the UHSAS control software. We would
like to thank Joshua (Shuka) Schwarz and Joseph Katich for access to data
and their helpful comments. We would also like to thank Bernadett Weinzierl,
Maximilian Dollner, T. Paul Bui, and Glenn S. Diskin for access to their
preliminary data. Finally, we would like to thank David Fahey, Karl Froyd,
and Daniel M. Murphy for insightful discussions, and Pedro Campuzano-Jost
and Jason C. Schroder for checking PSL standards.
Edited by: Eric C. Apel
Reviewed by: three anonymous referees
Albrecht, B. A.: Aerosols, Cloud Microphysics, and Fractional Cloudiness, Science, 245, 1227–1230, https://doi.org/10.1126/science.245.4923.1227, 1989.
Anderson, B. E., Grant, W. B., Gregory, G. L., Browell, E. V., Collins, J. E., Sachse, G. W., Bagwell, D. R., Hudgins, C. H., Blake, B. R., and Blake, N. J.: Aerosols from biomass burning over the tropical South Atlantic region: Distributions and impacts, J. Geophys. Res.-Atmos., 101, 24117–24137, https://doi.org/10.1029/96jd00717, 1996.
Bates, K. H., Nguyen, T. B., Teng, A. P., Crounse, J. D., Kjaergaard, H. G., Stoltz, B. M., Seinfeld, J. H., and Wennberg, P. O.: Production and Fate of C-4 Dihydroxycarbonyl Compounds from Isoprene Oxidation, J. Phys. Chem. A, 120, 106–117, https://doi.org/10.1021/acs.jpca.5b10335, 2016.
Bates, T. S., Kapustin, V. N., Quinn, P. K., Covert, D. S., Coffman, D. J., Mari, C., Durkee, P. A., De Bruyn, W. J., and Saltzman, E. S.: Processes controlling the distribution of aerosol particles in the lower marine boundary layer during the First Aerosol Characterization Experiment (ACE 1), J. Geophys. Res.-Atmos., 103, 16369–16383, https://doi.org/10.1029/97jd03720, 1998.
Bohren, C. F. and Huffman, D. R.: Absorption and scattering of light by small particles, Wiley, New York, 1983.
Brock, C. A., Cozic, J., Bahreini, R., Froyd, K. D., Middlebrook, A. M., McComiskey, A., Brioude, J., Cooper, O. R., Stohl, A., Aikin, K. C., de Gouw, J. A., Fahey, D. W., Ferrare, R. A., Gao, R.-S., Gore, W., Holloway, J. S., Hübler, G., Jefferson, A., Lack, D. A., Lance, S., Moore, R. H., Murphy, D. M., Nenes, A., Novelli, P. C., Nowak, J. B., Ogren, J. A., Peischl, J., Pierce, R. B., Pilewskie, P., Quinn, P. K., Ryerson, T. B., Schmidt, K. S., Schwarz, J. P., Sodemann, H., Spackman, J. R., Stark, H., Thomson, D. S., Thornberry, T., Veres, P., Watts, L. A., Warneke, C., and Wollny, A. G.: Characteristics, sources, and transport of aerosols measured in spring 2008 during the aerosol, radiation, and cloud processes affecting Arctic Climate (ARCPAC) Project, Atmos. Chem. Phys., 11, 2423–2453, https://doi.org/10.5194/acp-11-2423-2011, 2011.
Brock, C. A., Wagner, N. L., Anderson, B. E., Attwood, A. R., Beyersdorf, A., Campuzano-Jost, P., Carlton, A. G., Day, D. A., Diskin, G. S., Gordon, T. D., Jimenez, J. L., Lack, D. A., Liao, J., Markovic, M. Z., Middlebrook, A. M., Ng, N. L., Perring, A. E., Richardson, M. S., Schwarz, J. P., Washenfelder, R. A., Welti, A., Xu, L., Ziemba, L. D., and Murphy, D. M.: Aerosol optical properties in the southeastern United States in summer – Part 1: Hygroscopic growth, Atmos. Chem. Phys., 16, 4987–5007, https://doi.org/10.5194/acp-16-4987-2016, 2016.
Brock, C., Williamson, C., Kupc, A., Froyd, K., Erdesz, F., Wagner, N., Richardson, M., Schwarz, J. P., Gao, R.-S., Katich, J., Compuzano-Jost, P., Nault, B., Schroder, J. Jimenez, J., Weinzierl, W., Dollner, M., Bui, T., and Murphy D. M.: Aerosol size distribution measurements during the Atmospheric Tomography (ATom) mission: methods, uncertainties, and data products, in preparation, Atmos. Meas. Tech., 2018.
Cai, Y., Montague, D. C., Mooiweer-Bryan, W., and Deshler, T.: Performance characteristics of the ultra high sensitivity aerosol spectrometer for particles between 55 and 800 nm: Laboratory and field studies, J. Aerosol Sci., 39, 759–769, https://doi.org/10.1016/j.jaerosci.2008.04.007, 2008.
Charlson, R. J., Schwartz, S. E., Hales, J. M., Cess, R. D., Coakley, J. A., Hansen, J. E., and Hofmann, D. J.: Aerosols and Global Warming – Response, Science, 256, 598–599, https://doi.org/10.1126/science.256.5057.598-a, 1992.
Clarke, A. and Kapustin, V.: Hemispheric aerosol vertical profiles: Anthropogenic impacts on optical depth and cloud nuclei, Science, 330, 1047–1047, 2010.
Clarke, A. D.: A Thermo Optic Technique for Insitu Analysis of Size-Resolved Aerosol Physicochemistry, Atmos. Environ. A-Gen., 25, 635–644, https://doi.org/10.1016/0960-1686(91)90061-B, 1991.
Clarke, A. D. and Kapustin, V. N.: A pacific aerosol survey. Part I: A decade of data on particle production, transport, evolution, and mixing in the troposphere, J. Atmos. Sci., 59, 363–382, https://doi.org/10.1175/1520-0469(2002)059<0363:Apaspi>2.0.Co;2, 2002.
Clarke, A. D., Uehara, T., and Porter, J. N.: Atmospheric nuclei and related aerosol fields over the Atlantic: Clean subsiding air and continental pollution during ASTEX, J. Geophys. Res.-Atmos., 102, 25281–25292, https://doi.org/10.1029/97jd01555, 1997.
Clarke, A. D., Varner, J. L., Eisele, F., Mauldin, R. L., Tanner, D., and Litchy, M.: Particle production in the remote marine atmosphere: Cloud outflow and subsidence during ACE 1, J. Geophys. Res.-Atmos., 103, 16397–16409, https://doi.org/10.1029/97jd02987, 1998.
Clarke, A. D., Freitag, S., Simpson, R. M. C., Hudson, J. G., Howell, S. G., Brekhovskikh, V. L., Campos, T., Kapustin, V. N., and Zhou, J.: Free troposphere as a major source of CCN for the equatorial pacific boundary layer: long-range transport and teleconnections, Atmos. Chem. Phys., 13, 7511–7529, https://doi.org/10.5194/acp-13-7511-2013, 2013.
DeCarlo, P. F., Dunlea, E. J., Kimmel, J. R., Aiken, A. C., Sueper, D., Crounse, J., Wennberg, P. O., Emmons, L., Shinozuka, Y., Clarke, A., Zhou, J., Tomlinson, J., Collins, D. R., Knapp, D., Weinheimer, A. J., Montzka, D. D., Campos, T., and Jimenez, J. L.: Fast airborne aerosol size and chemistry measurements above Mexico City and Central Mexico during the MILAGRO campaign, Atmos. Chem. Phys., 8, 4027–4048, https://doi.org/10.5194/acp-8-4027-2008, 2008.
Dick, V. P.: Maximum coefficient of light extinction in a nonabsorbing dispersive medium, Opt. Spectrosc.+, 103, 632–639, https://doi.org/10.1134/S0030400x07100165, 2007.
Dusek, U., Frank, G. P., Hildebrandt, L., Curtius, J., Schneider, J., Walter, S., Chand, D., Drewnick, F., Hings, S., Jung, D., Borrmann, S., and Andreae, M. O.: Size matters more than chemistry for cloud-nucleating ability of aerosol particles, Science, 312, 1375–1378, https://doi.org/10.1126/science.1125261, 2006.
Fierz, M., Vernooij, M. G. C., and Burtscher, H.: An improved low-flow thermodenuder, J. Aerosol Sci., 38, 1163–1168, https://doi.org/10.1016/j.jaerosci.2007.08.006, 2007.
Hamilton, D. S., Lee, L. A., Pringle, K. J., Reddington, C. L., Spracklen, D. V., and Carslaw, K. S.: Occurrence of pristine aerosol environments on a polluted planet, P. Natl. Acad. Sci. USA, 111, 18466–18471, https://doi.org/10.1073/pnas.1415440111, 2014.
Hand, J. L. and Kreidenweis, S. M.: A new method for retrieving particle refractive index and effective density from aerosol size distribution data, Aerosol Sci. Tech., 36, 1012–1026, https://doi.org/10.1080/02786820290092276, 2002.
Huffman, J. A., Ziemann, P. J., Jayne, J. T., Worsnop, D. R., and Jimenez, J. L.: Development and characterization of a fast-stepping/scanning thermodenuder for chemically-resolved aerosol volatility measurements, Aerosol Sci. Tech., 42, 395–407, https://doi.org/10.1080/02786820802104981, 2008.
Jonsson, A. M., Hallquist, M., and Saathoff, H.: Volatility of secondary organic aerosols from the ozone initiated oxidation of alpha-pinene and limonene, J. Aerosol Sci., 38, 843–852, https://doi.org/10.1016/j.jaerosci.2007.06.008, 2007.
Kanakidou, M., Seinfeld, J. H., Pandis, S. N., Barnes, I., Dentener, F. J., Facchini, M. C., Van Dingenen, R., Ervens, B., Nenes, A., Nielsen, C. J., Swietlicki, E., Putaud, J. P., Balkanski, Y., Fuzzi, S., Horth, J., Moortgat, G. K., Winterhalter, R., Myhre, C. E. L., Tsigaridis, K., Vignati, E., Stephanou, E. G., and Wilson, J.: Organic aerosol and global climate modelling: a review, Atmos. Chem. Phys., 5, 1053–1123, https://doi.org/10.5194/acp-5-1053-2005, 2005.
Kassianov, E., Berg, L. K., Pekour, M., Barnard, J., Chand, D., Flynn, C., Ovchinnikov, M., Sedlacek, A., Schmid, B., Shilling, J., Tomlinson, J., and Fast, J.: Airborne Aerosol in Situ Measurements during TCAP: A Closure Study of Total Scattering, Atmosphere-Basel, 6, 1069–1101, https://doi.org/10.3390/atmos6081069, 2015.
Kim, H. and Paulson, S. E.: Real refractive indices and volatility of secondary organic aerosol generated from photooxidation and ozonolysis of limonene, α-pinene and toluene, Atmos. Chem. Phys., 13, 7711–7723, https://doi.org/10.5194/acp-13-7711-2013, 2013.
Kohler, H.: The nucleus in and the growth of hygroscopic droplets, T. Faraday Soc., 32, 1152–1161, https://doi.org/10.1039/Tf9363201152, 1936.
Korhonen, H., Carslaw, K. S., Spracklen, D. V., Mann, G. W., and Woodhouse, M. T.: Influence of oceanic dimethyl sulfide emissions on cloud condensation nuclei concentrations and seasonality over the remote Southern Hemisphere oceans: A global model study, J. Geophys. Res.-Atmos., 113, D15204, https://doi.org/10.1029/2007jd009718, 2008.
Lee, L. A., Pringle, K. J., Reddington, C. L., Mann, G. W., Stier, P., Spracklen, D. V., Pierce, J. R., and Carslaw, K. S.: Corrigendum to “The magnitude and causes of uncertainty in global model simulations of cloud condensation nuclei” published in Atmos. Chem. Phys., 13, 8879–8914, 2013, Atmos. Chem. Phys., 13, 9375–9377, https://doi.org/10.5194/acp-13-9375-2013, 2013.
May, K. R.: The collison nebulizer: Description, performance and application, J. Aerosol Sci., 4, 235–243, https://doi.org/10.1016/0021-8502(73)90006-2, 1973.
McMurry, P. H.: A review of atmospheric aerosol measurements, Atmos. Environ., 34, 1959–1999, https://doi.org/10.1016/S1352-2310(99)00455-0, 2000.
Merikanto, J., Spracklen, D. V., Pringle, K. J., and Carslaw, K. S.: Effects of boundary layer particle formation on cloud droplet number and changes in cloud albedo from 1850 to 2000, Atmos. Chem. Phys., 10, 695–705, https://doi.org/10.5194/acp-10-695-2010, 2010.
Middlebrook, A. M., Murphy, D. M., and Thomson, D. S.: Observations of organic material in individual marine particles at Cape Grim during the First Aerosol Characterization Experiment (ACE 1), J. Geophys. Res.-Atmos., 103, 16475–16483, https://doi.org/10.1029/97jd03719, 1998.
Moteki, N., Kondo, Y., and Nakamura, S.: Method to measure refractive indices of small nonspherical particles: Application to black carbon particles, J. Aerosol Sci., 41, 513–521, https://doi.org/10.1016/j.jaerosci.2010.02.013, 2010.
Murphy, D. M., Anderson, J. R., Quinn, P. K., McInnes, L. M., Brechtel, F. J., Kreidenweis, S. M., Middlebrook, A. M., Posfai, M., Thomson, D. S., and Buseck, P. R.: Influence of sea-salt on aerosol radiative properties in the Southern Ocean marine boundary layer, Nature, 392, 62–65, https://doi.org/10.1038/32138, 1998.
Pettersson, A., Lovejoy, E. R., Brock, C. A., Brown, S. S., and Ravishankara, A. R.: Measurement of aerosol optical extinction at 532nm with pulsed cavity ring down spectroscopy, J. Aerosol Sci., 35, 995–1011, 10.1016/j.jaerosci.2004.02.008, 2004.
Petzold, A., Onasch, T., Kebabian, P., and Freedman, A.: Intercomparison of a Cavity Attenuated Phase Shift-based extinction monitor (CAPS PMex) with an integrating nephelometer and a filter-based absorption monitor, Atmos. Meas. Tech., 6, 1141–1151, https://doi.org/10.5194/amt-6-1141-2013, 2013.
Quinn, P. K. and Bates, T. S.: The case against climate regulation via oceanic phytoplankton sulphur emissions, Nature, 480, 51–56, https://doi.org/10.1038/nature10580, 2011.
Quinn, P. K., Coffman, D. J., Johnson, J. E., Upchurch, L. M., and Bates, T. S.: Small fraction of marine cloud condensation nuclei made up of sea spray aerosol, Nat. Geosci., 10, 674–679, https://doi.org/10.1038/NGEO3003, 2017.
Raes, F.: Entrainment of Free Tropospheric Aerosols as a Regulating Mechanism for Cloud Condensation Nuclei in the Remote Marine Boundary-Layer, J. Geophys. Res.-Atmos., 100, 2893–2903, https://doi.org/10.1029/94jd02832, 1995.
Schwarz, J. P., Spackman, J. R., Gao, R. S., Perring, A. E., Cross, E., Onasch, T. B., Ahern, A., Wrobel, W., Davidovits, P., Olfert, J., Dubey, M. K., Mazzoleni, C., and Fahey, D. W.: The Detection Efficiency of the Single Particle Soot Photometer, Aerosol Sci. Tech., 44, 612–628, https://doi.org/10.1080/02786826.2010.481298, 2010.
Twomey, S.: Pollution and Planetary Albedo, Atmos. Environ., 8, 1251–1256, https://doi.org/10.1016/0004-6981(74)90004-3, 1974.
Twomey, S. A.: Pollution and Cloud Albedo, Eos T. Am. Geophys. Un., 58, 797–797, 1977.
Williamson, C., Kupc, A., Wilson, E. L., Gesler, D., Reeves, J. M., Erdesz, F., McLaughlin, R. J., and Brock, C. A.: Fast time response measurements of particle size distributions in the 3–60 nm size range with the Nucleation Mode Aerosol Size Spectrometer, in preparation, Atmos. Meas. Tech., 2018.
Yokelson, R. J., Burling, I. R., Urbanski, S. P., Atlas, E. L., Adachi, K., Buseck, P. R., Wiedinmyer, C., Akagi, S. K., Toohey, D. W., and Wold, C. E.: Trace gas and particle emissions from open biomass burning in Mexico, Atmos. Chem. Phys., 11, 6787–6808, https://doi.org/10.5194/acp-11-6787-2011, 2011.
Yoo, S. H., Chae, S. K., and Liu, B. Y. H.: Influence of particle refractive index on the lower detection limit of light scattering aerosol counters, Aerosol Sci. Tech., 25, 1–10, https://doi.org/10.1080/02786829608965374, 1996.