the Creative Commons Attribution 4.0 License.
the Creative Commons Attribution 4.0 License.
 | 11 Jul 2018
Ice particle sampling from aircraft – influence of the probing position on the ice water content
Armin Afchine
Christian Rolf
Anja Costa
Nicole Spelten
Martin Riese
Bernhard Buchholz
Volker Ebert
Romy Heller
Stefan Kaufmann
Andreas Minikin
Christiane Voigt
Martin Zöger
Jessica Smith
Paul Lawson
Alexey Lykov
Sergey Khaykin
The ice water content (IWC) of cirrus clouds is an essential parameter determining their radiative properties and thus is important for climate simulations. Therefore, for a reliable measurement of IWC on board research aircraft, it is important to carefully design the ice crystal sampling and measuring devices. During the ML-CIRRUS field campaign in 2014 with the German Gulfstream GV HALO (High Altitude and Long Range Research Aircraft), IWC was recorded by three closed-path total water together with one gas-phase water instrument. The hygrometers were supplied by inlets mounted on the roof of the aircraft fuselage. Simultaneously, the IWC is determined by a cloud particle spectrometer attached under an aircraft wing. Two more examples of simultaneous IWC measurements by hygrometers and cloud spectrometers are presented, but the inlets of the hygrometers were mounted at the fuselage side (M-55 Geophysica, StratoClim campaign 2017) and bottom (NASA WB57, MacPex campaign 2011). This combination of instruments and inlet positions provides the opportunity to experimentally study the influence of the ice particle sampling position on the IWC with the approach of comparative measurements. As expected from theory and shown by computational fluid dynamics (CFD) calculations, we found that the IWCs provided by the roof inlets deviate from those measured under the aircraft wing. As a result of the inlet position in the shadow zone behind the aircraft cockpit, ice particle populations with mean mass sizes larger than about 25 µm radius are subject to losses, which lead to strongly underestimated IWCs. On the other hand, cloud populations with mean mass sizes smaller than about 12 µm are dominated by particle enrichment and thus overestimated IWCs. In the range of mean mass sizes between 12 and 25 µm, both enrichment and losses of ice crystals can occur, depending on whether the ice crystal mass peak of the size distribution – in these cases bimodal – is on the smaller or larger mass mode. The resulting deviations of the IWC reach factors of up to 10 or even more for losses as well as for enrichment. Since the mean mass size of ice crystals increases with temperature, losses are more pronounced at higher temperatures, while at lower temperatures IWC is more affected by enrichment. In contrast, in the cases where the hygrometer inlets were mounted at the fuselage side or bottom, the agreement of IWCs is most frequently within a factor of 2.5 or better – due to less disturbed ice particle sampling, as expected from theory – independently of the mean ice crystal sizes. The rather large scatter between IWC measurements reflects, for example, cirrus cloud inhomogeneities and instrument uncertainties as well as slight sampling biases which might also occur on the side or bottom of the fuselage and under the wing. However, this scatter is in the range of other studies and represent the current best possible IWC recording on fast-flying aircraft.
- Article
(7029 KB) - Full-text XML
- BibTeX
- EndNote


Cirrus ice water content (IWC) is directly linked to cloud extinction and thus relates bulk cloud properties to radiative properties (Gayet et al., 2004; Heymsfield et al., 2014; Thornberry et al., 2017). Since IWC is a parameter representing cirrus in global climate models, a solid knowledge of IWC is of importance. The most accurate measurements are achieved by in situ aircraft observations where cirrus clouds are directly probed. However, the measurements must be carried out carefully to obtain the desired data quality. Besides the ability of the instruments to detect the complete range of IWCs with sufficient accuracy, the probing position at the aircraft's fuselage is of importance (Krämer et al., 2013).
The IWC is a bulk quantity which is composed of the sum of all masses of ice particles of different sizes contained in an air volume. Yet there are shadow and enrichment zones for ice crystals around the aircraft, which depend on the ice particle size and the position relative to the fuselage. These zones are the most prominent particle measurement bias caused by an aircraft body. Thus, if the position for particle sampling is placed in such a zone, it can be expected that an IWC measurement will be distorted. These effects are described already by airflow and trajectory calculations in King (1984) for different sized cloud particles. In particular, King (1984) shows that above the roof of an aircraft the sampling of particles is greatly disturbed. However, to simulate and quantify losses or enrichment of ice particles and particularly the effect on the IWC at a specific position of an aircraft is hardly possible, since this depends on the prevailing ice particle size distribution and flight conditions.
Here, we use a comparative experimental approach to determine the influence of particle probing positions on IWC measurements of cirrus clouds, by relating in situ observations of IWC measured on the roof, side, bottom and under the wing of aircraft with different instruments. Specifically, IWC is measured under the wing – which is the most favorable position for particle sampling – during three field campaigns with different aircraft. One aircraft is additionally equipped with three other IWC instruments placed at the aircraft roof, in the second the IWC measurement is placed on the side of the aircraft and in the third it is on the bottom. From the comparison of the correlation of the roof, side and bottom with the wing IWCs, conclusions are drawn about the representativeness of the measurements at a specific position. The results of the measurements at the aircraft roof are validated by exemplary CFD simulations of gas streamlines and ice particle trajectories around the aircraft for typical conditions during penetration of cirrus clouds.
Determining the quality of an IWC measurement taken on airplanes is challenging, because the IWC evolves from a population of ice crystals of varying size that can be influenced by flow perturbations caused by the aircraft. In a perfect system, all ice particles of each size that are contained in a volume of undisturbed air would be collected. However, even small distortions of the airflow in comparison to calm-air conditions can cause deviations in the IWC. These and other effects that depend on the size of the crystals can distort the IWC measurement in different ways and it is difficult to reproduce their influence on the IWC.
To understand the effects that may occur for specific ice particle sizes, CFD simulations of gas streamlines and particle trajectories around an airplane are helpful. These effects can be caused, for example, by unfavorable sampling positions together with specific flight conditions such as the aircraft speed and the planes angle of attack. For specific cases, potential shadow or enrichment zones can be identified and the effect on IWC can be estimated. These estimates, however, differ for each particle size and, in addition, the particle concentration of each size must be known to determine the overall influence on the IWC. This influence can also vary for each IWC measurement with the ice particle size distribution (PSDice), flight conditions and related changes in the shadow and enrichment zones.
On the other hand, all effects that may occur as a result of flow disturbances or other causes (discussed in the last paragraph of this section) are included in the measurement of the bulk IWC. Hence, for the evaluation of the quality of IWC measurements an experimental comparative approach of IWC measurements is useful. The explanatory power of comparative IWC measurements is described in the following. The first step of the approach is to establish a reference bulk IWC measurement with respect to the instrument performance (i.e. good precision of the measurement). This is achieved by gas-phase and total water measurements with different instruments mounted on a fuselage (see Sect. 4.1 and Fig. 9).
Next, the bulk IWC is compared to an IWC measurement at a different position, here at the aircraft wing, which is least susceptible to flow disturbances if it is properly positioned (see Sect. 4.2). In this study, the wing IWC is derived from the measurements of PSDice (see also Sect. 4.2), which should be only weakly influenced by flow perturbation effects. An agreement of the wing IWC with the bulk IWC measured on the fuselage (shown in Sect. 5.1.3) could indicate that both measurements are influenced in the same way by flow perturbations or instrument and other effects – but this does not seem very likely because of the very different flow conditions for the sampling positions under the wing and on the roof. Our interpretation of this agreement is that both measurements are only slightly influenced by airflow or instrument and other effects. Such a reliable agreement between IWCs from two different instruments mounted at two different positions is a reasonable indication of an applicable IWC measurement. Likewise, as soon as the ice particle sampling at one or both positions is seriously disturbed by effects outlined in the next paragraph, the IWC measurements will differ significantly from each other (see Sect. 5.1.2). As will be shown in Sect. 5.2, from such IWC deviations it is possible to draw conclusions on the manner of the IWC distortion, for example if the probing position is placed in a shadow or enrichment zone. Also, the IWC deviations from each other can be quantified by using the comparative IWC approach.
However, some scatter between IWCs measured with different instruments and at different positions must be expected. The reasons for this are manifold: first of all, cirrus clouds are very inhomogeneous, even on the scale of the distance of the measuring instruments from each other, so the differing probe mounting positions can cause differing IWCs. Also, each mounting position on a fast-flying aircraft, even when chosen as carefully as possible, might be slightly influenced by distortions of the airstream in comparison to the calm-air conditions and thus can cause deviations in IWC. Further, ice crystals bouncing at the fuselage may break, the small fragments may enter the IWC sampling areas, or the density of air can also influence the particle sizes that enter these areas. Last, some unknown uncertainties are always included in the derivation of IWC from the PSDice. For example, the applied parameterizations are derived from measurements with a certain scatter, and the particle-counting statistics can be poor in thin cirrus clouds. The resulting overall scatter between IWC measured in this study is shown in Sect. 5.1.4.
As introduced in the previous section, the IWC of cirrus can be recorded from aircraft either by bulk cloud measurements using airborne closed-path hygrometers mounted behind an inlet tube or via integration of the ice particle number size distributions, PSDice, measured by cloud spectrometers. In both cases, the ice particles must be properly sampled before the measurement. The bulk IWC is less error-prone in comparison to the IWC from PSDice in the case of undisturbed ice particle sampling. The reason is that, before the bulk measurements the ice crystals are evaporated, while the size-resolved IWC detection must account for the ice crystal shapes. In the following, a brief summary on sampling and measuring IWC on fast-flying aircraft is given. For more detail, we refer to Krämer and Afchine (2004), Schiller et al. (2008), Wendisch and Brenguier (2013), Krämer et al. (2013) and Luebke et al. (2013).
3.1 IWC from hygrometers
The bulk IWC is derived from the difference between H2Otot, which is the total amount of water (H2Ogas + evaporated ice crystals) contained in a cirrus, and H2Ogas contained the gas-phase water amount. The IWC is calculated by using the following equation:
where H2Oenh (H2Otot enhanced by an oversampling of ice crystals) and Emax (enhancement factor) are parameters related to the sampling of the ice crystals by an inlet tube which is described in Sect. 3.1.2.
For the measurement of H2Ogas, the air laden with water vapor is passed into the aircraft by an inlet tube which faces against the direction of flight. Therefore, a pump is used to suck the air through the inlet-hygrometer-exhaust line. No cloud particles enter backward-facing inlets, since their inertia is too high for a complete U-turn. The hygrometer is mounted behind the inlet in the aircraft cabin.
Measuring H2Otot (or H2Oenh, respectively) is more difficult, also since ice particles with a wide range of sizes (≈ 3–1000 µm or more in cirrus clouds) have to be passed into the aircraft. To this end, inlet tubes facing the direction of flight are deployed. To precisely determine H2Otot, the ice crystals have to be completely evaporated before they enter the hygrometer, which is subsequently placed in the sampling line. For that, the inlet should be heated to up to 90 ∘C. In addition, a strong bend should directly follow the inlet to shatter ice crystals into small fragments that evaporate in a short time. Behind the water measurement the air leaves the aircraft at the outlet point. Most systems are free-stream sampling lines; i.e. the flow is generated by the pressure difference between the inlet tip and the outlet. A prerequisite for a reliable H2Otot measurement is a suitable, well-characterized inlet so that the true concentration of water plus evaporated ice crystals can be determined. To accomplish this requirements, two points are important: (i) first, the inlet needs to be placed at the aircraft fuselage in a way to enable sampling in undisturbed flow. (ii) Further, the inlet itself should minimally influence the gas-phase water and ice particle concentration. These two points are briefly described in the following, mainly based on Krämer et al. (2013) and references therein.
3.1.1 IWC enrichment or loss due to inlet position
The principle behavior of gas streamlines and cloud particle trajectories around an aircraft fuselage can be seen in Fig. 1 (King, 1984). In the upper panel of these early but still meaningful potential flow simulations, the predicted gas flow streamlines at 90 m s−1 are displayed. Far in front of the aircraft's nose they are equally spaced, indicating the same flow velocity. However, due to the aircraft body the streamlines are compressed over the cockpit, indicating regions of higher airspeed and also enriched concentrations of smaller cloud particles that follow the streamlines in contrast to the free stream.
In the bottom panel, trajectories for larger (exemplarily 100 µm) cloud particles are displayed for the same flight conditions. As these particles have high inertia, most of the trajectories end at the aircraft fuselage; i.e., the particles impact on the aircraft. However, some of the trajectories were deviated, leading to regions devoid of particles (shadow zone) or with increased particle concentration (enrichment zone).
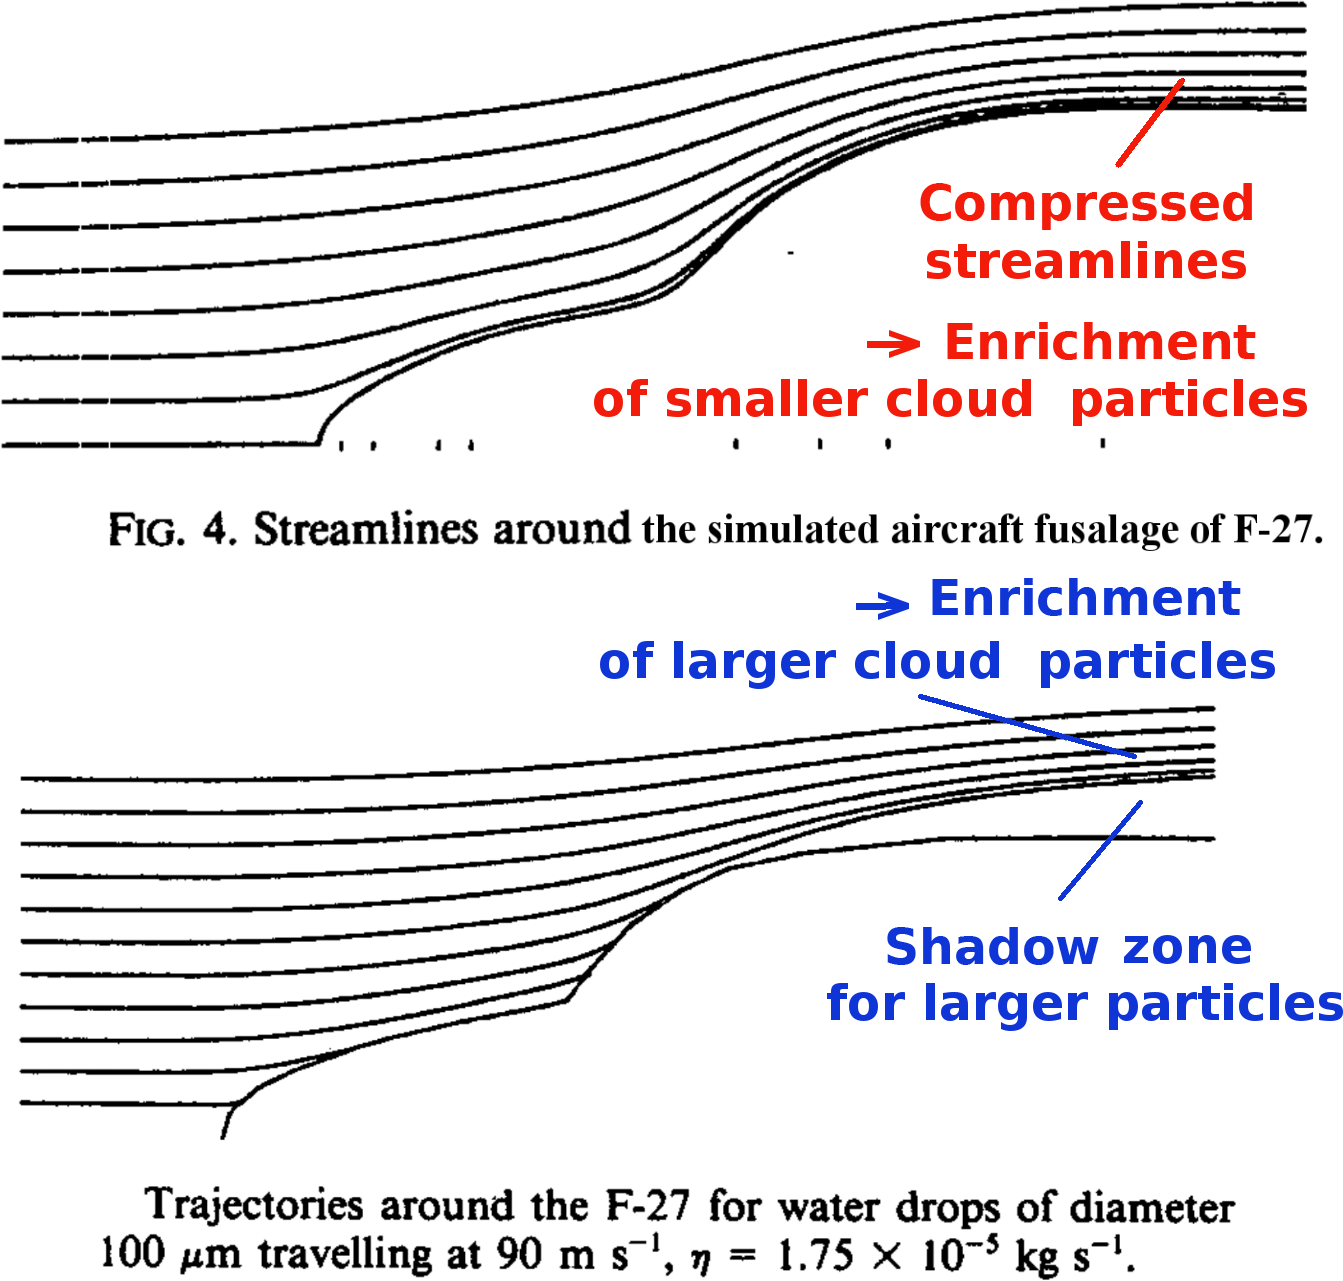
To specify the aforementioned size ranges of the smaller and larger cloud particles, CFD calculations of streamlines and particle trajectories have to be made for the specific conditions of fuselage shape, aircraft speed and inlet distance from the nose of the aircraft. Very roughly, cloud particles with radii < 30 µm can be assumed to belong to the smaller part, while those > 30 µm are associated with the larger part of the cloud particle size spectrum at jet aircraft with high air speeds. Altogether, when measuring cloud particles on the roof of an airplane, it is important to know where shadow and enrichment zones on the aircraft platform are located, since at the same fuselage station it is possible to sample in the shadow/enrichment zone for larger/smaller particles if a probe is positioned close to the aircraft fuselage or in the enrichment zone for larger particles in case the probe is farther away from the fuselage.
To minimize the effect of streamline compression and deviation of particle trajectories during the sampling of cloud particles, it is favorable to mount the sampling inlets on the aircraft's side or bottom, well away from the fuselage. There, the flow is much closer to free-stream conditions, and the largest deviations from these conditions occur near the fuselage and in regions of strong curvature (Twohy and Rogers, 1993). The most favorable position for an undisturbed sampling on an aircraft is most likely under an aircraft wing with the probe head ahead of the aircraft wing, since the aerodynamically shaped wing has the least influence on the flow.
3.1.2 IWC enhancement due to inlet design
The first requirements to an inlet for a proper sampling are that it protrudes beyond the aircraft's boundary layer and that the wall of the inlet tip is thin enough to avoid strong shattering of ice crystals or deviation of streamlines from the free flow. However, as explained in the following, a deviation from the gas streamlines is desirable when sampling cirrus clouds, since cirrus are very thin and their IWC can be as low as 10−3 ppmv (∼ 10−4 mg m−3). To this end, nearly virtual impactors (see Fig. 2) are used for the collection of cirrus ice particles. These are inlets where the velocity inside of the inlet tube (U) is much smaller than the flow speed (U0). Actually U is so small (Krämer and Afchine, 2004) that the inlet cross section appears to be an impaction plate. Such inlets strongly sample sub-isokinetically; i.e. the part of the cross section where gas streamlines enter the inlet is much smaller than the part of the cross section that samples ice particles. The particle sampling cross sections increases with increasing particle size up to the total inlet cross section for the largest particles. As a consequence, ice crystals are sampled from a much larger (enhanced) air volume than H2Ogas, and thus the combined sampling of H2Ogas and evaporated ice crystals is also enhanced (H2Oenh instead of H2Otot). To adjust the two volumes to each other, the ice crystal air volume (and thus the IWC; see Eq. 1) needs to be corrected for this enhancement.
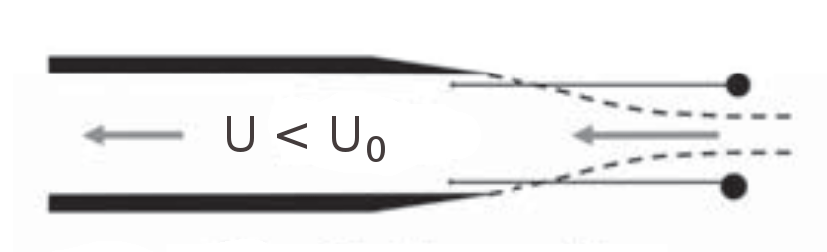
Figure 2Sub-isokinetic sampling of ice particles by a nearly virtual inlet, where the velocity U inside of the inlet tube is much smaller than the flow speed U0. The dashed lines denote the region of the free stream from where the gas streamlines enter the inlet; the black dots illustrate large particles that do not follow the gas streamlines, particle tracks are indicated by thin solid lines (Krämer et al., 2013).
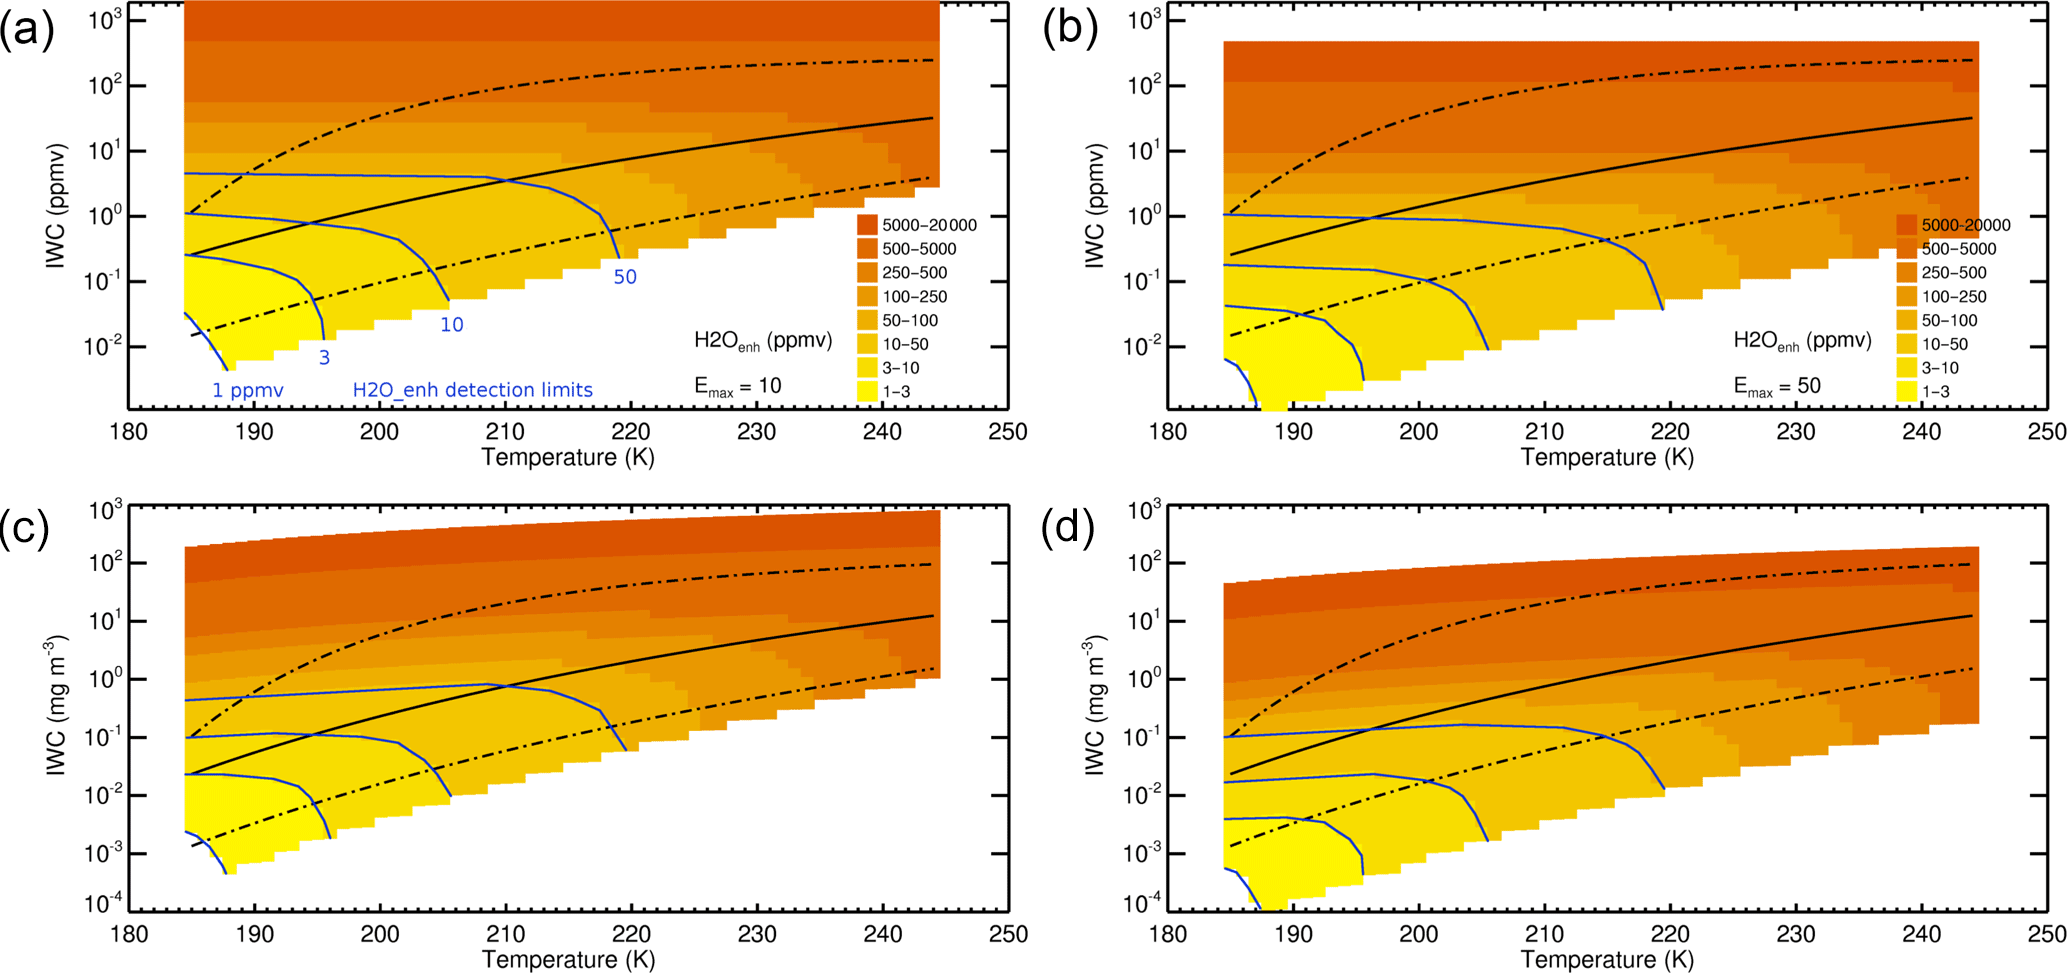
Figure 3Relation between H2Oenh and IWC regarding temperature for given H2Ogas (assumed as water vapor saturation value), calculated from Eq. (1) for two different Emax (a, c: 10, b, d: 50; a, b volume mixing ratio, c, d concentration). The minimum difference between H2Oenh and H2Ogas to detect IWC is 5 % to account for measurement uncertainties, i.e. in the white region below the calculated IWCs, H2Oenh ∕ H2Ogas < 1.05. Blue lines: H2Oenh isolines corresponding to the detection limit of an instrument, the 1, 3 and 10 ppmv H2Oenh isolines represent the IWC detection limit of the FISH, HAI and WARAN instruments described in Sect. 4.1.2. Black solid and dashed lines: medium, core max and min IWCs after Schiller et al. (2008).
As mentioned, the enhancement (which can also be called “aspiration efficiency”) is dependent on particle size and increases for larger particles, up to a maximum value Emax. This maximum value is used for the calculation of the IWC (see Eq. 1). Emax can be calculated from the velocity of the free stream U0 and the velocity U inside of the inlet:
The point at which the enhancement is 50 % of Emax (E50) is called the cut-off size of the inlet, which defines the particle size range sampled by the inlet. Emax is dependent on U, which in turn depends strongly on the pressure difference between the inlet and outlet, the driving force of the flow (in case the flow rate is not controlled) as well as other parameters like pressure, temperature and aircraft speed U0. Thus, U decreases with increasing altitude.
With the knowledge of Emax, the IWC can now be calculated following Eq. (1). In Fig. 3, we visualize the complex relation between the measuring parameter H2Oenh, IWC and Emax regarding temperature for given H2Ogas (assumed as the saturation value for the calculations), calculated from Eq. (1) (left column is Emax=10, right column is Emax=50, top row is volume mixing ratio and bottom row is concentration). To avoid very small artificial IWCs caused by the uncertainties in measurements and not by ice particles, the minimum difference between H2Oenh and H2Ogas needs to be 5 % to encounter an IWC. The differently colored regions show the ranges of H2Oenh and IWC belonging to each other. It can be seen from Fig. 3 that the IWCs covered by H2Oenh of the same color are broader and show lower IWCs at higher temperatures and narrower with higher IWCs at lower temperatures. This reflects the fact that H2Ogas decreases with temperature and is thus more strongly enhanced due to the addition of ice crystals. Consequently, H2Oenh jumps to a higher value with another color. Because of this, the IWC detection limit as well as the uncertainty of IWC improves with decreasing temperature. Regarding the difference between Emax=10 and 50 (left and right panels of Fig. 3) it becomes visible that the higher the Emax, the smaller the IWC that can be detected.
The range of IWCs that can be detected with a H2Otot instrument can be seen from Fig. 3. The blue H2Oenh isolines through the IWC-T parameter space correspond to the detection limit of an instrument; e.g., the 1, 3 and 10 ppmv H2Oenh isolines represent the IWC detection limits of the FISH, HAI and WARAN instruments that will be described in Sect. 4.1.2. Further, the IWC detection range is limited at the lower end of IWC regarding temperature by the requirement that H2Oenh/H2Ogas > 1.05. A difference of 5 % between the two measurements is necessary to avoid artificial clouds emerging due to the scatter of the instruments (Schiller et al., 2008).
3.2 IWC from cloud spectrometers
Cloud spectrometers measure the cloud particle number size distribution PSDice. They are, in most cases, mounted below the aircraft wings with distances ahead of the wing and from the aircraft body to minimize particle losses or enrichment due to contamination of distorted cloud particle trajectories by cloud particles bounced from the air frame (Krämer et al., 2013). In any case, deviations of streamlines do not play a great role in the flow around wings for particle measurements. To avoid uncertainties in the measurements caused by the aircraft's angle of attack, the cloud probes should be mounted under this angle to compensate for this effect. Ice crystal shattering into small fragments (≲ 50 µm diameter) at the cloud probes head is a source of error in PSDice. However, this does not play a significant role in the calculation of the IWC for cloud probes equipped with anti-shattering inlet tips, since the ice fragments contribute to the integrated mass of PSDice in the same way as the original crystal several hundred microns or more in size. For those cloud spectrometers that use anti-shattering tips and data evaluation algorithms, ice fragments from large shattered ice crystals can be considered (Korolev et al., 2011). However, without these tools, ice crystals from outside could shatter at the inlet tips and the small fragments are then being swept into the sample volume. Other measurement issues of PSDice are discussed in detail in Krämer et al. (2013) and Baumgardner et al. (2017).
The IWC is derived from PSDice by summing up the ice crystal concentrations measured in each size bin of the number size distribution. The largest source of error in this method is the irregularity of the ice crystal shapes. In particular, large ice crystals cannot be assumed as spheres and their shapes strongly vary. Numerous mass-dimension (m–D) or mass-area (m–A) relations are derived to account for this effect (a comparison is shown in Sect. 4.2). A summary of m–D relations is given, e.g., in Abel et al. (2014) and a new, advanced relation is developed by Erfani and Mitchell (2016). The m–D relations are of the form
with mi, Di mass and diameter of the ice crystals of the ith size bin and a, b constants of respective relations. The IWC is then
4.1 Bulk IWC inlet and hygrometers
4.1.1 H2Otot inlets
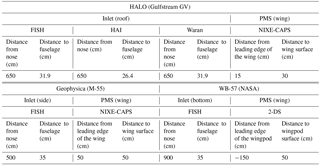
For HALO (High Altitude and Long Range Research Aircraft), trace gas inlets (TGIs) are designed1, mainly to probe atmospheric gas components, but also to sample ice cloud particles. The design can be seen in the bottom panel of Fig. 4, where a TGI is mounted with three inlets facing in a forward direction for cloud sampling and one inlet in a backwards direction for gas constituents. The height of the TGI and the distances of the inlets from the fuselage are designed to protrude from the aircraft's boundary layer. The numbers are listed in Table 1. The TGI inlet is heated, and the sampling tubes have a 90∘ bend as required to evaporate ice crystals entering the forward-facing ducts (see Sect. 3.1.) During ML-CIRRUS in 2014, two TGIs were mounted on the frontmost apertures of HALO's roof. The roof position was chosen for the various apertures due to technical restrictions. Two H2Otot hygrometers (FISH and Waran, for a description of the H2O instruments see next section) are positioned at the upper forward inlet tips of TGI 1 and 2, a third hygrometer (HAI) is connected to the middle forward duct of the TGI 1. The TGI position at the aircraft fuselage is shown in the top panel of Fig. 4. The hygrometer used for H2Ogas sampling (SHARC) is connected to a backward inlet tip of a TGI mounted further downstream.
On board Geophysica, the inlet for the H2Otot hygrometer FISH is mounted on the side of the aircraft, as can be seen in Fig. 5. It is also heated and has a 90∘ bend. The H2Ogas hygrometer FLASH is mounted below the wing and equipped with its own inlet. The WB-57 H2Otot inlet for the FISH hygrometer is mounted at the aircraft's bottom (see Fig. 6), is also heated and has a 90∘ bend. The H2Ogas hygrometer HWV is mounted below a wing and equipped with its own inlet. The IWCs derived from the H2Otot measurements behind the respective inlets are here referred to as roof, side and bottom IWCs.
4.1.2 H2O instruments
The essential features of the hygrometers used to measure H2Otot and H2Ogas on board HALO during ML-CIRRUS 2014 (FISH, HAI, Waran and SHARC) are summarized in the following. For more detail we refer to the respective cited publications of the instruments.
FISH (Fast In situ Stratospheric Hygrometer) is a closed-path Lyman-α photofragment fluorescence hygrometer (Meyer et al., 2015; Zöger et al., 1999) used to measure H2Otot in the range of 1–1000 ppmv between 50 and 500 hPa with an accuracy and precision of 6–8 % and 0.3 ppmv. Connected to the HALO-TGI forward-facing duct, the enhancement factor range is 12–20. In accordance to Fig. 3, the resulting minimum detectable IWC is between about 1–20 × 10−3 ppmv (∼ 1–20 × 10−4 mg m−3). The time resolution of the measurements is 1 Hz.
HAI (Hygrometer for Atmospheric Investigation) is a four-channel tunable diode laser hygrometer (Buchholz et al., 2017). Here, we use its closed-path 1.4 µm H2Otot channel. The measurement range is 3–40 000 ppmv with an accuracy and precision of 4.3 % ± 3 ppmv and 0.24 ppmv. Its enhancement factor at the HALO-TGI is 17–50. The resulting minimum IWC following Fig. 3 is between about 0.5–20 × 10−2 ppmv (∼ 0.5–20 × 10−3 mg m−3) and the time resolution is 1 Hz.
Waran (a water vapor analyzer) is a tunable diode laser hygrometer (1.4 µm) WVSS (Vance et al., 2015), attached to the forward-facing TGI (Voigt et al., 2017) instead of the originally associated inlet. The detection range is ≳ 50–40 000 ppmv, the accuracy according to the manufacturer is ±50 ppmv or 5 % of the reading, whichever is larger. However, good performance of WVSS down to about 20 ppmv is reported in Smit et al. (2013) in a comparison of airborne hygrometers. The enhancement factor at the HALO-TGI is in the range of 20–35 and the resulting minimum detectable IWC is (see Fig. 3) between about 0.5–50 × 10−1 ppmv (0.5–50 × 10−2 mg m−3) at a time resolution of 0.4 Hz.
SHARC (Sophisticated Hygrometer for Atmospheric Research) is also a closed-path tunable diode laser hygrometer (1.4 µm), but at HALO it is used for H2Ogas measurements (Meyer et al., 2015). Its range of detection is 20–40 000 ppmv with an accuracy and precision of 2–4 % and 0.2 ppmv at a time resolution of 1 Hz.
On board Geophysica during StratoClim 2017, H2Otot was measured by FISH, while H2Ogas was measured by FLASH (Khaykin et al., 2013). FLASH also uses the Lyman-α photofragment fluorescence technique for the detection of water vapor, but its inlet is designed to sample only the gas phase. The detection range is 1–1000 ppmv with an accuracy and precision of < 9 % and 0.5 ppmv. The time resolution is 1 Hz.
FISH was also used for H2Otot measurements on board the WB-57 during MacPex 2011. In this case, H2Ogas is detected by the Lyman-α fluorescence hygrometer HWV (Harvard Water Vapor with a time resolution of 1 Hz). Details of the water measurements during MacPex are described in Rollins et al. (2014).
4.2 Cloud spectrometers for IWC
During ML-CIRRUS 2014 and also StratoClim 2017, the NIXE-CAPS (New Ice eXpEriment: Cloud and Aerosol Particle Spectrometer, NIXE hereafter) instrument, mounted under the wing of HALO (see Fig. 7) and Geophysica were used to measure the cloud particle number size distribution in the size range of 3–930 µm diameter at a time resolution of 1 Hz (Meyer, 2012). The mounting positions (distance from leading edge of the wing and distance to wing surface) are listed in Table 1. Comprehensive CFD studies had been carried out during the modification of the plane to a research aircraft to determine the optimal position for particle sampling (permission for image to be shown was not given). Two instruments are incorporated in NIXE: the NIXE-CAS-DPOL (Cloud and Aerosol Spectrometer with Detection of POLarization) and the NIXE-CIPg (Cloud Imaging Probe – grayscale). In combination, particles with diameters between 0.61 and 937 µm can be sized and counted. For cloud measurements, particle diameters > 3 µm are considered. The data analysis methods and all applied correction algorithms are described in Meyer (2012) and Luebke et al. (2016). The IWC was derived using the m–D relation described by Krämer et al. (2016) and Luebke et al. (2016). This relation, originally derived from observations by Mitchell et al. (2010) and confirmed in the study of Erfani and Mitchell (2016), has nearly no dependency on temperature or cirrus type, thus demonstrating the robustness of the connection between cirrus ice crystal size and mass. The m–D relation is again confirmed by our measurements, which can be seen by the good agreement of IWCs derived from PSDs from NIXE-CAPS with those determined from total water measurements with FISH (see Fig. 11, left panel). Furthermore, it should be noted that the IWCs derived from PSDs are not very sensitive about the choice of the m–D relation. That can be seen in Fig. 8, where, in addition to the abovementioned m–D relations, the usual m–D relations of Heymsfield et al. (2010) and Cotton et al. (2013) are plotted in the left panel. The right panel of Fig. 8 shows IWCs calculated from 10 different m–D relations versus their mean IWC for one flight during ML-CIRRUS. It can be seen that the IWCs from the m–D relations are at most around the factor 1.5 over the entire IWC range, specifically, 55 % of the data range between 1 : ±1.2, while 19/26 % can be found in the ranges 1 : −(1.2 to 1.5)/1 : (1.2–1.5).
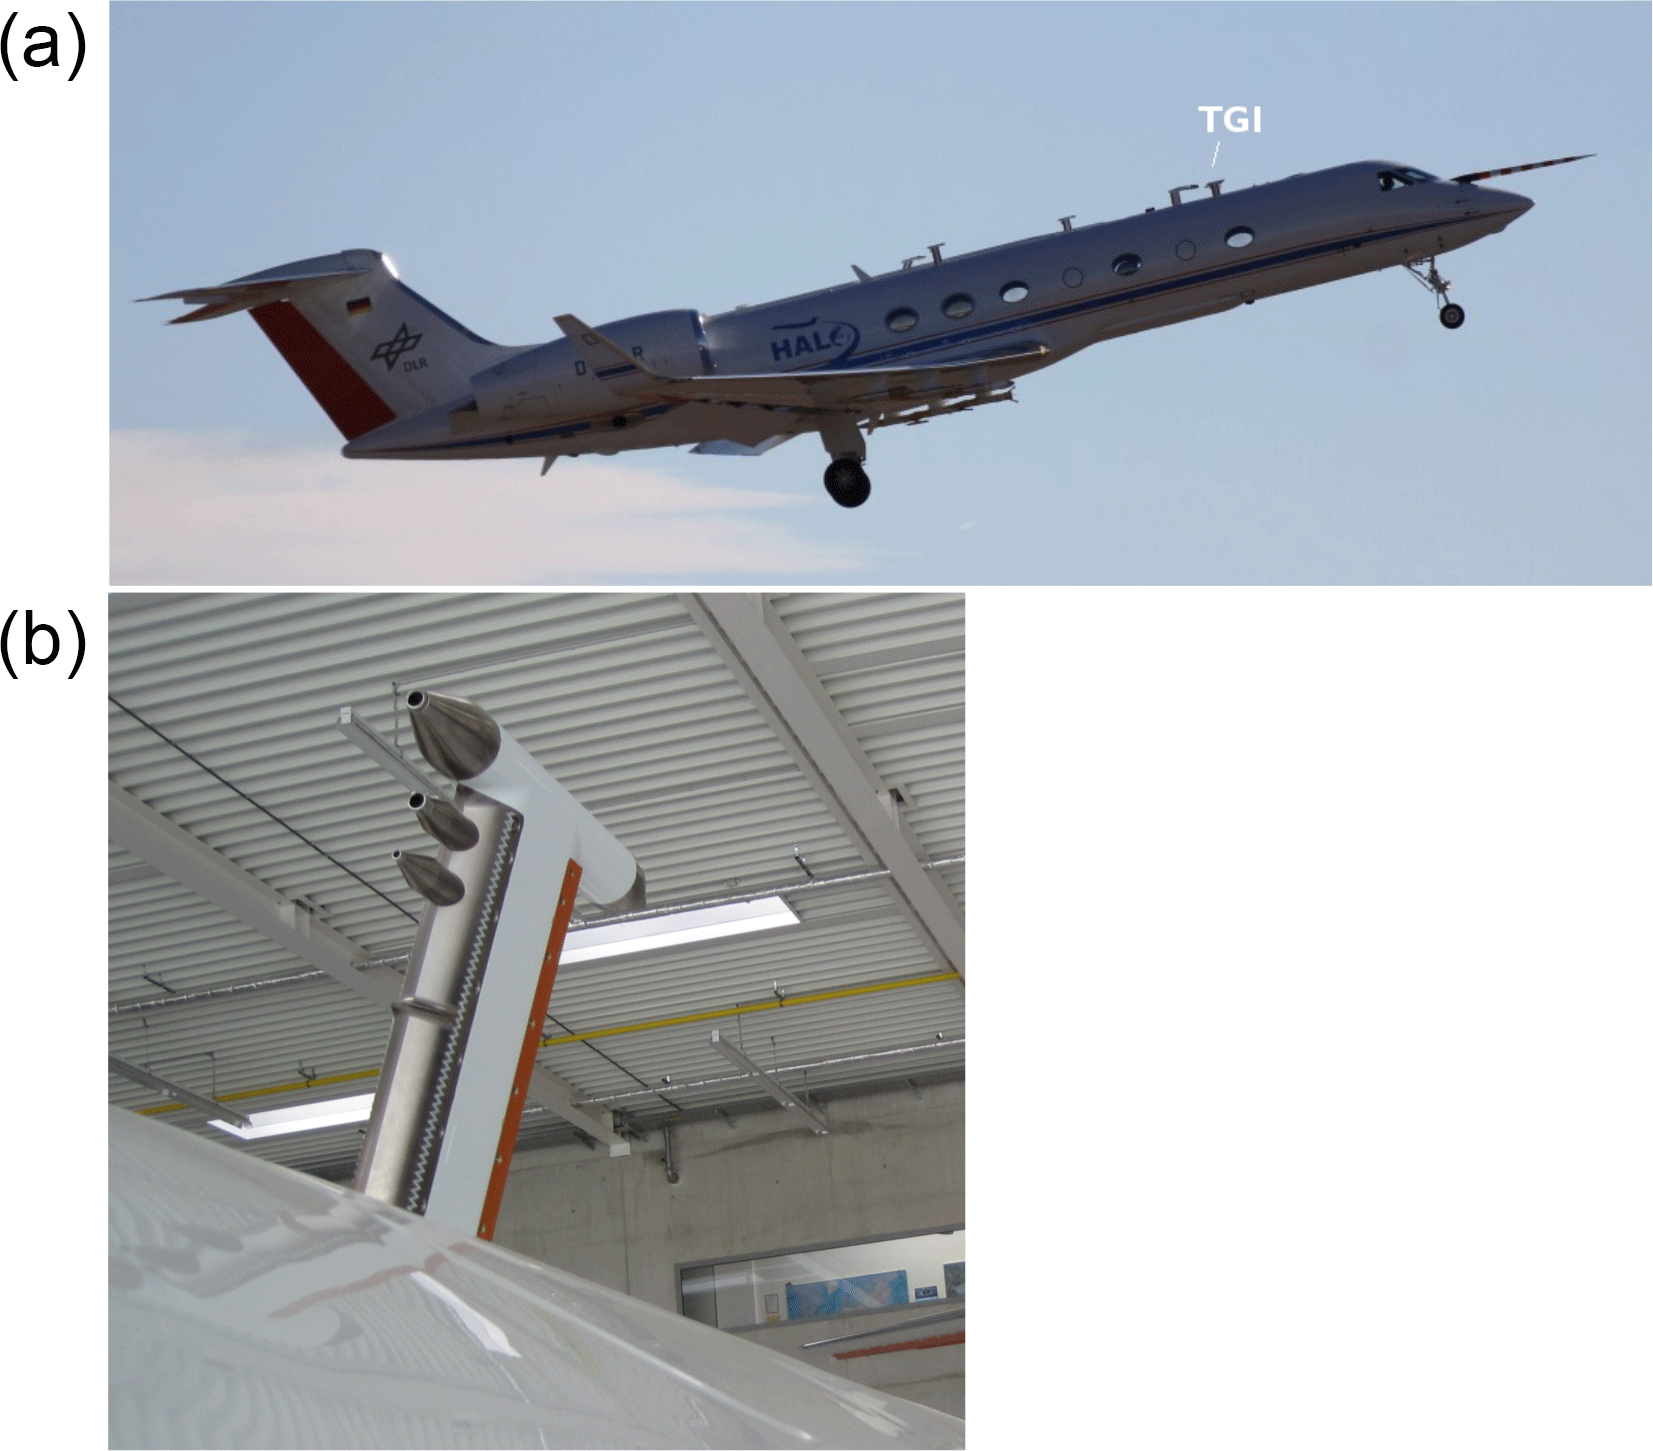
Figure 4Roof-mounted FISH, HAI, Waran inlet at HALO (photos: a: Andreas Fix, b: Armin Afchine).
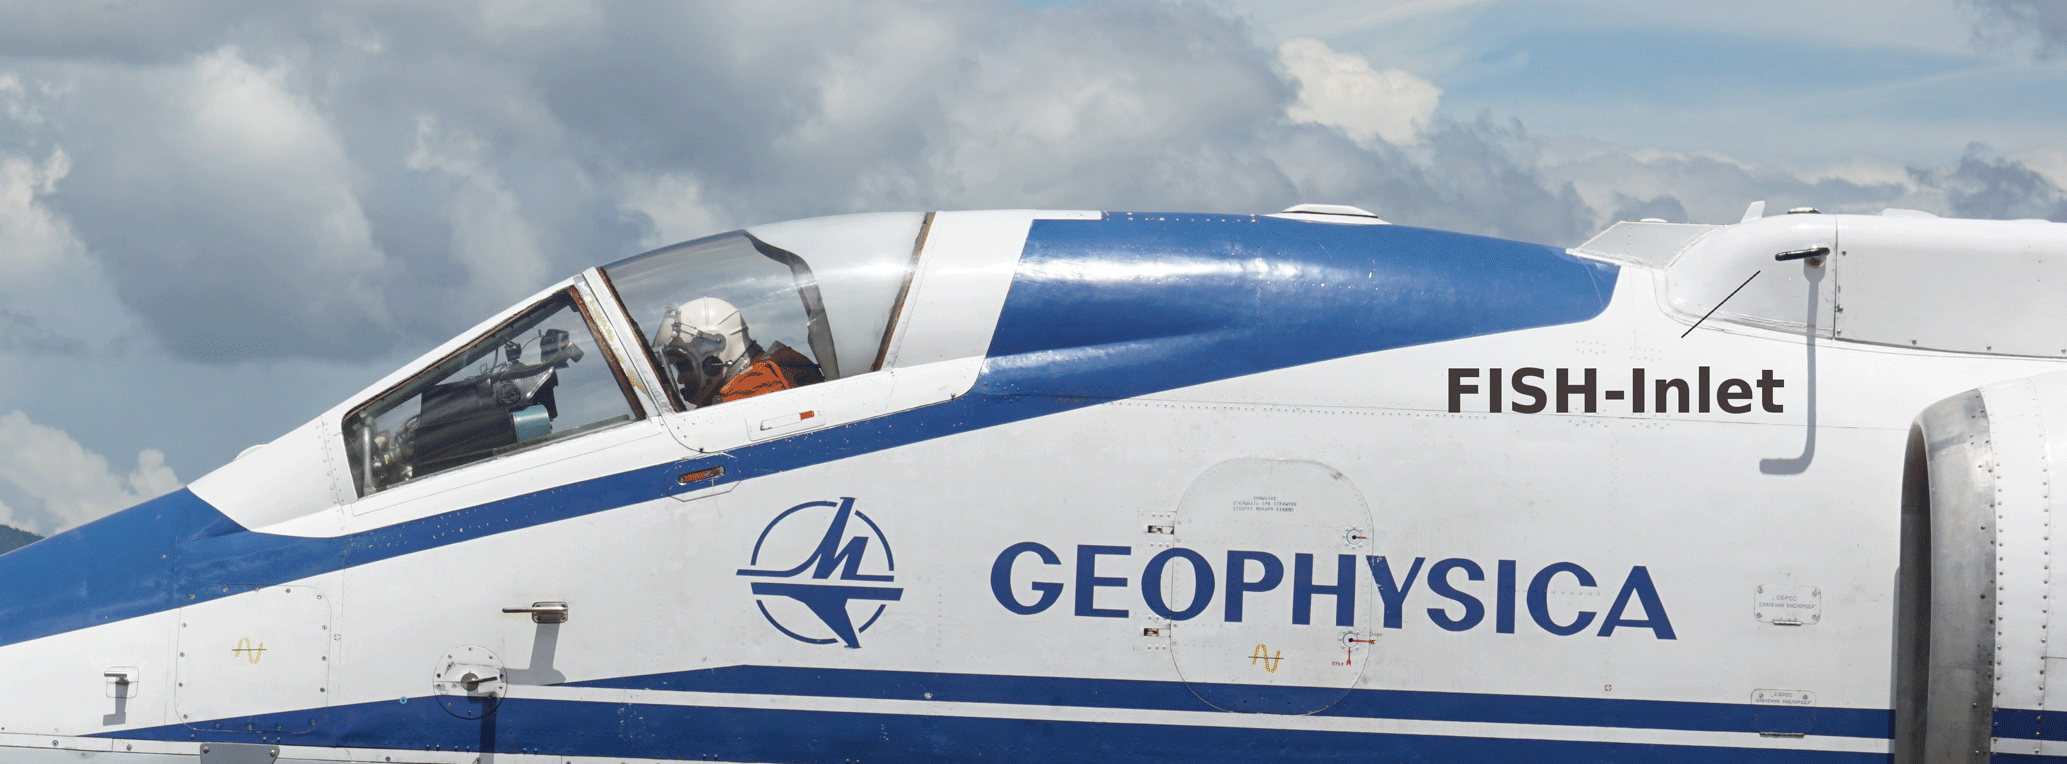
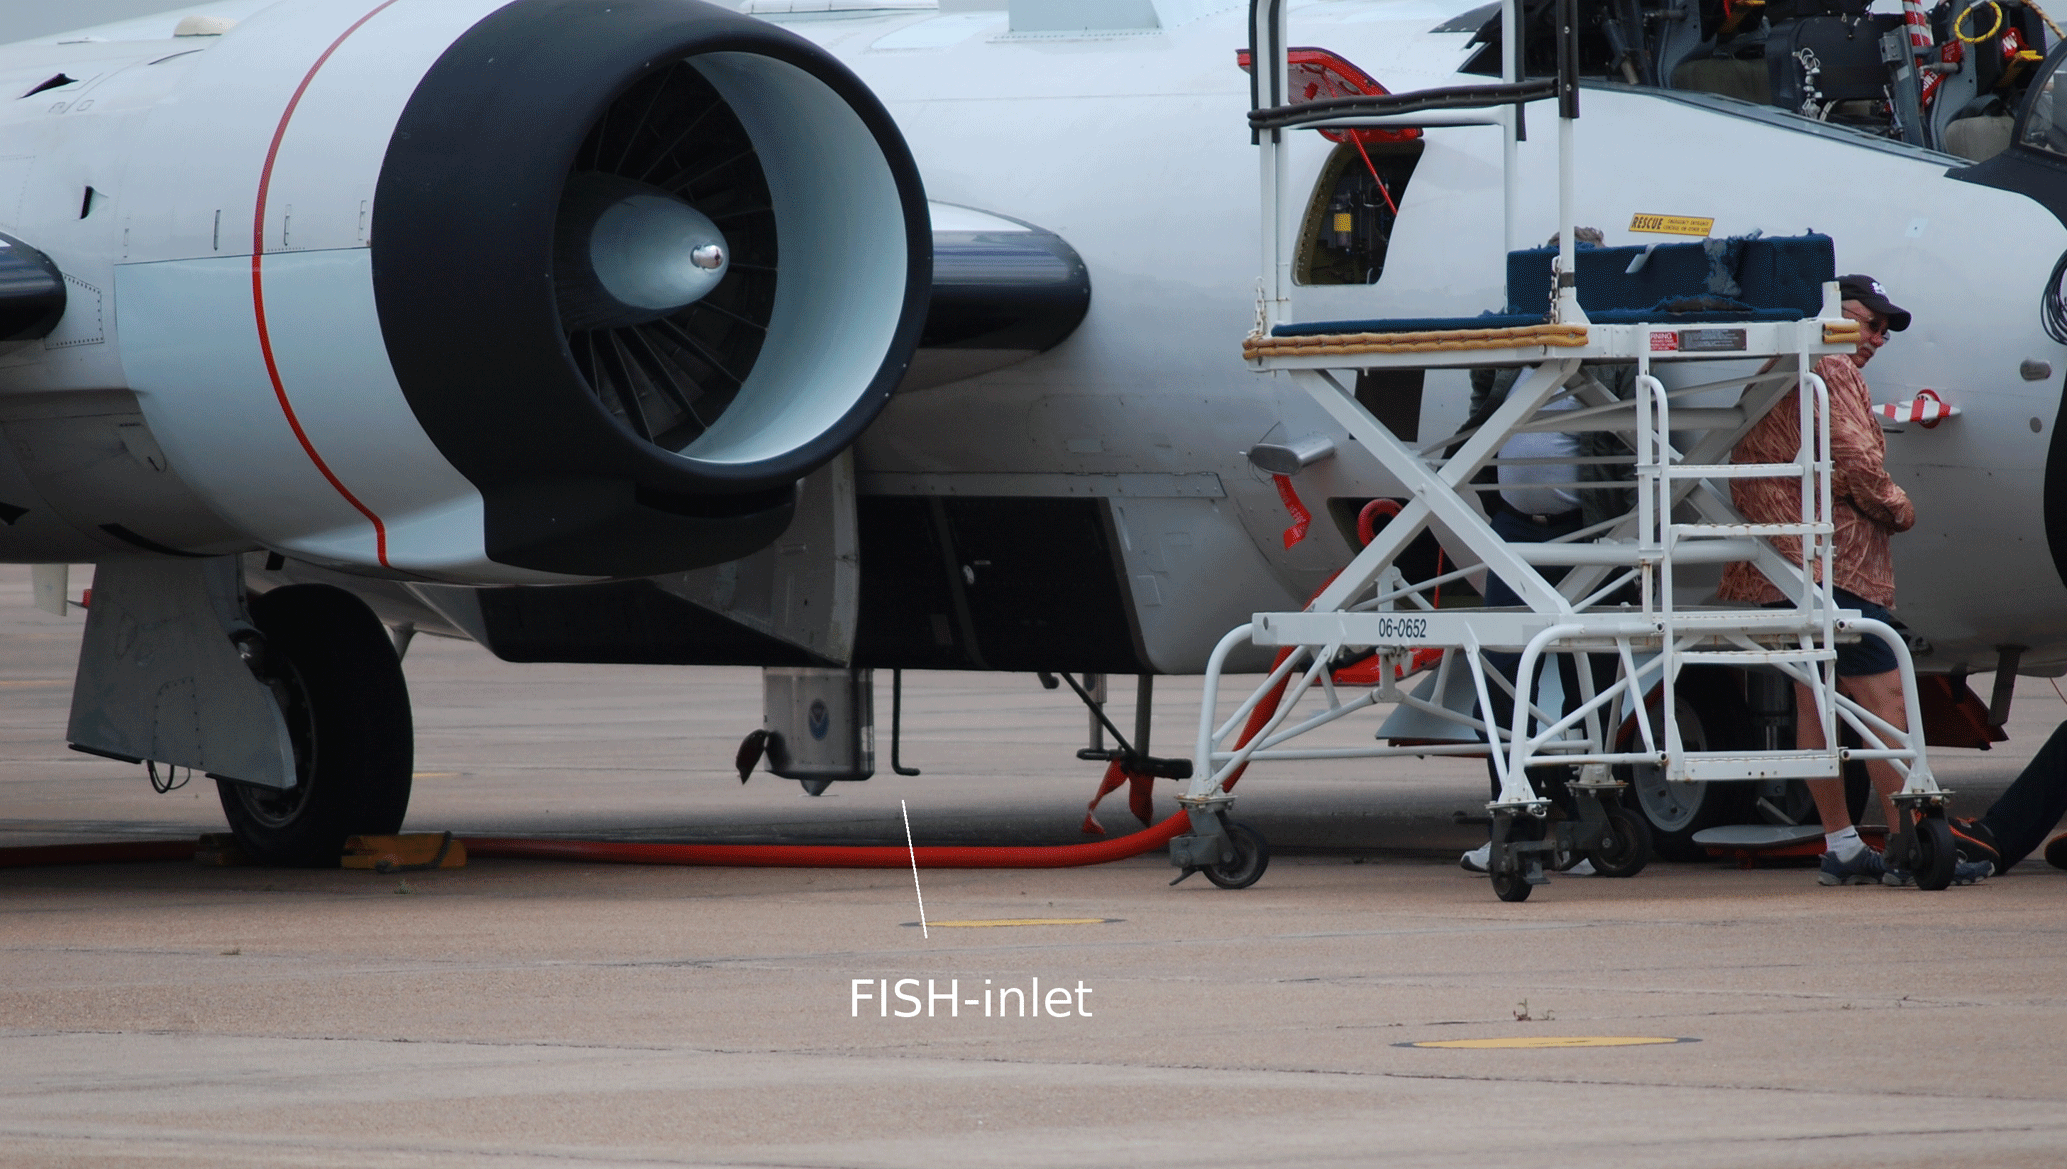
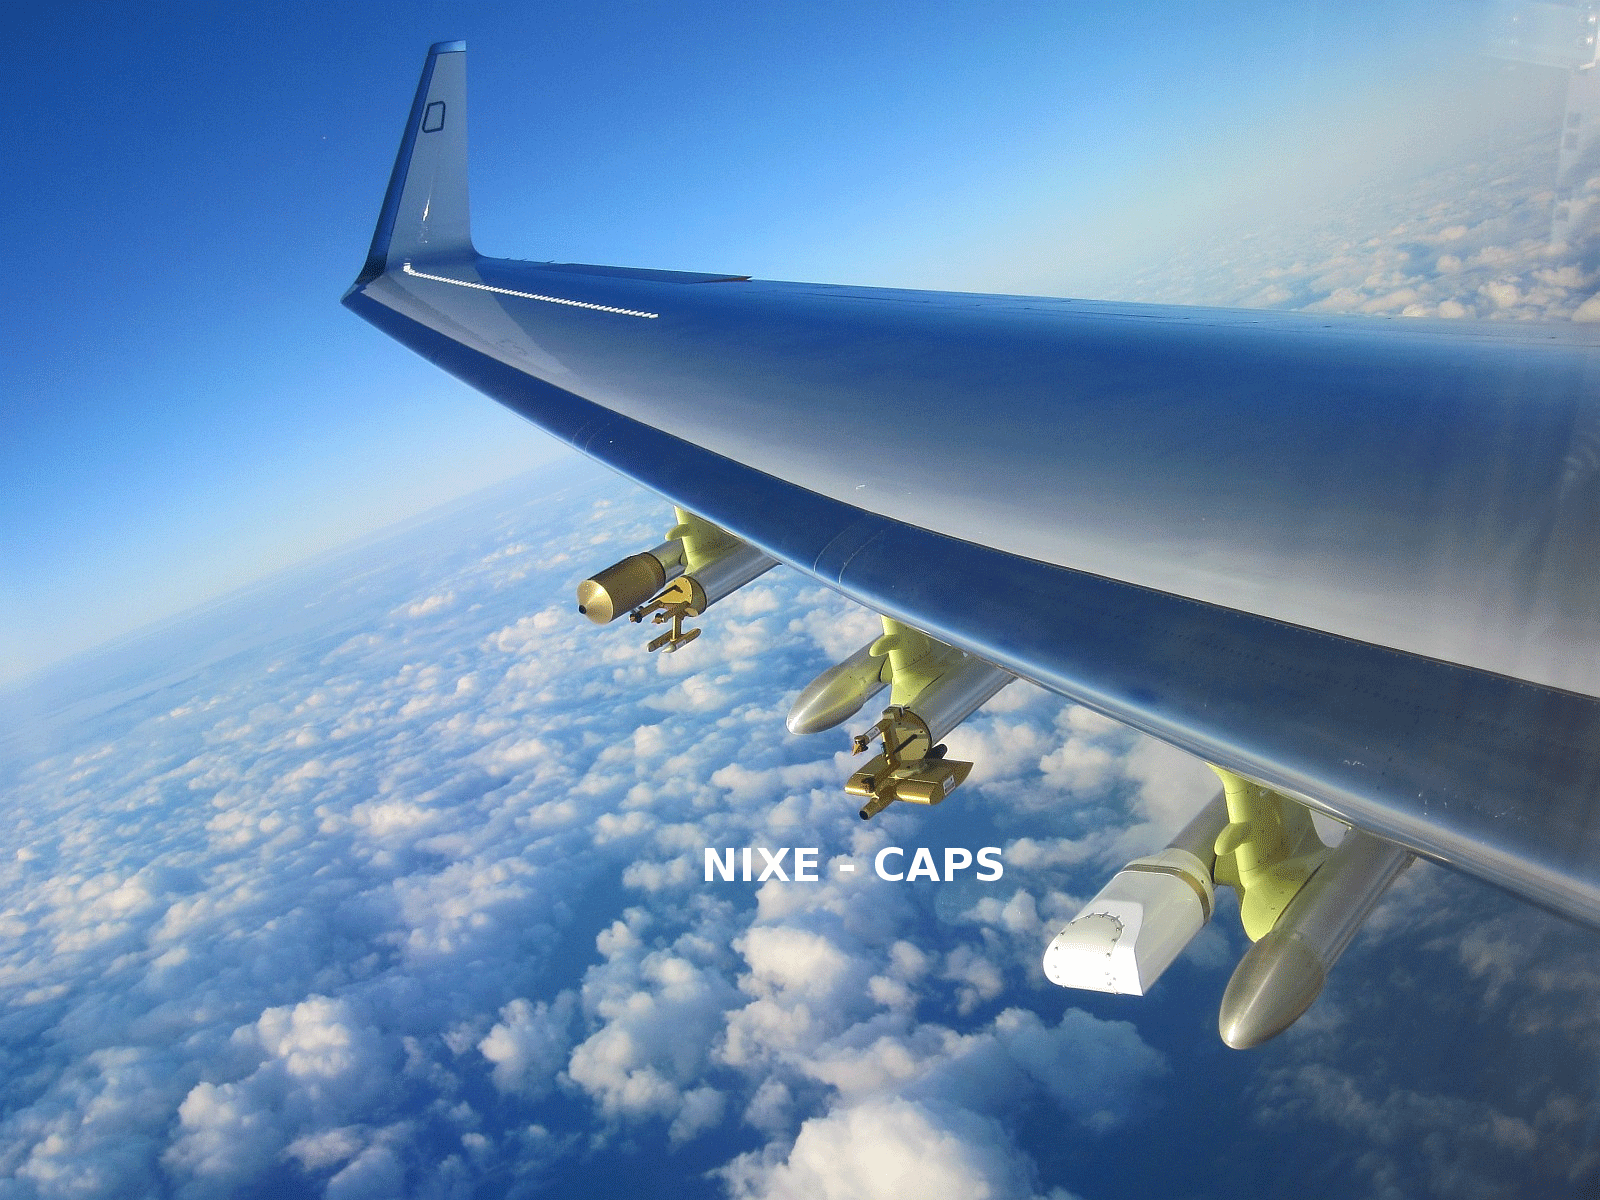
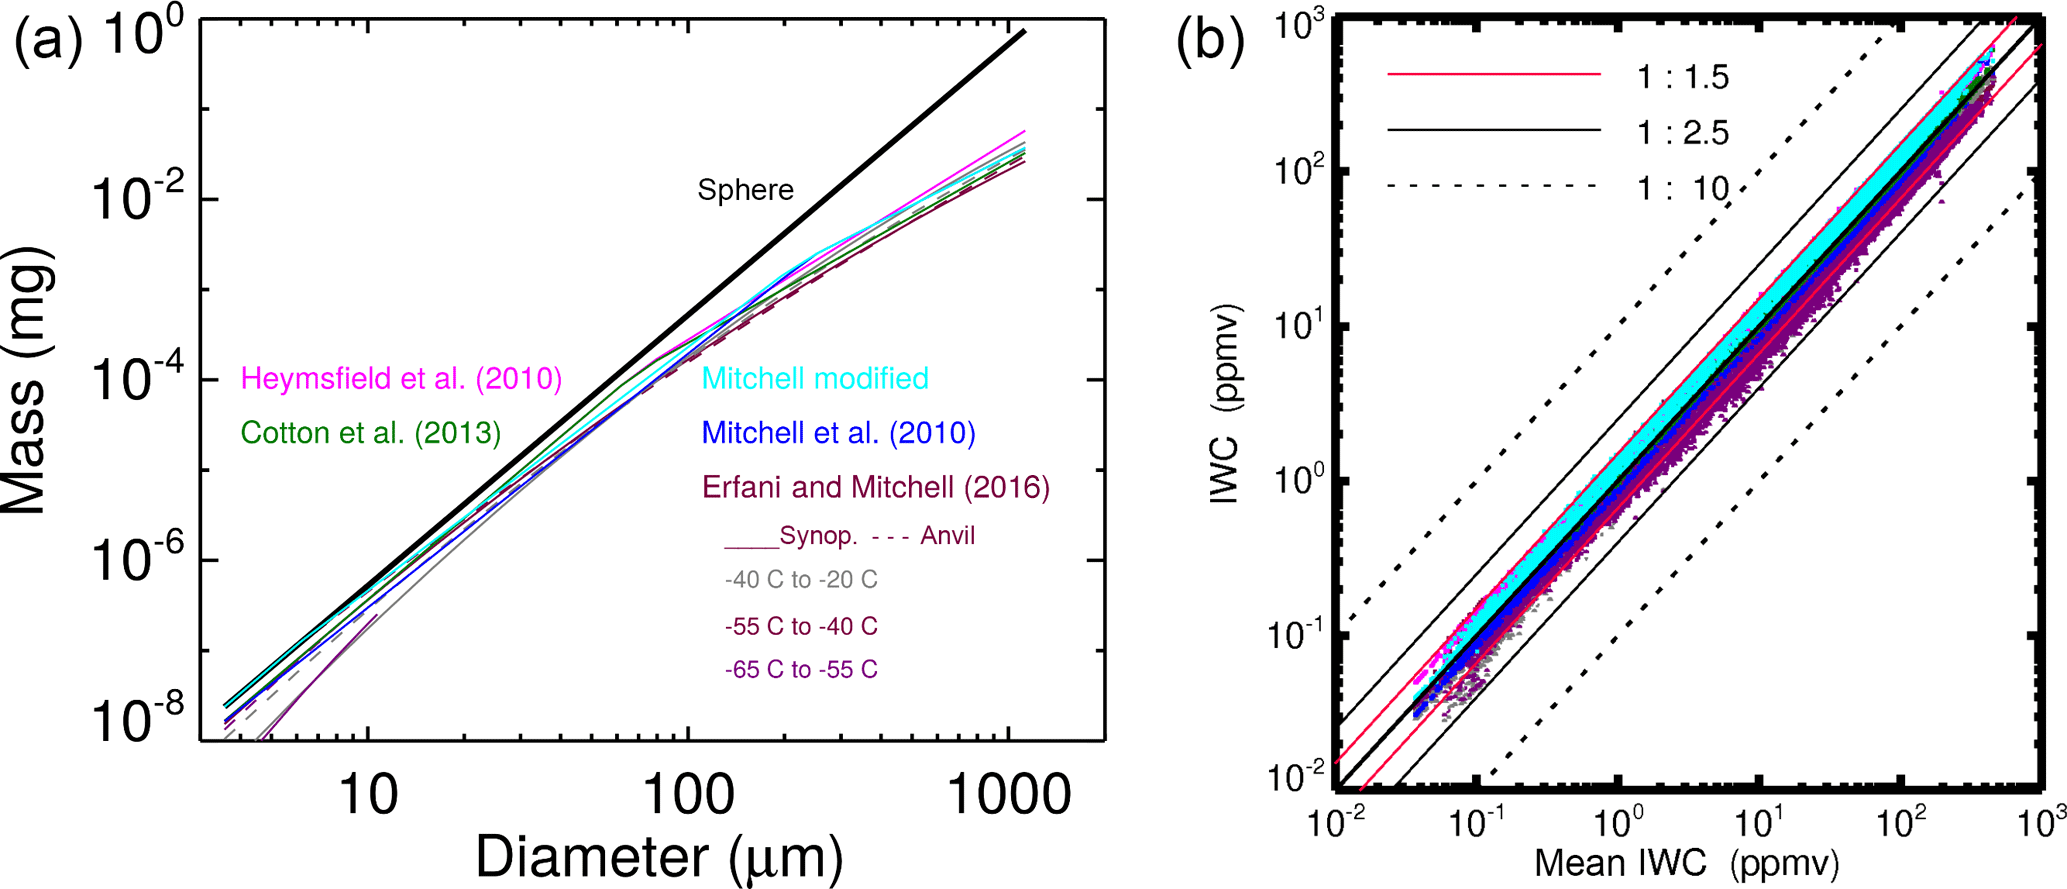
Figure 8(a) Ice particle mass in relation to size: summary of mass-dimension (m–D) relations. The black line is for an ice sphere. (b) IWCs calculated from the different m–D relations vs. their mean IWC for one flight during ML-CIRRUS (29 March 2014) where the entire IWC range is covered by the measurements. 55 % of the data are between 1 : ±1.2, while 19/26 % can be found in the ranges 1 : −(1.2 to 1.5)/1 : (1.2–1.5).
During MacPex 2011, the cloud spectrometer 2D-S (Lawson et al., 2006) was mounted under a wingpod of the WB-57 to measure cloud particles at a time resolution of 1 Hz (the mounting position is listed in Table 1). 2D-S is an optical imaging cloud probe comparable to the CIPg, covering the particle size range of 15–1280 µm diameter. The IWC is derived from an a–D (area–dimension) relation described by Baker and Lawson (2006), which is again confirmed here (see Sect. 5.1.3 and Fig. 11, right panel).
The IWCs derived from the wing-mounted NIXE or 2D-S ice particle measurements are here referred to as “wing IWCs”.
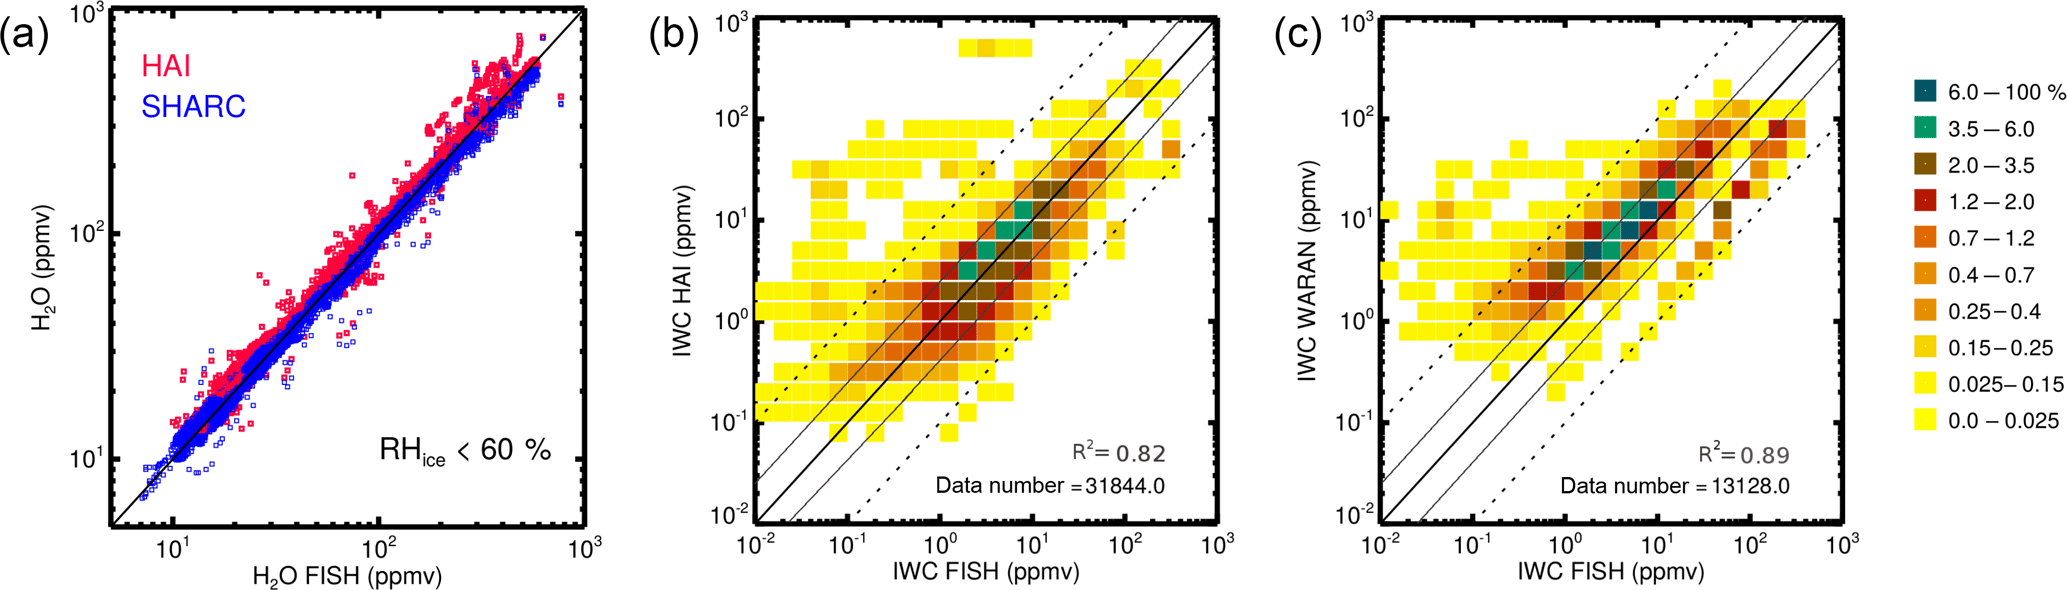
Figure 9Comparison of H2O (a) and IWCs (b) from roof-mounted closed-path hygrometers FISH, HAI and WARAN (H2Otot) and SHARC (H2Ogas) @HALO during ML-CIRRUS 2014 (color code: frequencies; solid black: 1 : 1 line; dashed/thin: ±factor 10/2.5 to 1 : 1 line). Linear regression coefficients for X = IWC FISH, Y = IWC HAI/WARAN are FISH/HAI (b) , σ=0.0032 and FISH/WARAN (c) , σ=0.0035; the correlation coefficients R2 are shown in the respective panels. The FISH/HAI regression is calculated for the data range > 0.2 ppmv (lower detection limit of HAI in the observed temperature range; see Fig. 3) and the FISH/WARAN regression for > 0.5 ppmv (lower detection limit of WARAN; see Fig. 3).
5.1 IWCs from roof, side, bottom and wing sampling
5.1.1 Roof H2O measurements
First, the measurements of the hygrometers mounted on the roof of the HALO aircraft (FISH, HAI, Waran and SHARC) are compared to each other to ensure that possible instrument differences are not attributed to the probing position in the further discussion. Note here that the FISH instrument is a well-established hygrometer with a long history of successful aircraft measurements and instrument intercomparisons (Fahey et al., 2014; Meyer et al., 2015; Rollins et al., 2014). SHARC, HAI and Waran are developed for and first deployed on the HALO aircraft.
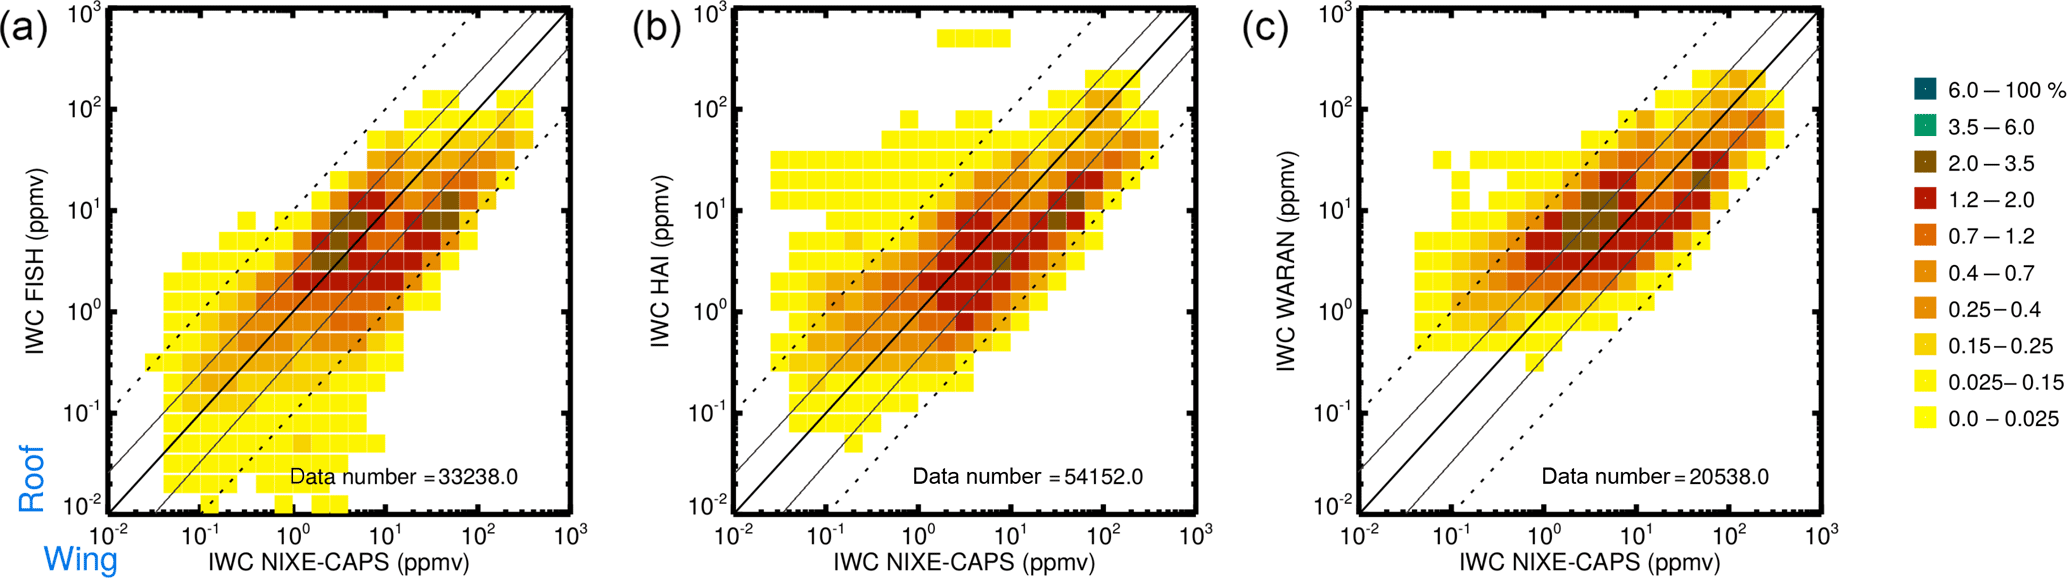
Figure 10Comparison of IWCs from roof-mounted closed-path hygrometers FISH, HAI and Waran (see Eq. 1, H2Ogas from SHARC) and wing-mounted cloud spectrometer NIXE @HALO during ML-CIRRUS 2014 (color code: frequencies; solid black: 1 : 1 line; dashed/thin: ±factor 10/2.5 to 1 : 1 line).
To this end, scatterplots of H2O in clear air as well as IWCs in cirrus are shown in Fig. 9. Good agreement of the clear air H2O measurements (at RHice < 60 % to strictly exclude clouds) from FISH, HAI and SHARC is demonstrated in the left panel of the figure. The middle panel shows the IWC scatterplot of FISH and HAI. Most of the measurements symmetrically spread around the 1 : 1 line within a factor of 2.5, which can be considered a good agreement (as discussed in Sects. 2 and 5.1.4). Linear regression is calculated for the data range > 0.2 ppmv, representing the lower detection limit of HAI in the observed temperature range (see Fig. 3). The correlation coefficient R2 = 0.82 (regression coefficients are given in the figure caption; the regression lines are not plotted to keep the visual clearness of the graphics). In the right panel, the measurements of FISH and Waran are displayed. The data are mostly placed above the 1 : 1 line, most frequently around a factor of 2.5. This means that the IWC of Waran is shifted to higher values in comparison to FISH. An explanation for this behavior is still missing. The linear regression is calculated for the data range > 0.5 ppmv, the lower detection limit of WARAN in the observed temperature range (see Fig. 3). The correlation coefficient R2 = 0.89.
5.1.2 Roof and wing IWCs
IWCs from measurements on the aircraft roof in comparison to the IWC measured under the wing are shown in Fig. 10. The left, middle and right panels of the figure depict roof-mounted FISH, HAI and WARAN versus wing-mounted NIXE observations.
The first thing to note is the relatively broad scatter of all IWC measurements. This can be seen from the broad distribution of the data points between the black dashed lines in the panels, which represent a factor of ±10 to the black solid 1 : 1 line. A closer look at the panels by taking notice of the frequencies of occurrence (see color code in the figure), however, shows narrower structures parallel to the 1 : 1 lines. For the FISH instrument, at medium IWCs most data pairs are placed between the 1 : 1 and 1 : 2.5 lines (IWC enrichment), while at higher IWCs the highest frequencies are found below the 1 : 10 line (IWC losses). The same is found for HAI, but at medium IWC losses are seen more often than for FISH. Likewise, for Waran, IWC enrichment is more abundant and expands beyond the 1 : 2.5 line in the medium IWC range. No clear correlations can be observed here, as expected when sampling ice crystals on the roof of an airplane where the measurement is influenced by shadow/enrichment zones for larger/smaller particles (see Sect. 3.1.1). The structures of IWC deviations seen in Fig. 10 will be further analyzed in Sect. 5.2. What can already be seen when comparing the scattering of IWCs with that caused by the use of different m–D relations (see Fig. 8) is that the m–D relation does not cause the deviations seen in Fig. 10.
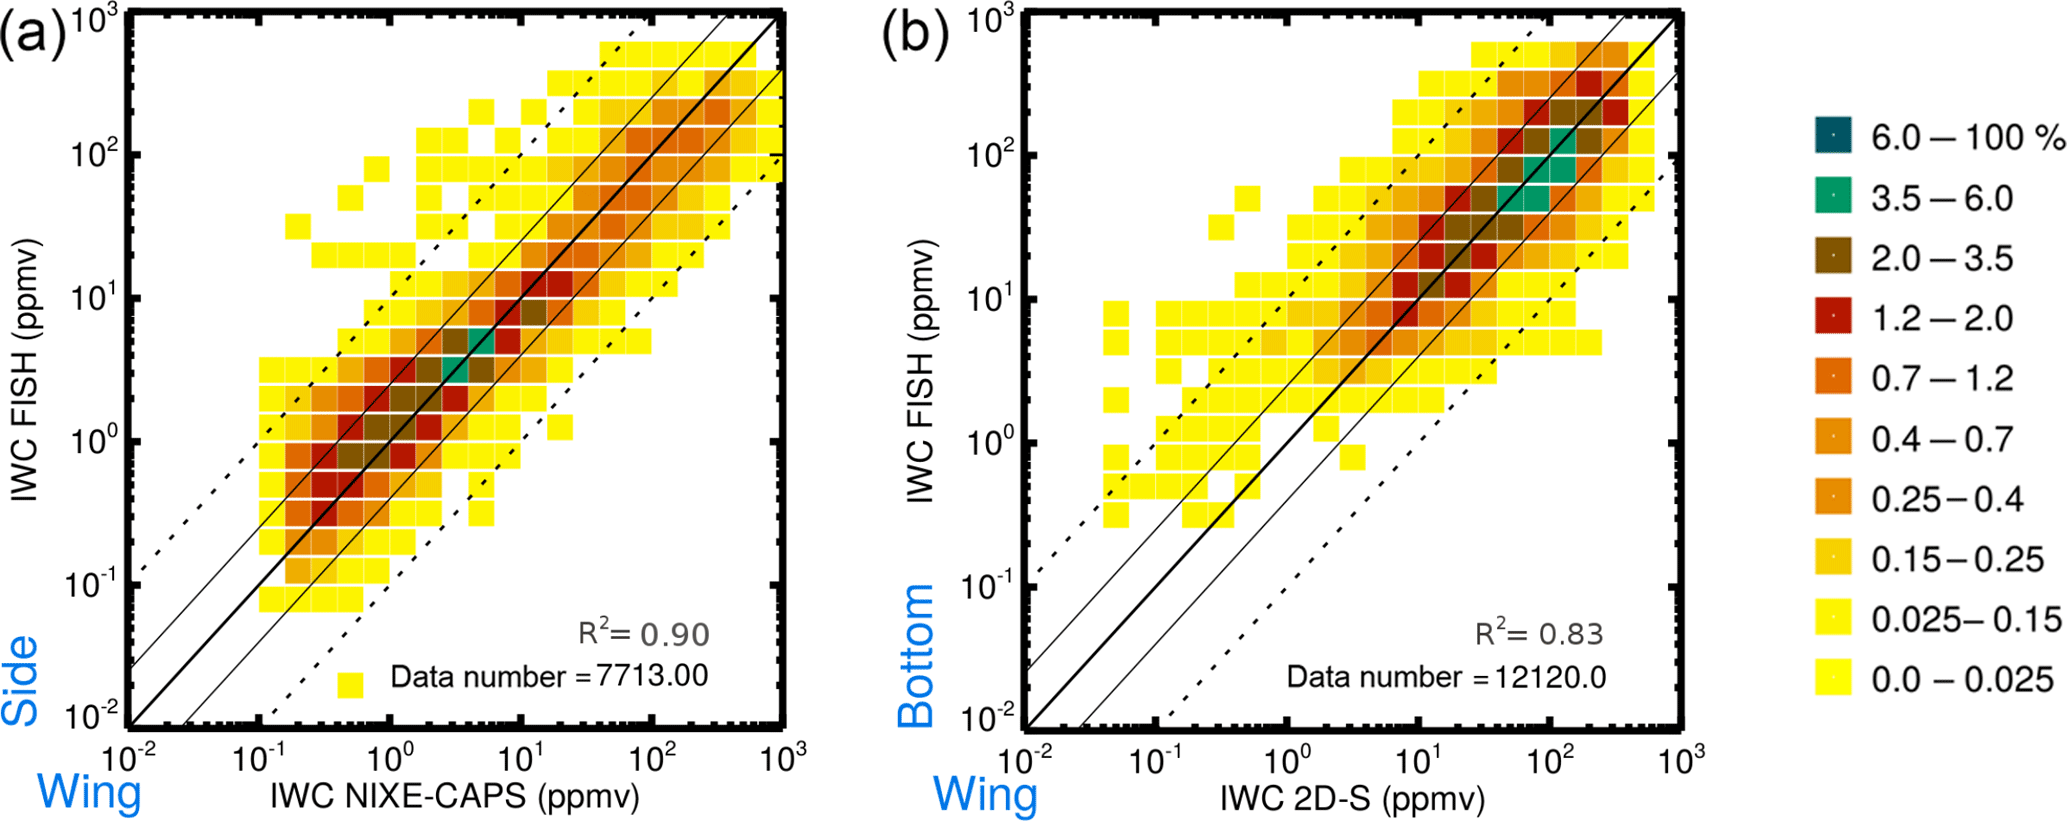
Figure 11Comparison of IWCs from (a) side-mounted closed-path FISH (see Eq. 1, H2Ogas from FLASH) and wing-mounted cloud spectrometer NIXE @Geophysica during StratoClim 2017; (b) bottom-mounted closed-path FISH (see Eq. 1, H2Ogas from HWV) and wing-mounted cloud spectrometer 2D-S @WB-57 during MacPex 2011 (color code: frequencies; solid black: 1 : 1 line; dashed/thin: ±factor 10/2.5 to 1 : 1 line). Linear regression coefficients for X = IWC wing, Y = IWC side–bottom are (a) side–wing , σ=0.0045 and (b) bottom–wing , σ=0.0048; the correlation coefficients R2 are shown in the respective panels. The side–wing regression is calculated for the data range > 0.15 ppmv (lower detection limit NIXE-CAPS).
5.1.3 Side, bottom and wing IWCs
To investigate if the differences of the IWCs from roof and wing measurements found in the last section might be indeed related to the H2Otot inlet position at the aircraft's roof, we analyze IWCs correlations of side–wing and bottom–wing measurements in the following.
Side IWCs were measured by FISH (H2Otot; see inlet position in Fig. 5 and Table 1) together with the hygrometer FLASH for H2Ogas, while wing IWCs are recorded by the cloud spectrometer NIXE during the recent field campaign StratoClim 2017 with the Russian aircraft Geophysica. Note here that the roof and wing ice particle measurements are taken with instruments that also operated on board HALO. Under clear-sky conditions the hygrometers agree as well as those shown in Fig. 9, left panel (not shown here).
A good agreement of side–wing IWCs can be seen from the left panel of Fig. 11. The majority of data pairs are distributed between the thin lines, representing a factor of ±2.5.
Linear regression is calculated for the data range > 0.15 ppmv, the lower IWC detection limit of NIXE. The correlation coefficient R2 = 0.90 is the highest of the considered correlations. Since for these measurements the same instruments as for the roof–wing measurements were used for ice particle sampling, the position of the H2Otot inlet on the side of the aircraft is most probably the cause for the better agreement of the IWCs in comparison to the roof–wing IWCs discussed in the previous section (shown in Fig. 10). The reason is that here the airflow clings better at the aircraft fuselage because the cockpit is less disruptive. Consequently, the trajectories of the ice crystals are not deflected, as occurs on the roof of the aircraft (see Sect. 3). Another aspect of the good agreement between the two measurements is that it shows the validity of the m–D relation used to calculate the IWC from the PSDice measured by NIXE.
Bottom and wing IWCs were measured by FISH for H2Otot (see inlet position in Fig. 6; note that FISH is also deployed at HALO and Geophysica) and the hygrometer HWV for H2Ogas, complemented by the cloud spectrometer 2D-S. The instruments are mounted on the US aircraft WB-57 during the field campaign MacPex 2011 (Krämer et al., 2016). FISH and HWV agreed well under clear-sky conditions (not shown here).
It can be seen from Fig. 11, right panel, that – besides mostly high IWCs being found in the probed mesoscale convective cloud systems – the bottom–wing data pairs are evenly distributed between the 1 : 1 and 1 : ±2.5 lines, as are the side–wing observations. This is again attributed to the position of the H2Otot inlet at the bottom of the aircraft where the ice crystals are not deflected. The correlation coefficient R2 = 0.83 of the linear regression (note that no lower instrument detection limits need to be considered here since the IWCs are generally high) is slightly less than for the side–wing measurements at Geophysica.
5.1.4 Scatter of IWC measurements
In all cases of reasonable agreement between IWC measurements, in the sense of possible agreement between IWC measurements from different ice particle sampling positions discussed in Sect. 2, the IWC data distribute around the 1 : 1 line mostly in between a factor of ±2.5 or better (see Fig. 9: roof–roof, and Fig. 11: side–wing and bottom–wing), represented by the thin lines in the figures. This is in good agreement with a study by de Reus et al. (2009), where IWCs from H2Otot (FISH and FLASH) and cloud spectrometers (FSSP and CIP) measurements at the Russian aircraft Geophysica are compared during the field campaign SCOUT-O3. De Reus et al. (2009) reported an IWC scatter of ±2.2 around the 1 : 1 line. A scatter of IWC data on this order of magnitude is also reported by Thornberry et al. (2017), who measured IWCs by means of the side mounted NOAA-TDL hygrometer and the wing-mounted cloud spectrometers FCDP and 2D-S on board the Global Hawk during the ATTREX 2014 campaign. Abel et al. (2014) reported this quite large scatter, which in all cases exceeds the uncertainties stated for the instruments. The scatter of IWC from three instruments mounted on the WB-57 reported by Davis et al. (2007) is slightly better.
5.2 Impact of ice crystal size on roof IWC
To further investigate the structures seen in the roof–wing IWC scatterplots discussed in Sect. 5.1.2 (see Fig. 10), we analyze the influence of the ice particle size distribution (PSDice) on the IWCs and also ice particle trajectories of different sizes around the planes fuselage for the specific case of roof sampling considered here.
To visualize the influence of PSDice on IWC, we look at the ratio of the roof to the wing IWCs regarding the mean mass radius Rice of the PSDice ( with ρ = 0.92 g cm−3, Nice = total number of ice crystals with diameter > 3 µm from NIXE). The results are shown in Fig. 12. In the case of undisturbed sampling at both positions at the aircraft, the distribution of the data points should be homogeneous around the 1 line of the IWC ratio, with the highest frequencies closest to this line. However, the data distributions are more duck-shaped for all three roof-mounted H2Otot instruments. The appearance of the IWC ratios can be divided into three regimes, marked by the thin vertical red lines in Fig. 12.
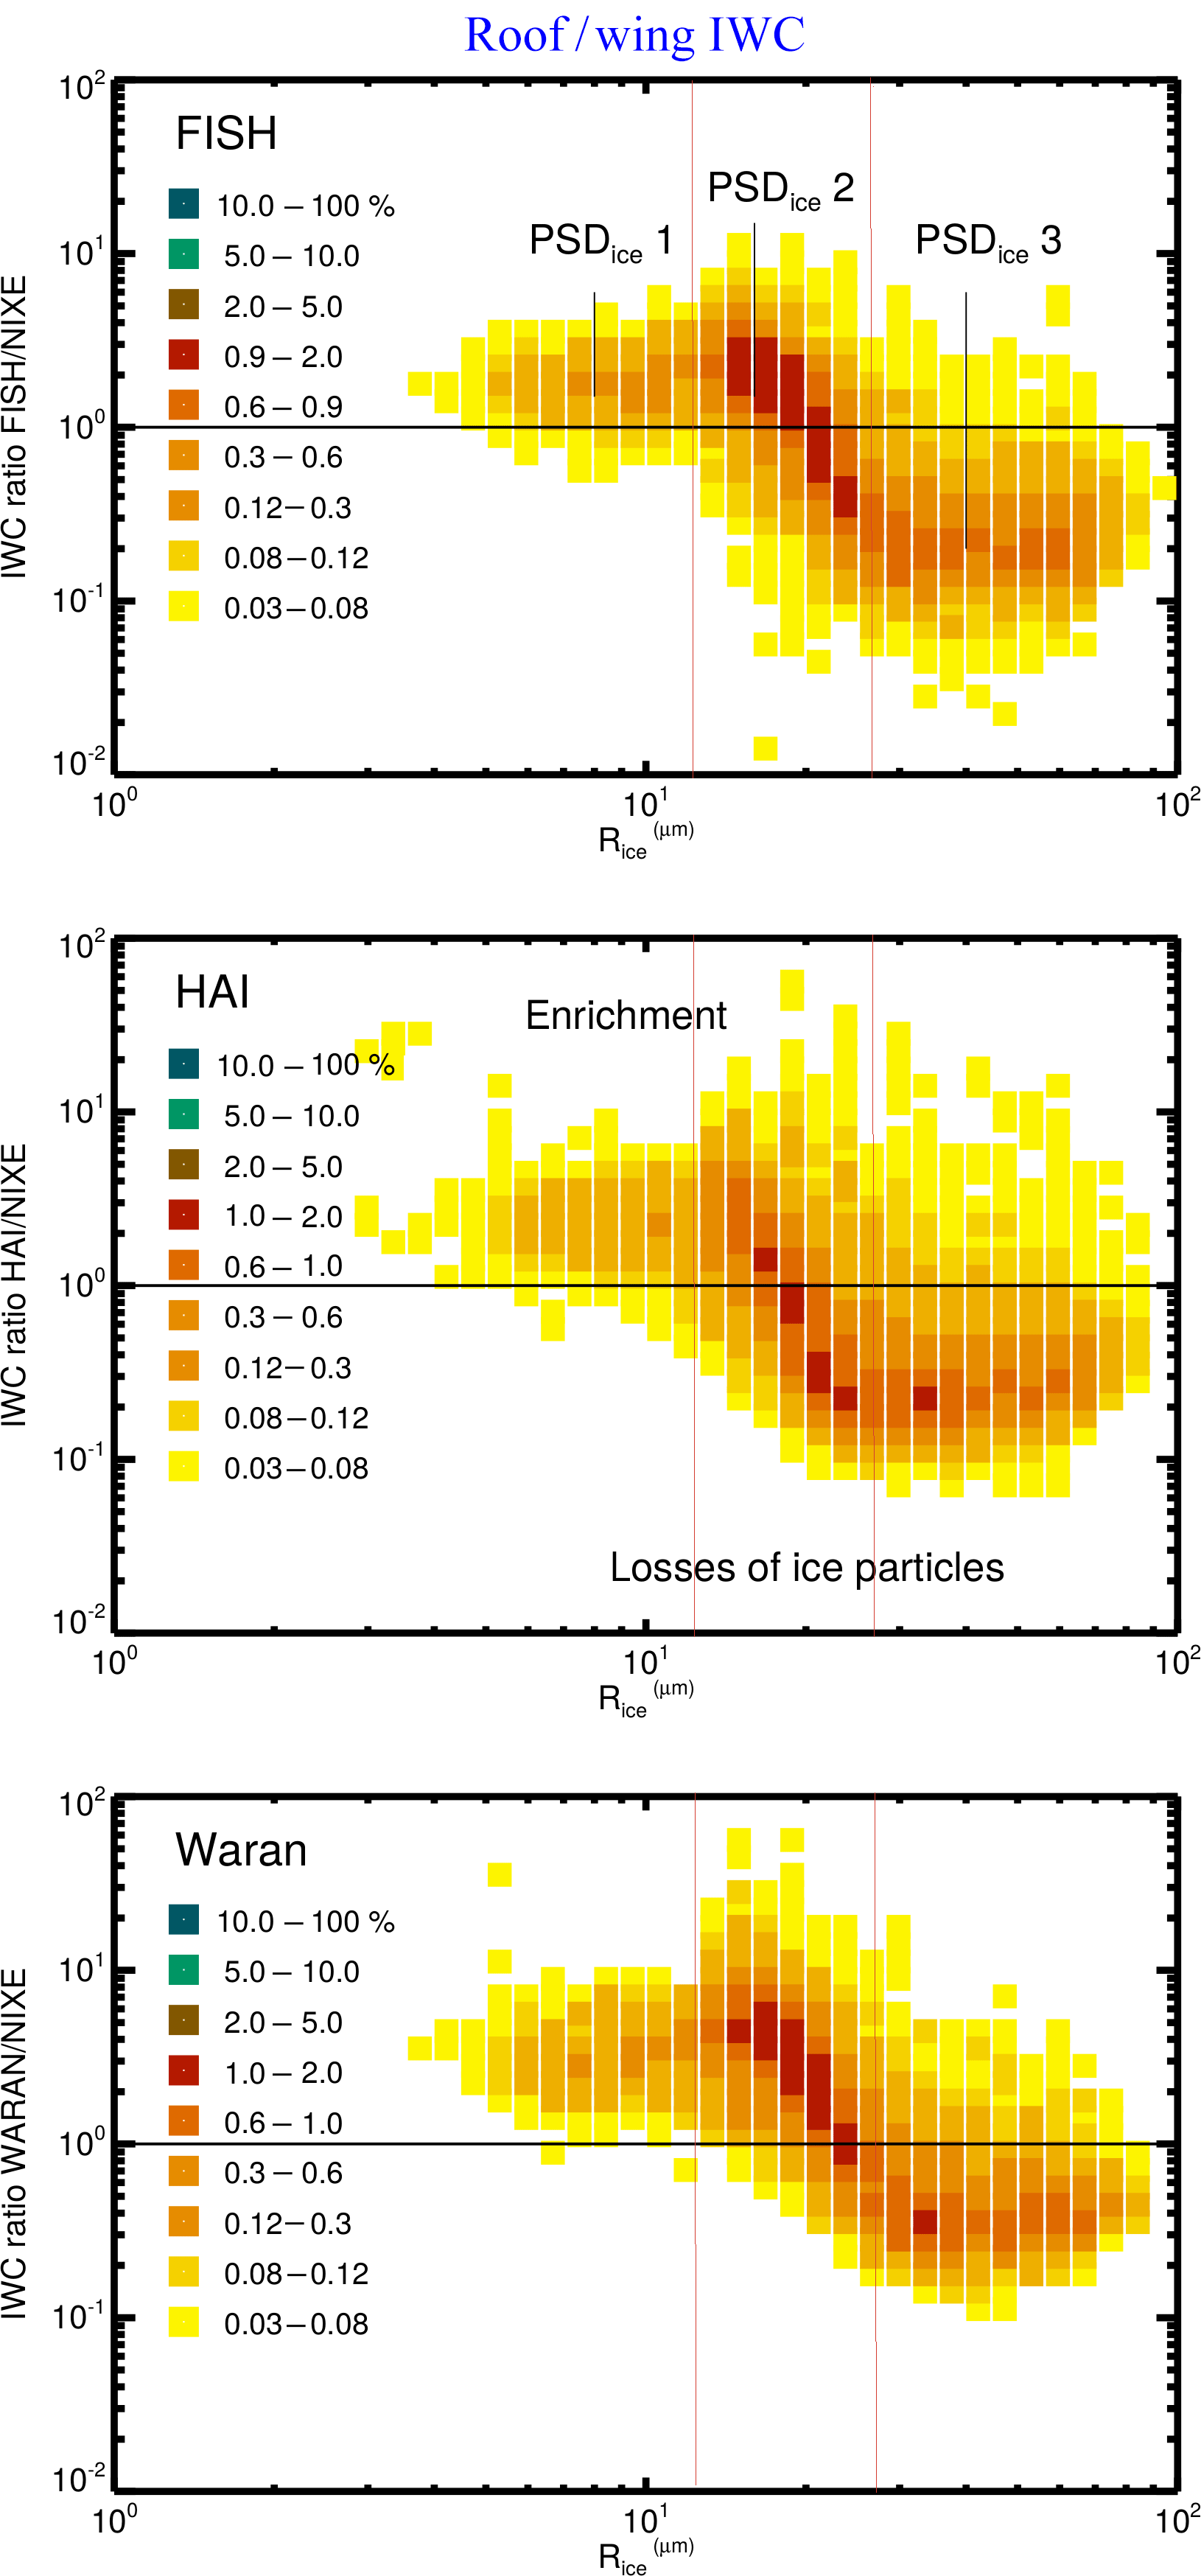
Figure 12Ratios of roof ∕ wing IWC (roof IWC from FISH, HAI, Waran; wing IWC from NIXE) vs. mean mass Rice.
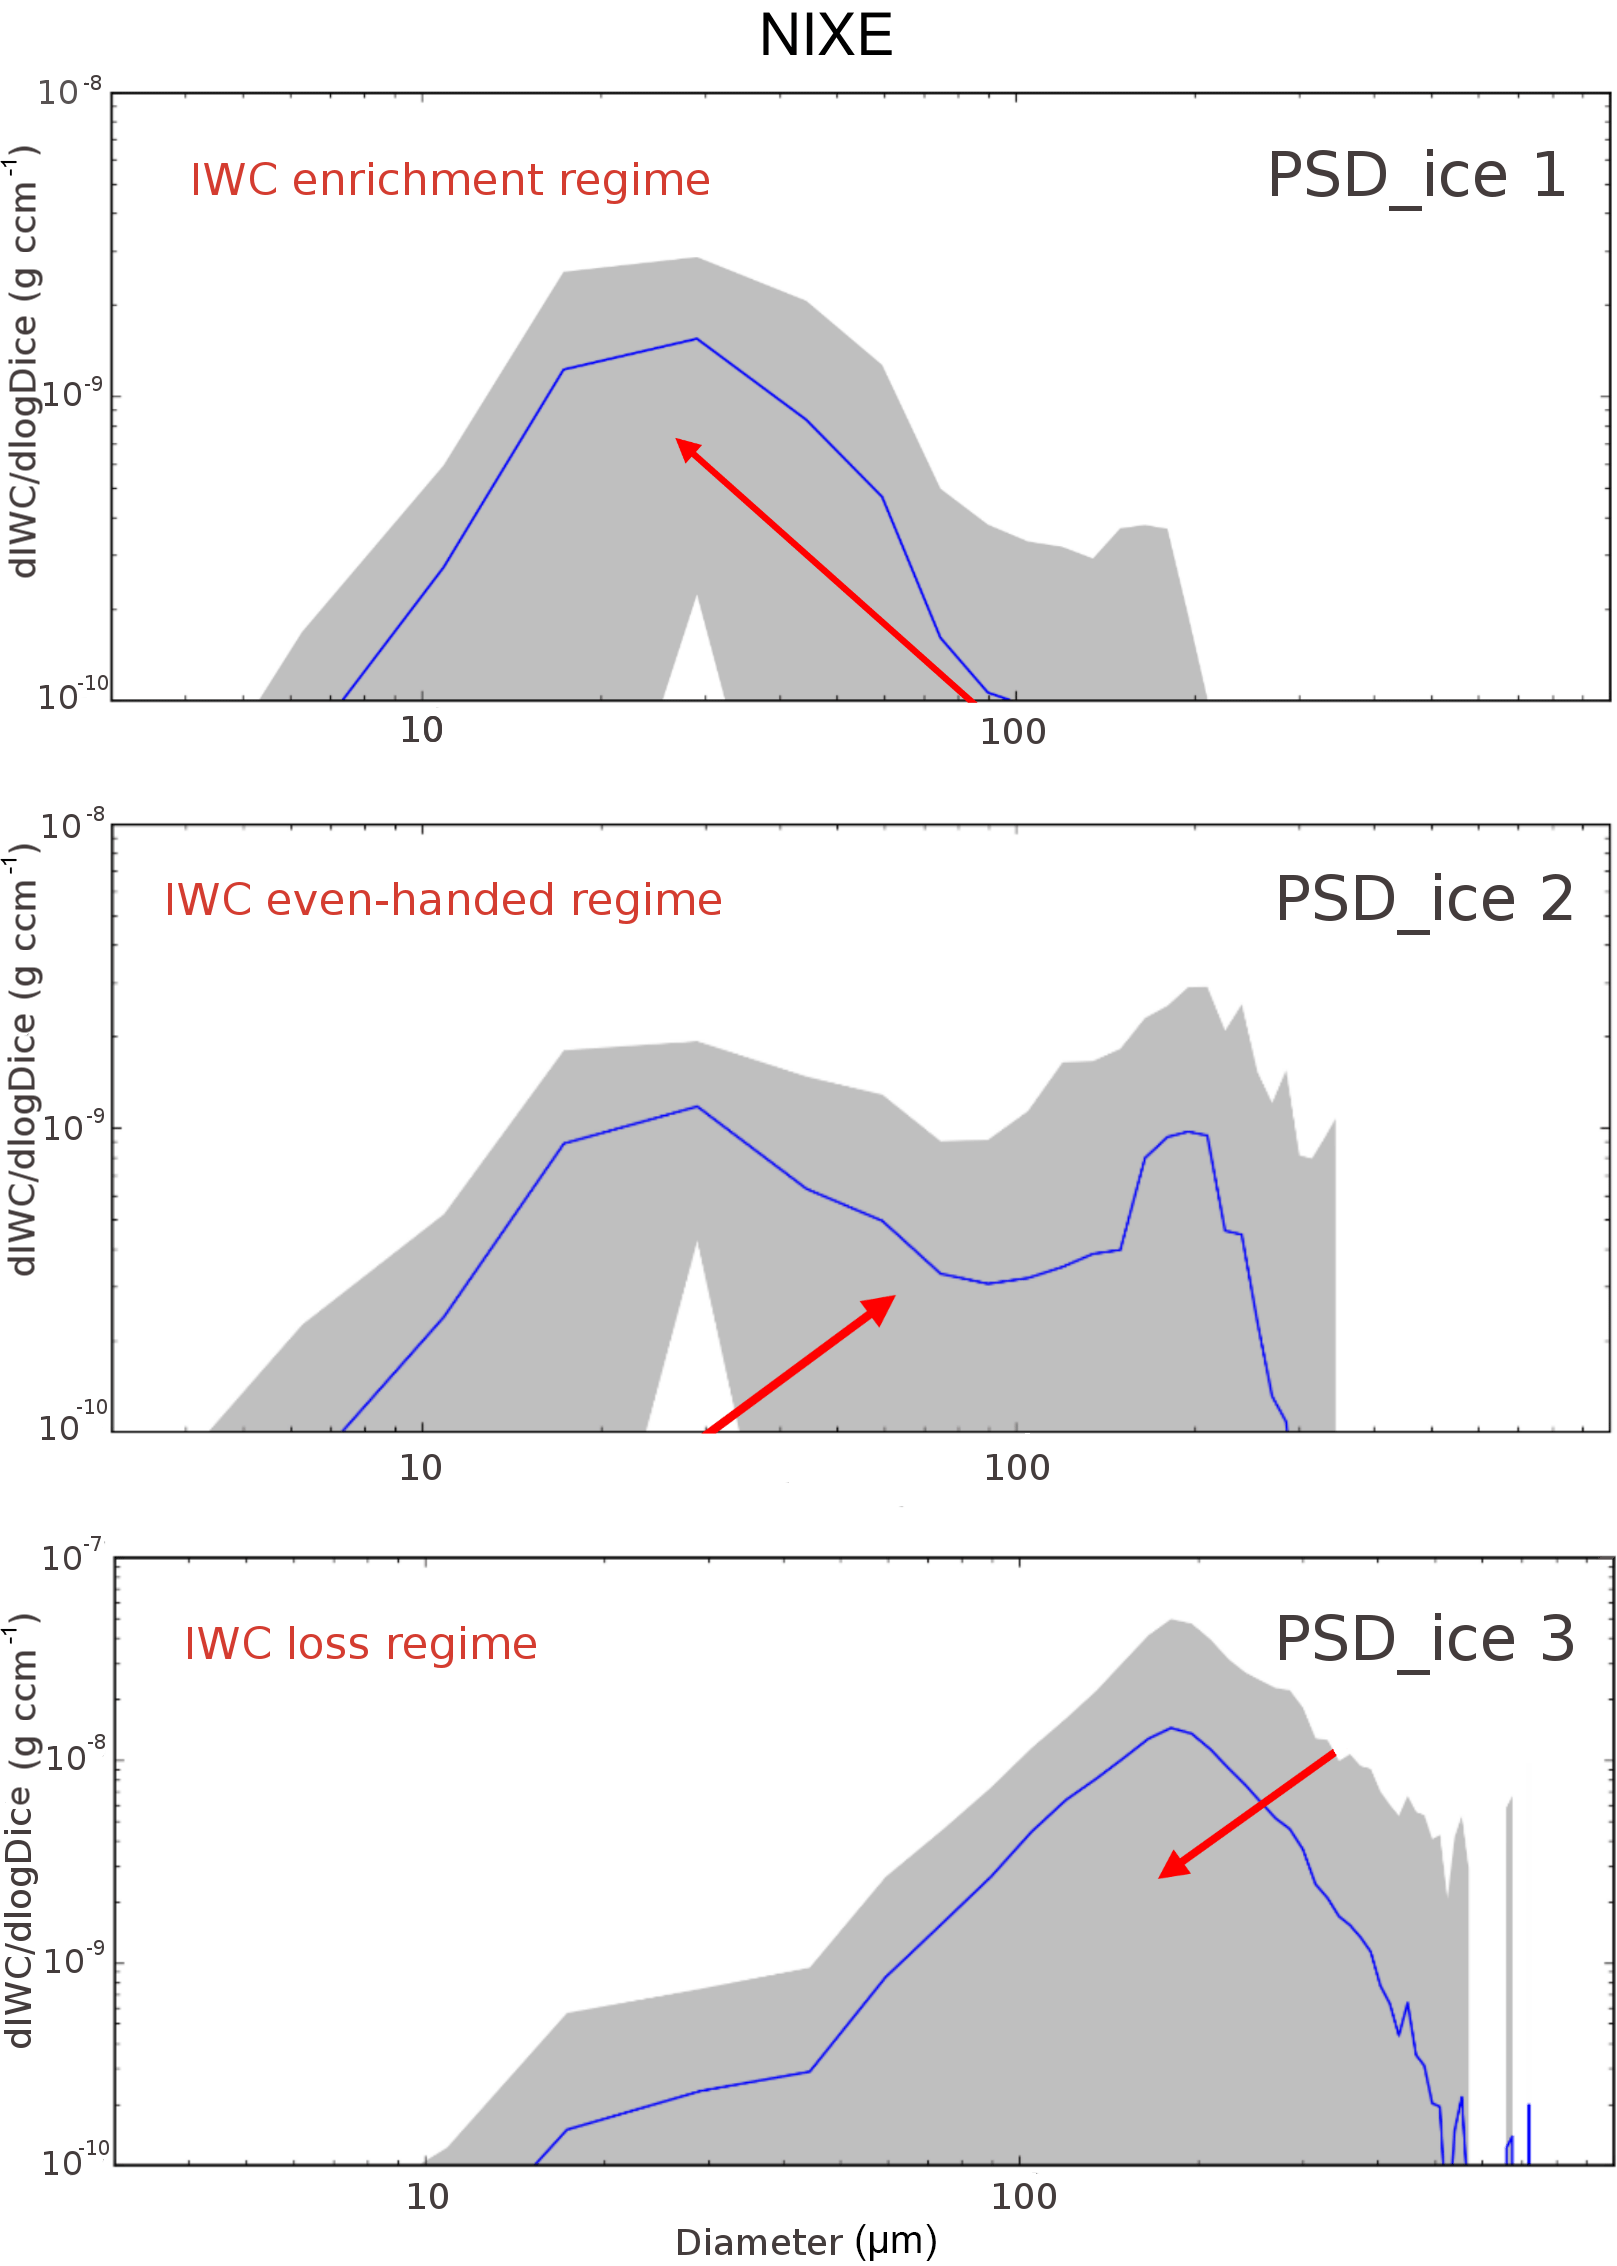
Figure 13Three types of cirrus mass size distributions dIWC ∕ dlogDice exemplarily for the flight on 4 April 2014. Blue lines represent the mean PSDs and the gray area represents the standard deviation. to clearly distinguish the actual particle size from the mean mass radius Rice of the ice particle population used in Fig. 12.
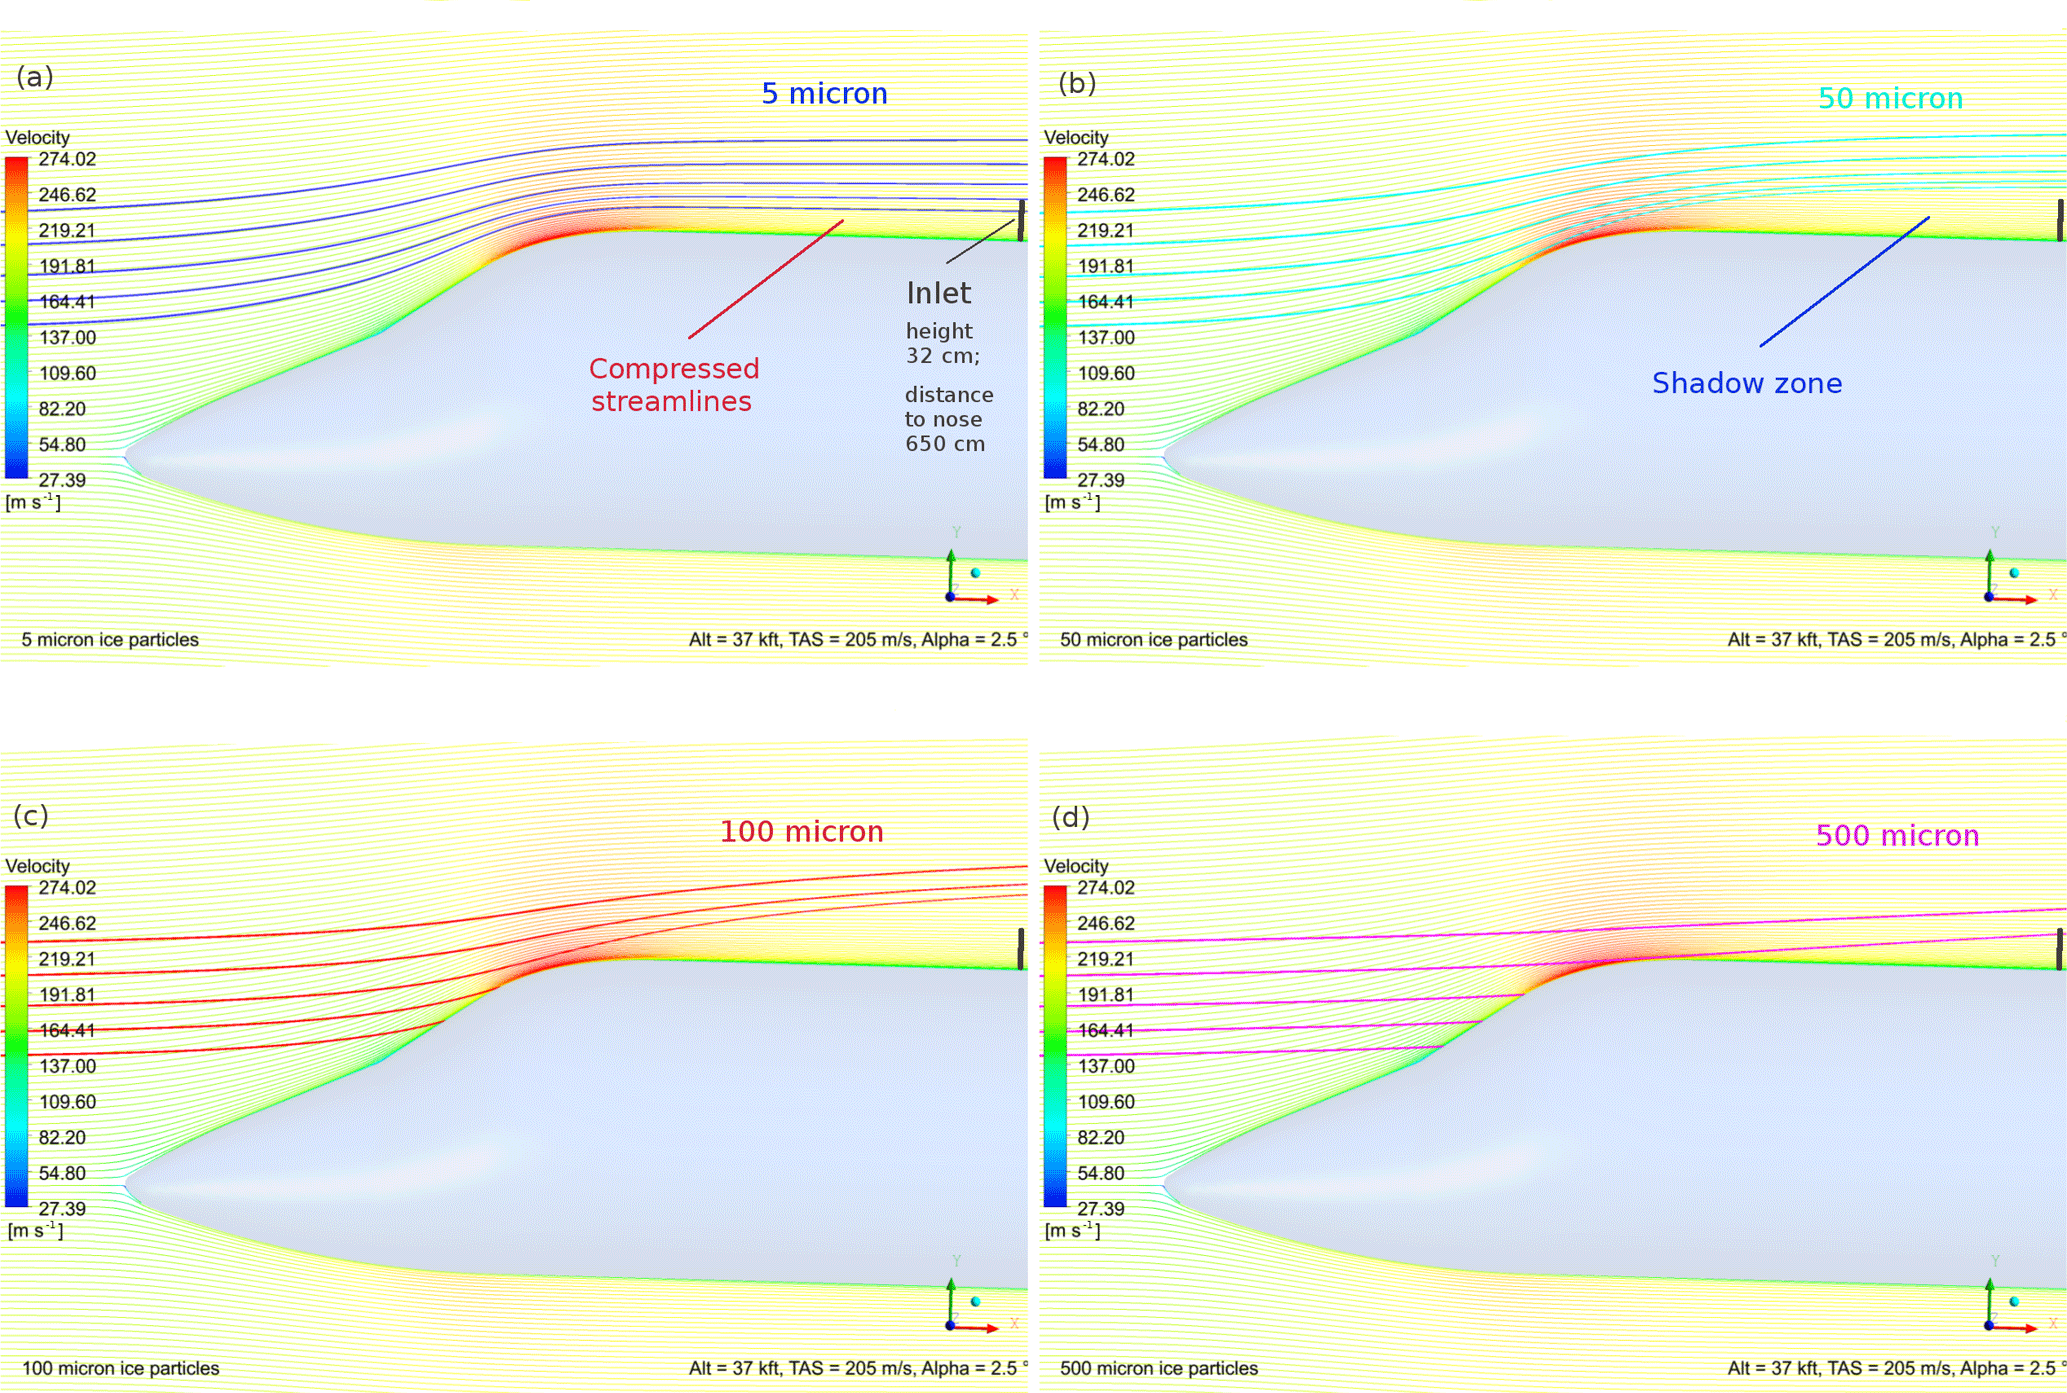
Figure 14Three-dimensional CFD calculations of gas streamlines (thin lines, color coded by the velocity of the flow) and ice particle trajectories (thick colored lines) around an aircraft with a fuselage similar to the HALO aircraft (note that for legal reasons, the exact envelope of HALO can not be simulated). The IWC inlet is placed on the roof at the same position as the TGI on HALO (see Fig. 4, Sect. 4.1.1). The simulations are run for typical conditions during penetration of cirrus clouds: altitude = 37 kft (11.3 km), true air speed TAS = 205 m s−1, angle of attack AOA = 2.5∘ and an ice crystal density of 0.918 g cm−3. The panels are for different particle sizes, indicated in the panels. Ice particles starting at the lowest trajectory position enter the middle inlet tube of the IWC inlet if the particle follows the gas streamline. The simulations are run by means of CFX 18.2 by ANSYS Inc. For a more detailed description of the methods applied to the simulations see Weigel et al. (2016).
-
An IWC enrichment regime is observed for small Rice (about < 12 µm). A mass size distribution typical for this regime is displayed in Fig. 13 (PSDice 1, top panel; note that for the portrayal of the PSDs, we use the ice particle diameter and not the radius to clearly distinguish from the mean mass radius Rice of the ice particle population used in Fig. 12). The ice mass of PSDice 1 accumulates at smaller sizes; larger ice particles do not contribute to the IWC. Following Sect. 3 (Fig. 1), smaller ice crystals at the aircraft roof are enriched close to the fuselage, and this is what Fig. 12 shows in consistency with the enrichment at lower IWC seen in Fig. 10.
To support this finding based on the experimental approach of comparative IWC measurements, we made three-dimensional CFD calculations of gas streamlines and ice particle trajectories around an aircraft with a HALO-type fuselage, shown in Fig. 14. In panel (a) trajectories of ice crystals as small as 5 µm diameter are plotted (thick lines). It can be seen from the figure that the gas streamlines (thin lines, color coded by the velocity of the flow) are compressed, in accordance with the potential flow calculations. Consequently, the probed air volume is compressed for smaller ice crystals which follow the streamlines, which leads to the observed enrichment of IWC.
-
An IWC loss regime is detected in Fig. 12 for large mean mass Rice (about ≳ 25 µm). Here, the IWC originates mainly from large ice crystals connected to PSDice 3 in Fig. 13 that are not sampled in the shadow zone at the aircraft roof. A shadow zone can also be seen in the CFD simulation in Figure 14, panels (b) and (c). Ice particles of 50 and 100 µm miss the inlet or hit the plane, respectively. Note that the width of the shadow zone differs for the different particle sizes but increases for the 100 µm ice particles in comparison to those with 50 µm. However, some cases of IWC oversampling (IWC ratios > 1 in Fig. 12) are also found for large ice crystals. This might be explained by cases in which huge ice crystals are present, which meet the inlet directly, as can be seen in panel (d) of Fig. 14 (500 µm particle trajectory), but come from air outside of the original sampling volume.
-
An IWC even-handed regime is found (Fig. 12) for intermediate Rice (about 12–25 µm). The corresponding typical PSDice 2 can be seen in the middle panel of Fig. 13. This type of PSDice is bimodal with one ice mass peak at smaller sizes and another at larger sizes. Depending on which of the peaks is dominating, the accumulation of smaller ice crystals in the aircraft's enrichment zone or the losses of larger ice crystals in the shadow zone overbalance.

Figure 15(a, b) IWC regarding temperature during ML-CIRRUS 2014, from roof-mounted FISH and wing-mounted NIXE (Schiller et al., 2008). (c) Rice regarding temperature during ML-CIRRUS 2014, from wing-mounted NIXE (the black lines denote the size regimes where ice particles are lost, enriched or both; for details see Sect. 5.2).
The duck shape of the IWC ratios of the three instruments slightly differ from each other. Most equally distributed around the ratio 1 are the FISH/NIXE IWCs (top panel of Fig. 12), with the highest frequencies in the enrichment part of the even-handed regime at IWC ratios slightly above 1. HAI/NIXE IWC ratios (middle panel of Fig. 12), on the other hand, have the highest frequencies in the loss part of the even-handed regime, reaching IWC ratios significantly below 1. This is consistent with the fact that the HAI instrument is connected to the middle forward inlet (see Fig. 4) and is thus – in comparison to the FISH inlet – closer to the fuselage. Here, the losses of large particles are more pronounced. It is notable that a few centimeters already have this effect on the particle sampling efficiency. The bottom panel of Fig. 12 shows the Waran/NIXE IWC ratios. Waran is connected – as is FISH – to the roof inlet of a TGI right next to that of FISH and thus shows a comparable distribution of frequencies but shifted to higher values. This reflects the somewhat higher Waran IWCs compared to those of the other instruments (see Figs. 9 and 10).
5.3 Roof and wing IWC climatologies
An overview of the impact of the sampling position on the IWC is given in Fig. 15, where IWC frequencies of occurrence are shown regarding temperature for the roof-mounted FISH instrument (top panel) and the wing-mounted NIXE (bottom panel).
Comparing the roof and wing IWCs at warmer temperatures, it can be clearly seen that high IWCs are not measured at the roof position and thus the higher frequencies are shifted to lower IWCs. The reason is most probably that high IWCs at temperatures ≳ 220 K are related to large ice crystal sizes belonging to the loss regime discussed in the previous section, which can be seen in Fig. 15 (bottom panel), where frequencies of occurrence of Rice regarding temperature are plotted. At lower temperatures, the mean mass ice crystal sizes Rice shrinks into the even-handed and enrichment regime, which means they are often enriched, resulting in an overestimation of the roof IWCs. This can be seen in the higher frequencies of larger roof IWCS in comparison to the wing IWCs.
Altogether, the IWC climatology of the roof IWCs covers roughly the same range as that of the wing IWCs, with the exception that large IWCs at high temperatures are missed. However, the distribution of the frequencies of occurrence of the IWCs is caused by the position of the H2Otot inlet, which is heavily skewed for the roof IWCs.
The influence of the ice particle sampling position on IWC measurements on aircraft is investigated with the approach of comparative measurements. The reproducibility of the underlying total water measurements is assessed by comparing several instruments at the same position as well as with gas-phase water instruments. The representativeness of the corresponding IWC measurements on the roof, side and bottom mountings on the fuselage is evaluated by comparison with IWCs derived from ice particle size distributions measured under the aircraft wing.
-
The IWCs measured at the fuselage side or bottom show reasonably good agreement in comparison to IWC measurements under the aircraft wing. Most frequently they correspond to each other within a factor of 2.5, independently of the mean ice crystal sizes. The reason for the mostly undisturbed measurements at these positions is that, under the aircraft wing and on the side and bottom of the fuselage, the cloud particle trajectories are not greatly diverted by the aircraft body or the wing itself, so the sampling of ice crystals represents nearly ambient conditions. However, the agreement of the IWCs does not only show the performance of the side, bottom and wing sampling positions but also the credibility of the measurements. This is notable since the measurement techniques greatly differ, the side–bottom IWC is measured by the Lyman–α fluorescence hygrometer FISH and the wing IWC is obtained from the ice particle mass size distribution measured by optical methods with NIXE-CAPS and 2D-S. A further conclusion from the agreement of the IWCs is that it demonstrates the validity of the m–D relation of Erfani and Mitchell (2016), which is slightly modified by Krämer et al. (2016) and Luebke et al. (2016) and applied to convert the NIXE-CAPS size of the ice crystals into mass. In addition, a comparison of 10 different m–D relations shows that the resulting IWCs differ from their mean IWC by at most a factor of 1.5 (55 % of the data range between 1 : ±1.2) over the entire IWC range.
-
However, roof and wing IWCs differ from each other. Since the instrument performance is shown from the side and bottom in comparison to wing measurements, we attribute the differences to the mounting position on the roof. Deviations of the streamlines and particle trajectories above the roof due to the cockpit can lead to both enrichment and losses of particles depending on the size of the ice particles. Large ice particles are lost in the shadow zone behind the aircraft's cockpit, while at the same time smaller ice crystals are enriched. These – expected – findings from the approach of comparative measurements are supported by CFD simulations run for different ice particle sizes. A more detailed analysis shows that, for the measurements taken in this study the mean mass radii of the ice particle population smaller than about 12 µm, enrichment of the ice crystals and thus an overestimation of the IWC dominates. In the size range of 12 to about 25 µm both enrichment and loss of ice crystals occur, while loss of large crystals leading to strongly underestimated IWCs prevails for larger sizes. Enrichment and losses are on the order of a factor of 10 or more.
A correction of the IWCs measured at aircraft roofs might only be possible when ice particle PSDs are measured simultaneously. However, in that case the IWCs calculated from the PSDs would still be more accurate. Because of the high variability of the ice particle size distributions, it is also not an option to assume PSDs, e.g., regarding temperature, for a correction of the roof IWCs.
The influence of the size-dependent enrichment or losses of ice crystals from the roof sampling propagates to IWC climatologies with respect to temperatures. At higher temperatures, where the ice crystals are larger, IWCs are underestimated due to the ice particle losses, while at lower temperatures overestimation of IWC caused by particle enrichment dominates.
-
The recommendations resulting from this comparison of in situ measurements of IWC are that reliable measurements of IWC are (i) possible from sampling positions on the side, bottom and under the wing when (ii) using instruments with a detection range that covers the complete wide IWC range from about 0.001 to 3000 ppmv and (iii) placing the instruments far enough away from the fuselage to minimize possible effects of flow distortions. The best approach for measuring IWC is to deploy a combination of two instruments at different sampling positions. As last remark we would like to note that this recommendation also applies to other ice particle measurements, such as ice crystal numbers sampled by counterflow virtual impactors (Mertes et al., 2007).
ML-CIRRUS via the DLR HALO database (https://doi.org/10.17616/R39Q0T; HALO consortium, 2017) at https://halo-db.pa.op.dlr.de/ (last acess: March 2017); MacPex via https://espoarchive.nasa.gov/archive/browse/macpex/WB57 (last access: March 2013); StratoClim via https://stratoclim.icg.kfa-juelich.de/AfcMain/CampaignDataBase, access to the data is possible in the near future, after the time period of first use of the data by the participants of the StratoClim project.
AA: NIXE-CAPS measurements and IWC analysis; MK: FISH and NIXE-CAPS measurements, IWC analysis; CR: FISH measurements and IWC analysis; AC: NIXE-CAPS measurements; NS: FISH measurements; MR: FISH and NIXE deployment; BB: HAI measurements; VE: HAI measurements; RH: Waran measurements; SK: Waran measurements; CV: Waran measurements; MZ: SHARC measurements; PL: 2D-S measurements; JS: HWV measurements; AL: FLASH measurements; SK: FLASH measurements ; AM: under wing cloud spectrometer configuration.
The authors declare that they have no conflict of interest.
This article is part of the special issue “ML-CIRRUS – the airborne experiment on natural cirrus and contrail cirrus in midlatitudes with the high-altitude long-range research aircraft HALO (ACP/AMT inter-journal SI)”. It is not associated with a conference.
The authors would like to thank the DFG (Deutsche
Forschungsgemeinschaft, German Research Foundation) Priority Program
SPP 1294 for funding the FZJ project ACIS (KR 2957/1-1), HAI-Quality
(SCHI-872/2-2) and the PTB HAI projects (EB 235/3-1 and EB 235/3-2). Christiane Voigt is thankful for
funding through the HGF contract no. W2/W3-60 and the DFG SPP HALO 1294
contract no. V01504/4-1.
Special thanks to our colleagues Stephan Mertes (TROPOS, Leipzig) and
Helmut Ziereis (DLR, Wessling) for stimulations and important discussions on
the topic of ice crystal sampling from an aircraft roof.
The article processing charges for this open-access
publication were covered by a Research
Centre
of the Helmholtz Association.
Edited by:
Darrel Baumgardner
Reviewed by: Greg McFarquhar, Alexei
Korolev, and one
anonymous referee
Abel, S. J., Cotton, R. J., Barrett, P. A., and Vance, A. K.: A comparison of ice water content measurement techniques on the FAAM BAe-146 aircraft, Atmos. Meas. Tech., 7, 3007–3022, https://doi.org/10.5194/amt-7-3007-2014, 2014. a, b
Baker, B. and Lawson, R. P.: Improvement in determination of ice water content from two-dimensional particle imagery. Part I: Image-to-mass relationships, J. Appl. Meteorol. Clim., 45, 1282–1290, https://doi.org/10.1175/JAM2398.1, 2006. a
Baumgardner, D., Abel, S. J., Axisa, D., Cotton, R., Crosier, J., Field, P., Gurganus, C., Heymsfield, A., Korolev, A., Krämer, M., Lawson, P., McFarquhar, G., Ulanowski, Z., and Um, J.: Cloud Ice Properties: In Situ Measurement Challenges, chap. 9, in: Ice Formation and Evolution in Clouds and Precipitation: Measurement and Modeling Challenges, Meteorol. Monographs, https://doi.org/10.1175/AMSMONOGRAPHS-D-16-0011.1, 2017. a
Buchholz, B., Afchine, A., Klein, A., Schiller, C., Krämer, M., and Ebert, V.: HAI, a new airborne, absolute, twin dual-channel, multi-phase TDLAS-hygrometer: background, design, setup, and first flight data, Atmos. Meas. Tech., 10, 35–57, https://doi.org/10.5194/amt-10-35-2017, 2017. a
Cotton, R. J., Field, P. R., Ulanowski, Z., Kaye, P. H., Hirst, E., Greenaway, R. S., Crawford, I., Crosier, J., and Dorsey, J.: The effective density of small ice particles obtained from in situ aircraft observations of mid-latitude cirrus, Q. J. Roy. Meteor. Soc., 139, 1923–1934, https://doi.org/10.1002/qj.2058, 2013. a
Davis, S. M., Avallone, L. M., Weinstock, E. M., Twohy, C. H., Smith, J. B., and Kok, G. L.: Comparisons of in situ measurements of cirrus cloud ice water content, J. Geophys. Res., 112, D10212, https://doi.org/10.1029/2006JD008214, 2007. a
de Reus, M., Borrmann, S., Bansemer, A., Heymsfield, A. J., Weigel, R., Schiller, C., Mitev, V., Frey, W., Kunkel, D., Kürten, A., Curtius, J., Sitnikov, N. M., Ulanovsky, A., and Ravegnani, F.: Evidence for ice particles in the tropical stratosphere from in-situ measurements, Atmos. Chem. Phys., 9, 6775–6792, https://doi.org/10.5194/acp-9-6775-2009, 2009. a, b
Erfani, E. and Mitchell, D. L.: Developing and bounding ice particle mass- and area-dimension expressions for use in atmospheric models and remote sensing, Atmos. Chem. Phys., 16, 4379–4400, https://doi.org/10.5194/acp-16-4379-2016, 2016. a, b, c
Fahey, D. W., Gao, R.-S., Möhler, O., Saathoff, H., Schiller, C., Ebert, V., Krämer, M., Peter, T., Amarouche, N., Avallone, L. M., Bauer, R., Bozóki, Z., Christensen, L. E., Davis, S. M., Durry, G., Dyroff, C., Herman, R. L., Hunsmann, S., Khaykin, S. M., Mackrodt, P., Meyer, J., Smith, J. B., Spelten, N., Troy, R. F., Vömel, H., Wagner, S., and Wienhold, F. G.: The AquaVIT-1 intercomparison of atmospheric water vapor measurement techniques, Atmos. Meas. Tech., 7, 3177–3213, https://doi.org/10.5194/amt-7-3177-2014, 2014. a
Gayet, J.-F., Ovarlez, J., Shcherbakov, V., Ström, M., Schumann, U., Minikin, A., Auriol, F., Petzold, A., and Monier, M.: Cirrus cloud microphysical and optical properties at southern and northern midlatitudes during the INCA experiment, J. Geophys. Res., 109, D20206, https://doi.org/10.1029/2004JD004803, 2004. a
HALO consortium: HALO database, https://doi.org/10.17616/R39Q0T, 2017. a
Heymsfield, A. J., Schmitt, C., Bansemer, A., and Twohy, C. H.: Improved Representation of Ice Particle Masses Based on Observations in Natural Clouds, J. Atmos. Sci., 67, 3303–3318, https://doi.org/10.1175/2010JAS3507.1, 2010. a
Heymsfield, A. J., Winker, D., Avery, M., Vaughan, M., Diskin, D., Deng, M., Mitev, V., and Matthey, R.: Relationships between ice water content and volume extinction coefficient from in situ observations for temperatures from 0∘ to 86 ∘C: Implications for spaceborne lidar, J. Appl. Meteorol. Clim., 53, 479–505, https://doi.org/10.1175/JAMC-D-13-087.1, 2014. a
Khaykin, S. M., Engel, I., Vömel, H., Formanyuk, I. M., Kivi, R., Korshunov, L. I., Krämer, M., Lykov, A. D., Meier, S., Naebert, T., Pitts, M. C., Santee, M. L., Spelten, N., Wienhold, F. G., Yushkov, V. A., and Peter, T.: Arctic stratospheric dehydration – Part 1: Unprecedented observation of vertical redistribution of water, Atmos. Chem. Phys., 13, 11503–11517, https://doi.org/10.5194/acp-13-11503-2013, 2013. a
King, W. D.: Air flow and particle trajectories around aircraft fuselages I: Theory, J. Atmos. Ocean. Tech., 1, 5–13, 1984. a, b, c, d
Korolev, A., Emery, E., Strapp, J., Cober, S., Isaac, G., Wasey, M., and Marcotte, D.: Small ice particles in tropospheric clouds: fact or artifact? Airborne Icing Instrumentation Evaluation Experiment, B. Am. Meteorol. Soc., 92, 967–973, https://doi.org/10.1175/2010BAMS3141.1, 2011. a
Krämer, M. and Afchine, A.: Sampling characteristics of inlets operated at low U∕U0 ratios: new insights from computational fluid dynamics (CFX) modeling, J. Aerosol Sci., 35, 683–694, 2004. a, b
Krämer, M., Twohy, C., Hermann, M., Afchine, A., Dhaniyala, S., Korolev, A., Wendisch, M., and Brenguier, J.-L.: Aerosol and Cloud Particle Sampling, in: Airborne Measurements for Environmental Research: Methods and Instruments, edited by: Wendisch, M. and Brenguier, J.-L., Wiley-VCH Verlag GmbH & Co. KGaA, https://doi.org/10.1002/9783527653218.ch6, 2013. a, b, c, d, e, f
Krämer, M., Rolf, C., Luebke, A., Afchine, A., Spelten, N., Costa, A., Meyer, J., Zöger, M., Smith, J., Herman, R. L., Buchholz, B., Ebert, V., Baumgardner, D., Borrmann, S., Klingebiel, M., and Avallone, L.: A microphysics guide to cirrus clouds – Part 1: Cirrus types, Atmos. Chem. Phys., 16, 3463–3483, https://doi.org/10.5194/acp-16-3463-2016, 2016. a, b, c
Lawson, R., O'Connor, D., Zmarzly, P., Weaver, K., Baker, B., Mo, Q., and Jonsson, H.: The 2D-S (Stereo) probe: Design and preliminary tests of a new airborne, high-speed, high-resolution particle Imaging probe, J. Atmos. Ocean. Tech., 23, 1462–1477, 2006. a
Luebke, A. E., Avallone, L. M., Schiller, C., Meyer, J., Rolf, C., and Krämer, M.: Ice water content of Arctic, midlatitude, and tropical cirrus – Part 2: Extension of the database and new statistical analysis, Atmos. Chem. Phys., 13, 6447–6459, https://doi.org/10.5194/acp-13-6447-2013, 2013. a
Luebke, A. E., Afchine, A., Costa, A., Grooß, J.-U., Meyer, J., Rolf, C., Spelten, N., Avallone, L. M., Baumgardner, D., and Krämer, M.: The origin of midlatitude ice clouds and the resulting influence on their microphysical properties, Atmos. Chem. Phys., 16, 5793–5809, https://doi.org/10.5194/acp-16-5793-2016, 2016. a, b, c
Mertes, S., Verheggen, B., Walter, S., Connolly, P., Ebert, M., Schneider, J., Bower, K. N., Cozic, J., Weinbruch, S., Baltensperger, U., and Weingartner, E.: Counterflow virtual impact or based collection of small ice particles in mixed-phase clouds for the physico-chemical characterization of tropospheric ice nuclei: Sampler description and first case study, Aerosol Sci. Tech., 41, 848–864, https://doi.org/10.1080/02786820701501881, 2007. a
Meyer, J.: Ice Crystal Measurements with the New Particle Spectrometer NIXE-CAPS, Schriften des Forschungszentrums Jülich. Reihe Energie und Umwelt/Energy and Environment, vol. 160, Research Center Jülich, Germany, 2012. a, b
Meyer, J., Rolf, C., Schiller, C., Rohs, S., Spelten, N., Afchine, A., Zöger, M., Sitnikov, N., Thornberry, T. D., Rollins, A. W., Bozóki, Z., Tátrai, D., Ebert, V., Kühnreich, B., Mackrodt, P., Möhler, O., Saathoff, H., Rosenlof, K. H., and Krämer, M.: Two decades of water vapor measurements with the FISH fluorescence hygrometer: a review, Atmos. Chem. Phys., 15, 8521–8538, https://doi.org/10.5194/acp-15-8521-2015, 2015. a, b, c
Mitchell, D. L., D'Entremont, R. P., and Lawson, R. P.: Inferring Cirrus Size Distributions through Satellite Remote Sensing and Microphysical Databases, J. Atmos. Sci., 67, 1106–1125, https://doi.org/10.1175/2009JAS3150.1, 2010. a
Rollins, A. W., Thornberry, T. D., Gao, R. S., Smith, J. B., Sayres, D. S., Sargent, M. R., Schiller, C., Krämer, M., Spelten, N., Hurst, D. F., Jordan, A. F., Hall, E. G., Vömel, H., Diskin, G. S., Podolske, J. R., Christensen, L. E., Rosenlof, K. H., Jensen, E. J., and Fahey, D. W.: Evaluation of UT/LS hygrometer accuracy by intercomparison during the NASA MACPEX mission, J. Geophys. Res., 119, 1915–1935, https://doi.org/10.1002/2013JD020817, 2014. a, b
Schiller, C., Krämer, M., Afchine, A., Spelten, N., and Sitnikov, N.: Ice water content in Arctic, midlatitude and tropical cirrus, J. Geophys. Res., 113, D24208, https://doi.org/10.1029/2008JD010342, 2008. a, b, c, d
Smit, H., Krämer, M., Petzold, A., Rolf, C., Spelten, N., Rohs, S., Neis, P., Ebert, V., Buchholz, B., Bozoki, Z., Tatrai, D., Jones, R., Mead, M., and Malinowski, S.: Development and evaluation of novel compact hygrometers for airborne research (DENCHAR): Assessment report on the performance of the suite of hygrometers and recommendations, Eufar research report, Forschungszentrum Jülich, Jülich, Germany, 2013. a
Thornberry, T., Rollins, A., Avery, M., Woods, S., Lawson, R., Bui, T., and Gao, R.-S.: Ice water content-extinction relationships and effective diameter for TTL cirrus derived from in situ measurements during ATTREX 2014, J. Geophys. Res., 122, 4494–4507, https://doi.org/10.1002/2016JD025948, 2017. a, b
Twohy, C. and Rogers, D.: Air-flow and water-drop trajectories at instrument sampling points around the Beechcraft King Air and Lockheed Electra, J. Atmos. Ocean. Tech., 10, 566–578, https://doi.org/10.1175/1520-0426(1993)010<0566:AAWDTA>2.0.CO;2, 1993. a
Vance, A. K., Abel, S. J., Cotton, R. J., and Woolley, A. M.: Performance of WVSS-II hygrometers on the FAAM research aircraft, Atmos. Meas. Tech., 8, 1617–1625, https://doi.org/10.5194/amt-8-1617-2015, 2015. a
Voigt, C., Schumann, U., Minikin, A., Abdelmonem, A., Afchine, A., Borrmann, S., Boettcher, M., Bucuchholz, B., Bugliaro, L., Costa, A., Curtius, J., Dollner, M., Doernbrack, A., Dreiling, V., Ebert, V., Ehrlich, A., Fix, A., Forster, L., Frank, F., Fuetterer, D., Giez, A., Graf, K., Grooss, J.-U., Gross, S., Heimerl, K., Heinold, B., Hueneke, T., Jaervinen, E., Jurkat, T., Kaufmann, S., Kenntner, M., Klingebiel, M., Klimach, T., Kohl, R., Krämer, M., Krisna, T. C., Luebke, A., Mayer, B., Mertes, S., Molleker, S., Petzold, A., Pfeilsticker, K., Port, M., Rapp, M., Reutter, P., Rolf, C., Rose, D., Sauer, D., Schaefer, A., Schlage, R., Schnaiter, M., Schneider, J., Spelten, N., Spichtinger, P., Stock, P., Walser, A., Weigel, R., Weinzierl, B., Wendisch, M., Werner, F., Wernli, H., Wirth, M., Zahn, A., Ziereis, H., and Zoger, M.: ML-Cirrus the airborne experiment on natural cirrus and contrail cirrus with the high-altitude long-range research aircraft HALO, B. Am. Meteorol. Soc., 98, 271–288, https://doi.org/10.1175/BAMS-D-15-00213.1, 2017. a
Weigel, R., Spichtinger, P., Mahnke, C., Klingebiel, M., Afchine, A., Petzold, A., Krämer, M., Costa, A., Molleker, S., Reutter, P., Szakáll, M., Port, M., Grulich, L., Jurkat, T., Minikin, A., and Borrmann, S.: Thermodynamic correction of particle concentrations measured by underwing probes on fast-flying aircraft, Atmos. Meas. Tech., 9, 5135–5162, https://doi.org/10.5194/amt-9-5135-2016, 2016. a
Wendisch, M. and Brenguier, J.-L. E.: Airborne Measurements for Environmental Research: Methods and Instruments, Wiley-VCH Verlag GmbH & Co. KGaA, Weinheim, Germany, 2013. a
Zöger, M., Afchine, A., Eicke, N., Gerhards, M.-T., Klein, E., McKenna, D., Mörschel, U., Schmidt, U., Tan, V., Tuitjer, F., Woyke, T., and Schiller, C.: Fast in situ stratospheric hygrometers: A new family of balloon-borne and airborne Lyman- photofragment fluorescence hygrometers, J. Geophys. Res., 104, 1807–1816, 1999. a
enviscope GmbH.