the Creative Commons Attribution 4.0 License.
the Creative Commons Attribution 4.0 License.
 | 25 Jul 2018
Reduction in 317–780 nm radiance reflected from the sunlit Earth during the eclipse of 21 August 2017
Guoyong Wen
Alexander Marshak
Karin Blank
Liang Huang
Alexander Cede
Nader Abuhassan
Matthew Kowalewski
Ten wavelength channels of calibrated radiance image data from the sunlit Earth are obtained every 65 min during Northern Hemisphere summer from the EPIC (Earth Polychromatic Imaging Camera) instrument on the DSCOVR (Deep Space Climate Observatory) satellite located near the Earth–Sun Lagrange 1 point (L1), about 1.5 million km from the Earth. The L1 location permitted seven observations of the Moon's shadow on the Earth for about 3 h during the 21 August 2017 eclipse. Two of the observations were timed to coincide with totality over Casper, Wyoming, and Columbia, Missouri. Since the solar irradiances within five channels (λi=388, 443, 551, 680, and 780 nm) are not strongly absorbed in the atmosphere, they can be used for characterizing the eclipse reduction in reflected radiances for the Earth's sunlit face containing the eclipse shadow. Five channels (λi=317.5, 325, 340, 688, and 764 nm) that are partially absorbed in the atmosphere give consistent reductions compared to the non-absorbed channels. This indicates that cloud reflectivities dominate the 317.5–780 nm radiances reflected back to space from the sunlit Earth's disk with a significant contribution from Rayleigh scattering for the shorter wavelengths. An estimated reduction of 10 % was obtained for spectrally integrated radiance (387 to 781 nm) reflected from the sunlit Earth towards L1 for two sets of observations on 21 August 2017, while the shadow was in the vicinity of Casper, Wyoming (42.8666∘ N, 106.3131∘ W; centered on 17:44:50 UTC), and Columbia, Missouri (38.9517∘ N, 92.3341∘ W; centered on 18:14:50 UTC). In contrast, when non-eclipse days (20 and 23 August) are compared for each wavelength channel, the change in reflected light is much smaller (less than 1 % for 443 nm compared to 9 % (Casper) and 8 % (Columbia) during the eclipse). Also measured was the ratio REN(λi) of reflected radiance on adjacent non-eclipse days divided by radiances centered in the eclipse totality region with the same geometry for all 10 wavelength channels. The measured REN(443 nm) was smaller for Columbia (169) than for Casper (935), because Columbia had more cloud cover than Casper. REN(λi) forms a useful test of a 3-D radiative transfer models for an eclipse in the presence of optically thin clouds. Specific values measured at Casper with thin clouds are REN(340 nm) = 475, REN(388 nm) = 3500, REN(443 nm) = 935, REN(551 nm) = 5455, REN(680 nm) = 220, and REN(780 nm) = 395. Some of the variability is caused by changing cloud amounts within the moving region of totality during the 2.7 min needed to measure all 10 wavelength channels.
- Article
(19405 KB) - Full-text XML
- Companion paper
- BibTeX
- EndNote


Measured backscattered radiances of the entire sunlit Earth were obtained during the 21 August 2017 eclipse from EPIC (Earth Polychromatic Imaging Camera) on the DSCOVR (Deep Space Climate Observatory) satellite. EPIC obtains synoptic observations of the sunlit Earth from an orbit around the L1 point (Lagrange 1) 1.5 million km from Earth (Herman et al., 2018). EPIC top-of-the-atmosphere (TOA) albedo measurements, made at a backscatter angle of about 172∘, are in the enhanced reflectivity regime (hot spot angles). This study focuses on data from two selected locations during the 21 August 2017 eclipse that crossed the United States from west to east. The locations selected were Casper, Wyoming, and Columbia, Missouri, both near the center of the path of totality and both with a nearly overhead total solar eclipse (local time 11:45 in Casper, Wyoming, and 13:12 in Columbia, Missouri). The sites were selected in advance to have a high probability of almost cloud-free skies and so that totality would occur about 30 min apart in UTC (Coordinated Universal Time) to accommodate the satellite's ability to acquire data. On the day of the eclipse, Casper, Wyoming, had almost clear skies (Fig. 1), with a small amount of thin clouds visible, while Columbia, Missouri, had more low-altitude cloud cover (Fig. 2).
Observations of total solar eclipses have been made with varying degrees of sophistication for thousands of years as reviewed by Littman et al. (2008). At a given location, observations of reduced irradiance reaching the Earth's surface are limited to just a few minutes of totality and about 2 h of partial obscuration (Meeus, 2003). The totality region (umbra) is an oval of about 110–120 km in size near local noon at Casper, Wyoming, and Columbia, Missouri, but will change size and shape as a function of local solar zenith angle (https://eclipse2017.nasa.gov/eclipse-maps, last access: 18 July 2018). Some of the complicating factors concerning quantitative eclipse observations include the effects of the solar corona and light scattered in the atmosphere (Liendo and Chacin, 2004; Emde and Mayer, 2007).
A detailed analysis of an eclipse that occurred in 2006 over southern Europe includes both ground-based and space-based polar-orbiting MODIS (Moderate Resolution Imaging Spectroradiometer) observations of cloud cover before totality (Gerasopoulos et al., 2008) as well as theoretical modeling of the eclipse, but unlike the present study it was largely limited to local effects near the region of totality. A comparison from a meteorological radiation model and measurements of total solar irradiance were made near Athens, Greece (84 % of a total eclipse), which showed good agreement in the presence of light clouds (Psiloglou and Kambezidis, 2007). A 3-D Monte Carlo radiative transfer study (Emde and Mayer, 2007) was applied to the geometry for the nearly overhead total eclipse of 29 March 2006 (13:20 LT in Turkey) to estimate the downward global radiation at the surface, but without the effect of clouds included in the calculation. An application of the 3-D model to the 2006 eclipse over Kastelorizo, Greece, with fairly cloud-free measurements (few cumulus, 1–2 octas, and scattered cirrus, 3–4 octas) at 380 nm showed good agreement for the ratio (ratio = 217) of global surface irradiance starting 5 min before totality to that during totality (Kazantzidis et al., 2007). Successful modeling of the light levels during an eclipse under realistic conditions is the first step toward improved modeling of high cloud reflection and shadowing of solar radiation on the Earth's energy balance.
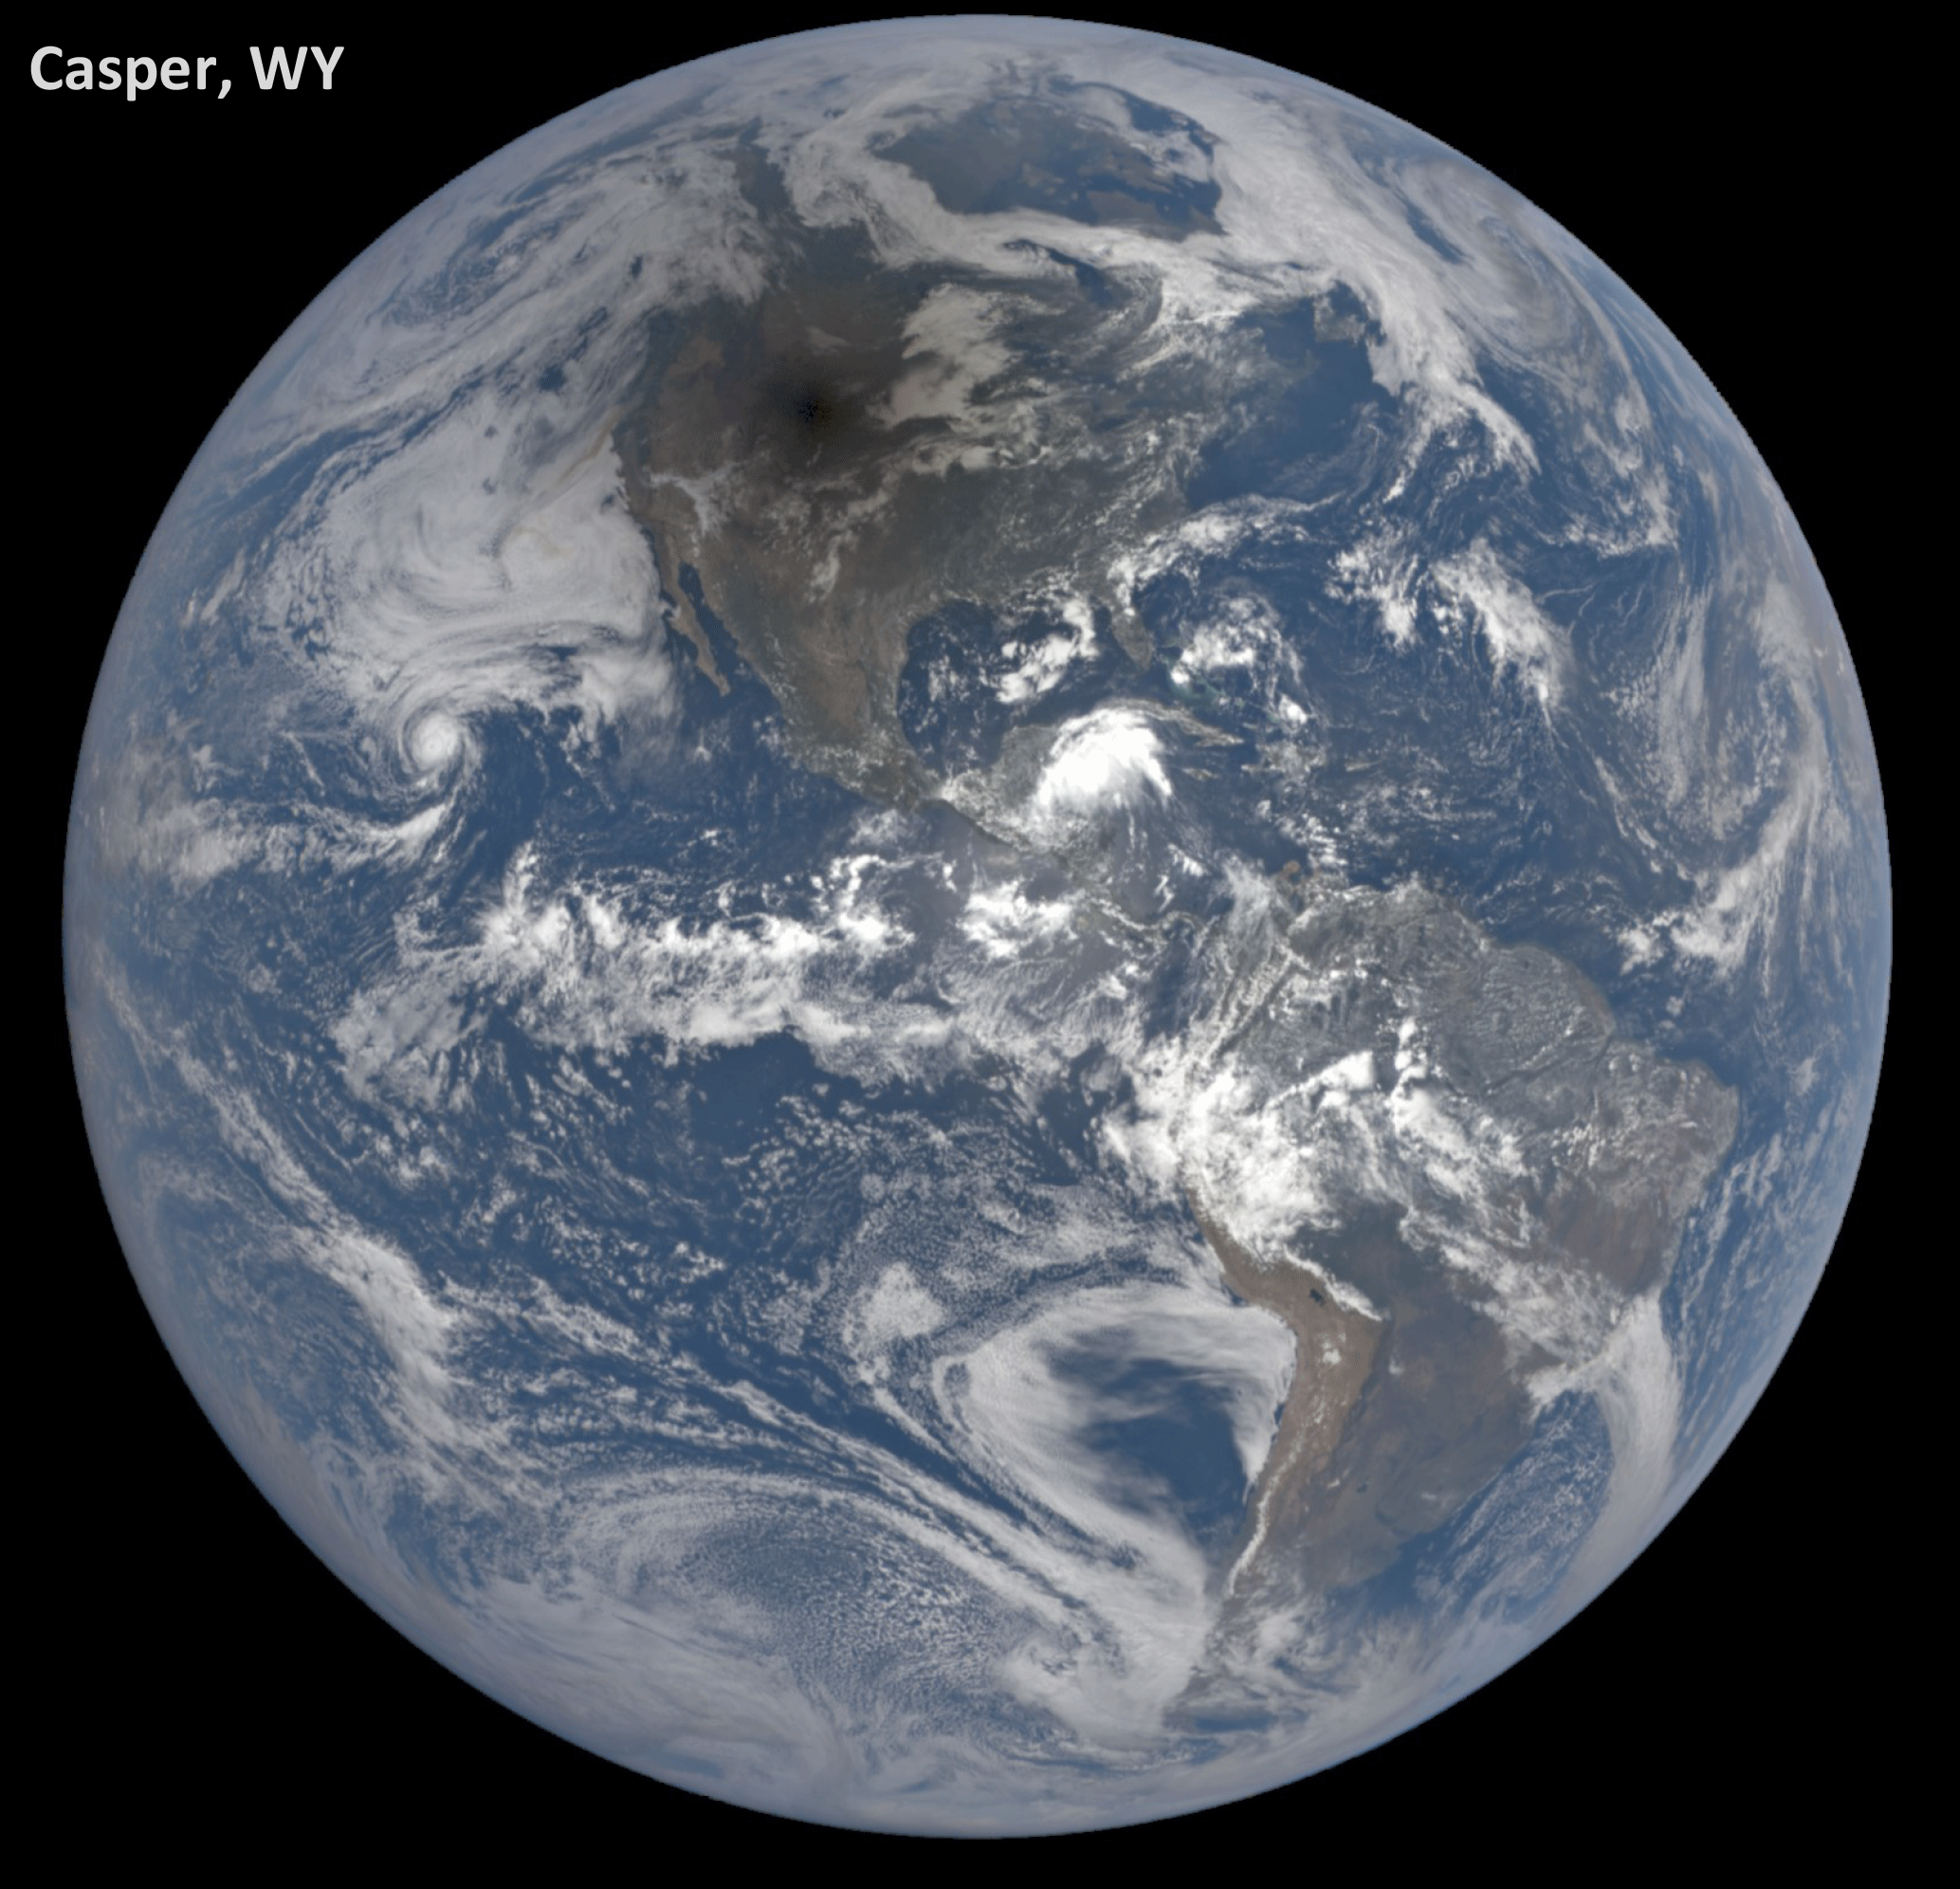
Figure 1Synoptic view of the sunlit Earth perturbed by the 21 August 2017 total eclipse centered over Casper, Wyoming, at 17:44:50 UTC. The black region is the eclipse umbra centered over Casper, WY. The color image has been adjusted from the images on https://epic.gsfc.nasa.gov/ (last access: 18 July 2018) by increasing the gamma correction (Cescatti, 2007) to bring out the region of totality and surrounding clouds.
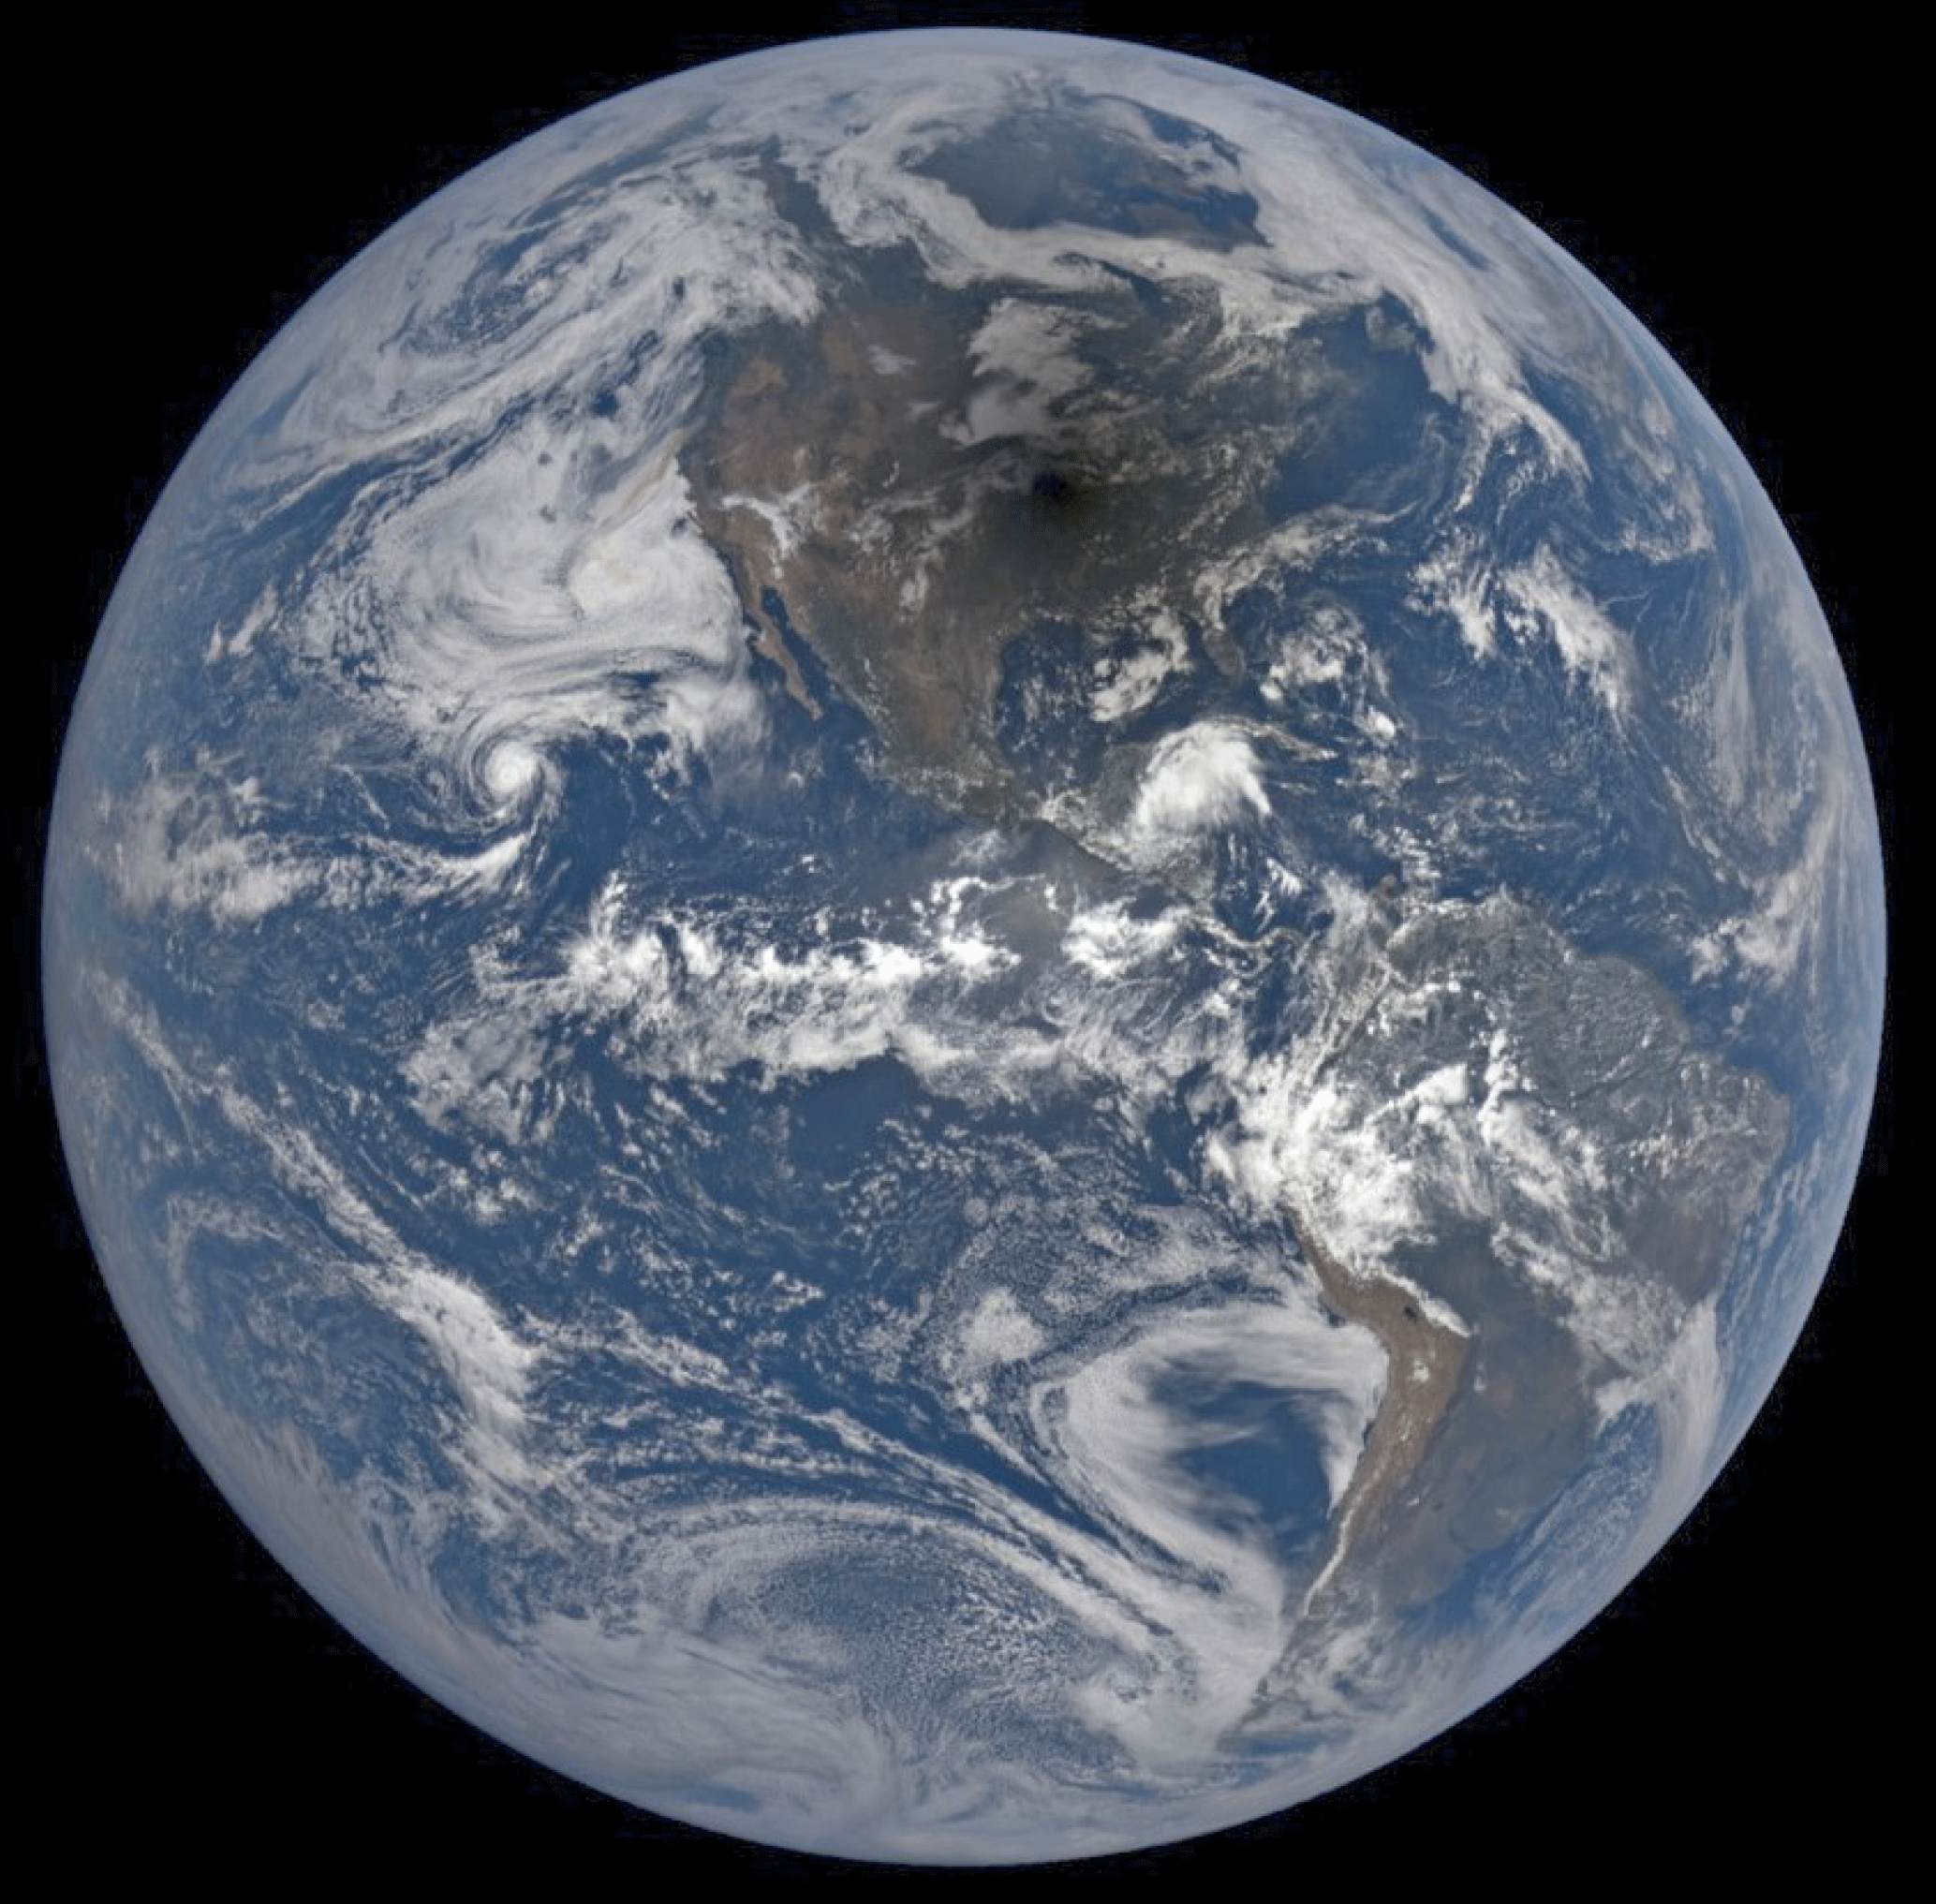
Figure 2Synoptic view of the total eclipse centered over Columbia, Missouri, at 18:14:50 UTC. The black region is the eclipse umbra centered over Columbia, MO. The color image has been adjusted from the images on https://epic.gsfc.nasa.gov/ by increasing the gamma correction to bring out the region of totality and surrounding clouds.
The observations from the DSCOVR satellite are part of a larger project that combines simultaneously obtained satellite and ground-based measurements using a pyranometer (Ji and Tsay, 2000) and the Pandora spectrometer instrument (Herman et al., 2009) at both sites. The combination will be used to help validate 3-D radiative transfer models applicable to analysis of eclipse effects on radiances reflected back to space and reaching the Earth's surface. This study presents the only calibrated spectral synoptic satellite data of the sunlit Earth ever obtained during an eclipse, which should place tighter limits on validating radiative transfer studies under realistic conditions. The data include EPIC-measured ozone amounts 316±5 DU (DU: Dobson units) for Casper and 305±5 DU for Columbia (see Fig. A3), O2 A- and B-band absorption, clouds, aerosols, and scene and surface reflectivity (Herman et al., 2018; Marshak et al., 2018).
DSCOVR/EPIC observations of the entire sunlit Earth from the eclipse day, 21 August 2017, are compared to those from two non-eclipse days to quantify the change of the global integral of reflected solar radiation caused by the eclipse. We present a potential validation test data set for the 21 August 2017 eclipse for 3-D radiative transfer models, namely the ratio of radiances without the eclipse on 20 and 23 August to the same regions that contained totality on 21 August 2017 (based on a suggestion in the paper by Emde and Mayer, 2007).
Section 2 describes the DSCOVR/EPIC instrument, available data, and monochromatic images based on measured counts per second (counts s−1). Section 3.1 presents a comparison between eclipse and non-eclipse days. Section 3.2 gives an estimate of the global reduction of reflected sunlight during the eclipse over Casper, WY, and Columbia, MO. In Sect. 3.3, EPIC non-eclipse-day TOA albedos are compared to the satellite instrument POLDER (POLarization and Directionality of the Earth's Reflectances) surface reflectivity measurements at 8∘ (Maignan et al., 2004).
The EPIC instrument on board the DSCOVR spacecraft, in a 6-month orbit near the L1 point since June 2015, observed the Moon's shadow for about 3 h. EPIC eclipse data comprise a set of seven observations (16:44 to 19:44 UTC) starting in the Pacific Ocean and ending in the Atlantic Ocean, while synoptically observing the entire sunlit disk of the Earth (nominal size 0.5∘). EPIC is a 10-wavelength filter camera with a 2048×2048 pixel CCD (charge-coupled detector) using a 30 cm aperture Cassegrain telescope with a field of view (FOV) of 0.62∘ that continuously points at the sunlit Earth. The sampling size on the Earth is nominally 8 km at the center of the image with an effective spatial resolution of 10×10 km2 for the 443 nm channel and 17×17 km2 for the other nine 2×2-pixel-averaged filter channels. Operation of EPIC consists of sequentially selecting a filter from two rotatable six-position filter wheels and an exposure time using a rotating disk shutter mechanism. Invariant exposure times were set at the beginning of the on-orbit mission to fill the CCD wells to about 80 % so as to avoid blooming (a saturated pixel affecting its neighbors). The CCD was calibrated for the sensitivity differences between the pixels (flatfielding). EPIC measurements were made in the laboratory and in flight to obtain corrections for stray-light effects. Corrections for dark current are applied based on periodic measurements with the shutter closed. While EPIC very slowly rotates on its axis, it is kept centered on the Earth during its 6-month north–south tilted Lissajous orbit about the Earth–Sun L1 point. The spacecraft is never closer than 4∘ from the Earth–Sun line, which makes it possible to observe an eclipse without the Moon being in the FOV. On 21 August 2017, DSCOVR was 7.7∘ from the Earth–Sun line. A more detailed description of EPIC is given in Herman et al. (2018) and Marshak et al. (2018).
Geolocated EPIC data (counts per second) from each set of 10 wavelengths are archived in an HDF5-formatted file available from the permanent NASA Langley data repository center (https://eosweb.larc.nasa.gov/project/dscovr/dscovr_epic_l1b, last access: 19 July 2018). Contained in each Level 2 data HDF5 file are the 2048×2048 array of counts per second measured by EPIC and a common latitude–longitude grid. The geolocated data are organized corresponding to the rectangular CCD grid, one data point per CCD pixel. For the time of the eclipse, the illuminated CCD pixels are within a circular boundary corresponding to illuminated pixels (illuminated pixels formed a circle of 1816 pixels in diameter out of a maximum of 2048 pixels). To reduce the volume of telemetry data, all measurements except those from the 443 nm channel were 2×2 averaged on board DSCOVR to 1024×1024 pixels. After geolocation onto a common latitude × longitude grid, the data from all channels are presented as 2048×2048 points with off-Earth points represented as the floating point symbol for “infinity”. All of the data products (e.g., ozone amounts) are also freely available at the above repository center.
The EPIC HDF5 file names (e.g., epic_1b_20170821174450_02.h5) from the NASA data repository are interpreted as year 2017, month 08, day 21, 17:44:50 UTC, version 2, which is 11:44:50 local daylight savings time in Casper, Wyoming. The file name time refers to approximately the middle of the measurement sequence. Totality in Casper started at 11:42:39 MDT and ended at 11:45:05 MDT. Version 2 refers to the reprocessing of data with the latest CCD flatfielding and stray-light corrections (Herman et al., 2018; Marshak et al., 2018; Geogdzhayev and Marshak, 2018), and the geolocation algorithms.
Observing conditions for 21 August 2017 ranged from significant cloud cover over the oceans to nearly clear skies over the United States (Figs. 1 and 2). The synoptic observations provided a unique opportunity to estimate the fraction of reduced reflected radiation from the entire sunlit Earth caused by a total solar eclipse. Two of the synoptic observations were timed so that they centered on Casper, Wyoming (42.8666∘ N, 106.3131∘ W; 17:44:50 UTC), and Columbia, Missouri (38.9517∘ N, 92.3341∘ W; 18:14:50 UTC). Ten narrowband images were obtained at center vacuum wavelengths λi of 317.5±0.5, 325±0.5, 340±1.3, 388±1.3, 443±1.3, 551±1.5, 680±0.8, 688±0.42, 764±0.5, and 779.5±0.9 nm (Herman et al., 2018). Of these, 388, 443, 552, 680, and 779 nm radiances are not strongly absorbed in the atmosphere and are used for estimating the reduction in reflected radiances from the Earth. The others are strongly affected either by ozone (317, 325, 340 nm) or oxygen absorption (688, 764 nm) in the atmosphere but give similar radiance percent reductions during the eclipse to those of non-absorbed channels.
The non-absorbed wavelength observations were combined to produce eye-realistic color images (https://epic.gsfc.nasa.gov, last access: 18 July 2018) for the entire data set (2015–2018). For this eclipse day study, 21 August 2017, the original color images were modified by increasing the gamma correction to better show the umbra over Casper, Wyoming, and Columbia, Missouri (Figs. 1 and 2 based on a suggestion by Steven Albers and Michael Boccara, personal communication, 2017). The images include Rayleigh scattering effects that cause light from the penumbral region to increase illumination within the umbra along with scattering from clouds and aerosols.
Table 1Eclipse measurement timing and location details for five wavelengths. Eclipse maximum and EPIC image times. Total measurement duration: 2.7 min.
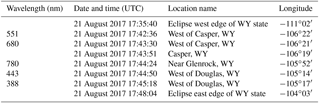
Table 1 summarizes eclipse timing and location details for Casper, Wyoming. During the 2.7 min needed to obtain all 10 wavelength channel images, the center of totality moves at about 46 km min−1, covering approximately 124 km. Based on the image in Fig. 1, the entire measurement took place within the observed nearly clear-sky region surrounding Casper, Wyoming. A similar table could be constructed for the eclipse totality region near Columbia, Missouri.
The timing and predicted shape of the Moon's shadow over Casper, Wyoming, and Columbia, Missouri, can be seen at https://eclipse2017.nasa.gov/eclipse-maps (last access: 19 July 2018). An annotated portion of the figures for Casper and Columbia are reproduced in the Appendix (Fig. A1). The predicted totality shadow (Fig. A1) over Casper was elliptical in shape with a width of about 116 km (about 1.5∘ in latitude or longitude). The similar drawing for Columbia, Missouri, shows a more nearly circular region of totality. The dimension of the partial eclipse for 90 % obscuration is about 5∘ in latitude or longitude. The region of 75 % obscuration covers a latitude range from 32 to 46∘, or about 1200 km. An obscuration region of this size produces a significant decrease in the percentage of total solar irradiance reaching the Earth's surface and in the amount reflected back to space. EPIC synoptically measures both the local and sunlit portion of the global percent change in reflected radiance, which is approximately the same as the percent change in global surface irradiance for the wavelength range from 388 to 780 nm. An exception is within the umbral region, where the percent change is larger at the surface than at the top of the atmosphere. The three wavelength channels shorter than 388 nm are affected by ozone absorption and also do not contribute much to the sum of reflected radiances compared to the range from 388 to 780 nm. The energy content of 317 to 340 nm is not included in the quantitative estimate of broadband (UV + visible) reduced reflected radiance, nor are the strongly absorbed O2 A- and B-band channels, 688 and 764 nm, included. However, the effects of the eclipse on all 10 channels are individually estimated.
Monochromatic eclipse images
Before quantitatively examining the EPIC data from the eclipse in units of counts per second or reflectance, the same data can be represented as monochrome grayscale images. The images (Fig. 3 with north down) range from 340 nm, with strong Rayleigh scattering effects and some ozone absorption, to 780 nm in the near infrared. North is selected as down to correspond to a 3-D projection image presented later where placing north down permits viewing inside of the umbral region. Because of the clarity of the atmosphere at 780 nm, the image serves as a geographic map of the Earth as viewed by EPIC where North and South America are clearly visible.
3.1 Comparison of EPIC observations of eclipse totality (21 August) with non-eclipse days (20 and 23 August) for Casper, WY, and Columbia, MO
Atmospheric conditions during the eclipse at Casper, Wyoming, were almost cloud-free compared to Columbia, Missouri, which had optically thin low-altitude clouds (Fig. 2). Figure 4 shows the cloud cover on the day of the eclipse, 21 August 2017 (panel a), about 90 min before totality at Casper and about 2 h after totality, where the eclipse umbra is still visible over the Atlantic Ocean. The images (north is up) show that the skies remained relatively clear over the northern United States for the duration of the eclipse. A similar set of images (panel b) are shown for the day before (20 August) and 2 days after the eclipse (23 August). There were no useable data available on 22 August. Data obtained on 20 and 23 August at approximately the same UTC (backscatter phase angle for a given location on Earth) as occurred during the total eclipse are used as reference data to compare with the eclipse data on 21 August 2017. The basic global patterns of cloud cover are similar for all 3 days, but not identical. As shown later, the amount of light reflected back to space is approximately the same on the two non-eclipse days 20 and 23 August.
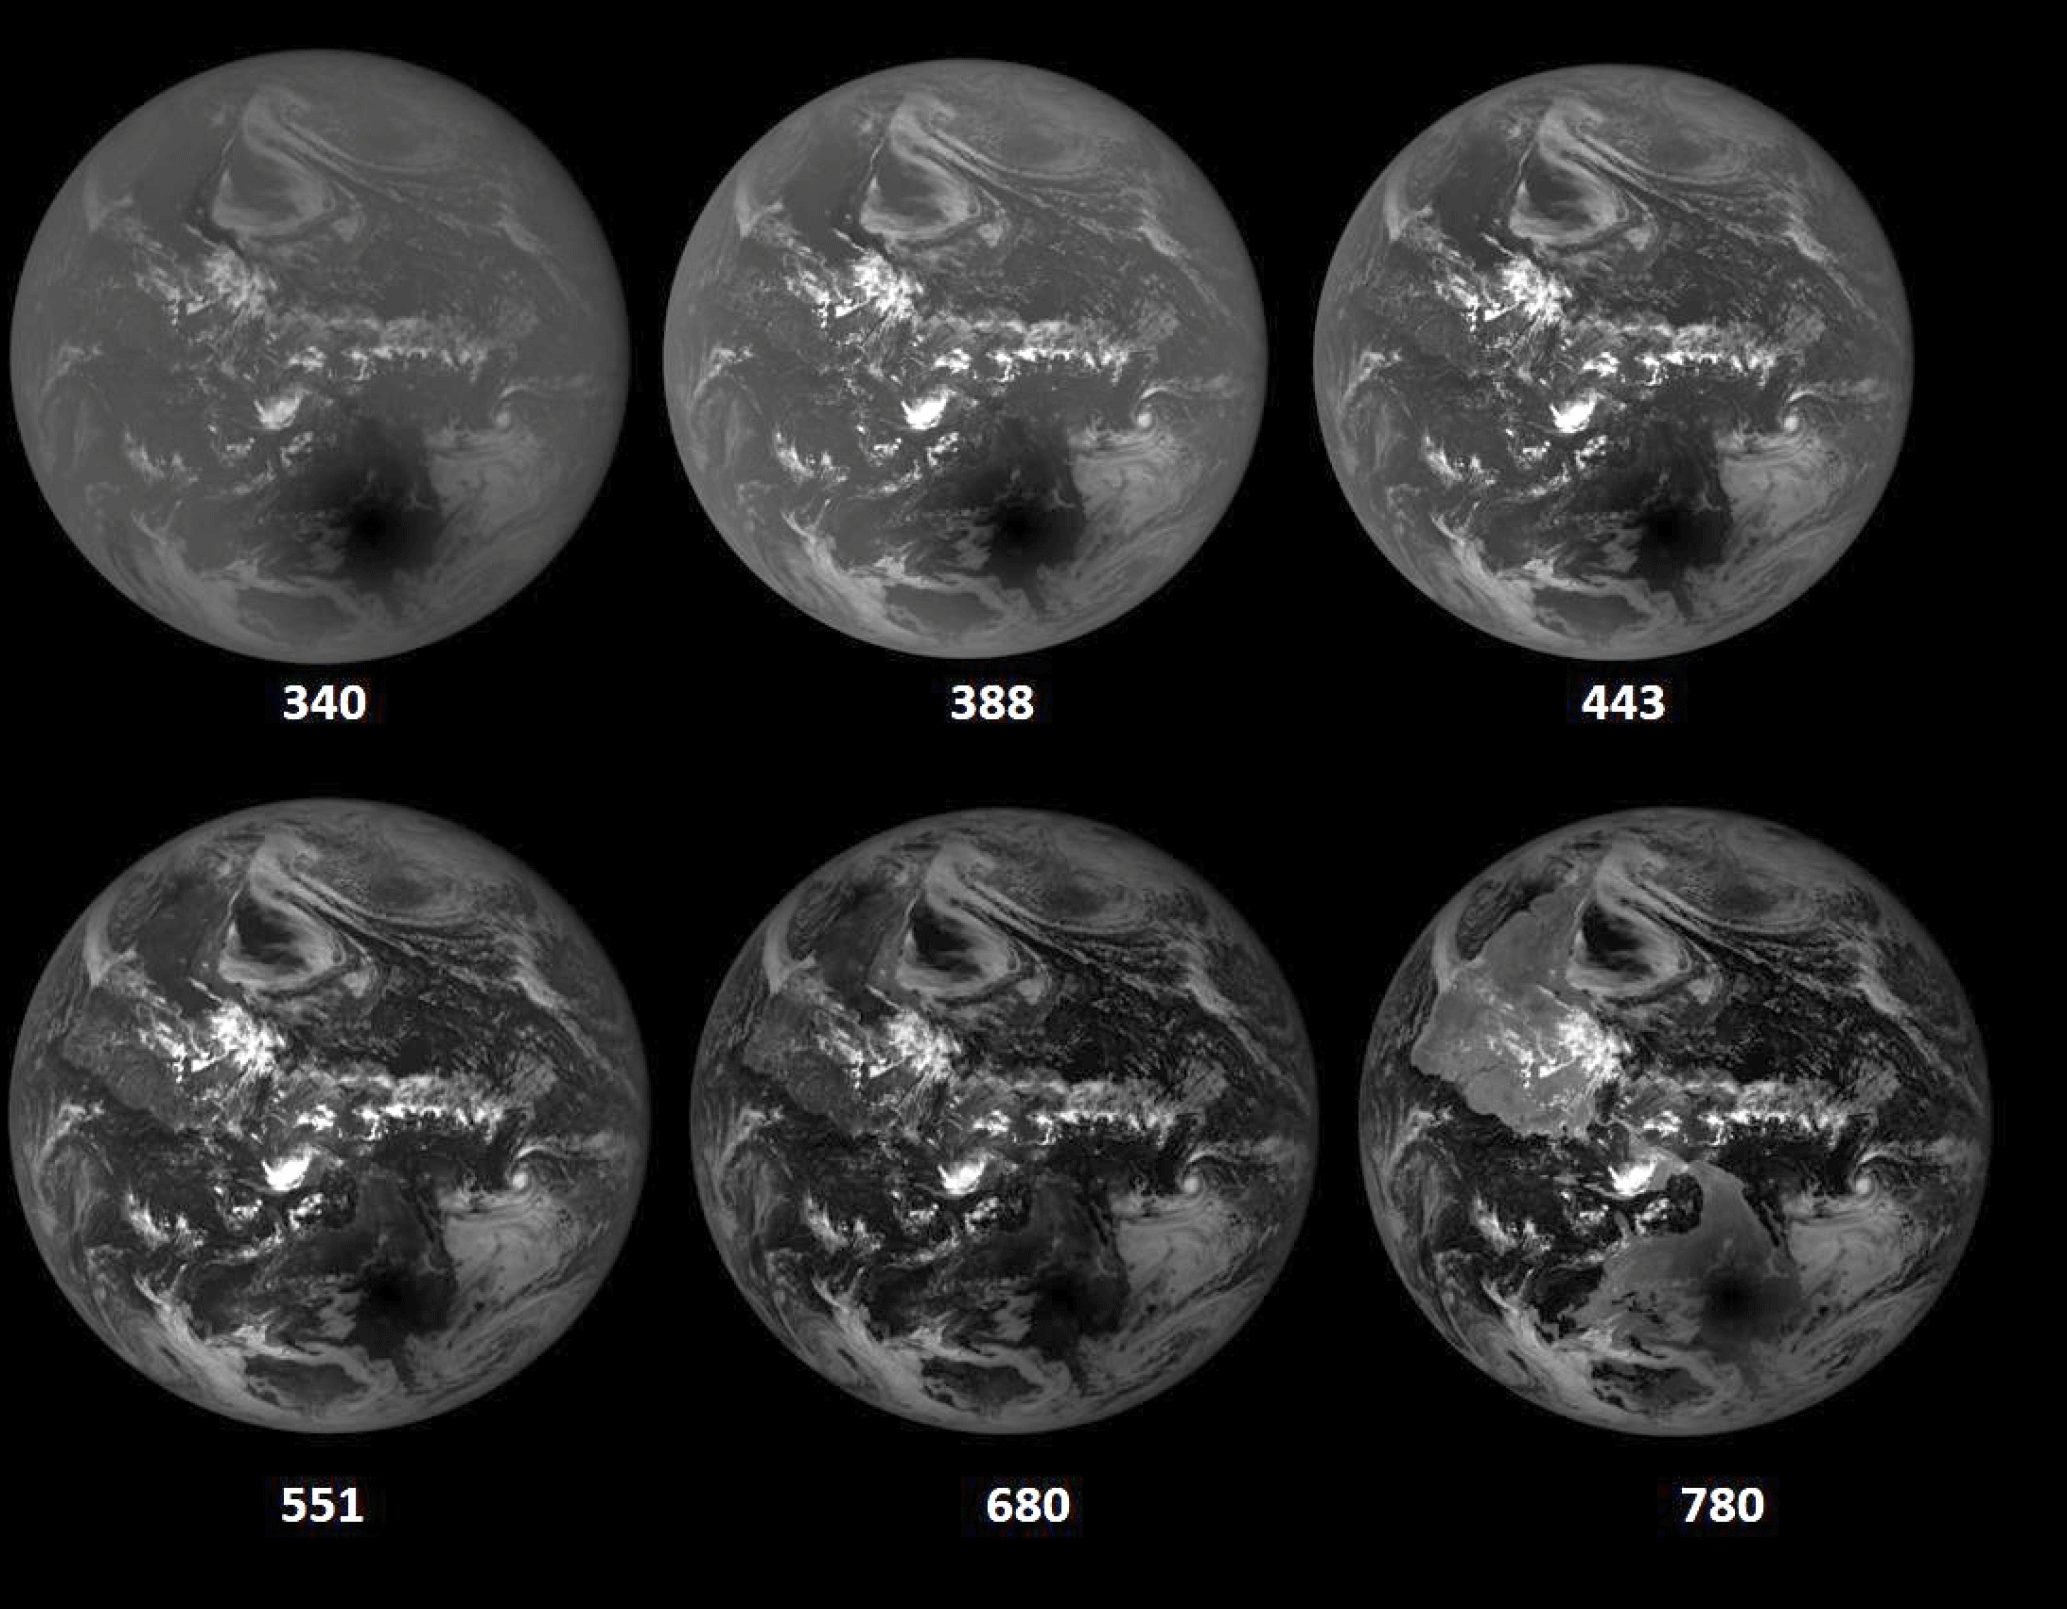
Figure 3Grayscale images for six of the DSCOVR/EPIC channels for the eclipse over Casper, Wyoming, showing the blurring caused by Rayleigh scattering and the dark land and ocean surfaces at 340 nm to the almost clear atmosphere and bright continental surfaces at 780 nm. The images were obtained over a period of 2.7 min. North is facing down. The gray scale is linear, with black representing very low reflectivity and white very high reflectivity from high-altitude equatorial region clouds.
Figure 5a and b show longitudinal slices of 443 nm reflected solar radiances in counts per second towards L1 through the locations corresponding to Casper, Wyoming, and Columbia, Missouri, at their respective times of totality. Figure 5c and d show 443 nm measurements in counts per second on 20 August at 18:04 UTC before the eclipse for nearly identical solar phase angle conditions for both sites. The effect of clouds at the Columbia site compared to Casper can be seen in terms of the depth of the umbra relative to the average counts per second from −140 to −150∘ longitude (panel a: ratio = 1530; panel b: ratio = 37). Similarly, on the preceding day, 20 August (panels c and d), the cloud effect is small at Casper, 1.2×10⁴ counts s−1, compared to Columbia, 5×10⁴ counts s−1, and just to the west of Columbia, 1.3×10⁵ counts s−1.
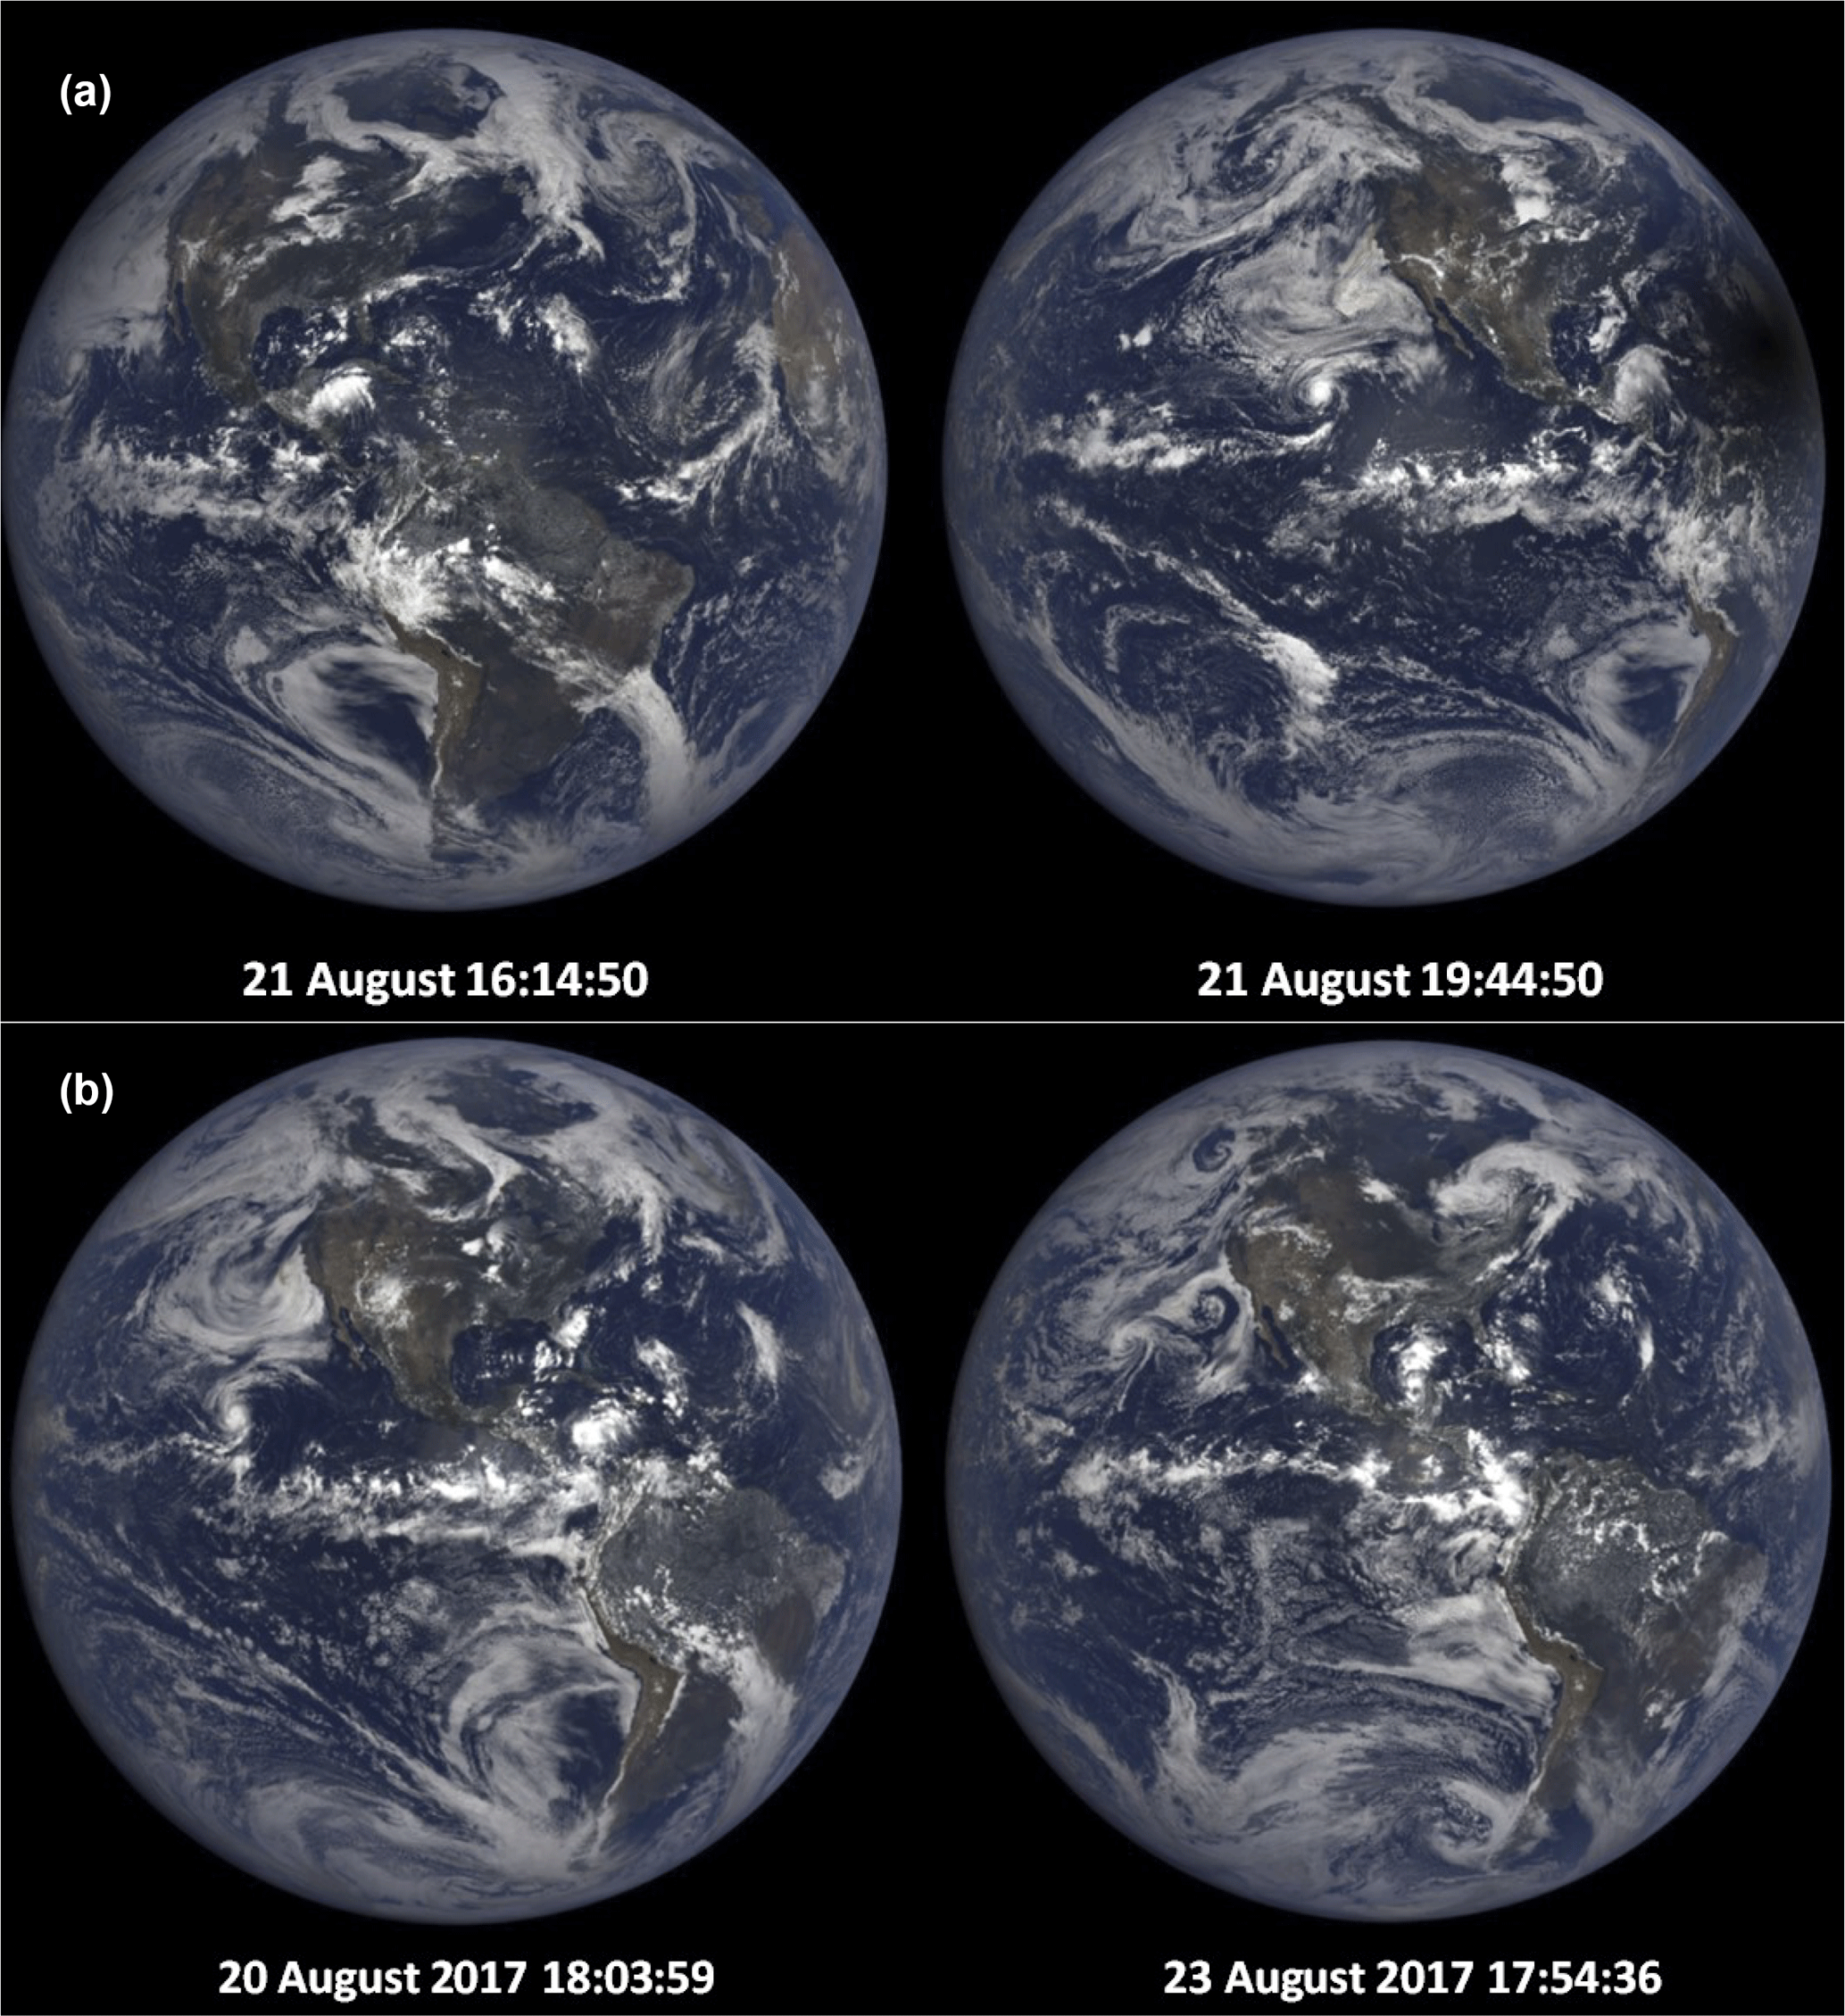
Figure 4(a) Synoptic natural color images on 21 August at 16:14 and 19:44 before and after the eclipse over the US, and (b) the days before and after the eclipse selected to be as close as possible to the phase angle (UTC 17:44:50) as the time of totality over Casper, Wyoming. North is facing up.
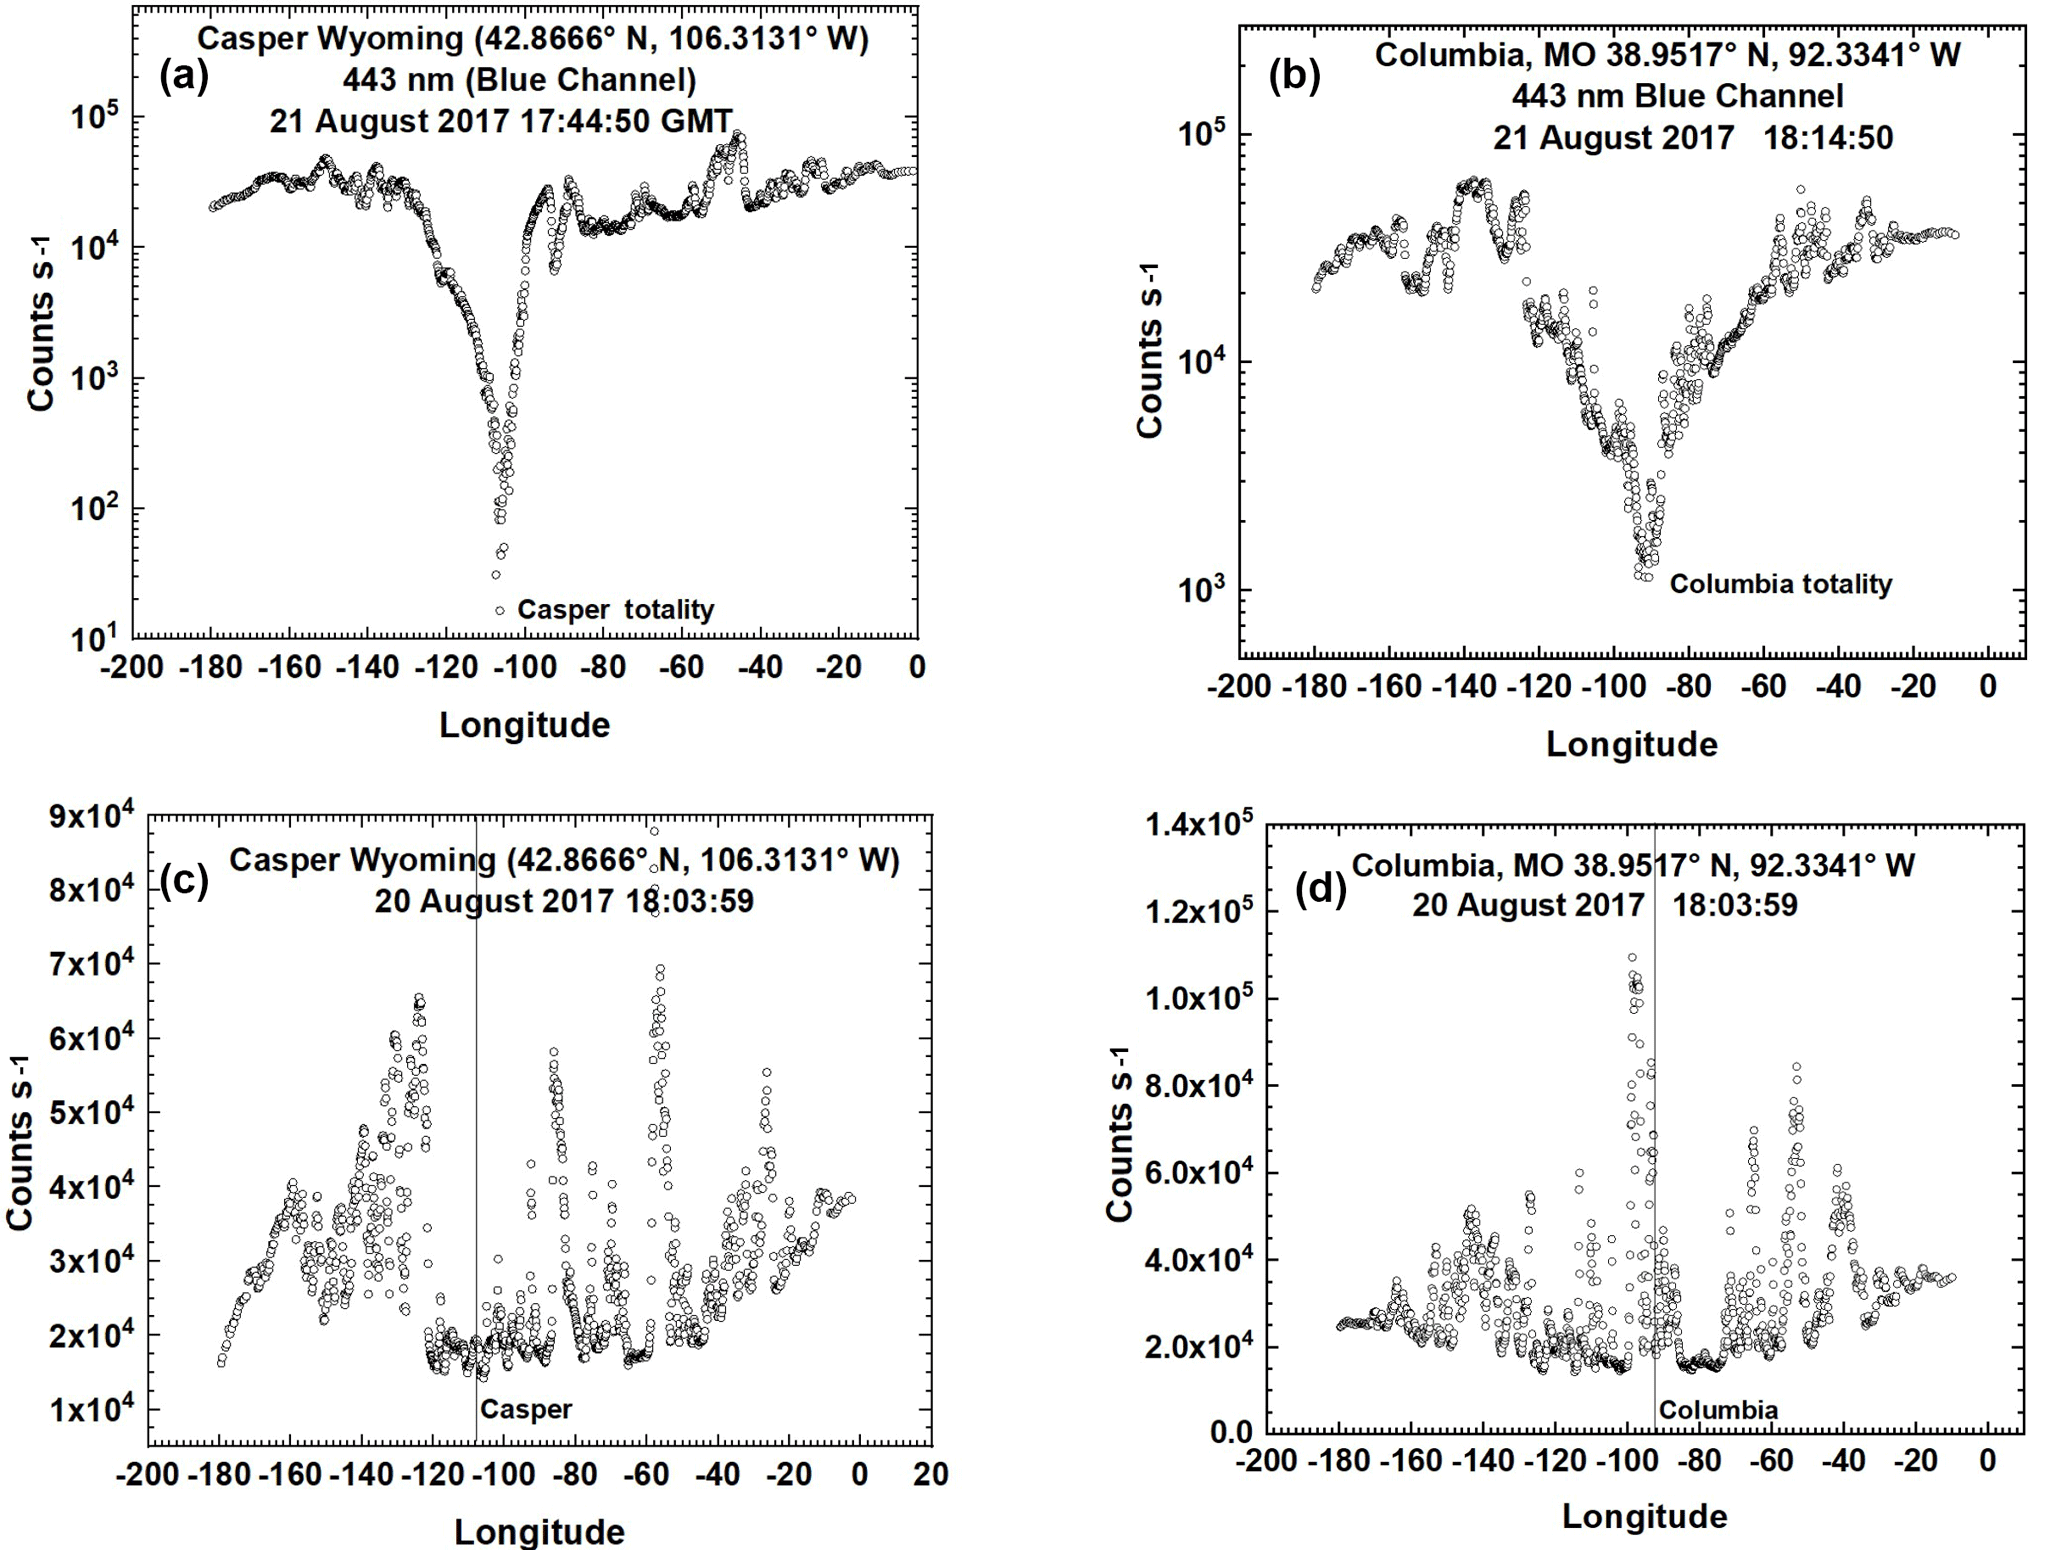
Figure 5(a, b) The effect of an eclipse (21 August) on the measured counts per second reflected back to space as a function of longitude (degrees) for two locations: Casper, Wyoming (a, c), and Columbia, Missouri (b, d). (c, d) Measured counts per second reflected back to space on 20 August. A log10 scale is used to show details of the spatial variability mostly caused by clouds.
The minimum 443 nm values during totality are 16.6 counts s−1 for Casper and 312 counts s−1 for Columbia. On 20 August EPIC measured 15 240 and 52 728 counts s−1, respectively, showing the effect of increased cloudiness for Columbia. While Fig. 5 is expressed in counts per second, the data can be converted to radiance (W m−2 nm−1 sr−1) based on an in-flight-determined radiance calibration coefficient of KR(443nm) = W m−2 nm−1 sr−1 counts−1 s derived from reflectance coefficients (Geogdzhayev and Marshak, 2018; Marshak et al., 2018; Herman et al., 2018). For the 443 nm channel, an average count rate for the illuminated Earth is 3×10⁴ counts s−1, corresponding to a radiance of 0.159 W m−2 nm−1 sr−1. EPIC calibration constants for 8 of the 10 channels were obtained by in-flight comparisons of reflectance measured by two well-calibrated low Earth-orbiting satellite instruments, OMPS (Ozone Mapping Profiler Suite for UV channels) and MODIS (for visible and near-IR channels) for simultaneously viewed Earth areas with the same satellite view and solar zenith angles (Herman et al., 2018; Geogdzhayev and Marshak, 2018). The O2 A- and B-band channels were calibrated using lunar data when the Moon was within the field of view of EPIC. Detailed discussions and values of all EPIC calibration coefficients K(λ) are given by Geogdzhayev and Marshak (2018), Herman et al. (2018), and Marshak et al. (2018). Most of the conclusions in this study are in terms of ratios of counts per second from the same wavelength channel at approximately the same solar phase angle, which are independent of the absolute calibration conversion from counts per second to radiance.
The ratio is used to characterize the eclipse effects at the top of the atmosphere. Because the solar phase angles are nearly the same, the effects of the 172∘ backscatter angle (“hot spot” caused mostly by minimized shadows) and ocean specular reflection are also nearly the same on both days.
There is considerable variability in REN(λi) as a function of wavelength that is partially caused by the 2.7 min needed to obtain measurements for all 10 wavelengths. During the 2.7 min, the center of totality moved about 124 km, or about 1.7∘ longitude, meaning that the ratio was affected by atmospheric variability (mostly cloud effects) in the successive scenes containing the eclipse totality for each wavelength. The ratios REN(λi) of counts per second on the eclipse day to the preceding non-eclipse day are shown in Fig. 6 for all 10 wavelength λi channels and two sites (Casper, Fig 6a; Columbia, Fig. 6b) and summarized in Table 2. The same reference data from 20 August are used for both sites, since they were the closest in UTC for both the Casper and Columbia eclipse times.
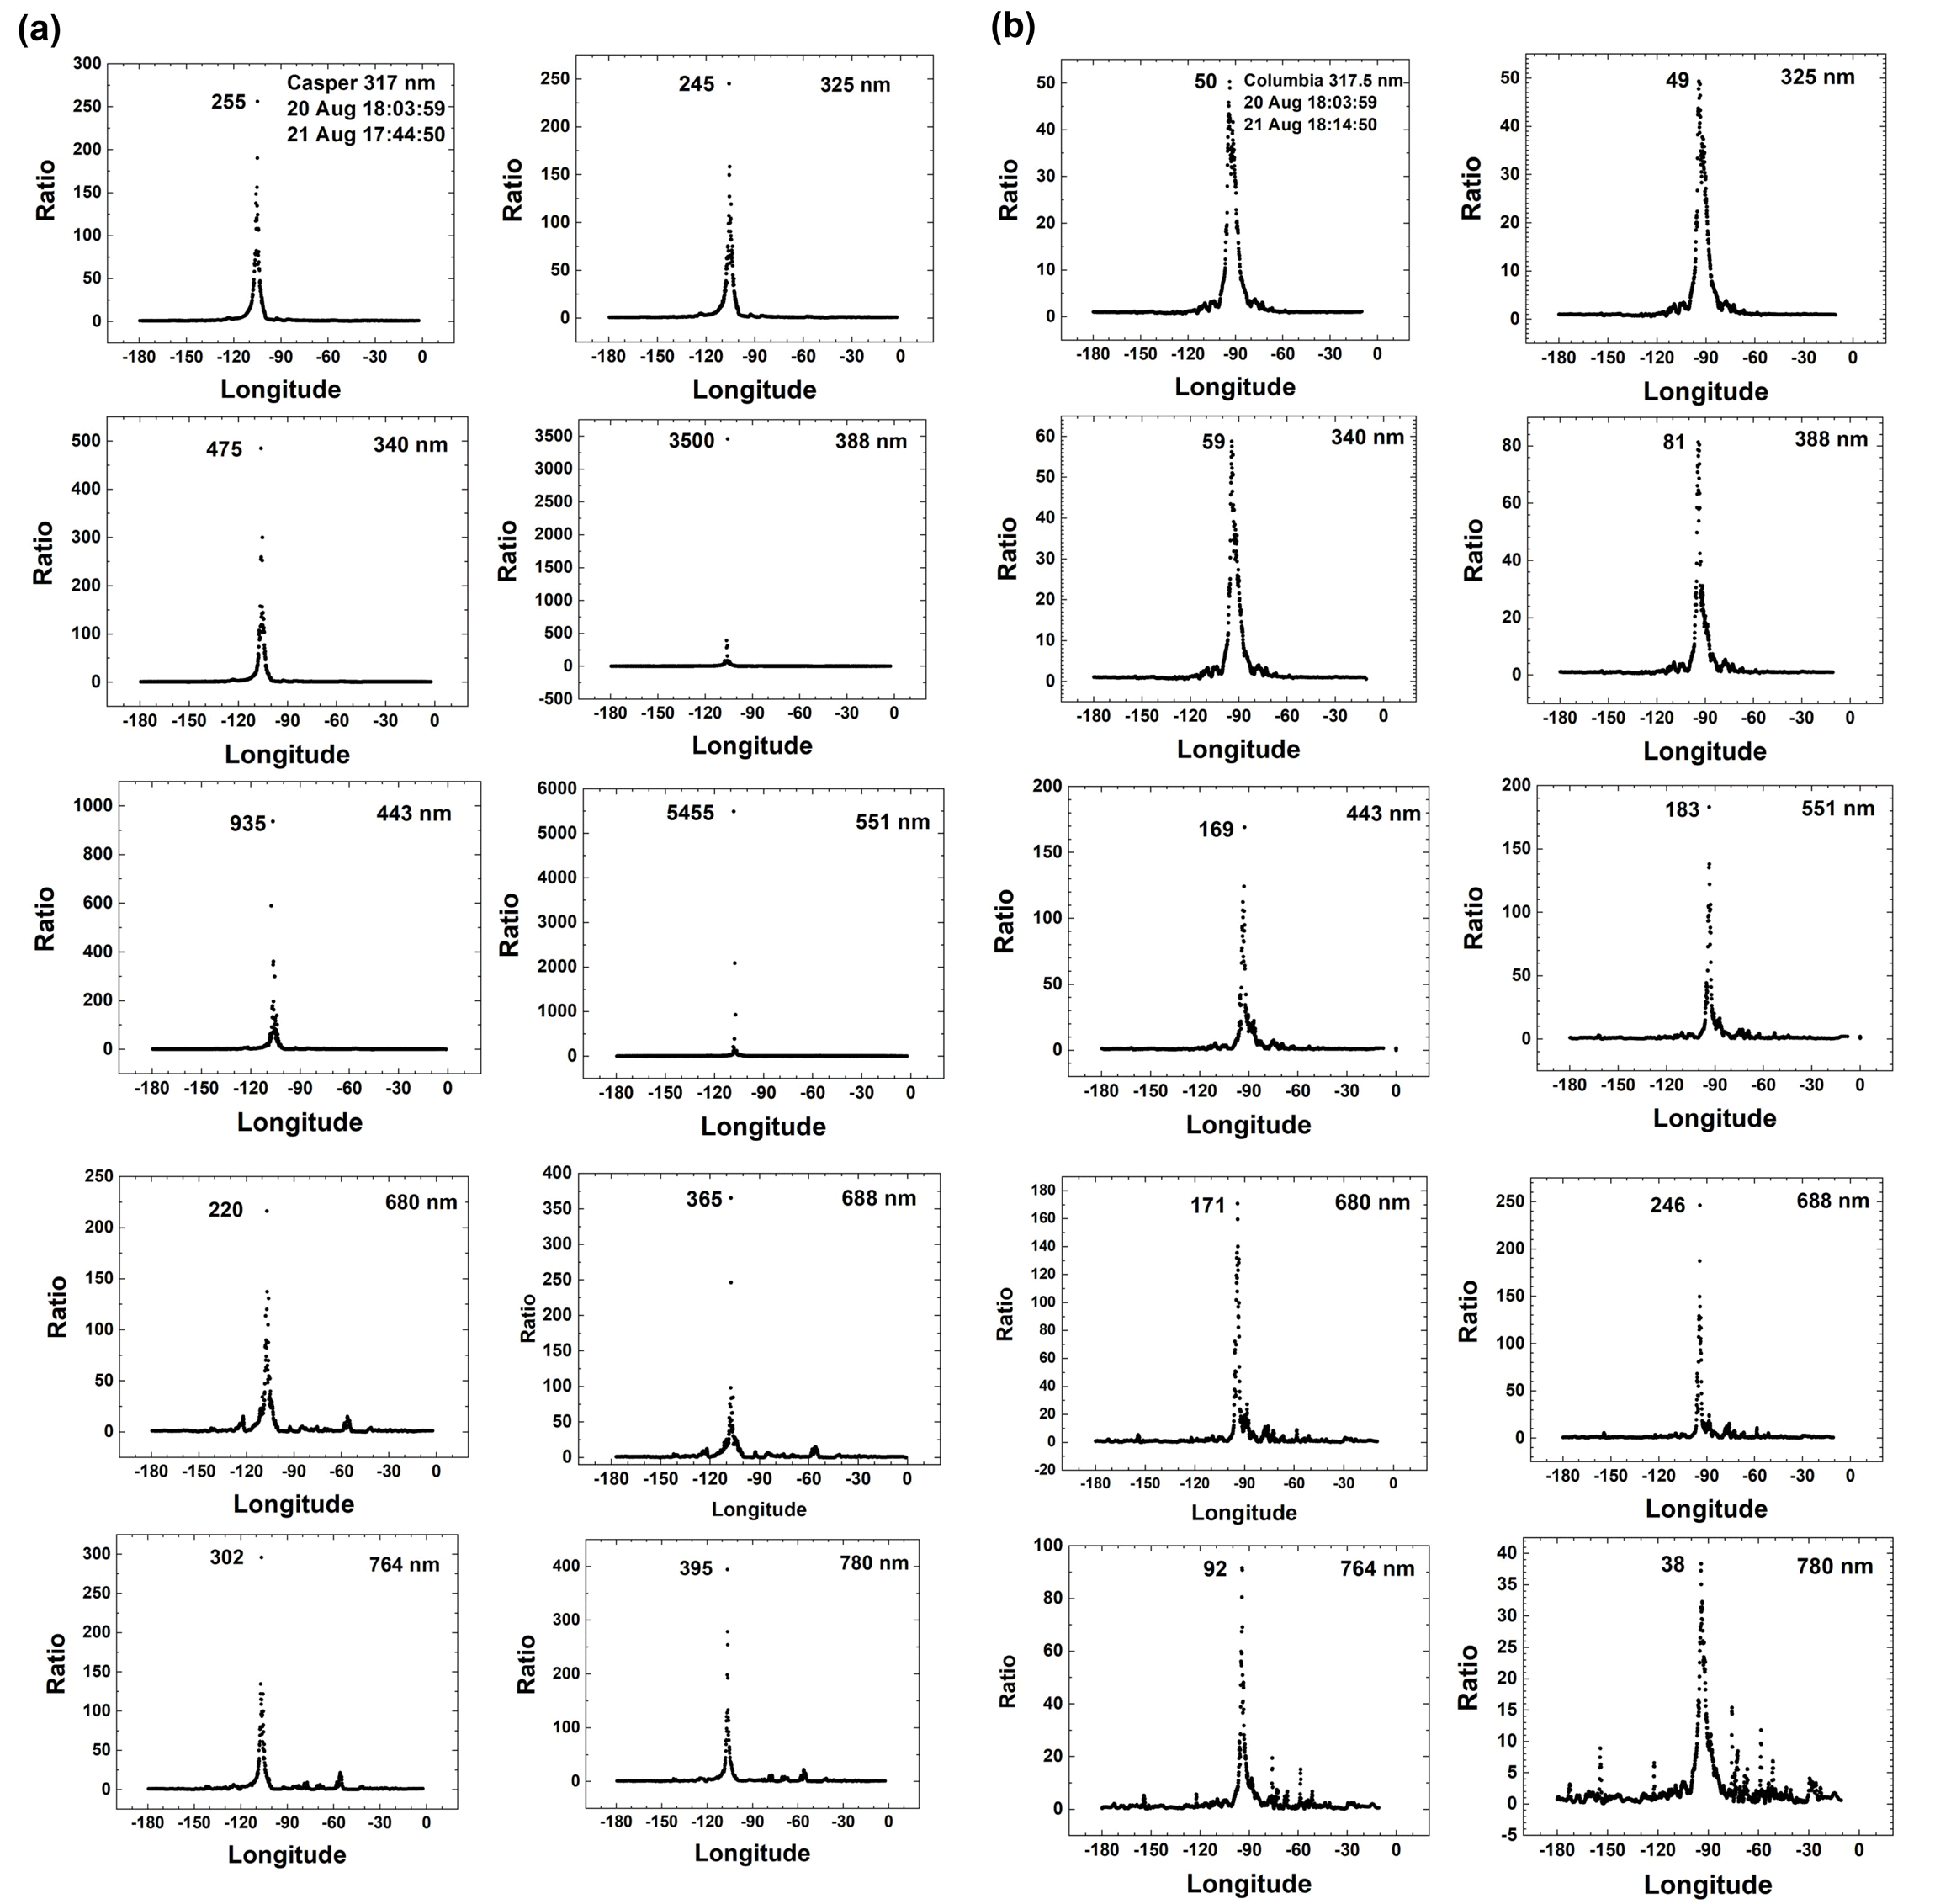
Figure 6(a) The ratio at the time of the eclipse in Casper, Wyoming, for wavelengths 317.5 to 780 nm. The channels 317.5 to 340 nm are affected by ozone absorption, and the channels 688 and 764 nm are within the O2 B and A absorption bands. (b) The ratio at the time of the eclipse in Columbia, Missouri, for wavelengths 317.5 to 780 nm. The channels 317.5 to 340 nm are affected by ozone absorption, and the channels 688 and 764 nm are within the O2 B and A absorption bands.
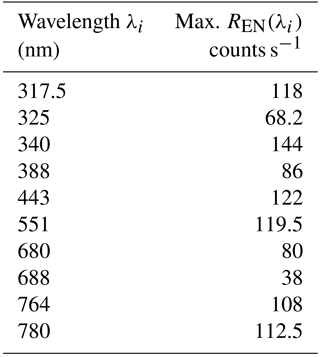
For the eclipse study, the range of synoptically observed longitudes is approximately from the international dateline (−180∘) to almost the longitude of Greenwich, England (0∘). The nearly clear sky in Casper with optically thin clouds permits the reflected light during totality to become very small (about 17 counts s−1 for 443 nm compared to 1.5×10⁴ counts s−1 on 20 August at the same longitude). Columbia had more low-altitude cloud cover than Casper (Fig. 2), with the cloud cover extending into the region of totality. The effect of this cloud cover can be seen in Fig. 6, where the maximum REN(443, Columbia) = 169, compared to 935 for Casper. Table 2 provides the eclipse radiance ratio REN(λi) for the five non-absorbed wavelength channels and five absorbed channels that can help validate 3-D radiative transfer models. The measured lower values of REN(λi) at Columbia compared to Casper show that there is high sensitivity in the TOA upwelling measured ratios to the presence of even optically thin clouds. A detailed radiative transfer study for realistic conditions is made feasible by using EPIC's simultaneous estimates of cloud reflectivity and transmission, cloud height, ozone amounts (Fig. A3 and Herman et al., 2018), and aerosol amounts (Omar Torres, private communication, 2018). These data products are available from the NASA Langley data repository referenced above.
Table 2Radiance ratio REN(λi) during eclipse totality at 17:45 UTC compared to 20 August.
3.2 Global reduction of reflected sunlight during the eclipse over Casper, WY
The unique DSCOVR/EPIC measurements provide estimates of the fractional reduction of sunlight from 388 to 780 nm reflected back to space for the entire sunlit globe caused by the eclipse shadow on the Earth. To do this, all of the light reaching EPIC in each of the five non-absorbed channels (388, 443, 551, 680, and 780 nm) are integrated over the visible sunlit Earth and compared (percent difference, PDF(λi)) with a nearly identical viewing geometry (nearly the same UTC) from the previous and next days. The assumption is that the major cloud features change slowly on a global scale over relatively short periods (Figs. 1 to 3). A test of this hypothesis is that the PDF(λi) between successive non-eclipse days is small compared to the eclipse day PDF(λi) with a non-eclipse day.
In the 3-D Fig. 7 for 443 nm, the nearly cloud-free eclipse region is the blue area in the midst of greens, yellows, and reds. The high red values correspond to fairly reflective clouds mostly seen near the Equator (Fig. 1). The yellows and greens correspond to lower-altitude clouds that tend to have smaller reflectivities. Integrating over all of the pixels for the eclipse on 21 August 2017, using the file named epic_1b_20170821174450_02.h5, we get S(DOY, UTC) = 5.34366×10¹⁰ counts s−1 for day of year (DOY) = 233 (21 August 2017) and UTC = 17:44:50. For the eclipse day, the 443 nm average counts s−1 = 2.0631×10⁴, which corresponds to 2.0631×10⁴KR(443 nm) = 0.11 W m−2 nm−1 sr−1. Peak values are approximately 1×10⁵ counts s−1, or about 0.53 W m−2 nm−1 sr−1. Figure 7 is oriented with north down so that one can see into the eclipse shadow region. A similar figure is obtained for Columbia, Missouri, with reduced depth caused by some visible light cloud cover extending into the region of totality (Fig. 2).

Figure 7The counts per second observed by EPIC for the 443 nm channel corresponding to the color image shown in Fig. 1. In the data file, the word infinity has been replaced by the number zero. In this image there are approximately Np illuminated pixels out of 2048 pixels (61.8 %).
Measured counts-per-second images for six wavelength channels (340 to 780 nm) on 20, 21, and 23 August (Fig. 8) were selected to be as close as possible to the UTC time of the eclipse in Casper, Wyoming, keeping the scattering phase angles nearly constant. Similar images for the strongly absorbed channels 317.5, 325, 688, and 764 nm are shown in the Appendix (Fig. A2). The middle images in panels B and E of Fig. 8a, b, and c are for the eclipse over Casper, Wyoming. These images are in the same format as Fig. 3, but rotated with north up. Unlike Fig. 3, the scale in Fig. 8 was selected so that the brightest clouds do not saturate the image. The increase in scale makes the land surfaces less visible. While the figures are similar from wavelength to wavelength, there are differences in the depth of the eclipse totality and the reflectivities of the surrounding clouds. In general, equatorial clouds with higher counts per second (reflectivities) tend to reach higher altitudes. This is confirmed by examining the counts per second in the strongly absorbed O2 A-band channel (Fig. A2b and Herman et al., 2018).
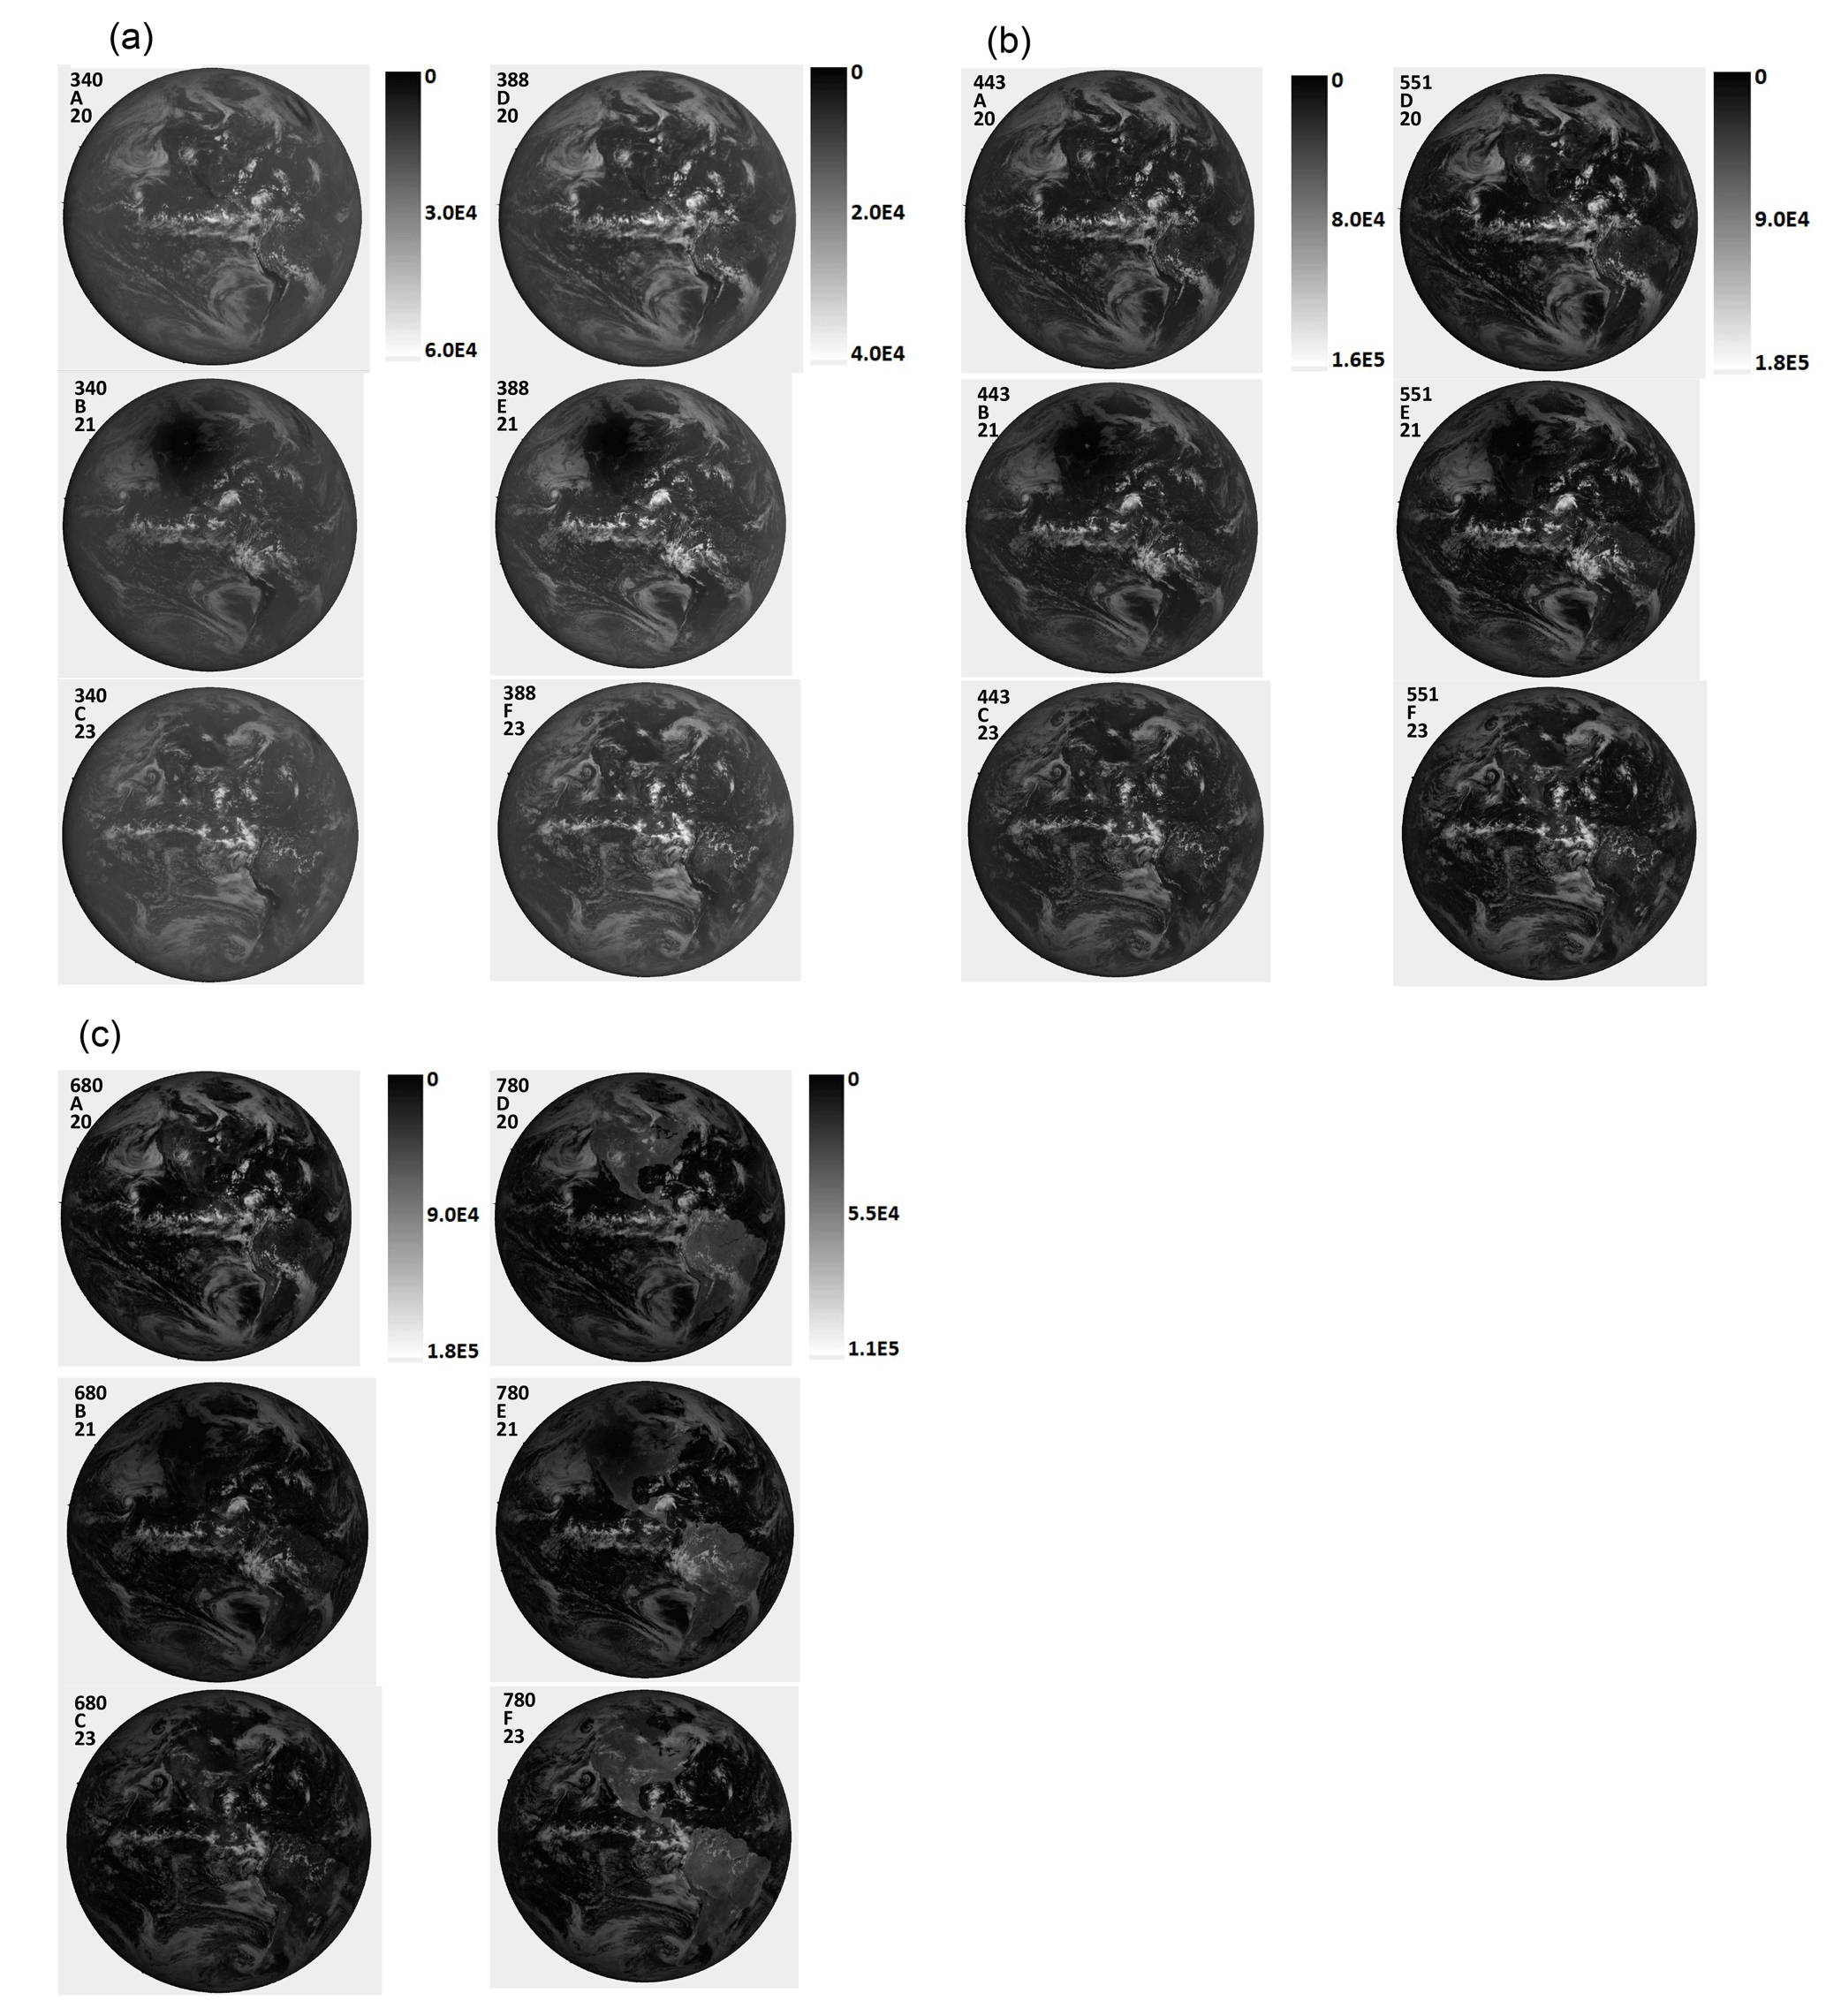
Figure 8(a) Image in counts per second for 340 and 388 nm for 20 August (A, D), 21 August (B, E), and 23 August (C, F). The scale applies to the specific wavelength. North is up. (b) Image in counts per second for 443 and 551 nm for 20 August (A, D), 21 August (B, E), and 23 August (C, F). The scale applies to the specific wavelength. North is up. (c) Image in counts per second for 680 and 780 nm for 20 August (A, D), 21 August (B, E), and 23 August (C, F). The scale applies to the specific wavelength. North is up.
Table 3(a) Eclipse change in reflected light at Casper, WY, from 20, 21, and 23 August 2017. Units are ICs . (b) Eclipse change in reflected light at Columbia, MO, from 20, 21, and 23 August 2017. Units are ICs .
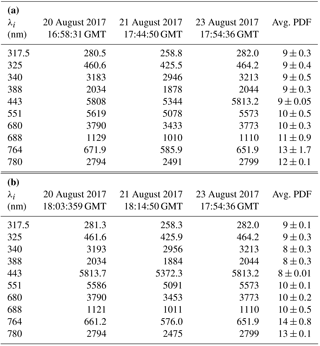
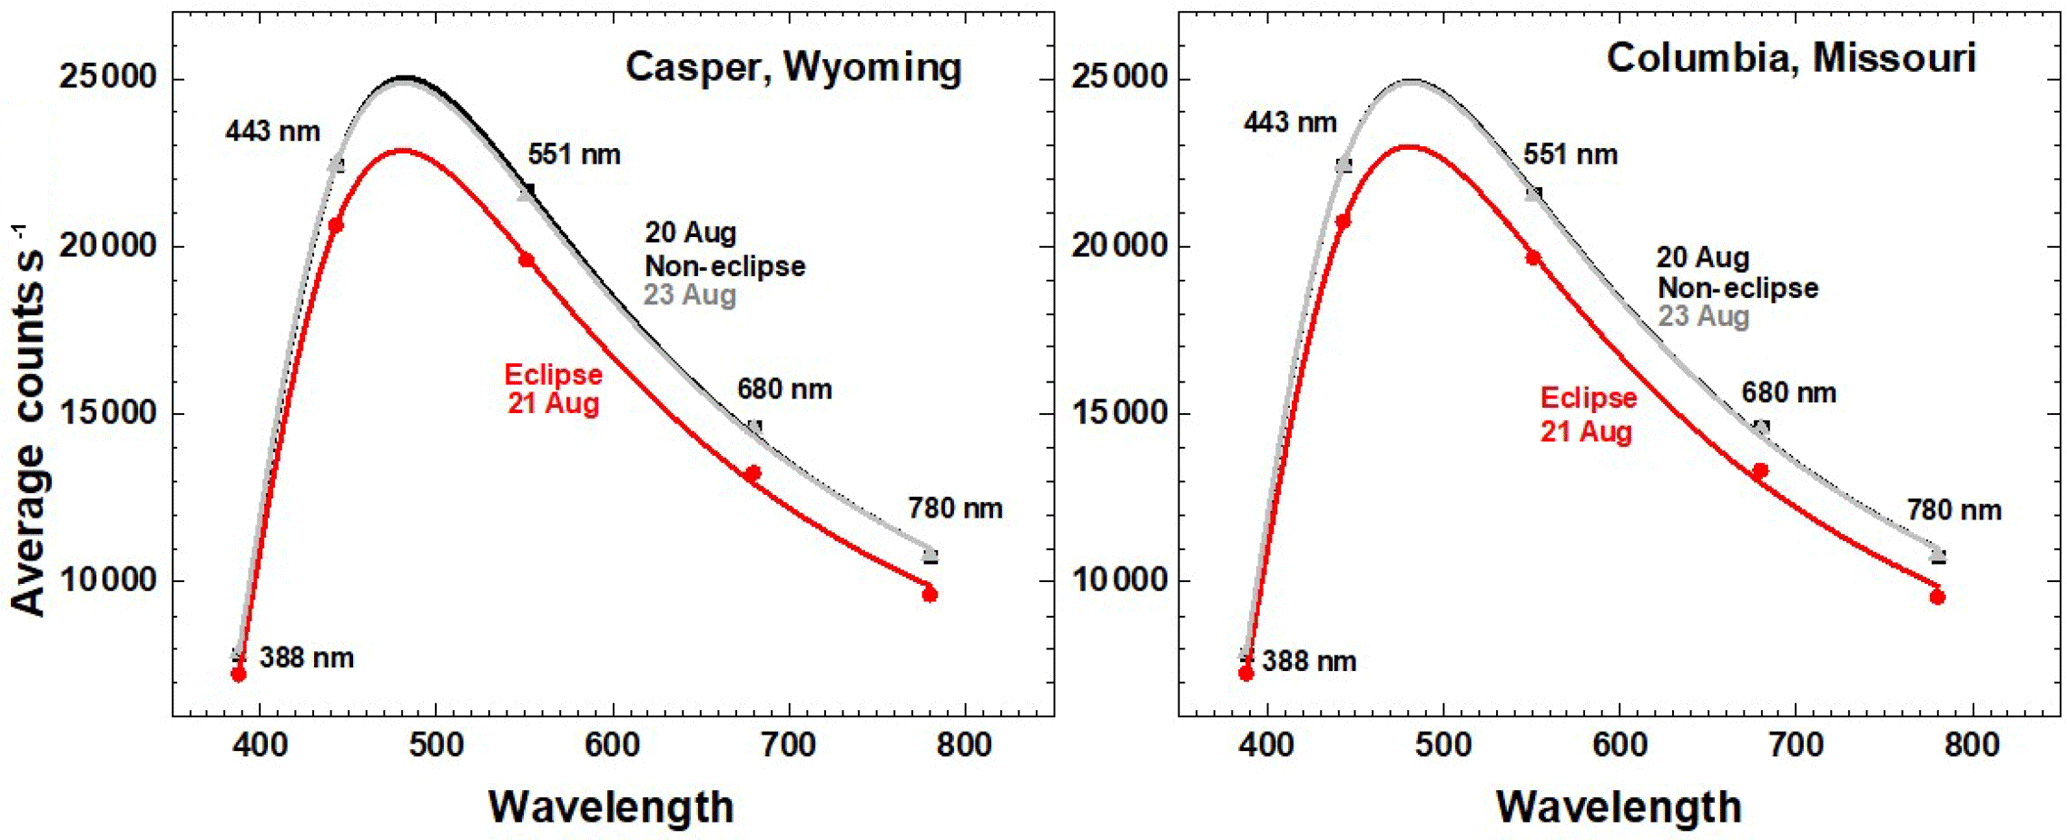
Figure 9Average reflected light in counts per second for eclipse (21 August, red) and non-eclipse (20 and 23 August, black and gray) days from Table 3 and Eq. (1) for Casper and Columbia. The locations of the maxima are from curve fitting to the discrete wavelength measurements.
EPIC-measured C(λ) in counts per second for each pixel can be converted to Earth top-of-the-atmosphere reflectance Re(λ) using the in-flight-derived calibration coefficients K(λ), where Re(λ)=K(λ)C(λ). For the six wavelength channels in Fig. 8 plus the O2 A- and B-band channels, , , , , , , , and (Herman et al., 2018; Geogdzhayev and Marshak, 2018; Marshak et al., 2018). To estimate the percent reduction in outgoing radiances, the ratios of integrals over the illuminated CCD for each wavelength channel are formed for nearly the same Earth geometry on days preceding and following the eclipse. Either the integrated reflectances or the integrated counts s (Eq. 1) for Table 3a for Casper, Wyoming, and Table 3b for Columbia, Missouri, over the CCD pixels (integrated counts per second, ICs(λ)) can be used directly, since they are linearly proportional to the integral of the photons received by the illuminated pixels.
Table 3 and Fig. 9 show that the global reduction of backscattered light caused by the eclipse is similar for the two sites even though there is more cloud cover locally over Columbia than Casper. This is because the global reduction caused by the differing umbral regions is a small fraction of the total, and only 30 min has elapsed between the two measurements, which is not enough time for the global cloud cover to have significantly changed.
Figure 9 shows a plot of the data contained in Table 3 based on Eq. (1). The two non-eclipse days are nearly identical, while the eclipse day (21 August) is significantly lower at all wavelengths. The backscattered light (in counts per second) peaks near 500 nm and then decreases toward longer wavelengths, since C(λ) is proportional to the solar irradiance, which decreases with λ after approximately 550 nm.
over Np = 2.59×10⁶ illuminated pixels on 20, 21, and 23 August 2017.
For the 443 nm channel, the result is an approximate decrease of 9 % on 21 August at 11:44:50 MDT for Casper and 8 % at 13:14:50 CDT for Columbia. As a reference, we compare two non-eclipse days (20 and 23 August). The relative difference is 0.1 % for Casper and 0.01 % for Columbia, which are much smaller than the 9 % decrease produced by the eclipse on 21 August. The comparison of the 443 nm eclipse day with two non-eclipse days gives a measure of the uncertainty in the calculation (e.g., 9±0.05 % for Casper and 8±0.01% for Columbia).
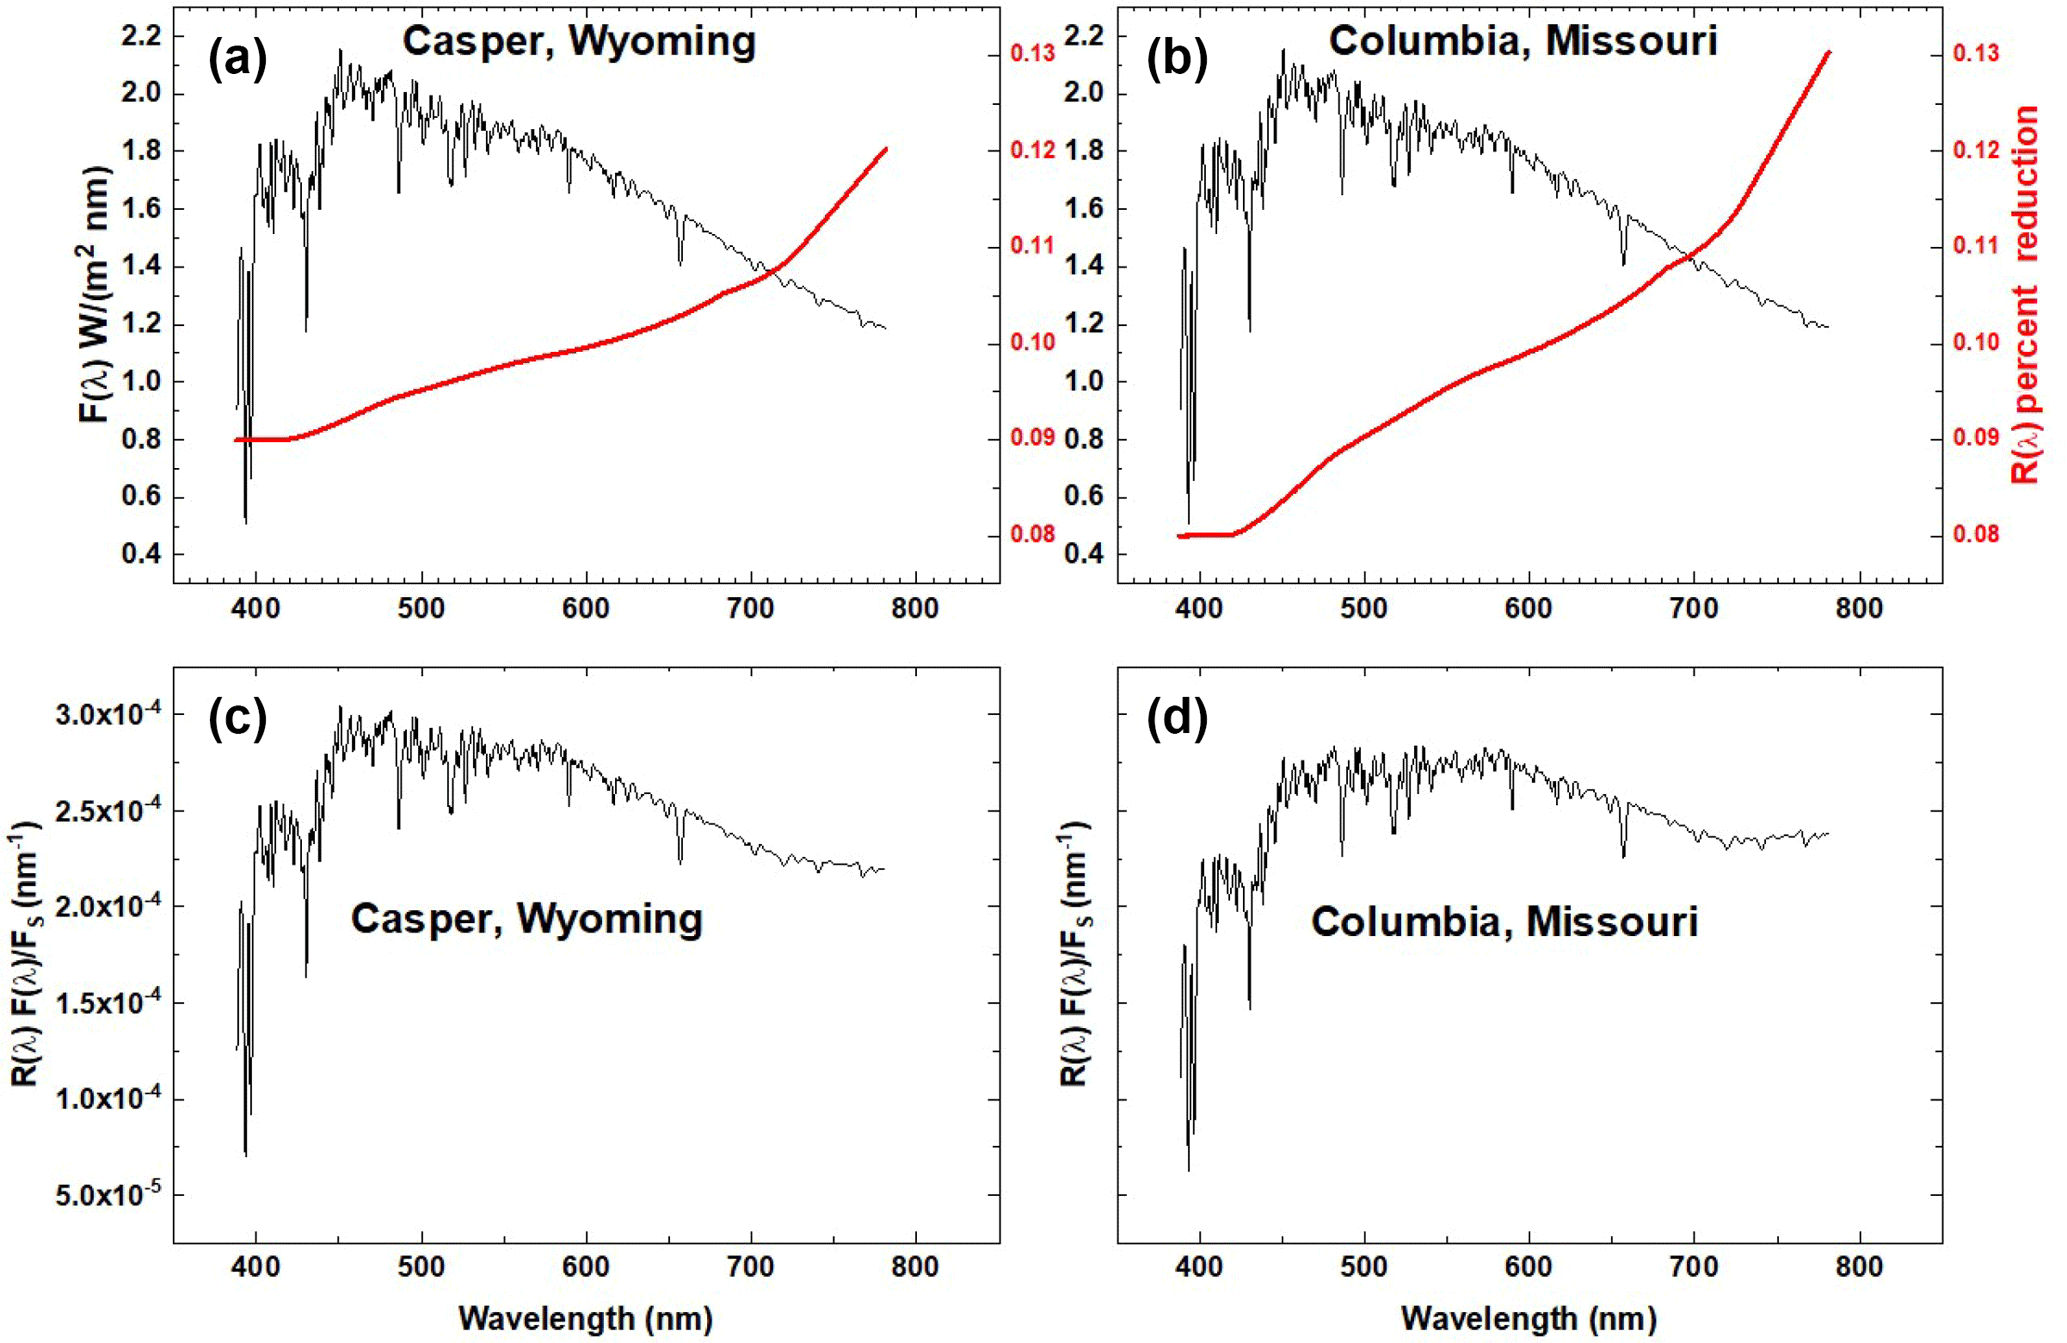
Figure 10Solar irradiance at 1 AU F(λ) W m−2 nm−1 (Mayer and Kylling, 2005) and the eclipse reduction function R(λ) in percent for Casper, Wyoming (red curve in panel a), and Columbia, Missouri (red curve in panel b). Fractional reduction (nm−1) in reflected solar irradiance in the direction of L1 for Casper, Wyoming (panel c), and Columbia, Missouri (panel d).
PDF(λi) calculations for λi=317.5, 325, 340, 388, 443, 551, 680, 688, 764, and 780 nm based on Eq. (1) are summarized in Table 3a, yielding PDF(λi)=9, 9, 9, 9, 9, 9, 10, 10, 13, and 12 % reductions in backscattered radiances in the direction of L1 for Casper, respectively, with similar values for Columbia. The PDF(764 nm) within the strongly absorbing O2 A band is 13 % for Casper and 14% for Columbia, even though the reflected ICs(764 nm) are much lower than the surrounding non-absorbed bands. The fact that adjacent absorbed and non-absorbed wavelengths give consistent PDF(λi) suggests that most of the effect comes from clouds. Eclipse effects for the short UV wavelengths are affected by Rayleigh scattering and clouds, and not much by the relatively low UV surface reflectivity (about 4 %). Eclipse effects on outgoing radiances for wavelengths longer than about 700 nm are increased by vegetation reflectivity, even where the amount of clear-sky penetrating radiances are small for the O2-absorbed 688 and 764 nm channels. There is insufficient information to explain the small observed wavelength dependence in Table 3.
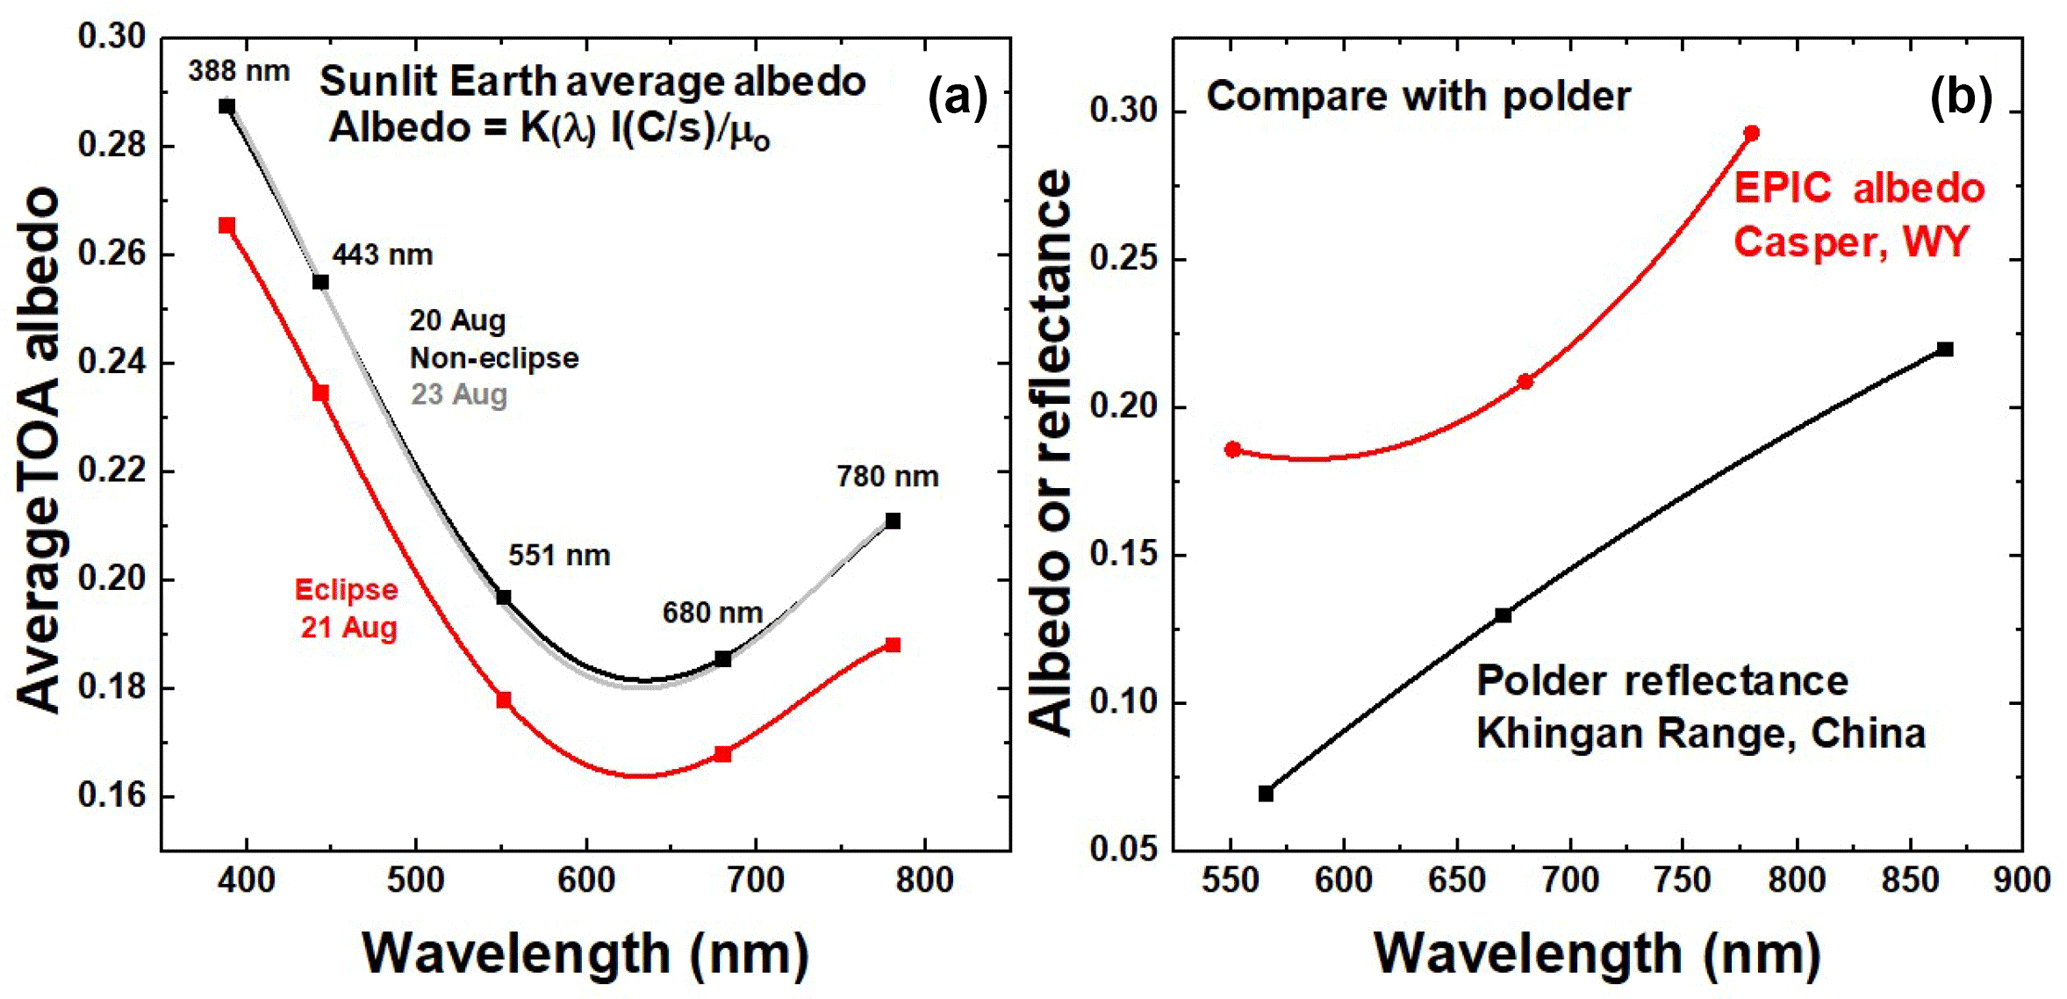
Figure 11(a) The measured albedo at Casper, Wyoming, on 20 August (black curve) and 23 August (gray curve) compared to (b) the POLDER-measured surface reflectance in the Khingan Range, China (Maignan et al., 2004), corresponding to 8∘ from overhead Sun.
To estimate the fractional reflected radiance reduction for the wavelength range from 388 to 780 nm, a polynomial interpolation R(λ) of the average PDF in Table 3 for the five weakly absorbed channels is formed (Fig. 10a and b, red curves). R(λ) must be weighted by the solar irradiance spectrum F(λ). The solar spectrum used is a combination of measured solar flux data named “atlas_plus_modtran” in the libRadtran software package (Mayer and Kylling, 2005). The components, FR and FS, of the weighted average R are defined in Eqs. (2) and (3). On 21 August 2017 the distance of the Earth from the Sun was 1.011 AU, or FS(21 August at 1 AU) = 664.94 W m−2, and at 1 AU, FR-Casper= 66.11 W m−2 and FR-Columbia= 64.86 W m−2. For the wavelength range of interest (387.9 to 781.25 nm), FS is about half of the total solar irradiance of 1361 W m−2 at the top of the atmosphere at 1 AU (Kopp and Lean, 2011).
Figure 11b shows the product R(λ)F(λ)∕FS (nm−1). Forming shows that during the eclipse the shadow of the Moon reduces the backscattered radiance (388 to 780 nm) from the sunlit Earth in the direction of L1 by about 10 %. The combined uncertainty ±0.3 % is caused by variations in the cloud cover of the reference days compared to the eclipse day. The calculation of is based on counts-per-second measurements from DSCOVR/EPIC of the sunlit Earth and the interpolation function R(λ). The result is independent of the absolute calibration of EPIC, since it is based on ratios of counts per second over 3 days with approximately the same UTC (scattering phase angles). R(λ) includes the near-backscatter-direction enhanced reflection function appropriate for the entire sunlit disk at a backscatter angle of about 172∘. The 3 days at nearly the same UTC can be compared directly, since EPIC has proven to be very stable based on repeated in-flight calibrations over a 2-year period using OMPS and MODIS (Herman et al., 2018 and Geogdzhayev and Marshak, 2018). The smooth function R(λ) does not include absorption features from water and the O2 A and B bands.
3.3 Comparison of EPIC albedo with POLDER reflectance
TOA albedo measurements made by EPIC can be compared with reflectance measurements made by the POLDER satellite instrument near the hot spot backscatter direction (172∘) for the incident solar irradiance over nearly cloud-free scenes (Maignan et al., 2004). EPIC counts per second can be converted to albedo using the calibration constants K(λ), which already contains the factor π (Fig. 11a). The average TOA albedo from EPIC was almost the same on 20 August as on 23 August. For EPIC albedo data over grassland common to Casper, Wyoming, compared to the POLDER measurements, the counts per second data for each wavelength (see Fig.5 for 443 nm) can be converted to TOA albedo.
Measurements from the POLDER satellite over the Khingan Range, China (45.68 to 53.56∘ N, 117.55 to 131.56∘ E) show that the backscatter amount from the land surface increases with increasing wavelength (Maignan et al., 2004). The Khingan Range is mainly covered by deciduous broadleaf and a mix of deciduous and evergreen needleleaf forest with a small amount of grassland, while the area around Casper is mainly short-grass prairie land with few trees. Over Casper, WY (Fig. 11b), the wavelength dependence of the EPIC TOA albedo (551, 680, and 780 nm) at 172∘ backscatter angle is similar to POLDER surface reflectance at 8∘. The shape and magnitude differences are partially caused by the atmospheric component of the albedo that includes some light cloud cover, whereas the POLDER reflectance has atmospheric effects subtracted. The effect of increasing Rayleigh scattering is seen for shorter wavelengths measured by EPIC.
The EPIC instrument on board the DSCOVR spacecraft synoptically observes the entire sunlit portion of the Earth from an orbit near the Earth–Sun Lagrange-1 point. On 21 August 2017, EPIC was able to observe the totality shadow from the lunar eclipse of the Sun with the Earth's surface for about 3 h (seven 10-channel measurements) as it crossed the United States from west to east (about 1.5 h). When the region of totality was over Casper, Wyoming, at 17:44:50 UTC, the reflected 443 nm TOA radiance was reduced to 16 counts s−1 ( W m−2 sr−1) in the narrow region of totality compared to a non-eclipse day (1.52×10⁴ counts s−1 or 0.076 W m−2 sr−1). About 30 min later the shadow passed over Columbia, Missouri, but the presence of thin clouds in the vicinity of Columbia caused increased reflected radiance of 312 counts s−1 ( W m−2 sr−1) into the umbral region during totality compared to Casper. The ratio REN(λi) of reflected radiances within the eclipse totality to radiances for the same geometry on adjacent non-eclipse days was measured for all 10 wavelength channels. The measured REN(443 nm) was smaller for Columbia (71) than for Casper (936), showing the sensitivity to increased cloud cover over Columbia. Similarly REN(388 nm, Casper) = 3500 and REN(388 nm, Columbia) = 81. While the results cannot be directly compared with REN, good agreement was obtained (Kazantzidis et al., 2007) between a model study based on a 3-D Monte Carlo radiative transfer model (Emde and Mayer, 2007) and measured ratio at 380 nm (ratio = 217) of downward global surface radiation before and during totality. The measured radiance ratios REN(λi) can serve as a validation data set for 3-D radiative transfer models of the atmosphere that include cloud effects, since EPIC also measures the surrounding amount of cloud cover for the entire sunlit Earth. Comparing REN(λ, Casper) with REN(λ, Columbia) shows that Rayleigh scattering combined with low-optical-depth clouds can scatter light into the umbra region and reduce REN(λ). Outside of the region of totality, EPIC observed the partial eclipse shadow and the fully illuminated regions of the Earth's disk. Interpolating in wavelength between the percent reductions in integrated radiances (in counts per second) over the sunlit globe, ICs(λi) for the five measured non-absorbed wavelength channels at both locations showed that the integrated reflected radiance from the Earth's sunlit disk towards L1 decreased by about 10 % compared to the integrated radiances measured on the days before and after the eclipse for approximately the same observing geometry as occurred during the eclipse. Similar calculations comparing two non-eclipse days show smaller changes in ICs (less than 0.1 %) than the eclipse day change. The five channels that are partially absorbed in the atmosphere give consistent results compared to the non-absorbed channels, suggesting that cloud reflectivities dominate the 317.5–780 nm radiances reflected back to space from the sunlit Earth's disk with a contribution from Rayleigh scattering for the shorter wavelengths.
All data authored by the DSCOVR/EPIC project at the NASA Goddard Space Flight Center are archived at the permanent NASA Atmospheric Science Data Center (ASDC) in Langley, Virginia: https://eosweb.larc.nasa.gov/project/dscovr/dscovr_epic_l1b (NASA DSCOVR project, 2018).
The course of the eclipse in the vicinity of Casper, Wyoming, and Columbia, Missouri, is shown in Fig. A1.
Grayscale images for the short UV wavelength channels (317.5, 325) with strong ozone absorption and Rayleigh scattering, the longer-wavelength UV channels (340, 388), and the strongly absorbed O2 B- and A-band channels (688, 764 nm) are shown in Fig. A2a, b, and c.
The amount of ozone over the eclipse sites can be derived (Herman et al., 2018) to produce ozone data that are stored in the NASA Langley archive. During the eclipse, it is not possible to derive the amount of ozone from either ground-based or satellite data. Ozone amounts do not change rapidly from day to day except when major weather systems pass through a region, which was not the case during the eclipse period, 20 to 23 August. This is confirmed from OMI satellite data (Ozone Monitoring Instrument on board the AURA satellite). Figure A3 shows the amount of ozone over the eclipse trajectory obtained on 20 August. The values obtained (316 DU near Casper, WY; 306 DU near Columbia, MO) compare well with ozone amounts derived from OMI of 314 and 301 DU. The O3 variability during the 2.7 min (approximately 124 km or about 1∘ of longitude) is about ±5 DU.
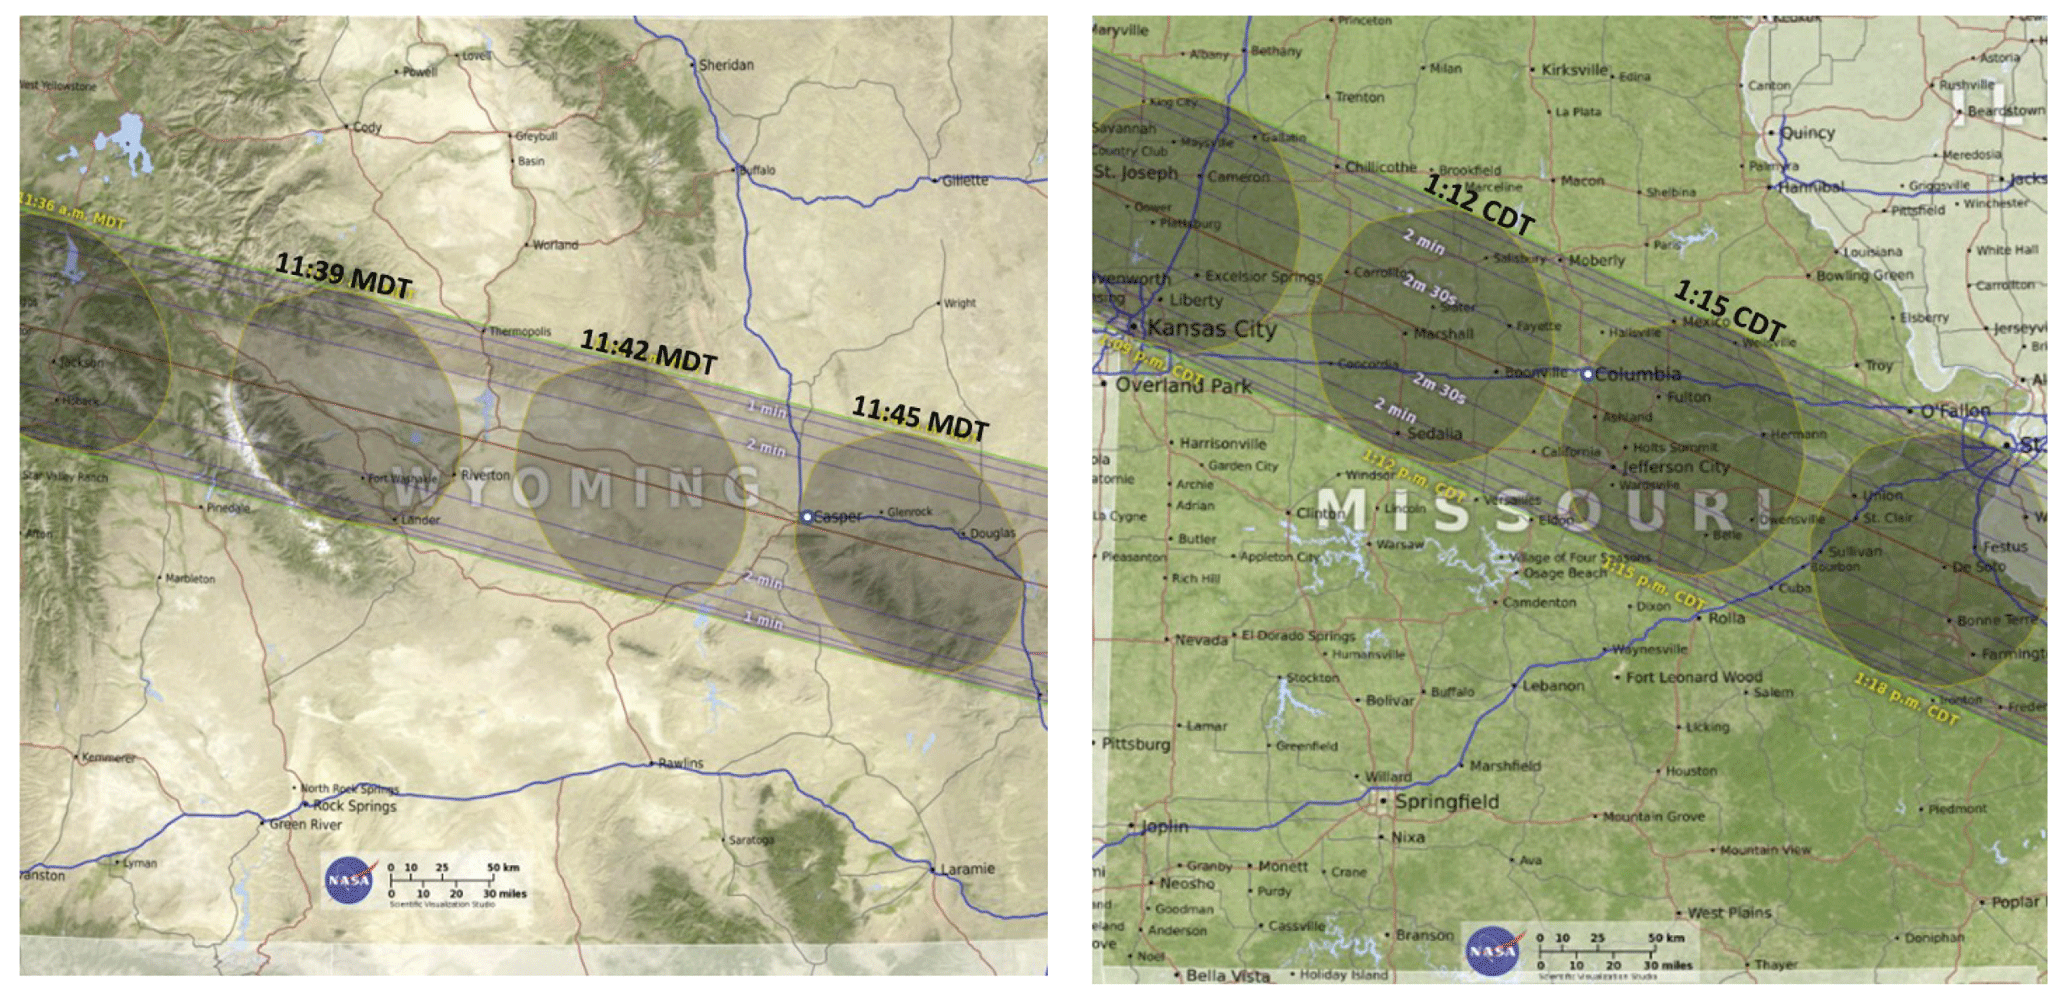
Figure A1The timing and shape of the Moon's shadow over Casper, Wyoming, showing the relative location of Casper and Columbia (white circles) at 11:45 MDT (Mountain Daylight Time) and 13:15 CDT (Central Daylight Time). The shadow is moving at about 46 km min−1 (https://eclipse2017.nasa.gov/eclipse-maps). The scale size with the NASA logo is 50 km.
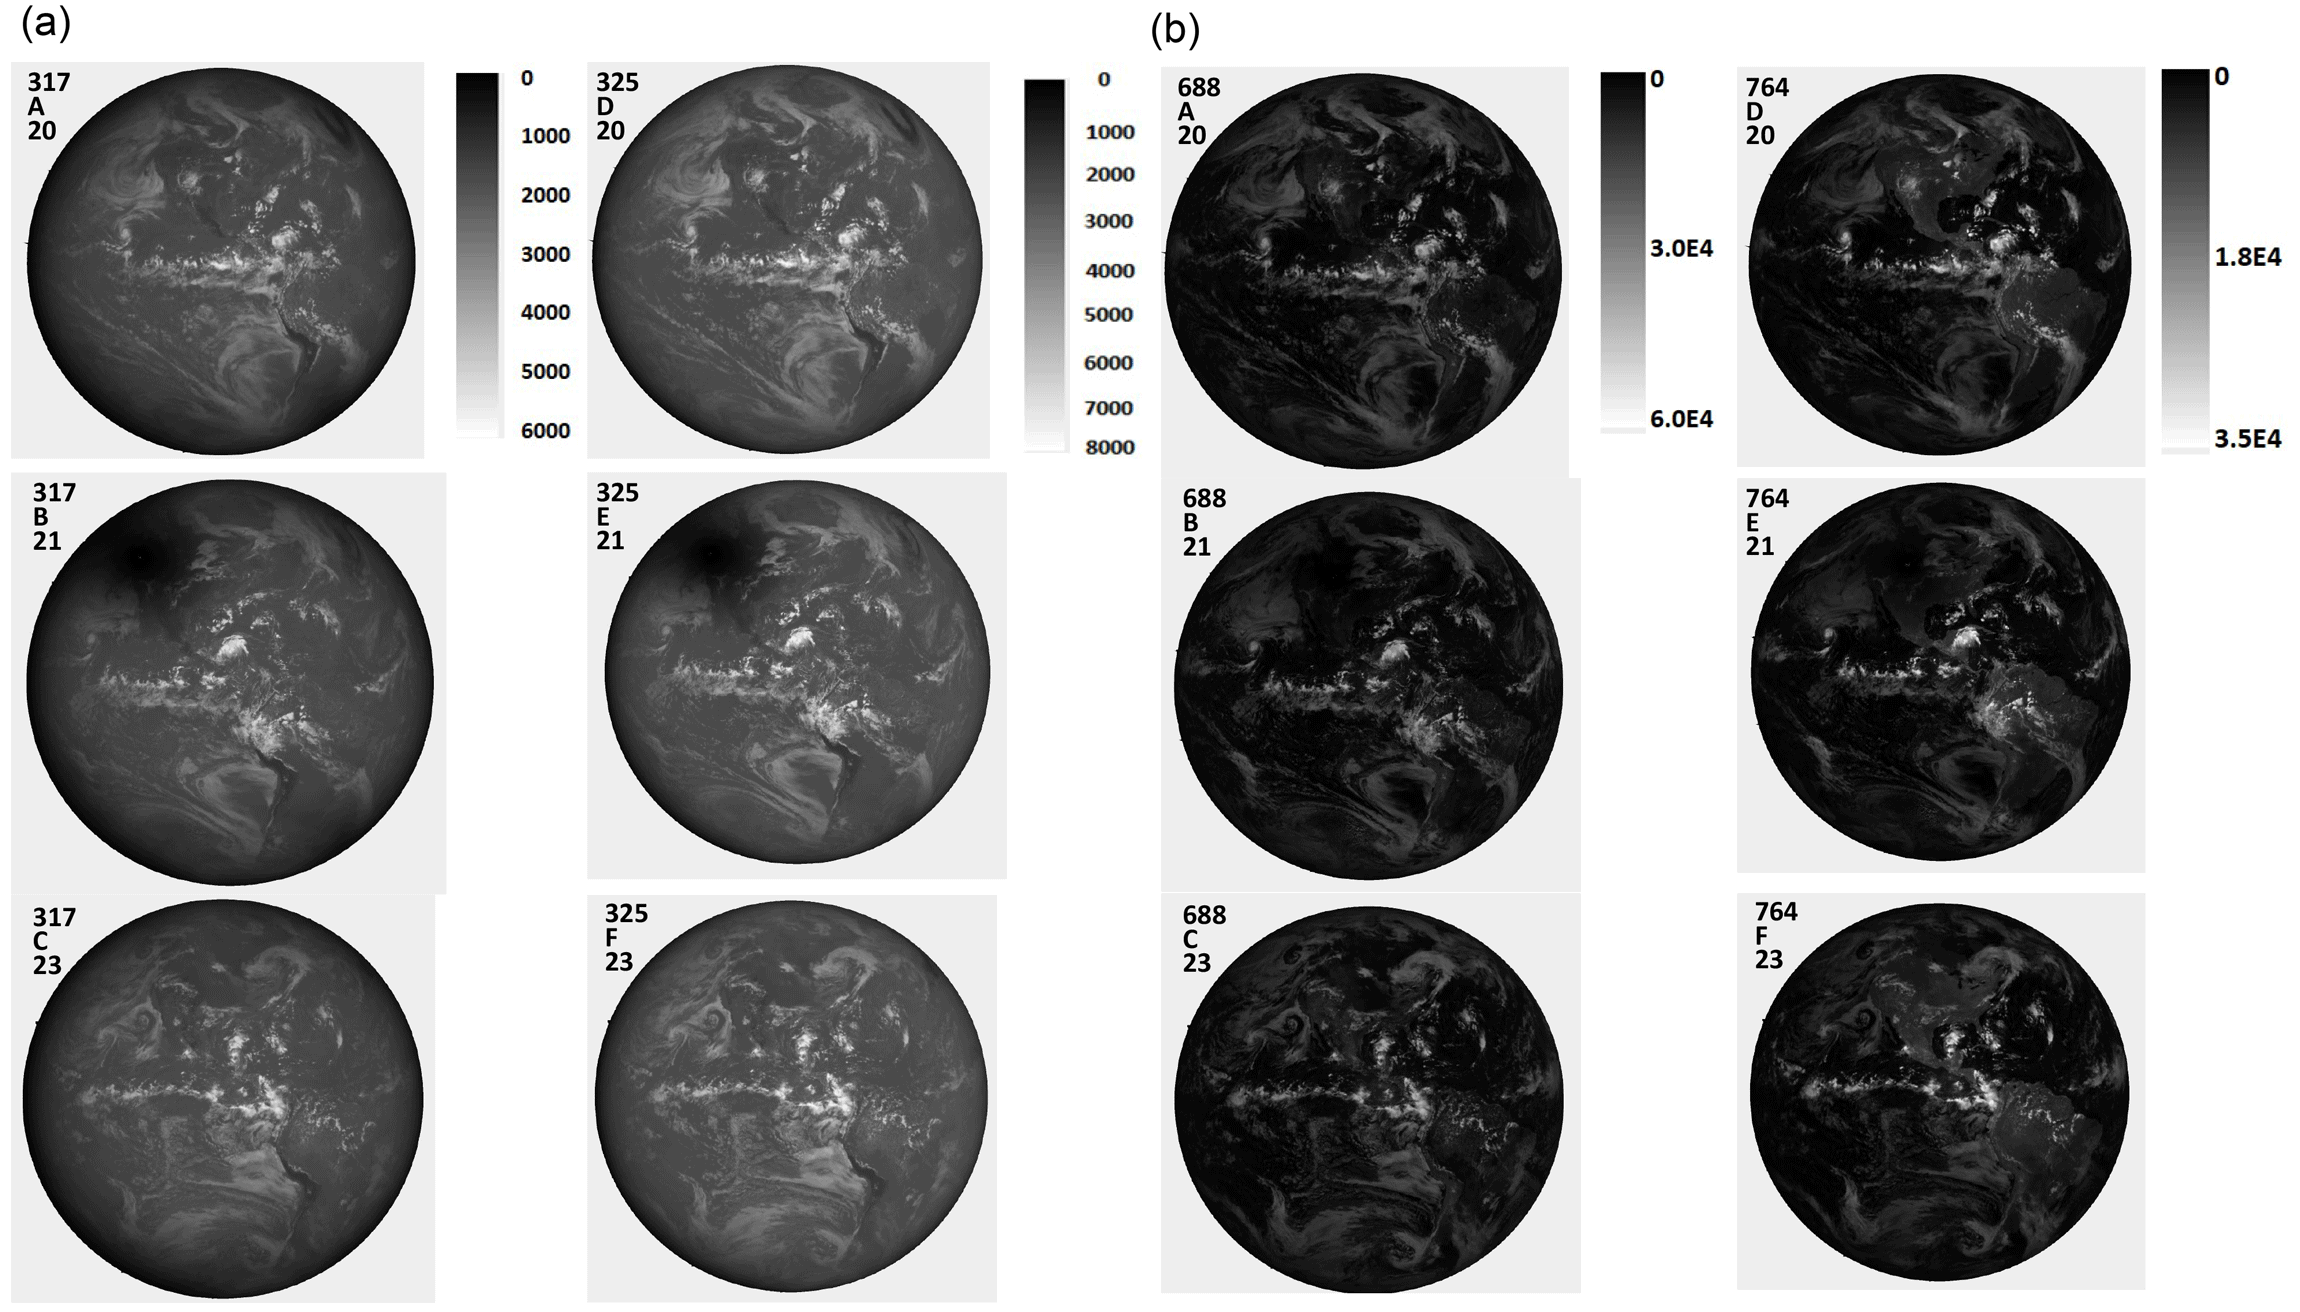
Figure A2(a) Image in counts per second for 317 and 325 nm and (b) image in counts per second for 688 and 764 nm for 20, 21, and 23 August. The scale applies to the specific wavelength. North is up.
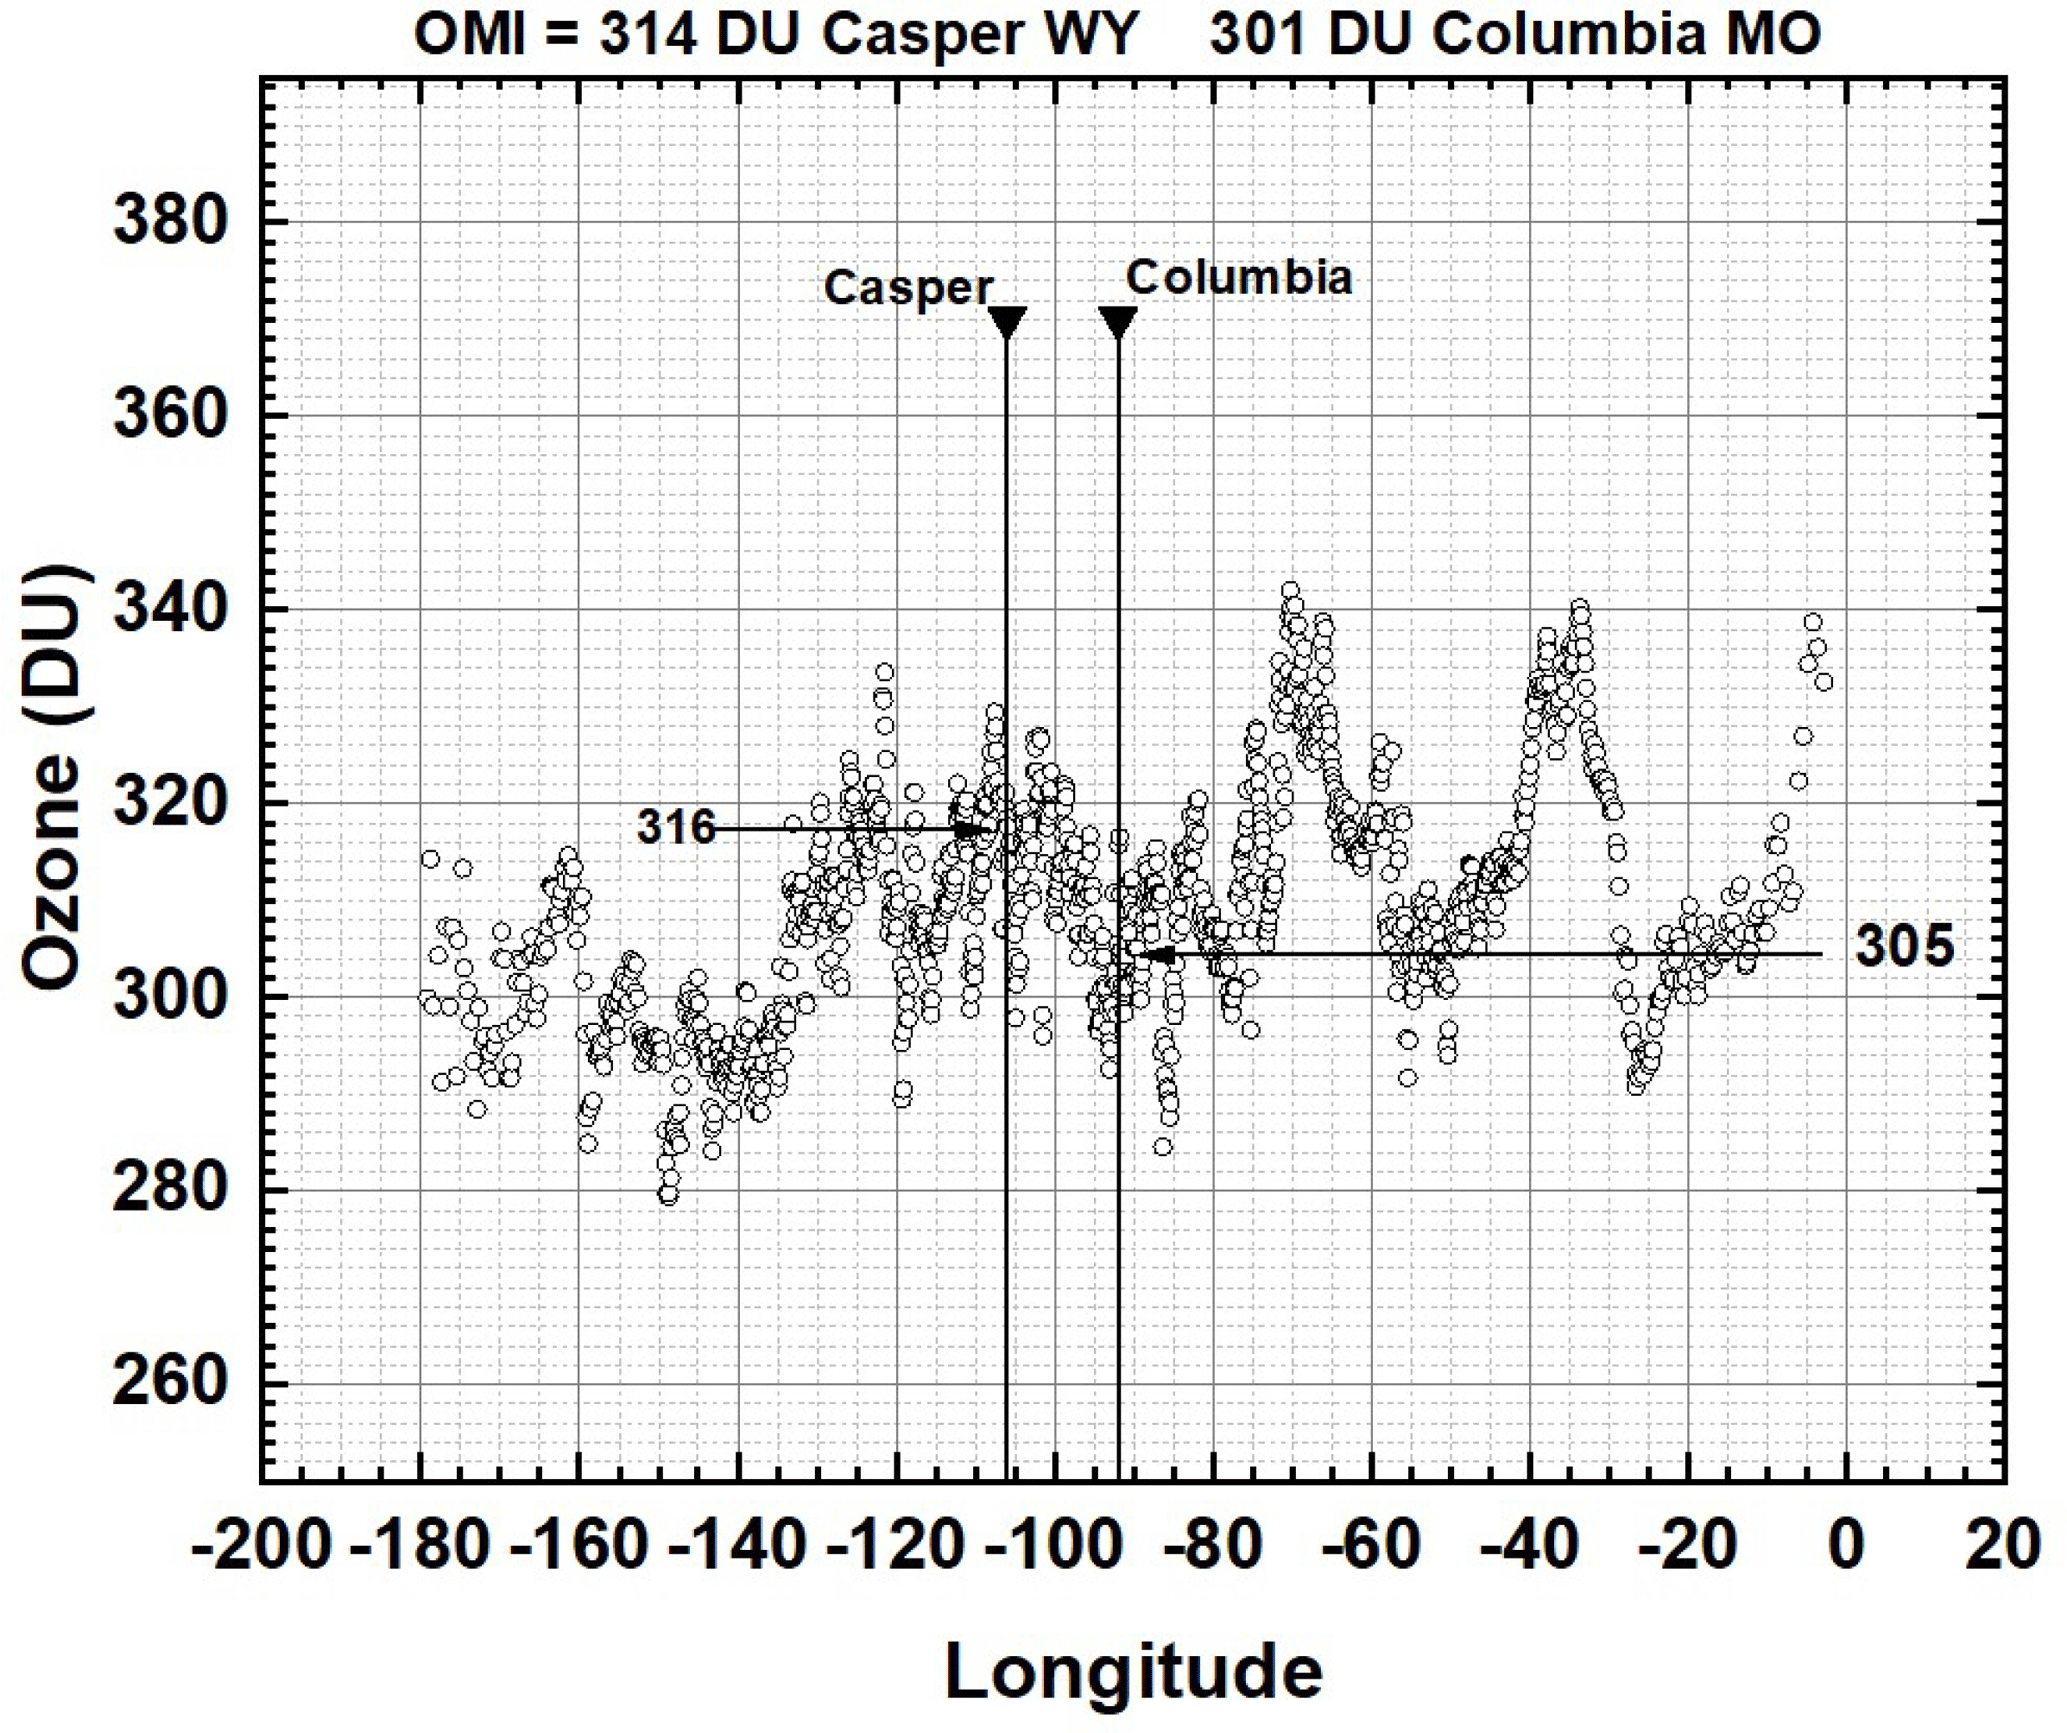
Figure A3EPIC-measured ozone amounts from 20 August in the vicinity of Casper, WY, and Columbia, MO.
JH wrote most of the paper and performed most of the calculations. GW is the funded principal investigator of the project. AM provided the calibration coefficients for the visible and near-IR channels. KB provided the color images in Figs. 1 to 3. She was responsible for the geolocation of the 10 filter images on a common grid. LH provided the calibration coefficients for the UV channels. AC provided the flatfielding, stray-light correction, and dark-current analysis. NA helped with flatfielding and stray-light correction and was responsible for the ground-based portion of this research. MK provided the flatfielding, stray-light correction, and dark-current analysis.
The authors declare that they have no conflict of interest.
The author would like to thank the DSCOVR project for support in completing
this study as well as financial support from an accepted NASA-ROSES proposal
in response to NNH16ZDA001N-ISE.
Edited by: Bernhard Mayer
Reviewed by: two anonymous referees
Cescatti, A.: Indirect estimates of canopy gap fraction based on the linear conversion of hemispherical photographs: Methodology and comparison with standard thresholding techniques, Agr. Forest Meteorol., 143, 1–12, 2007.
Emde, C. and Mayer, B.: Simulation of solar radiation during a total eclipse: a challenge for radiative transfer, Atmos. Chem. Phys., 7, 2259–2270, https://doi.org/10.5194/acp-7-2259-2007, 2007.
Geogdzhayev, I. V. and Marshak, A.: Calibration of the DSCOVR EPIC visible and NIR channels using MODIS Terra and Aqua data and EPIC lunar observations, Atmos. Meas. Tech., 11, 359–368, https://doi.org/10.5194/amt-11-359-2018, 2018.
Gerasopoulos, E., Zerefos, C. S., Tsagouri, I., Founda, D., Amiridis, V., Bais, A. F., Belehaki, A., Christou, N., Economou, G., Kanakidou, M., Karamanos, A., Petrakis, M., and Zanis, P.: The total solar eclipse of March 2006: overview, Atmos. Chem. Phys., 8, 5205–5220, https://doi.org/10.5194/acp-8-5205-2008, 2008.
Herman, J. R., Cede, A., Spinei, E., Mount, G., Tzortziou M., and Abuhassan, N.: NO2 Column Amounts from Ground-based Pandora and MFDOAS Spectrometers using the Direct-Sun DOAS Technique: Intercomparisons and Application to OMI Validation, J. Geophys. Res., 114, D13307, https://doi.org/10.1029/2009JD011848, 2009.
Herman, J., Huang, L., McPeters, R., Ziemke, J., Cede, A., and Blank, K.: Synoptic ozone, cloud reflectivity, and erythemal irradiance from sunrise to sunset for the whole earth as viewed by the DSCOVR spacecraft from the earth–sun Lagrange 1 orbit, Atmos. Meas. Tech., 11, 177–194, https://doi.org/10.5194/amt-11-177-2018, 2018.
Ji, Q. and Tsay S.-C.: On the dome effect of Eppley oyrgeometers and pyranometers, Geophys. Res. Lett., 27, 971–974, 2000.
Kazantzidis, A., Bais, A. F., Emde, C., Kazadzis, S., and Zerefos, C. S.: Attenuation of global ultraviolet and visible irradiance over Greece during the total solar eclipse of 29 March 2006, Atmos. Chem. Phys., 7, 5959–5969, https://doi.org/10.5194/acp-7-5959-2007, 2007.
Kopp, G. and Lean, J. L.: A new, lower value of total solar irradiance: Evidence and climate significance, Geophys. Res. Lett., 38, L01706, https://doi.org/10.1029/2010GL045777, 2011.
Liendo, J. A. and Chacin, G. H.: A study of a solar eclipse using a photocell, Rev. Bras. Ensino Fis., 26, 395–399, 2004.
Littmann, M., Espenak, F., and Wilcox, K.: Totality: Eclipses of the Sun, Oxford University Press, New York, USA, 18–19, 2008.
Maignan, F., Breon, F. M., and Lacaze, R.: Bidirectional reflectance of Earth targets: Evaluation of analytical models using a large set of spaceborne measurements with emphasis on the Hot Spot, Remote Sens. Environ., 90, 210–220, https://doi.org/10.1016/j.rse.2003.12.006, 2004.
Marshak, A., Herman, J., Szabo, A., Blank, K., Carn, S., Cede, A., Geogdzhayev, I., Huang, D., Huang, L., Knyazikhin, Y., Kowalewski, M., Krotkov, N., Lyapustin, A., McPeters, R., Meyer, K., Torres, O., and Yang, Y.: Earth Observations from American Meteorological Society DSCOVR/EPIC Instrument, B. Am. Meteorol. Soc., https://doi.org/10.1175/BAMS-D-17-0223.1, in press, 2018.
Mayer, B. and Kylling, A.: Technical note: The libRadtran software package for radiative transfer calculations – description and examples of use, Atmos. Chem. Phys., 5, 1855–1877, https://doi.org/10.5194/acp-5-1855-2005, 2005.
Meeus, J.: The maximum possible duration of a total solar eclipse, Journal of the British Astronomical Association, 113, 343–348, 2003.
NASA DSCOVR project: Archiving and distributing Earth science data at the NASA Langley Research Center, NASA Goddard Space Flight Center, Atmospheric Science Data Center (ASDC), https://doi.org/10.5067/EPIC/DSCOVR/L1B.001, last access: 18 July 2018.
Psiloglou, B. E. and Kambezidis, H. D.: Performance of the meteorological radiation model during the solar eclipse of 29 March 2006, Atmos. Chem. Phys., 7, 6047–6059, https://doi.org/10.5194/acp-7-6047-2007, 2007.