the Creative Commons Attribution 4.0 License.
the Creative Commons Attribution 4.0 License.
 | 07 Sep 2018
Real-time measurements of gas-phase organic acids using SF6− chemical ionization mass spectrometry
Theodora Nah
Yi Ji
David J. Tanner
Hongyu Guo
Amy P. Sullivan
Nga Lee Ng
Rodney J. Weber
The sources and atmospheric chemistry of gas-phase organic acids are currently poorly understood, due in part to the limited range of measurement techniques available. In this work, we evaluated the use of as a sensitive and selective chemical ionization reagent ion for real-time measurements of gas-phase organic acids. Field measurements are made using chemical ionization mass spectrometry (CIMS) at a rural site in Yorkville, Georgia, from September to October 2016 to investigate the capability of this measurement technique. Our measurements demonstrate that can be used to measure a range of organic acids in the atmosphere. One-hour averaged ambient concentrations of organic acids ranged from a few parts per trillion by volume (ppt) to several parts per billion by volume (ppb). All the organic acids displayed similar strong diurnal behaviors, reaching maximum concentrations between 17:00 and 19:00 EDT. The organic acid concentrations are dependent on ambient temperature, with higher organic acid concentrations being measured during warmer periods.
- Article
(2193 KB) - Full-text XML
-
Supplement
(2675 KB) - BibTeX
- EndNote


Organic acids are ubiquitous and important species in the troposphere. They are major contributors of free acidity in precipitation (Galloway et al., 1982; Keene et al., 1983; Keene and Galloway, 1984) and can also affect the formation of secondary organic aerosols (SOA) (Zhang et al., 2004; Carlton et al., 2006; Sorooshian et al., 2010; Yatavelli et al., 2015). As end products of oxidation, organic acids can also serve as useful tracers of air mass history (Sorooshian et al., 2007, 2010). Organic acids are found in urban, rural and remote marine environments in the gas, aqueous and particle phases. While organic acids are emitted directly from biogenic sources (e.g., microbial activity, vegetation and soil) and anthropogenic activities (e.g., fossil fuel combustion, vehicular emissions and biomass burning) (Kawamura et al., 1985; Talbot et al., 1988, 1999; Chebbi and Carlier, 1996; Seco et al., 2007; Veres et al., 2010, 2011; Paulot et al., 2011; Millet et al., 2015), they can also be formed from photooxidation of nonmethane volatile organic compounds and aqueous-phase photochemistry of semivolatile organic compounds (Chebbi and Carlier, 1996; Hansen et al., 2003; Orzechowska and Paulson, 2005; Carlton et al., 2006; Sorooshian et al., 2007; Ervens et al., 2008; Paulot et al., 2011; Millet et al., 2015). The chemical aging of organic aerosols has also been proposed as a major source of organic acids (Molina et al., 2004; Vlasenko et al., 2008; Paulot et al., 2011). The relative importance of primary and secondary sources of organic acids are currently poorly constrained, though their emissions likely depend on the magnitude of biogenic and anthropogenic activities and the meteorological conditions. Wet and dry deposition are the primary sinks of organic acids in the atmosphere (Chebbi and Carlier, 1996).
Formic and acetic acids are the dominant gas-phase monocarboxylic acids in the troposphere (Chebbi and Carlier, 1996). Due to their high vapor pressures, the gas-phase concentrations of formic and acetic acids are usually 1 to 2 orders of magnitude higher than their particle-phase concentrations. Some field studies report strong correlations between formic and acetic acids, suggesting that these two organic acids have similar sources (Nolte et al., 1997; Souza and Carvalho, 2001; Paulot et al., 2011). A recent modeling study suggested that the dominant sources of formic acid in the southeastern US are primarily biogenic in nature (Millet et al., 2015). These sources include direct emissions from vegetation and soil and photochemical production from biogenic volatile organic compounds (BVOCs). Currently, atmospheric formic and acetic acid concentrations are higher than those predicted by models, indicating that present model estimates of source and sink magnitudes are incorrect (Paulot et al., 2011; Millet et al., 2015). In the case of formic acid, deposition and secondary photochemical production via mechanisms such as photooxidation of isoprene and reaction of stabilized criegee intermediates need to be better constrained in models. Given that formic and acetic acids are major trace gases in the atmosphere, there is a need to resolve the discrepancy between measurements and model predictions to close the atmospheric reactive carbon budget and improve our overall understanding of VOC chemistry in the atmosphere.
Currently, research on gas-phase organic acids has focused primarily on formic and acetic acids (Andreae et al., 1988; Talbot et al., 1988, 1995, 1999; Grosjean, 1991; Hartmann et al., 1991). This is due, in part, to the analytical difficulties in measuring gas-phase >C2 organic acids (i.e., containing more than 3 carbon atoms) and oxidized organic acids (i.e., containing more than 2 oxygen atoms) in real time. These organic acids have low vapor pressures and are generally present in low concentrations in the gas phase. For example, dicarboxylic acids typically have vapor pressures that are 2 to 4 orders of magnitude lower than their analogous monocarboxylic acids (Chebbi and Carlier, 1996), and are present mainly in the particle and aqueous phases. Rapid and accurate measurements of gas-phase >C2 organic acids and oxidized organic acids are necessary for constraining the regional and global SOA budget since these acids can partition readily between the gas and particle and aqueous phases and subsequently affect SOA formation (Zhang et al., 2004; Carlton et al., 2006; Ervens et al., 2008; Sorooshian et al., 2010; Yatavelli et al., 2015).
Chemical ionization mass spectrometry (CIMS) is commonly used to selectively measure atmospheric trace gases in real time with high sensitivity. CIMS measurements rely on reactions between reagent ions and compounds of interest present in the sampled air to produce analyte ions that are detected by a mass spectrometer. The subset of molecular species detected is determined by the reagent ion employed since the specificity of the ionization process is governed by the ion–molecule reaction mechanism. CIMS is a popular tool for atmospheric measurements, since it is versatile and has high time resolution and sensitivity. It is also often a soft ionization technique with minimal ion fragmentation, thus preserving the parent molecule's elemental composition and allowing for molecular speciation. Recent developments in chemical ionization methods and sources have greatly improved our ability to measure atmospheric acidic species. Some of the CIMS reagent ions that have been used to measure atmospheric organic acids include acetate (), iodide (I−) and CF3O− anions (Crounse et al., 2006; Veres et al., 2008; Lee et al., 2014; Brophy and Farmer, 2015; Nguyen et al., 2015). However, each of these CIMS reagent ions has its drawbacks, which are generally related to their selectivity and sensitivity towards different atmospheric species. For example, acetic acid is difficult to measure with as the CIMS reagent ion, due to interferences from the reagent ion chemistry that complicates the desired ion–molecule reactions. In addition, while many organic acids can be detected using I− as a reagent ion, its sensitivity to different acids can vary by orders of magnitude (Lee et al., 2014).
The sulfur hexafluoride () anion has been used as a CIMS reagent ion to measure atmospheric inorganic species such as sulfur dioxide (SO2), nitric acid (HNO3) and peroxynitric acid (HO2NO2) (Slusher et al., 2001, 2002; Huey et al., 2004; Kim et al., 2007). commonly reacts with most acidic gases at the collision rate by either proton or fluoride transfer reactions (Huey et al., 1995). The ion chemistry is selective to acidic species, which can simplify the mass spectral analysis of organic acids. However, is reactive to both ozone (O3) and water vapor, which can lead to interfering reactions that limit its applicability to many species in certain environments (Huey et al., 2004). For these reasons, this work is focused on assessing the ability of to measure a series of organic acids in ambient air. The major advantage that has over I− and in this study is that it offers the possibility of sensitive detection of acetic and oxalic acids and SO2 (Lee et al., 2014, 2018). CF3O− has a similar chemistry to but it also has issues due to hydrolysis and the ion precursor not being commercially available. We present ambient measurements of gas-phase organic acids conducted in a mixed forest–agricultural area in Georgia in early fall of 2016 to evaluate the performance of a CIMS technique. Gas-phase organic acid measurements are compared to gas-phase water-soluble organic carbon (WSOCg) measurements performed during the field study to estimate the fraction of WSOCg that is comprised of organic acids at this rural site. Laboratory experiments are conducted to measure the sensitivity of with a series of organic acids of atmospheric relevance.
2.1 Field site
Real-time ambient measurements of gas-phase organic acids were obtained using a chemical ionization mass spectrometer from 3 September to 12 October 2016 at the SouthEastern Aerosol Research and Characterization (SEARCH) site located in Yorkville, Georgia. A detailed description of the field site has been provided by Hansen et al. (2003). Briefly, the Yorkville field site (33.931∘ N, 85.046∘ W) was located ∼55 km northwest of Atlanta (the closest urban center), and was on a broad ridge in a large pasture where there were occasionally grazing cattle. The field site was surrounded by forest and agricultural land. There were no major roads near the field site and nearby traffic emissions were negligible. The closest power plant was Plant Bowen, which was located ∼25 km north of the field site. The sampling period was characterized by moderate temperatures (24.0 ∘C average, 32.6 ∘C max, 9.5 ∘C min) and high relative humidities (68.9 % RH average, 100 % RH max, 21.6 % RH min). The study-averaged diurnal trends of relative humidity, temperature and solar radiance are shown in Fig. S1 in the Supplement. Data reported are displayed in eastern daylight time (EDT). Volumetric gas concentrations reported are at ambient temperature and relative humidity.

Figure 1The CIMS instrument and inlet configuration used in the field study. The automated three-way sampling valve is shown in the inset. The figure was adapted from Liao et al. (2011).
2.2 CIMS
2.2.1 CIMS instrument and air sampling inlet
The CIMS instrument was housed in a temperature-controlled trailer during the field study. The inlet configuration and CIMS instrument used in this study is shown in Fig. 1. Since HNO3 and organic acids may condense on surfaces, an inlet configuration with a minimal wall interaction was used. This inlet configuration was previously described by Huey et al. (2004) and Nowak et al. (2006); hence, only a brief description will be provided here. The inlet was a 7.6 cm ID aluminum pipe that extended ∼40 cm into the ambient air through a hole in the trailer's wall. This positioned the inlet ∼2 m above the ground. A donut-shaped ring was attached to the ambient sampling port of the pipe to reduce the influence of crosswinds on the pipe's flow dynamics. This ring was wrapped with a fine wire mesh to prevent insects from being drawn through the pipe. A flow of ∼2800 L min−1 was maintained in the pipe using a regenerative blower (AMETEK Windjammer 116637-03). Part of this flow (7 L min−1) was sampled through a custom-made three-way PFA Teflon valve, which connected the pipe's center to the CIMS sampling orifice. The valve was maintained at a temperature of 40 ∘C in an insulated aluminum oven and could be switched automatically between ambient and background modes. In ambient mode, ambient air was passed through a 25 cm long, 0.65 cm ID Teflon tube into the CIMS instrument. In background mode, ambient air was first drawn through an activated charcoal scrubber before being delivered into the CIMS instrument. A small flow of ambient air (∼0.05 L min−1) was continuously passed through the scrubber to keep it at equilibrium with ambient humidity levels. Most of the sampled air flow (6.7 L min−1) was exhausted using a small diaphragm pump. The rest of the sampled air flow (0.3 L min−1) was introduced into the CIMS instrument through an automatic variable orifice, which was used to maintain a constant sample air mass flow.
The CIMS instrument was comprised of a series of differentially pumped regions: a flow tube, a collisional dissociation chamber, an octopole ion guide, a quadrupole mass filter and an ion detector. These sections were evacuated by a scroll pump (Edward nXDS 20i), a drag pump (Adixen MDP 5011) and two turbo pumps (Varian Turbo-V301), respectively. Ambient air was drawn continuously into the flow tube. A flow of 3.7 slpm (standard liters per minute) of N2 containing a few parts per million of SF6 (Scott-Marrin Inc.) was passed through a 210Po ion source into the flow tube. anions, which were produced via associative electron attachment in the 210Po ion source, reacted with the sampled ambient air in the flow tube to generate analyte ions. Arnold and Viggiano (2001) showed that the formation of cluster ions from the reaction of and water vapor is enhanced at high flow tube pressures. Since these cluster ions could interfere with mass spectral analysis, the flow tube was maintained at a low pressure (∼13 mbar, 0.5 % uncertainty) in this study to reduce both the water vapor concentration and reaction time in the flow tube, thus minimizing interferences from reaction with water vapor. The analyte ions exited the flow tube and were accelerated through the collisional dissociation chamber (CDC), which was maintained at ∼0.8 mbar (10 % uncertainty). The molecular collisions in the CDC served to dissociate weakly bound cluster ions into their core ions to simplify mass spectral analysis. Flow tube and CDC pressures were controlled by the automatic variable orifice. For this study, the CDC was operated at a relatively high electric field (∼113 V cm−1) to efficiently dissociate cluster ions. The resulting ions were then passed into the octopole ion guide (maintained at mbar), which collimated the ions and transferred them into the quadrupole mass spectrometer (maintained at mbar) for mass selection and detection. It should also be noted that we always used gloves when working on the CIMS instrument during this study to limit contamination of lactic acid emissions from human skin. In addition, we kept people away from the front of the –CIMS sampling inlet to minimize lactic acid interferences as well.
Ions monitored during the field study included mass-to-charge ratios (m∕z) of 45, 59, 65, 73, 75, 79, 82, 87, 89, 101, 102, 103, 108, 117, 131 and 148. The assignment of these ions will be discussed in section 3. The dwell time for each m∕z ion was set to 0.5 s and measurements of these ions were obtained every ∼13 s, which resulted in a ∼4 % ( %) duty cycle for each ion monitored. The data presented in this paper were averaged to 1 h intervals unless stated otherwise.
2.2.2 Background and calibration measurements during field study
Background measurements were performed every 25 min during the field study. During each background measurement, the sampled air flow was passed through an activated charcoal scrubber prior to delivery into the CIMS instrument. The scrubber removed >99 % of the targeted species in ambient air. Calibration measurements were performed every 5 h during the field study through standard additions of 34SO2 and either formic or acetic acid to the sampled air flow. Each background and calibration measurement period lasted ∼4 and ∼3.5 min, respectively, which not only gave the scrubber (during background measurements) and flow tube ample time to equilibrate when the three-way PFA Teflon valve was switched between ambient and background modes, but also allowed us to obtain good averaging statistics during background and calibration measurements. A 1.12 ppm 34SO2 gas standard was used as the source of the sulfur standard addition. A total of 1.85 ppb of 34SO2 was added to sampled air flow during calibration measurements. The formic and acetic acid calibration sources were permeation tubes (VICI Metronics) with emission rates of 91 and 110 ng min−1, respectively. The emission rates were measured by scrubbing the output of the permeation tube in deionized water via a gas impinger immersed in water, which was then analyzed for formate and acetate using ion chromatography (Thermo Fisher Scientific). Eight samples of each acid were analyzed over the course of the field study and the standard deviations of the permeation rates were ≤6 %. Either 6.75 ppb of formic acid or 5.87 ppb of acetic acid was added to sampled air flow during calibration measurements. The CIMS instrument sensitivity measured by the ion signal (m∕z 104) was similarly applied to all the other measured species (except for formic and acetic acids) using relative sensitivities determined in laboratory studies. The calibrant ion signals were also used to calibrate ambient ion signals and determine ambient SO2 concentrations as discussed in Sect. 3.2.5.
2.2.3 Laboratory calibration
To estimate the levels of sensitivities for a series of acids of atmospheric relevance, HNO3, oxalic, butyric, glycolic, propionic and valeric acid standard addition calibrations were performed in postfield laboratory work. Many of these acids have previously been measured in rural and urban environments (Kawamura et al., 1985; Veres et al., 2011; Brophy and Farmer, 2015). The response of the CIMS acid signals was measured relative to the sensitivity of 34SO2 in these calibration measurements. The HNO3 calibration source was a permeation tube (KIN-TEK) with a permeation rate of 39 ng min−1, which was measured using UV optical absorption (Neuman et al., 2003). Solid or liquid samples of oxalic (Sigma Aldrich, ≥99 %), butyric (Sigma Aldrich, ≥99 %), glycolic (Sigma Aldrich, 99 %), propionic (Sigma Aldrich, ≥99.5 %) and valeric (Sigma Aldrich, ≥99 %) acids were used in calibration measurements. The acid sample was placed in a glass impinger, which was immersed in an ice bath to provide a constant vapor pressure. A flow of 6 to 10 mL min−1 of N2 was passed over the organic acid in the glass impinger. This organic acid air stream was then diluted with varying flows of N2 (1 to 5 L min−1) to achieve different mixing ratios of the organic acid. Mixing ratios were calculated from either the acid's emission rate from the impinger or the acid's vapor pressure. The emission rate of gas-phase oxalic acid from the impinger was measured by scrubbing the output in deionized water using the same method for calibrating the formic and acetic acid permeation tubes, followed by ion chromatography analysis for oxalate. Three samples were analyzed and the emission rate was determined to be 14 ng min−1 with a standard deviation of <5 %. The vapor pressures of butyric and propionic acids at 0 ∘C were measured using a capacitance manometer (MKS Instruments). The vapor pressures of glycolic and valeric acids at 0 ∘C were estimated using their literature vapor pressures at 25 ∘C and enthalpies of vaporization (Daubert and Danner, 1989; Lide, 1995; Acree and Chickos, 2010).
Attempts to generate a calibration plot for pyruvic acid using its liquid sample (Sigma Aldrich, 98 %) and the setup described above were unsuccessful as this acid was found to interact very strongly with surfaces. Glyoxylic acid calibrations were not performed due to the presence of impurities in the glyoxylic acid monohydrate solution used (Sigma Aldrich, 98 %), which resulted in the appearance of ions not attributed to glyoxylic acid. We attempted to generate calibration plots for malonic (Sigma Aldrich, ≥99.5 %), succinic (Sigma Aldrich, 99 %) and glutaric (Sigma Aldrich, 99 %) acids by passing N2 over their solid samples at room temperature. However, it was not possible to generate large enough gas-phase concentrations for calibration since these organic acids have very low vapor pressures. The vapor pressures of malonic, succinic and glutaric acids are , and kPa at 298 K, respectively (Booth et al., 2010), which are at least 2 orders of magnitude lower than the organic acids that we calibrated. Although heating up the malonic, succinic and glutaric acid samples will likely generate sufficient vapors for calibration, this method of generating calibrant gases will lead to large measurement uncertainties due to vapors condensing out and adhering onto surfaces at room temperature prior to introduction into the CIMS instrument.
2.2.4 Detection limits and measurement uncertainties
The detection limits of the organic acids were estimated as 3 times the standard deviation values (3σ) of the ion signals measured during background mode. Although each background measurement period lasted ∼4 min, ion signals of the different organic acids took up to 1.5 min to stabilize during the switch between ambient, calibration and background measurements during the field study. Thus, ion signals measured during the first 1.5 min were not included in the calculation of the average and standard deviation of ion signals measured during background mode. Table 1 summarizes the average detection limits of calibrated organic acids for 2.5 min averaging periods, which corresponds to the length of a background measurement with a 4 % duty cycle for each m∕z. The mean difference between successive background measurements ranged from 1 to 40 ppt for the different organic acids. Future work will focus on reducing the instrument background, and therefore improving the detection limits of these organic acids.
The uncertainties (1σ) in our ambient measurements of formic, acetic and oxalic acid concentrations originated from CIMS and ion chromatography calibration measurements. The ion chromatography measurement uncertainty was estimated to be 10 %. For formic and acetic acids, which were calibrated during the field study using permeation tubes, their CIMS measurement uncertainties were estimated to be 6 % and 7 %, respectively, based on 1 standard deviation of the acids' calibrant ion signals. For oxalic acid, which was calibrated in postfield laboratory work, the CIMS measurement uncertainty was estimated to be 9 % based on 1 standard deviation of the 34SO2 sensitivity (3 %), the acid's calibrant ion signals (7 %) and linear fit of the calibration curve (5 %). Hence, the uncertainties in our ambient measurements of formic, acetic and oxalic acid concentrations were estimated to be 12 %, 12 % and 14 %, respectively.
For nitric acid, which was calibrated in postfield laboratory work using a permeation tube and UV optical absorption, the uncertainty in its ambient concentrations was estimated to be 13 % based on uncertainties in UV absorption measurements (10 %) as well as 1 standard deviation of the acid's UV absorption signals (3 %), 34SO2 sensitivity (3 %) and acid's calibrant ion signals (8 %). For propionic acid, which was calibrated in postfield laboratory work using vapor pressures measured by a capacitance manometer, the uncertainty in its ambient concentrations was estimated to be 14 % based on the vapor pressure measurement uncertainty (10 %) and 1 standard deviation of the 34SO2 sensitivity (3 %), the acid's calibrant ion signals (8 %) and linear fits of the acid's calibration curves (3 %). Ambient concentrations and the corresponding uncertainties of glycolic, valeric and butyric acids were not quantified.
Table 1Summary of organic acids of interest, their detection limits and sensitivities of their X− and ionsa.
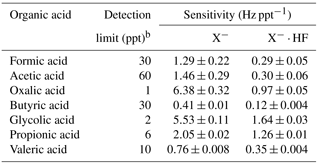
a Only organic acids with calibration measurements are shown. b Detection limits are approximated from 3 times the standard deviation values (3σ) of the ion signals measured during background mode. Shown here are the average detection limits of the organic acids for 2.5 min averaging periods, which corresponds to the length of a background measurement at a 4 % duty cycle for each mass.
2.3 WSOCg measurements
WSOCg was measured with a mist chamber coupled to a total organic carbon (TOC) analyzer (Sievers 900 series, GE Analytical Instruments). Ambient air first passed through a Teflon filter (45 mm diameter, 2.0 µm pore size, Pall Life Sciences) to remove particles in the air stream. This filter was changed every 3 to 4 days. The particle-free air was then pulled into a glass mist chamber filled with ultrapure deionized water at a flow rate of 20 L min−1. The mist chamber scrubbed soluble gases with Henry's law constants greater than 103 M atm−1 into deionized water (Spaulding et al., 2002). The resulting liquid samples from the mist chamber were analyzed by the TOC analyzer. The TOC analyzer converted the organic carbon in the liquid samples to carbon dioxide using UV light and chemical oxidation. The carbon dioxide formed was then measured by conductivity. The amount of organic carbon in the liquid samples is proportional to the measured increase in conductivity of the dissolved carbon dioxide. Each WSOCg measurement lasted 4 min. Background WSOCg measurements were performed for 45 min every 12 h by stopping the sample air flow and rinsing the sampling lines with deionized water. The TOC analyzer was calibrated using different concentrations of sucrose (as specified by the instrument manual) before and after the field study. The limit of detection was 0.4 µg C m−3. The measurement uncertainty was estimated to be 10 % based on uncertainties in the sample air flow, liquid flow and TOC analyzer uncertainty. The mist chamber and upstream particle filter were located in an air-conditioned building so were generally below ambient temperature. Hence, evaporation of collected particles (which will lead to positive artifacts in WSOCg measurements) are not expected to be significant.
2.4 Supporting gas measurements
Supporting gas measurements were provided by a suite of instruments operated by the SEARCH network. A nondispersive infrared spectrometer (Thermo Fisher Scientific) provided hourly CO measurements. A UV absorption analyzer (Thermo Fisher Scientific) provided hourly O3 measurements. A gas chromatography–flame ionization detector (GC-FID, Agilent Technologies) provided hourly VOC measurements.
3.1 General CIMS field performance
3.1.1 ion chemistry with organic acids
CIMS measurements of atmospheric constituents use ion–molecule reactions to selectively ionize compounds of interest in the complex matrix of ambient air and produce characteristic ions. The reactions of with the organic acids (HX) proceed through Reactions (R1a) to (R1c) and gave similar products to those reported previously for reactions with inorganic acids (Huey et al., 1995): , X− and where X− is the conjugate base of the organic acid (Reactions R1a–R1c).
The effective branching ratios of the , X− and product ions can be impacted by the field strength of the CDC. The ion (m∕z 127, Reaction R1c) is a common reaction product of the reactions of with many species and is probably thermodynamically driven by the formation of HF (Huey et al., 1995). Unfortunately, the production of does not allow for the selective detection of any atmospheric species. In addition, the larger the branching ratio of the channel, the lower the CIMS sensitivity is to an individual acid since the effective rate constants for the X− and channels are lower.
The reaction of with formic acid and oxalic acid also produced ions (m∕z 108). These reactions are probably thermodynamically driven by the formation of CO2 and HF:
We used the X− and/or ions to determine ambient organic acid concentrations since these ions are characteristic of the individual acids. For all the organic acids, the ion signal is substantially lower than that of the X− ion for the conditions in this study. However, this is probably largely due to the relatively high collision energy used in the CDC, which led to efficient dissociation of the fluoride adducts to form X− ions. Consequently, only the proton transfer channel (Reaction R1b) is used to quantify most of the organic acids in the field study. The exceptions are formic and acetic acid, as discussed in Sect. 3.2.1 and 3.2.2
Table 1 shows a summary of the sensitivities of X− and ions of some common atmospheric organic acids. The average sensitivities of the HCOO− (m∕z 45) and (m∕z 65) ions of formic acid were 1.29±0.22 and 0.29±0.05 Hz ppt−1, respectively, while the average sensitivities of the CH3COO− (m∕z 59) and (m∕z 79) ions of acetic acid were 1.46±0.29 and 0.30±0.06 Hz ppt−1, respectively. A weak 210Po ion source (< 1 mCi) was used by the –CIMS instrument during the field study; hence, these sensitivities will be substantially higher if a stronger radioactive source is used. Postfield laboratory work suggests that the sensitivities may increase by as much as a factor of 5 for a new commercial 20 mCi 210Po ion source. Nevertheless, these sensitivities are compared to formic and acetic acid sensitivities measured by a high-resolution time-of-flight chemical ionization mass spectrometer (Aerodyne Research Inc.) that utilized I− reagent ions during the field study. Only the formic and acetic acid sensitivities were compared since laboratory calibrations were not performed to determine the sensitivities for oxalic, butyric, glycolic, propionic and valeric acids by I−–CIMS. Although the formic acid sensitivity measured by I−–CIMS (1.33±0.28 Hz ppt−1) was comparable to that measured by –CIMS, the acetic acid sensitivity measured by I−–CIMS (<0.1 Hz ppt−1) was substantially lower than that measured by –CIMS. Previous studies have similarly reported low acetic acid sensitivity measured by I−–CIMS (Aljawhary et al., 2013; Lee et al., 2014).
Since many recent studies use I− as a reagent ion to measure many compounds, the measured sensitivities to organic acids are compared with those of I− reported by Lee et al. (2014, 2018). However, it is important to note that the absolute and I− sensitivities values are specific to the respective instruments and their configuration. The sensitivity to individual compounds depends on a variety of instrument parameters (e.g., flow rates, pressures, electric fields, ion source activity) that control ion production and transmission, reaction time, declustering efficiency, etc. Consequently, this analysis serves primarily as a qualitative comparison of and I− sensitivity.
Although the I− sensitivity to formic acid (2.9 Hz ppt−1) reported by Lee et al. (2014) is higher than that of (1.29 Hz ppt−1), the sensitivities for the other organic acids (i.e., acetic, oxalic, glycolic and propionic acids) are substantially higher than those of I− (Table S1a). The CIMS method is particularly sensitive to oxalic, propionic and glycolic acids, which are expected to be present at low concentrations in the atmosphere. The sensitivities of and I− to SO2, HNO3 and HCl can also be compared (Table S1b). The sensitivities of SO2 and HCl are significantly higher than that of I− reported by Lee et al. (2018). However, I− is more sensitive to HNO3.
3.1.2 Characterization of interferences
is very sensitive to many trace atmospheric species but its reactions with water vapor and O3 when sampling ambient air can lead to issues with both selectivity and stability. For example, reacts nonlinearly with water vapor to form a series of cluster ions (Huey et al., 1995; Arnold and Viggiano, 2001). also reacts efficiently with O3 to form , which is rapidly converted to in ambient air (Slusher et al., 2001). These reactions can deplete as well as form a variety of potentially interfering ions from secondary reactions (e.g., and ions) that depend on more abundant atmospheric species. For these reasons, efforts were made to minimize interferences by limiting reaction times and the flow sampled into the CIMS instrument. This was accomplished by sampling only 0.3 L min−1 of air through the variable orifice into the flow tube and maintaining the flow tube at a low pressure (∼13 mbar). The 0.3 L min−1 sampled air flow is diluted by 3.7 slpm of N2∕SF6 flow in the flow tube. The ratio of the sampled air flow to the N2∕SF6 flow introduced into the flow tube is approximately 1 : 13. While the high N2∕SF6 flow (3.7 slpm) passed through the radioactive source into the flow tube increased the reagent ion signal, the high dilution of the sampled air flow in the flow tube reduced the CIMS instrument sensitivity by decreasing the number density of the analytes.
Figure 2 shows a mass spectrum of ambient air. Interference peaks at m∕z 39 ( and , respectively) can be attributed to the presence of water and O3, respectively. The reagent ion is present at m∕z 146. The reagent ion signal was saturated, and this caused the sharp drop in the m∕z 146 signal, as shown in Fig. 2. Since the reagent ion signal was saturated for the entire field study, we monitored the ion signal of its isotope to determine if the reaction of with ambient water vapor ( to g cm−3) and O3 (2.1 to 82.4 ppb) depleted reagent ions. Figure S2a shows the time series of the ion signal and ambient water vapor concentration for the entire field study. Despite fluctuations in ambient water vapor and O3 concentrations, the ion signal was relatively constant for the entire field study, with a standard deviation of <3 %. This indicates that the reaction of with ambient water vapor and O3 did not significantly deplete the reagent ions during the field study.
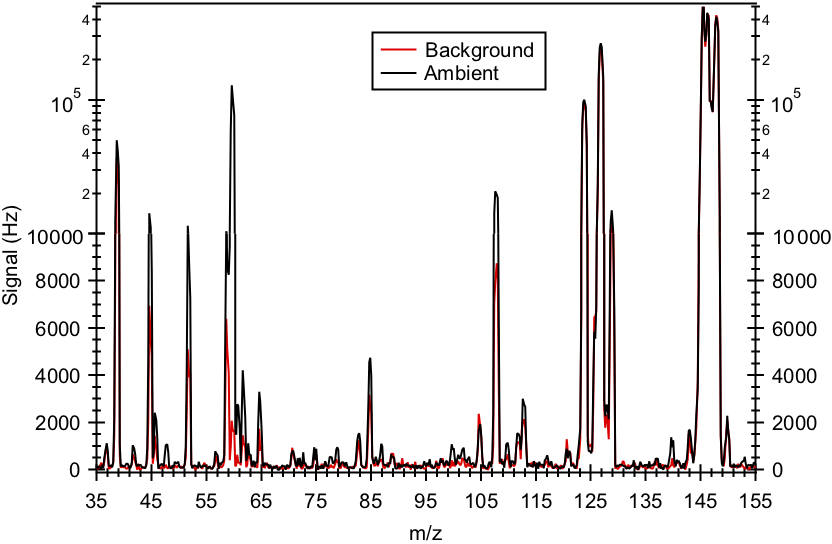
Figure 2Mass spectrum of ambient air and background measured in Yorkville, Georgia, on 8 September 2016 using . Note that the reagent ion signal (at m∕z 146) is saturated, causing the sharp drop in its signal. As a result, the ion signal of its isotope (at m∕z 150) was monitored to determine if the reaction of with ambient water vapor and O3 depleted reagent ions.
The ion signal was used to monitor the CIMS SO2 sensitivity during the field study. Figure S2b shows the time series of the ion signal ratio obtained in calibration measurements. There is a ∼50 % increase in the ion signal ratio on 28 September 2016, indicating an increase in the CIMS instrument sensitivity. The increase in CIMS instrument sensitivity is due to the decrease in ambient water vapor concentrations on 28 September 2016 (Fig. S2a). Previous laboratory and field studies showed that this was due to the hydrolysis of , which led to the loss of this ion and diminished sensitivity at higher levels of ambient water vapor (Arnold and Viggiano, 2001; Slusher et al., 2001). However, the SO2 sensitivity at only varied within a factor of 2 for the entire field study with a clear relationship to water vapor (Fig. S2c). The SO2 sensitivity did not show any obvious dependence on ambient O3 concentrations (Fig. S2d).
The formic (HCOO− at m∕z 45 and at m∕z 65) and acetic ( at m∕z 79) acid ions did not show any obvious dependence on ambient water vapor and O3 concentrations during calibration measurements (Fig. S3). Therefore, we do not expect the sensitivities of the X− and ions of the studied organic acids to depend on ambient water vapor and O3 concentrations. We accounted for water vapor dependence of the ion signal using the linear relationship between the ion sensitivity and ambient water vapor concentration (Fig. S2c) in our postfield calibrations, where the response of the CIMS acid signals were measured relative to the of the 34SO2 sensitivity.
3.1.3 Background and calibration measurements
Figure S4 shows an example of the CIMS instrument response during the switch between background, calibration and ambient measurements of formic and acetic acids during the field study. The 13 s time resolution data were used to determine the CIMS instrument time response. Formic (m∕z 45, 65 and 108) and acetic (m∕z 79) acid ion signals took ∼1.5 min to reach a steady state after being switched between ambient, calibration and background measurements (Fig. S4a and c).
The CIMS response time to a compound is governed primarily by the compound's propensity to adhere to surfaces. The decays in the formic and acetic acid ion signals and times required for them to reach steady state after the removal of calibration gases during the switch from standard addition calibration to ambient sampling were used to determine the CIMS response time. The signal decays were fitted using double exponential functions. For formic acid, the m∕z 45, 65 and 108 ion signals decayed to 1∕e2 in 37±2, 33±2 and 32±2 s, respectively (Fig. S4b). For acetic acid, the m∕z 79 ion signal decayed to 1∕e2 in 42±2 s (Fig. S4d).
3.2 Ambient measurements
3.2.1 Formic acid
Figure 2 shows typical mass spectra obtained under background and measurement modes during the field study. The reagent ion is present at m∕z 146. One of the prominent species in the mass spectrum is formic acid, which is detected as HCOO− and at m∕z 45 and 65, respectively. Our laboratory studies demonstrated that the reaction of formic acid with also produced a large fraction of ions at m∕z 108. The reaction of with oxalic acid also produced ions, but its product ion yield is low and gas-phase oxalic acid is not present in large concentrations. In addition, is present in the mass spectrum obtained under background mode but the background ion signals are lower than those typically observed in measurement mode at the Yorkville site. As a result, we determined the ambient formic acid concentrations using the HCOO−, and ions. Figure 3a shows a scatter plot comparing the ambient formic acid concentrations measured at Yorkville using the HCOO−, and ions. Linear regression analysis reveals that the formic acid concentrations determined by the three ions are highly correlated (R2=0.99), with slopes exhibiting a near 1 : 1 correlation. The excellent correlation between these three ions and the agreement with laboratory data indicate that formic acid is selectively measured by this method.
The time series of formic acid, temperature and solar radiation measured at Yorkville are shown in Fig. 3b. Formic acid concentrations ranged from 40 ppt to 4 ppb during the field study, with strong and consistent diurnal trends. The day-to-day variability in formic acid concentrations are associated with changes in solar radiation and temperature. Higher formic acid concentrations are measured during warm and sunny days, similar to formic acid measurements performed in Centreville, rural Alabama, during the 2013 Southern Oxidant Aerosol Study (SOAS) (Brophy and Farmer, 2015; Millet et al., 2015). Figure 3c shows the study-averaged diurnal profiles of formic acid and solar irradiance. Formic acid started to increase at 07:30 EDT, which coincided with a sharp increase in solar irradiance. Concentrations continued to increase throughout the day and peaked at 18:30 EDT, which coincided with the approximate time just before solar irradiance reached zero. Formic acid then decreased continuously throughout the night.
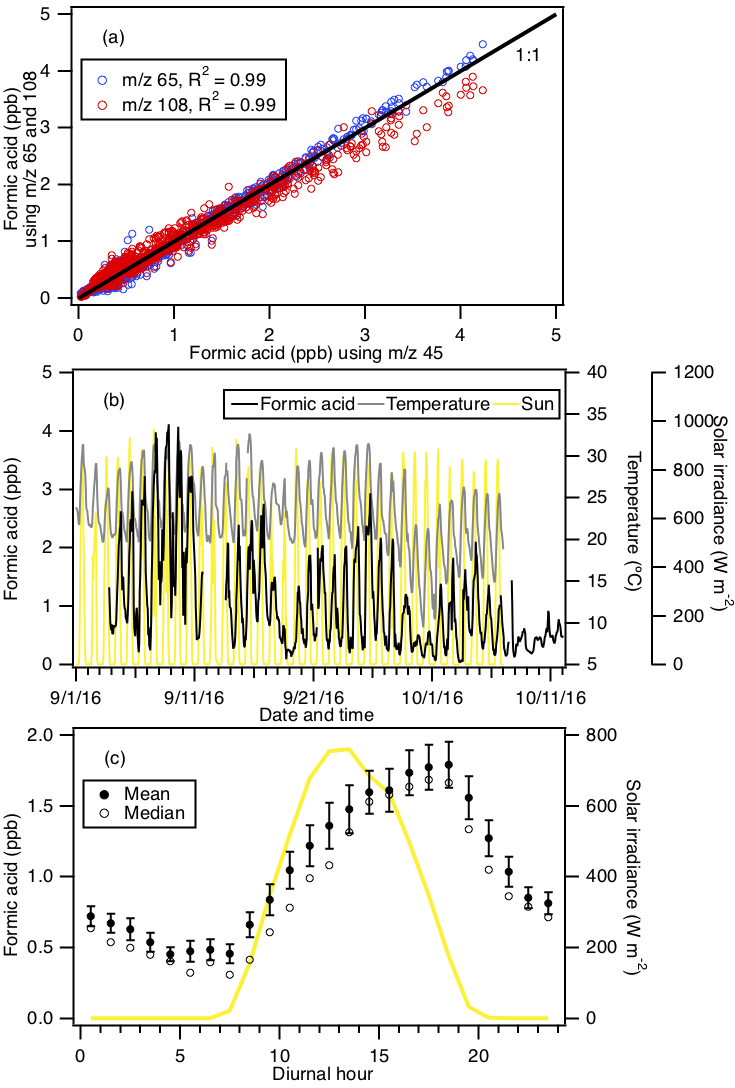
Figure 3(a) Scatter plot comparison of ambient formic acid concentrations determined using mass peaks m∕z 45, 65 and 108. The three datasets correlated well with one another (R2=0.99). Linear regression of the data gave slopes of 1 (for m∕z 65) and 0.95 (for m∕z 108), indicating that all three mass peaks can be used to determine the formic acid concentration. (b) Time series of formic acid concentration, temperature and solar irradiance. All the data are displayed as 1 h averages. (c) Diurnal profiles of formic acid concentration (symbols) and solar irradiance (yellow line). All the concentrations represent averages in 1 h intervals and the standard errors are plotted as error bars.
The immediate early-morning increase in formic acid observed in this field study is similar to that seen during the SOAS study (Millet et al., 2015). However, there are some differences in the formic acid diurnal cycles measured in this field study and the SOAS study. Formic acid peaked at 15:30 EDT during SOAS, approximately 3 h before solar irradiance decreased to zero. In contrast, formic acid concentrations only started to decrease at sunset (at 19:30 EDT) in this study. This suggests that there may be differences in the types and/or magnitudes of formic acid sources and sinks in these two field studies. Land cover and/or land use differences may have contributed to differences in formic acid sources and sinks at the Centreville and Yorkville field sites. The area surrounding the Yorkville field site is covered primarily by hardwood mixed with farmland and open pastures. In contrast, the Centreville field site is surrounded by forests comprised of mixed oak–hickory and loblolly trees (Hansen et al., 2003). It is also possible that seasonal differences contributed to differences in formic acid sources and sinks in the two field studies. The SOAS campaign took place in the middle of summer (1 June to 15 July 2013) when biogenic emissions are typically higher, while this field study took place in early fall when biogenic emissions are lower due to cooler temperatures. For example, the average concentration of isoprene (a formic acid source) in this study (1.21 ppb) is lower than that in SOAS (1.92 ppb; Millet et al., 2015). Despite these differences, our overall results are similar to the formic acid measurements performed in SOAS in both magnitude and diurnal variability.
3.2.2 Acetic acid
Acetic acid is detected with as CH3COO− and at m∕z 59 and 79, respectively. However, these ions are subject to interferences from the reaction of with water vapor present in the sampled ambient air. Two of these interfering ions, and , occur at m∕z 59 and 79, respectively. As discussed earlier, we minimized the impact of these interferences by diluting the sample flow into the CIMS instrument and running the CDC at a high collision energy to dissociate the HF cluster ions. As expected from cluster bond strengths, we found that larger HF cluster ions dissociated more easily than smaller ones. For example, at a CDC electric field of ∼113 V cm−1 (the configuration used in this field study), virtually all of the 3 cluster ions dissociated while very few of the cluster ions dissociated. This indicates that the m∕z 79 channel for acetic acid is more immune to interference from water vapor than the m∕z 59 channel. This is supported by the observation that the background ion signal at m∕z 59 (R2=0.50) is more highly correlated with ambient water vapor concentrations than the background ion signal of m∕z 79 (R2=0.30). In addition, the m∕z 59 ion is subjected to interference from the reaction of with O3 present in the sampled ambient air. reacts with O3 in the presence of CO2 to form at m∕z 60 (Slusher et al., 2001). As shown in Fig. 2, the large peak at m∕z 60 is a potential interference to the m∕z 59 signal. As the background scrubber also removed O3 from the ambient air, there is a large difference in the m∕z 60 ion signal between the measurement and background modes (∼100 000 Hz). Thus, even a bleed of a few percentage points of m∕z 60 over to m∕z 59 can lead to an overestimation of ambient acetic acid concentrations. For these reasons, we used m∕z 79 () to determine ambient acetic acid concentrations even though this channel has a lower sensitivity than the m∕z 59 channel (X−).
The time series of acetic acid, temperature and solar radiation measured at Yorkville are shown in Fig. 4a. Acetic acid concentrations ranged from 30 ppt to 3 ppb during the field study. The day-to-day variability in acetic acid concentrations resembled the behavior of formic acid concentrations, with higher concentrations being measured during warm and sunny days. Figure 4b shows the study-averaged diurnal profiles of acetic acid and solar irradiance. The diurnal profile of acetic acid is similar to that of formic acid with a more pronounced evening maximum. Acetic acid started to increase at 07:30 EDT and built up throughout the day, peaking at 19:30 EDT and decreasing continuously overnight. In general, acetic acid concentrations are well correlated with (R2=0.67) and comparable in magnitude (∼60 % on average) to formic acid. The study-averaged formic acid ∕ acetic acid concentration ratio (1.65) is comparable to ratios from previous field studies in rural and urban environments (Talbot et al., 1988, 1995, 1999; Granby et al., 1997; Khare et al., 1999; Baboukas et al., 2000; Singh et al., 2000; Kuhn et al., 2002; Baasandorj et al., 2015; Millet et al., 2015).

Figure 4(a) Time series of acetic acid concentration, temperature and solar irradiance. All the data are displayed as 1 h averages. (b) Diurnal profiles of acetic acid (symbols) and solar irradiance (yellow line). All the concentrations represent averages in 1 h intervals and the standard errors are plotted as error bars.
3.2.3 Larger organic acids
In addition to formic and acetic acid, eight other ions were monitored during the field study: m∕z 73, 75, 87, 89, 101, 103, 117 and 131. These ions were chosen as they had significant signals when ambient air was sampled and were not obviously formed from reaction with water vapor or O3. Since the CIMS instrument utilized in this study only had unit mass resolution, these ions are the sum of all organic acid isomers and isobaric organic acids of the same molecular weight as well as other product ions from species that might react with . We will refer to organic acids with m∕z 75, 87, 101, 103, 117 and 131 by their ion masses. We assign the m∕z 73 ion as the X− ion of propionic acid because it does not have organic acid isomers and isobaric species at that m∕z. In addition, real-time ion chromatography measurements of aerosol composition performed during the field study demonstrated the presence of particulate oxalic acid (Nah et al., 2018). For this reason, we assign the m∕z 89 ion as the X− ion of oxalic acid. As shown in Nah et al. (2018), the gas-particle ratios of the organic acids depend on their thermodynamic conditions, which are dependent on the acid's physicochemical properties, ambient temperature, particle water and pH. Since the measured gas-particle partitioning ratios of oxalic acid (calculated using the CIMS and ion chromatography measurements) are in good agreement with their corresponding thermodynamic predictions (Nah et al., 2018), this indicated that our assignment of the m∕z 89 ion to oxalic acid is reasonable. In addition, the high sensitivity of to oxalic acid also helps limit interferences due to other acids. Particulate formic acid and acetic acid were also detected by ion chromatography during the field study, but were at much lower concentrations relative to the gas phase (Nah et al., 2018).
Figures 5 and S5 show the time series and diurnal profiles of oxalic and propionic acids and organic acids with ions m∕z 75, 87, 101, 103, 117 and 131 measured during the field study. These organic acids displayed very similar day-to-day variability as formic and acetic acids, with higher concentrations (or ion signals) being measured on warm and sunny days. The diurnal profiles of all the measured organic acids have similar diurnal trends, with their concentrations (or ion signals) reaching a maximum between 17:30 and 19:30 EDT and rapidly decreasing after sunset.
3.2.4 Comparison with WSOCg
WSOCg measurements were performed during the field study using a mist chamber coupled to a TOC analyzer. The study's average WSOCg was 3.6±2.7 µg C m−3, slightly lower than that measured during the SOAS study (4.9 µg C m−3) (Xu et al., 2017), and approximately 4 times lower than that measured in urban Atlanta, Georgia (13.7 g C m−3) (Hennigan et al., 2009). Despite being comparable in magnitude, the diurnal profiles of WSOCg measured in this study and the SOAS study are different. WSOCg measured in the SOAS study decreased at sunset, while WSOCg measured in this study decreased 2 h after sunset. Differences in WSOCg concentrations and diurnal profiles at the three different sites may be due to differences in emission sources as a result of different measurement periods, land use and/or land cover.
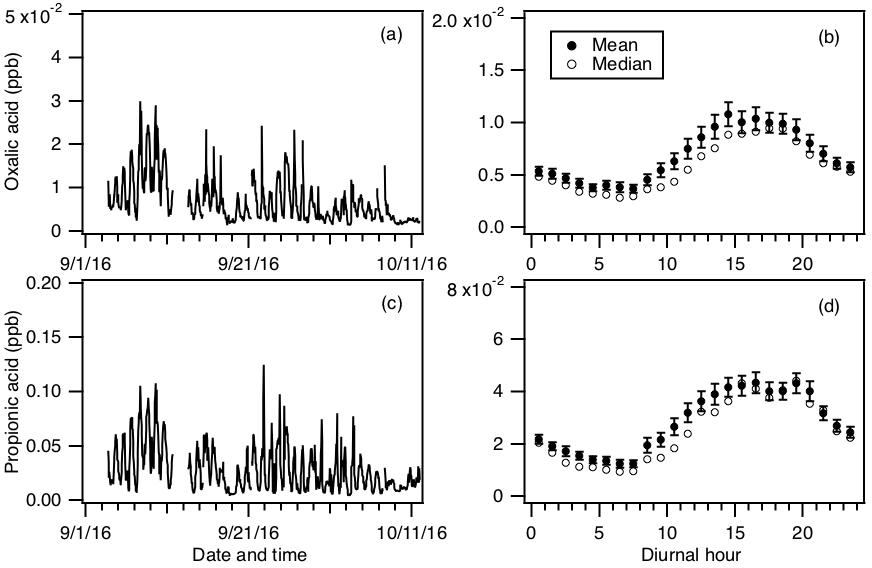
Figure 5Time series of concentrations of (a) oxalic and (c) propionic acids measured during the field study. All the data are displayed as 1 h averages. Their corresponding diurnal profiles are shown in panels (b) and (d), respectively. The diurnal profile concentrations represent averages in 1 h intervals and the standard errors are plotted as error bars.
To estimate the fraction of WSOCg that is comprised of organic acids, the total organic carbon contributed by formic, acetic, oxalic and propionic acids is compared to the WSOCg measurements. This comparison primarily serves as a check to determine if the peak assignments are plausible by ensuring that the estimated sum of organic carbon contributed by these four organic acids is less than or equal to the measured WSOCg. Figure 6a and b show the time series and diurnal profiles of WSOCg and the organic carbon contributed by the four organic acids. Formic and acetic acids comprised the majority of the total organic carbon contributed by the four organic acids (study averages of 41 % and 54 %, respectively). The carbon mass fraction of WSOCg comprised of these four organic acids ranged from 2 % to 100 %. Based on the orthogonal distance regression slope shown in Fig. 6c, the study-averaged carbon mass fraction of WSOCg comprised of the four organic acids is 22 %. The total organic carbon contributed by the four organic acids is moderately correlated with WSOCg (R2=0.42). This is likely due to the presence of other water-soluble gas-phase species (with different day-to-day variability from the organic acids) that contribute to the WSOCg. This is supported by slight differences in the diurnal profiles of WSOCg and the organic carbon contributed by the organic acids (Fig. 6b). While the diurnal profiles of WSOCg and the organic carbon contributed by the four organic acids have similar general shapes, WSOCg peaked at 21:30 EDT, approximately 2 h after the solar irradiance have decreased to zero. In contrast, the organic carbon contributed by the four organic acids start to decrease at sunset (at 19:30 EDT).
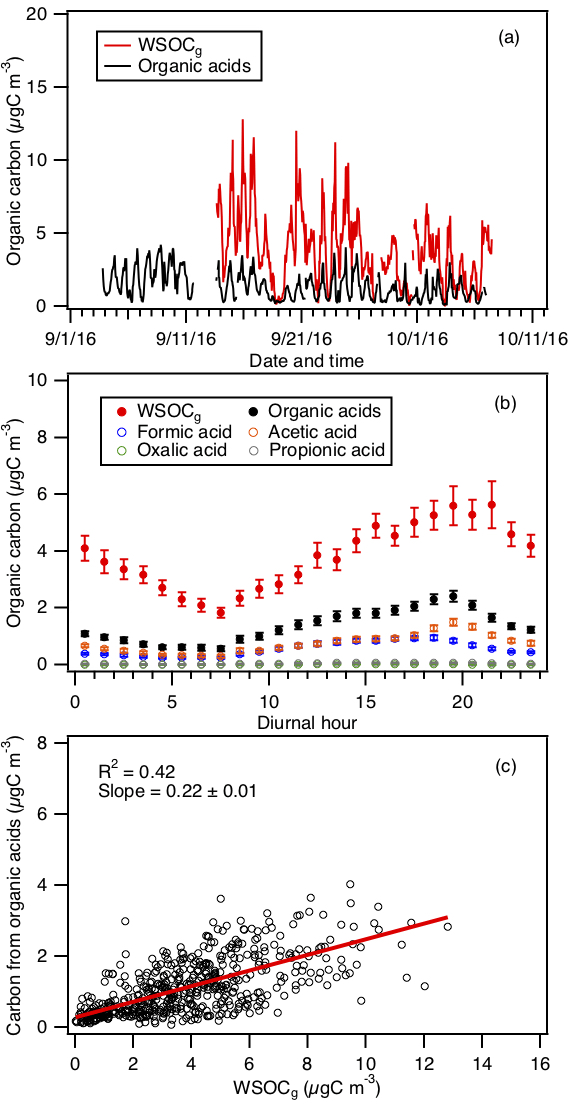
Figure 6(a) Time series of WSOCg and the total organic carbon contributed by formic, acetic, oxalic and propionic acids. All the data are displayed as 1 h averages. (b) Diurnal profiles of WSOCg and the total organic carbon contributed by formic, acetic, oxalic and propionic acids. Also shown are the diurnal profiles of the organic carbon contributed by the individual organic acids. All the concentrations represent the mean hourly averages and the standard errors are plotted as error bars. (c) Scatter plot of total organic carbon contributed by formic, acetic, oxalic and propionic acids with WSOCg.
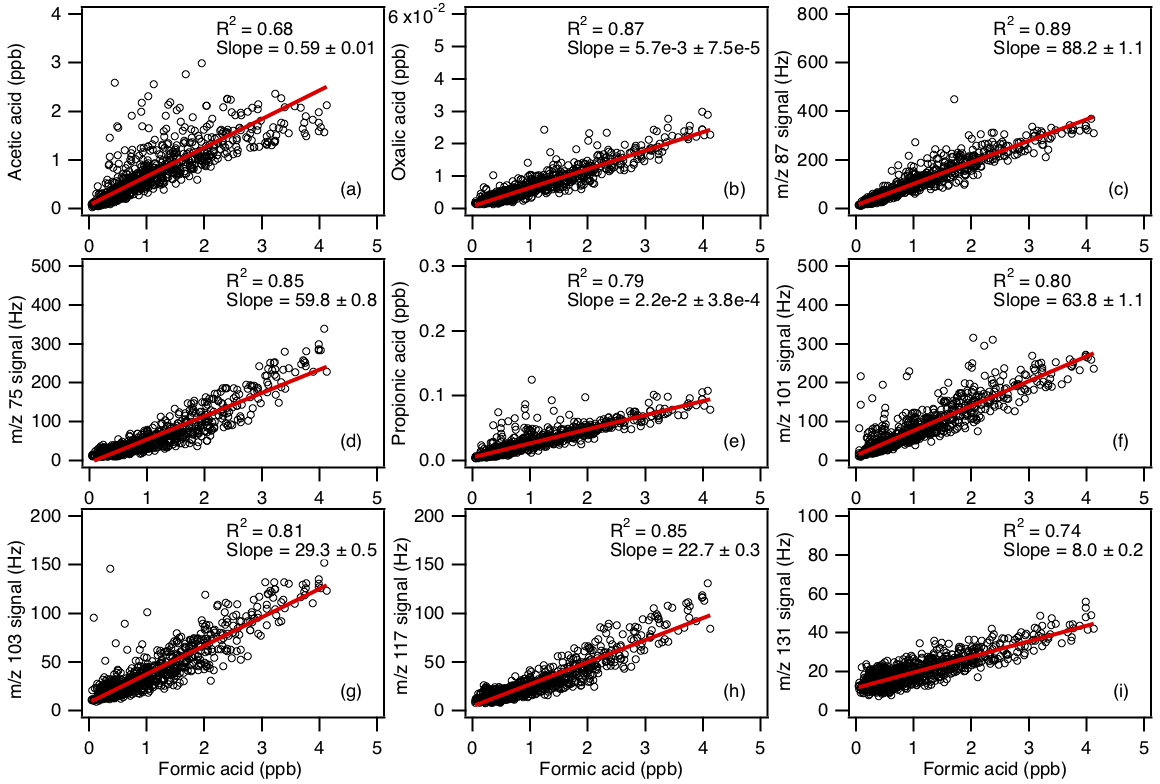
Figure 7Scatter plots of concentrations (or ion signals) of the measured organic acids with formic acid concentration. All the data are displayed as 1 h averages. Red lines shown are linear fits to the data.
3.2.5 SO2 and HNO3 observations
In addition to evaluating the field performance of the CIMS technique in gas-phase organic acid measurements, another focus of this study was to investigate the possible sources of the measured organic acids. For this reason, HNO3 and SO2 (two common anthropogenic tracers) were also measured by CIMS during the field study. Correlations between the concentrations of organic acids and those of HNO3 and SO2 were then examined to determine if the organic acids were anthropogenic in nature (Sect. 3.3). While their reactions with have multiple product channels (Huey et al., 1995), only the (m∕z 82) and (m∕z 102) ions were used for quantitative purposes:
Figure S6 shows the time series of SO2 and HNO3 measured during the field study. As expected at a rural site, SO2 and HNO3 concentrations are low most of the time (study averages of 230 and 180 ppt, respectively). However, there were occasional periods when the site was impacted by anthropogenic pollution. In particular, there are spikes in both SO2 and HNO3 concentrations lasting between 1 and 3 h throughout the study that corresponded to the site being impacted by power plant or urban emissions. Outside of these anthropogenic spikes, HNO3 showed a clear diurnal profile with a maximum at approximately 12:30 EDT, consistent with local photochemical production.
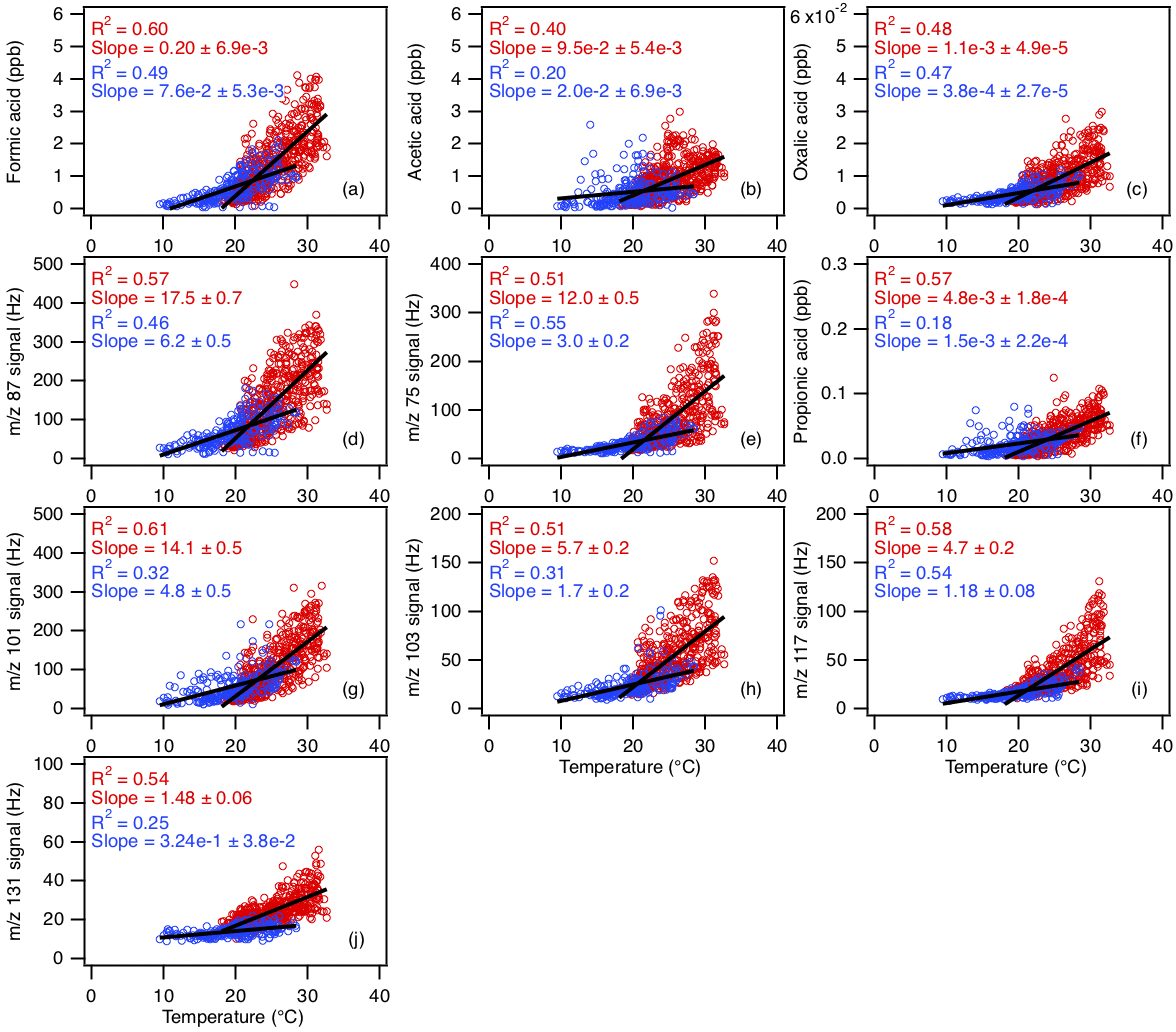
Figure 8Scatter plots of concentrations (or ion signals) of the measured organic acids with ambient temperature. The red symbols are data collected from 3 to 27 September, while the blue symbols are data collected from 28 September onwards. All the data are displayed as 1 h averages. Black lines shown are linear fits to the datasets.
3.3 Potential sources of organic acids
Correlation analysis on organic acid concentrations can provide insights into their sources. Figure 7 shows that the concentration of formic acid is strongly correlated with those of the other measured organic acids (R2=0.68 to 0.89). This suggests that these organic acids have the same or similar sources at Yorkville. The sources of organic acids can be biogenic or anthropogenic in nature. To determine if the primary sources of organic acids are of biogenic or anthropogenic origin, we first examined the correlations of organic acid concentrations with those of anthropogenic pollutants CO, SO2, O3 and HNO3. CO and SO2 are common tracers for combustion sources. The organic acid concentrations (or ion signals) are poorly correlated with CO (Fig. S7, R2=0.04 to 0.15) and SO2 (Fig. S8, R2=0.01 to 0.23), indicating that primary emissions from combustion are a minor source of organic acids in Yorkville. HNO3 and O3 are common photochemical tracers of urban air masses. The organic acid concentrations (or ion signals) are weakly correlated with O3 (Fig. S9, R2=0.11 to 0.31) and HNO3 (Fig. S10, R2=0.33 to 0.60). In addition, there is no noticeable increase in organic acid concentrations during periods of elevated CO, SO2, O3 and HNO3 concentrations when the site was impacted by pollution plumes. Formic acid ∕ CO ratios (which have been used in some studies to determine the contribution of polluted air masses) ranged between and ppb ppb−1. The ratio peaked consistently in the midafternoon, which coincided with when formic acid and CO reached their maximum and minimum, respectively. In addition, there were no spikes in the formic acid ∕ CO ratio during the study, suggesting that contributions of polluted air masses to the daily increase in formic acid are minimal. Together, these results indicate that the primary sources of organic acids in Yorkville are likely not anthropogenic in nature.
Diurnal profiles of the measured organic acids suggest that their sources are linked to higher daytime temperatures and/or photochemical processes. Figure 8 compares the concentrations (or ion signals) of organic acids against ambient temperatures measured during the study. Since there was a noticeable decrease in mean ambient temperatures starting on 28 September 2016, we grouped the datasets into two time periods (3 to 27 September and 28 September to 12 October) to better evaluate the effect of temperature on organic acid concentrations. The average temperature in the first time period (3 to 27 September) is 24.8 ∘C (32.6 ∘C max, 18.1 ∘C min), while the average temperature in the second time period (28 September to 12 October) is 19.5 ∘C (28.4 ∘C max, 9.5 ∘C min). We find that organic acid concentrations are on average higher and more highly correlated with temperatures in the warmer first time period (R2=0.40 to 0.61) compared to the cooler second time period (R2=0.18 to 0.55). These observations can be explained by temperature-dependent emissions of organic acids and their BVOC precursors. Previous studies have shown that emissions of organic acids and their BVOC precursors depend strongly on light and temperature, with substantially lower concentrations being emitted in the dark and/or at low temperatures (Kesselmeier et al., 1997; Kesselmeier, 2001; Sindelarova et al., 2014). We find that the concentration of isoprene, which was the dominant BVOC in Yorkville, has a somewhat similar diurnal profile to the organic acids and decreased with temperature on 28 September 2016 (Fig. S11). In addition, the concentrations of formic and acetic acids are moderately correlated with that of isoprene (R2=0.42 and 0.40, respectively) (Fig. S12).
Multiphase photochemical aging of ambient organic aerosols can also be a source of gas-phase organic acids (Eliason et al., 2003; Ervens et al., 2004; Molina et al., 2004; Lim et al., 2005; Park et al., 2006; Walser et al., 2007; Sorooshian et al., 2007, 2010; Vlasenko et al., 2008; Pan et al., 2009). Organic acids may be formed in the particle phase during organic aerosol photochemical aging, with subsequent volatilization into the gas phase. Real-time ion chromatography measurements of aerosol composition demonstrated the presence of particulate formic, acetic, oxalic, malonic, succinic and glutaric acids (Nah et al., 2018). However, since the ratios of gas-phase formic and acetic acid mass concentration to the total organic aerosol mass concentration are large (study averages of 40 % and 35 %, respectively) (Nah et al., 2018), it is unlikely that organic aerosol photochemical aging is a large source of formic and acetic acids. In contrast, the ratios of gas-phase oxalic, malonic, succinic and glutaric acids mass concentration to the total organic aerosol mass concentration are expected to be small, suggesting that organic aerosol photochemical aging may be an important source of these gas-phase organic acids.
In summary, the temperature dependence and diurnal profile of organic acid concentrations combined with poor correlations between organic acid concentrations and those of anthropogenic pollutants CO, SO2, O3 and HNO3 strongly suggest that the primary sources of gas-phase organic acids at Yorkville are biogenic in nature. However, our data alone do not allow us to determine if the organic acids are a result of direct emissions or photochemical oxidation of other BVOC emissions and/or organic aerosols. Partitioning of these organic acids between the gas and particle phases is discussed in another paper (Nah et al., 2018).
reacted with all of the studied organic acids to produce product ions that were characteristic of the individual acids (i.e., X− or ). These reactions all occurred at less than the maximum collisional rate due to significant yields of and , which reduced the sensitivity of the method. For the conditions employed in this study, the sensitivities of X− and ions of the organic acids ranged from 0.12 to 6.38 Hz ppt−1. The detection limits of the organic acids were approximated from 3 times the standard deviation values (3σ) of the ion signals obtained during background measurements. Limits of detection ranged from 1 to 60 ppt for 2.5 min integration periods for the organic acids studied. It should be noted that the CIMS method is particularly sensitive to oxalic, propionic and glycolic acids, which are expected to be present at low concentrations in the atmosphere. Water vapor and O3 can lead to interferences with this method but for the conditions employed in this study, they were largely limited to acetic acid measurements at m∕z 59. However, fluctuations in ambient water vapor can also lead to changes in sensitivity for the detection of some species (e.g., SO2). Uncertainties in organic acid concentrations originate primarily from calibration measurements and ranged from 12 to 14 %. Overall, the tractable mass spectra obtained by the CIMS method coupled with reasonable limits of detection and the high correlations observed between the individual organic acids demonstrated the potential of this method. Obvious next steps for the CIMS method are to compare it to other measurement methods for organic acids and to deploy the ion chemistry to a higher resolution time-of-flight mass spectrometer to reduce the potential for interferences.
The CIMS method was deployed for measurements of gas-phase organic acids in a mixed forest–agricultural area in Yorkville, Georgia, from September to October 2016. The organic acids measured in the field study were formic, acetic, propionic and oxalic acids. Ambient concentrations of these organic acids ranged from a few parts per trillion to several parts per billion. All the organic acids exhibited similar strong diurnal trends. Organic acid concentrations built up throughout the day and peaked between 17:30 and 19:30 EDT before decreasing continuously overnight. Strong correlations between organic acid concentrations indicated that these organic acids likely have the same or similar sources at Yorkville. We concluded that the organic acids were likely not due to anthropogenic emissions since they were poorly correlated with anthropogenic pollutants and their concentrations were not elevated when the site was impacted by pollution plumes. Higher organic acid concentrations were measured during warm and sunny days. Organic acid concentrations were strongly correlated with temperature during the first month of the study when ambient temperatures were high. Together, our results suggested that the primary sources of organic acids at Yorkville were biogenic in nature. Direct biogenic emissions of organic acids and/or their BVOC precursors were likely enhanced at high ambient temperatures, resulting in the observed variability of organic acid concentrations. Another potential source is the production of organic acids in the particle phase from the multiphase photochemical aging of organic aerosols followed by evaporation to the gas phase, though this source is likely not a large source of formic and acetic acids. However, given the inability of current models and photochemical mechanisms to explain formic acid observations in the southeastern US (Millet et al., 2015), it is unlikely that our observations of formic acid and larger organic acids can be explained as well. Further work (i.e., laboratory, field and modeling studies) is needed to determine how organic acids are formed in the atmosphere.
Data can be accessed by request (greg.huey@eas.gatech.edu).
The supplement related to this article is available online at: https://doi.org/10.5194/amt-11-5087-2018-supplement.
LGH, RJW and NLN planned the field study. LGH and DJT conceived the CIMS method and performed tests prior to the field study. TN, DJT, HG and APS conducted the field study. TN and HG analyzed the CIMS and WSOC data, respectively. TN, YJ and APS conducted postfield study calibrations. TN, LGH, RJW and DJT were involved in data interpretation. TN and LGH wrote the paper.
The authors declare that they have no conflict of interest.
The authors thank Eric Edgerton (Atmospheric Research and Analysis, Inc.) for providing CO, O3 and VOC measurements and meteorological data. We also thank Young Ro Lee for performing laboratory experiments to determine sensitivity to HCl.
This publication was developed under US Environmental Protection Agency
(EPA) STAR grant R835882 awarded to Georgia Institute of Technology. It has
not been formally reviewed by the EPA. The views expressed in this document
are solely those of the authors and do not necessarily reflect those of the
EPA. EPA does not endorse any products or commercial services mentioned in
this publication.
Edited by: Bin Yuan
Reviewed by: two anonymous referees
Acree, W. and Chickos, J. S.: Phase Transition Enthalpy Measurements of Organic and Organometallic Compounds. Sublimation, Vaporization and Fusion Enthalpies From 1880 to 2010, J. Phys. Chem. Ref. Data, 39, 043101, https://doi.org/10.1063/1.3309507, 2010.
Aljawhary, D., Lee, A. K. Y., and Abbatt, J. P. D.: High-resolution chemical ionization mass spectrometry (ToF-CIMS): application to study SOA composition and processing, Atmos. Meas. Tech., 6, 3211–3224, https://doi.org/10.5194/amt-6-3211-2013, 2013.
Andreae, M. O., Talbot, R. W., Andreae, T. W., and Harriss, R. C.: Formic amd Acetic Acid over the Cental Amazon Region, Brazil. 1. Dry Season, J. Geophys. Res.-Atmos., 93, 1616–1624, https://doi.org/10.1029/JD093iD02p01616, 1988.
Arnold, S. T. and Viggiano, A. A.: Turbulent ion flow tube study of the cluster-mediated reactions of with H2O, CH3OH, and C2H5OH from 50 to 500 torr, J. Phys. Chem. A, 105, 3527–3531, https://doi.org/10.1021/jp003967y, 2001.
Baasandorj, M., Millet, D. B., Hu, L., Mitroo, D., and Williams, B. J.: Measuring acetic and formic acid by proton-transfer-reaction mass spectrometry: sensitivity, humidity dependence, and quantifying interferences, Atmos. Meas. Tech., 8, 1303–1321, https://doi.org/10.5194/amt-8-1303-2015, 2015.
Baboukas, E. D., Kanakidou, M., and Mihalopoulos, N.: Carboxylic acids in gas and particulate phase above the Atlantic Ocean, J. Geophys. Res.-Atmos., 105, 14459–14471, https://doi.org/10.1029/1999jd900977, 2000.
Booth, A. M., Barley, M. H., Topping, D. O., McFiggans, G., Garforth, A., and Percival, C. J.: Solid state and sub-cooled liquid vapour pressures of substituted dicarboxylic acids using Knudsen Effusion Mass Spectrometry (KEMS) and Differential Scanning Calorimetry, Atmos. Chem. Phys., 10, 4879–4892, https://doi.org/10.5194/acp-10-4879-2010, 2010.
Brophy, P. and Farmer, D. K.: A switchable reagent ion high resolution time-of-flight chemical ionization mass spectrometer for real-time measurement of gas phase oxidized species: characterization from the 2013 southern oxidant and aerosol study, Atmos. Meas. Tech., 8, 2945–2959, https://doi.org/10.5194/amt-8-2945-2015, 2015.
Carlton, A. G., Turpin, B. J., Lim, H. J., Altieri, K. E., and Seitzinger, S.: Link between isoprene and secondary organic aerosol (SOA): Pyruvic acid oxidation yields low volatility organic acids in clouds, Geophys. Res. Lett., 33, L06822, https://doi.org/10.1029/2005gl025374, 2006.
Chebbi, A. and Carlier, P.: Carboxylic acids in the troposphere, occurrence, sources, and sinks: A review, Atmos. Environ., 30, 4233–4249, https://doi.org/10.1016/1352-2310(96)00102-1, 1996.
Crounse, J. D., McKinney, K. A., Kwan, A. J., and Wennberg, P. O.: Measurement of gas-phase hydroperoxides by chemical ionization mass spectrometry, Anal. Chem., 78, 6726–6732, https://doi.org/10.1021/ac0604235, 2006.
Daubert, T. E. and Danner, R. P.: Physical and thermodynamic properties of pure chemicals: data compilation, Taylor & Francis, Washington, D.C., USA, 1989.
Eliason, T. L., Aloisio, S., Donaldson, D. J., Cziczo, D. J., and Vaida, V.: Processing of unsaturated organic acid films and aerosols by ozone, Atmos. Environ., 37, 2207–2219, https://doi.org/10.1016/s1352-2310(03)00149-3, 2003.
Ervens, B., Feingold, G., Frost, G. J., and Kreidenweis, S. M.: A modeling study of aqueous production of dicarboxylic acids: 1. Chemical pathways and speciated organic mass production, J. Geophys. Res.-Atmos., 109, D15205, https://doi.org/10.1029/2003jd004387, 2004.
Ervens, B., Carlton, A. G., Turpin, B. J., Altieri, K. E., Kreidenweis, S. M., and Feingold, G.: Secondary organic aerosol yields from cloud-processing of isoprene oxidation products, Geophys. Res. Lett., 35, L02816, https://doi.org/10.1029/2007gl031828, 2008.
Galloway, J. N., Likens, G. E., Keene, W. C., and Miller, J. M.: The Composition of Precipitation in Remote Areas of the World, J. Geophys. Res.-Oc. Atm., 87, 8771–8786, https://doi.org/10.1029/JC087iC11p08771, 1982.
Granby, K., Egelov, A. H., Nielsen, T., and Lohse, C.: Carboxylic acids: Seasonal variation and relation to chemical and meteorological parameters, J. Atmos. Chem., 28, 195–207, https://doi.org/10.1023/a:1005877419395, 1997.
Grosjean, D.: Ambient Levels of Formaldehyde, Acetaldehyde, and Formic acid in Southern California: Results of a One-year Base-line Study, Environ. Sci. Technol., 25, 710–715, https://doi.org/10.1021/es00016a016, 1991.
Hansen, D. A., Edgerton, E. S., Hartsell, B. E., Jansen, J. J., Kandasamy, N., Hidy, G. M., and Blanchard, C. L.: The southeastern aerosol research and characterization study: Part 1 – overview, J. Air Waste Manage., 53, 1460–1471, 2003.
Hartmann, W. R., Santana, M., Hermoso, M., Andreae, M. O., and Sanhueza, E.: Diurnal Cycles of Formic anc Acetic Acids in the Northern Part of the Guayana Sheld, Venezuela, J. Atmos. Chem., 13, 63–72, https://doi.org/10.1007/bf00048100, 1991.
Hennigan, C. J., Bergin, M. H., Russell, A. G., Nenes, A., and Weber, R. J.: Gas/particle partitioning of water-soluble organic aerosol in Atlanta, Atmos. Chem. Phys., 9, 3613–3628, https://doi.org/10.5194/acp-9-3613-2009, 2009.
Huey, L. G., Hanson, D. R., and Howard, C. J.: Reactions of SF6- and I- with Atmospheric Trace Gases, J. Phys. Chem., 99, 5001–5008, https://doi.org/10.1021/j100014a021, 1995.
Huey, L. G., Tanner, D. J., Slusher, D. L., Dibb, J. E., Arimoto, R., Chen, G., Davis, D., Buhr, M. P., Nowak, J. B., Mauldin, R. L., Eisele, F. L., and Kosciuch, E.: CIMS measurements of HNO3 and SO2 at the South Pole during ISCAT 2000, Atmos. Environ., 38, 5411–5421, https://doi.org/10.1016/j.atmosenv.2004.04.037, 2004.
Kawamura, K., Ng, L. L., and Kaplan, I. R.: Determination of Organic Acids (C1–C10) in the Atmosphere, Motor Exhausts, and Engine Oils, Environ. Sci. Technol., 19, 1082–1086, https://doi.org/10.1021/es00141a010, 1985.
Keene, W. C. and Galloway, J. N.: Organic Acidity in Precipitation of North America, Atmos. Environ., 18, 2491–2497, https://doi.org/10.1016/0004-6981(84)90020-9, 1984.
Keene, W. C., Galloway, J. N., and Holden, J. D.: Measurement of Weak Organic Acidity in Precipitation from Remote Areas of the World, J. Geophys. Res.-Oc. Atm., 88, 5122–5130, https://doi.org/10.1029/JC088iC09p05122, 1983.
Kesselmeier, J.: Exchange of short-chain oxygenated volatile organic compounds (VOCs) between plants and the atmosphere: A compilation of field and laboratory studies, J. Atmos. Chem., 39, 219–233, https://doi.org/10.1023/a:1010632302076, 2001.
Kesselmeier, J., Bode, K., Hofmann, U., Muller, H., Schafer, L., Wolf, A., Ciccioli, P., Brancaleoni, E., Cecinato, A., Frattoni, M., Foster, P., Ferrari, C., Jacob, V., Fugit, J. L., Dutaur, L., Simon, V., and Torres, L.: Emission of short chained organic acids, aldehydes and monoterpenes from Quercus ilex L. and Pinus pinea L. in relation to physiological activities, carbon budget and emission algorithms, Atmos. Environ., 31, 119–133, https://doi.org/10.1016/s1352-2310(97)00079-4, 1997.
Khare, P., Kumar, N., Kumari, K. M., and Srivastava, S. S.: Atmospheric formic and acetic acids: An overview, Rev. Geophys., 37, 227–248, https://doi.org/10.1029/1998rg900005, 1999.
Kim, S., Huey, L. G., Stickel, R. E., Tanner, D. J., Crawford, J. H., Olson, J. R., Chen, G., Brune, W. H., Ren, X., Lesher, R., Wooldridge, P. J., Bertram, T. H., Perring, A., Cohen, R. C., Lefer, B. L., Shetter, R. E., Avery, M., Diskin, G., and Sokolik, I.: Measurement of HO2NO2 in the free troposphere during the intercontinental chemical transport experiment – North America 2004, J. Geophys. Res.-Atmos., 112, D12S01, https://doi.org/10.1029/2006jd007676, 2007.
Kuhn, U., Rottenberger, S., Biesenthal, T., Ammann, C., Wolf, A., Schebeske, G., Oliva, S. T., Tavares, T. M., and Kesselmeier, J.: Exchange of short-chain monocarboxylic acids by vegetation at a remote tropical forest site in Amazonia, J. Geophys. Res.-Atmos., 107, 8069, https://doi.org/10.1029/2000jd000303, 2002.
Lee, B. H., Lopez-Hilfiker, F. D., Mohr, C., Kurten, T., Worsnop, D. R., and Thornton, J. A.: An Iodide-Adduct High-Resolution Time-of-Flight Chemical-Ionization Mass Spectrometer: Application to Atmospheric Inorganic and Organic Compounds, Environ. Sci. Technol., 48, 6309–6317, https://doi.org/10.1021/es500362a, 2014.
Lee, B. H., Lopez-Hilfiker, F. D., Veres, P. R., McDuffie, E. E., Fibiger, D. L., Sparks, T. L., Ebben, C. J., Green, J. R., Schroder, J. C., Campuzano-Jost, P., Iyer, S., D'Ambro, E. L., Schobesberger, S., Brown, S. S., Wooldridge, P. J., Cohen, R. C., Fiddler, M. N., Bililign, S., Jimenez, J. L., Kurtén, T., Weinheimer, A. J., Jaegle, L., and Thornton, J. A.: Flight Deployment of a High-Resolution Time-of-Flight Chemical Ionization Mass Spectrometer: Observations of Reactive Halogen and Nitrogen Oxide Species, J. Geophys. Res.-Atmos., 123, 7670–7686, https://doi.org/10.1029/2017JD028082, 2018.
Liao, J., Sihler, H., Huey, L. G., Neuman, J. A., Tanner, D. J., Friess, U., Platt, U., Flocke, F. M., Orlando, J. J., Shepson, P. B., Beine, H. J., Weinheimer, A. J., Sjostedt, S. J., Nowak, J. B., Knapp, D. J., Staebler, R. M., Zheng, W., Sander, R., Hall, S. R., and Ullmann, K.: A comparison of Arctic BrO measurements by chemical ionization mass spectrometry and long path-differential optical absorption spectroscopy, J. Geophys. Res.-Atmos., 116, D00R02, https://doi.org/10.1029/2010jd014788, 2011.
Lide, D. R.: CRC handbook of chemistry and physics: a ready-reference book of chemical and physical data, CRC Press, Boca Raton, FL, USA, 1995.
Lim, H. J., Carlton, A. G., and Turpin, B. J.: Isoprene forms secondary organic aerosol through cloud processing: Model simulations, Environ. Sci. Technol., 39, 4441–4446, https://doi.org/10.1021/es048039h, 2005.
Millet, D. B., Baasandorj, M., Farmer, D. K., Thornton, J. A., Baumann, K., Brophy, P., Chaliyakunnel, S., de Gouw, J. A., Graus, M., Hu, L., Koss, A., Lee, B. H., Lopez-Hilfiker, F. D., Neuman, J. A., Paulot, F., Peischl, J., Pollack, I. B., Ryerson, T. B., Warneke, C., Williams, B. J., and Xu, J.: A large and ubiquitous source of atmospheric formic acid, Atmos. Chem. Phys., 15, 6283–6304, https://doi.org/10.5194/acp-15-6283-2015, 2015.
Molina, M. J., Ivanov, A. V., Trakhtenberg, S., and Molina, L. T.: Atmospheric evolution of organic aerosol, Geophys. Res. Lett., 31, L22104, https://doi.org/10.1029/2004gl020910, 2004.
Nah, T., Guo, H., Sullivan, A. P., Chen, Y., Tanner, D. J., Nenes, A., Russell, A., Ng, N. L., Huey, L. G., and Weber, R. J.: Characterization of aerosol composition, aerosol acidity, and organic acid partitioning at an agriculturally intensive rural southeastern US site, Atmos. Chem. Phys., 18, 11471–11491, https://doi.org/10.5194/acp-18-11471-2018, 2018.
Neuman, J. A., Ryerson, T. B., Huey, L. G., Jakoubek, R., Nowak, J. B., Simons, C., and Fehsenfeld, F. C.: Calibration and evaluation of nitric acid and ammonia permeation tubes by UV optical absorption, Environ. Sci. Technol., 37, 2975–2981, https://doi.org/10.1021/es026422l, 2003.
Nguyen, T. B., Crounse, J. D., Teng, A. P., Clair, J. M. S., Paulot, F., Wolfe, G. M., and Wennberg, P. O.: Rapid deposition of oxidized biogenic compounds to a temperate forest, P. Natl. Acad. Sci. USA, 112, E392–E401, https://doi.org/10.1073/pnas.1418702112, 2015.
Nolte, C. G., Solomon, P. A., Fall, T., Salmon, L. G., and Cass, G. R.: Seasonal and spatial characteristics of formic and acetic acids concentrations in the southern California atmosphere, Environ. Sci. Technol., 31, 2547–2553, https://doi.org/10.1021/es960954i, 1997.
Nowak, J. B., Huey, L. G., Russell, A. G., Tian, D., Neuman, J. A., Orsini, D., Sjostedt, S. J., Sullivan, A. P., Tanner, D. J., Weber, R. J., Nenes, A., Edgerton, E., and Fehsenfeld, F. C.: Analysis of urban gas phase ammonia measurements from the 2002 Atlanta Aerosol Nucleation and Real-Time Characterization Experiment (ANARChE), J. Geophys. Res.-Atmos., 111, D17308, https://doi.org/10.1029/2006jd007113, 2006.
Orzechowska, G. E. and Paulson, S. E.: Photochemical sources of organic acids. 1. Reaction of ozone with isoprene, propene, and 2-butenes under dry and humid conditions using SPME, J. Phys. Chem. A, 109, 5358–5365, https://doi.org/10.1021/jp050166s, 2005.
Pan, X., Underwood, J. S., Xing, J.-H., Mang, S. A., and Nizkorodov, S. A.: Photodegradation of secondary organic aerosol generated from limonene oxidation by ozone studied with chemical ionization mass spectrometry, Atmos. Chem. Phys., 9, 3851–3865, https://doi.org/10.5194/acp-9-3851-2009, 2009.
Park, J., Gomez, A. L., Walser, M. L., Lin, A., and Nizkorodov, S. A.: Ozonolysis and photolysis of alkene-terminated self-assembled monolayers on quartz nanoparticles: implications for photochemical aging of organic aerosol particles, Phys. Chem. Chem. Phys., 8, 2506–2512, https://doi.org/10.1039/b602704k, 2006.
Paulot, F., Wunch, D., Crounse, J. D., Toon, G. C., Millet, D. B., DeCarlo, P. F., Vigouroux, C., Deutscher, N. M., González Abad, G., Notholt, J., Warneke, T., Hannigan, J. W., Warneke, C., de Gouw, J. A., Dunlea, E. J., De Mazière, M., Griffith, D. W. T., Bernath, P., Jimenez, J. L., and Wennberg, P. O.: Importance of secondary sources in the atmospheric budgets of formic and acetic acids, Atmos. Chem. Phys., 11, 1989–2013, https://doi.org/10.5194/acp-11-1989-2011, 2011.
Seco, R., Penuelas, J., and Filella, I.: Short-chain oxygenated VOCs: Emission and uptake by plants and atmospheric sources, sinks, and concentrations, Atmos. Environ., 41, 2477–2499, https://doi.org/10.1016/j.atmosenv.2006.11.029, 2007.
Sindelarova, K., Granier, C., Bouarar, I., Guenther, A., Tilmes, S., Stavrakou, T., Müller, J.-F., Kuhn, U., Stefani, P., and Knorr, W.: Global data set of biogenic VOC emissions calculated by the MEGAN model over the last 30 years, Atmos. Chem. Phys., 14, 9317–9341, https://doi.org/10.5194/acp-14-9317-2014, 2014.
Singh, H., Chen, Y., Tabazadeh, A., Fukui, Y., Bey, I., Yantosca, R., Jacob, D., Arnold, F., Wohlfrom, K., Atlas, E., Flocke, F., Blake, D., Blake, N., Heikes, B., Snow, J., Talbot, R., Gregory, G., Sachse, G., Vay, S., and Kondo, Y.: Distribution and fate of selected oxygenated organic species in the troposphere and lower stratosphere over the Atlantic, J. Geophys. Res.-Atmos., 105, 3795–3805, https://doi.org/10.1029/1999jd900779, 2000.
Slusher, D. L., Pitteri, S. J., Haman, B. J., Tanner, D. J., and Huey, L. G.: A chemical ionization technique for measurement of pernitric acid in the upper troposphere and the polar boundary layer, Geophys. Res. Lett., 28, 3875–3878, https://doi.org/10.1029/2001gl013443, 2001.
Slusher, D. L., Huey, L. G., Tanner, D. J., Chen, G., Davis, D. D., Buhr, M., Nowak, J. B., Eisele, F. L., Kosciuch, E., Mauldin, R. L., Lefer, B. L., Shetter, R. E., and Dibb, J. E.: Measurements of pernitric acid at the South Pole during ISCAT 2000, Geophys. Res. Lett., 29, 2011, https://doi.org/10.1029/2002gl015703, 2002.
Sorooshian, A., Ng, N. L., Chan, A. W. H., Feingold, G., Flagan, R. C., and Seinfeld, J. H.: Particulate organic acids and overall water-soluble aerosol composition measurements from the 2006 Gulf of Mexico Atmospheric Composition and Climate Study (GoMACCS), J. Geophys. Res.-Atmos., 112, D13201, https://doi.org/10.1029/2007jd008537, 2007.
Sorooshian, A., Murphy, S. M., Hersey, S., Bahreini, R., Jonsson, H., Flagan, R. C., and Seinfeld, J. H.: Constraining the contribution of organic acids and AMS m∕z 44 to the organic aerosol budget: On the importance of meteorology, aerosol hygroscopicity, and region, Geophys. Res. Lett., 37, L21807, https://doi.org/10.1029/2010gl044951, 2010.
Souza, S. R. and Carvalho, L. R. F.: Seasonality influence in the distribution of formic and acetic acids in the urban atmosphere of Sao Paulo City, Brazil, J. Brazil. Chem. Soc., 12, 755–762, 2001.
Spaulding, R. S., Talbot, R. W., and Charles, M. J.: Optimization of a mist chamber (cofer scrubber) for sampling water-soluble organics in air, Environ. Sci. Technol., 36, 1798–1808, https://doi.org/10.1021/es011189x, 2002.
Talbot, R. W., Beecher, K. M., Harriss, R. C., and Cofer, W. R.: Atmospheric Geochemistry of Formic and Acetic Acids at a Mid-latitude Temperate Site, J. Geophys. Res.-Atmos., 93, 1638–1652, https://doi.org/10.1029/JD093iD02p01638, 1988.
Talbot, R. W., Mosher, B. W., Heikes, B. G., Jacob, D. J., Munger, J. W., Daube, B. C., Keene, W. C., Maben, J. R., and Artz, R. S.: Carboxylic Acids in the Rural Continental Atmosphere over the Eastern United States during the Shenandoah Cloud and Photochemistry Experiment, J. Geophys. Res.-Atmos., 100, 9335–9343, https://doi.org/10.1029/95jd00507, 1995.
Talbot, R. W., Dibb, J. E., Scheuer, E. M., Blake, D. R., Blake, N. J., Gregory, G. L., Sachse, G. W., Bradshaw, J. D., Sandholm, S. T., and Singh, H. B.: Influence of biomass combustion emissions on the distribution of acidic trace gases over the southern Pacific basin during austral springtime, J. Geophys. Res.-Atmos., 104, 5623–5634, https://doi.org/10.1029/98jd00879, 1999.
Veres, P., Roberts, J. M., Warneke, C., Welsh-Bon, D., Zahniser, M., Herndon, S., Fall, R., and de Gouw, J.: Development of negative-ion proton-transfer chemical-ionization mass spectrometry (NI-PT-CIMS) for the measurement of gas-phase organic acids in the atmosphere, Int. J. Mass Spectrom., 274, 48–55, https://doi.org/10.1016/j.ijms.2008.04.032, 2008.
Veres, P., Roberts, J. M., Burling, I. R., Warneke, C., de Gouw, J., and Yokelson, R. J.: Measurements of gas-phase inorganic and organic acids from biomass fires by negative-ion proton-transfer chemical-ionization mass spectrometry, J. Geophys. Res.-Atmos., 115, D23302, https://doi.org/10.1029/2010jd014033, 2010.
Veres, P. R., Roberts, J. M., Cochran, A. K., Gilman, J. B., Kuster, W. C., Holloway, J. S., Graus, M., Flynn, J., Lefer, B., Warneke, C., and de Gouw, J.: Evidence of rapid production of organic acids in an urban air mass, Geophys. Res. Lett., 38, L17807, https://doi.org/10.1029/2011gl048420, 2011.
Vlasenko, A., George, I. J., and Abbatt, J. P. D.: Formation of volatile organic compounds in the heterogeneous oxidation of condensed-phase organic films by gas-phase OH, J. Phys. Chem. A, 112, 1552–1560, https://doi.org/10.1021/jp0772979, 2008.
Walser, M. L., Park, J., Gomez, A. L., Russell, A. R., and Nizkorodov, S. A.: Photochemical aging of secondary organic aerosol particles generated from the oxidation of d-limonene, J. Phys. Chem. A, 111, 1907–1913, https://doi.org/10.1021/jp066293l, 2007.
Xu, L., Guo, H. Y., Weber, R. J., and Ng, N. L.: Chemical Characterization of Water-Soluble Organic Aerosol in Contrasting Rural and Urban Environments in the Southeastern United States, Environ. Sci. Technol., 51, 78–88, https://doi.org/10.1021/acs.est.6b05002, 2017.
Yatavelli, R. L. N., Mohr, C., Stark, H., Day, D. A., Thompson, S. L., Lopez-Hilfiker, F. D., Campuzano-Jost, P., Palm, B. B., Vogel, A. L., Hoffmann, T., Heikkinen, L., Aijala, M., Ng, N. L., Kimmel, J. R., Canagaratna, M. R., Ehn, M., Junninen, H., Cubison, M. J., Petaja, T., Kulmala, M., Jayne, J. T., Worsnop, D. R., and Jimenez, J. L.: Estimating the contribution of organic acids to northern hemispheric continental organic aerosol, Geophys. Res. Lett., 42, 6084–6090, https://doi.org/10.1002/2015gl064650, 2015.
Zhang, R. Y., Suh, I., Zhao, J., Zhang, D., Fortner, E. C., Tie, X. X., Molina, L. T., and Molina, M. J.: Atmospheric new particle formation enhanced by organic acids, Science, 304, 1487–1490, https://doi.org/10.1126/science.1095139, 2004.