the Creative Commons Attribution 4.0 License.
the Creative Commons Attribution 4.0 License.
 | 24 Oct 2018
A 12-year long global record of optical depth of absorbing aerosols above the clouds derived from the OMI/OMACA algorithm
Omar Torres
Changwoo Ahn
Aerosol–cloud interaction continues to be one of the leading uncertain components of climate models, primarily due to the lack of adequate knowledge of the complex microphysical and radiative processes of the aerosol–cloud system. Situations when light-absorbing aerosols such as carbonaceous particles and windblown dust overlay low-level cloud decks are commonly found in several regions of the world. Contrary to the known cooling effects of these aerosols in cloud-free scenario over darker surfaces, an overlapping situation of the absorbing aerosols over the cloud can lead to a significant level of atmospheric absorption exerting a positive radiative forcing (warming) at the top of the atmosphere. We contribute to this topic by introducing a new global product of above-cloud aerosol optical depth (ACAOD) of absorbing aerosols retrieved from the near-UV observations made by the Ozone Monitoring Instrument (OMI) onboard NASA's Aura platform. Physically based on an unambiguous “color ratio” effect in the near-UV caused by the aerosol absorption above the cloud, the OMACA (OMI above-cloud aerosols) algorithm simultaneously retrieves the optical depths of aerosols and clouds under a prescribed state of the atmosphere. The OMACA algorithm shares many similarities with the two-channel cloud-free OMAERUV algorithm, including the use of AIRS carbon monoxide for aerosol type identification, CALIOP-based aerosol layer height dataset, and an OMI-based surface albedo database. We present the algorithm architecture, inversion procedure, retrieval quality flags, initial validation results, and results from a 12-year long OMI record (2005–2016) including global climatology of the frequency of occurrence, ACAOD, and aerosol-corrected cloud optical depth. A comparative analysis of the OMACA-retrieved ACAOD, collocated with equivalent accurate measurements from the HSRL-2 lidar for the ORACLES Phase I operation (August–September 2016), revealed a good agreement (R = 0.77, RMSE = 0.10). The long-term OMACA record reveals several important regions of the world, where the carbonaceous aerosols from the seasonal biomass burning and mineral dust originated over the continents are found to overlie low-level cloud decks with moderate (0.3 < ACAOD < 0.5, away from the sources) to higher levels of ACAOD (> 0.8 in the proximity to the sources), including the southeastern Atlantic Ocean, southern Indian Ocean, Southeast Asia, the tropical Atlantic Ocean off the coast of western Africa, and northern Arabian sea. No significant long-term trend in the frequency of occurrence of aerosols above the clouds and ACAOD is noticed when OMI observations that are free from the “row anomaly” throughout the operation are considered. If not accounted for, the effects of aerosol absorption above the clouds introduce low bias in the retrieval of cloud optical depth with a profound impact on increasing ACAOD and cloud brightness. The OMACA aerosol product from OMI presented in this paper offers a crucial missing piece of information from the aerosol loading above cloud that will help us to quantify the radiative effects of clouds when overlaid with aerosols and their resultant impact on cloud properties and climate.
- Article
(14689 KB) - Full-text XML
- BibTeX
- EndNote


Aerosol–cloud interactions continue to be the most significant source of uncertainty in estimating the role of aerosols and clouds in Earth's changing radiation budget (IPCC, 2013). One of the main hurdles is the lack of adequate knowledge of the complex microphysical and optical processes of an aerosol–cloud system that govern the resultant impact on the regional and global climate. An important aspect of the problem is when the light-absorbing aerosols such as biomass burning generated carbonaceous particles and windblown mineral dust overlay low-level cloud decks. Such situations are commonly observed from satellites over several oceanic and continental regions of the world on daily to seasonal scales (Devasthale and Thomas, 2011; Alfaro-Contreras et al., 2016). The transoceanic transport of elevated fine mode aerosols from biomass burning and coarse mode aerosols from dust storms observed from the ground and satellites is a well-known phenomenon (Prospero et al., 2002; Kaufman et al., 2005; Chand et al., 2008; Torres et al., 2012). Aerosols in the cloud-free scenario over dark surfaces are known to produce a net cooling effect (negative radiative forcing) on climate. In contrast, an overlapping situation of the absorbing aerosols over cloud can lead to a significant level of atmospheric absorption and thus exert a positive radiative forcing at the top of the atmosphere (TOA) (Keil and Haywood, 2003; Chand et al., 2009; Meyer et al., 2013; Feng and Christopher, 2015; Zhang et al., 2016). The magnitude of direct radiative effects of aerosols above cloud depends directly on the amount of aerosol loading, the microphysical–optical properties of the aerosol layer (Eswaran et al., 2015) and the underlying cloud deck (Meyer et al., 2013), geometric cloud fraction, and cloud optical depth (Chand et al., 2009), as well as the diurnal cycle of clouds (Min and Zhang, 2014). The resultant aerosol-driven atmospheric heating can have a significant influence on atmospheric stability, cloud formation and lifetime, and the hydrological cycle (Wilcox, 2012; Lu et al., 2018). Different climate models treat aerosol–cloud interaction processes differently, which results in significant inter-model discrepancies in aerosol forcing assessments, especially over the absorbing aerosol–cloud overlap regions, i.e., the southeastern Atlantic Ocean and Southeast Asia (Schulz et al., 2006). To accurately quantify the direct and semi-direct effects of aerosols in cloudy skies, it is imperative that a measurement-based global database is made available to the community.
In the past decade, the development of several independent algorithms that quantify aerosol loading above cloud from satellite-based active, as well passive, sensors has been a breakthrough. These techniques have shown the potential to retrieve above-cloud aerosol optical depth (ACAOD) using measurements from different A-train sensors (Jethva et al., 2014). The depolarization ratio (Hu et al., 2007) and color ratio methods (Chand et al., 2008) applied to the CALIPSO/CALIOP active lidar measurements of two-way transmittance (Chand et al., 2008) directly provide ACAOD and the corresponding Ångström exponent. Waquet et al. (2009) make use of polarized radiances measured by PARASOL/POLDER to retrieve ACAOD. An operational version of this algorithm capable of retrieving ACAOD globally has also been developed (Waquet et al., 2013). Taking advantage of enhanced aerosol absorption sensitivity in the near-UV, Torres et al. (2012) introduced a technique to retrieve ACAOD and underlying aerosol-corrected cloud optical depth (COD), simultaneously. Jethva et al. (2013) have extended the color ratio method to the visible and shortwave IR (SWIR) channel measurements of MODIS to deduce a pair of ACAOD and aerosol-corrected COD. Using an iterative optimal estimation approach applied to the MODIS observations, Meyer et al. (2015) and Sayer et al. (2016) have developed multispectral algorithms to simultaneously retrieve ACAOD, COD, and cloud effective radius for scenes with absorbing aerosols over clouds.
Satellite-based passive and active sensors can observe the aerosols in the entire atmospheric column above the cloud deck. Conventional satellite retrievals have provided a global distribution of aerosols only over cloud-free regions, leaving the vast cloudy region unmonitored regarding the presence of aerosols. Likewise, field campaigns in the past mainly focused on the measurement and characterization of aerosol properties in cloud-free conditions to evaluate and improve satellite-based retrievals as well as model simulations. The lack of a measurement-based aerosol database in the cloudy atmosphere severely limits our understanding of the aerosol's effects on cloud radiative forcing and microphysical properties.
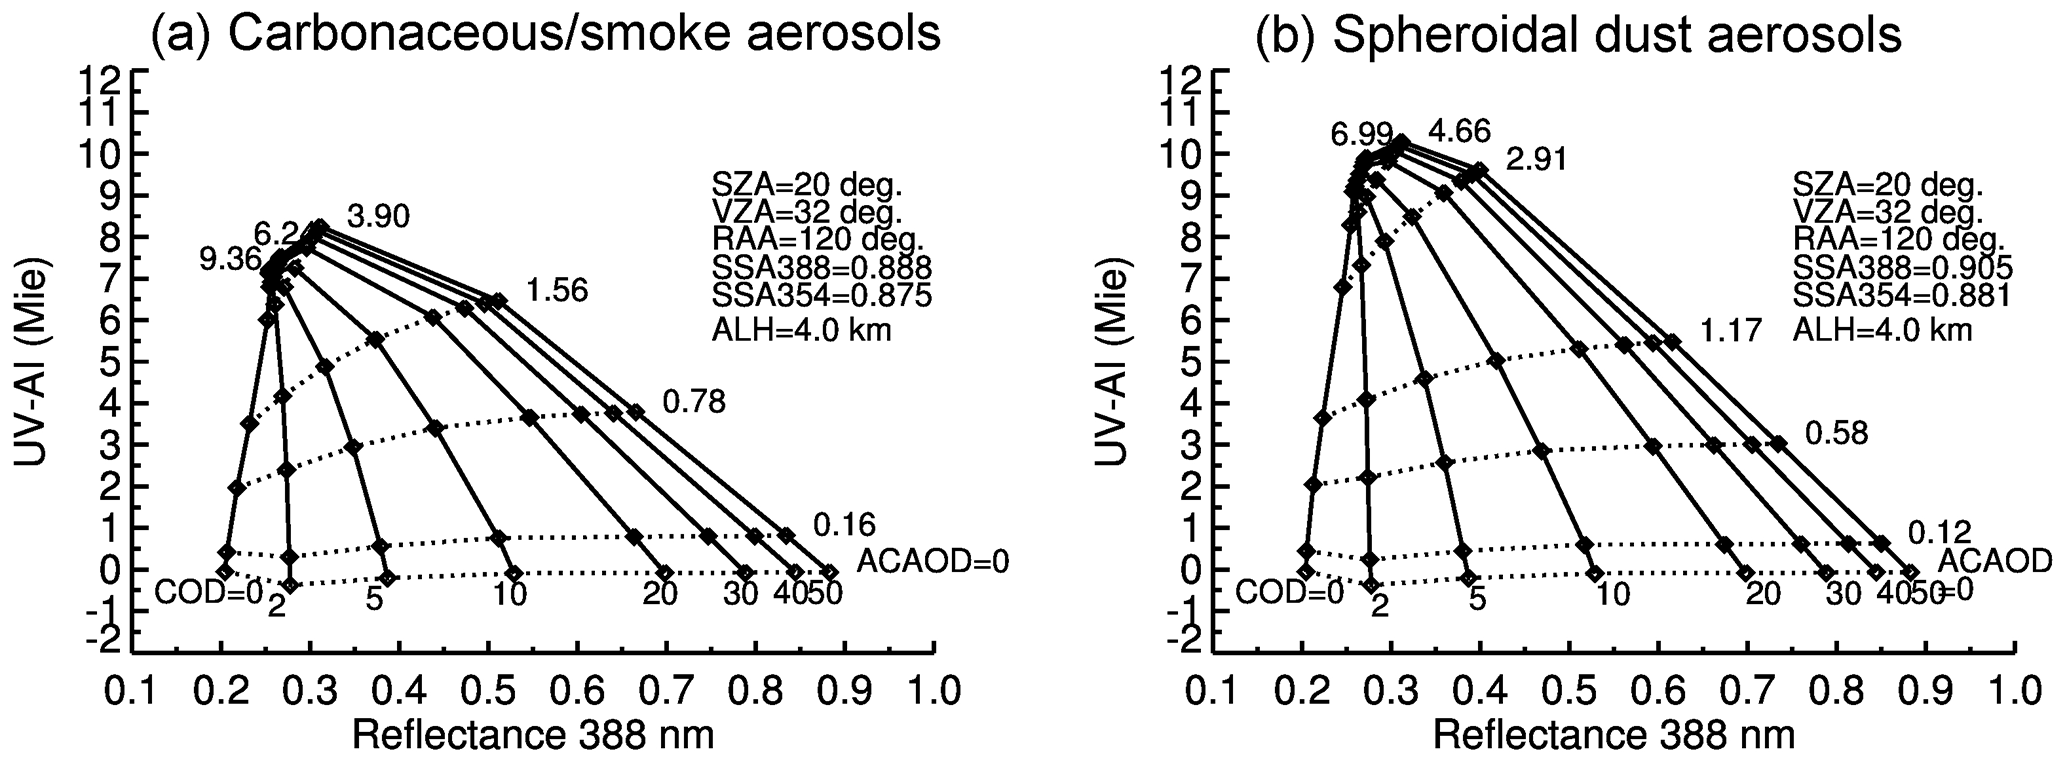
Figure 1Simulation of UVAI (y axis) vs. reflectance at 388 nm (x axis) for the different pairs of ACAOD and COD (both at 388 nm) for the carbonaceous (a) and spheroidal shape dust aerosols (b). Values of ACAOD and COD depicted in the figure correspond to the 388 nm wavelength. The shown 2-D diagram forms the retrieval domain in which the observations from OMI are fitted and related to a pair of ACAOD and COD.
Torres et al. (2012) introduced a remote sensing technique to simultaneously retrieve ACAOD and aerosol-corrected COD using the near-UV observations made by the Ozone Monitoring Instrument (OMI) onboard NASA's Aura satellite. The method is physically established on an unambiguous “color ratio” effect produced by the absorbing aerosols above clouds in the two near-UV channels, i.e., 354 and 388 nm. Under a prescribed state of the atmosphere, the aerosol-led changes in the cloud radiances measured at the top of the atmosphere (TOA) relate to a pair of ACAOD and COD. The technique was successfully tested over the case studies of carbonaceous aerosols above the cloud deck found over the southeastern Atlantic Ocean. Furthermore, ACAOD derived using the near-UV color ratio method was found to be consistent when inter-compared against those inferred from other research-based algorithms applied to the different A-train sensors (MODIS, CALIOP, POLDER) (Jethva et al., 2014).
In this paper, we apply the near-UV color ratio algorithm on a global scale to produce a Level 2 orbital dataset of ACAOD using OMI observations. First, we describe different components of the algorithm (Sect. 2), followed by the theoretical estimates of the expected uncertainties (Sect. 3). Initial validation results of the OMACA aerosol retrieval using airborne HSRL-2 measurements are presented in Sect. 4. The results of the frequency of occurrence analysis of the aerosols above clouds are discussed in Sect. 5. A global 12-year long record of ACAOD and aerosol-corrected COD derived from OMACA,along with a quantitative analysis of the impact of aerosol absorption on COD retrievals, are presented in Sect. 6. The paper is summarized and concluded in Sect. 7.
2.1 Physical basis
Light absorbing aerosols such as carbonaceous aerosols (Kirchstetter et al., 2004) and dust particles (Wagner et al., 2012) exhibit strong wavelength dependence in absorption, particularly in the UV region of the spectrum. On the other hand, clouds show minimal to no spectral dependence in reflectance when measured from the space. When absorbing aerosols overlay the cloud deck, the spectral contrast in the UV is further enhanced, producing a strong “color ratio” effect in the two-channel TOA reflectance measurements (Torres et al., 2012). This effect is often referred to as “cloud darkening” caused by the aerosol-led spectral absorption. The UV aerosol index (UVAI) measured by OMI is an excellent indicator of the presence of absorbing aerosols in the clear (Torres et al., 1998) as well as the cloudy atmosphere (Torres et al., 2012). Radiative transfer simulation shows that for a prescribed state of the atmosphere, the reduction in the spectral reflectance and UVAI between a pair of wavelengths depends on the optical depth of both aerosols and cloud, single-scattering albedo, and aerosol layer height. Founded on this unambiguous detection of absorbing aerosols above the cloud, Torres et al. (2012) introduced a technique that delivers the simultaneous retrieval of ACAOD and aerosol-corrected COD from OMI's two near-UV observations (354 and 388 nm). Figure 1 shows the two-dimensional domain of simulated reflectance at 388 nm (x axis) and UVAI (y axis) for several pairs of ACAOD and COD for the carbonaceous aerosols (left panel) and spheroidal dust particles (right panel). Under a prescribed set of assumptions, i.e., aerosol layer height (ALH), aerosol single-scattering albedo (SSA), surface albedo, and geometry, the two-channel measurements of OMI can be related to a pair of ACAOD and COD.
2.2 Inputs and ancillary datasets
2.2.1 Direct input
We use OMI Level-1b calibrated and geolocated radiance measurements at 354 and 388 nm as the primary input to the OMACA algorithm. First and foremost, the observed radiances are used to calculate the UVAI (Mie), as described by Torres et al. (2018), which is a residual quantity resulting from the comparison between measured and calculated radiances between 354 and 388 nm. Compared to the previously adopted Lambert equivalent reflector (LER) based method for calculating UVAI (Herman et al., 1997; Torres et al., 1998), the new approach offers a better characterization of clouds by accounting for the angular dependence of cloud reflectance (phase function) of liquid water clouds.
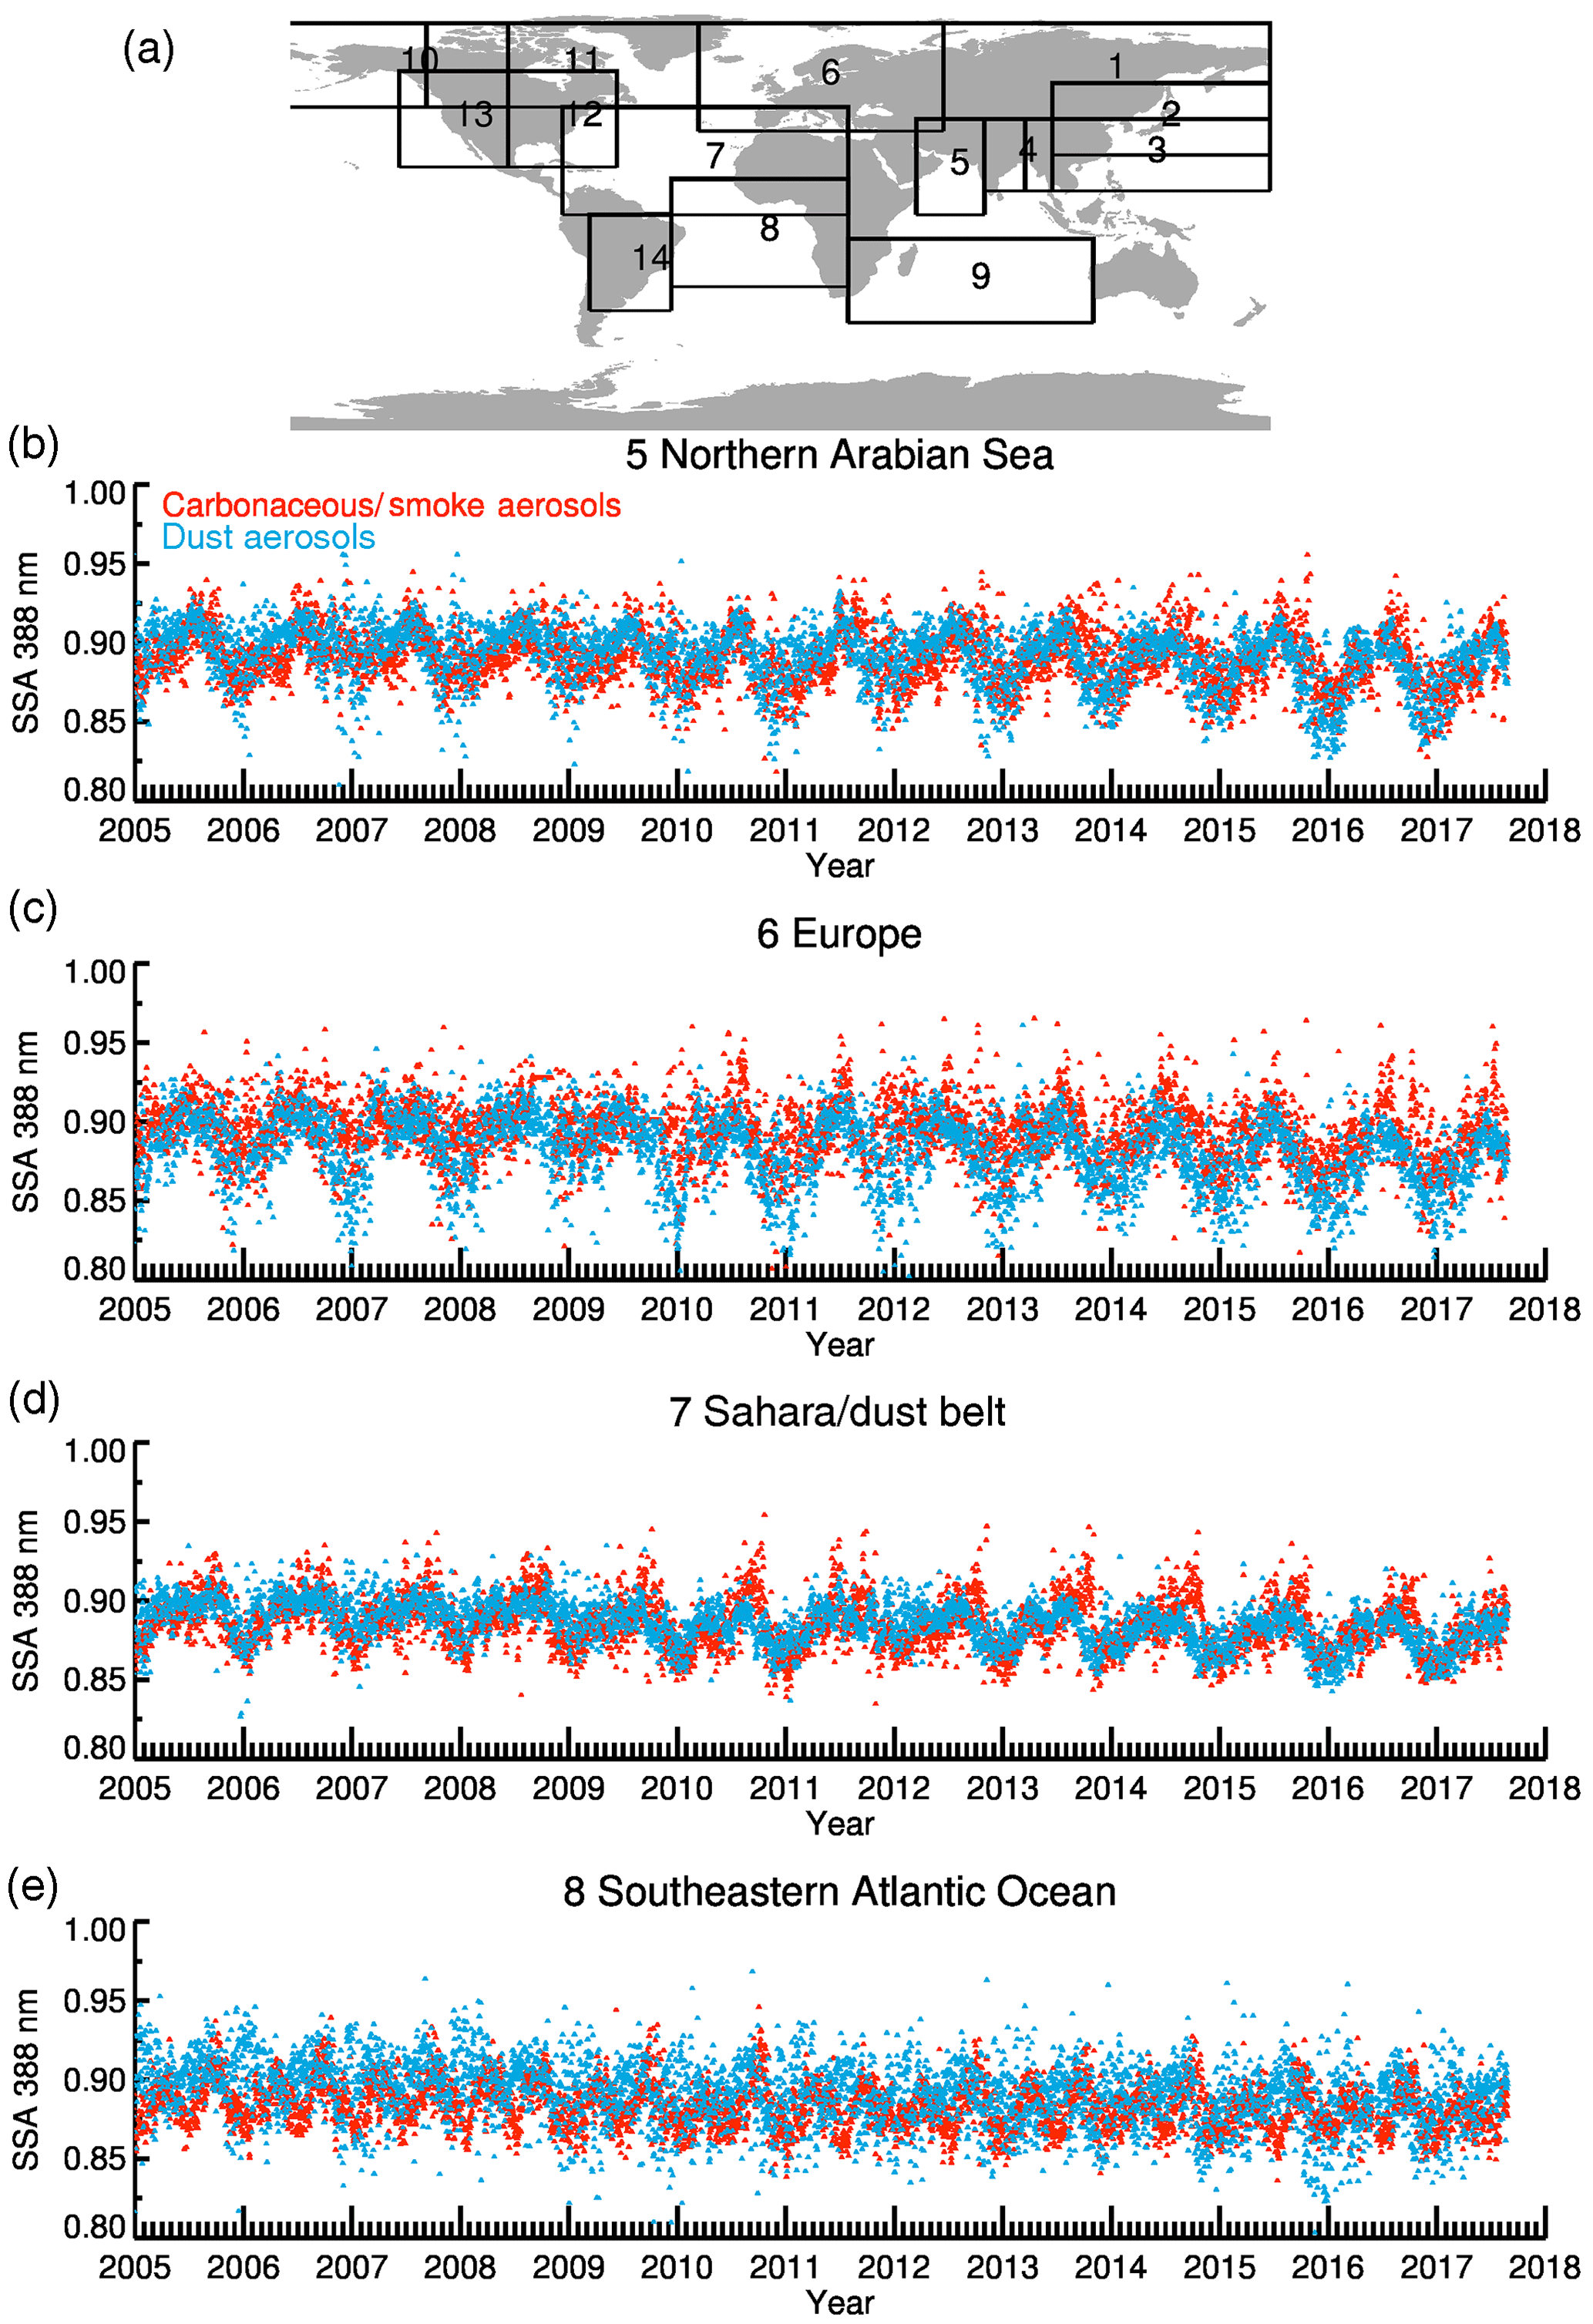
Figure 2(a) Geographical boundaries of the 14 regions considered for calculating corresponding regional values of SSA (388 nm). (b–e) Regional mean UVAI weighted cloud-free SSA (388 nm) for carbonaceous and dust aerosols for the four selected regions (numbered 5, 6, 7, and 8 in a) derived using OMI/OMAERUV operational (version 1.8.9.1) L2 cloud-free SSA retrievals.
2.2.2 Ancillary datasets
AIRS CO and OMI UVAI for aerosol type identification
The aerosol-type identification scheme for OMACA has been directly adopted from the operational cloud-free OMI/OMAERUV (version 1.8.9.1) two-channel algorithm. It uses Aura/OMI UVAI coincident with the real-time Aqua/AIRS retrievals of carbon monoxide (CO) to distinguish three major aerosol types, i.e., carbonaceous aerosols, dust particles, and urban and industrial aerosols. OMACA considers two absorbing aerosol types, i.e., carbonaceous aerosols and desert dust. The aerosol type identification scheme adopts a threshold of 0.8 in UVAI to assign either smoke or dust aerosol type, which subsequently depends on the columnar amounts of CO retrieved by AIRS. Since the CO is a primary gaseous component of open-field biomass burning, it constitutes a reliable tracer of carbonaceous aerosol. For the Northern Hemisphere (NH), the threshold in CO is set to 2.0 × 10¹⁸ molecules cm−2, whereas for the Southern Hemisphere (SH) it is 1.6 × 10¹⁸ molecules cm−2. The different threshold values of CO in NH and SH correspond to the average of AIRS CO climatological annual minima over major biomass burning and boreal fire activity regions. The presence of carbonaceous aerosols is assumed if UVAI ≥ UVAI threshold (0.8) and CO ≥ CO threshold or when CO values larger than 2.8 × 10¹⁸ (2.5 × 10¹⁸) are observed in the NH (SH) regardless of UVAI considerations. Conversely, OMI pixels with observed UVAI ≥ UVAI threshold (0.8) and CO < CO threshold are assigned with the dust aerosol type. Threshold values in AI and CO represent noise and background levels in the respective measurements not necessarily associated with the free troposphere CO burden that is expected to coexist with the lofted carbonaceous aerosols. For the equatorial region bounded by the latitude range 10∘ S to 10∘ N, the aerosol type is determined based on a linearly interpolated value of CO threshold between NH and SH.
The straightforward way of discerning the absorbing aerosol type works efficiently in most cases; however, it may break down under certain situations, i.e., when dust aerosols are present over regions characterized by high CO levels associated with pollution episodes other than the biomass burning smoke for which the scheme would assign absorbing aerosol type as smoke. Note that the aerosol type identification scheme does not account for the mixture of aerosols for which either smoke or dust aerosol type is assigned depending upon the threshold values of UVAI and CO. The reader is recommended to refer to Torres et al. (2013) for obtaining a detailed description of the scheme and its implementation within the OMAERUV algorithm.
Aerosol layer height and surface albedo
The representation of aerosol vertical profile relies on an averaged aerosol layer height (ALH) dataset derived using the 30-month long combined and colocated measurements of CALIOP vertical backscatter and OMI UVAI (Torres et al., 2013). The aerosol profile is assumed to follow a quasi-Gaussian distribution around mean ALH given by the CALIOP-OMI dataset. For the surface characterization, we use a near-UV surface albedo database derived using the multiyear OMI LER observations. The method adopts a minimum LER approach which ensures minimal or no contamination from the atmosphere, i.e., aerosols and clouds, in the measured reflectivity. Afterward, the minimum LER dataset derived from the OMI observations was scaled in the temporal domain to the seasonality of surface albedo retrieved in the visible wavelengths from MODIS. The dataset contains surface albedo values at 354 and 388 nm at a grid resolution of 0.25∘ × 0.25∘. These two components of the OMACA algorithm, i.e., ALH and surface albedo, are identical to the ones adopted in the operational cloud-free OMI/OMAERUV two-channel algorithm (Torres et al., 2013).
Above-cloud aerosol single-scattering albedo
The aerosol single-scattering albedo (SSA) is one of the most critical assumptions that can govern the accuracy of ACAOD retrieved from OMI (Torres et al., 2012). A perturbation of +0.03 (−0.03) in SSA yields about +48 % (−25 %) error in ACAOD for a reference AOD and COD of 0.5 and 5.0, respectively. The error in ACAOD follows an asymmetric behavior around the perturbed state and is a dynamic function of both aerosol loading (AOD) and underlying cloud brightness (COD). The OMACA algorithm takes advantage of cloud-free standard OMAERUV global retrievals of SSA for characterizing the absorption capacity of aerosols above the cloud. OMI's two-channel OMAERUV algorithm simultaneously retrieves columnar total AOD and SSA at 388 nm in cloud-free conditions on a daily global scale (Torres et al., 2007, 2013). Both retrieved parameters have been evaluated against the ground-based AERONET measurements globally (Ahn et al., 2014; Jethva et al., 2014). Jethva et al. (2014) have shown that for carbonaceous and dust aerosol types, which are relevant to the OMACA product, about 52 % (77 %) of OMI-AERONET matchups agree within the absolute difference of ±0.03 (± 0.05). Despite the inherent uncertainties in both inversions, a reasonable agreement between the two independent techniques globally, with a robust comparison over many important sites affected by biomass burning and dust, provided the increased confidence and credibility of the OMAERUV aerosol product.
We have used the existing cloud-free OMAERUV SSA product to generate a daily database to prescribe SSA required in OMACA. The world is split up into 14 regions, based on the patterns of absorbing aerosols above cloud inferred from the frequency of occurrence analysis (given in Sect. 5). Figure 2a shows the geographical boundaries of the selected regions. For each region and each day of OMI observation, the daily, region-specific value of above-cloud SSA was estimated for the carbonaceous and dust aerosol types separately using the respective cloud-free SSA retrieval weighted by the corresponding UVAI observations (> 0.8). Since the OMAERUV algorithm assigns a fixed aerosol type, i.e., smoke, dust, or background aerosol, to each valid cloud-free pixel of OMI, it is possible to estimate daily regional SSA value separately for smoke and dust aerosol types. In the case of missing daily regional SSA due to cloud cover or no OMI orbital data, the method relies on the availability of SSA values on nearby days with a sequential preference, i.e., weekly (± 3 days excluding the day in consideration), monthly, or long-term climatology datasets. Observations of aerosols above cloud found outside the boundaries of these 14 pre-selected regions are assigned a fixed SSA of 0.89 and 0.9 for the smoke and dust aerosol types, respectively. These values correspond to the aerosol model having a moderate level of absorption for both aerosol types (see Appendix A). We emphasize here that though the OMACA is a global product, it was primarily designed to capture above-cloud aerosol events over major and some minor regions of the world where such situations are prevalent on monthly to seasonal scale.
Using ground-based AERONET inversion, Eck et al. (2013) showed that the absorption properties of the smoke aerosols over central and southern Africa exhibit a seasonal trend where the monthly mean aerosol SSA (440 nm) increases from 0.84 in July to 0.93 in November. An analysis of the OMI-retrieved SSA (388 nm) in the same paper also showed a similar trend as that observed by AERONET and suggests that the seasonal change in SSA is widespread over much of southern Africa. The present approach of assigning the above-cloud aerosol SSA captures the daily variability of aerosol absorption for each region and thus eliminates the need to assume a time-invariant value of SSA for the retrievals of above-cloud aerosols.
Aerosol models
OMACA considers two major partially absorbing aerosol types, i.e., carbonaceous and dust aerosols. The microphysical and optical properties of these aerosol types are adopted from the current operational OMAERUV aerosol models (Torres et al., 2013). Each aerosol type consists of seven distinct sub-models that differ in their imaginary part of the refractive index. The tables included in Appendix list the model properties of both types of aerosol models. Carbonaceous aerosols are assumed as spherical particles with a wavelength-dependent imaginary refractive index in the near-UV region (relative spectral dependence of 20 %) that accounts for the presence of organics in the biomass burning generated aerosols (Kirchstetter et al., 2004; Jethva and Torres, 2011). Dust aerosols are considered spheroidal in shape with a fixed distribution of the spheroidal axis ratio adopted from Dubovik et al. (2006) and applied to the near UV observations (Torres et al., 2018).
Look-up tables
OMACA is essentially a look-up-table (LUT) based algorithm. To generate LUTs, we employ the vector discrete ordinate radiative transfer model VLIDORT (Spurr, 2006). Clouds are assumed to be liquid in phase and follow the standard C1 size distribution (Deirmendjian, 1969). Aerosol size distribution is assumed to follow a bimodal, log-normal distribution with parameters adopted from the standard OMAERUV aerosol models (see Appendix A). Carbonaceous aerosols are assumed to be spherical with associated scattering phase functions calculated following Mie theory. Dust particles, on the other hand, are treated as a mixture of randomly oriented spheroids with a fixed distribution of axis ratios (Dubovik et al., 2006). The phase matrix elements of each spheroidal dust aerosol model of OMACA (Appendix A) were calculated using a set of pre-calculated kernels and an associated software package made available by Oleg Dubovik (personal communication, 2015). The extracted phase matrix elements of each dust model were ingested into VLDIORT to simulate TOA radiances. More details on the treatment of spheroidal dust in the OMI aerosol retrieval framework are given in Torres et al. (2018).
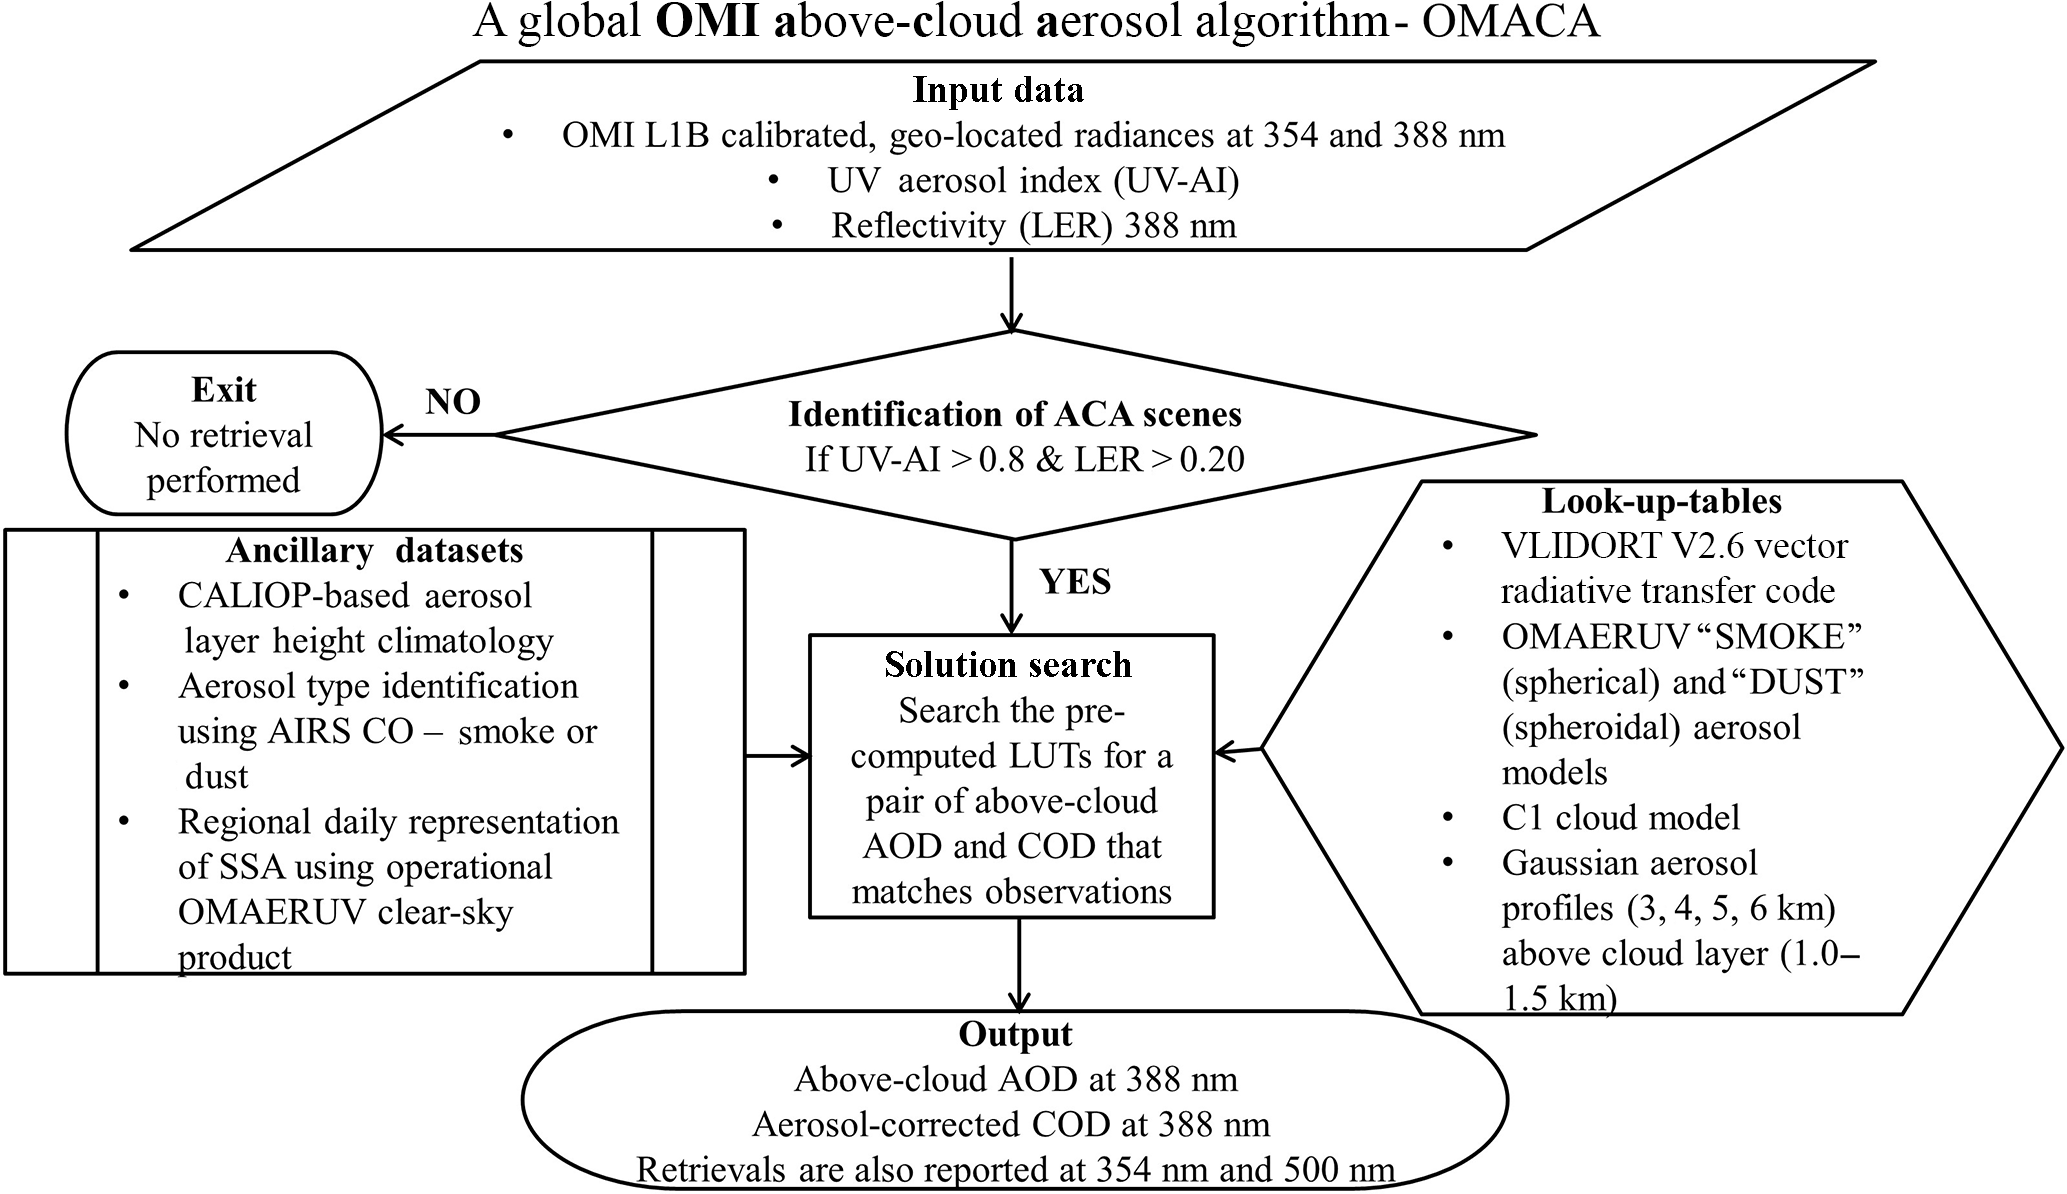
LUTs were generated for carbonaceous and dust aerosol models. Each aerosol type consists of seven discrete aerosol SSA (388 nm) ranging from 0.75 to 1.00, for the 354 and 388 nm wavelengths for a total of seven node values in ACAOD, eight nodes in COD, at different geometries of solar zenith angle, viewing zenith angle, and relative azimuth angle. The simulations were carried out for two surface pressure levels, for four different ALH referenced at respective surface pressure levels, and for five nodes in surface albedo. The node values for each variable are listed in Appendix A. The LUT radiances interpolated at observed geometry, pressure level, ALH, and SSA are matched with the OMI-observed radiance in 2-D retrieval domain (Fig. 1) to find a pair of ACAOD and COD at 388 nm. The retrieved values at 388 nm are converted to 354 and 500 nm wavelengths following the spectral dependence of extinction associated with the assumed model in the retrieval process. Figure 3 illustrates a general flow diagram of the OMACA algorithm.
2.2.3 Identification of absorbing aerosols above clouds
We adopt a bi-parametric approach to identify the presence of absorbing aerosols above the cloud. The Lambertian equivalent reflectivity or LER measured at a near-UV wavelength is proportional to the brightness of the scene. LER represents the reflectivity of the scene when Rayleigh scattering is taken out from the TOA radiance measurements. On the other hand, UVAI is an excellent indicator of the presence of absorbing aerosols in both cloud-free and overcast skies (Torres et al., 2012) over all surfaces. Radiative transfer simulations show that while LER is directly proportional to COD, the layers of absorbing aerosols above cloud produces higher magnitudes of UVAI that depend on the above-cloud AOD, aerosol model, and cloud brightness (COD). Thus, higher values of LER and UVAI potentially represent scenes of absorbing layers of aerosols over low-level cloud deck.
OMI offers a spatial resolution of 13 × 24 km2 at its nadir, which intercepts an area of about 338 km2 on the ground for the VIS part of the instrument (Algorithm Theoretical Document Basis, OMPIXCOR). The ground pixel size and associated area increase significantly at the extreme edge of the swath. A new global product called OMMYDCLD, processed in-house, colocates the Aqua/MODIS 1 km cloud retrievals (MYD06) with each OMI pixel footprint (13 × 24 km2; Joanna Joiner and Brad Fisher, personal communication, 2016). OMMYDCLD reports statistics of many MODIS cloud parameters for each OMI footprint, such as the median COD, histogram of COD, cloud phase information, and many others. In addition to this, the OMMYDCLD also provides the total number of MODIS 1 km pixels (clear and cloudy) as well as the total number of cloudy pixels identified at 1 km spatial resolution. The availability of these two parameters allows the calculation of geometric cloud fraction as observed by MODIS for each OMI pixel. Notice that the current OMACA product does not use the OMMYDCLD product while making above-cloud aerosol retrieval. Instead, we use the information on the geometric cloud fraction derived from OMMYCLD in the post-retrieval analysis.
Table 1A description of the OMACA algorithm retrieval quality flags.
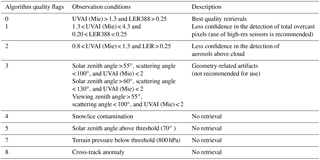
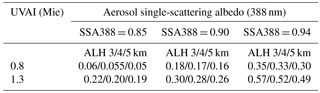
Table 2Theoretical simulations of the retrieved ACAOD for two discrete values of UVAI under different combinations of SSA and ALH assumptions. Threshold values of 0.8 and 1.3 in UVAI correspond to the algorithm quality flags of “0” (best) and “2” (less confidence).
2.2.4 Algorithm quality flags
Each qualified OMI retrieval of the above-cloud aerosols is assigned with an appropriate algorithm quality flag. Table 1 describes the algorithm quality flags attached to each valid retrieval and their associated observed conditions. Retrievals with the quality flag equal to “0” are expected to be the best in quality as they are associated with the larger magnitudes of UVAI (> 1.3) and LER388 (> 0.25) with both providing high confidence in the detection of absorbing aerosols above the cloud. An analysis using the OMMYCLD product over the southeastern Atlantic Ocean for the period of June–July–August 2007 revealed a well-constrained non-linear relationship between the MODIS-derived COD multiplied by the geometric cloud fraction, and LER388. A threshold for LER388 of 0.25, adopted for the best quality retrievals, compares to the COD times geometric cloud fraction of 3–4. Thus, given the geometric cloud fraction of unity the minimum COD retrieved by OMACA would be in the range 3–4.
Table 3Theoretical error (%) in ACAOD (388 nm) due to the uncertainty in the assumption of SSA at 388 nm. The reference value of SSA (388 nm) assumed in the calculation was 0.89; the error in SSA (leftmost column) represents perturbation from the reference value. The cloud optical depth underneath the aerosol layer was assumed to be 10.
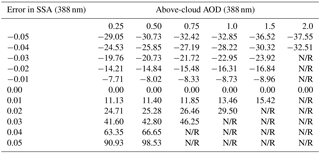
N/R: not retrieved.
Lower magnitudes in both parameters might result in less confidence in the detection of either overcast pixels (0.20 < LER388 < 0.25, quality flag = 1) or the presence of absorbing aerosols above cloud (0.8 < UVAI < 1.3, quality flag = 2). Lower LER values (0.20–0.25) might pose a risk of identifying broken clouds in the OMI pixels, resulting in a geometric cloud fraction less than unity – a condition, under which the assumption of fully overcast pixels breaks down. Nevertheless, it is also possible that the increased aerosol loading (AOD > 2) with a significant absorption capacity (SSA < 0.90) above the fully overcast pixels reduces LER measured at TOA (Fig. 6 of Jethva et al., 2013). On the other hand, the lower values of UVAI (0.8–1.3) associated with the quality flag “2” may be related to the non-aerosol related artifacts resulting from the inherent uncertainties in the derivation of UVAI. The sources of uncertainties include spectral surface albedo, the unaccounted presence of ice clouds, and viewing geometry of the Sun and satellites. The magnitudes of UVAI depend on several aerosol parameters including ACAOD, COD, SSA, ALH, and spectral dependence of aerosol absorption. Radiative transfer calculations show that for a given value of SSA of 0.90 (388 nm) with an ALH of 3, 4, and 5 km, the UVAI value of 1.3 can be equated to the AOD (388 nm) of 0.30, 0.28, and 0.26, respectively. For a given SSA of 0.84, the values of AOD are 0.22, 0.20, and 0.19. The results of these simulations presented in Table 2 suggest that the minimum value of AOD retrieved using the thresholds in UVAI depends on the actual condition of the scene.
Table 4Theoretical error (%) in ACAOD (388 nm) due to the uncertainty in the assumption of aerosol layer height (ALH). The reference value of ALH assumed in the calculation was 4.0 km; the error in ALH (leftmost column) represents perturbation from the reference value. The cloud optical depth underneath the aerosol layer was assumed to be 10.
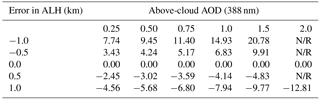
N/R: not retrieved.
Retrievals assigned with the algorithm quality flag “3” are considered to be the lowest in confidence as they represent spurious non-aerosol related enhancement in UVAI (up to 2.0) at certain extreme geometries. However, if the observed UVAI exceeds a value of 2.0, then the retrievals are assigned with the quality flag “0”, “1”, or “2” depending upon the observed LER and UVAI. The OMACA algorithm operates over both ocean and land pixels with terrain pressure greater than 800 hPa, which encompasses the majority of the regions of frequent aerosol–cloud overlap (see Sect. 5). Retrievals over oceanic cloud pixels are performed at all Sun glint angles if measured LER exceeds 0.30; for the 0.20 < LER < 0.30 condition retrievals are performed with pixels having Sun glint angle > 20∘ to avoid glint-related artifacts in the retrievals.
The OMACA algorithm relies on the presumptions about the atmosphere and surface properties. Therefore, it is imperative to estimate the sensitivity of the OMACA retrievals to the departure of the actual state of the atmosphere from the one assumed in the inversion. Earlier, Torres et al. (2012) described the theoretical uncertainties in the near-UV based retrieval of ACAOD and aerosol-corrected COD. However, the analysis was confined to a narrow range of input conditions. Here, we reperform the same exercise by considering an extended range of perturbation in each assumed parameter.
The approach to calculating the uncertainties in the OMACA retrievals follows a perturbation-based method. The errors were calculated by contrasting the retrievals derived assuming a reference state and perturbed state of a particular input parameter. For example, given a fixed set of aerosol size distribution, ALH, and surface albedo, OMACA retrievals are derived assuming a range of aerosol SSA. The retrievals are then compared with those derived considering a reference value of SSA, which is the center value of the prescribed range. The errors in the retrievals then can be calculated given both underestimated and overestimated values of an assumed parameter.
Table 3 lists the percent error in ACAOD (388 nm) caused by varying uncertainty in the aerosol SSA for an above-cloud smoke situation. The reference value of SSA (388 nm) was assumed to be 0.89; ALH and surface albedo were referenced at 3.0 and 0.05 km, respectively. Errors were calculated for a range of uncertain SSA, i.e., −0.05 (underestimation) to 0.05 (overestimation) in step of 0.01. The optical depth of cloud underneath the aerosol layer was assumed to be 10. The errors in ACAOD are found to behave non-linearly to the perturbations in the assumed SSA. It also depends on the true value of ACAOD. Furthermore, the error conforms to an asymmetric behavior around the reference value of SSA; larger magnitudes of error are associated with the overestimated SSAs, whereas relatively lower errors are obtained when SSA was underestimated. The selection of above-cloud SSA values in actual OMACA retrievals relies on a daily, regional database of cloud-free SSA values retrieved from the standard OMAERUV aerosol product, as described in Sect. 2.2.2.3. Therefore, the accurateness of assigned above-cloud SSA depends on the accuracy of cloud-free OMAERUV SSA retrievals as well as on the validity of the assumption that aerosol absorption properties are invariant between cloud-free and above-cloud aerosols scenes.
Table 5Theoretical error (%) in ACAOD (388 nm) due to the uncertainty in the assumption of aerosol absorption Ångström exponent (AAE). The reference value of AAE (354–388 nm) assumed in the calculation was 2.65; the error in AAE (leftmost column) represents perturbation from this reference value. The cloud optical depth underneath the aerosol layer was assumed to be 10. Simulations marked with N/R (not retrieved) represent the retrieval failure due to the out-of-domain issue.
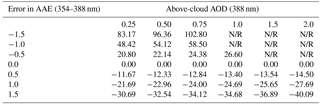
Table 6Theoretical error (%) in aerosol-corrected COD (388 nm) due to the uncertainty in the assumption of aerosol SSA and layer height (ALH).
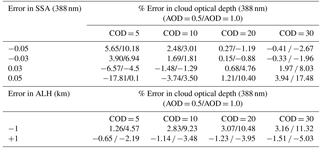
Table 7Theoretical error (%) in aerosol-corrected COD (388 nm) due to the uncertainty in the assumption of cloud effective radius.
Earlier, an intercomparison analysis of OMI-AERONET SSA retrievals, based on the previous public version of the OMAERUV product, from over 269 AERONET sites distributed globally, showed an agreement within ±0.03 and ±0.05 limits for about 51 % and 76 % of total 5463 collocated matchups, respectively (Jethva et al., 2014). When segregated by the range of AOD (440 nm) and UVAI, 49 % (AOD < 0.7, UVAI < 1.0) and 53 % (AOD > 0.7, UVAI > 1.0) of the total OMAERUV-AERONET SSA (440 nm) retrievals are found to agree within their estimated uncertainties of ±0.03. The agreement improved to 74 % and 79 %, respectively, when the uncertainty limit was relaxed up to ± 0.05. The statistical comparison was found to be even better when the matchups were segregated by the aerosol type, i.e., only smoke or dust, over many long-term sites located in the biomass burning and dust dominated regions.
Since its public release in 2012, the OMAERUV algorithm has been upgraded with several major changes, including better treatment of dust particles assuming realistic spheroidal shape distribution, accounting for angular scattering effects of clouds in the calculation of UVAI, use of new minimum surface LER dataset using the synergy of multi-year OMI and MODIS observations, and updated cloud screening and retrieval flagging scheme. The regional, daily SSA dataset used in the OMACA product has been derived from the latest version of the OMAERUV (version 1.8.9.1) product, released in 2017. A new comparative analysis of OMI-AERONET SSAs over global AERONET locations demonstrated that the agreement between the two independent sets of retrievals improved significantly for scenes identified as smoke and dust aerosol type. Quantitatively, about 59 % (83 %), 65 % (88 %), and 72 % (91 %) of the matchups are found to be within the expected limits of ±0.03 (±0.05) difference given the observed range of UVAI > 0.8, > 1.5, and > 2.0, respectively. Use of the UVAI-weighted scheme to estimate the daily regional value of SSA precisely reflects the fact that the agreement between OMI and AERONET SSA improves at higher aerosol loading and absorption providing increased confidence in the satellite retrievals. The remaining uncertainty in the assumed SSA of +0.03 (−0.03) leads to an error in the retrieved ACAOD by +42 % to +46 % (−20 % to −25 %), as shown in Table 3. The estimated errors could be much larger (90 %–100 %) given the larger uncertainty (±0.05) in the assumed SSA.
Relative to the errors in ACAOD due to the uncertain SSA, departures of ALH from the assumed state results in lower errors (Table 4). For assigning the mean ALH, OMACA relies on a global, monthly mean dataset derived from the 30-month collocated CALIOP and OMI observations (Torres et al., 2013). The OMI-CALIOP climatology of ALH was developed using mostly clear-sky observations in both datasets with maximum LER in OMI dataset restricted to 0.25. The threshold in LER (0.25) largely avoided above-cloud aerosols scenes that are assigned with the best quality OMACA retrievals (Table 1). The transport of aerosols over the cloud in hotspot regions is known to occur above the boundary layer and between the altitudes 3 and 6 km, as observed from CALIOP lidar. Furthermore, the time series of fractional AOD shown in Fig. 9 (right-hand axis in blue ink) later in this paper demonstrated that a large fraction of the total column AOD, about 80 %–100 %, was retrieved as AOD above the clouds during the seasonal biomass burning and dust episodes over the hotspot regions. For these reasons, we expect that the OMI-CALIOP ALH database derived from cloud-free observations is also representative over the hotspot regions of above-cloud aerosols. The expected uncertainty in the derived ALH dataset is about ±1 km for which the error in ACAOD could vary between −5 % to −13 % and +8 % to +21 % for an overestimated and underestimated ALH by +1 km and −1 km, respectively.
The OMACA 2-D retrieval domain shown in Fig. 1 suggests that the magnitudes of UVAI primarily modulate the retrieved value of ACAOD. Several parameters including ACAOD, COD, ALH, SSA, and AAE can influence the magnitudes of UVAI. For instance, given a fixed set of spectral AODs at 354 and 388 nm wavelengths, ALH, and SSA at 388 nm, the magnitude of derived UVAI strongly varies with the assumed value of AAE (Fig. 4 of Jethva and Torres, 2011). In other words, for a given value of observed UVAI, different assumptions of AAE would result in different values of the retrieved AOD. The “smoke” and “dust” aerosol models adopted in the OMACA algorithm assume an invariant spectral dependence of the imaginary part of the refractive index. For the carbonaceous and dust aerosol models, the relative spectral dependence in the imaginary index is assumed to be 20 % (Kirchstetter et al., 2004; Jethva and Torres, 2011) and 39 %, respectively, between the 354 and 388 nm wavelengths, at which the imaginary index at 354 nm is higher than that at 388 nm. For a fixed set of size distribution parameters and range of SSA (388 nm), this results in AAE in the range 2.5–3.0 for the carbonaceous aerosol models, and 2.0–4.0 for the dust models (see Appendix A). Theoretical error (%) in ACAOD (388 nm) due to the uncertainty in the assumption of aerosol AAE (354–388 nm range) is listed in Table 5. The reference value of AAE was assumed to be 2.65 corresponding to the moderately absorbing smoke model, and COD underneath the aerosol layer was assumed to be 10. AAE was perturbed in steps of 0.5 in both directions from the reference value. Similar to the uncertain SSA simulations, errors in ACAOD behave asymmetrically to the perturbations in AAE with larger (relatively lower) magnitudes of errors are associated with the underestimated (overestimated) AAE.
The corresponding simulated errors in the retrieval of aerosol-corrected COD resulting from uncertain SSA and ALH are shown in Table 6. The overall errors in COD are found to be much smaller compared those in the ACAOD retrievals. An uncertainty of ±0.03 in SSA produces an error in COD in the range −2 % to 8 % depending on the absolute values ACAOD and COD. Similarly, an uncertain assumption of ALH yields an error in COD between −5 % to 11 %. In addition to the assumptions on aerosol properties, the LUT calculations also are based on the assumed C1 liquid water cloud model with a fixed value of droplet effective radius (Deirmendjian, 1969). A sensitivity analysis, similar to the ones presented above, was carried out following the perturbation approach around the assumed CRE value of 12.0 µm. Table 7 lists the errors in aerosol-corrected COD due to the range of uncertainty in the assumed cloud effective radius. The analysis was performed assuming a reference effective radius of 12 µm and for the ACAOD of 0.5 and 1.0 (388 nm).
The errors in COD retrievals due to the uncertainty in effective radius follow asymmetric behavior to the perturbation around the assumed state. While a large underestimation of −8 µm produces negative errors of ∼ 10 %–11 % in the retrieved COD, an overestimation of +8 to +12 µm yields positive errors of much smaller magnitudes (∼ 1 %–2 %). The spatial distribution of MODIS monthly cloud CRE over the southeastern Atlantic Ocean, as shown in Fig. 11 of Meyer et al. (2015), exhibits spatial variations with smaller droplets (CRE 7–11 µm) concentrated closer to the coast and relatively larger size droplets (11–17 µm) retrieved away from the coast. Given the fixed value of CRE equals 6.0 µm assumed in the OMACA cloud LUTs, the observed variations from MODIS would produce < 2 % error in the retrieved aerosol-corrected COD. The corresponding errors in ACAOD due to the uncertainty in cloud effective radius are found to be marginal. For an ACAOD > 0.5, an uncertainty in cloud effective radius by ±8 µm results in ACAOD errors < 2 % with much smaller magnitudes at higher aerosol loading. This is because at larger ACAODs the aerosol absorption effects dominate over that produced by varying effective radius of liquid droplets leaving other major algorithmic assumptions, i.e., SSA, ALH, and AAE to determine the resultant uncertainty in ACAOD retrievals. The analysis implies that near-UV wavelengths do not offer a strong sensitivity to the variations in cloud droplet size rather the cloud signal is predominantly driven by the optical depth of the cloud layer. Due to the lack of information on cloud droplet size from OMI, we adopted the standard C1 cloud model validated and used in numerous studies for all cloud LUT calculations.
The sensitivity of ACAOD and aerosol-corrected retrievals to the uncertainty in three major assumptions made in OMACA considered a broad range of perturbation. However, we anticipate that the prescribed values of SSA, ALH, and AAE are accurate to within ±0.03, ±1 km, and ±0.5, respectively, for which the errors in ACAOD can vary from −23 % to +46 % in the ACAOD range 0.25-1.0. The corresponding errors in aerosol-corrected COD are found to be significantly lower and in the range −5 % to +11 %. In situations when the uncertainty in the assumed inputs leads to errors of opposite sign, the resulting error in the retrievals is likely to be lower than expected due to the cancellation of individual errors. On the other hand, an agglomeration of the errors of the same sign can further amplify the overall uncertainty in the retrievals. Nevertheless, it is practically hard to arrive at the actual uncertainty in the OMACA retrieval for every pixel due to the ill-posed nature of the inversion problem. Evaluating the accuracy of the satellite retrievals requires an independent set of direct measurements of aerosols, in this case above the cloud, discussed in the following section.
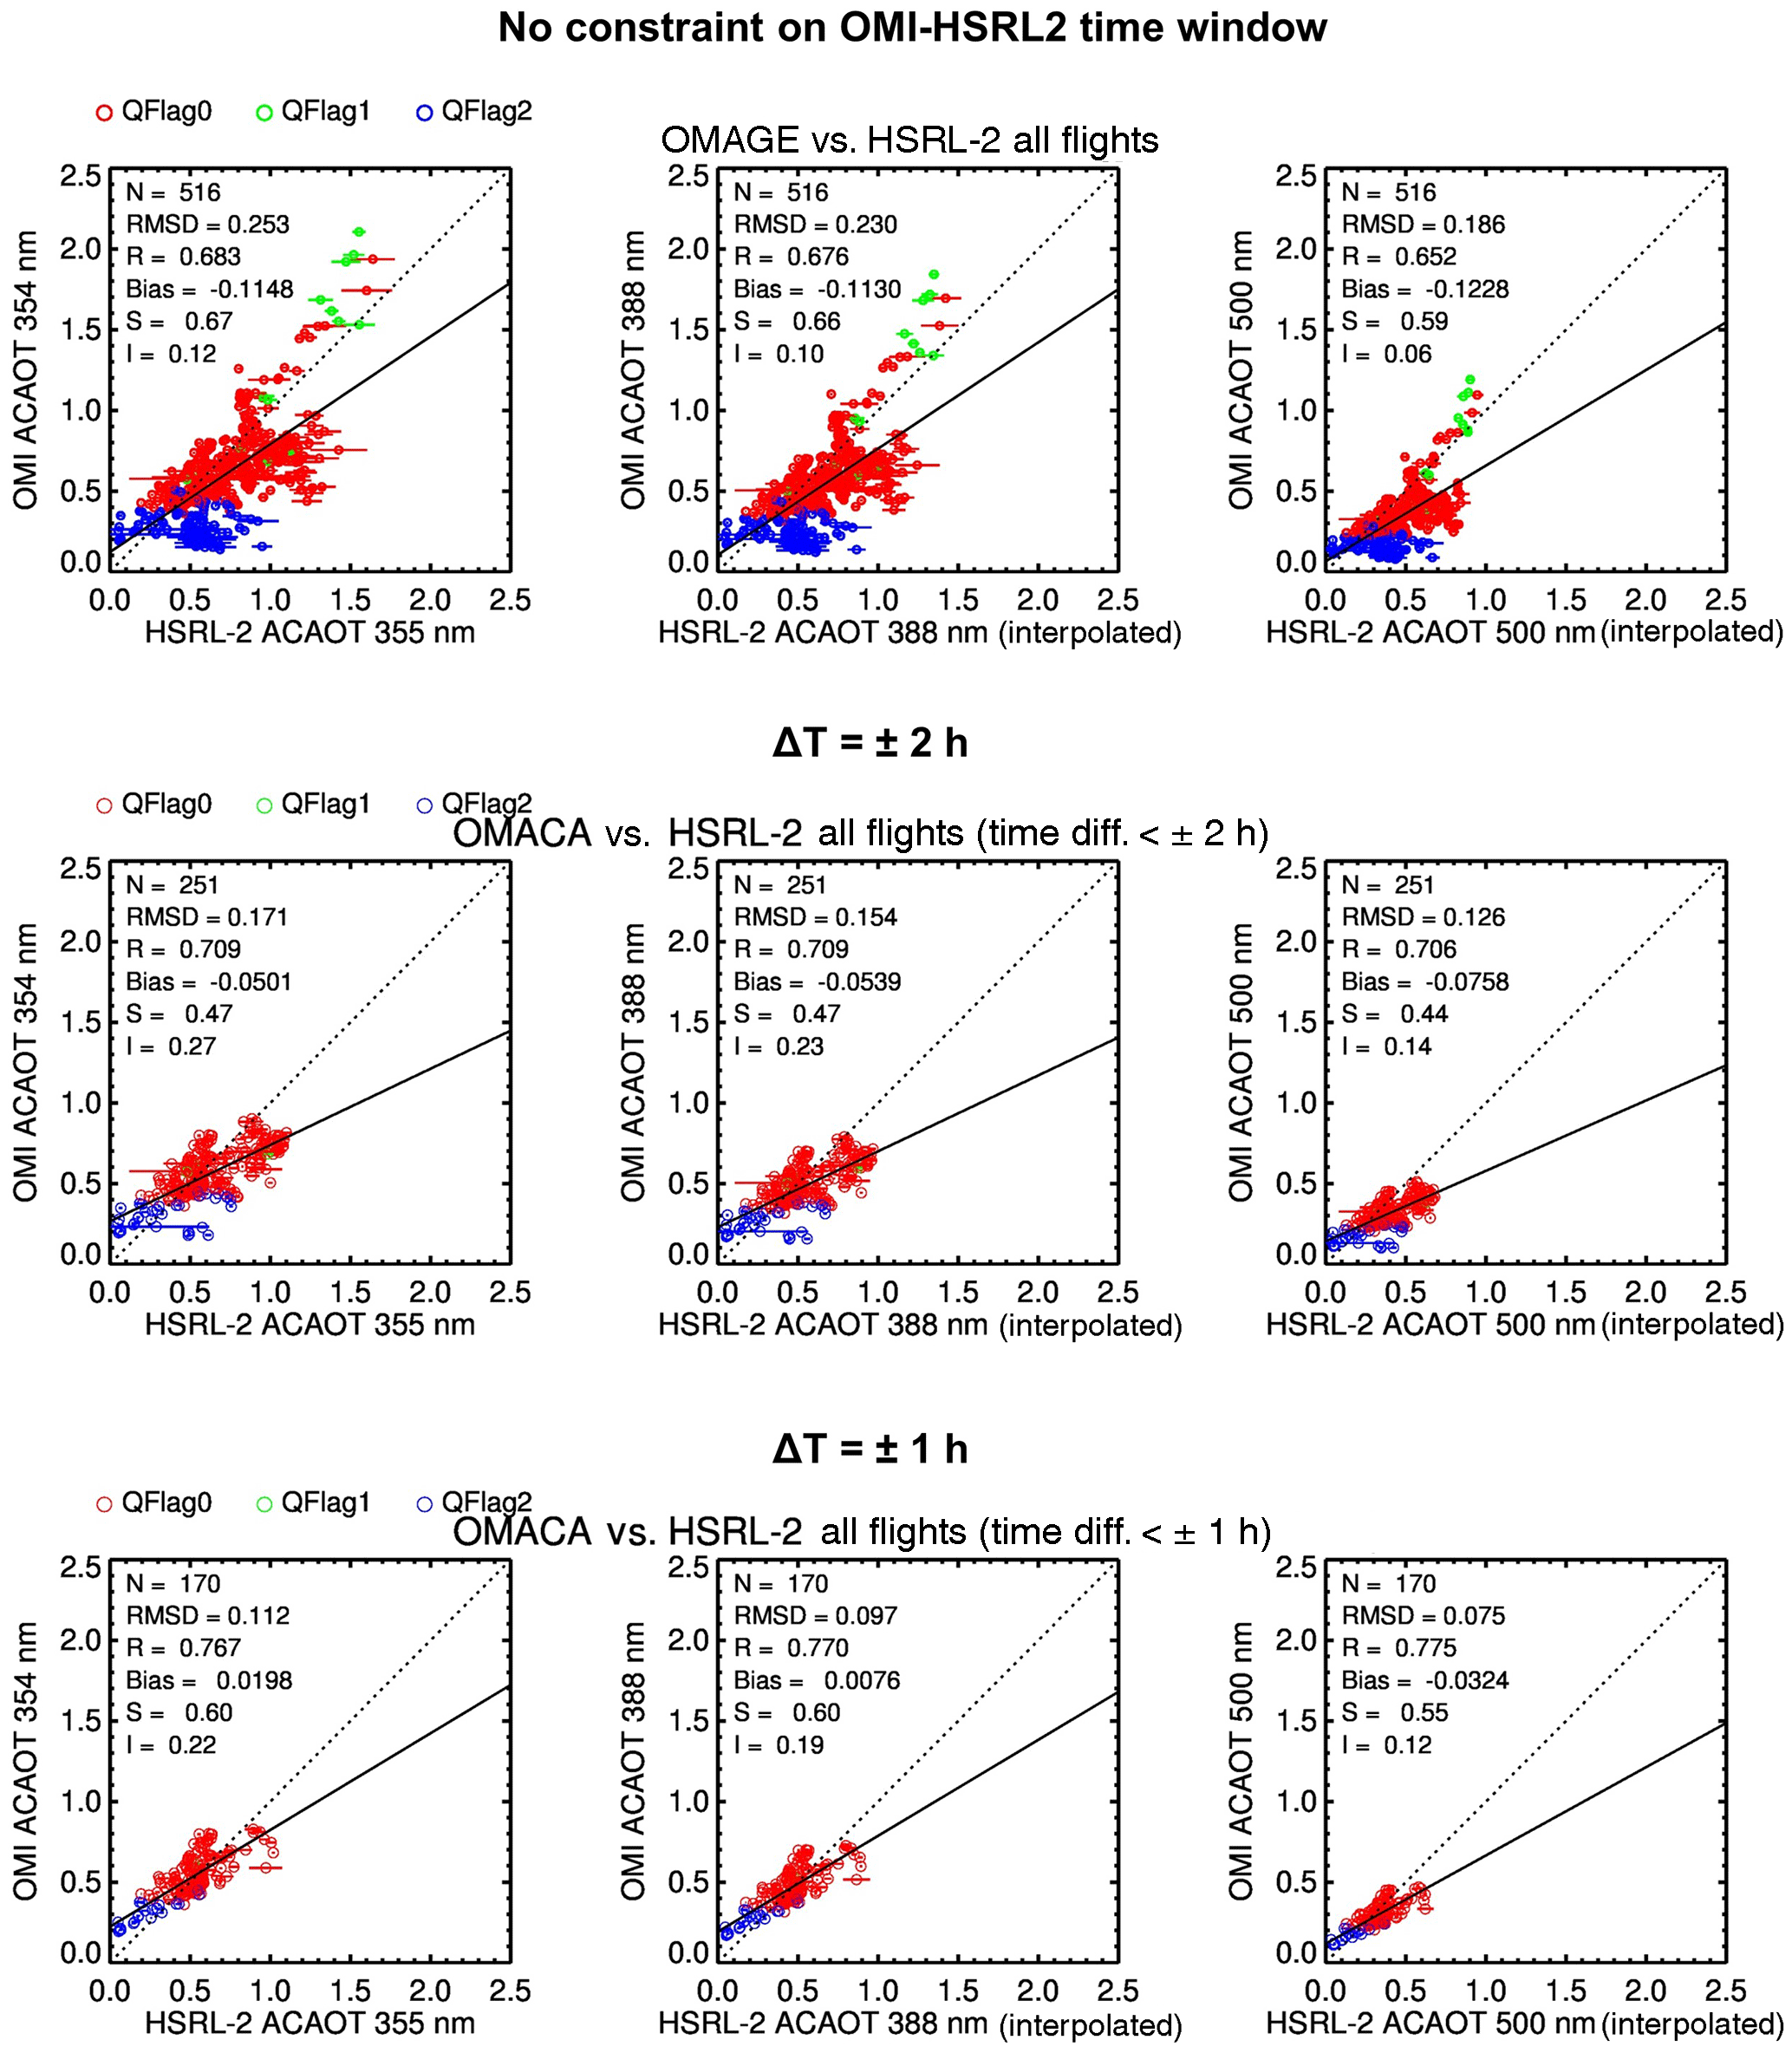
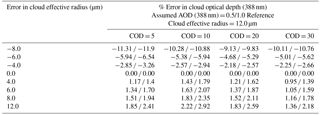
Figure 4Comparison of coincident and collocated spectral ACAODs measured and retrieved from HSRL-2 and OMI/OMACA for a total of seven ER-2 flights operated during ORACLES phase I operation over the southeastern Atlantic Ocean in August–September 2016. ΔT represents the absolute time difference (in hours) between the OMI overpass and HSRL-2 measurements.
Unlike the validation exercise of satellite-based aerosol retrievals in cloud-free skies, for which the ground-based direct measurements of AOD are amply available from hundreds of sites worldwide, such an assessment of ACAOD retrieved from the satellite is a challenging task due to the lack of reference aerosol measurements above the clouds. This is because the field campaigns in the past mainly focused on the measurements and characterization of aerosol properties in cloud-free conditions leaving vast cloudy areas unmonitored regarding the aerosol measurements. However, the airborne lidar such as high spectral resolution lidar (HSRL) when flying above the top of the aerosol layer can make direct measurements of aerosol extinction and thus provides AOD above the cloud. Also, airborne sunphotometers can make such measurements by flying above the cloud and below the aerosol layer. Using a limited dataset of the direct measurements of AOD above the cloud carried out by the NASA Ames Airborne Tracking Sunphotometer (AATS) and Sky-Scanning, Sun-Tracking Atmospheric Research (4STAR) sensors during different field campaigns, Jethva et al. (2016) have validated ACAOD retrieved using the “color ratio” method (Jethva et al., 2013), similar to the one presented here, but applied to the TOA visible-near infrared reflectances measured by the MODIS.

Figure 5The monthly mean distribution of cloudy-sky frequency of occurrence of above-cloud absorbing aerosols deduced from the 12-year record (2005–2016) of OMI's near-UV observations.
NASA's ORACLES (observations of aerosols above clouds and their interactions) (https://espo.nasa.gov/oracles, last access: 15 October 2018) is an ongoing multi-year field experiment supported by the NASA Earth-Venture Suborbital Program. ORACLES intended to make accurate airborne remote sensing and in situ measurements of aerosols and clouds in the southeastern Atlantic Ocean. At the time writing this paper (2018), ORACLES has already completed the two phases of its operation, 1st phase conducted in August–September 2016 and the 2nd phase in August 2017. During the 1st phase, HSRL-2 lidar developed by the NASA Langley Research Center made extensive measurements of smoke aerosols, including detailed vertical measurements of aerosol backscatter, extinction, and AOD at 355 and 532 nm, above shallow marine clouds, while deployed from NASA ER-2 aircraft. HSRL-2 measurements of AOD are routinely compared with that of AERONET and found to agree well (R = 0.98) with the latter. Taking advantage of highly accurate and valuable dataset of AOD above the cloud, we evaluate the ACAOD retrievals from OMACA for the cases of coincident and collocated OMI-HSRL2 measurements.
Figure 4 shows the comparison of spectral ACAODs measured by HSRL-2 and retrieved from OMI/OMACA for a total of seven ER-2 flights conducted during August–September of 2016 (26 August, 12, 16, 18, 20, 22, 24 September). HSRL-2 measurements falling within the boundaries of each OMI pixel, as defined in the OMPIXCOR product, were averaged and compared with the ACAOD value of the corresponding OMI pixel. The spatially collocated aircraft–satellite matchups were grouped according to the three different time windows, i.e., no time constraints (in hours), and ΔT of ±2 and ±1 h, where ΔT is the absolute time difference (in hours) between the OMI overpass and HSRL-2 measurements. To facilitate the direct comparison, ACAODs from HSRL-2 were interpolated to the OMI wavelengths of 388 and 500 nm following the Ångström exponent calculated using the 355–532 nm measurements. For the “no time constraint” group, the collocation procedure yields more than 500 matchup data points with a correlation, RMSE, and mean bias of 0.676, 0.23, and −0.11, respectively, at 388 nm. However, the comparison significantly improves when the matchups are restricted to the narrower time windows of ΔT of ±2 and ±1 h. For the ΔT = ±1 h matchup group, the comparison yields correlation, RMSE, and mean bias of 0.77, 0.1, and 0.007 with the slope and intercept of 0.6 and 0.19 of the linear regression. Aerosol mass is in constant motion depending on wind speed and direction and thus allows a wider time window between the satellite and aircraft measurements that may end up in a mismatch, which appears to the case for the relatively poor comparison when no time limits were imposed on the comparison. Noticeably, the OMI-HSRL2 comparison of ACAOD provides the best agreement at the 500 nm wavelength, where the OMACA does not perform inversion but reports ACAOD based on the spectral dependence of extinction assumed in the aerosol model.
The remaining discrepancies in the comparison could be primarily attributed to the inherent uncertainties associated with both types of measurements, particularly in the satellite retrievals of ACAOD as discussed in the previous section, and spatiotemporal heterogeneity in aerosol fields unresolved by the collocation method. Despite these uncertainties, a reasonable agreement of OMACA-retrieved ACAOD with more accurate measurements from HSRL-2 for the ORACLES campaign provided the credibility and confidence in the product and allowed us to use it for the regional and global analyses presented in the rest of the paper. While the primary focus of the paper is to highlight the ACAOD product, its spatiotemporal distribution, and initial validation against ORACLES/HSRL-2 observations, we are working with the ORACLES team to perform a detailed validation of the OMACA product, both ACAOD and COD, using airborne in situ and remote sensing measurements. The results of the validation analysis will be covered in a dedicated follow-up publication.
5.1 Spatial distribution
The regional and global climate impact of absorbing aerosols above cloud depends on the total aerosol loading above the cloud, the microphysical and optical properties of aerosols and underlying cloud deck, as well as the spatial and temporal extent of the aerosol–cloud overlap scenes. We have carried out a global frequency of occurrence of absorbing aerosols above the cloud (FOACA) to identify the regions of frequent aerosol–cloud overlap. We adopt a bi-parametric approach to identify the scenes of absorbing aerosols overlaying the low-level cloud decks, as described in Sect. 2.2.3. FOACA is referenced to the cloudy-sky observations and defined as the ratio of the total number of days with an ACA condition (LER > 0.25 and UVAI > 0.8) to the total number of days with cloudy-condition (LER > 0.25). Additionally, we take advantage of the OMMYDCLD product to calculate the geometric cloud fraction for each qualifying OMI pixel. For the FOACA analysis, we adopt a less strict threshold of cloud fraction of 0.5. Since the main purpose of this analysis was to identify the presence of absorbing aerosols and cloud in the same atmospheric column and not to quantitatively retrieve ACAOD, a less strict value cloud fraction should adequately represent both aerosols and clouds in the corresponding pixel.
Figure 5 shows the monthly averages of FOACA derived from the 12-year record (2005–2016) of OMI following the above-described method. This analysis reveals several important regions of the world where the overlap of absorbing aerosols over clouds are frequently observed. During July through September, carbonaceous aerosols generated from agricultural burning over the central and southern Africa are mobilized over the semi-permanent low-level stratocumulus water clouds in the southeastern Atlantic Ocean (Torres et al., 2012; Alfaro-Contreras et al., 2016; Meyer et al., 2015). With more than 80 % of the cloudy-sky observations identified as aerosols above cloud during the Northern Hemisphere summer, the southeastern Atlantic Ocean is considered to be one of the prime study regions the world and also a natural laboratory to study the aerosols above cloud phenomenon. The springtime biomass burning activities such as burning of forest, savanna/grassland, and crop residue over Southeast Asia (SEA) countries, including Thailand, Myanmar, Laos, Cambodia, and Vietnam release significant amounts of trace gases and carbonaceous aerosols into the atmosphere (Elvidge and Baugh, 1996; Streets et al., 2003). Natural color images from the satellite show that smoke particles emitted from these activities were mobilized under the influence of winds over the widespread cloud deck over southern China, creating the appearance of the darker cloud deck. FOACA results show that about 20 %–40 % of the cloudy days are marked with smoke aerosols overlying bright cloud deck. Additionally, the smoke–cloud overlap seen in the OMI data is not merely confined to over land, but also extended over the western Pacific Ocean, albeit less often.
Dust storms originated over the Sahara Desert in northern Africa during the summer are often transported across the tropical Atlantic Ocean (Prospero et al., 2002; Kaufman et al., 2005; Huang et al., 2010; Yu et al., 2015). A substantial part of the dust transport occurs over the low-level stratocumulus clouds. The FOACA analysis shows that the presence of mineral dust aerosols above the cloud accounts for 40 %–80 % of the total cloudy-sky OMI observations. Similarly, mineral dust particles originated from the Arabian Peninsula, Iran and Pakistan often mobilized over the Arabian Sea during the active months (July–August) of the southwest Indian summer monsoon (Moorthy et al., 2005; Satheesh et al., 2006). The transported dust frequently overlies the low-level clouds such that the dust-cloud overlap accounts for the 40 %–60 % of the cloud-sky days.
Figure 6(a) Chart showing the time evolution of OMI row anomaly and (b) cloudy-sky (LER388 > 0.25) UVAI. (c) Monthly time series of the global, cloudy-sky frequency of occurrence (in percentages with respect to the total cloudy-sky observations) of absorbing aerosols above cloud derived using OMI full scan (Rows 1 to 60) (blue) and anomaly-free observations (Rows 1 to 23) (red). Solid lines represent the linear regression fits to the respective time-series data.
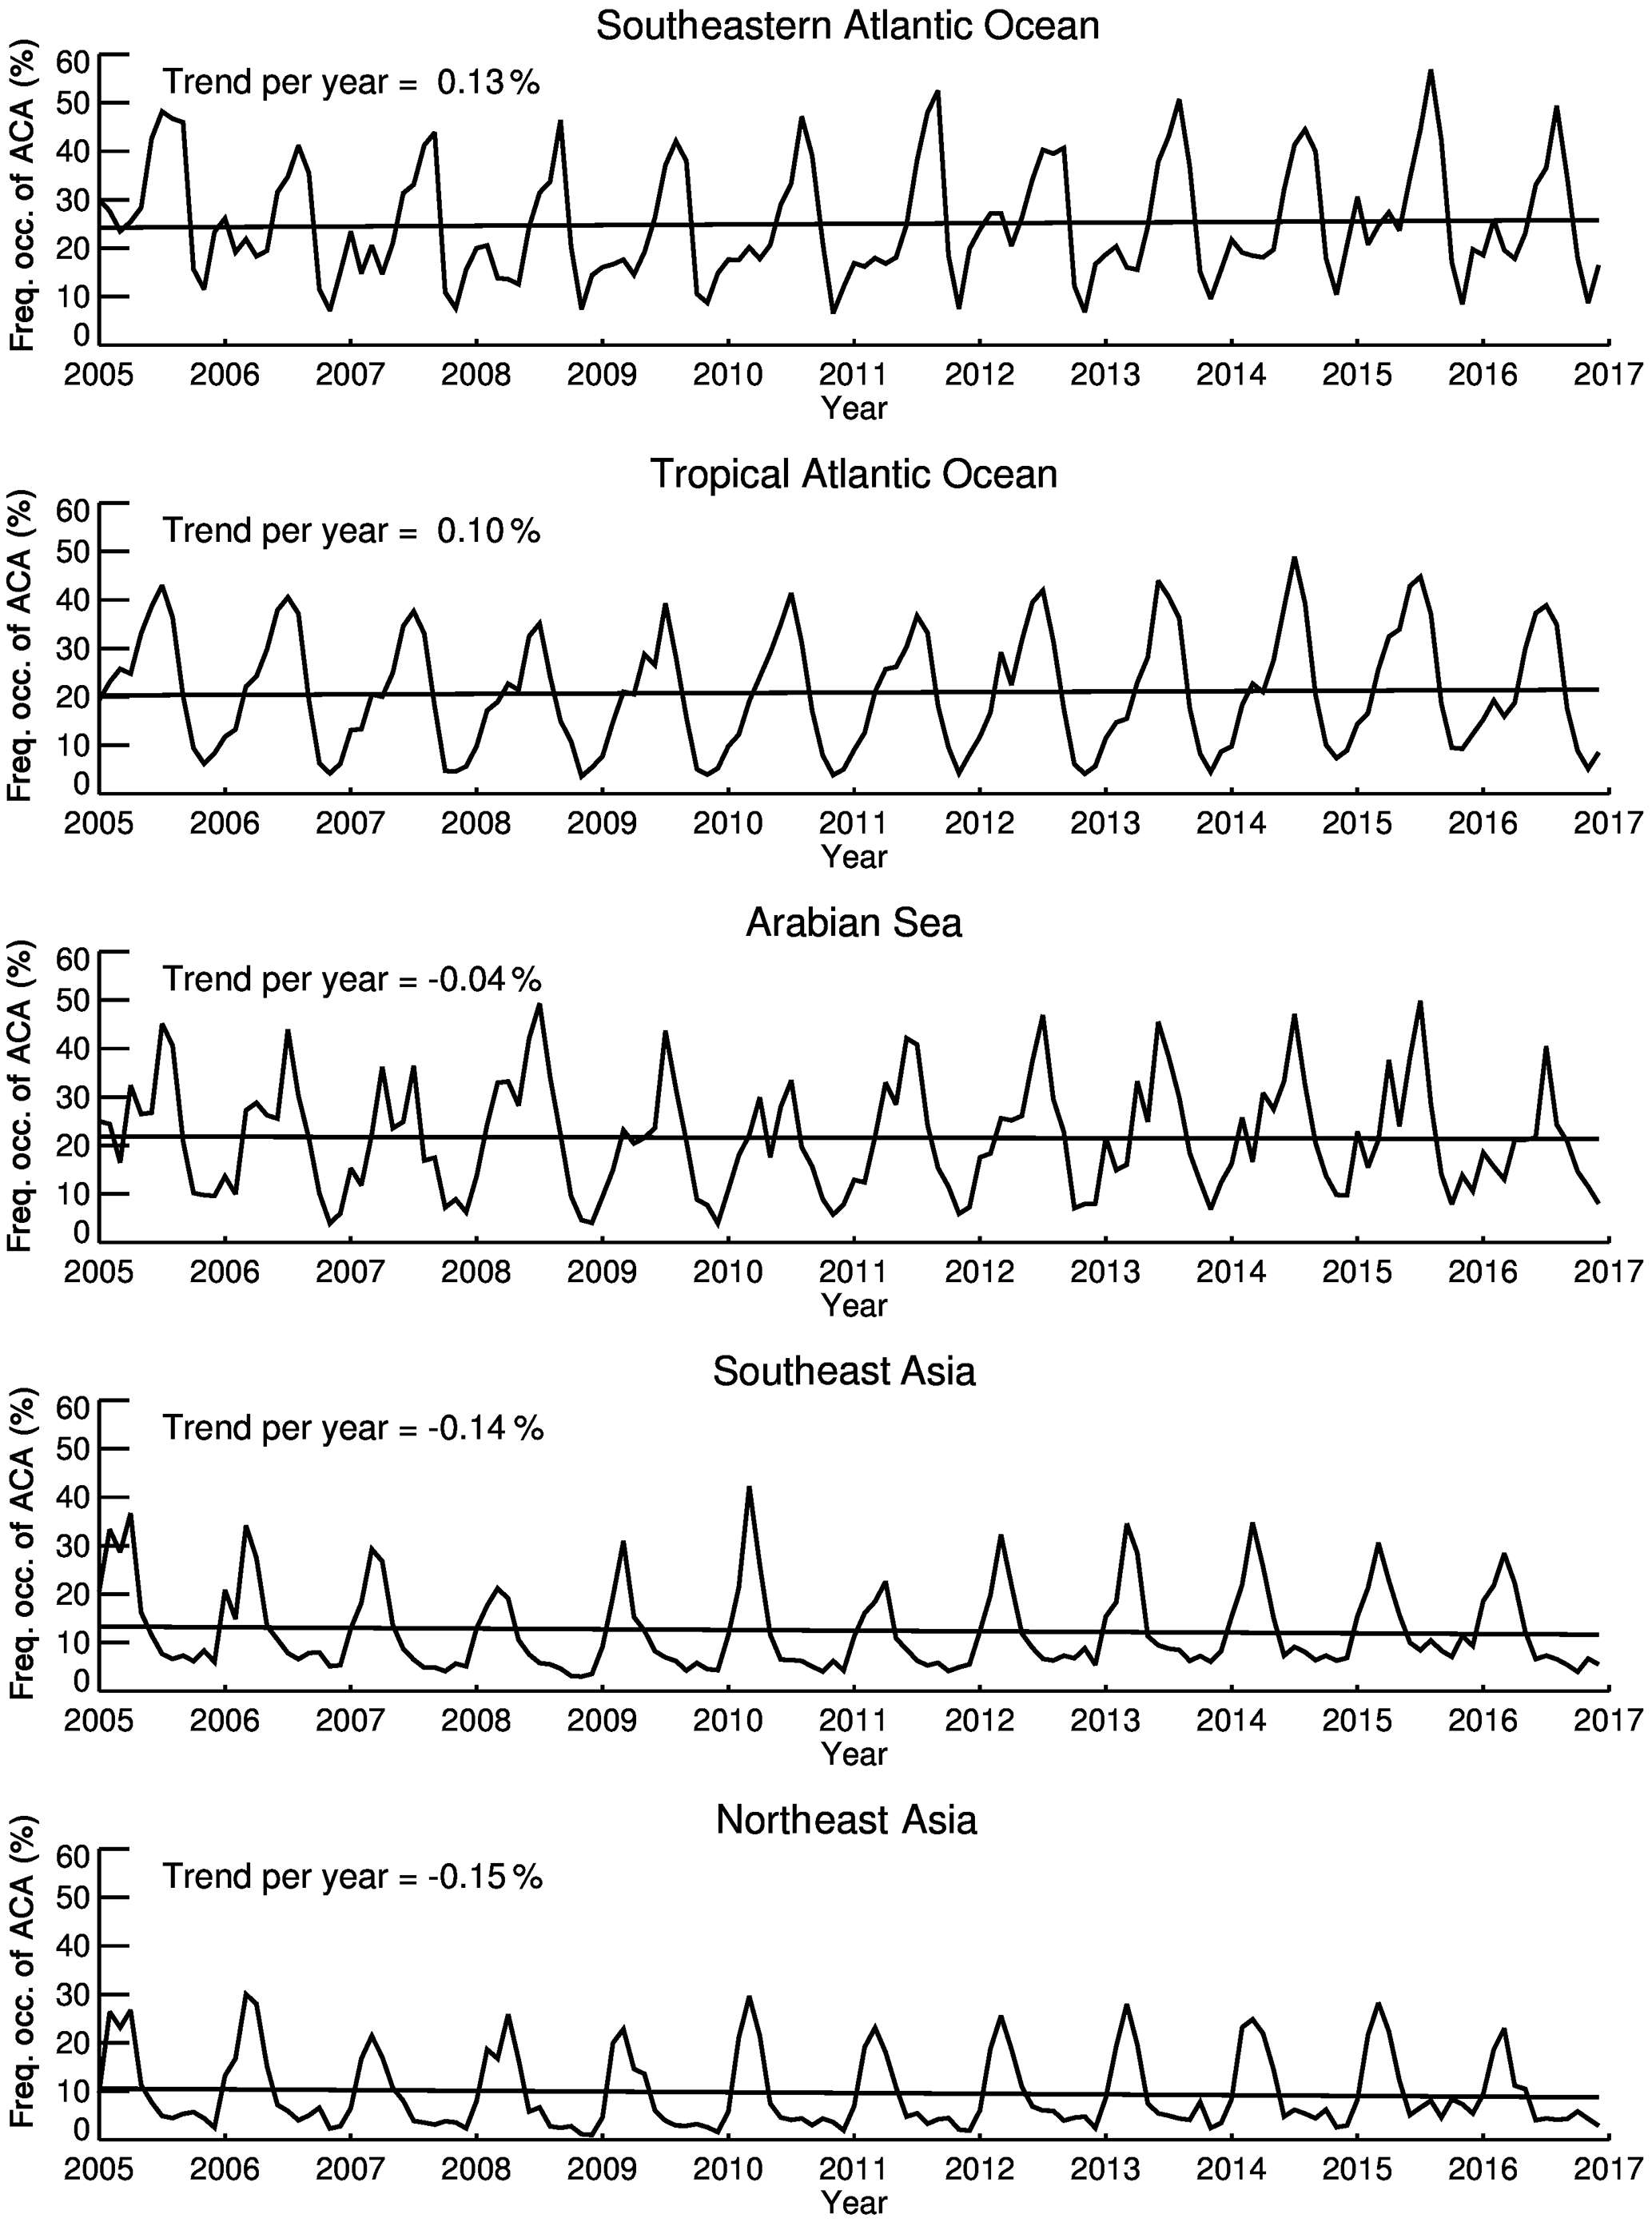
Figure 7Monthly time series of the regional cloudy-sky frequency of occurrence (in percentages with respect to the total cloudy-sky observations) of absorbing aerosols above cloud derived using OMI anomaly-free observations (Rows 1 to 23). Solid lines represent the linear fit to the respective time-series data.

Figure 8Global distribution of monthly mean above-cloud AOD (388 nm) deduced from the 12-year (2005–2016) OMI observations.
The springtime Asian outflow of air pollutants, both anthropogenic and mineral dust, across the Pacific Ocean is documented in various studies (Liu et al., 2003; Huebert et al., 2003). The FOACA maps for the April and May months revealing the transport pattern encompasses the entire northern Pacific basin from the eastern coast of Asia to the western coast of North America with 10 %–30 % of the cloudy-sky scenes identified as aerosols over the clouds. One of the salient features of the FOACA analysis is the smoke transport from southern Africa to the Indian Ocean. Carbonaceous aerosols emitted from the fires in southeastern Africa during the late biomass burning season (September) are often taken away from the continent along the eastward flow and advected above the clouds over the southern Indian Ocean (Sinha et al., 2004). The FOACA map for the month of September highlights that the transport of smoke over the cloud is confined to within the latitude range 35 to 20∘ S with 40 %–50 % (20 %–30 %) cloudy scenes marked by the smoke overlaying clouds just off the coast of southeastern Africa (over the western coast of Australia).
Prior to our study, Devsthale and Thomas (2011) and Zhang et al. (2016) have studied the cloud-sky FOACA over the global ocean using 4 years and 8 years of CALIOP observations, respectively. The results presented in these papers are largely consistent with the ones derived from OMI observations over oceanic regions that are influenced by long-range transport of smoke and dust aerosols from continents as described above.
5.2 Long-term trends in FOACA
Since mid-2007, OMI observations have been affected by a possible external obstruction that perturbs both the measured solar flux and Earth radiance. This obstruction affecting the quality of radiance at all wavelengths for a particular viewing direction is referred to as “row anomaly” since the viewing geometry is associated with the row numbers on the charge-coupled device detectors. The row anomaly issue was detected for the first time in mid-2007 for a few rows, which over the period of operation expanded to other rows in 2008 and later. Figure 6a shows the current status of the row anomaly as identified by the anomaly algorithm developed for the NASA OMI total ozone product OMTO3 (Schenkeveld et al., 2017). At present, about half of the total 60 rows across the track are identified and flagged as row anomaly affected positions for which no physical retrievals are being performed.
Above it was examined and concluded that for the derivation of a meaningful trend in the global FOACA, only those rows or positions of the OMI instrument should be considered that are mostly unaffected by the row anomaly throughout the OMI operation period (Jethva, 2015). This is because UVAI exhibits a dependency on the scan angle in which the westward viewing geometry (left side of the scan, row numbers 1–30) shows higher values than those measured for the eastward-looking geometry (right side of the scan, row number 31–60). The row-averaged UVAI for the OMI operation period shown in the middle panel of Fig. 6b reflects the asymmetry in UVAI. OMI lost its most rows on the right side of the scan post-2007 operation due to the row anomaly. The remaining rows on the left side of the scan, where the UVAI values are larger than those on the right side of the scan, introduces a positive shift in the absolute values of UVAI, which leads to an overall positive trend in the FOACA. Therefore, the global trend (%) in FOACA calculated using all rows of OMI gives a positive trend (0.178 per year) as shown in the bottom panel of Fig. 6c. However, when the global trend is calculated using observations from rows which are mostly free of row anomaly throughout the OMI operation period, i.e., row number 1–23, the FOACA shows a negligible trend (0.022 per year). Regionally, we find similar results of positive trends in FOACA when all rows of OMI were used in the calculations (not shown here) against the statistically negligible trend when observations from rows 1 to 23 were considered, as shown in Fig. 7. Based on the present findings and also according to the results published in an interactive comment (Jethva, 2015), we strongly recommend the users of the OMACA product to use only those observations that are free of row anomaly throughout the OMI operation (2004 to present) for the trend related analysis.
6.1 Global distribution of above-cloud AOD
Figure 8 shows the global distribution of ACAOD (388 nm) derived from OMACA algorithm applied to the 12-year long record of OMI observations. The OMACA Level 2 retrievals with algorithm quality flag “0”, “1”, and “2” were averaged on every 0.5∘ × 0.5∘ spatial grid to derive a global monthly gridded dataset. Also, a threshold of 0.75 in the geometric cloud fraction, calculated using the OMMYDCLD product, was used to filter out the L2 pixels with broken cloud fields. Only those grids are considered in the long-term monthly averages for which (1) the total number of days with valid retrievals for a particular month is greater than 3, and (2) number of years greater than 3 out of the 12-year record. The distribution plot reveals moderate to high aerosol loading above the clouds over several regions of the world.
During the Northern Hemisphere summer, larger magnitudes of ACAOD (> 0.7) are retrieved over the southeastern Atlantic Ocean along the coast of Namibia and Angola. Noticeably, the area coverage of ACAOD expands substantially as the season progresses with retrieval coverage confined to within 1500 km from the western coast of Africa in June to encompassing almost the entire Atlantic Ocean basin (∼ 5000 km) in September. The largest magnitudes of ACAOD are observed in August and September when biomass burning activities also peak in the central and southern Africa. In March and April, biomass burning in Southeast Asia emits large amounts of carbonaceous aerosols, which under the influence of winds are transported above the bright cloud deck over southern China, where OMACA retrieves large values of ACAOD (> 0.8) in the vicinity of burning areas. Noticeably, the area-coverage of aerosol–cloud overlap extends far from the source burning region to over the East China Sea, albeit with a decreasing gradient in the retrieved ACAOD. During the late biomass burning season (September), carbonaceous aerosols emitted from the fires in southeastern Africa often drift away from the continent along the eastward flow (Garstang et al., 1996), and advected above the clouds over the southern Indian Ocean. The spatial pattern of retrieved ACAOD encompasses the entire Indian ocean basin stretching from the southeastern coast of Africa with ACAOD in the range 0.4–0.5 to the western coast of Australia with reduced ACAOD in the range 0.2–0.3.
During the Northern Hemisphere summer months, ACAOD in the range 0.3–0.5 is observed over the tropical Atlantic Ocean where the transport of dust takes place from the Saharan desert to over the oceanic clouds. The area coverage of the retrievals is at its maximum in July, spanning half of the tropical Atlantic Ocean basin with maximum ACAOD (∼ 0.5) just off the coast of northern Africa. Also, a gradient in ACAOD is noted over the northern Arabian Sea during summer, owing to the dust transport from the Arabian region to over the low-level clouds over the ocean.
The OMACA product also captures springtime (April and May), long-range trans-Pacific transport of dust aerosols originated over the Gobi and Taklamakan Deserts possibly mixed with urban pollution and smoke along the transport pathways and over the clouds. The magnitude of retrieved ACAOD of the above-cloud Asian outflow ranges from 0.4 to 0.5 near the eastern coast of northeastern Asia, reducing to 0.2–0.3 along the transport over the mid-Pacific and up to the western coast of North America.
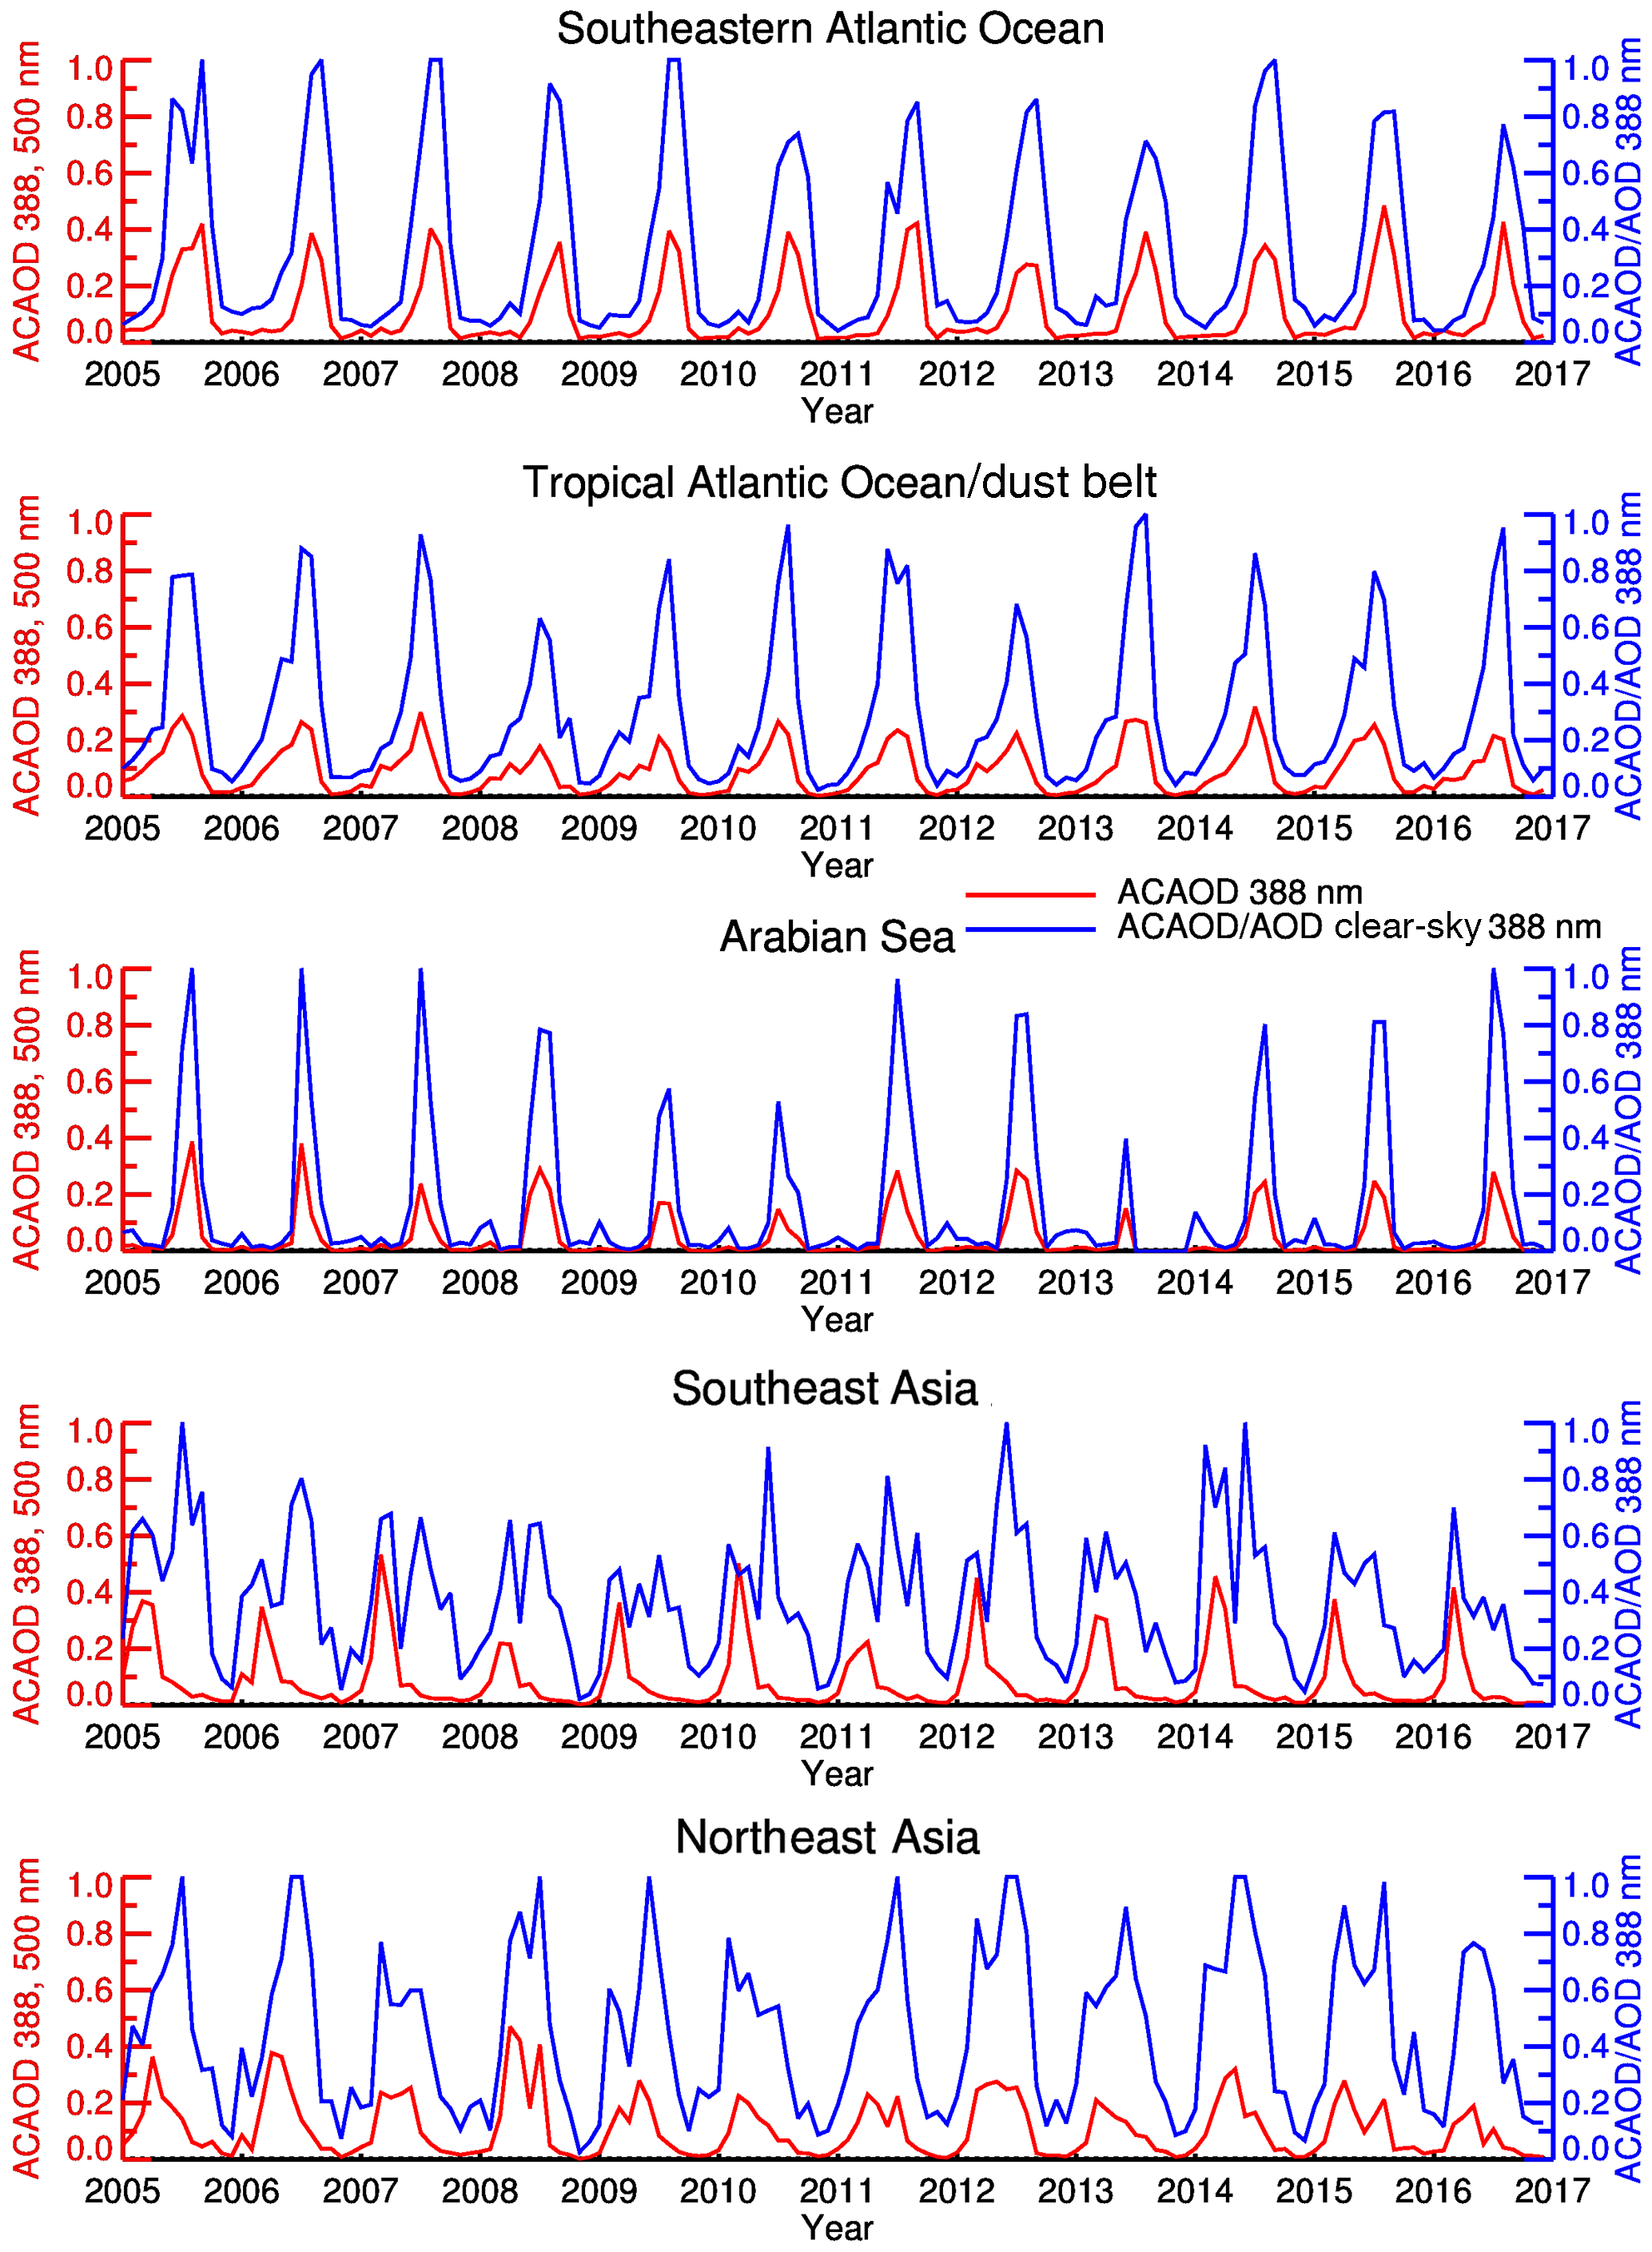
Figure 9Time series of regional monthly mean above-cloud AOD at 388 nm (left y axis, color: red) and the ratio of above-cloud AOD and cloud-free AOD (right y axis, color: blue), both at 388 nm, derived using the OMACA and OMAERUV products, respectively.
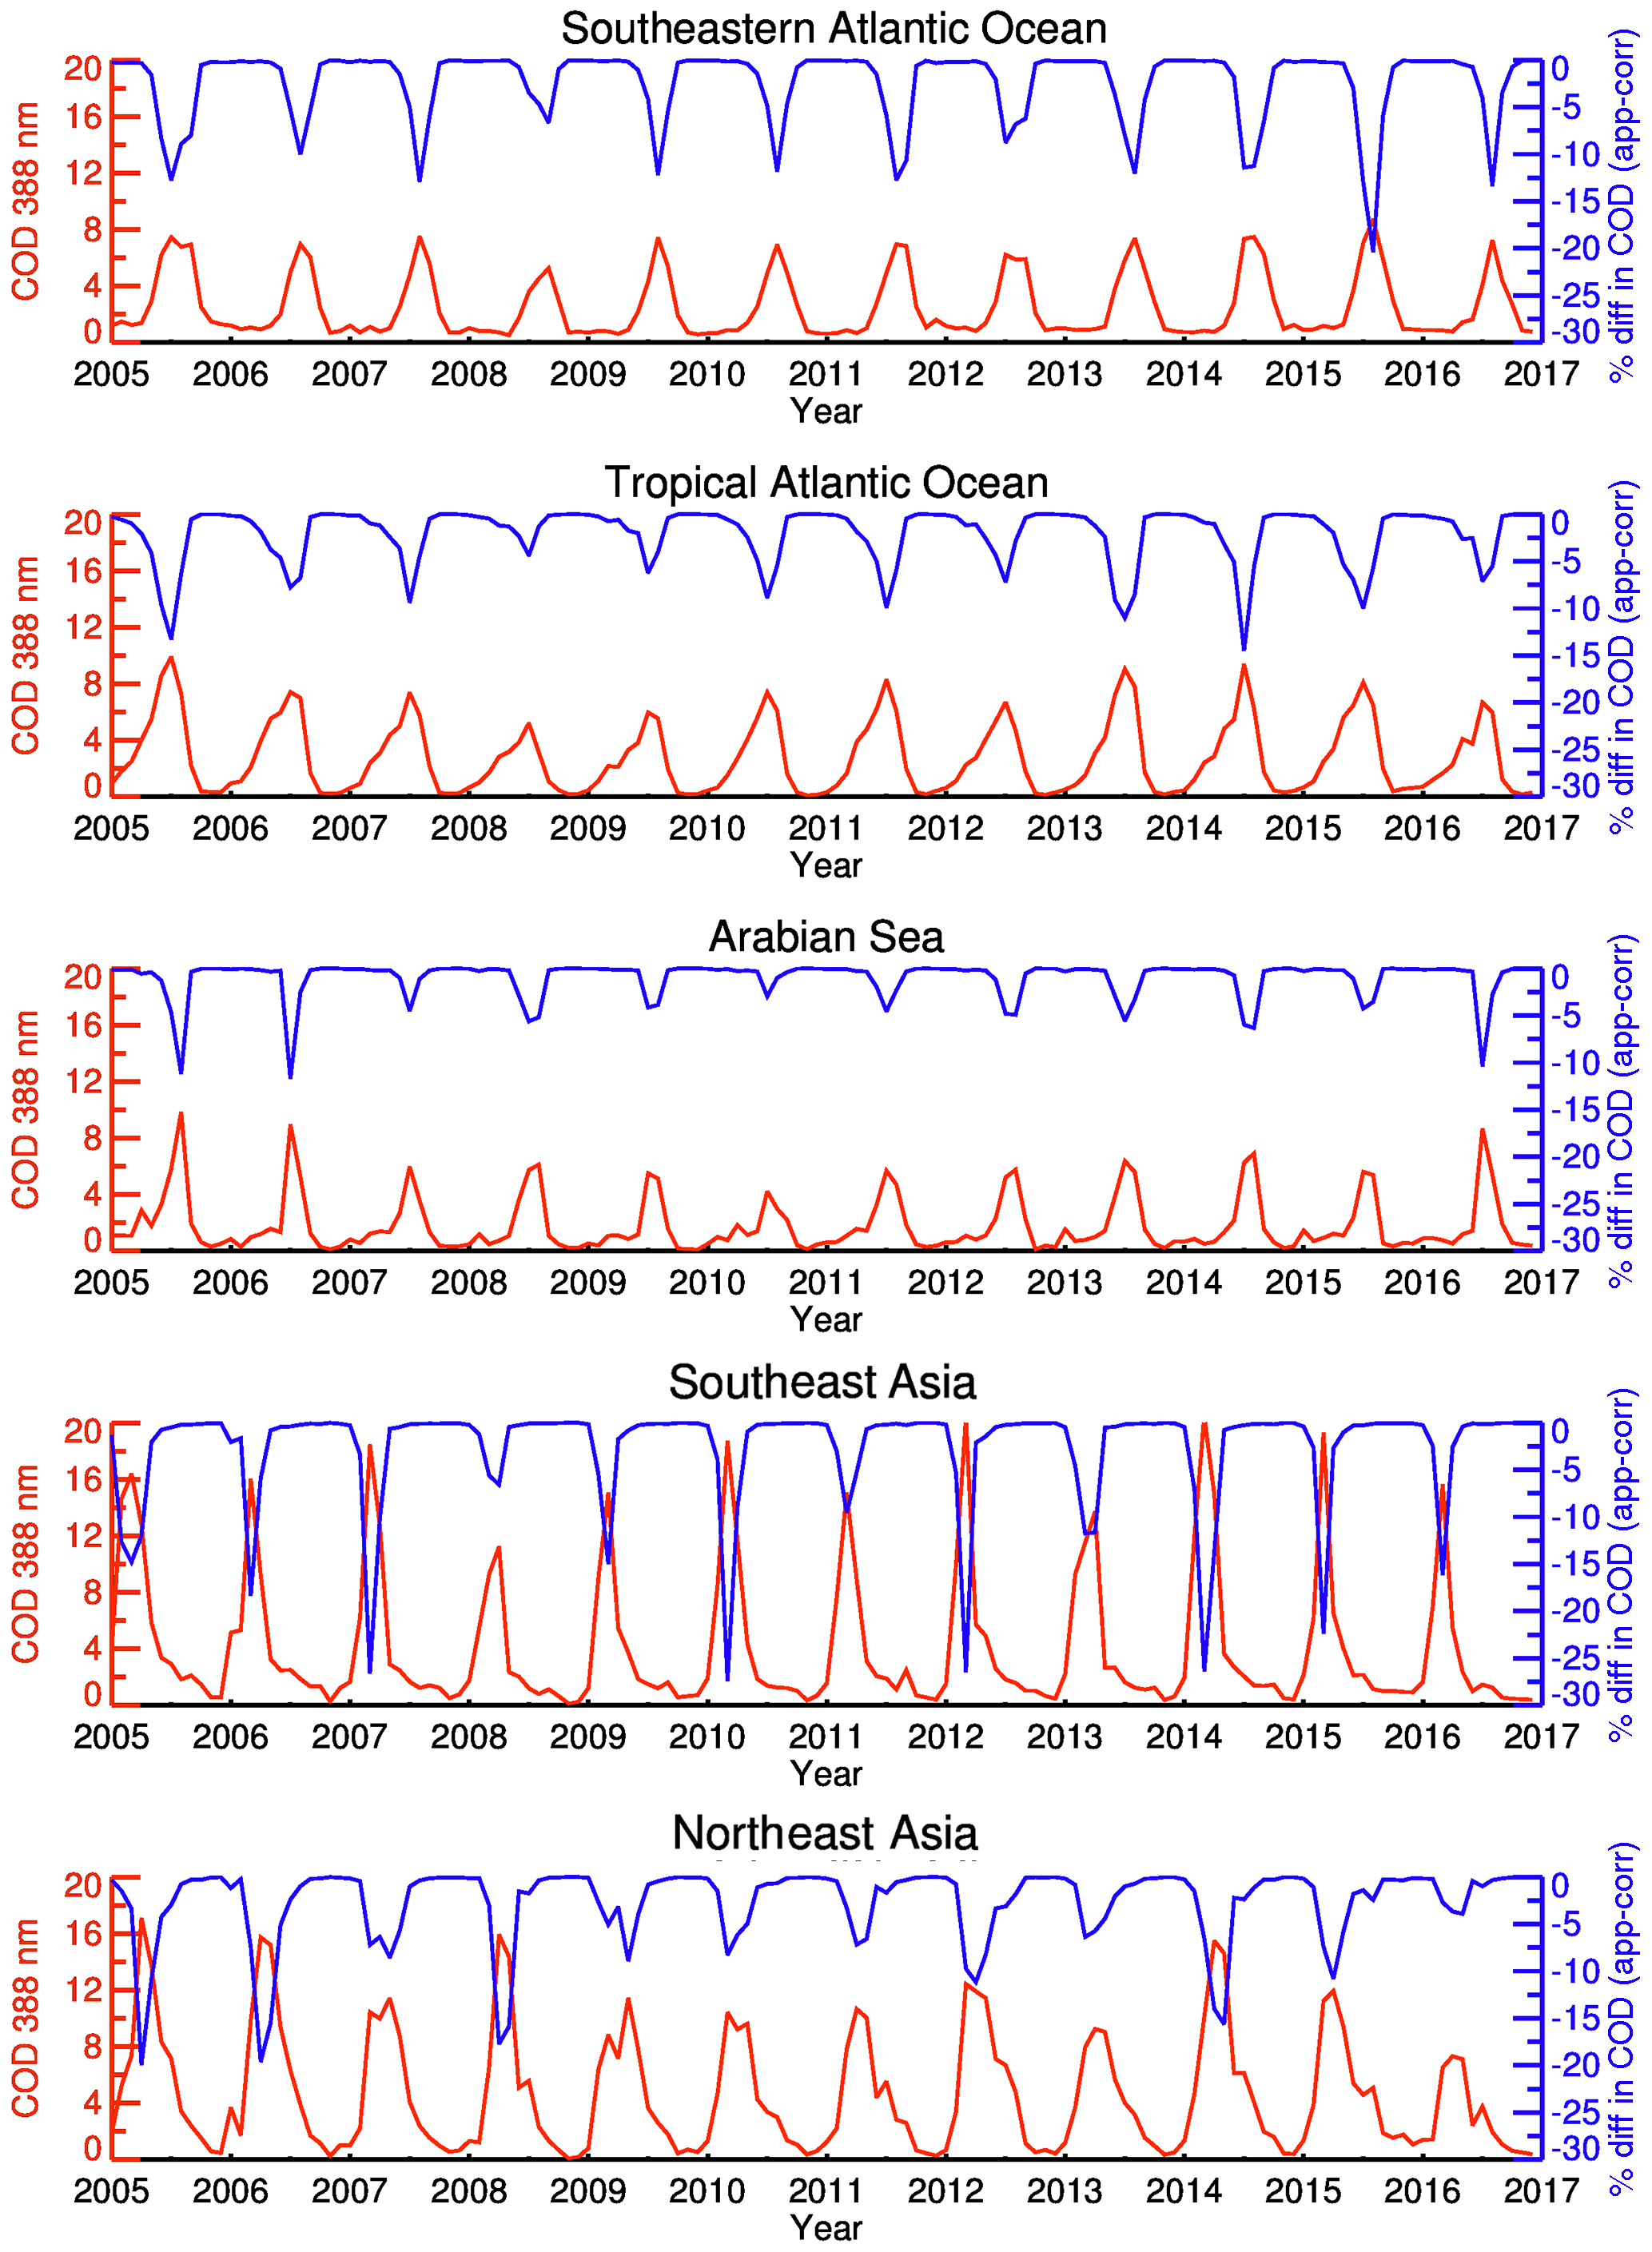
Figure 10Time series of regional, monthly mean aerosol-corrected (left y axis, color: red) COD (388 nm) derived using a 12-year long OMACA record. The y axis on the right side (color: blue) depicts a time series of the % difference between simultaneous retrievals of apparent/non-corrected and aerosol-corrected COD for the same period and regions. Only anomaly-free observations of OMI (Rows 1 to 23) were used in the calculations.
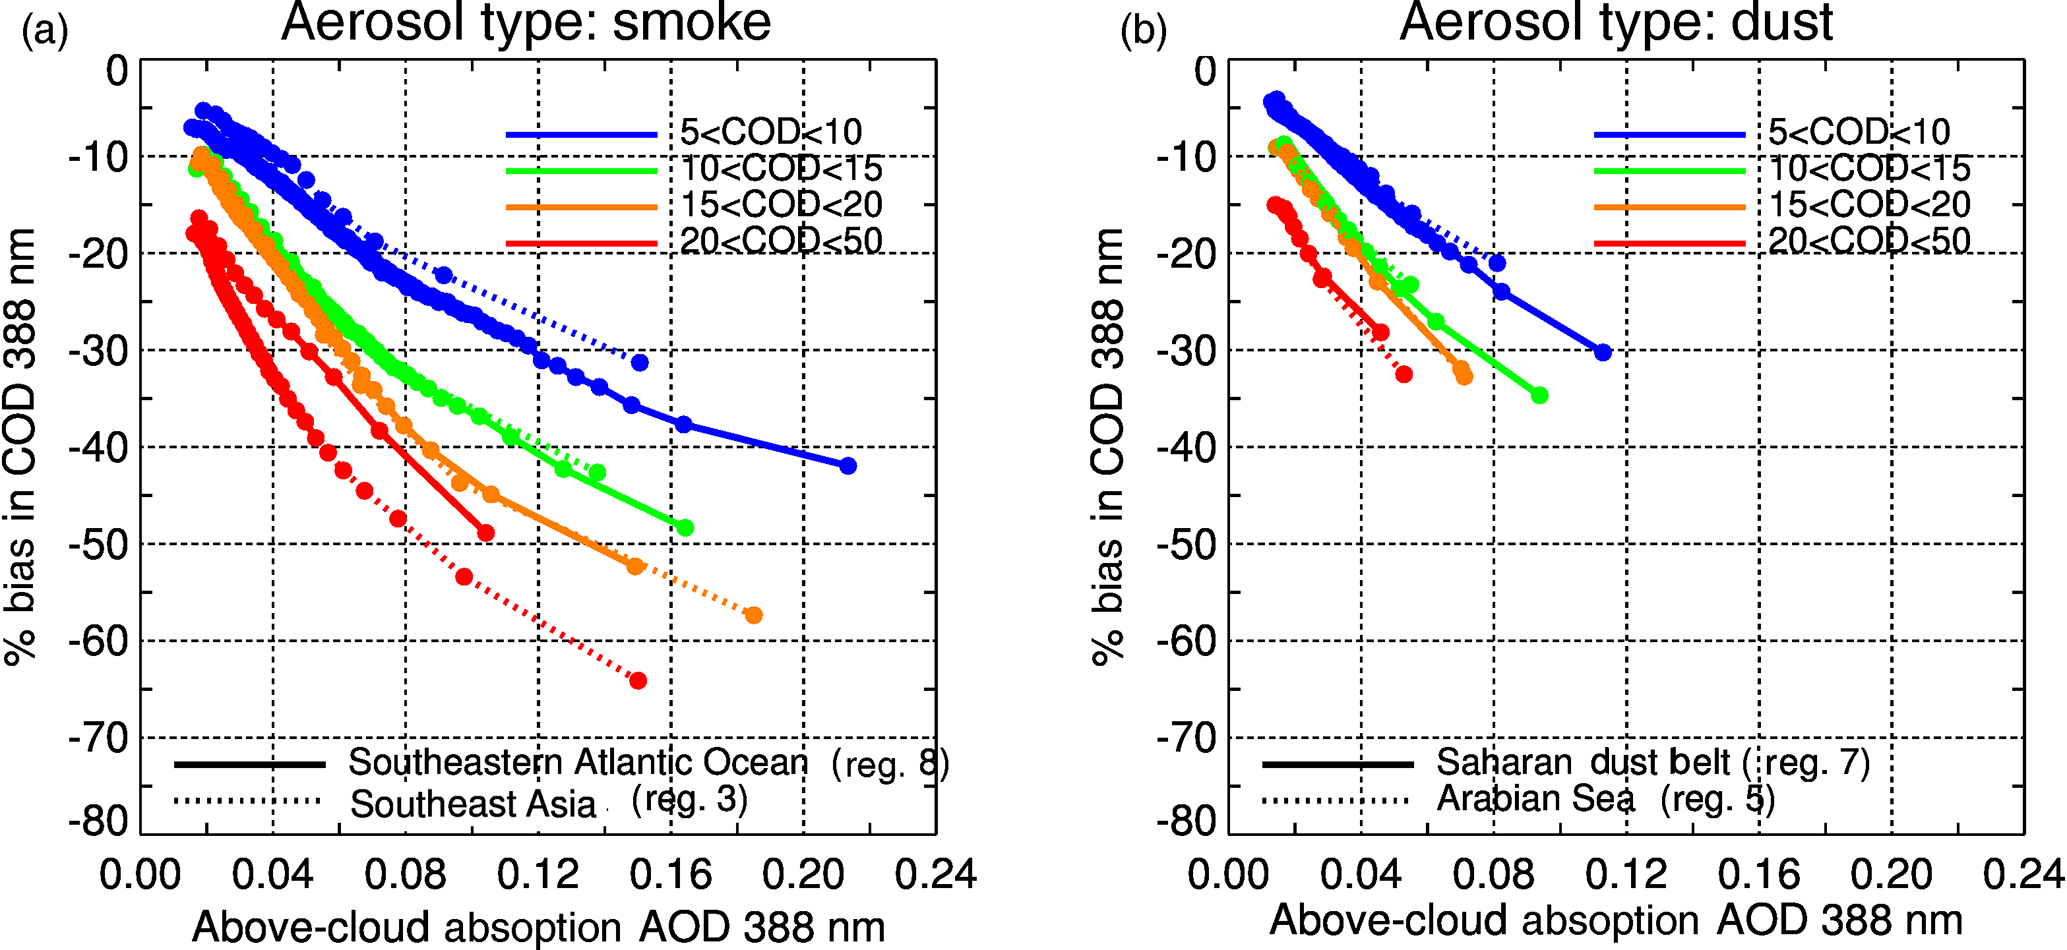
Figure 11Percent difference in COD (aerosol-corrected minus non-corrected) as a function of above-cloud absorption AOD (388 nm) for the smoke (a) and dust (b) dominated regions. Different color codes represent the relationship for a discrete range of aerosol-corrected COD.
6.2 Regional time series of above-cloud AOD
Figure 9 (left y axis, color: red) shows the regional, monthly mean time series of ACAOD (388 nm) for the five prominent regions of the world where the frequent overlap of absorbing aerosols above the cloud is observed. The regional monthly mean ACAODs were calculated in the following way. For each region and month, an averaged value of ACAOD was calculated, and a number of Level 2 observations that went into the averaging was also stored. Subsequently, a set of 12-monthly averaged values scaled by multiplying them with a fraction that is defined as the ratio Level 2 observations for the individual months to the maximum number of Level 2 observations found over the 12-year period (2005–2016) over the same region. Scaling the monthly averaged value with the calculated fraction ensures the representativeness of ACAOD statistics over the spatial and temporal domains and thus facilitates the intercomparison. For instance, a comparison of the two averaged values derived from two different set of statistics, i.e., under-populated and adequately populated, likely results in the misinterpretation of monthly time-series data. The procedure described above was applied to the OMACA observations for the five prominent aerosol–cloud overlap regions to produce the time series shown in Fig. 9.
The temporal evolution of ACAOD (388 nm) over the southeastern Atlantic Ocean exhibits a repetitive seasonal cycle with monthly mean values reaching up to 0.4 during the dry biomass burning season. Although an inter-annual variation is apparent in the time series, e.g., lower and higher ACAOD during the burning season of 2012 and 2015, no significant trend is noticed over the 2005–2016 OMI record. Over the tropical Atlantic Ocean, the monthly ACAOD values fall in the range 0.2–0.3 during summer months when dust aerosols from northern Africa are mobilized over the low-level oceanic stratocumulus clouds. The inter-annual variations of ACAOD over the Arabian Sea are found to be significant with the monthly value of 0.4 during the first 2 years of the record (July and Aug of 2005 and 2006) followed by a drastic reduction in the aerosol loading above the cloud during the middle part of the record. The springtime biomass burning and resulting smoke aerosols above cloud over Southeast Asia (4th panel) is evident in the time series where the peak values of monthly ACAOD vary from 0.2 to 0.5 depending on the year.
It is important to quantify the fraction of the total columnar aerosol loading, situated above the cloud, for several applications. For instance, the cloud-free aerosol retrieval represents the aerosol in the entire vertical column while avoiding the cloudy-sky scenes. Therefore, the statistics of cloud-free retrievals over the regions with frequent aerosol–cloud overlap becomes restrictive, leading to partially incomplete representation of aerosol properties on a regional and temporal scales. This kind of scenario affects the calculations of regional climatology, radiative forcing assessments, and aerosol transport. However, the availability of above-cloud (OMACA) and cloud-free total columnar (OMAERUV) AODs from OMI allows us to estimate the fractional aerosol loading above the cloud. The ratio of monthly mean ACAOD to the total columnar AOD (both at 388 nm) displayed on the right-side y axis of Fig. 9 shows that the fractional aerosol loading over the cloud can be as large as 80 %–100 % during the peak months of biomass burning and dust transport over the respective regions. A significant fraction of the aerosol column above clouds indicates that the long-range transport of partially absorbing aerosols occurs in the free troposphere and over the low-level clouds. However, the above-cloud and total column AOD are comparable in magnitude during peak aerosol activities,
6.3 Regional time series of aerosol-corrected cloud optical depth
Figure 10 displays the monthly mean evolution of aerosol-corrected COD (left y axis, color: red) for the five prominent regions of aerosol–cloud overlap. The monthly mean values were calculated following the procedure described in the previous section. The seasonal cycle of COD over the southeastern Atlantic Ocean exhibits repetitive behavior with the maximum value of COD reaching up to 8.0 during the peak burning period. On the other hand, the monthly cycle of COD over the tropical Atlantic Ocean (Arabian Sea) during the same season shows more considerable interannual variations with COD in the range 6 to 14 (4 to 10). The magnitudes of aerosol-corrected COD over Southeast Asia during the springtime biomass burning season (March–April) are found to be the largest among five regions considered here with values ranging between 16 and 20 except for the years 2008 and 2013 when COD was less than 12.
The right-side y axis of Fig. 10 (color: blue) depicts the concurrent monthly time series of the percent difference between apparent (non-corrected) and aerosol-corrected CODs the magnitudes of which represent the error in the retrieval of COD at 388-nm wavelength with reference to the corrected COD if the presence of aerosols is ignored in the inversion. Note that only those COD retrievals are considered here for which the absorbing aerosols are identified above the clouds. While there is a significant variation in the magnitudes of the percentage difference between the two CODs over different regions, generally larger errors are associated with the higher aerosol-corrected COD and ACAODs (shown in Fig. 9). More discussion on the impact of aerosol absorption on cloud retrievals is presented in the next section.
6.4 Impact of aerosol absorption on cloud retrievals
The presence of absorbing aerosols above cloud obstructs the light reflected by the cloud top, and thus reduces cloud-reflected upwelling UV (Torres et al., 2012), VIS, and NIR radiation (Jethva et al., 2013; Meyer et al., 2015) reaching the TOA. Therefore, cloud retrievals of COD derived from passive sensors such as OMI are expected to be biased low if absorbing aerosols are not accounted for in the inversion. The OMACA product reports two sets of COD, one corrected for the presence of absorbing aerosols overlying cloud deck, and one retrieved assuming no aerosols above the cloud, which is termed as the apparent COD. The magnitudes of bias in the apparent COD depend on the strength of aerosol absorption and backscattering, as well as on the actual value of COD. Note that OMACA does not directly retrieve the aerosol absorption optical depth (AAOD) but retrieves ACAOD assuming an a priori value of SSA (see Sect. 2.2.2.3). Therefore, the AAOD can be readily calculated using these two pieces of information as AAOD = ACAOD ⋅ (1 − SSA). Figure 11 shows the percent bias in COD (388 nm), defined as (apparent COD – aerosol-corrected COD)/aerosol-corrected COD ⋅ 100, as a function of concurrent AAOD (388 nm). The percent bias was calculated for the distinct range of aerosol-corrected COD and the two aerosol types, i.e., smoke (Fig. 11a) and dust (Fig. 11b). All OMACA Level 2 orbital data (2005–2016) for the respective regions and the two aerosol types were accumulated separately and subsequently averaged as a function of corresponding AAOD bins of a sampling size of 5000 retrievals.
For both aerosol types, increasing the magnitude of negative bias in the retrieval of apparent COD is related to AAOD, suggesting the impact of aerosol absorption on the retrieved COD when the presence of absorbing aerosols is ignored in the inversion. Retrievals identified with the “smoke” aerosol type, predominantly found over the biomass burning regions of the southeastern Atlantic Ocean and Southeast Asia show a much larger range of AAOD and associated bias in COD than that observed with “dust” aerosols found in the regions of dust transport over the tropical Atlantic Ocean and the Arabian Sea. Noticeably, the magnitudes of negative bias in the cloud retrievals are also codependent on the absolute values of COD (here it is aerosol-corrected COD). For instance, for an AAOD of 0.1, the bias in COD is ∼ −25 % at a lower range of COD (5–10), which becomes twofold in magnitude (∼ −50 %) at the higher range of COD (20–50).
We have developed a global above-cloud aerosol algorithm, formally named OMACA (OMI above-cloud aerosols), to simultaneously derive the columnar optical depth of absorbing aerosols above the cloud and underlying aerosol-corrected cloud optical depth from the near-UV observations made by Aura/OMI. Physically based on the enhanced spectral contrast in the near- UV region (354–388 nm) caused by aerosol absorption above the cloud, OMACA relates the TOA observations in the two channels to a pair of ACAOD and COD under a prescribed set of assumptions. The architect of the OMACA algorithm in terms of the ancillary datasets (CALIOP-OMI based ALH, OMI-based near-UV surface albedo, and use of AIRS CO for the aerosol type identification), aerosol models (smoke and dust), and retrieval approach (two-channel inversion) is analogous to the OMI's two-channel, cloud-free OMAERUV aerosol algorithm. OMACA was applied to the entire record of OMI observations (October 2004 to present) to deduce a global research product of AOD above the cloud. Currently, the Level 2 orbital data product is stored on a freely accessible Aura Validation Data Center webpage (https://avdc.gsfc.nasa.gov/pub/data/satellite/Aura/OMI/V03/L2/OMACA/, last access: 15 October 2018). Also, the OMACA product is produced in the forward processing mode with a maximum latency of about 3 days, which is associated with the availability of AIRS L3 CO data for the aerosol type identification.
An analysis of the frequency of occurrence of the above-cloud absorbing aerosols reveals several important regions of the world where the overlap of absorbing aerosols and cloud are frequently observed on a monthly to seasonal scales. These regions include the southeastern Atlantic Ocean and Southeast Asia, where layers of smoke aerosols produced from the seasonal agricultural biomass burning spread thousands of kilometers over the regional low-level stratocumulus cloud deck; the tropical Atlantic Ocean and the Arabian Sea, where dust aerosols transported from Sahara and Arabian deserts, respectively, found over low-level clouds; the northern Pacific Ocean, where dust particles originated from Asian deserts, possibly mixed with the pollution haze, along the eastward transport pathways are found to overlie clouds; and the southern Indian Ocean, where the smoke produced from agricultural burning over southeastern Africa drifts along the easterly winds and overlies the oceanic cloud deck. Globally, as well as on a regional scale, no significant trend in the frequency of ACA was noted when only those observations of OMI instrument (Rows 1 to 23) that are free of row anomaly throughout the OMI operation period (2004 to 2016) were used in the calculation. The climatology maps of the retrieved ACAOD (388 nm) derived from a 12-year long OMACA record show moderate (0.3 < ACAOD < 0.5, away from the sources) to higher aerosol loading (ACAOD > 0.8 in the proximity to the sources) above the cloud over these prominent aerosol–cloud overlap regions. When compared with the cloud-free, columnar aerosol loading distribution retrieved from the OMI/OMAERUV two-channel algorithm, ACAOD accounts for as large as 60 %–100 % of the total columnar loading over different regions during peak biomass burning and dust transport seasons.
The aerosol-corrected CODs retrieved at the near-UV wavelength (388 nm) are found to be noticeably higher than those retrieved assuming no aerosols above the cloud. The percent bias in COD with reference to the aerosol-corrected COD is found to strongly correlate with AAOD as well as the magnitude of COD. For instance, carbonaceous aerosols above cloud found over the southeastern Atlantic Ocean and Southeast Asia during respective biomass burning seasons result in a significant negative bias in apparent COD, the magnitudes of which increase with increasing aerosol absorption as well as the cloud brightness.
A direct comparison of coincident and collocated ACAODs derived from OMI ∕ OMACA and those measured from airborne HSRL-2 measurements for the ORACLES phase I operation (August–September 2016) over the southeastern Atlantic Ocean showed a good level of agreement with a correlation and RMSE of 0.7 and 0.1, respectively. We further plan to extend the validation of OMACA using the direct measurements of ACAOD from an airborne 4STAR sunphotometer operated from NASA's P3-B aircraft during ORACLES phase I and II. Additionally, a suite of aerosol microphysical and optical measurements from the ORACLES campaign, particularly those characterizing spectral aerosol absorption, will help to verify and improve the region-specific aerosol models employed in OMACA.
Conventional aerosol remote sensing algorithms provide distribution of aerosols in the cloud-free areas leaving behind vast cloudy regions unmonitored regarding the co-presence of aerosols and clouds. The OMACA aerosol product offers a quantitative characterization of aerosol loading above cloud on a global scale. Several observational and modeling studies have shown that an overlap of absorbing aerosols above cloud leads to significant atmospheric warming, which can affect cloud lifetime and the hydrological cycle. The magnitudes of these effects depend upon the amount of aerosol loading above the cloud, cloud brightness (COD), optical and microphysical properties of aerosols and clouds, and cloud fraction. The OMACA aerosol product from OMI presented in this paper offers a crucial missing piece of information of the aerosol loading above cloud that will help us to quantify the radiative effects of aerosols above the cloud and its resultant impact on clouds and thus climate. A global above-cloud aerosol product, in conjunction with the standard cloud-free aerosol product, provides us with an unprecedented all-sky aerosol distribution from space. This can substantially enhance our knowledge of how aerosols affect cloud radiative forcing and microphysical properties, and aerosol transport.
The OMI/OMACA Level-2 dataset presented in this paper is stored at a freely accessible Aura Validation Data Center web page (https://avdc.gsfc.nasa.gov/pub/data/satellite/Aura/ OMI/V03/L2/OMACA/, last access: 15 October 2018).
Table A1Optical and microphysical properties of the OMACA dust aerosol model.
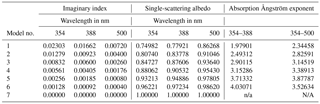
n/a: Not applicable.
Real refractive
index = 1.55.
Mean radius (fine mode) = 0.052 µm; mean radius (coarse
mode) = 0.67 µm; standard deviation (fine
mode) = 1.697 µm; standard deviation (coarse
mode) = 1.806 µm;
minimum radii (fine
mode) = 0.00627012 µm; minimum radii (coarse
mode) = 0.0629802 µm;
maximum radii (fine
mode) = 0.431252 µm; maximum radii (coarse
mode) = 7.12764 µm.
Table A2Axis ratio distribution for the spheroidal dust particles (Dubovik et al., 2006).
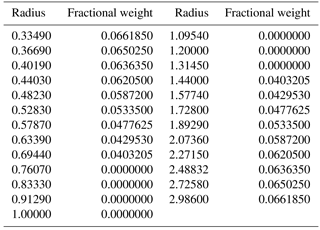
Table A3Optical and microphysical properties of the OMACA carbonaceous aerosol model.
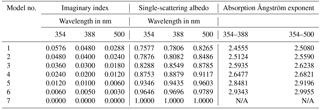
Real refractive index = 1.5
Model nos. 1 to 3; mean radius (fine mode) = 0.080132 µm;
mean radius (coarse mode) = 0.705495 µm;
standard deviation (fine mode) = 1.492 µm;
standard deviation (coarse mode) = 2.075 µm;
minimum radii (fine mode) = 0.0161708 µm;
minimum radii (coarse mode) = 0.0380559 µm;
maximum radii (fine mode) = 0.397083 µm;
maximum radii (coarse mode) = 13.0788 µm.
Model nos. 4 to 7 mean radius (fine mode) = 0.08717 µm;
mean radius (coarse mode) = 0.567194 µm;
standard deviation (fine mode) = 1.537 µm;
standard deviation (coarse mode) = 2.203 µm;
minimum radii (fine mode) = 0.0156197 µm;
minimum radii (coarse mode) = 0.0240810 µm;
maximum radii (fine mode) = 0.486477 µm;
maximum radii (coarse mode) = 13.3595 µm.
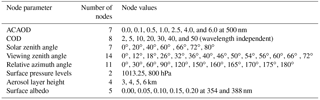
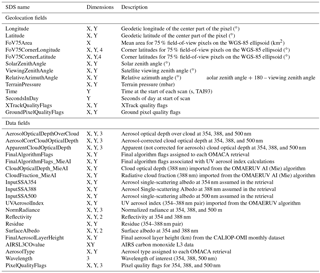
HJ developed the global OMACA algorithm, conducted the analysis, prepared graphics, and wrote the paper. CA developed an initial version of the research version of OMACA code, which was then revised, updated, and operationalized by HJ. OT ensured the integrity of various stages of the development and supervised the overall flow of the work. All authors contributed to editing the paper.
The authors declare that they have no conflict of interest.
Authors acknowledge the support of the OMI SIPS team
(https://earthdata.nasa.gov/about/sips/sips-omi, last access: 15
October 2018) for processing the OMACA dataset. We thank Pawan K. Bhartia at
the NASA Goddard Space Flight Center for his guidance and helpful suggestions
throughout the development of the OMACA product. Peter Leonard at ADNET
Systems Inc has extended help in coding the software package. Oleg Dubovik at
the University of Lille provided a standalone software package for the
simulation of phase matrix elements of spheroidal particle size distribution
used to generate the dust aerosol look-up table. Acknowledgments are due to
the HSLR team members for conducting the measurements of aerosols above cloud
during ORACLES phase I operation, which helped validate the OMACA product
over the southeastern Atlantic Ocean. Edited by: Jun
Wang
Reviewed by: Zhibo Zhang and one anonymous referee
Ahn, C., Torres, O. and Jethva, H.: Assessment of OMI near-UV aerosol optical depth over land, J. Geophys. Res.-Atmos., 119, 2457–2473, https://doi.org/10.1002/2013JD020188, 2014.
Alfaro-Contreras, R., Zhang, J., Campbell, J. R., and Reid, J. S.: Investigating the frequency and interannual variability in global above-cloud aerosol characteristics with CALIOP and OMI, Atmos. Chem. Phys., 16, 47–69, https://doi.org/10.5194/acp-16-47-2016, 2016.
Chand, D., Anderson, T. L., Wood, R., Charlson, R. J., Hu, Y., Liu, Z., and Vaughan, M.: Quantifying above-cloud aerosol using spaceborne lidar for improved understanding of cloudy-sky direct climate forcing, J. Geophys. Res., 113, D13206, https://doi.org/10.1029/2007JD009433, 2008.
Chand, D., Wood, R., Anderson, T. L., Satheesh, S. K., and Charlson, R. J.: Satellite-derived direct radiative effect of aerosols dependent on cloud cover, Nat. Geosci., 2, 181–184, https://doi.org/10.1038/NGEO437, 2009.
Deirmendjian, D.: Electromagnetic scattering on spherical polydispersions, American Elsevier Publishing Company, Inc., 108 pp., New York, 1969.
Devasthale, A. and Thomas, M. A.: A global survey of aerosol-liquid water cloud overlap based on four years of CALIPSO-CALIOP data, Atmos. Chem. Phys., 11, 1143–1154, https://doi.org/10.5194/acp-11-1143-2011, 2011.
Dubovik, O., Sinyuk, A., Lapyonok, T., Holben, B. N., Mishcenko, M., Yang, P., Eck, T. F., Volten, H., Munoz, O., Vehelmann, B., van der Zande, W. J., Leon, J. F., Sorokin, M., and Slutsker, I.: Application of spheroid models to account for aerosol particle nonsphericity in remote sensing of desert dust, J. Geophys. Res., 111, D11208, https://doi.org/10.1029/2005JD006619, 2006.
Eck, T. F., Holben, B. N., Reid, J. S., MukelabaiM. M., Piketh,S. J., Torres, O., Jethva, H. T., Hyer, E. J., Ward,D. E., Dubovik, O., Sinyuk, A., Schafer,J. S., Giles, D. M., Sorokin, M., Smirnov, A., and Slutsker, I.: A seasonal trend of single scattering albedo in southern African biomass-burning particles: Implications for satellite products and estimates of emissions for the world's largest biomass-burning source, J. Geophys. Res.-Atmos., 118, 6414–6432, https://doi.org/10.1002/jgrd.50500, 2013.
Elvidge, C. D. and Baugh, K. E.: Survey of fires in Southeast Asia and India during 1987, in Global Biomass Burning, vol. 2, edited by: Levine, J., 663–670, MIT Press, Cambridge, MA, USA, 1996.
Eswaran, K., Satheesh, S. K., and Srinivasan, J.: Dependence of `critical cloud fraction' on aerosol composition, Atmos. Sci. Lett., 16, 380–385, https://doi.org/10.1002/asl2.571, 2015.
Feng, N. and Christopher, S. A.: Measurement-based estimates of direct radiative effects of absorbing aerosols above clouds. J. Geophys. Res.-Atmos., 120, 6908–6921, https://doi.org/10.1002/2015JD023252, 2015.
Garstang, M., Tyson, P. D., Swap, R., Edwards, M., Kallberg, P., and Lindesay, J. A.: Horizontal and vertical transport of air over southern Africa, J. Geophys. Res., 101, 23721–23736, 1996.
Herman, J. R., Bhartia, P. K., Torres, O., Hsu, C., Seftor, C., and Celarier, E.: Global distribution of UV- absorbing aerosols from Nimbus 7/TOMS data, J. Geophys. Res., 102, 16911–16922, https://doi.org/10.1029/96JD03680, 1997.
Hu, Y., Vaughan, M., Liu, Z., Powell, K., and Rodier, S.: Retrieving optical depths and lidar ratios for transparent layers above opaque water clouds from CALIPSO lidar measurements, IEEE Geosci. Remote Sens. Lett., 4, 523–526, https://doi.org/10.1109/LGRS.2007.901085, 2007.
Huang, J., Zhang, C., and Prospero, J. M.: African dust outbreaks: a satellite perspective of temporal and spatial variability over the tropical Atlantic Ocean, J. Geophys. Res., 115, D05202, https://doi.org/10.1029/2009JD012516, 2010.
Huebert, B., Bates, T., Russell, P., Seinfield, J., Wang, M., Uematsu, M., and Kim, Y. J.: An overview of ACE-Asia: Strategies for quantifying the relationships between Asian aerosols and their climatic impacts, J. Geophys. Res., 108, 8633, https://doi.org/10.1029/2003JD003550, 2003
IPCC, 2013: Climate Change 2013: The Physical Science Basis. Contribution of Working Group I to the Fifth Assessment Report of the Intergovernmental Panel on Climate Change, edited by: Stocker, T. F., Qin, D., Plattner, G.-K., Tignor, M., Allen, S. K., Boschung, J., Nauels, A., Xia, Y., Bex, V., and Midgley, P. M., Cambridge University Press, Cambridge, UK and New York, NY, USA, 1535 pp., https://doi.org/10.1017/CBO9781107415324, 2013.
Jethva, H. and Torres, O.: Satellite-based evidence of wavelength-dependent aerosol absorption in biomass burning smoke inferred from Ozone Monitoring Instrument, Atmos. Chem. Phys., 11, 10541–10551, https://doi.org/10.5194/acp-11-10541-2011, 2011.
Jethva, H., Torres, O., and Ahn, C.: Global assessment of OMI aerosol single-scattering albedo using ground- based AERONET inversion, J. Geophys. Res.-Atmos., 119, 9020–9040, https://doi.org/10.1002/2014JD021672, 2014.
Jethva, H., Torres, O., Remer, L. A., and Bhartia, P. K.: A Color Ratio Method for Simultaneous Retrieval of Aerosol and Cloud Optical Thickness of Above-Cloud Absorbing Aerosols From Passive Sensors: Application to MODIS Measurements, IEEE T. Geosci. Remote Sens., 51, 3862–3870, https://doi.org/10.1109/TGRS.2012.2230008, 2013.
Jethva, H., Torres, O., Waquet, F., Chand, D., and Hu, Y.: How do A-train sensors intercompare in the retrieval of above-cloud aerosol optical depth? A case study-based assessment, Geophys. Res. Lett., 41, 186–192, https://doi.org/10.1002/2013GL058405, 2014.
Jethva, H.: Interactive comment on “Investigating the frequency and trends in global above-cloud aerosol characteristics with CALIOP and OMI” by R. Alfaro-Contreras et al., Atmos. Chem. Phys. Discuss., 15, C1488–C1496, 2015.
Jethva, H., Torres, O., Remer, L., Redemann, J., Livingston, J., Dunagan, S., Shinozuka, Y., Kacenelenbogen, M., Rosenheimer, M. S., and Spurr, R.: Validating MODIS above-cloud aerosol optical depth retrieved from “color ratio” algorithm using direct measurements made by NASA's airborne AATS and 4STAR sensors, Atmos. Meas. Tech., 9, 5053–5062, https://doi.org/10.5194/amt-9-5053-2016, 2016.
Liu, H., Jacob, D. J., Bey, I., Yantosca, R. M., Duncan, B. N., and Sachse, G. W.: Transport pathways for Asian pollution outflow over the Pacific: Interannual and seasonal variations, J. Geophys. Res., 108, 8786, https://doi.org/10.1029/2002JD003102, 2003.
Kaufman, Y. J., Koren, I., Remer, L. A., Tanré, D., Ginoux, P., and Fan, S.: Dust transport and deposition observed from the Terra-Moderate Resolution Imaging Spectroradiometer (MODIS) spacecraft over the Atlantic Ocean, J. Geophys. Res., 110, D10S12, https://doi.org/10.1029/2003JD004436, 2005.
Keil, A. and Haywood, J. M.: Solar radiative forcing by biomass burning aerosol particles during SAFARI2000: A case study based on measured aerosol and cloud properties, J. Geophys. Res., 108, 8467, https://doi.org/10.1029/2002JD002315, 2003.
Kirchstetter, T. W., Novakov, T., and Hobbs, P. V.: Evidence that the spectral dependence of light absorption by aerosols is affected by organic carbon, J. Geophys. Res., 109, D21208, https://doi.org/10.1029/2004JD004999, 2004.
Lu, Z., Liu, X., Zhang, Z., Zhao, C., Meyer, K. Rajapakshe, C., Wu, C., Yang, Z., and Penner, J. E.: Biomass smoke from southern Africa can significantly enhance the brightness of stratocumulus over the southeastern Atlantic Ocean, P. Natl. Acad. Sci., 115, 2924–2929, https://doi.org/10.1073/pnas.1713703115, 2018.
Meyer, K., Platnick, S., Oreopoulos, L., and Lee, D.: Estimating the direct radiative effect of absorbing aerosols overlying marine boundary layer clouds in the southeast Atlantic using MODIS and CALIOP, J. Geophys. Res.-Atmos., 118, 4801–4815, https://doi.org/10.1002/jgrd.50449, 2013.
Meyer, K., Platnick, S., and Zhang, Z.: Simultaneously inferring above-cloud absorbing aerosol optical thickness and underlying liquid phase cloud optical and microphysical properties using MODIS, J. Geophys. Res.-Atmos., 120, 5524–5547, https://doi.org/10.1002/2015JD023128, 2015.
Min, M and Zhang, Z.: On the influence of cloud fraction diurnal cycle and sub-grid cloud optical thickness variability on all-sky direct aerosol radiative forcing, J. Quant. Spectroscopy and Rad. Trans., 142, 25–36, https://doi.org/10.1016/j.jqsrt.2014.03.014, 2014.
Moorthy, K. K., Babu, S. S., and Satheesh, S. K.: Aerosol Characteristics and Radiative Impacts over the Arabian Sea during the Intermonsoon Season: Results from ARMEX Field Campaign, J. Atmos. Sci., 62, 192–206, https://doi.org/10.1175/JAS-3378.1, 2005.
Prospero, J. M., Ginoux, P., Torres, O., Nicholson, S. E., and Gill, T. E.: Environmental Characterization Of Global Sources Of Atmospheric Soil Dust Identified With The Nimbus 7 Total Ozone Mapping Spectrometer (TOMS) Absorbing Aerosol Product, Rev. Geophys., 40, 1002, https://doi.org/10.1029/2000rg000095, 2002.
Satheesh, S., Krishna Moorthy, K., Kaufman, Y., and Takemura, T.: Aerosol optical depth, physical properties and radiative forcing over the Arabian Sea, Meteorol. Atmos. Phys., 91, 45–62, https://doi.org/10.1007/s00703-004-0097-4, 2006.
Sayer A. M., Hsu, N. C., Bettenhausen, C., Lee, J., Redemann, J., Schmid, B., and Shinozuka, Y.: Extending “Deep Blue” aerosol retrieval coverage to cases of absorbing aerosols above clouds: Sensitivity analysis and first case studies, J. Geophys. Res.-Atmos., 121, 4830–4854, https://doi.org/10.1002/2015JD024729, 2016
Schenkeveld, V. M. E., Jaross, G., Marchenko, S., Haffner, D., Kleipool, Q. L., Rozemeijer, N. C., Veefkind, J. P., and Levelt, P. F.: In-flight performance of the Ozone Monitoring Instrument, Atmos. Meas. Tech., 10, 1957–1986, https://doi.org/10.5194/amt-10-1957-2017, 2017.
Schulz, M., Textor, C., Kinne, S., Balkanski, Y., Bauer, S., Berntsen, T., Berglen, T., Boucher, O., Dentener, F., Guibert, S., Isaksen, I. S. A., Iversen, T., Koch, D., Kirkevåg, A., Liu, X., Montanaro, V., Myhre, G., Penner, J. E., Pitari, G., Reddy, S., Seland, Ø., Stier, P., and Takemura, T.: Radiative forcing by aerosols as derived from the AeroCom present-day and pre-industrial simulations, Atmos. Chem. Phys., 6, 5225–5246, https://doi.org/10.5194/acp-6-5225-2006, 2006.
Sinha, P., Jaeglé, L., Hobbs, P. V., and Liang, Q.: Transport of biomass burning emissions from southern Africa, J. Geophys. Res., 109, D20204, https://doi.org/10.1029/2004JD005044, 2004.
Spurr, R. J. D.: VLIDORT: A linearized pseudo-spherical vector discrete ordinate radiative transfer code for forward model and retrieval studies in multilayer multiple scattering media, J. Quant. Spectrosc. Ra., 102, 316–342, https://doi.org/10.1016/j.jqsrt.2006.05.005, 2006.
Streets, D. G., Yarber, K. F., Woo, J.-H., and Carmichael, G. R.: Biomass burning in Asia: Annual and seasonal estimates and atmospheric emissions, Global Biogeochem. Cy., 17, 1099, https://doi.org/10.1029/2003GB002040, 2003.
Torres, O., Bhartia, P. K., Herman, J. R., Ahmad, Z., and Gleason, J.: Derivation of aerosol properties from satellite measurements of backscattered ultraviolet radiation: Theoretical basis, J. Geophys. Res., 103, 17099–17110, https://doi.org/10.1029/98JD00900, 1998.
Torres, O., Tanskanen, A., Veihelmann, B., Ahn, C., Braak, R., Bhartia, P. K., Veefkind, P., and Levelt, P.: Aerosols and surface UV products from Ozone Monitoring Instrument observations: An overview, J. Geophys. Res., 112, D24S47, https://doi.org/10.1029/2007JD008809, 2007.
Torres, O., Jethva, H., and Bhartia, P. K.: Retrieval of Aerosol Optical Depth above Clouds from OMI Observations: Sensitivity Analysis and Case Studies, J. Atmos. Sci., 69, 1037–1053, https://doi.org/10.1175/JAS- D-11-0130.1, 2012.
Torres, O., Ahn, C., and Chen, Z.: Improvements to the OMI near-UV aerosol algorithm using A-train CALIOP and AIRS observations, Atmos. Meas. Tech., 6, 3257–3270, https://doi.org/10.5194/amt-6-3257-2013, 2013.
Torres, O., Bhartia, P. K., Jethva, H., and Ahn, C.: Impact of the ozone monitoring instrument row anomaly on the long-term record of aerosol products, Atmos. Meas. Tech., 11, 2701–2715, https://doi.org/10.5194/amt-11-2701-2018, 2018.
Wagner, R., Ajtai, T., Kandler, K., Lieke, K., Linke, C., Müller, T., Schnaiter, M., and Vragel, M.: Complex refractive indices of Saharan dust samples at visible and near UV wavelengths: a laboratory study, Atmos. Chem. Phys., 12, 2491–2512, https://doi.org/10.5194/acp-12-2491-2012, 2012.
Waquet, F., Riedi, J., Labonnote, L. C., Goloub, P., Cairns, B., Deuzé, J.-L., and Tanré D.: Aerosol remote sensing over clouds using A-train observations, J. Atmos. Sci., 66, 2468–2480, https://doi.org/10.1175/2009JAS3026.1, 2009.
Waquet, F., Cornet, C., Deuzé, J.-L., Dubovik, O., Ducos, F., Goloub, P., Herman, M., Lapyonok, T., Labonnote, L. C., Riedi, J., Tanré, D., Thieuleux, F., and Vanbauce, C.: Retrieval of aerosol microphysical and optical properties above liquid clouds from POLDER/PARASOL polarization measurements, Atmos. Meas. Tech., 6, 991–1016, https://doi.org/10.5194/amt-6-991-2013, 2013.
Wilcox, E. M.: Direct and semi-direct radiative forcing of smoke aerosols over clouds, Atmos. Chem. Phys., 12, 139–149, https://doi.org/10.5194/acp-12-139-2012, 2012.
Yu, H., Chin, M., Bian, H., Yuan, T., Prospero, J. M., Omar, A. H., Remer, L. A., Winker, D. M., Yang, Y., Zhang, Y., and Zhang, Z.: Quantification of trans-Atlantic dust transport from seven-year (2007–2013) record of CALIPSO lidar measurements, Remote Sens. Environ., 159, 232–249, https://doi.org/10.1016/j.rse.2014.12.010, 2015.
Zhang, Z., Meyer, K., Yu, H., Platnick, S., Colarco, P., Liu, Z., and Oreopoulos, L.: Shortwave direct radiative effects of above-cloud aerosols over global oceans derived from 8 years of CALIOP and MODIS observations, Atmos. Chem. Phys., 16, 2877–2900, https://doi.org/10.5194/acp-16-2877-2016, 2016.
- Abstract
- Introduction
- Description of the OMACA algorithm
- Uncertainty estimates
- Preliminary validation
- The frequency of occurrence of absorbing aerosols above clouds
- Results from 12-year long OMACA record
- Summary and concluding remarks
- Data availability
- Appendix A
- Author contributions
- Competing interests
- Acknowledgements
- References