the Creative Commons Attribution 4.0 License.
the Creative Commons Attribution 4.0 License.
 | 20 Nov 2018
Improved real-time bio-aerosol classification using artificial neural networks
Maciej Leśkiewicz
Miron Kaliszewski
Maksymilian Włodarski
Jarosław Młyńczak
Zygmunt Mierczyk
Krzysztof Kopczyński
Air pollution has had an increasingly powerful impact on the everyday life of humans. More and more people are aware of the health problems that may result from inhaling air which contains dust, bacteria, pollens or fungi. There is a need for real-time information about ambient particulate matter. Devices currently available on the market can detect some particles in the air but cannot classify them according to health threats. Fortunately, a new type of technology is emerging as a promising solution.
Laser-based bio-detectors are characterizing a new era in aerosol research. They are capable of characterizing a great number of individual particles in seconds by analyzing optical scattering and fluorescence characteristics. In this study we demonstrate the application of artificial neural networks (ANNs) to real-time analysis of single-particle fluorescence fingerprints acquired using BARDet (a Bio-AeRosol Detector). A total of 48 different aerosols including pollens, bacteria, fungi, spores, and nonbiological substances were characterized. An entirely new approach to data analysis using a decision tree comprising 22 independent neural networks was discussed. Applying confusion matrices and receiver operating characteristics (ROC) analysis the best sets of ANNs for each group of similar aerosols were determined. As a result, a very high accuracy of aerosol classification in real time was achieved. It was found that for some substances that have characteristic spectra, almost each particle can be properly classified. Aerosols with similar spectral characteristics can be classified as specific clouds with high probability. In both cases the system recognized aerosol type with no mistakes.
In the future, it is planned that performance of the system may be determined under real environmental conditions, involving characterization of fluorescent and nonfluorescent particles.
- Article
(3941 KB) - Full-text XML
- BibTeX
- EndNote


Ambient air contains a variety of particles such as dust, bacteria, pollens, fungi and other particles of biological and nonbiological origin (Pöhlker et al., 2013; Górny, 2004). Aerosols are involved in various atmospheric processes such as ice nuclei formation, precipitation and global climate effects (Deguillaume et al., 2008; Fröhlich-Nowoisky et al., 2016; Gabey et al., 2010; Pósfai and Buseck, 2010; Fuzzi et al., 2015). They also greatly influence human health (Davidson et al., 2005; Pope and Dockery, 2006; Michaels, 2017; Shiraiwa et al., 2012). Therefore, the characterization of ambient air is important for estimating potential health hazards and environmental impact (Mauderly and Chow, 2008; Lim et al., 2005). Standard methods of aerosol composition assessment usually include microscopic inspection or molecular analysis of filters (Miaskiewicz-Peska and Lebkowska, 2012), tape or liquid trapped particles. Nevertheless, they suffer from low time resolution due to periodical and relatively long analytical procedures. They are also ineffective for the detection of non-culturable microorganisms (Blais-Lecours et al., 2015; Trafny et al., 2014).
The detection and classification of biological particles is possible using fluorescence techniques due to the presence of proteins, NADH, and some vitamins that emit light when excited with UV light (Lakowicz, 2006). This feature is utilized in single-particle fluorescence detectors. In the flowing air each particle is characterized for size/shape using light scattering as well as fluorescence properties. This approach ensures continuous measurement and immediate response. Thus the analysis process can be facilitated and accelerated compared with other commonly used analytical procedures (Hill et al., 1999; Choi et al., 2014; Taketani et al., 2013; Feugnet et al., 2008). Besides advantages such as reagentless and real-time particle characterization, laser-based methods do not provide information on the chemical composition of aerosol.
Several studies using single-particle fluorescence detectors have demonstrated that fluctuations of aerosol concentration and variations in its fluorescence properties are highly dependent on the season, day, time, location and place occupancy (Gabey et al., 2011; Huffman et al., 2010; Pinnick et al., 2004; Bhangar et al., 2014; Fennelly et al., 2017). Each single particle passing the instrument is labeled with a time stamp, scattering properties (size and/or shape) and fluorescence characteristics. It is obvious that continuous single-particle measurements bring a new potential and quality to environmental research. However, particles of the same type and batch display slightly different spectral characteristics due to variations in biochemical composition, size, age of population (Agranovski et al., 2003), degradation (Hernandez et al., 2016) or stress level (Lee et al., 2010) and the particle position within the instrument's interrogation point (Pan et al., 2011). Simpler statistical analyses, such as data averaging and graphical spectra representation, are not sufficient. Therefore, the huge amount of data and occurring spectral variations require more advanced algorithms supporting automatic data classification. Various analytical methods of particle discrimination and classification have been applied. It has been shown that principal component analysis (PCA), linear discriminant analysis (LDA) and hierarchical cluster analysis (HCA) of fluorescence spectra greatly increase the discrimination of particles compared with methods based on spectra averaging or fluorescence threshold (Leśkiewicz et al., 2016; Kaliszewski et al., 2013; Pan et al., 2012; Savage et al., 2017; Crawford et al., 2015). Artificial neural networks (ANNs) comprise an emerging analytical approach that is becoming more widely and successfully applied in various life domains such as chemical analysis (Borecki et al., 2008), image recognition (Antowiak and Chałasińska-Macukow, 2003), data mining and weather forecasting (Purnomo et al., 2017). It has been shown that ANNs can be applied in bio-aerosol classification (Kohlus and Bottlinger, 1993). However, it usually requires more user input compared to other analytical procedures (Ruske et al., 2017).
This paper focuses on the application of ANNs for real-time discrimination of bio-aerosols based on single-particle fluorescence characteristics. We demonstrate a new approach to data analysis using ANNs which allows automation of data preparation procedures and minimum user involvement.
2.1 Experiment
2.2 BioAeRosol Detector (BARDet)
Detailed information concerning the construction and parameters of the instrument used for the experiments was presented in our previous work (Kaliszewski et al., 2016). In general, the ambient air is continuously drawn through the nozzle. It is focused with a sheath flow of filtered air. Particles in the focused air pass through the BARDet's chamber where they are interrogated by a 16 mW CW laser beam generated by a diode laser operating at 375 nm wavelength (CUBE, Coherent). The backward and forward scattered signals are detected with two PMTs (photomultiplier tubes; H6780, Hamamatsu) mounted at the 35 and 145∘ angles to the laser beam axis.
The fluorescence of particles is measured at a 90∘ angle to the laser beam with a 32-channel PMT (A10766, Hamamatsu). The longpass filter with a cutting edge at 400 nm (Edmund Optics) separates the fluorescence signal from scattered light. The multichannel PMT measures fluorescence in 18 active channels in a range of 415.4–643.5 nm. The channels are grouped in seven bands. Such a solution extends the dynamic range of measured spectra, assures a high S∕N (signal-to-noise) ratio and also reduces the possibility of signal saturation. The remaining channels are not used. The band configuration is presented in Table 1.

2.2.1 Aerosols
For the tests, dry powders of harmless substances were used since they did not need a specialized aerosol protection chamber. In order to achieve a reliable aerosol classification, the ANNs need to be trained using as large a number of measurement data as possible. Therefore, various particle types, that can be easily aerosolized, were tested. Samples such as pollens, fungi, bacteria, spores and plant debris naturally occur in the atmosphere. Biofluororphores such as riboflavin, cellulose, amino acids and proteins were also characterized since they are present in biological materials. The group of bacterial growth media was investigated due to their powerful influence on bacteria fluorescence, especially if they are not sufficiently washed. This can occur in the case of intentionally released bacterial aerosols. Due to technical limitations, samples other than of a pharmaceutical type could not be aerosolized in this study. The aerosols of flours as well as fluorescent nonbiological substances such as paper dust, AC fine test dust and talc were analyzed since they can especially occur in indoor and public places. Nonfluorescent particles were not the subject of research since they can be automatically discarded as nonbiologically applying given fluorescence thresholds.
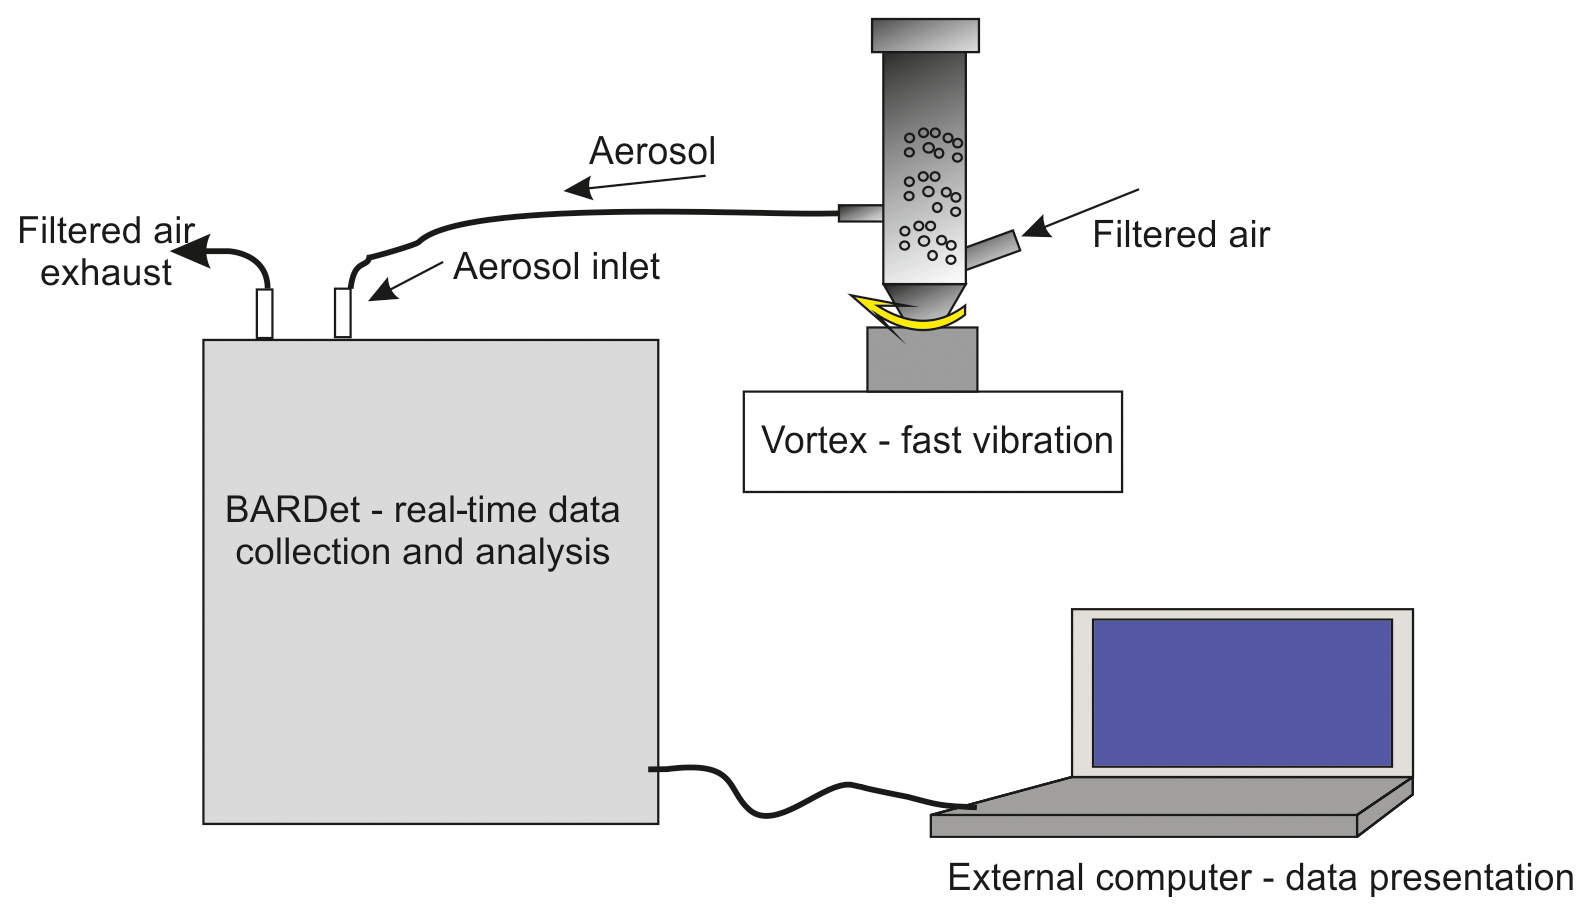
The samples used for this study are listed in Table 2. To perform numerous experiments, disposable vials were used, one for each aerosol sample. This prevented cross-contamination between measured samples. The aerosols were generated from modified 50 ml Falcon tubes placed on the vortex. The vials in the lower part contained two connectors for silicon tubes. Vortexed particles were entrained and formed an aerosol cloud inside the Falcon tube. The aerosolized particles were aspirated from the vial to BARDet's aerosol inlet. Each tube contained about 50 mg of the dry powder sample. During aerosol generation, filtered air was supplied into the vial to compensate for the BARDet's flow. The concentration of the aerosols was adjusted with the vibration frequency of the vortex. The measurement started after the aerosol reached a homogeneous concentration. The experimental setup is shown in Fig. 1.
Table 2List of all substances used in the experiment.

∗OC: pollens collected from trees, flowers and grass in the region of Warsaw during vegetative seasons in 2015 and 2016. ∗RS: regular shops in Warsaw where common goods are purchased. ∗P: pharmacy shops in Warsaw.
2.2.2 Aerosol microscopy
For microscopy analysis the aerosols were generated as described above and collected by impaction on a glass microscopic slide. The visualization of the samples was performed using a Nikon Eclipse Ti-U microscope with 10× objective. The images were recorded with a 5 megapixel DS-Fi1 camera. The aerosol equivalent diameters and circularity were analyzed automatically using NIS-Elements 64 bit 3.22.10 software. The threshold of particle outline was corrected manually to obtain the visually best fit.

Figure 2Example of 50 normalized subsequent fluorescence characteristics of NT (a), FM (c) and LCB (e) and corresponding averaged normalized intensities of NT (b), FM (d) and LCB (f). Error bars represent standard deviation of measurements.
2.2.3 Data acquisition method and preprocessing
The fluorescence of each particle was recorded in seven bands. This creates a time series of the signals which has to be preprocessed before further analysis. There are two steps in gathering data. The first one is performed by the internal software of BARDet which is responsible for controlling the instrument and the acquisition of raw signals. Then data are forwarded to a preprocessing module in the analysis software. Its first task is to extract valuable signals from the noise (three sigma rule). After that a normalization procedure is required. It is performed first by subtracting the average value of the signal and then normalizing it to its standard deviation. The main goal was to analyze the shape of the emission spectrum (not signal strength). An example visualization of input data is shown in Fig. 2.
The data acquisition process started after the stabilization of the aerosol generation rate which was measured by the device. It was important not to exceed one particle per 2 ms of data integration time in a 20 µs measurement window. Finally, a total of 114 779 spectral characteristics of 48 aerosols was gathered, which gives on average 2391 (SD 437) fluorescence characteristics per substance. From the recorded data, 80 % were used as a training data set and 20 % as a test data set.
2.3 Data analysis
2.3.1 ANN (artificial neural network)
Basics
There are many types of artificial neural networks (ANNs), but in this paper only the backpropagation algorithm is demonstrated because it is one of the most practical ones. The main concept of this algorithm is based on a model of the neuron that has two tasks. It aggregates signals (1) and then processes them by an activation function (2), which, in this research, is a sigmoid. The result of such single processing is a new signal zj propagated to other neurons (Fig. 3).
where aj is the aggregated signal, wji is the weight that connects neuron i with j and zi is the signal (input).
where g(aj) is the sigmoidal function and β is the parameter (steepness) of sigmoid curve.
The structure of a neural network is formed by layers of neurons: input, hidden and output. In this research input neurons constitute a fluorescence spectrum and output neurons represent substances. Most computations are carried out in the hidden layers (no more than two layers were examined). The schematic representation of neuron layers is presented in Fig. 4.
The described algorithm constitutes the supervised learning method that requires training data for a teaching process. This allows one to calculate an error between the target shown and the ANN response. Every problem is related to minimizing output error which is calculated as the mean squared error (Eq. 3).
where E is the mean squared error, tk is the observed value (target), yk is the calculated response, k is the output neuron and c is the number of output neurons.
The gradient descent method is used to find a minimum of error function. Error is dependent on network weights Δwji which might be adjusted (Eq. 4). In order to update weights correctly, firstly one needs to propagate the error backwards by calculating partial derivatives δj (Eq. 5) (Fig. 5). All mathematical details are well described by Christopher M. Bishop (Bishop, 1995).
where η is the learning rate, m is the momentum and t is the iteration.
The learning rate factor determines the size of the steps, while the momentum parameter enables the local minimum to be omitted by adding a fraction of the weight correction from the last step.
After the correction of all weights of the ANN, the output error is examined, and the procedure starts again unless an error level is low enough and there is no overfitting. All data are divided into three different sets: training, test and validation. For calculations during the learning process, only the first two are used. In order to determine whether it is time to stop the teaching process, one has to observe an error in the test set. There will be a moment when this error comes to be constant or starts increasing due to the overfitting of training data (Fig. 6). The validation data set may be useful for comparing different models or just to verify the current model with a completely separate set of data.


Implementation of ANNs for BARDet
There are statistical commercial software packages available that provide ANN modules as one of the methods to analyze the data. It is worthwhile noting that customized software was developed for this research. This approach helped us to understand ANNs in depth and led to the development of software that is not only responsible for data preprocessing and network training, but also (mainly) for solving a real-time classification problem.
Ruske et al. in their studies (Ruske et al., 2017) compared various algorithms to analyze single-particle data and noted that an ANN requires much more user input. However, we present a method to overcome this inconvenience by automating the process and implementing procedures which simplify and improve the analysis.
The main disadvantage of an ANN is the fact that it is a parametrized algorithm. How well it works depends strictly on a proper choice of the best possible factors, which may be different for each problem. There are two types of factors that influence the ANN outcome. The first one corresponds to the architecture of the ANN which comprises a number of layers, neurons and an activation function parameter. The second one determines the learning process: momentum and learning rate. The latter can be tuned during the learning process to make it much faster. The “bold driver” procedure was chosen for that purpose. It continuously increases the learning rate unless an error is higher than that before the change. If it is, the algorithm radically decreases the learning rate and obtains weights from the last step again. Teaching an ANN is a stochastic process initiated by using randomly chosen initial weights. It was found that the best procedure for this investigation would be to conduct all optimization processes that way. Therefore, the parameters of the ANN, responsible both for structure and the learning process, are randomly selected until the desired result is reached. In fact, the calculations are carried out automatically and simultaneously for several models by means of multicore-oriented software. The benefits of this approach are time-saving and high levels of efficiency and effectiveness in finding the best model. The latter is especially important because the goal is to create a model that produces the best results, which does not necessary mean creating a more complicated network (more neurons or layers).
2.3.2 Model evaluation
The main goal of the analysis described in this paper is to find a solution to the bio-aerosol classification problem. When a training process ends, a final model is created, a network, which has a unique structure and a set of weights. One can create many of them and only make a comparison by using the final error. It is not the best solution because the goal is to distinguish patterns in data consistently, not to produce a network with a minimal error. That is why there is a need to conduct a final analysis of the results and evaluate the model in accordance with the best classification performance.
The standard method for visualization of results is a confusion matrix which will be necessary for receiver operating characteristics (ROC) analysis (Fawcett, 2006). It simply shows what fraction of population for each class is predicted correctly or not. Each element from the data set is assigned to one of the following fits of the confusion matrix: true positive (TP), true negative (TN), false negative (FN) and false positive (FP). If it belongs to TP and TN, it was classified correctly.
The ROC graphs are very simple but useful tools for discovering whether a classifier is worth using or if it makes a random classification. It is based on two rates from the confusion matrix: hit rate (Eq. 5) and false alarm rate (Eq. 6).
Each discrete classifier has a threshold level that assigns an element to a positive or negative class. The points on the ROC graph (Fig. 7) represent the classifier for many thresholds. The most desirable curve will be obtained when the true positive rate is high, and the false positive rate is low (convex line). The random classifier, in turn, has a hit rate equal to a false alarm rate despite threshold variation (diagonal line). To identify an ROC analysis with one coefficient, the area under the curve (AUC) may be used. A higher value of AUC results in better performance (0.5 means random, and 1 means excellent).
The confusion matrix and ROC analysis described above were defined for two class problems (positive, negative). There is a straightforward way to expand it for multi-class problems. One needs to take a desired class versus all other classes. Then it will be possible to compare how good the classifier for specific classes within one model is.
3.1 ANN performance
First attempts were made to distinguish all substances using only one neural network model. The tests revealed that it is impossible due to the huge number of samples (48 aerosols) and only a few of them presented significantly different fluorescence spectra which allow accurate characterization. The remaining substances are then misclassified. Therefore, we decided to use a more practical approach to this problem, which would be to create several groups (considering information about aerosols), but we did not want to create any classes a priori. Although the ANN type demonstrated needs training, which requires a set of known classes, further tests showed that there is a possibility of finding similarities between substances through the analysis of confusion matrices. It was achieved after many trials of matching substances, which were not well separated, into new groups and checking if they are good enough on ROC graphs. Consequently, this procedure was also applied to those new groups.
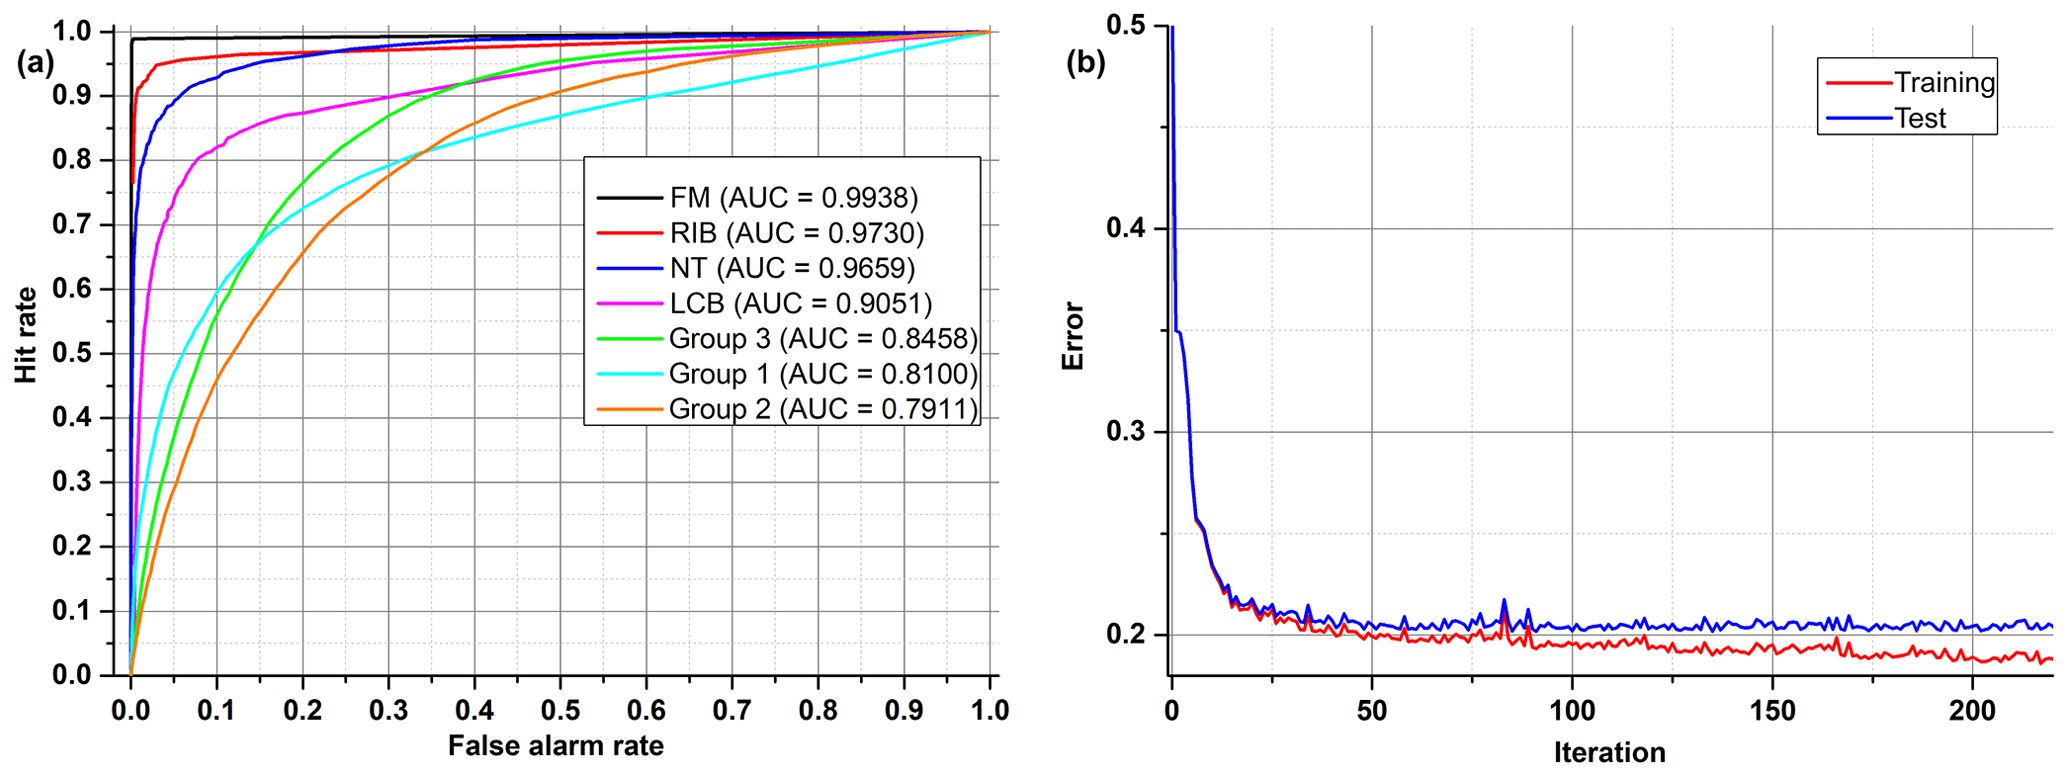
All examples demonstrated below were calculated on the test data sets, not training data. In the first ANN presented (Fig. 8), which tries to classify all of the 48 substances (Group 0), four aerosols reached a very high accuracy of separation (AUC > 0,9). The best separation was achieved for fluorescent microspheres (FM). In this case 98.5 % of all FM particles were correctly classified. Similarly, an efficient separation was achieved for riboflavin (RIB), talc (NT) and Lactobacillus bulgaricus (LCB). The remaining aerosols were divided into three separate groups that gather the most similar substances (Group 1–3) (Table 3). The subsequent groups up to 21 represent individual ANNs leading to the final classification of the aerosol. In practice separation is done not by one confusion matrix (ANN) but by all of them in sequence (22 ANNs combined in a decision tree). For example, if an ANN classifies an unknown substance into any of 22 groups it means that the decision process is not ended but rather from that moment another ANN classifies this substance. However, each new ANN is trained using only a subsection of the data excluding the data from other groups.
Table 3Exemplary confusion matrix of all aerosols classified by the first ANN. Bold numbers denote how correct (in percent) a certain substance was classified to be.

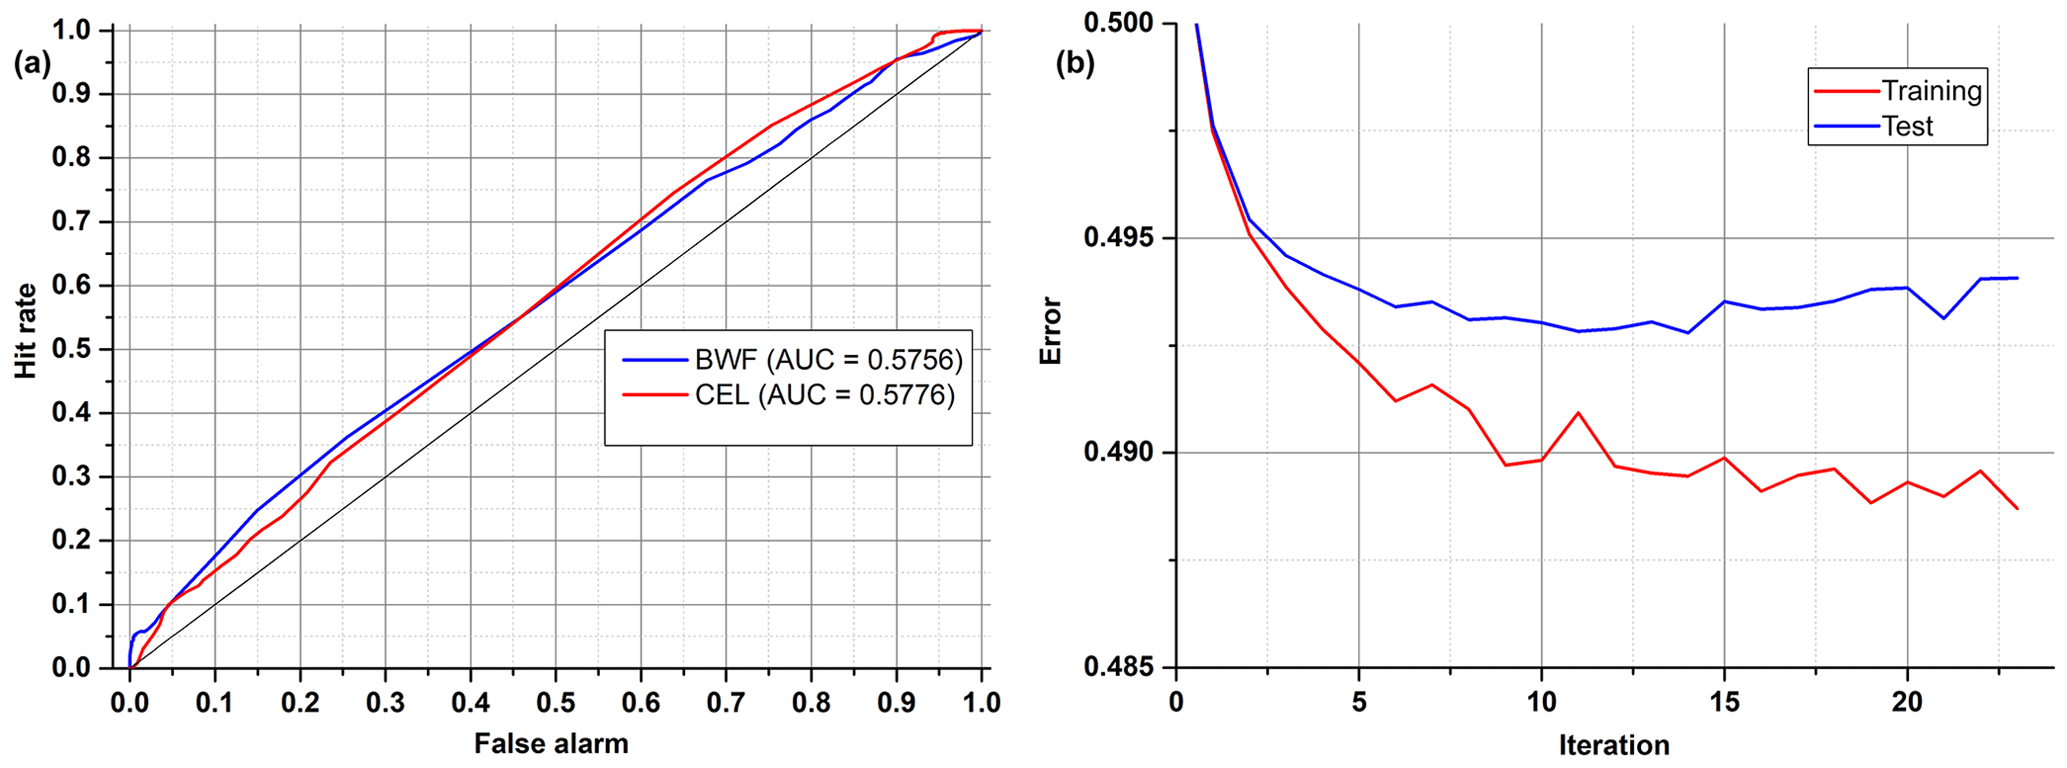
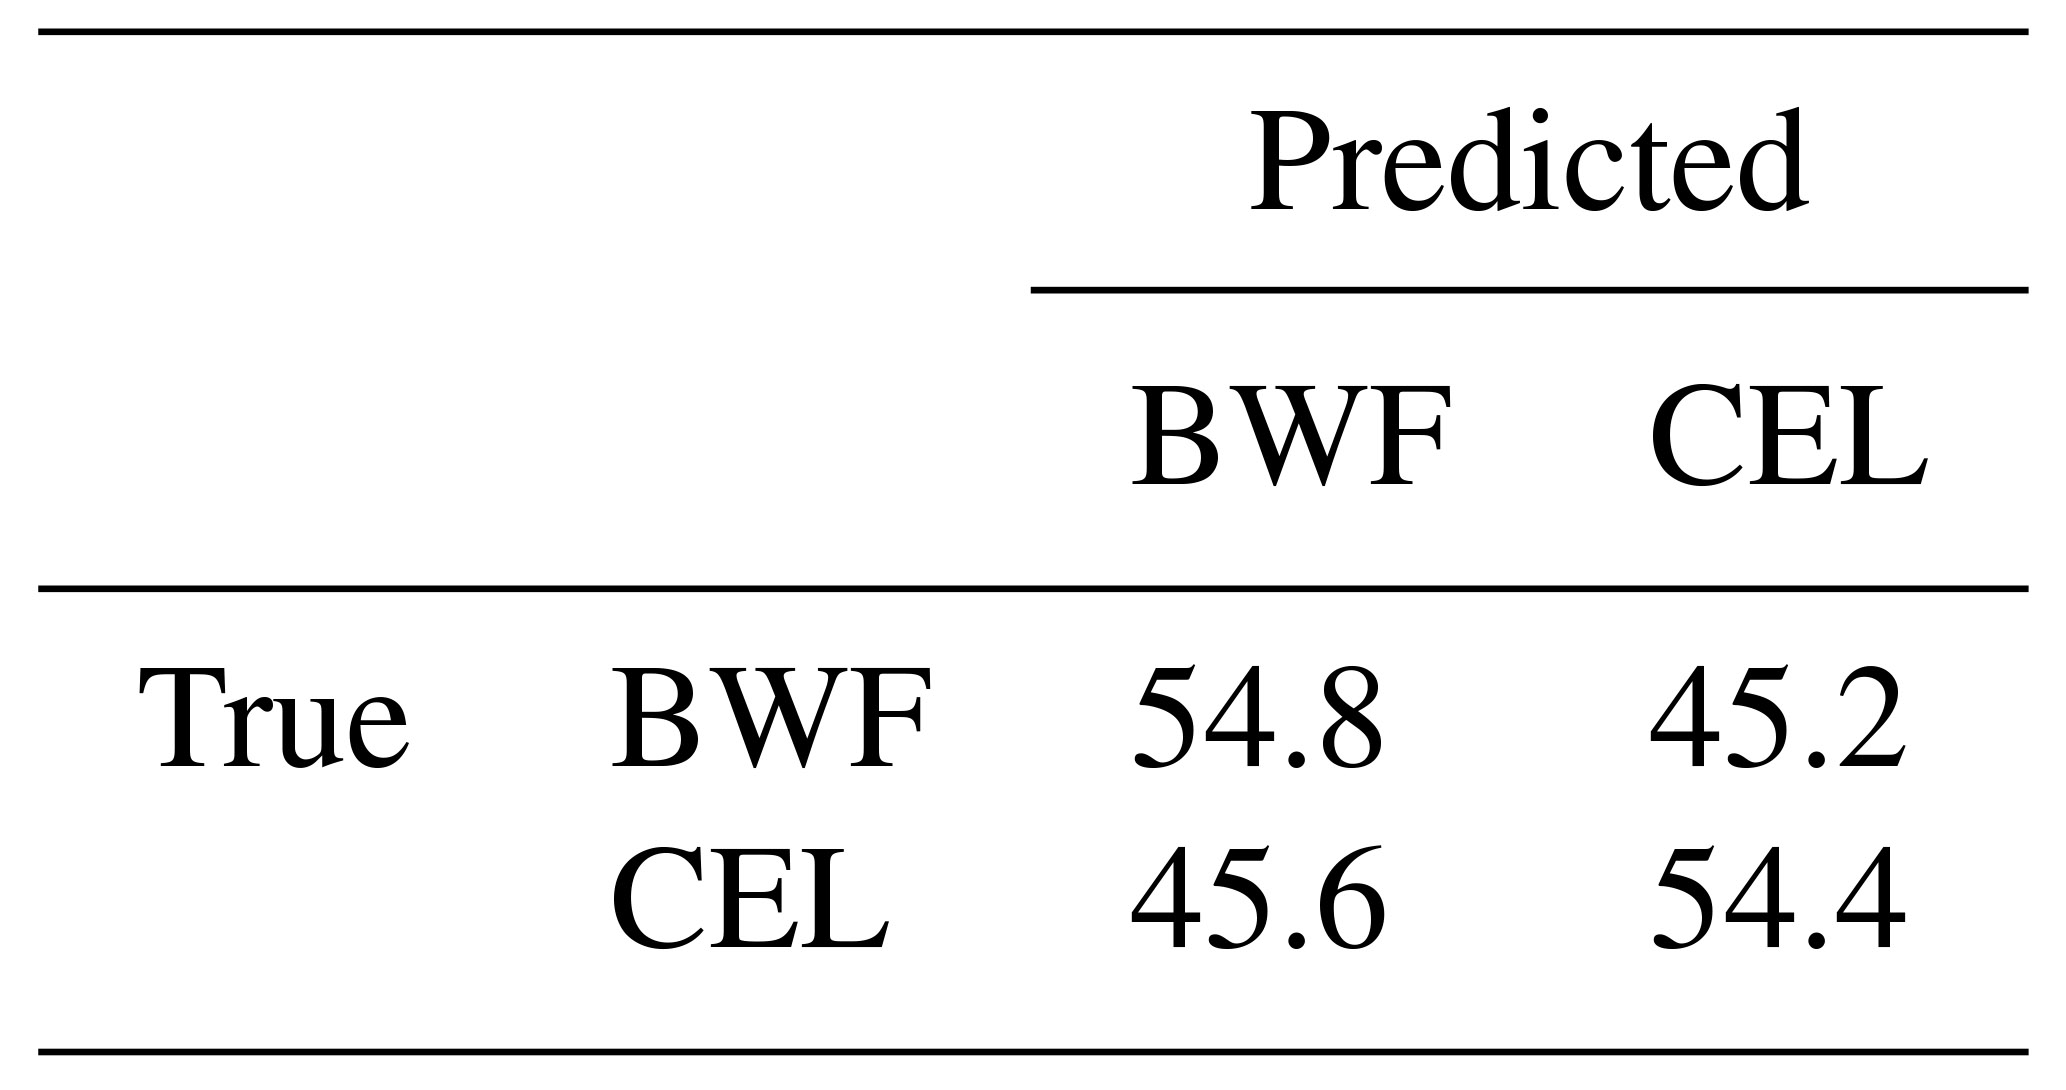
Table 4 and Fig. 9 show results achieved for two substances that have a very similar spectrum, and the AUCs calculated are not much higher than in a random classifier. This example clearly shows why we are not always able to classify every single particle of aerosol with 100 % accuracy. However, just a representative number (several dozen) of measured particles (a cloud) allows the proper prediction of aerosol types within a few seconds. This is easy to observe during real-time detection because counts allocated in a confusion matrix tend to reach a stable state quite quickly.
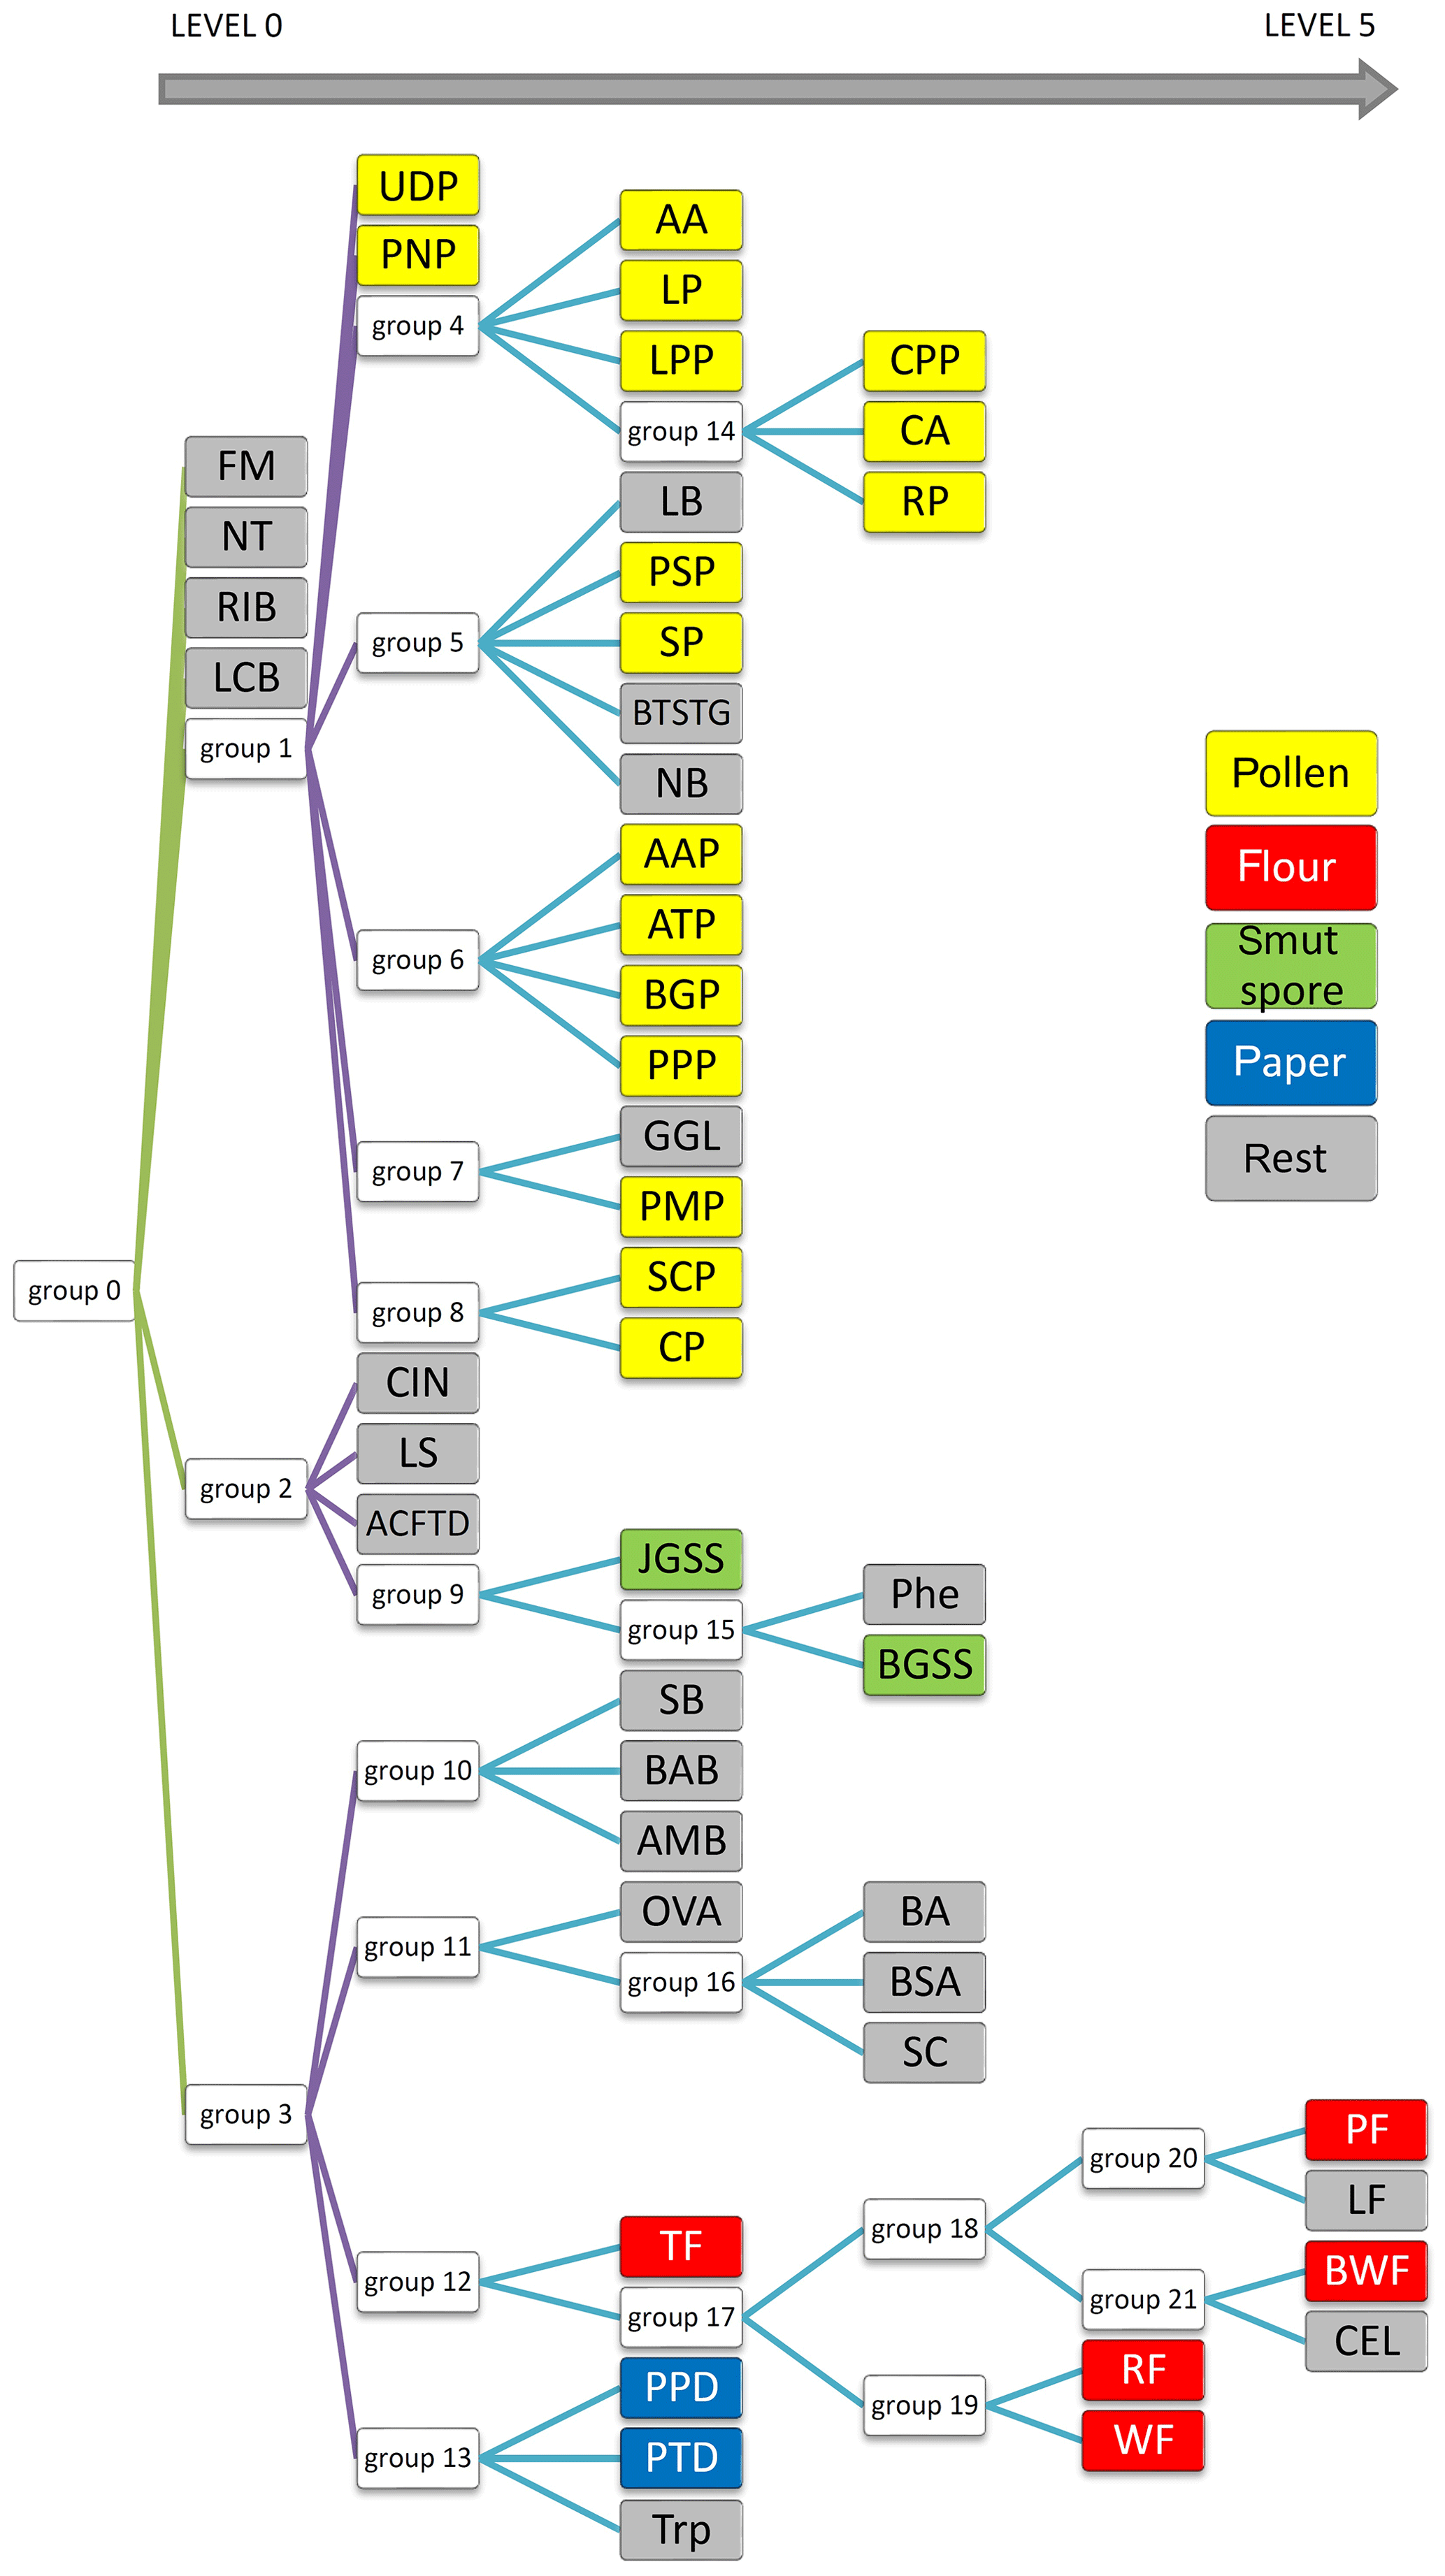
3.2 Classification tree
Finally, to achieve the best possible classification, a decision tree was created (Fig. 10). It comprises not 1, but 22 models. The process of creating them is not replicable in terms of the exact factors used for ANN generation. However, this is not essential because the decision tree is based on ANN results (classification ability), which should be the highest possible. Therefore, the final result will be the same. It is difficult to present confusion matrices and ROC graphs for all neural networks in this paper. Therefore, only the most interesting one has been discussed. Here, each node represents a network that classifies a group of aerosols. The aerosols on the left side of the diagram show the most distinct differences; thus they are easy to classify (Level 0). On the right side (Level 1–5), this task is much more demanding due to a similar spectrum, and the separation is less probable in accordance with single particles, although it is still very useful from a practical point of view for aerosol cloud discrimination.
Table 4Confusion matrix of two substances that have very similar spectra.
At first glance one can see that FM and RIB are very well recognized, but that was expected because these are standards of fluorescence. Surprisingly, NT and LCB aerosols were also separated from the others (Level 0 network). Further analysis of the tree structure identifies a correlation between samples and their real categories. It is especially noticeable for pollens, which are allocated to a separate branch of that tree, and all stems from Group 1. Most of them were classified on the third level. Interestingly all grass pollens (AAP, ATP, BGP, PPP) belong to the same group, Group 6. Similarly, both Lycopodium pollens from different regions of the word show a close correlation, although Abies alba, which is a tree, was classified in the same group. Flours, smut spores and papers are dispersed between different levels, but particular groups belong to the same branch of the tree. However, some of the samples are scattered on the whole tree area and do not correspond to any group.
It should be noted that the result is a system of 22 ANNs that work simultaneously. In comparison to the training process, which is rather time-consuming and has to be empirically optimized, this cluster of learned ANNs delivers high performance. Input data are processed by a single ANN in milliseconds. This performance makes the neural network a great tool as a splitting node in the classification tree. Compared to our previous results, for which principal component analysis was applied to analyze data from BARDet (Kaliszewski et al., 2016), the ANNs allowed much better discrimination between various bio-aerosols.
In this paper the possibility of applying an artificial neural network (ANN) for the real-time classification of biological aerosols was investigated. The spectral characteristics of bio-aerosols were collected using the BARDet instrument. The database consisted of 48 substances. Finally, 22 neural networks were trained and combined into a decision tree. This allowed aerosols to be characterized in real time. Tests revealed that only certain substances have such characteristic fluorescence spectra that allow correct classification of almost each particle. However, in all other cases the system was able to recognize a particular aerosol accurately with no mistakes, but a representative number of several dozens of particles in a cloud was necessary. Further approximation was based on decision tree analysis in which each node corresponded to a separate learned ANN. The best sets of ANNs for each group of similar aerosols were discovered utilizing confusion matrices and ROC analysis. Our intention was to make a complete system which detects and classifies substances without creating groups a priori. This attitude helped us to create a powerful analytical tool that works automatically, and the results of classification are immediately available on the operator's screen.
This study proved that it is possible to create a tool for a highly effective analysis of bio-aerosols using multiple ANNs combined into a decision tree. Our approach allowed us to automate and speed up the analysis, which reduced time and the amount of computing power needed. In a future study the database will be extended to obtain potentially a vast variety of samples including atmospherically relevant bacteria and fungi. In the next step, the actual performance of the system will be determined under real environmental conditions, which will be most challenging due to the presence of unknown fluorescent and nonfluorescent particles.
The experimental aerosol data can be provided upon request. The software for automatic data analysis cannot be publicly provided at this moment since it is the subject of negotiations with a company.
ML developed the code, performed aerosol experiments, performed data analysis for ANNs, wrote the section concerning data analysis and contributed to the discussion. He also elaborated on the research conception, produced graphs concerning the data analysis and elaborated on the aerosol generation setup. MK elaborated on the research conception, provided input in writing the Introduction, aerosol experimental and Summary sections, produced some graphs, supervised the manuscript preparation, elaborated on the aerosol generation method, collected most of the samples for analysis, performed aerosol experiments and participated in and elaborated on the microscopic analysis. MW maintained and manipulated the optical elements of BARDet, contributed to scientific discussions, edited the manuscript and graphs, wrote the aerosol microscopy section and performed most of the microscopic measurements. JM contributed to scientific discussions, supported and improved the electronic module of the BARDet and contributed to the writing of the Introduction. ZM reviewed the manuscript and provided constructive discussion as well as language corrections. KK reviewed the manuscript, provided constructive discussion and supervised the project.
The authors declare that they have no conflict of interest.
The work presented was supported by a grant from the National Centre of
Research and Development (894 Poland), within the project “Mobile laboratory
for environmental sampling and identification of biological threats” (O ROB
0031 01/ID/31/1).
Edited by: Mingjin Tang
Reviewed by: four anonymous referees
Agranovski, V., Ristovski, Z., Hargreaves, M., Blackall, P. J., and Morawska, L.: Performance evaluation of the UVAPS: Influence of physiological age of airborne bacteria and bacterial stress, J. Aerosol Sci., 34, 1711–1727, https://doi.org/10.1016/S0021-8502(03)00191-5, 2003.
Antowiak, M. and Chałasínska-Macukow, K.: Fingerprint identification by using artificial neural network with optical wavelet preprocessing, Opto-Electron. Rew., 11, 327–337, 2003.
Purnomo, H. D., Hartomo, K. D., and Prasetyo, S. Y. J.: Artificial Neural Network for Monthly Rainfall Rate Prediction, IOP Conf. Ser. Mater. Sci. Eng., 180, 12057, https://doi.org/10.1088/1742-6596/755/1/011001, 2017.
Bhangar, S., Huffman, J. A., and Nazaroff, W. W.: Size-resolved fluorescent biological aerosol particle concentrations and occupant emissions in a university classroom, Indoor Air, 24, 604–617, https://doi.org/10.1111/ina.12111, 2014.
Bishop, C. M.: Neural networks for pattern recognition, Oxford University Press, Inc., New York, NY, USA, 1995.
Blais-Lecours, P., Perrott, P., and Duchaine, C.: Non-culturable bioaerosols in indoor settings: Impact on health and molecular approaches for detection, Atmos. Environ., 110, 45–53, https://doi.org/10.1016/j.atmosenv.2015.03.039, 2015.
Borecki, M., Korwin-Pawlowski, M. L., and Beblowska, M.: A method of examination of liquids by neural network analysis of reflectometric and transmission time domain data from optical capillaries and fibers, IEEE Sens. J., 8, 1208–1214, 2008.
Choi, K., Ha, Y., Lee, H. K., and Lee, J.: Development of a biological aerosol detector using laser-induced fluorescence and a particle collection system, Instrum. Sci. Technol., 42, 200–214, https://doi.org/10.1080/10739149.2013.855639, 2014.
Crawford, I., Ruske, S., Topping, D. O., and Gallagher, M. W.: Evaluation of hierarchical agglomerative cluster analysis methods for discrimination of primary biological aerosol, Atmos. Meas. Tech., 8, 4979–4991, https://doi.org/10.5194/amt-8-4979-2015, 2015.
Davidson, C. I., Phalen, R. F., and Solomon, P. A.: Airborne particulate matter and human health: A review, Aerosol Sci. Technol., 39, 737–749, https://doi.org/10.1080/02786820500191348, 2005.
Deguillaume, L., Leriche, M., Amato, P., Ariya, P. A., Delort, A.-M., Pöschl, U., Chaumerliac, N., Bauer, H., Flossmann, A. I., and Morris, C. E.: Microbiology and atmospheric processes: chemical interactions of primary biological aerosols, Biogeosciences, 5, 1073–1084, https://doi.org/10.5194/bg-5-1073-2008, 2008.
Fawcett, T.: An introduction to ROC analysis, Pattern Recognition Letters, Pattern Recognit. Lett., 27, 861–874, https://doi.org/10.1016/j.patrec.2005.10.010, 2006.
Fennelly, M. J., Sewell, G., Prentice, M. B., O'Connor, D. J., and Sodeau, J. R.: Review: The use of real-time fluorescence instrumentation to monitor ambient primary biological aerosol particles (PBAP), Atmosphere (Basel), 9, 1–39, https://doi.org/10.3390/atmos9010001, 2017.
Feugnet, G., Lallier, E., Grisard, A., McIntosh, L., Hellström, J. E., Jelger, P., Laurell, F., Albano, C., Kaliszewski, M., Wlodarski, M., Mlynczak, J., Kwasny, M., Zawadzki, Z., Mierczyk, Z., Kopczynski, K., Rostedt, A., Putkiranta, M., Marjamäki, M., Keskinen, J., Enroth, J., Janka, K., Reinivaara, R., Holma, L., Humppi, T., Battistelli, E., Iliakis, E., and Gerolimos, G.: Improved laser-induced fluorescence method for bio-attack early warning detection system, in Proceedings of SPIE – The International Society for Optical Engineering, 7116, 71160C, Thales Research and Technology, France, 2008.
Fröhlich-Nowoisky, J., Kampf, C. J., Weber, B., Huffman, J. A., Pöhlker, C., Andreae, M. O., Lang-Yona, N., Burrows, S. M., Gunthe, S. S., Elbert, W., Su, H., Hoor, P., Thines, E., Hoffmann, T., Després, V. R., and Pöschl, U.: Bioaerosols in the Earth system: Climate, health, and ecosystem interactions, Atmos. Res., 182, 346–376, https://doi.org/10.1016/j.atmosres.2016.07.018, 2016.
Fuzzi, S., Baltensperger, U., Carslaw, K., Decesari, S., Denier van der Gon, H., Facchini, M. C., Fowler, D., Koren, I., Langford, B., Lohmann, U., Nemitz, E., Pandis, S., Riipinen, I., Rudich, Y., Schaap, M., Slowik, J. G., Spracklen, D. V., Vignati, E., Wild, M., Williams, M., and Gilardoni, S.: Particulate matter, air quality and climate: lessons learned and future needs, Atmos. Chem. Phys., 15, 8217–8299, https://doi.org/10.5194/acp-15-8217-2015, 2015.
Gabey, A. M., Gallagher, M. W., Whitehead, J., Dorsey, J. R., Kaye, P. H., and Stanley, W. R.: Measurements and comparison of primary biological aerosol above and below a tropical forest canopy using a dual channel fluorescence spectrometer, Atmos. Chem. Phys., 10, 4453-4466, https://doi.org/10.5194/acp-10-4453-2010, 2010.
Gabey, A. M., Stanley, W. R., Gallagher, M. W., and Kaye, P. H.: The fluorescence properties of aerosol larger than 0.8 µm in urban and tropical rainforest locations, Atmos. Chem. Phys., 11, 5491–5504, https://doi.org/10.5194/acp-11-5491-2011, 2011.
Górny, R. L.: Filamentous microorganisms and their fragments in indoor air – A review, Ann. Agric. Environ. Med., 11, 185–197, https://doi.org/10.1007/BF02677055, 2004.
Hernandez, M., Perring, A. E., McCabe, K., Kok, G., Granger, G., and Baumgardner, D.: Chamber catalogues of optical and fluorescent signatures distinguish bioaerosol classes, Atmos. Meas. Tech., 9, 3283–3292, https://doi.org/10.5194/amt-9-3283-2016, 2016.
Hill, S. C., Pinnick, R. G., Niles, S., Pan, Y.-L., Holler, S., Chang, R. K., Bottinger, J., Chen, B. T., Orr, C.-S., and Feather, G.: Realtime Measurement of Fluorescence Spectra from Single Airborne Biological Particles, F. Anal. Chem. Technol., 3, 221–239, https://doi.org/10.1002/(SICI)1520-6521(1999)3:4/5<221::AID-FACT2>3.3.CO;2-Z, 1999.
Huffman, J. A., Treutlein, B., and Pöschl, U.: Fluorescent biological aerosol particle concentrations and size distributions measured with an Ultraviolet Aerodynamic Particle Sizer (UV-APS) in Central Europe, Atmos. Chem. Phys., 10, 3215–3233, https://doi.org/10.5194/acp-10-3215-2010, 2010.
Kaliszewski, M., Trafny, E. A., Lewandowski, R., Włodarski, M., Bombalska, A., Kopczyński, K., Antos-Bielska, M., Szpakowska, M., Młyńczak, J., Mularczyk-Oliwa, M., and Kwaśny, M.: A new approach to UVAPS data analysis towards detection of biological aerosol, J. Aerosol Sci., 58, 148–157, https://doi.org/10.1016/j.jaerosci.2013.01.007, 2013.
Kaliszewski, M., Włodarski, M., Młyńczak, J., Leśkiewicz, M., Bombalska, A., Mularczyk-Oliwa, M., Kwaśny, M., Buliński, D., and Kopczyński, K.: A new real-time bio-aerosol fluorescence detector based on semiconductor CW excitation UV laser, J. Aerosol Sci., 100, 14–25, https://doi.org/10.1016/j.jaerosci.2016.05.004, 2016.
Kohlus, R. and Bottlinger, M.: Particle Shape Analysis as an example of knowledge extraction by neural nets, Part. Part. Syst. Charact., 10, 275–278, https://doi.org/10.1002/ppsc.19930100511, 1993.
Lakowicz, J. R.: Principles of fluorescence spectroscopy, Springer Science and Business Media LLC, Third edition, NY, 2006.
Leśkiewicz, M., Kaliszewski, M., Mierczyk, Z., and Włodarski, M.: Comparison of Principal Component Analysis and Linear Discriminant Analysis applied to classification of excitation-emission matrices of the selected biological material, Biul. Wojsk. Akad. Tech., 65, 15–31, https://doi.org/10.5604/12345865.1197960, 2016.
Lim, D. V., Simpson, J. M., Kearns, E. A., and Kramer, M. F.: Current and developing technologies for monitoring agents of bioterrorism and biowarfare, Clin. Microbiol. Rev., 18, 583–607, https://doi.org/10.1128/CMR.18.4.583-607.2005, 2005.
Mauderly, J. L. and Chow, J. C.: Health effects of organic aerosols, Inhal. Toxicol., 20, 257–288, https://doi.org/10.1080/08958370701866008, 2008.
Miaskiewicz-Peska, E. and Lebkowska, M.: Comparison of aerosol and bioaerosol collection on air filters, Aerobiologia (Bologna), 28, 185–193, https://doi.org/10.1007/s10453-011-9223-1, 2012.
Michaels, R. A.: Environmental Moisture, Molds, and Asthma – Emerging Fungal Risks in the Context of Climate Change, Environ. Claims J., 29, 171–193, https://doi.org/10.1080/10406026.2017.1345521, 2017.
Pan, Y. Le, Hill, S. C., Pinnick, R. G., House, J. M., Flagan, R. C., and Chang, R. K.: Dual-excitation-wavelength fluorescence spectra and elastic scattering for differentiation of single airborne pollen and fungal particles, Atmos. Environ., 45, 1555–1563, https://doi.org/10.1016/j.atmosenv.2010.12.042, 2011.
Pan, Y. Le, Huang, H. and Chang, R. K.: Clustered and integrated fluorescence spectra from single atmospheric aerosol particles excited by a 263- and 351-nm laser at New Haven, CT, and Adelphi, MD, J. Quant. Spectrosc. Radiat. Trans., 113, 2213–2221, https://doi.org/10.1016/j.jqsrt.2012.07.028, 2012.
Pinnick, R. G., Hill, S. C., Pan, Y. Le, and Chang, R. K.: Fluorescence spectra of atmospheric aerosol at Adelphi, Maryland, USA: Measurement and classification of single particles containing organic carbon, Atmos. Environ., 38, 1657–1672, https://doi.org/10.1016/j.atmosenv.2003.11.017, 2004.
Pöhlker, C., Huffman, J. A., Förster, J.-D., and Pöschl, U.: Autofluorescence of atmospheric bioaerosols: spectral fingerprints and taxonomic trends of pollen, Atmos. Meas. Tech., 6, 3369–3392, https://doi.org/10.5194/amt-6-3369-2013, 2013.
Pope, C. A. and Dockery, D. W.: Health effects of fine particulate air pollution: Lines that connect, J. Air Waste Manag. Assoc., 56, 709–742, https://doi.org/10.1080/10473289.2006.10464485, 2006.
Pósfai, M. and Buseck, P. R.: Nature and Climate Effects of Individual Tropospheric Aerosol Particles, Annu. Rev. Earth Planet. Sci., 38, 17–43, https://doi.org/10.1146/annurev.earth.031208.100032, 2010.
Ruske, S., Topping, D. O., Foot, V. E., Kaye, P. H., Stanley, W. R., Crawford, I., Morse, A. P., and Gallagher, M. W.: Evaluation of machine learning algorithms for classification of primary biological aerosol using a new UV-LIF spectrometer, Atmos. Meas. Tech., 10, 695–708, https://doi.org/10.5194/amt-10-695-2017, 2017.
Savage, N. J., Krentz, C. E., Könemann, T., Han, T. T., Mainelis, G., Pöhlker, C., and Huffman, J. A.: Systematic characterization and fluorescence threshold strategies for the wideband integrated bioaerosol sensor (WIBS) using size-resolved biological and interfering particles, Atmos. Meas. Tech., 10, 4279–4302, https://doi.org/10.5194/amt-10-4279-2017, 2017.
Shiraiwa, M., Selzle, K., and Pöschl, U.: Hazardous components and health effects of atmospheric aerosol particles: Reactive oxygen species, soot, polycyclic aromatic compounds and allergenic proteins, Free Radic. Res., 46, 927–939, https://doi.org/10.3109/10715762.2012.663084, 2012.
Taketani, F., Kanaya, Y., Nakamura, T., Koizumi, K., Moteki, N., and Takegawa, N.: Measurement of fluorescence spectra from atmospheric single submicron particle using laser-induced fluorescence technique, J. Aerosol Sci., 58, 1–8, https://doi.org/10.1016/j.jaerosci.2012.12.002, 2013.
Trafny, E. A., Lewandowski, R., Stȩpińska, M., and Kaliszewski, M.: Biological threat detection in the air and on the surface: How to define the risk, Arch. Immunol. Ther. Exp. (Warsz)., 62, 253–261, https://doi.org/10.1007/s00005-014-0296-8, 2014.
Uk Lee, B., Jung, J. H., Yun, S. H., Hwang, G. B., and Bae, G. N.: Application of UVAPS to real-time detection of inactivation of fungal bioaerosols due to thermal energy, J. Aerosol Sci., 41, 694–701, https://doi.org/10.1016/j.jaerosci.2010.04.003, 2010.