the Creative Commons Attribution 4.0 License.
the Creative Commons Attribution 4.0 License.
 | 12 Dec 2018
Particle wall-loss correction methods in smog chamber experiments
Ningxin Wang
Spiro D. Jorga
Jeffery R. Pierce
Neil M. Donahue
Spyros N. Pandis
The interaction of particles with the chamber walls has been a significant source of uncertainty when analyzing results of secondary organic aerosol (SOA) formation experiments performed in Teflon chambers. A number of particle wall-loss correction methods have been proposed including the use of a size-independent loss rate constant, the ratio of suspended organic mass to that of a conserved tracer (e.g., sulfate seeds), and a size-dependent loss rate constant, etc. For complex experiments such as the chemical aging of SOA, the results of the SOA quantification analysis can be quite sensitive to the adopted correction method due to the evolution of the particle size distribution and the duration of these experiments.
We evaluated the performance of several particle wall-loss correction methods for aging experiments of α-pinene ozonolysis products. Determining the loss rates from seed loss periods is necessary for this system because it is not clear when chemical reactions have been completed. Results from the OA ∕ sulfate ratio and the size-independent correction methods can be influenced significantly by the size dependence of the particle wall-loss process. Coagulation can also affect the particle size distribution, especially for particles with diameter less than 100 nm, thus introducing errors in the results of the wall-loss correction. The corresponding loss rate constants may vary from experiment to experiment, and even during a specific experiment. Friction between the Teflon chamber walls and non-conductive surfaces can significantly increase particle wall-loss rates and the chamber may require weeks to recover to its original condition. Experimental procedures are proposed for the characterization of particle losses during different stages of these experiments and the evaluation of corresponding particle wall-loss correction.
- Article
(2904 KB) - Full-text XML
-
Supplement
(385 KB) - BibTeX
- EndNote


Smog chamber experiments have been an important tool for the study of atmospheric aerosol processes. One major challenge of smog chamber experiments is the particle wall-loss processes. The aerosols inside the chamber are lost to its walls due to Brownian diffusion, convection, electrostatic effects (especially for Teflon chambers) and gravitational sedimentation (Crump and Seinfeld, 1981). The particle wall-loss process is first-order and the particle wall-loss rate constant, k, is defined as
where N(Dp,t) is the number concentration of particles with diameter Dp at time t. For an aerosol population, k is in general a function of particle size and time. Smaller sized particles (less than 50 nm) have a higher loss rate due to the diffusion-dominated wall-loss process, while particles larger than 1 µm are mainly lost due to sedimentation for a reactor with low air motion inside. The electrostatic effect can play a major role in intermediate sizes (McMurry and Rader, 1985). Charan et al. (2018) studied the charge effect on the rate of particle wall deposition, estimating both the eddy-diffusion coefficient and the average magnitude of the electric field within their chamber.
Early studies of chamber simulations of secondary organic aerosol (SOA) formation and growth assumed that particle wall loss is negligible in fairly large chambers (∼30 m3) when determining SOA yields (Stern et al., 1987). Several particle wall-loss correction methods have since been developed and adopted in chamber studies. Pathak et al. (2007) proposed a semi-empirical wall-loss correction method that involves determining the first-order particle wall-loss rate constant, k, from the SOA mass concentration measured by the scanning mobility particle sizer (SMPS) after chemical reactions have been completed. This total-mass-concentration-based method is based on the assumption that k is independent of particle size for the size range of particles present in the experiment and remains constant during the course of an experiment. The constant k is found as the slope of the linear regression:
where is the measured SOA mass concentration at time t and Q is an arbitrary constant. The values of used for the fit are taken after the SOA production has finished (condensation and/or evaporation is minimal). The corrected SOA concentration can be found by
where Cseed(0) is the seed mass concentration when SOA formation begins. This approach is relatively accurate when k remains more or less constant over the size range of the aerosol population inside the chamber, and accounts for the experiment-to-experiment variability of the particle wall-loss rates. However, it requires a period during which no reactions are taking place in the chamber and assumes that the rate constant does not vary during the experiment.
The size-dependent correction method involves determining a first-order k(Dp) through the aforementioned linear fitting of the number concentration of the suspended particles, for each size, usually with the help of an SMPS. Several studies that adopted this method determined the k(Dp) profile for the corresponding chamber through seed experiments in which inert (e.g., ammonium sulfate) particles were used (McMurry and Grosjean, 1985; Keywood et al., 2004; Ng et al., 2007; Fry et al., 2014; Nah et al., 2017). In these studies, an average k(Dp) profile was applied to all experiments. This method includes the size dependence of k but not its potential variation from experiment to experiment. Ng et al. (2007) and Wang et al. (2018) determined a k(Dp) profile using the initial seed wall-loss period for each of their experiments, thus accounting for the experiment-to-experiment variation.
The OA ∕ sulfate correction method was proposed by Hildebrandt et al. (2009) using the organic and the sulfate mass concentration measured by the aerosol mass spectrometer (AMS). This approach assumes that the loss rate constants of organic species and sulfate are the same during an experiment as there are no processes affecting sulfate other than losses to the walls (e.g., no added SO2 or other sulfate precursors). The corrected OA mass concentration is then calculated as
where is the AMS-derived OA ∕ sulfate ratio and Cseed(0) is the seed concentration in the chamber when SOA formation starts. Several chamber studies have adopted this method (Henry and Donahue, 2012; Loza et al., 2012). Other variations of this method include the use of the ratio of OA to other inert tracers like black carbon (BC), which are present in experiments investigating the evolution of primary OA from combustion sources (Hennigan et al., 2011). This method involving the use of OA ∕ tracer ratio is accurate when the OA and the tracer have the same size distribution during the experiment or when the loss rate constant is close to being size-independent. However, in experiments in which SOA condenses more onto smaller sized particles, the size dependence of the loss rate can introduce significant uncertainty in the corrected results, especially for timescales of several hours (Wang et al., 2018).
Table 1List of experiments and experimental conditions.
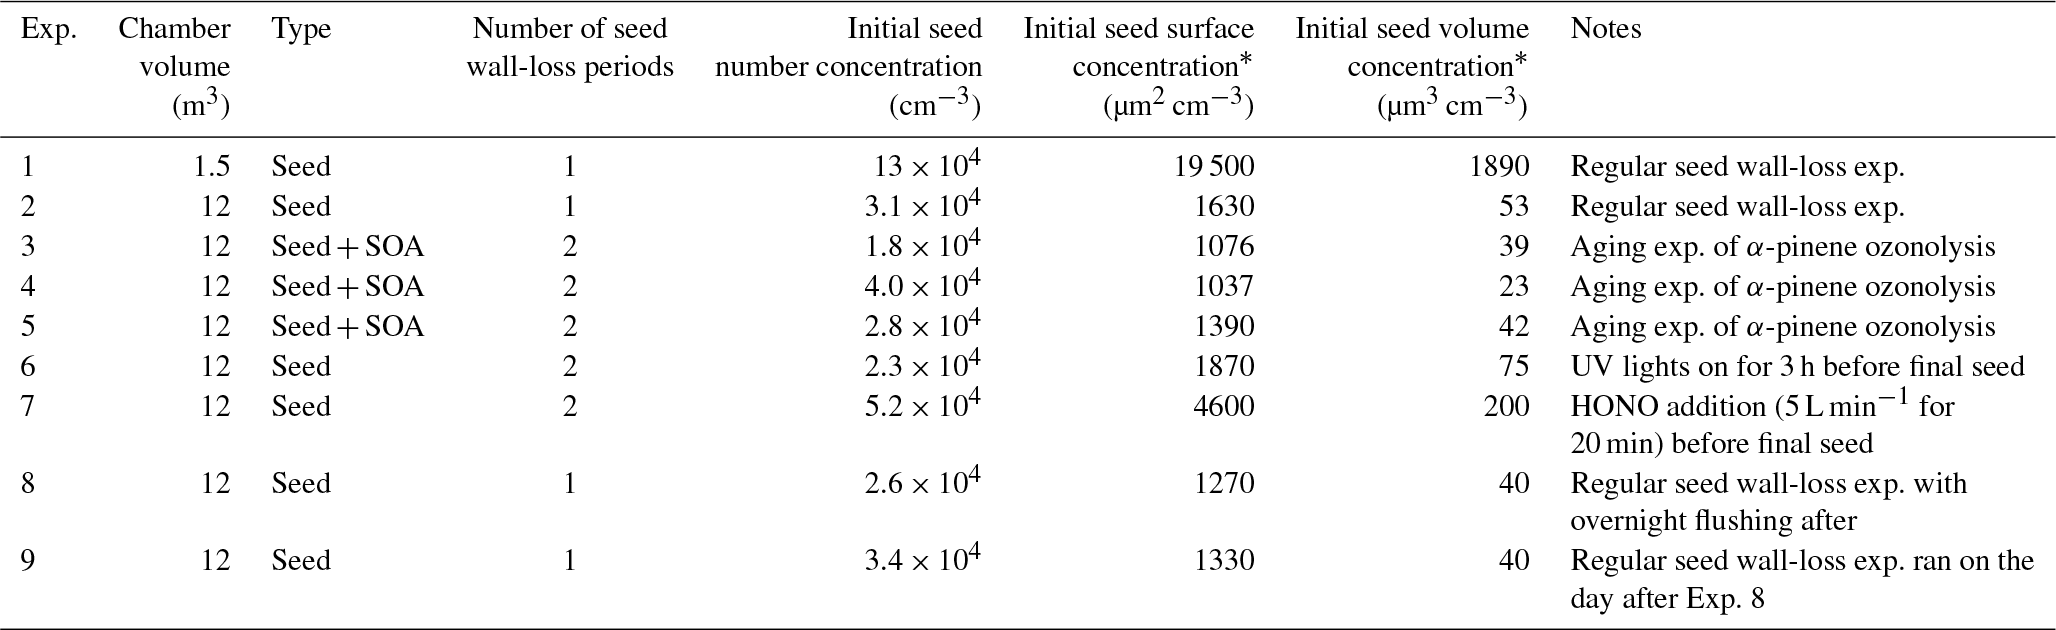
* Maximum concentration after initial seed injection (before wall loss of these seed particles).
An alternative method for particle wall-loss correction is the use of models of aerosol dynamics. Pierce et al. (2008) developed the Aerosol Parameter Estimation (APE) model that simulates the processes of condensation and/or evaporation, coagulation, and particle wall loss during a chamber experiment. By constraining the unknown parameters with the SMPS-measured particle size distribution, the model can predict SOA formation for each experiment, accounting for wall losses. The predicted particle wall-loss rates are both size- and time-dependent. The APE model predicts the particle wall-loss rates by assuming specific functional forms of its dependence on particle size (Crump and Seinfeld, 1981). The model has performed well in experiments in which the reaction timescale was short, but produced more uncertain results in experiments with slower reacting systems. Nah et al. (2017) adopted a modified version of the APE model that calculates the size-dependent wall-loss rate necessary to reproduce the observed size distribution, assuming Brownian coagulation was the only other particle process occurring in the chamber (i.e., no condensation and/or evaporation occurred during the analyzed portion of the experiment). The size-dependent, instantaneous particle loss rates were calculated directly from the SMPS-measured seed number size distribution at each time step. These instantaneous k(Dp) values were then averaged over the initial seed loss period of the experiment (or a separate experiment where k(Dp) was characterized). This determined k(Dp) can then be applied to the SOA formation period of experiments to correct for the size-dependent wall loss. This approach, focusing on specific wall-loss characterization experiments, has the advantage that the functional dependence of the wall-loss rate constant is directly calculated from the measurements by simply removing the effect of coagulation. Its disadvantage compared to APE is that it requires additional time/experiments for seed measurements and can no longer address the potential time dependence of k over the course of a complex experiment.
The aforementioned methods each have their own advantages and disadvantages, and may perform well for specific experiments and chambers. However, for long-lasting experiments such as SOA aging, whereby particle size distribution may shift across a wide size range due to several generations of condensation, it is important to address both the time and size dependence of the particle loss rates for the purpose of SOA quantification. In this work, we adopt the modified APE model following Nah et al. (2017) and derive the size-dependent particle loss rate constants, k(Dp), based on seed periods during the experiments. As an attempt to evaluate the time dependence of the loss rates, we derive a second k(Dp) at the end of each experiment with a second seed injection and loss characterization period. To probe the effect of electrostatic forces on particle wall loss, we regularly measured the k(Dp) during the time period when the chamber was experiencing changes (e.g., changes in its surroundings, location or air motion inside). We explore the coagulation effect on the estimated particle wall-loss rates and particle number/volume concentration in both a 12 m3 Teflon chamber and a smaller 1.5 m3 Teflon reactor. We evaluate the performance of the aforementioned particle wall-loss correction methods for relatively complex aging experiments involving two or three generations of condensation of the α-pinene ozonolysis products.
2.1 Particle wall-loss rate constant measurements in the 12 m3 CMU Teflon chamber
The CMU smog chamber is a 12 m3 Teflon reactor (Welch Fluorocarbons) suspended in a temperature-controlled room. The same Teflon reactor was used in all experiments discussed in this work. The walls of the room are covered with UV lights (GE10526 and 10244). Prior to each experiment, the chamber is flushed overnight with purified air under UV illumination to remove any residual particles and vapors. Purified air is generated by passing house air through a high-efficiency particulate air (HEPA) filter to remove particles, a Purafil filter to remove NOx and an activated carbon filter to remove any organics followed by a silica gel filter, keeping relative humidity below 20 % throughout the experiments performed in this work.
A list of experiments performed in this work is presented in Table 1, together with the experimental conditions. To characterize the particle wall-loss rates, we performed experiments with ammonium sulfate (AS) particles during a full year, with one listed in Table 1. We used both 1 and 5 g L−1 ammonium sulfate solutions to generate particles, with the latter producing more particles at larger sizes. The ammonium sulfate solution was fed to an atomizer (TSI, model 3076) at a constant rate of 90 mL h−1 to produce droplets. The droplets passed through a diffusion dryer and a neutralizer to produce dry ammonium sulfate particles. This process produced seeds with a number mode diameter of around 100 nm. The initial seed number concentration in the chamber ranged from 2 to 5×104 cm−3, corresponding to a mass concentration of 40–200 µg m−3 and a surface area concentration of 1100–4600 µm2 cm−3. After injecting the particles, the particle wall loss was quantified for 3–4 h. We measured the particle size distribution with an SMPS (TSI classifier model 3080; DMA model 3081; CPC model 3010 or 3772). The CPC (condensation particle counter) sampling rate was 0.3 L min−1 for experiments in both chambers. For a 5 h experiment, the volume lost due to sampling is 0.09 m3. This is a small change for both the 12 m3 and the 1.5 m3 chambers. The SMPS scanning time was 5 min.
For a number of α-pinene ozonolysis experiments, we characterized the particle wall-loss rates twice, once before and once after the main experiment. The rationale behind the second injection is to ensure that the wall-loss rate constant profile remains relatively consistent (no major change) throughout each experiment. Due to the length of these aging experiments, few particles were left after the main experiment for a robust characterization of the profile, and thus we injected additional seed particles for a second time. At the beginning of each aging experiment, we used the 1 g L−1 ammonium sulfate solution to generate seed particles to provide enough surface area for the vapors to condense on. From the 3–4 h wall-loss time period, we were able to characterize the initial k(Dp) profile for this experiment. At the end of each experiment, we injected additional ammonium sulfate seeds into the chamber using the same method with a more concentrated solution (5 g L−1) (to generate bigger particles) in order to characterize the particle wall-loss rate constants a second time. Details about the experimental procedure for these aging experiments can be found in Wang et al. (2018).
2.2 Particle wall-loss rate constant measurements in a 1.5 m3 Teflon reactor
We performed additional particle wall-loss measurements in a dual smog chamber system consisting of a set of two identical Teflon chambers (1.5 m3 each). The two pillow-shaped chambers are mounted on metal frames with wheels on the bottom for portability. Details about the portable dual-chamber system can be found in Kaltsonoudis et al. (2018). The system was tested inside the laboratory in the present study. We used both ammonium sulfate and PSL particles (700 nm, Duke Scientific Corporation) for measurements in these chambers.
3.1 Particle loss rate constants
The particle loss rate constants derived from methods accounting for the coagulation of particles are denoted as kc in the rest of the paper, while the apparent particle loss rate constants neglecting the role of coagulation as ka. Our analysis here focuses on the losses of the particles and not on the potential interactions of the particles deposited on the walls with the gas phase (Hildebrandt et al., 2009).
3.1.1 The coagulation-corrected particle loss rate constants, kc(Dp)
The coagulation-corrected particle wall-loss rate constants were derived based on the model used by Nah et al. (2017). The model assumes that only two processes take place: particle wall loss and coagulation. With a given particle number size distribution at a specific time step, the model predicts how the distribution evolves at the next step, assuming coagulation is the only process based on the Brownian coagulation kernel in Seinfeld and Pandis (2016). The model attributes the difference between the predicted size distribution and the measured one to particle wall loss. Then the model calculates the instantaneous wall-loss rate constants at each time step for each size. To obtain the coagulation-corrected particle wall-loss rate constant, kc(Dp), the instantaneous rate constants are averaged over time. The reported uncertainty is calculated as , where is the standard deviation of kc for a certain size bin and N is the total number of time steps used. To minimize the uncertainty of kc, we used a time step of 15 min (three SMPS samples) for the averaging of the measurements. Only SMPS measurements from the seed wall-loss periods were used as the inputs for the model.
3.1.2 The apparent particle wall-loss rate constants, ka(Dp)
The apparent particle loss rate constants, denoted as ka in this work, were derived from the size-dependent loss rate constant. Details can be found in Wang et al. (2018). This approach uses the SMPS-measured seed particle number size distribution as input, and calculates a first-order loss rate constant for particles of a certain size across all measured sizes. These ka values intrinsically represent the combined loss effect of both particle wall loss and coagulation.
For particles in size bin i, ka,i is found by
where is the suspended aerosol number concentration at size bin i measured by SMPS and Q is an arbitrary constant.
3.2 Size-dependent particle loss correction
Both kc and ka are size-dependent. The corrected particle number concentration at size bin i, , is calculated by
We can then derive the corrected particle volume concentration of size bin i, .
The organic aerosol mass concentration corrected for wall losses can be then calculated during a seeded experiment using
where Vtot(t) is the corrected total particle volume concentration summed across all sizes and Vs is the corrected seed volume concentration right before SOA formation. For all practical purposes, Vs is constant during the seed-only period after our particle wall-loss corrections.
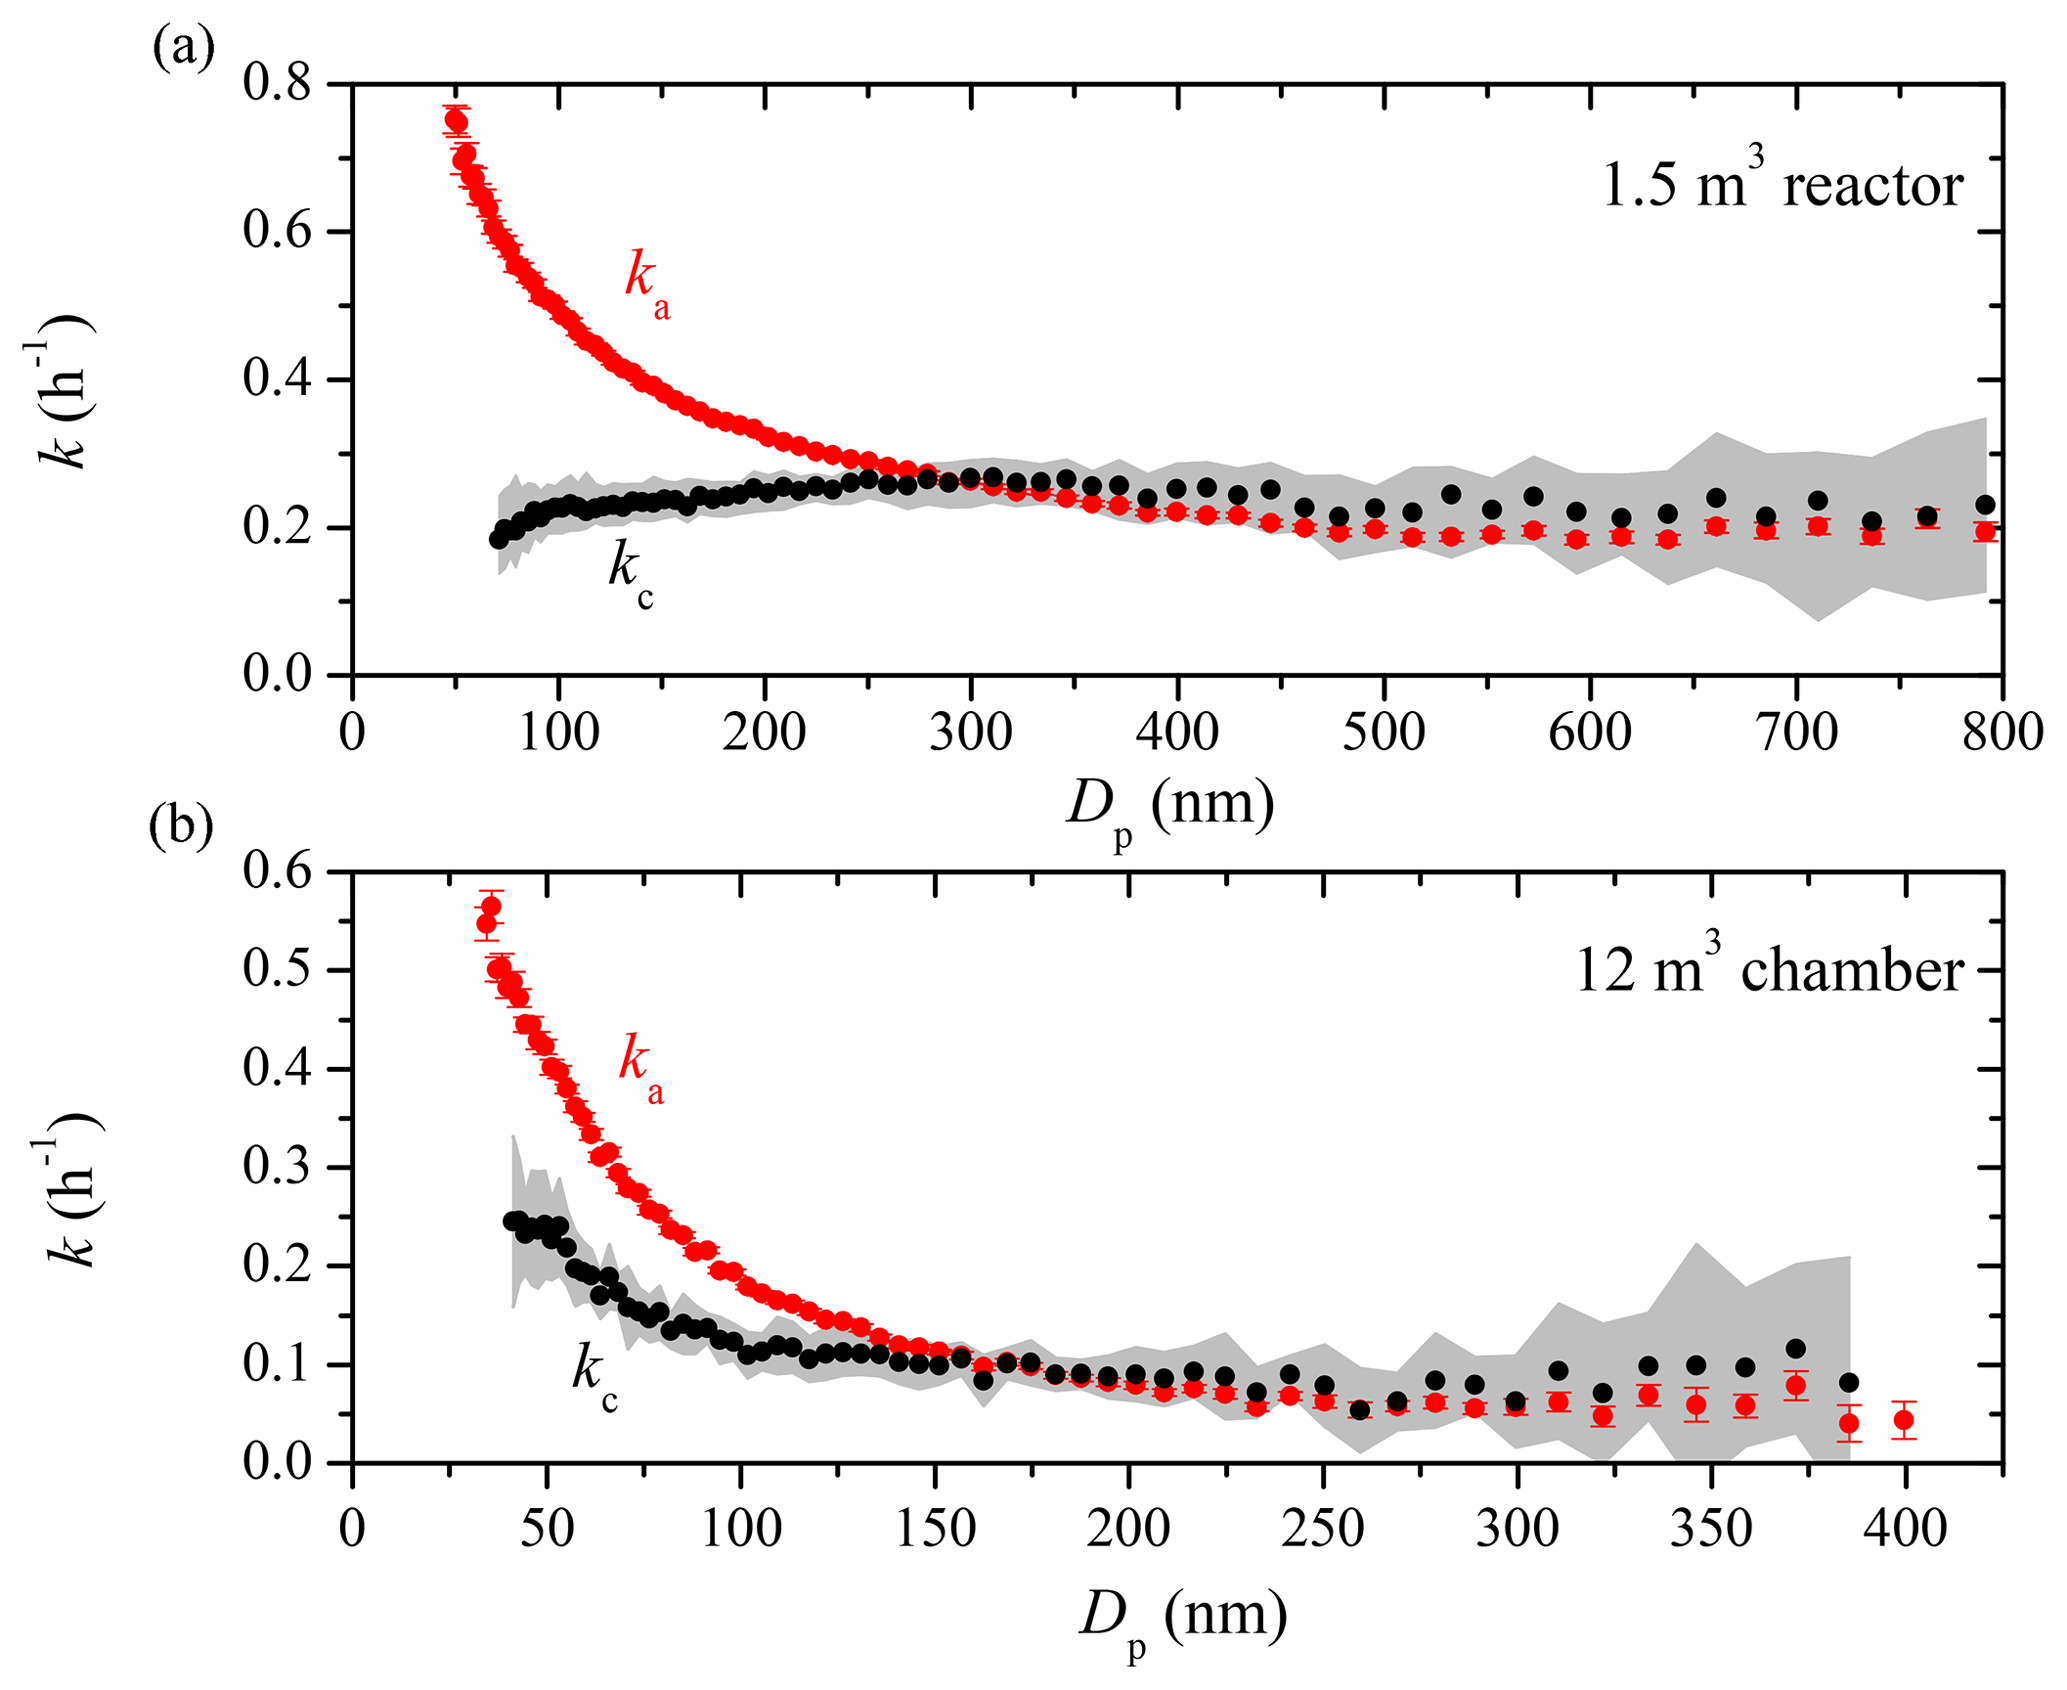
Figure 1The apparent (red symbols) and coagulation-corrected (black symbols) particle wall-loss rate constants as a function of particle size for (a) the 1.5 m3 Teflon reactor and (b) the 12 m3 CMU smog chamber after the two systems have been left undisturbed in the lab for weeks. The particle loss rate constants were derived based on SMPS measurements from Exp. 1 and 2. Only ka values with an R2>0.5 are shown. The error bars correspond to 1 standard deviation. The grey area is the uncertainty associated with kc.
4.1 Role of coagulation in particle wall-loss processes
Figure 1 shows the apparent (ka) and coagulation-corrected (kc) particle wall-loss rate constants as a function of particle size for the 1.5 m3 Teflon reactor (Exp. 1) and the 12 m3 chamber (Exp. 2) after both systems have remained “undisturbed” in the lab for weeks. The particle loss rate constants for a given size can only be measured reliably when there are enough particles of this size available in the system. In the experiments shown, the produced ammonium sulfate particle size distribution included few larger particles. As a result, the k values at bigger particle sizes were quite uncertain and are not shown. Since the differences in ka and kc are attributed to coagulation according to the aerosol dynamics model, coagulation was a significant loss process in Exp. 1 for particles with diameters smaller than 250 nm and for particles smaller than 150 nm in Exp. 2. In Exp. 1, the apparent loss rate constant for 100 nm particles was 0.5 h−1, while the actual rate constant after correcting for coagulation was only 0.2 h−1. For 200 nm particles, the corresponding values were 0.3 and 0.2 h−1 respectively. Note that the initial particle number concentration in Exp. 1 was 1 order of magnitude higher than that in Exp. 2 (Table 1), and thus coagulation played a more prominent role in Exp. 1. The coagulation effects were minor for particles larger than 250 nm in both cases. Once corrected for coagulation, the particle wall-loss rate constants indicated little size dependence for particles larger than 100 nm in both experiments. The corresponding values were 0.25 h−1 for the small reactor and 0.1 h−1 for the 12 m3 chamber. The uncertainty of the aerosol dynamics model for the larger particles is significantly higher than that of the direct calculation based on Eq. (5) (for example at Dp=790 nm in Exp. 1 for the 1.5 m3 reactor, the uncertainty of kc is 50 %, while that of ka is only 7 %). This is due to the reliance of the dynamics model on observed small changes of small number concentrations versus the linear regression fit of the logarithm of the measured particle concentration in each size bin. We suggest using twice the uncertainty of the linear regression as representative of the uncertainty of the rate loss constants of particles larger than 300 nm given the small impact of coagulation on particle concentrations and sizes in this range.

Figure 2The SMPS-measured (black symbols) and the particle-loss-corrected (a) number and (b) volume concentration using the ka(Dp) profile (red symbols) and the kc(Dp) profile (blue symbols) for Exp. 1.
To evaluate the coagulation effect on particle number and volume concentrations, we corrected them for wall loss with both ka(Dp) and kc(Dp). The results for the 1.5 m3 reactor (Exp. 1) are shown in Fig. 2 as an example. The measured ka values were extremely uncertain due to a lack of particles at small sizes, and thus they could not be used. To estimate the ka(Dp) values at Dp<50 nm (and the kc(Dp) values at Dp<70 nm), we used a linear fit of the ka(Dp) values from 50 to 70 nm (and of the kc(Dp) values from 70 to 100 nm) to back-extrapolate the ka values at smaller sizes; kc, being the coagulation-corrected particle wall-loss rate constant, intrinsically excludes the impact of coagulation on particle number concentration. Since coagulation reduces particle number (but conserves mass), kc-corrected particle number concentration is lower than the ka-corrected one, with the difference attributed to the coagulation rate. Coagulation caused the particle number concentration to decrease by 27 % over a 5 h period in this case, but had, as expected, a negligible effect on particle volume concentration. Please note that even if the overall effect of coagulation on total particle number is moderate, it is mostly concentrated in the lower end of the size distribution. As a result, the difference between ka and kc due to coagulation for particles smaller than 100 nm is almost an order of magnitude higher than the average difference. In this case there is little difference in the calculated total volume concentration, which is the most important quantity for SOA studies. However, this difference depends in general on the particle size distribution. If a significant part of the volume (or mass) is in particles with diameters less than 200 nm or so, the effect of coagulation will be significant for the corrected particle volume too. Nah et al. (2017) also studied the effect of coagulation on corrected SOA volume for the α-pinene ozonolysis system, and found that coagulation plays a minor role in experiments with an initial seed surface area of <3000 µm2 cm−3, while in experiments with a high seed surface area (>8000 µm2 cm−3), the SOA can be substantially overestimated if one ignores coagulation.
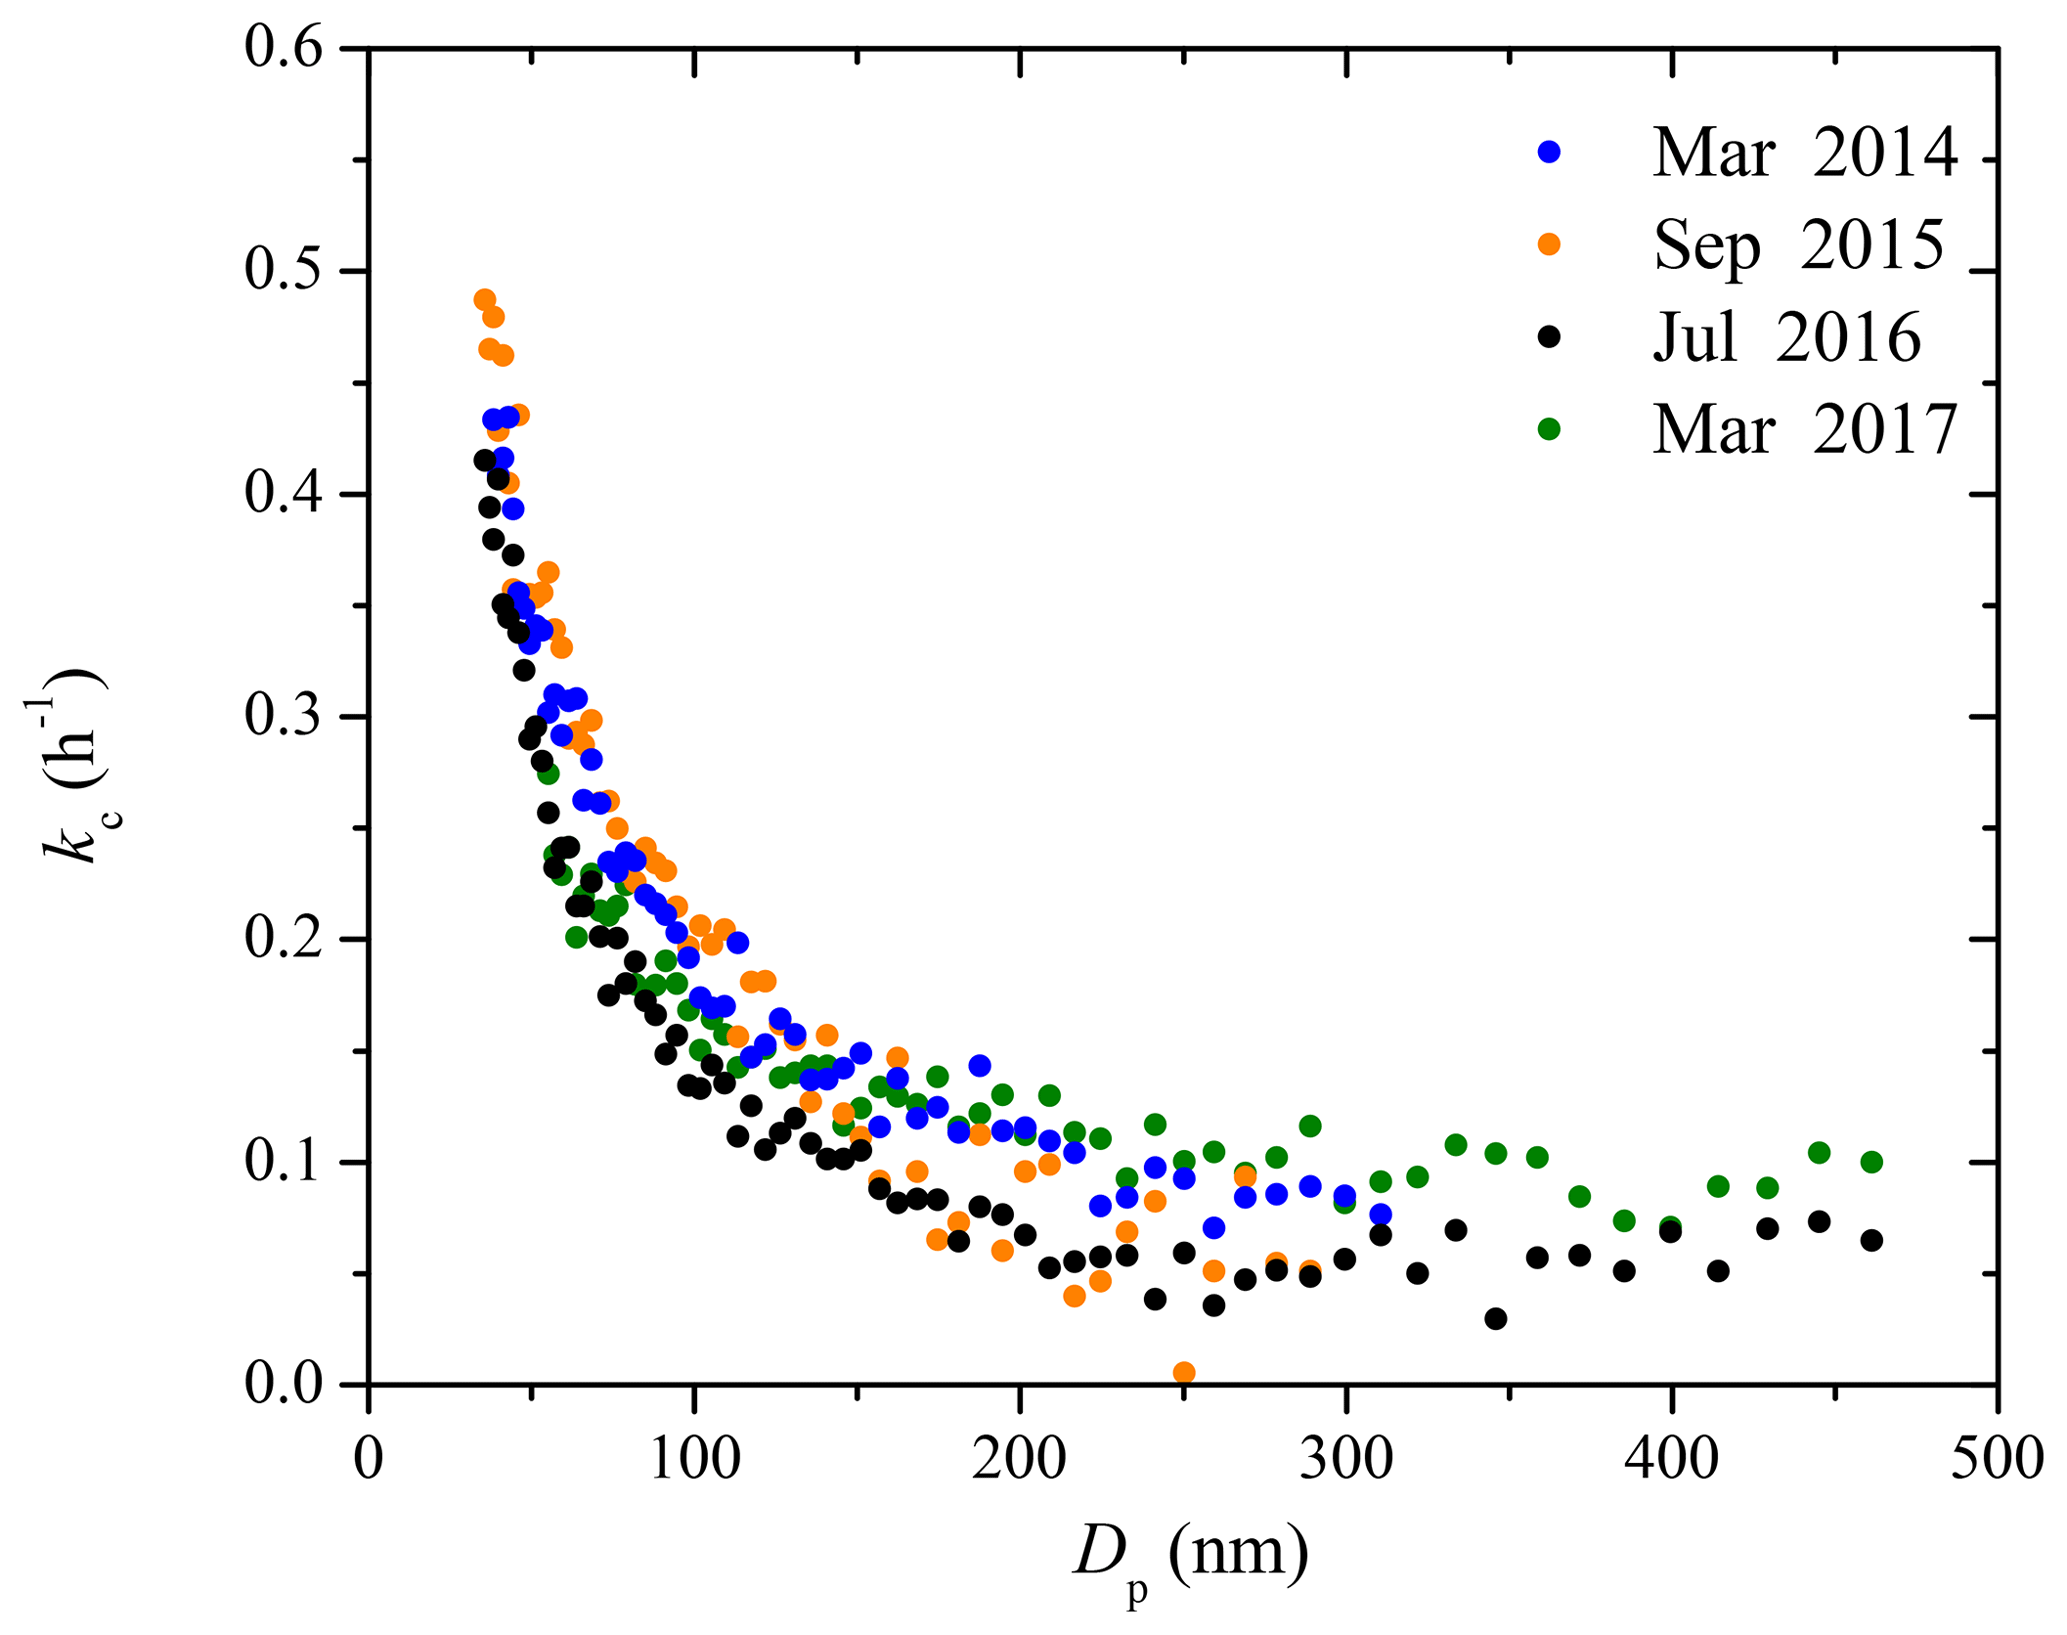
Figure 3The kc(Dp) profiles for the 12 m3 CMU Teflon chamber over a span of 3 years. The particle wall-loss rate constants were derived based on SMPS measurements from experiments with only ammonium sulfate particles.
4.2 Particle wall-loss rate constants in the CMU chamber over 3 years
Figure 3 shows the coagulation-corrected kc(Dp) profiles in the 12 m3 CMU smog chamber over a span of 3 years (Fig. S1 shows the uncertainty). All these measurements were performed during periods in which the chamber was undisturbed. These four curves are representative of the variability range of the size-dependent particle wall-loss rates in the CMU chamber under undisturbed conditions. The rate constants show a monotonic decreasing trend with sharp decrease initially until 100 nm due to diffusion dominating the wall-loss processes. Then the loss rate constants gradually decrease until 300 nm, after which they stay almost constant until the end of the measured size range. Using the kc(Dp) determined in 2017 as an example, kc decreased from 0.3 h−1 at 50 nm, to 0.14 h−1 at 100 nm, then gradually to 0.05 h−1 at 300 nm, and stayed constant until approximately 500 nm. The kc(Dp) profiles over the past 3 years stayed fairly consistent, with values equal to 0.32 ± 0.03 h−1 at 50 nm, 0.16 ± 0.03 h−1 at 100 nm, 0.10±0.02 h−1 at 200 nm, and 0.07±0.01 h−1 at 300 nm. The behavior of the chamber after disturbances (e.g., repairs, upgrades) will be discussed in a subsequent section.
4.3 Applying different particle wall-loss correction methods to SOA aging experiments
The measured particle volume concentration time series of a typical aging experiment (Exp. 3) of α-pinene ozonolysis products in the 12 m3 CMU Teflon chamber is shown in Fig. 4. In this experiment there were three separate stages. We injected ammonium sulfate seeds both at the beginning ( h) of the experiment and at t=3.5 h. At t=0, ozone was introduced into the chamber to react with α-pinene producing SOA in the dark. HONO was bubbled into the chamber twice at t=0.5 and 1.2 h to produce OH radicals under UV illumination, leading to a second round of reactions in the system. The size-dependent ka(Dp) and kc(Dp) derived from the initial 4.5 h seed loss period differed by up to 0.2 h−1 for particles smaller than 100 nm and were practically the same for particles larger than 100 nm (Fig. 4c). The size-independent loss rate constants k1–k3 were derived during the three periods when condensation and/or evaporation was minimal (based on both SMPS and AMS measurements). A value of k1=0.05 h−1 (R2=1) was derived from volume concentration measurements from to 0 h according to Eq. (2), k2=0.04 h−1 (R2=0.8) from t=2 to 3.4 h, and k3=0.03 h−1 (R2=0.9) from t=4.7 to 8.4 h. One major contributor to the difference in these three k values is the size dependence of the particle wall-loss rate constants; k2 was calculated from the period after three rounds of condensation (α-pinene ozonolysis and two doses of HONO). The particle size distribution shifted to larger sizes (Fig. 4b) and thus resulted in a smaller value compared to k1; k3 was derived from the final seed loss period when relatively large seed particles were present due to the higher concentration of the atomized ammonium sulfate solution.
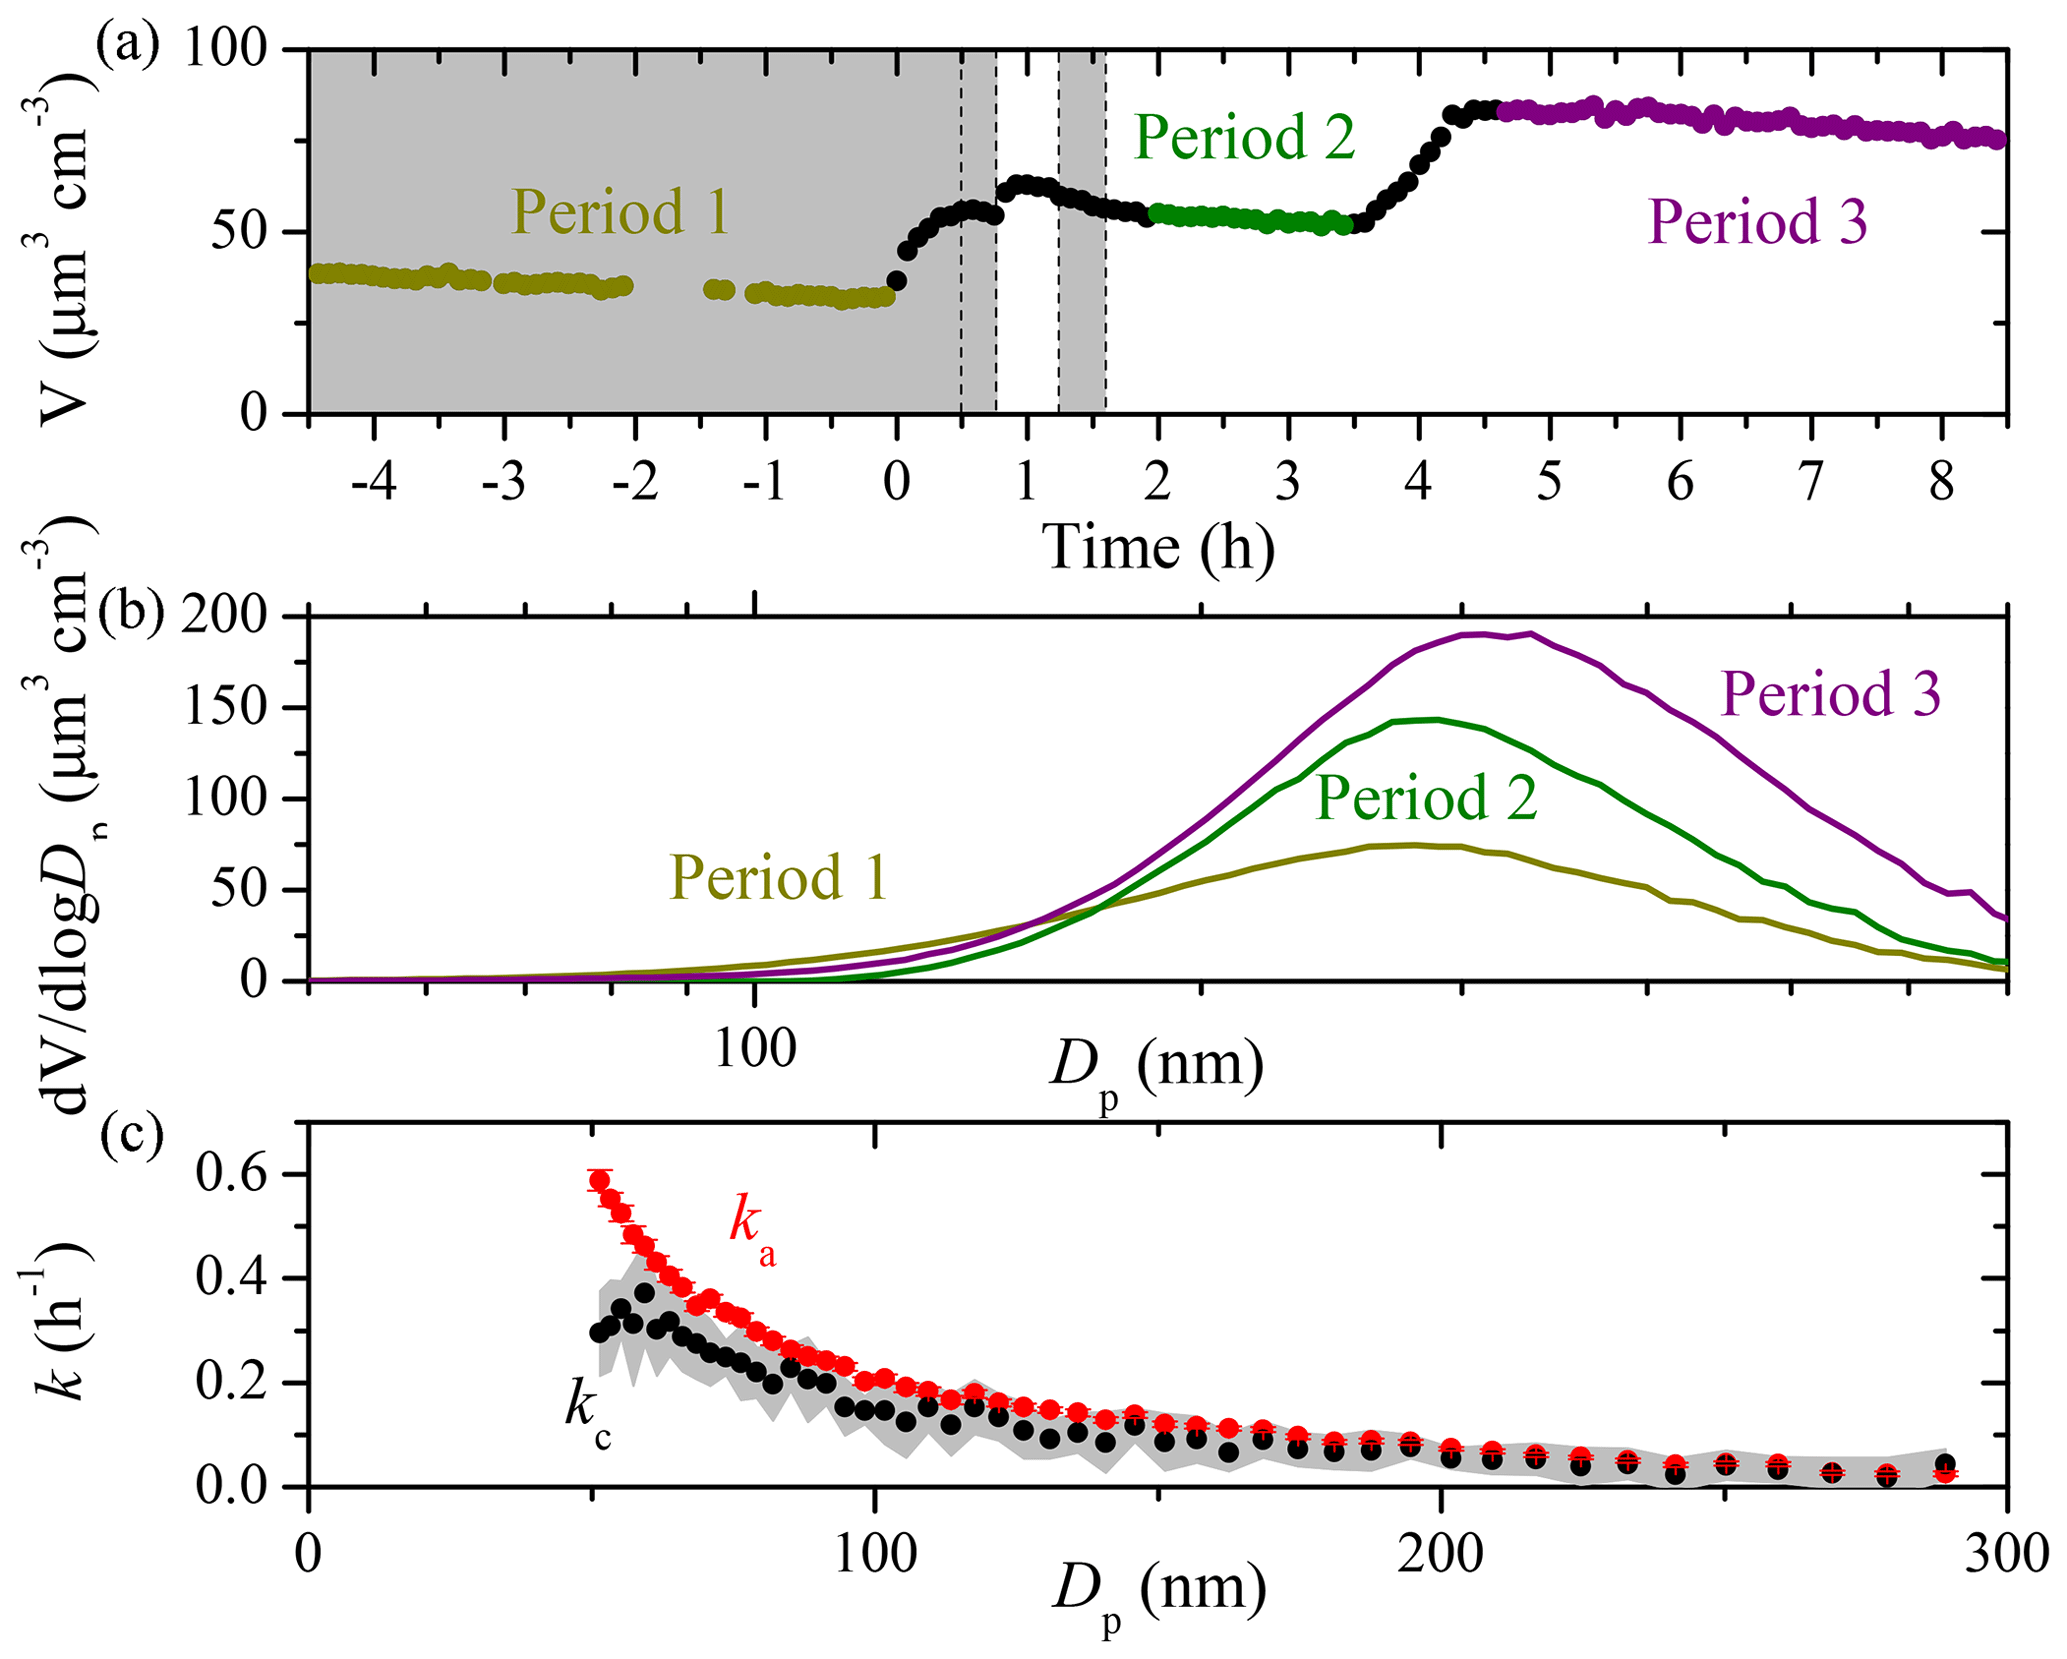
Figure 4(a) The SMPS-measured particle volume concentration time series for an aging experiment (Exp. 3) with three colored periods used to derive the corresponding size-independent particle wall-loss rate constants, k1–k3 (Eq. 2). The grey area indicates that the chamber was dark. The dashed lines mark the beginning and the end of bubbling HONO into the chamber twice; (b) the averaged particle volume size distribution over the three periods used to develop k1–k3 based on the SMPS measurement for Exp. 3; (c) the size-dependent particle wall-loss rate constants determined from SMPS-measured particle number concentration from Period 1 for Exp. 3. Only ka values (red symbols) with an R2>0.5 are shown. The error bars correspond to ± 1 standard deviation. The grey area is the uncertainty associated with kc (black symbols).
The particle-wall-loss-corrected SOA mass concentration (ρ=1.4 µg m−3) time series based on SMPS measurements using both the size-independent k1–k3 and the size-dependent ka(Dp) and kc(Dp) for Exp. 3 are shown in Fig. 5. Applying k1–k3 to Eq. (3) resulted in corrected SOA mass concentration differing up to 20 %. To estimate the k(Dp) values at Dp<50 nm and Dp>300 nm, we used a linear fit of the k(Dp) values from 50 to 70 nm to back-extrapolate the k values at smaller sizes and assumed a constant k value equal to that at 300 nm for particles larger than 300 nm (Fig. S2). This assumption is justified because kc remains relatively constant throughout the 300–500 nm range based on our measurements (Fig. 3) when the chamber is undisturbed and most of the SOA mass in this experiment was distributed in particles smaller than 300 nm (Fig. 4b). We corrected for total particle number concentration, applying the size-dependent loss rates to Eq. (6), and then calculated the corrected SOA mass concentration using Eq. (7). Note that the ka(Dp)- and the kc(Dp)-corrected SOA mass concentration time series were practically the same for this experiment because the majority of the formed SOA mass condensed on particles with diameters exceeding 100 nm. If one is interested in the total produced SOA after 3.5 h, the differences among the results of the different corrections are 20 % or less. If one is interested in the SOA produced during the aging phases the estimates vary by 25 %–30 %.
Depending on which wall-loss rate constants are used, the corrected SOA mass concentration can vary by 20 %–30%. We recommend using the size-dependent wall-loss rate constants for the correction. However, when the chamber is undisturbed and the experiment only lasts a couple of hours, using the size-independent wall-loss rate constant derived from the initial 4 h seed wall-loss period can give relatively accurate results (errors of 5 % or less).
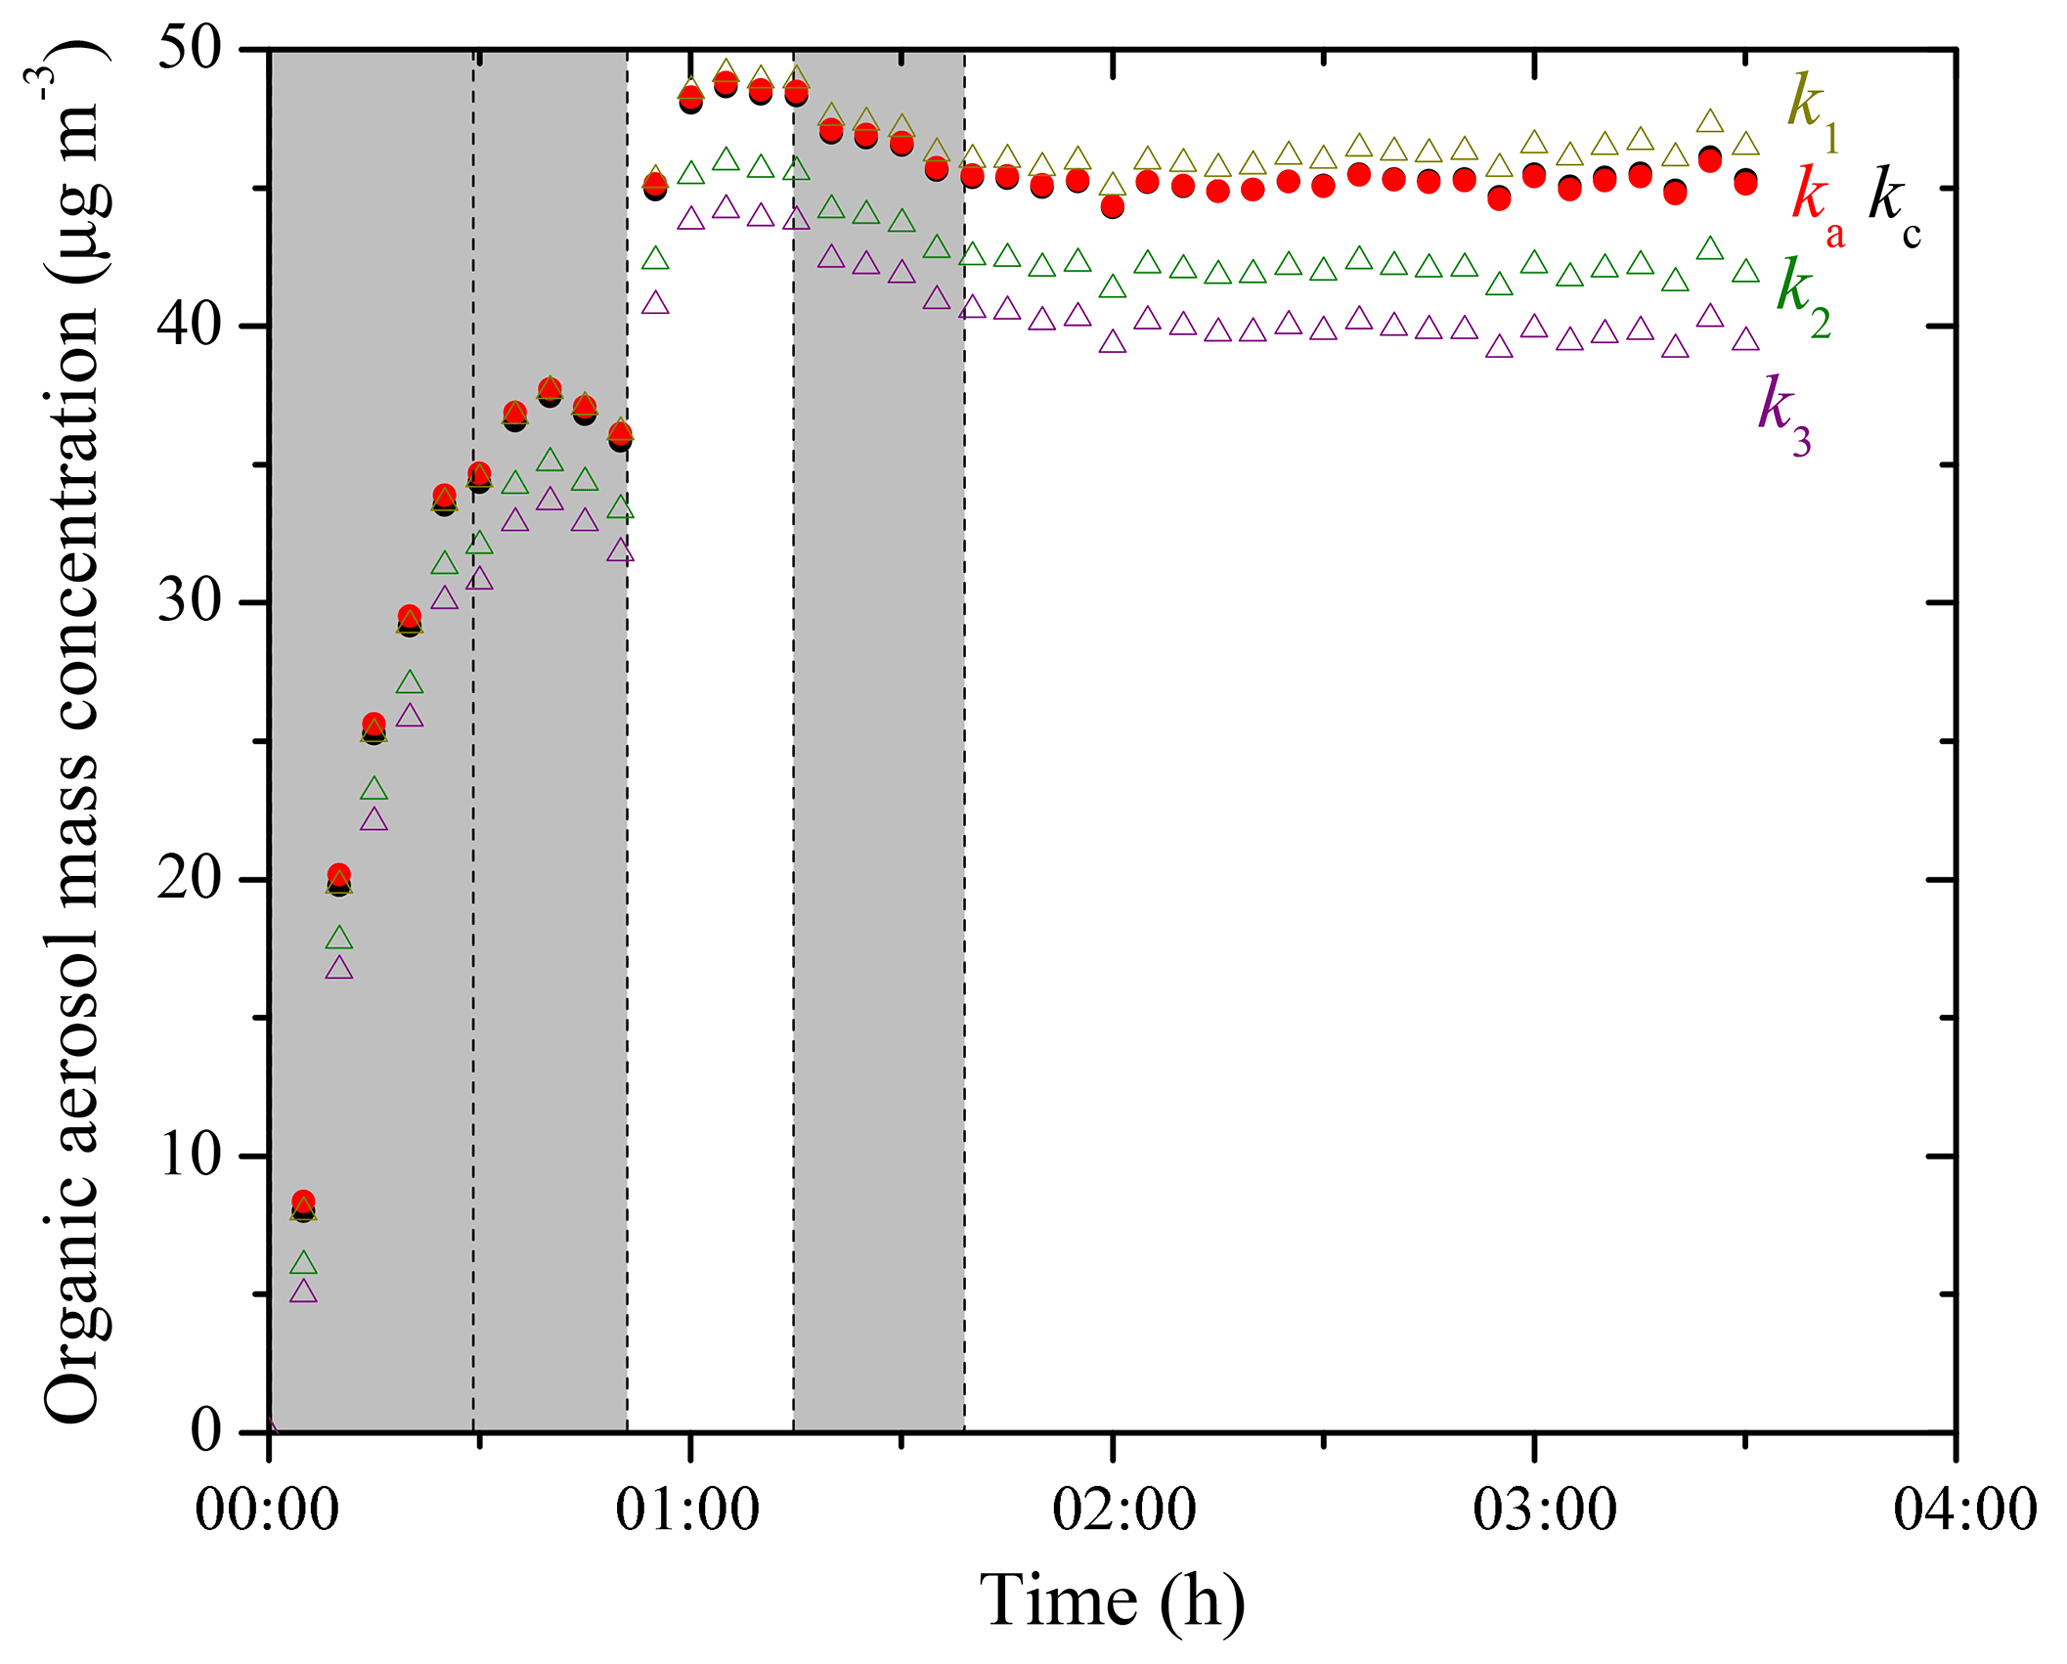
Figure 5Particle-loss-corrected SOA mass concentration (ρSOA=1.4 µg m−3) time series based on SMPS measurements using the size-independent k values (open symbols) and the size-dependent k(Dp) values (solid symbols) for Exp. 3; k1–k3 were derived from the total mass concentration-based method (Eq. 2) when wall loss was the only process (–0 h; t2=2–3.4 h; t3=4.7–8.4 h). The ka(Dp) and the kc(Dp) profiles were derived from the two models based on the SMPS-measured number concentration of the seed wall-loss periods. The shaded area indicates that the chamber was dark. The dashed lines mark the beginning and the end of bubbling HONO into the chamber.
4.4 Effect of size-dependent wall loss on organic to sulfate ratio
Figure 6 shows the AMS-measured organic to sulfate ratio (OA ∕ sulfate) for Exp. 4. In the beginning, the ratio increased to 0.8 at t=0.6 h due to the first generation of SOA formation. It then stayed practically constant until OH was introduced into the chamber at t=1.7 h. The second generation of SOA formation led to an increase of the ratio to 1.0 at t=2.0 h. The ratio decreased gradually to 0.9 at t=3.5 h. This decrease could be explained as a loss of SOA due to photodegradation or other chemical processes such as SOA evaporation driven by organic-vapor uptake by the walls (Bian et al., 2015). Another explanation for the decreasing trend of OA ∕ sulfate during this period is the size dependence of the particle wall-loss rates (Loza et al., 2012). Particles of smaller sizes with higher organic to sulfate ratios can be lost to the walls at a faster rate, thus causing the OA ∕ sulfate to decrease during periods when wall loss is the dominant process in the chamber. The strong size dependence of the OA ∕ sulfate ratio in this experiment is indicated in Fig. 7. The organic mass distribution peaked at an aerodynamic vacuum diameter equal to around 150 nm, while that of sulfate peaked at 210 nm. This indicates that the majority of the organic vapors condensed onto smaller particles with a higher surface to volume ratio. Figure 7b shows the OA ∕ sulfate derived from the AMS-measured mass distribution (averaged from t=2.1 to 3.5 h) as a function of the particle vacuum aerodynamic diameter. For particles with Dva from 75 to 150 nm, the ratio dropped dramatically from 7 to 1. It then decreased gradually and stabilized at 0.4 from Dva=150 to 600 nm.
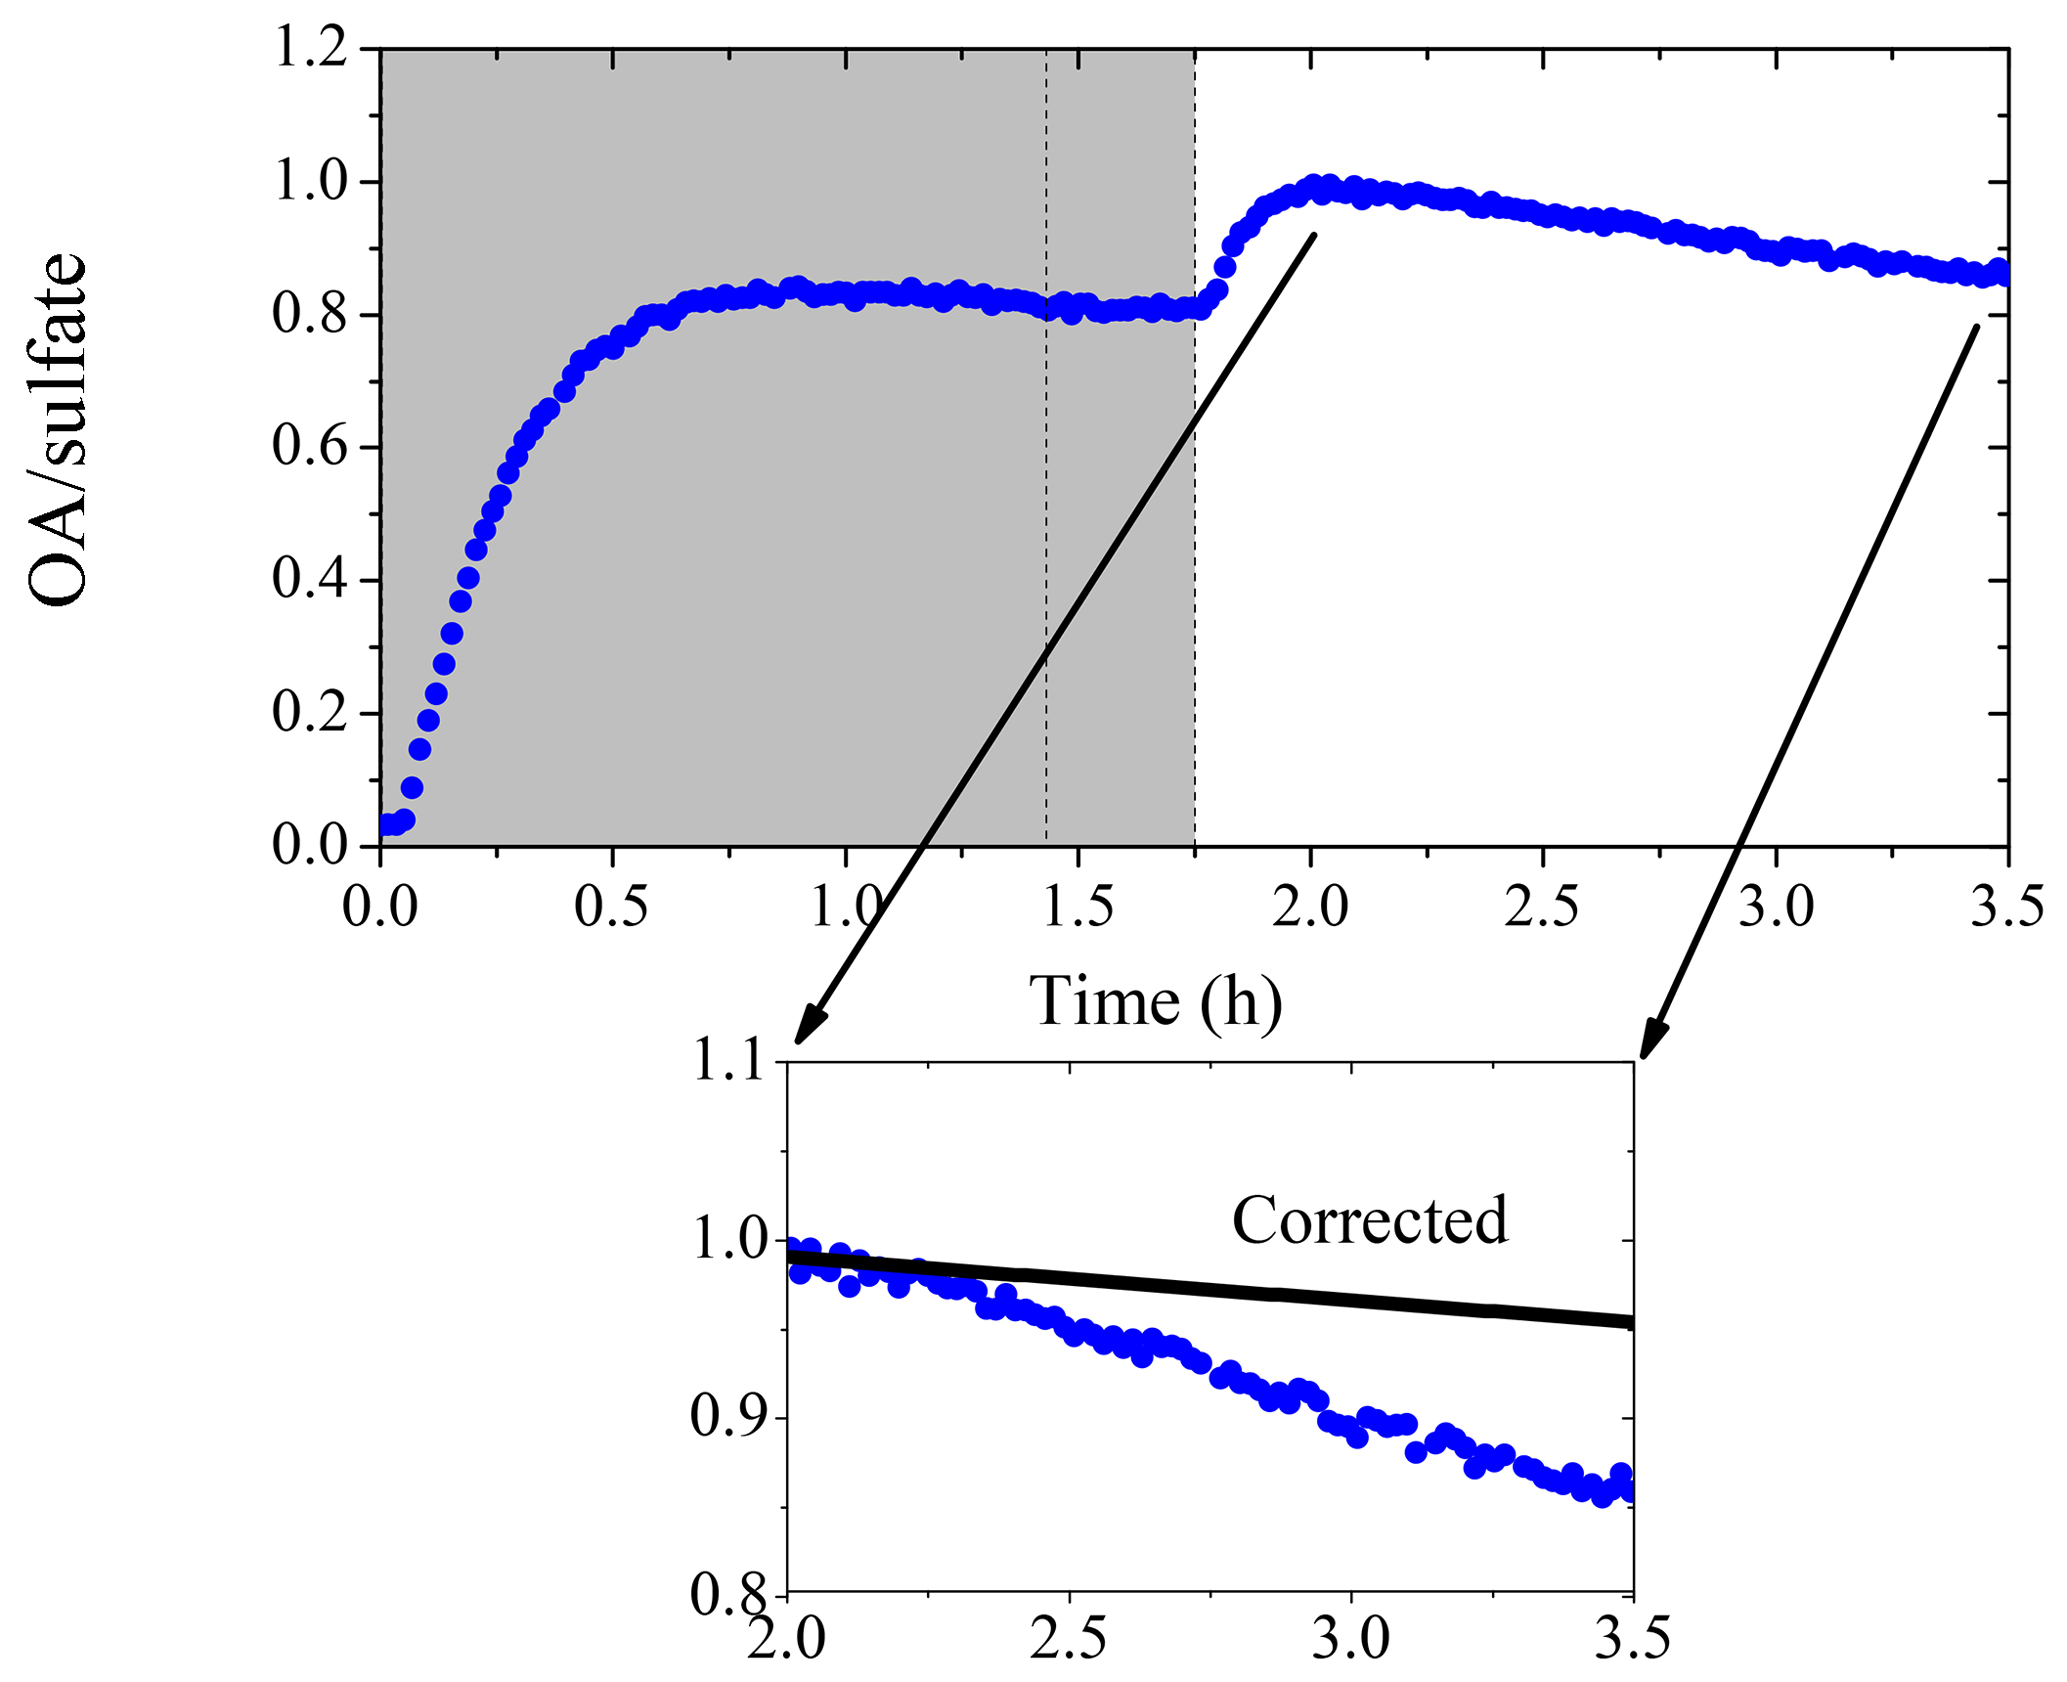
Figure 6The organic to sulfate ratio time series derived from AMS measurements for Exp. 4 (data after the second HONO introduction are not shown). The inset is a blow-up of the OA ∕ sulfate ratio from its maximum until the second HONO introduction. The black symbols are the size-dependence-corrected OA ∕ sulfate during that 1.5 h. The shaded area indicates that the chamber was dark. The dashed lines mark the beginning and the end of the first HONO injection into the chamber.
To further analyze the effect of size-dependent wall loss on OA ∕ sulfate, we adopted the method suggested in Wang et al. (2018). This approach allows the estimation of mass-weighted wall-loss rate constants for both species, and , by discretizing the AMS-measured mass distribution in the diameter space and assigning the corresponding kc(Dp). (An SOA density of 1.4 g cm−3 was used to convert the AMS-measured Dva to Dp.) For periods during the experiment when particle wall loss is the only process, the loss-corrected OA ∕ sulfate can be estimated as , where (OA ∕ sulfate)m(t) is the measured OA ∕ sulfate ratio. For Exp. 4 in this work, we discretized the AMS-measured mass distribution (averaged from t=2.1 to 3.5 h) into 10 diameter bins and found h−1 and h−1. The particle-wall-loss-corrected OA ∕ sulfate for the chosen time period is shown in the inset of Fig. 6. The correction explains more than 70 % of the decrease in the OA ∕ sulfate (over 1.4 h) in this experiment, indicating that the size-dependent particle wall-loss process coupled with the different size distributions of the organics and sulfate played a major role in the observed decrease in OA ∕ sulfate.
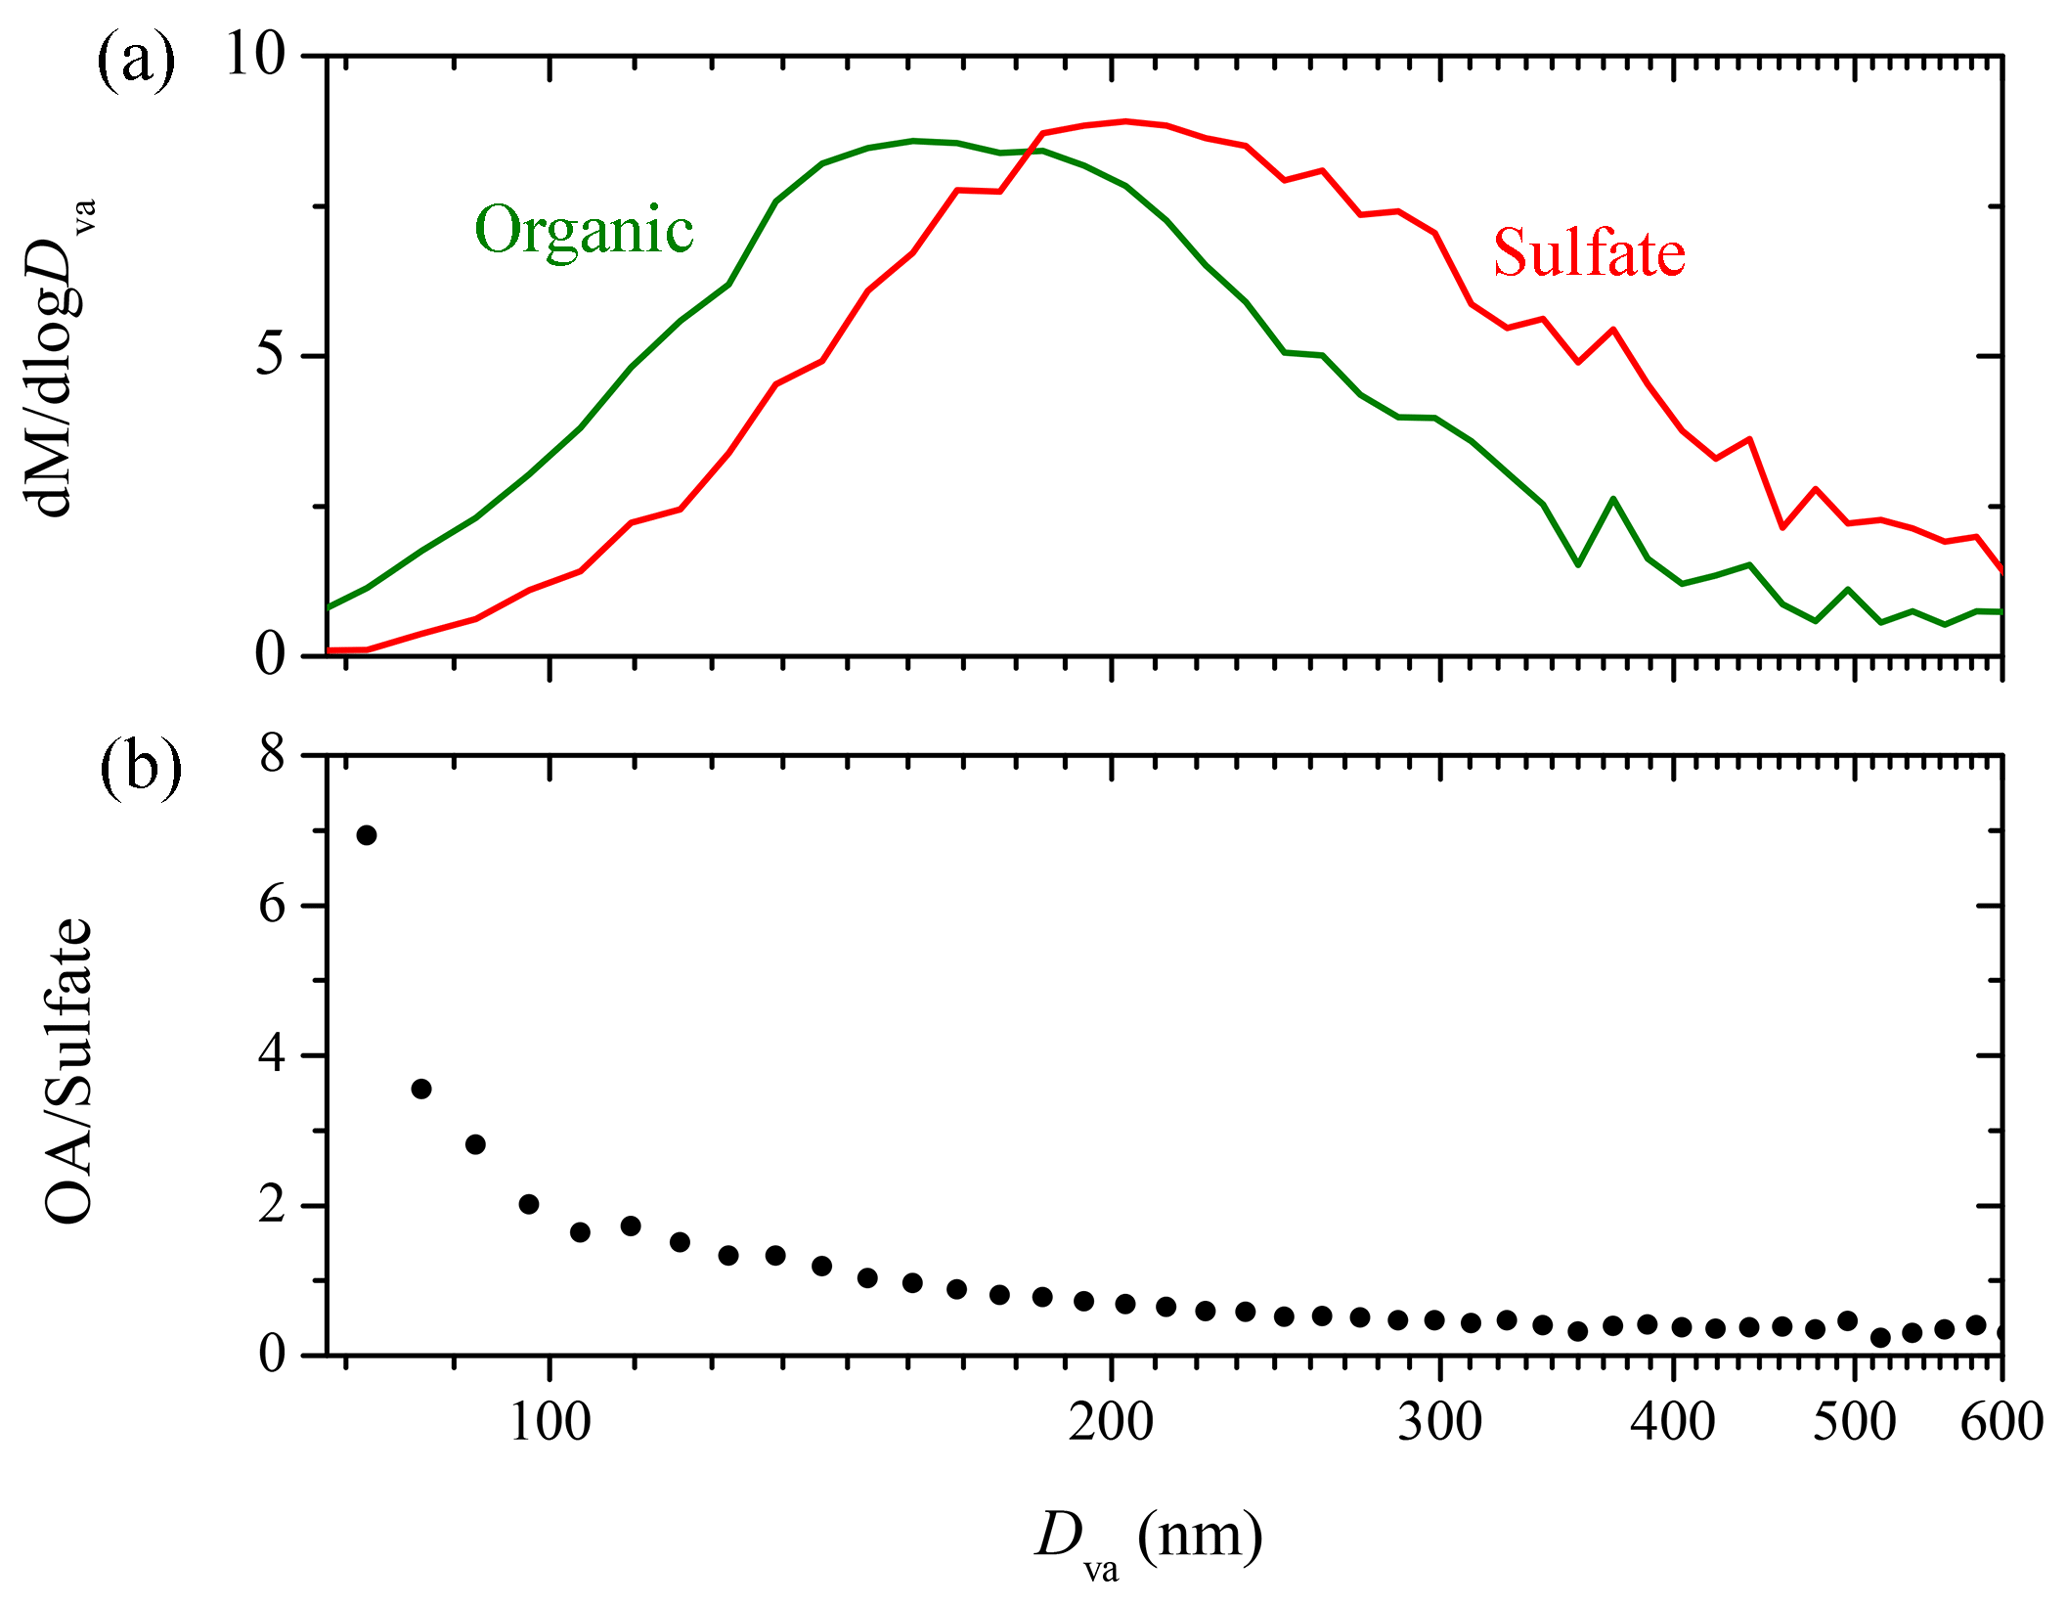
Figure 7(a) The AMS-measured organic (green) and sulfate (red) mass distribution (Dva from 75 to 600 nm) for Exp. 4; (b) the dependence of the AMS-derived organic to sulfate ratio on particle vacuum aerodynamic diameter (75–600 nm). The results are based on particle time-of-flight data averaged over ∼1.4 h (t=2.1–3.5 h).
4.5 Time dependence of particle wall-loss rates during an experiment
When the CMU chamber is undisturbed, the wall-loss rate constant is around 0.1 h−1 for particles larger than 100 nm. However, friction with the Teflon walls induced by small repairs (addition of a sampling line, replacement of lights, etc.) around the chamber can increase the loss rates dramatically and the effects can last for weeks. During these periods, the size-dependent coagulation-corrected particle wall-loss rate constants, kc(Dp), can change significantly during the course of an experiment. The results of such an experiment in a “disturbed” smog chamber are described below.
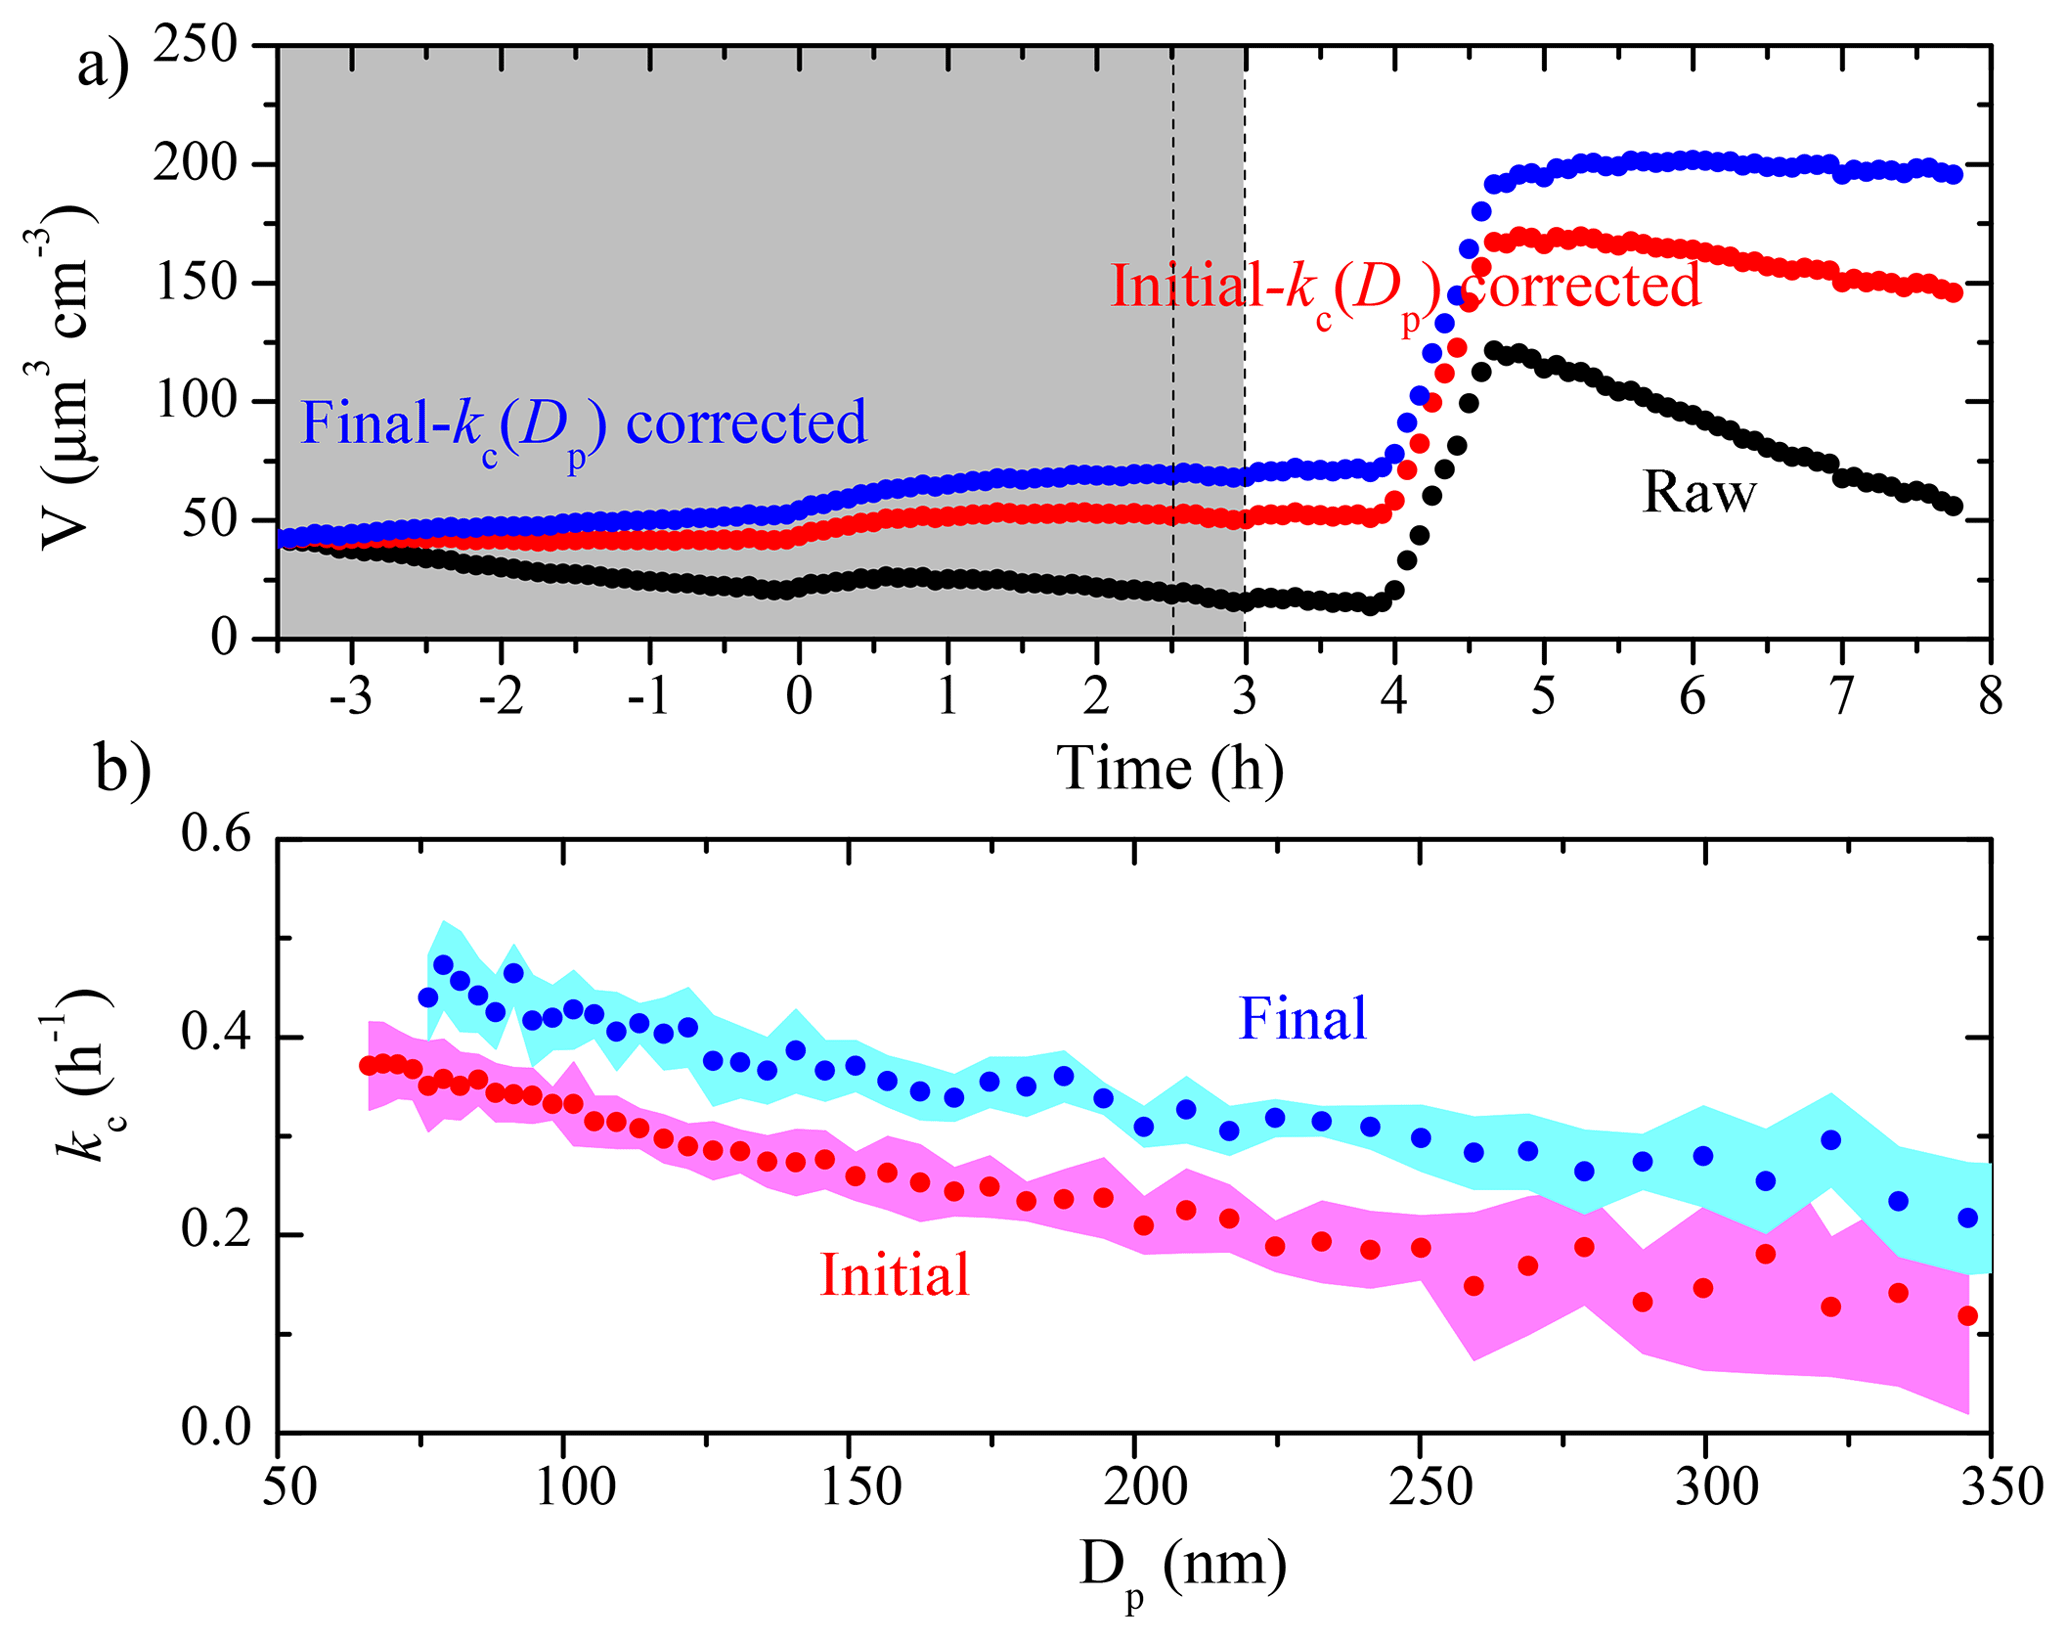
Figure 8(a) The SMPS-measured (black symbols), the initial kc(Dp)-corrected (red symbols), and the final kc(Dp)-corrected (blue symbols) particle volume concentration time series for an aging experiment (Exp. 5), together with (b) the initial (red symbols) and the final (blue symbols) kc(Dp) profiles. The colored areas are the uncertainties associated with the corresponding kc(Dp). The grey area indicates that the chamber was dark. The two dashed lines mark the beginning and the end of HONO addition into the chamber. Ammonium sulfate seed particles were injected into the chamber at t=4 h.
The comparison of the two kc(Dp) profiles derived from the initial and the final seed periods for Exp. 5 is shown in Fig. 8, together with the raw and the corrected aerosol volume concentration time series. This is a similar aging experiment of α-pinene ozonolysis products to Exp. 3, but with only one HONO injection. Before t=0, ammonium sulfate seed particles were lost to the chamber walls. At t=0, ozone was added into the chamber to react with α-pinene. The aerosol volume increased due to condensation of the first-generation products. At t=2.5 h, HONO was introduced into the chamber and OH radicals were produced at t=3 h under UV illumination. The aerosol volume increased again due to additional SOA formation from the second-generation oxidation. At t=4 h, we injected ammonium sulfate particles into the chamber to characterize the particle wall-loss rates for a second time. The final kc values were statistically higher than their initial counterparts at every size, and both sets of kc values were higher than their usual values in the chamber (Fig. 3). Comparing the initial kc values with the averaged usual values under undisturbed chamber conditions, the initial kc was 0.33 h−1 as compared to the usual 0.16 h−1 at 100 nm, 0.21 h−1 compared to 0.10 h−1 at 200 nm, and 0.15 h−1 compared to 0.07 h−1 at 300 nm. The particle wall-loss correction was applied when the ammonium sulfate seed was first injected into the chamber (as depicted in Fig. 8a). The final kc(Dp)-corrected volume concentration was higher than the one corrected using the initial kc(Dp) by 37 % at t=4 h. In this case, both kc profiles were representative of the chamber condition, but during the corresponding time periods. The time dependence of kc(Dp) during the course of this experiment introduced an uncertainty of 40 % or so in the corrected aerosol mass or volume concentration. The change in the loss rates suggests a change in the electric field in the chamber during this experiment. This could be due to additional charge buildup or redistribution of the charges as the experiment progresses (lights are turned on and off, the chamber walls move due to the air motion from the temperature control system, etc.).
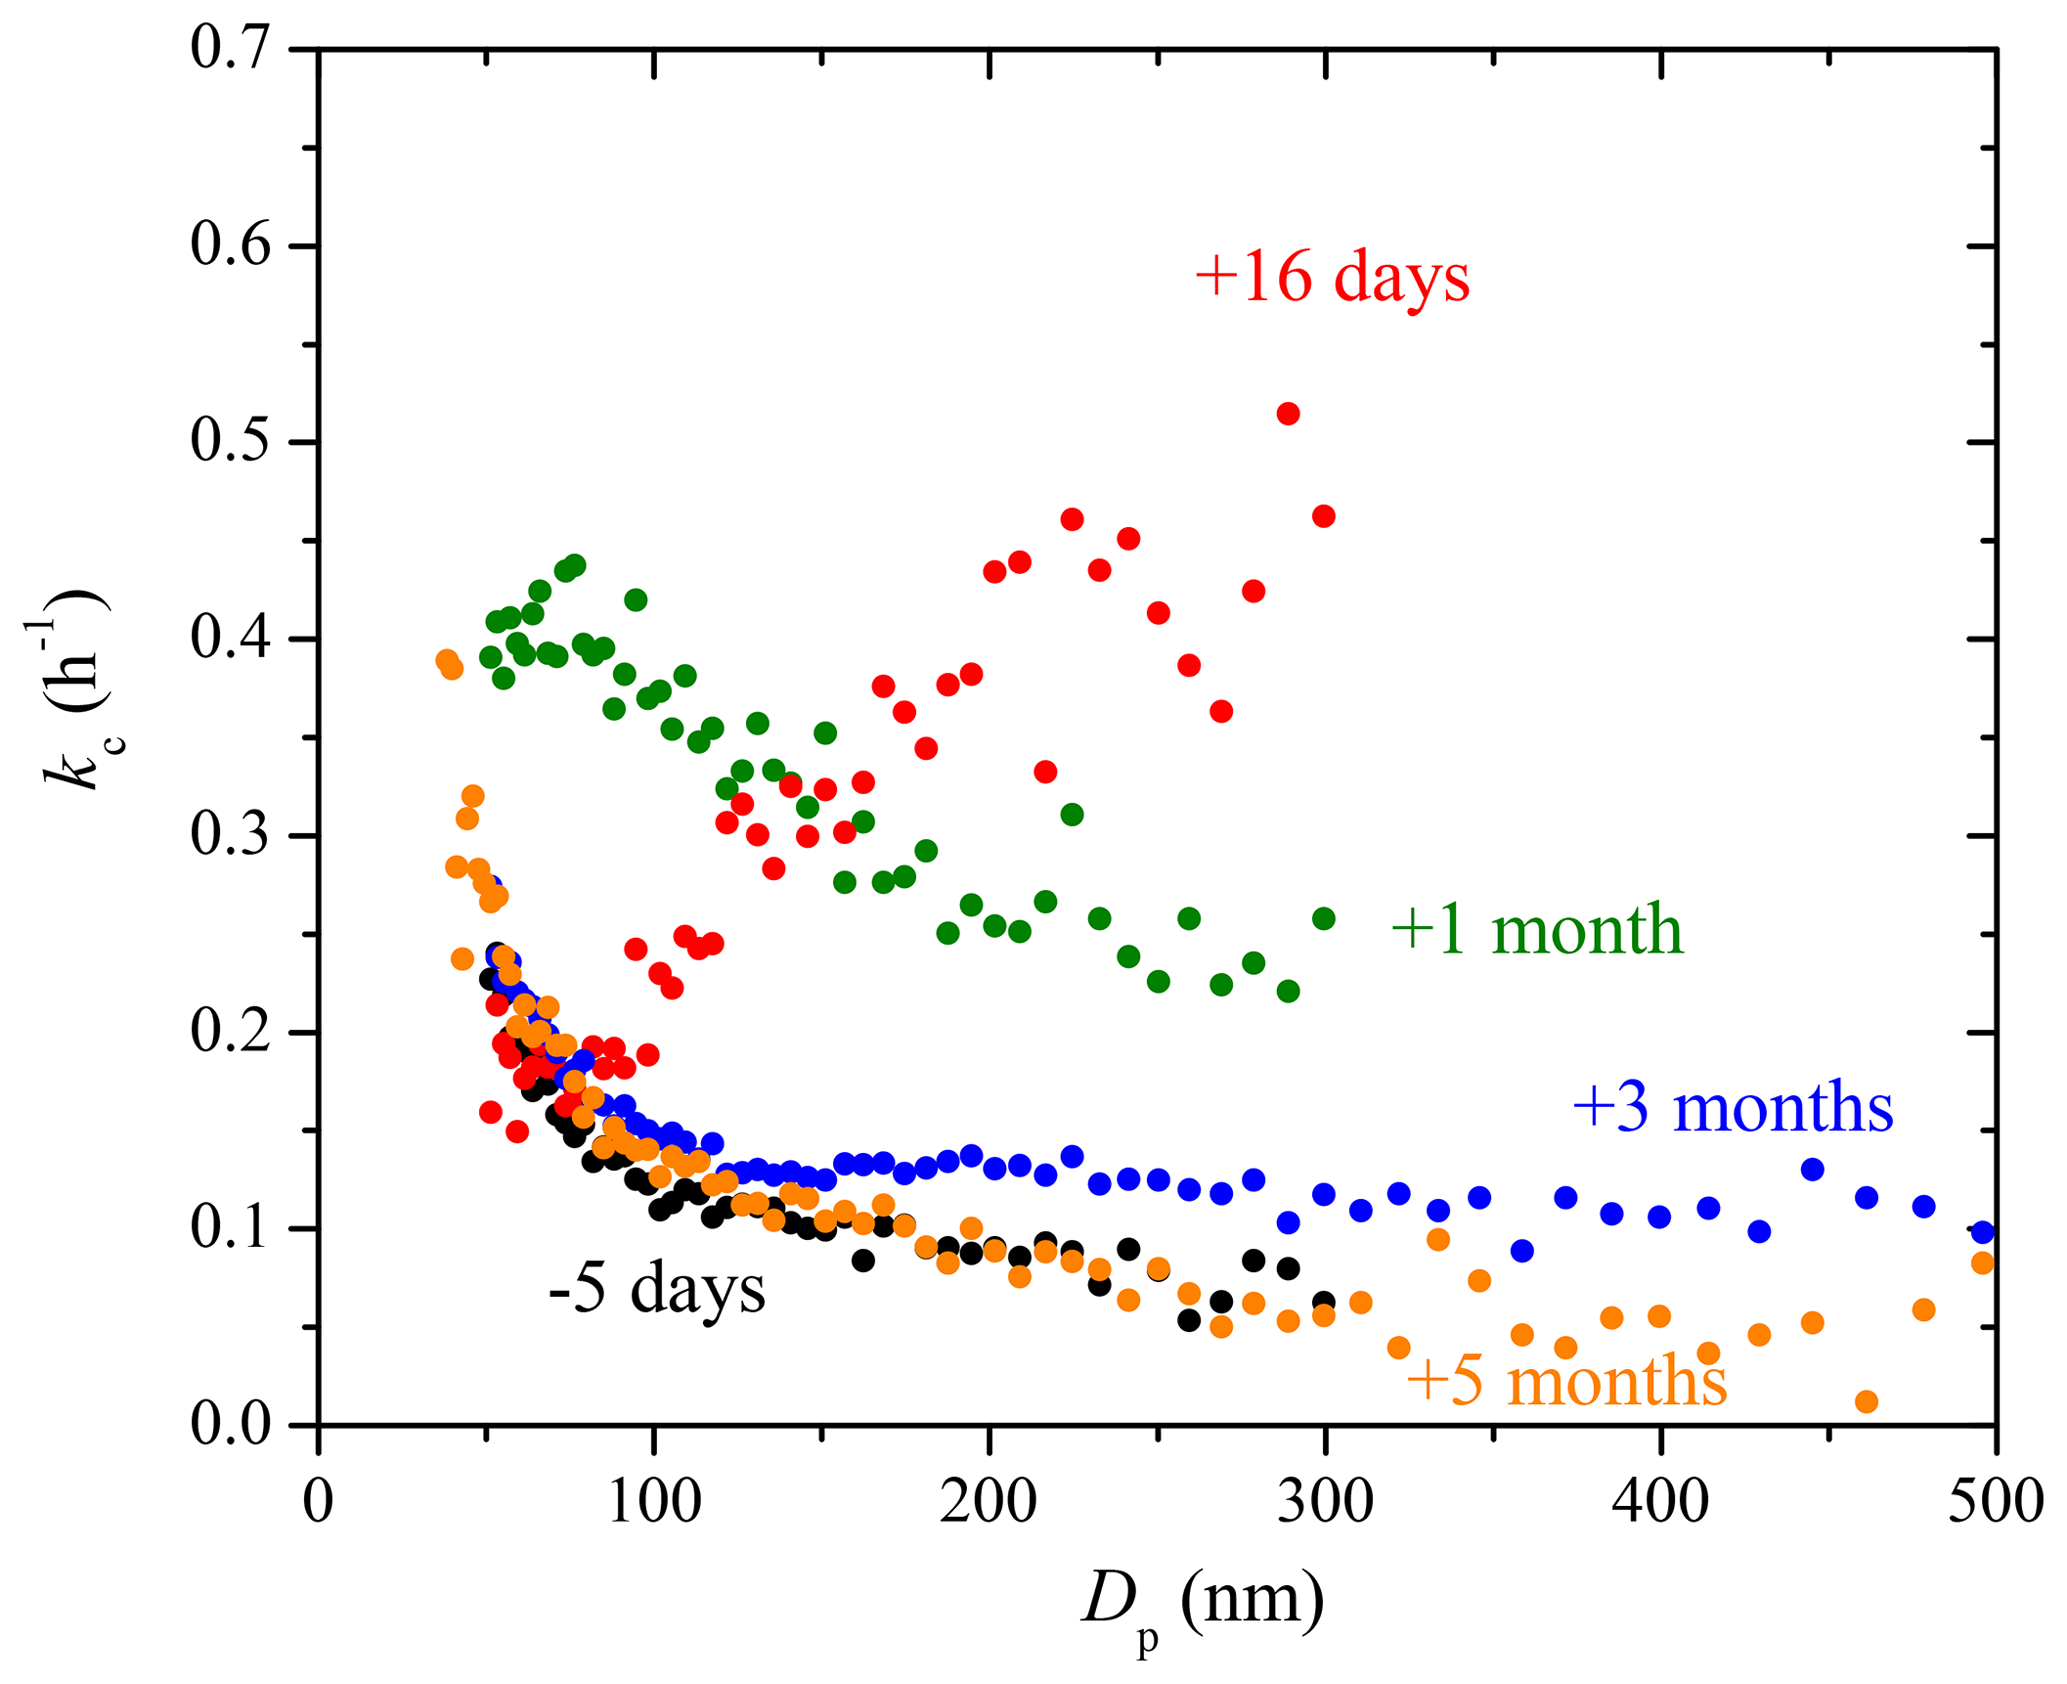
Figure 9The coagulation-corrected particle wall-loss rate constant, kc, at each diameter derived from experiments with only ammonium sulfate particles in the 12 m3 CMU Teflon chamber before and after some major maintenance in the room where the chamber is suspended. The chamber was partially deflated and its walls subjected to friction repeatedly during the maintenance.
We define the chamber conditions under which these abnormally high loss rates and exacerbated time dependence of kc(Dp) were observed as disturbed. The kc(Dp) profiles shown in Fig. 3 were under undisturbed chamber conditions. Since electrostatic forces start to dominate the wall-loss process when particles are usually larger than 100 nm (McMurry and Rader, 1985), we postulate that excess electrostatic forces within the chamber are most likely the cause of the disturbed conditions. Friction created with the Teflon walls was found to be a major contributor to the exacerbated electrostatic forces and the disturbed chamber conditions.
Figure 9 shows the kc(Dp) profiles measured over a span of 5 months after some major maintenance work (January 2016) in the room where the chamber is suspended (Fig. S3 shows the uncertainty). During the 1-week maintenance, friction with Teflon walls was created by partially deflating the chamber, moving, and touching it repeatedly. The measured kc(Dp) profile changed drastically in shape for days after. The 16-day post-maintenance kc(Dp) profile presented an increasing trend from 75 to 300 nm, with particles bigger than 200 nm getting lost at a rate 3–4 times faster than before. Once we noticed the abnormally high particle loss rates in the chamber, we refrained from being in any form of contact with the chamber walls. The chamber was left suspended and full during those 5 months. Records of experiments performed in the chamber during that time support the previous statements. About a month later, the kc values recovered to the decreasing trend, but were in general high as compared to their pre-maintenance counterparts with values >0.2 h−1 at 300 nm. A period of 3 months after the maintenance, particles smaller than 100 nm recovered to their pre-maintenance values, while particles bigger than 150 nm still had loss rate constants up to 0.1 h−1 higher than before. A period of 5 months after, the kc(Dp) values made a full recovery, with values decreased further to 0.13 h−1 at 100 nm, 0.09 h−1 at 200 nm, and 0.06 h−1 at 300 nm. During the 5 months, the chamber was left fully inflated, stationary, and suspended in the room. Only steps necessary for an experiment (overnight flushing, injection flow etc.) were taken. Experiment 5 was performed a month after the major maintenance when kc(Dp) was still in recovery, and thus the exacerbated electrostatic forces within the chamber likely played a major role in the extra time sensitivity of the kc(Dp) values in Exp. 5.
To test whether certain steps during an experiment cause changes in the particle loss rates, we explored potential impact on kc(Dp) of turning on the UV lights, injecting HONO, and overnight flushing individually in separate seed experiments. Experiments 5–8 were designed to test each of these factors individually. These experiments were performed about 3 months after the maintenance when particle wall-loss rates had almost recovered to their pre-maintenance values, indicating the chamber had mostly recovered to undisturbed conditions. Turning on the UV lights inside the room where the chamber is suspended can cause changes in the air circulation around the chamber walls, thus affecting the turbulence. Carrying HONO into the chamber with a clean air flow at a rate of ∼5 L min−1 for 20 min may potentially impact the turbulence within the chamber. Though cleaning the chamber with overnight flushing may not have a direct impact on kc during the day of an experiment, flow rates higher than 100 L min−1 into the chamber may well have an effect. The results of Exp. 5–8 are shown in Fig. 10 and none of the aforementioned processes had an evident impact on kc(Dp). The t test results indicated that the kc(Dp) profiles derived before and after each factor were statistically the same. We thus conclude that the usual steps taken during a typical SOA aging experiment do not have a significant impact on kc if the chamber is in its undisturbed state. However, when the chamber has been disturbed and the losses are already high, they also become sensitive to routine changes in the experimental conditions.
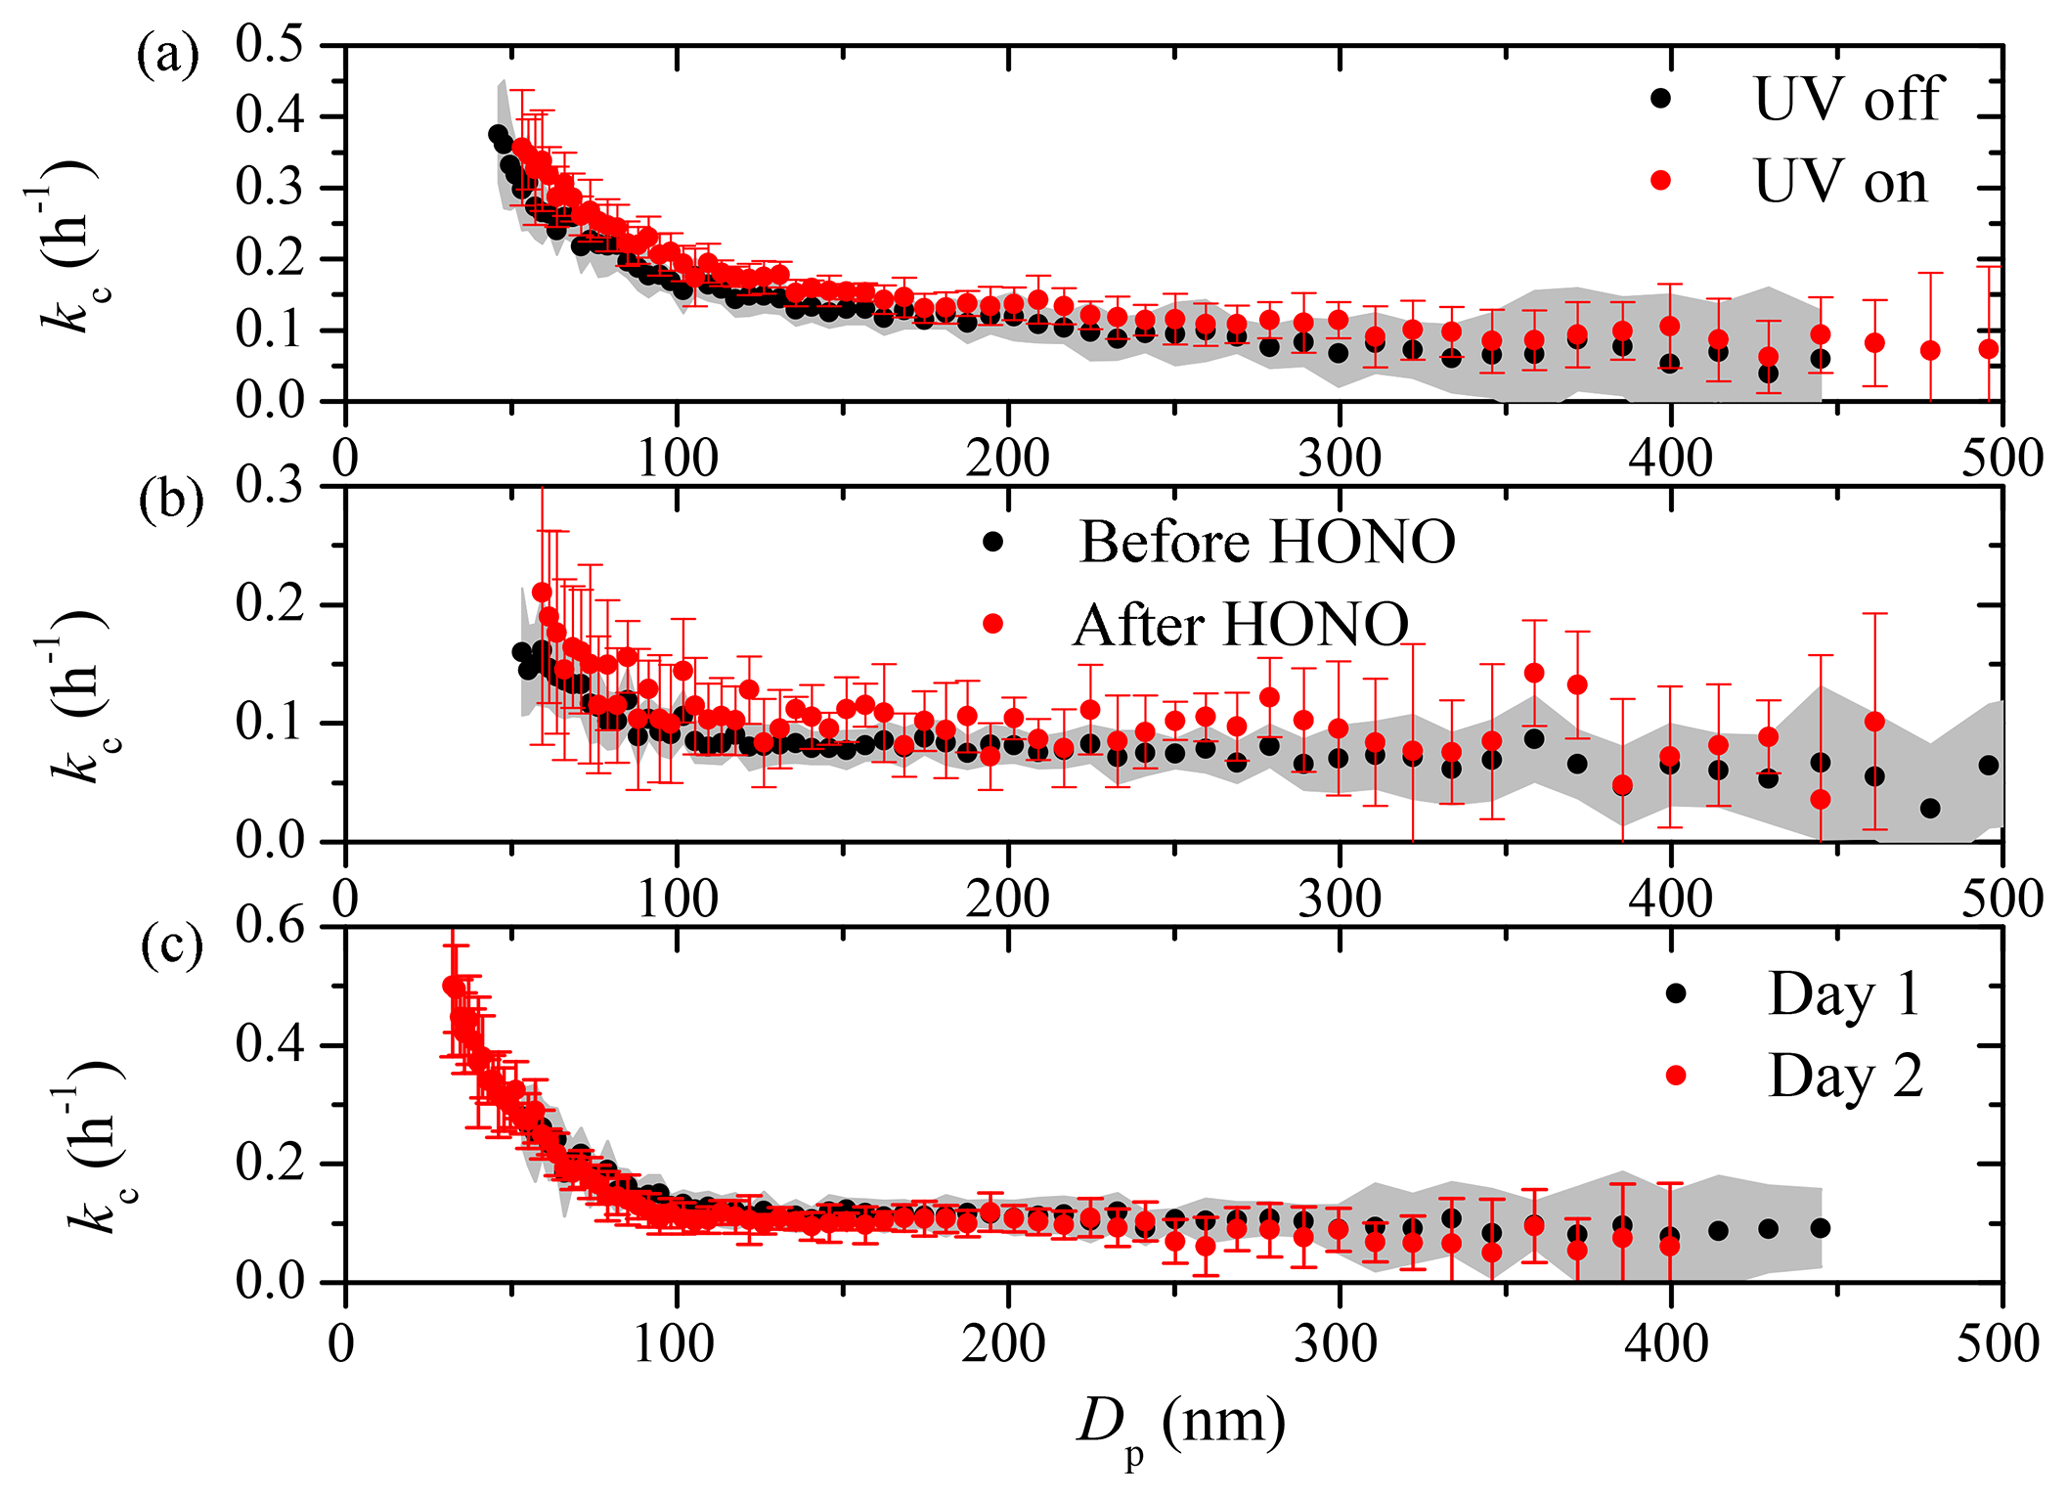
Figure 10The coagulation-corrected particle wall-loss rate constant, kc, at each diameter for (a) Exp. 6, (b) Exp. 7, and (c) Exp. 8 and 9. The uncertainties associated with the corresponding kc(Dp) values are either expressed as the grey area or the red error bars.
4.6 Teflon chamber maintenance and operating procedure of chamber experiments
Routine seed experiments appear to be necessary for the quantification of the particle loss rates in Teflon chambers. Any deviation in the particle wall-loss rate constants from the usual values can be a sign of disturbed chamber conditions, which may result in higher particle loss rates and time sensitivity of kc(Dp) during an experiment. As discussed above, friction with the chamber walls can introduce excess electrostatic forces within the chamber and thus introduce significant uncertainty in the particle loss rates. In order to maintain minimum particle loss in Teflon chambers, one should refrain from creating any type of friction with the chamber walls such as touching the walls or having the walls rubbing against each other. When transporting the chambers such as the dual-chamber system, it is ideal to leave them full or at least half-filled with air and fixed onto a rigid structure that can be packed during the transportation. This can minimize potential friction and shorten the recovery time for the particle loss rates. Other practices like using metal gloves when it is absolutely necessary to touch the chamber can help reduce the buildup of static electricity on the chamber walls.
When the chamber is in a disturbed state, the kc(Dp) values can vary with time during the course of an experiment. It is thus vital in these cases to include two seed loss periods, one at the beginning and the other at the end, for each SOA experiment to characterize the kc(Dp), especially if the chambers have recently been subjected to friction. When performing SOA experiments in a Teflon chamber, we recommend the following operating procedure:
-
Inject seeds and initially characterize kc(Dp) for 3–4 h.
-
Perform necessary steps for the SOA experiment and wait until the mass loadings in the chamber become low.
-
If the losses in step 1 are high, a second injection and another 3–4 h of measurements for final kc(Dp) characterization are necessary.
Particle number losses in chamber experiments due to coagulation can be significant for small particles (<150 nm under conditions in this work). It is thus important to correct for this coagulation effect when calculating the particle wall-loss rate constants, especially for experiments in which the behavior of the nanoparticles is important (e.g., when they carry a significant fraction of the total particle mass).
The Teflon chamber used in this study appeared to operate in two different states: an undisturbed and a disturbed one. The chamber entered the second state after either major repairs or even after smaller changes (e.g., addition of a sampling line or replacement of a few lights), probably because it was touched by the researchers or because friction was created during the repairs, causing charge buildup. The disturbed state could last for several weeks or even months. In this state the particle loss rates increased by more than a factor of 3–4 and their size dependence became more pronounced. There was significant variation of the losses from experiment to experiment and even within the same experiment. In the undisturbed state, the loss rate constant was less than 0.1 h−1 for particles larger than approximately 200 nm and was constant from experiment to experiment. Under these conditions the cleaning of the chamber, turning on the chamber lights, and injection of reactants, etc., did not have a statistically significant impact on the loss rate constants.
The accuracy of the use of size-independent loss rate constants for the correction of the experimental results depends on the state of the chamber and the size distribution of the aerosol during the experiment. If the aerosol volume is dominated by particles larger than 200 nm and the chamber is undisturbed, the corresponding results can be quite accurate under conditions in this work. However, if the chamber has been disturbed or if the size distribution during some phase of the experiment includes a lot of ultrafine particles, significant errors can be introduced.
The correction based on the OA ∕ sulfate ratio can also introduce uncertainties under at least some conditions. The SOA mass distribution is usually shifted towards the smaller particles compared to that of the sulfate seeds. As a result, the losses of sulfate can be different than those of the organics. The sign and the magnitude of the error depend on both the differences between the two size distributions and also the size dependence of the losses in this specific experiment. A method to correct the OA ∕ sulfate ratio for these effects has been developed. In one of the experiments, this explains most of the apparent decreases of the ratio. The errors appear to be of the order of 20 % or less, but may lead to problematic conclusions about potential processes taking place at longer timescales (e.g., photolysis and loss of SOA). Corrections similar to the one used in this work (taking into account the size-dependent losses and the size distributions of OA and sulfate) should be performed in the case of a disturbed chamber as a safeguard against higher errors.
Due to the above complexities, seed experiments for testing the particle loss rates in Teflon chambers should be performed regularly, probably before each experiment. If the rates are high, a second measurement of the losses should be performed after the end of the experiment to constrain any potential changes. The use of size-dependent corrections accounting for coagulation effects is the preferred approach, even if in a number of experiments when the chamber is undisturbed the errors introduced by neglecting the size dependence or the role of coagulation could be small. However, this depends a lot on the evolution of the aerosol volume distribution during the experiment and especially on the importance of the particles smaller than 200 nm or so for the objectives of the experiment.
The data in the study are available from the authors upon request (spyros@chemeng.upatras.gr).
The supplement related to this article is available online at: https://doi.org/10.5194/amt-11-6577-2018-supplement.
NW performed the experiments in the large chamber, contributed to the analysis of the results, and wrote the paper. SDJ performed the experiments in the small chamber and contributed to the analysis of the results. JRP developed the method for the data analysis, taking into account coagulation, and contributed to the writing of the paper. NMD contributed to the synthesis of the results and the writing of the paper. SNP was responsible for the design of the study and the synthesis of the results and contributed to the writing of the paper.
The authors declare that they have no conflict of interest.
This study was financially supported by the European Union's Horizon 2020
EUROCHAMP–2020 Infrastructure Activity (grant agreement 730997) and the EPA
STAR grant 835405.
Edited by: Hartmut
Herrmann
Reviewed by: three anonymous referees
Bian, Q., May, A. A., Kreidenweis, S. M., and Pierce, J. R.: Investigation of particle and vapor wall-loss effects on controlled wood-smoke smog-chamber experiments, Atmos. Chem. Phys., 15, 11027–11045, https://doi.org/10.5194/acp-15-11027-2015, 2015.
Charan, S. M., Kong, W., Flagan, R. C., and Seinfeld, J. H.: Effect of particle charge on aerosol dynamics in Teflon environmental chambers, Aerosol Sci. Technol., 52, 8, 854–871, 2018.
Crump, J. G. and Seinfeld, J. H.: Turbulent deposition and gravitational sedimentation of an aerosol in a vessel of arbitrary shape, J. Aerosol Sci., 2, 405–415, 1981.
Fry, J. L., Draper, D. C., Barsanti, K. C., Smith, J. N., Ortega, J., Winkler, P. M., Lawler, M. J., Brown, S. S., Edwards, P. M., Cohen, R. C., and Lee, L.: Secondary organic aerosol formation and organic nitrate yield from NO3 oxidation of biogenic hydrocarbons, Environ. Sci. Technol., 48, 11944–11953, 2014.
Hennigan, C. J., Miracolo, M. A., Engelhart, G. J., May, A. A., Presto, A. A., Lee, T., Sullivan, A. P., McMeeking, G. R., Coe, H., Wold, C. E., Hao, W.-M., Gilman, J. B., Kuster, W. C., de Gouw, J., Schichtel, B. A., Collett Jr., J. L., Kreidenweis, S. M., and Robinson, A. L.: Chemical and physical transformations of organic aerosol from the photo-oxidation of open biomass burning emissions in an environmental chamber, Atmos. Chem. Phys., 11, 7669–7686, https://doi.org/10.5194/acp-11-7669-2011, 2011.
Henry, K. M. and Donahue, N. M.: Photochemical aging of α-pinene secondary organic aerosol: effects of OH radical sources and photolysis, J. Phys. Chem. A, 116, 5932–5940, 2012.
Hildebrandt, L., Donahue, N. M., and Pandis, S. N.: High formation of secondary organic aerosol from the photo-oxidation of toluene, Atmos. Chem. Phys., 9, 2973–2986, https://doi.org/10.5194/acp-9-2973-2009, 2009.
Kaltsonoudis, C., Jorga, S. D., Louvaris, E., Florou, K., and Pandis, S. N.: A portable dual smog chamber system for atmospheric aerosol field studies, Atmos. Meas. Tech. Discuss., https://doi.org/10.5194/amt-2018-394, in review, 2018.
Keywood, M. D., Varutbangkul, V., Bahreini, R., Flagan, R. C., and Seinfeld, J. H.: Secondary organic aerosol formation from the ozonolysis of cycloalkenes and related compounds, Environ. Sci. Technol., 38, 4157–4164, 2004.
Loza, C. L., Chhabra, P. S., Yee, L. D., Craven, J. S., Flagan, R. C., and Seinfeld, J. H.: Chemical aging of m-xylene secondary organic aerosol: laboratory chamber study, Atmos. Chem. Phys., 12, 151–167, https://doi.org/10.5194/acp-12-151-2012, 2012.
McMurry, P. H. and Grosjean, D.: Gas and aerosol wall losses in Teflon film smog chambers, Environ. Sci. Technol., 19, 1176–1182, 1985.
McMurry, P. H. and Rader, D. J.: Aerosol wall losses in electrically charged chambers, Aerosol Sci. Tech., 4, 249–268, 1985.
Nah, T., McVay, R. C., Pierce, J. R., Seinfeld, J. H., and Ng, N. L.: Constraining uncertainties in particle-wall deposition correction during SOA formation in chamber experiments, Atmos. Chem. Phys., 17, 2297–2310, https://doi.org/10.5194/acp-17-2297-2017, 2017.
Ng, N. L., Kroll, J. H., Chan, A. W. H., Chhabra, P. S., Flagan, R. C., and Seinfeld, J. H.: Secondary organic aerosol formation from m-xylene, toluene, and benzene, Atmos. Chem. Phys., 7, 3909–3922, https://doi.org/10.5194/acp-7-3909-2007, 2007.
Pathak, R. K., Stanier, C. O., Donahue, N. M., and Pandis S. N.: Ozonolysis of α-pinene at atmospherically relevant concentrations: temperature dependence of aerosol mass fractions (yields), J. Geophys. Res., 112, D03201, 2007.
Pierce, J. R., Engelhart, G. J., Hildebrandt, L., Weitkamp, E. A., Pathak, R. K., Donahue, N. M., Robinson, A. L., Adams, P. J., and Pandis, S. N.: Constraining particle evolution from wall losses, coagulation, and condensation-evaporation in smog-chamber experiments: optimal estimation based on size distribution measurements, Aerosol Sci. Tech., 42, 1001–1015, 2008.
Seinfeld, J. H. and Pandis, S. N.: Atmospheric Chemistry and Physics, 3rd edn., John Wiley & Sons, Inc., Hoboken, New Jersey, 2016.
Stern, J. E., Flagan R. C., Grosjean D., and Seinfeld J. H.: Aerosol formation and growth in atmospheric aromatic hydrocarbon photooxidation, Environ. Sci. Technol., 21, 1224–1231, 1987.
Wang, N., Kostenidou, E., Donahue, N. M., and Pandis, S. N.: Multi-generation chemical aging of α-pinene ozonolysis products by reactions with OH, Atmos. Chem. Phys., 18, 3589–3601, https://doi.org/10.5194/acp-18-3589-2018, 2018.