the Creative Commons Attribution 4.0 License.
the Creative Commons Attribution 4.0 License.
 | 07 Jan 2019
Profiling of CH4 background mixing ratio in the lower troposphere with Raman lidar: a feasibility experiment
Igor Veselovskii
Philippe Goloub
Qiaoyun Hu
Thierry Podvin
David N. Whiteman
Mikhael Korenskiy
Eduardo Landulfo
We present the results of methane profiling in the lower troposphere using LILAS Raman lidar from the Lille University observatory platform (France). The lidar is based on a frequency-tripled Nd:YAG laser, and nighttime profiling up to 4000 with 100 m height resolution is possible for methane. Agreement between the measured photon-counting rate in the CH4 Raman channel in the free troposphere and numerical simulations for a typical CH4 background mixing ratio (2 ppm) confirms that CH4 Raman scattering is detected. The mixing ratio is calculated from the ratio of methane (395.7 nm) and nitrogen (386.7 nm) Raman backscatters, and within the planetary boundary layer, an increase of the CH4 mixing ratio, up to a factor of 2, is observed. Different possible interfering factors, such as leakage of the elastic signal and aerosol fluorescence, have been taken into consideration. Tests using backscattering from clouds confirmed that the filters in the Raman channel provide sufficient rejection of elastic scattering. The measured methane profiles do not correlate with aerosol backscattering, which corroborates the hypothesis that, in the planetary boundary layer, not aerosol fluorescence but CH4 is observed. However, the fluorescence contribution cannot be completely excluded and, for future measurements, we plan to install an additional control channel close to 393 nm, where no strong Raman lines exist and only fluorescence can be observed.
- Article
(4520 KB) - Full-text XML
- BibTeX
- EndNote


Raman spectroscopy is a powerful technique for identification of different gases in the atmosphere and for the estimation of their concentration (Weber, 1979), which can be used in conjunction with lidar technology (Inaba and Kobayasi, 1972). An example of such synergy is the Raman lidar for water vapor monitoring (Whiteman et al., 1992). For optimum application of the Raman technique, the gas of interest should be abundant in the atmosphere, possess a large scattering cross section and have a Raman spectrum that is isolated from potential interfering species. Detection of water vapor with Raman spectroscopy satisfies all of these conditions and has become a very popular application of lidar (e.g., Whiteman et al., 2007, and references therein). Besides water vapor, Raman lidar profiling of carbon dioxide (Ansmann et al., 1992; Whiteman et al., 2007; Zhao et al., 2008), as well as quartz crystals in dust layers (Müller et al., 2010), has been reported.
Methane is currently the second most important greenhouse gas (after carbon dioxide) of anthropogenic origin (IPCC, 2013). Methane is emitted from a variety of natural and anthropogenic sources (e.g., Baray et al., 2018; Kavitha et al., 2016, and references therein) and on a per-molecule basis, methane is about 30 times more effective a greenhouse gas than carbon dioxide (Etminan et al., 2016). Global information about the CH4 column concentration is available from satellite observations with, for example, the SCIAMACHY sensor on board the ENVISAT satellite (Bovensmann et al., 1999) or the TANSO-FTS sensor on board the GOSAT satellite (Kuze et al., 2009). Passive observations, however, can be influenced by the presence of aerosol layers or thin ice clouds. The lack of precise global measurements of atmospheric methane initiated, in particular, the upcoming MERLIN mission, offering integrated path differential absorption space-borne lidar (https://earth.esa.int/web/eoportal/satellite-missions/m/merlin, last access: 5 December 2018), which should provide unprecedented accuracy of CH4 column values. Still, the integrated path technique does not provide the profile of the methane mixing ratio, which can vary significantly in the lower troposphere.
Today, it is well established that, in the free troposphere the CH4 mixing ratio is about 2 ppm, while inside the planetary boundary layer (PBL), the mixing ratio can be increased in the vicinity of methane sources (Baray et al., 2018). Such enhancement up to 4 ppm was observed, for example, in the airborne measurements over oil sands (Baray et al., 2018). At low altitudes, the methane concentration depends on the PBL dynamics, so it is important to profile the methane mixing ratio simultaneously with the PBL parameters such as PBL height and aerosol backscattering. Profiling of the PBL is commonly done by aerosol lidars (Kovalev and Eichinger, 2004), while for methane profiling either the differential absorption (DIAL) or Raman lidars can be used.
Existing DIAL systems for measuring methane are based on tunable parametric laser sources and operate in the shortwave infrared (SWIR) spectral range between 1.65 and 2.3 µm, where methane has strong absorption lines (Refaat et al., 2013; Riris et al., 2017). Due to low Raleigh scattering in the SWIR region, methane profiling using the DIAL technique is possible only inside regions containing significant amounts of aerosol. Raman lidars, by contrast, use standard off-the-shelf tripled Nd:YAG lasers, are relatively simple in design and can be operated in aerosol-free atmosphere. The methane molecule is quite suitable for Raman detection. The vibrational Raman line at 2914 cm−1 is well isolated and has the scattering cross section about 8 times higher than that of nitrogen (Weber, 1979). The main difficulties of CH4 Raman detection are related to its low background atmospheric concentration. The first attempts to implement CH4 Raman spectroscopy in lidars go back to the 1980s. Raman lidar was used for monitoring methane plumes with relative CH4 volume concentrations of about 2 % (Houston et al., 1986). Monitoring of the background CH4 concentrations in the troposphere with airborne Raman lidar was reported by Heaps and Burris (1996). In both cases powerful excimer lasers (XeCl and XeF) were used. However, the wideband radiation of excimer lasers requires the use of wideband interference filters in Raman channel, which, in turn, increases the sky background noise and possible contribution of aerosol fluorescence. Wideband detection also creates an additional complication related to interference from the oxygen Raman overtone (second Stokes shift) (Heaps and Burris, 1996). Significant progress in the development of the interference filters, detectors and laser sources during the last 2 decades now provides the opportunity to develop the CH4 Raman lidar based on a relatively compact tripled Nd:YAG laser. For narrowband 354.7 nm laser radiation the vibrational Raman line of methane is at 395.7 nm, while the oxygen Raman overtone (3089 cm−1) is at 398.4 nm, which can be rejected by the interference filter.
In our paper we present the first results of methane profiling in the lower troposphere using LILAS Raman lidar from the Lille University observatory platform (Hauts-de-France region, France). The observations demonstrate that inside the PBL, the CH4 mixing ratio may exceed the background concentration levels by up to a factor of 2. Enhancement of the CH4 mixing ratio in weak elevated aerosol layers was also detected.
The experiments described here were performed using LILAS – multiwavelength Mie–Raman lidar from Lille University (Veselovskii et al., 2016). The lidar is based on a tripled Nd:YAG laser with a 20 Hz repetition rate and pulse energy of 70 mJ at 355 nm. The backscattered light is collected by a 40 cm aperture Newtonian telescope. The outputs of the detectors are recorded at 7.5 m range resolution using Licel transient recorders that incorporate both analog and photon-counting electronics. The full geometrical overlap of the laser beam and the telescope field of view (FOV) is achieved at approximately 1000 m height using a 0.75 mrad FOV. In its usual configuration, LILAS allows the detection of three elastic backscattered signals (355, 532, 1064 nm), a rotational Raman signal from N2 and O2 molecules at approximately 530 nm (Veselovskii et al., 2015), and vibrational nitrogen and water vapor Raman signals at 387 and 408 nm. To take the CH4 measurements shown in this paper, we modified the water vapor channel (408 nm interference filter was replaced by the methane filter centered at 395.7 nm). The dichroic mirror in the receiver did not provide an efficient selection of the methane (395.7 nm) Raman component, so it was replaced by the mirror with high reflectance at 395.7 nm. Only a small portion of the 387 nm component was transmitted to the nitrogen channel, while more than 95 % of the 395.7 nm signal was reflected to the methane channel. Through comparing nitrogen Raman backscatter intensity before and after the modification we find that the sensitivity of the 387 nm channel was degraded by a factor of 185. The strength of the nitrogen Raman signal, though low, was sufficient for the purpose of our experiment.
The Alluxa interference filter in the methane Raman channel has a bandwidth of 0.3 nm with peak transmission greater than 80 %. The corresponding transmission curve, simulated by the manufacturer in the 300–550 nm range, is shown in Fig. 1. Suppression of 355 and 532 nm radiation is specified to be greater than 12 orders of magnitude. The Raman-scattering cross section of methane is about 8 times higher than that of nitrogen, so for a 2 ppm methane concentration the ratio of intensities of Raman nitrogen to methane scattering is about 6×10⁴. Thus, not only should the elastic backscatter components of the signal be suppressed sufficiently, but so should the nitrogen and oxygen Stokes and anti-Stokes Raman lines. To eliminate the possible contribution of rotational anti-Stokes lines, the interference filter was combined with a notch filter, providing an additional OD4 blocking in the 348–360 nm range. The contribution of the vibrational anti-Stokes lines is the most significant for oxygen (336.2 nm), where the corresponding intensity is about 20 times the intensity of CH4 line. The filter suppression at 336.2 nm is about OD9, which is sufficient to block the anti-Stokes line contribution.
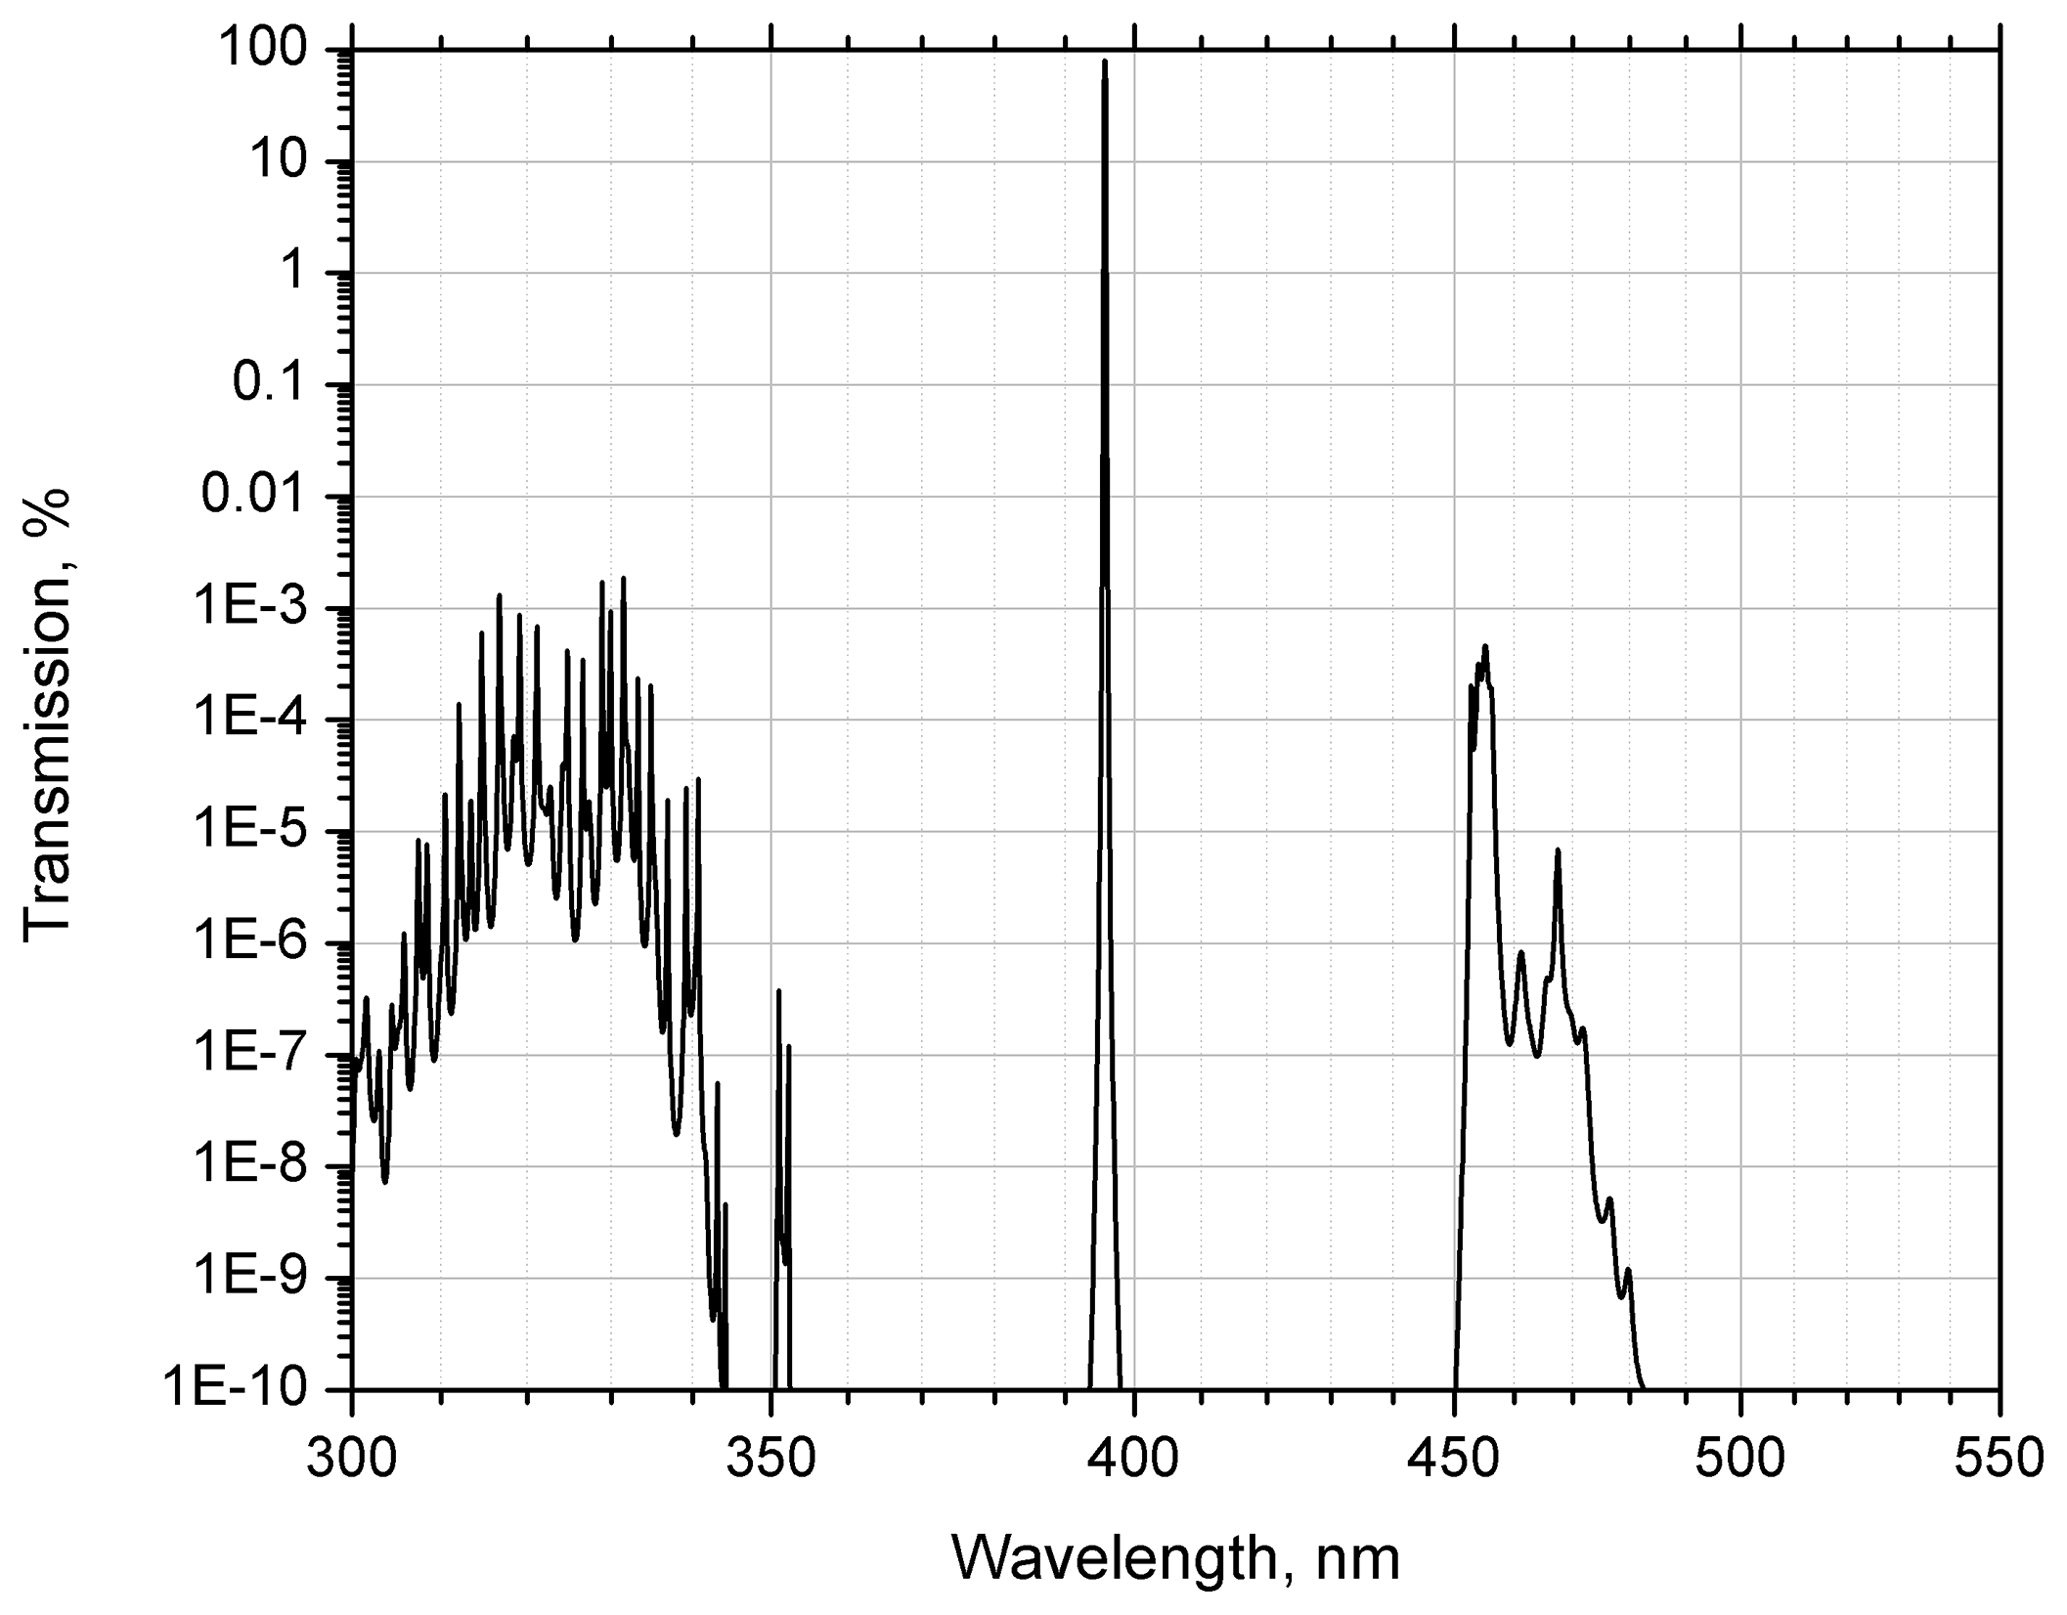
The intensity of the oxygen overtone (398.4 nm) is approximately 3 times the intensity of the methane line (Heaps and Burris, 1996), while the filter manufacturer specifies the suppression at 398.4 nm to be above OD10; hence the contribution of the oxygen overtone is negligible. To verify that no 532 nm backscatter or corresponding Raman lines leak into the methane channel, during the initial test phase a UV glass filter with transmission of less than 5 % in the 500–750 nm range was also added to the methane channel. No noticeable changes in CH4 Raman signals were discovered with this additional blocking filter in place. The transmission curve in Fig. 1 shows an increase in the 450–480 nm range, where aerosol fluorescence may occur (Sugimoto et al., 2012; Reichardt et al., 2017), with maximal transmission of % at 455 nm. The dichroic mirrors in the detection module provide additional suppression of factor 20 at this wavelength, so total suppression of fluorescence signal at 455 nm is greater than 4×10⁶. All presented Raman methane measurements were taken in the photon-counting mode and at night only.
Numerical simulation was performed to estimate the power of the Raman backscatter for the background methane mixing ratio. The lidar equation describing the number of detected photons , scattered by molecule x at distance z due to a single laser pulse can be written as follows:
Here O(z) is the geometrical overlap factor, Ax is an efficiency factor, including the transmission of the optics and the quantum efficiency of the detectors. E and hν are the laser pulse and the photon energies, Δz is range resolution, S is the receiving telescope area, Nx is the number concentration of molecule x and σx is the differential Raman-scattering cross section of molecule x, α is the extinction coefficient, where superscript “a” and “m” indicate aerosol and molecular contributions. Subscript “L” and “x” correspond to the laser wavelength λL and to the wavelength of Raman backscatter λx.
Table 1Raman frequency shift for H2O, CO2 and CH4 molecules and their scattering cross sections normalized to the cross section of nitrogen. Results are given for an excitation wavelength of 337 nm (Weber, 1979). Typical background-gas mixing ratios nx in the low troposphere and the product are also given.

Table 1 shows the parameters of H2O, CO2 and CH4 molecules, such as Raman frequency shift and Raman differential scattering cross section σx, normalized to the cross section of nitrogen . Results are presented for an excitation wavelength of 337 nm based on Weber (1979). The table also provides typical concentrations of gases in the troposphere. The efficiency of detection of molecule x is determined by the factor (nx is the molecule x mixing ratio), which is approximately 104 for the H2O molecule and about 320 for CO2. However, for CH4 this factor is about 20 times lower than for CO2, so detection of the methane background concentrations demands a powerful Raman lidar and significant signal accumulation time.
The lidar-derived mixing ratio of methane can be calculated from the ratio of CH4 and N2 lidar Raman signals ( and , corrected for the aerosol and molecular differential extinction:
Here and are the wavelengths of nitrogen and methane Raman components; and are the aerosol and molecular extinctions at ; γ is the Ångstrom exponent and K is the calibration constant. In our measurements, we assume that the CH4 mixing ratio above the boundary layer is 2 ppm and this value was used for calibration purposes. The calibration, in principle, can be performed from first principles by using a calibration lamp with a known spectrum, as has been done for Raman water vapor lidars (Venable et al., 2011). The methane mixing ratio in Eq. (2) is calculated from the ratio of the lidar signals, so the geometrical overlap factors are at least partially compensated and thus measurements below the height of the full overlap are possible. We still need to extrapolate the extinction coefficient to the region of incomplete overlap. However, the influence of the aerosol differential extinction term in Eq. (2) is lower than in the water vapor measurements due to the lower wavelength separation between nitrogen and methane Raman components.
To estimate the statistical uncertainties of methane detection, we assume that a uniform aerosol layer extends from the ground up to 2 km in height. In modeling the aerosol extinction coefficients at 355 nm, extinction values of 0.05, 0.1 and 0.2 km−1 were considered. The number of detected photons was calculated from Eq. (1) for Δz=100 m, and ppm. The assumed laser pulse energy was 70 mJ at 354.7 nm, which corresponds with the LILAS laser energy during the observations reported. The nitrogen Raman-scattering cross section of cm2 sr−1 at 488 nm is taken from Penney et al. (1974) and recalculated for 355 nm. Finally, assuming that (Weber, 1979), the value cm2 sr−1 at 355 nm was used. Statistical uncertainties of the measurements are determined mainly by the weak CH4 Raman backscatter and, in the absence of background noise, the uncertainty can be estimated as .
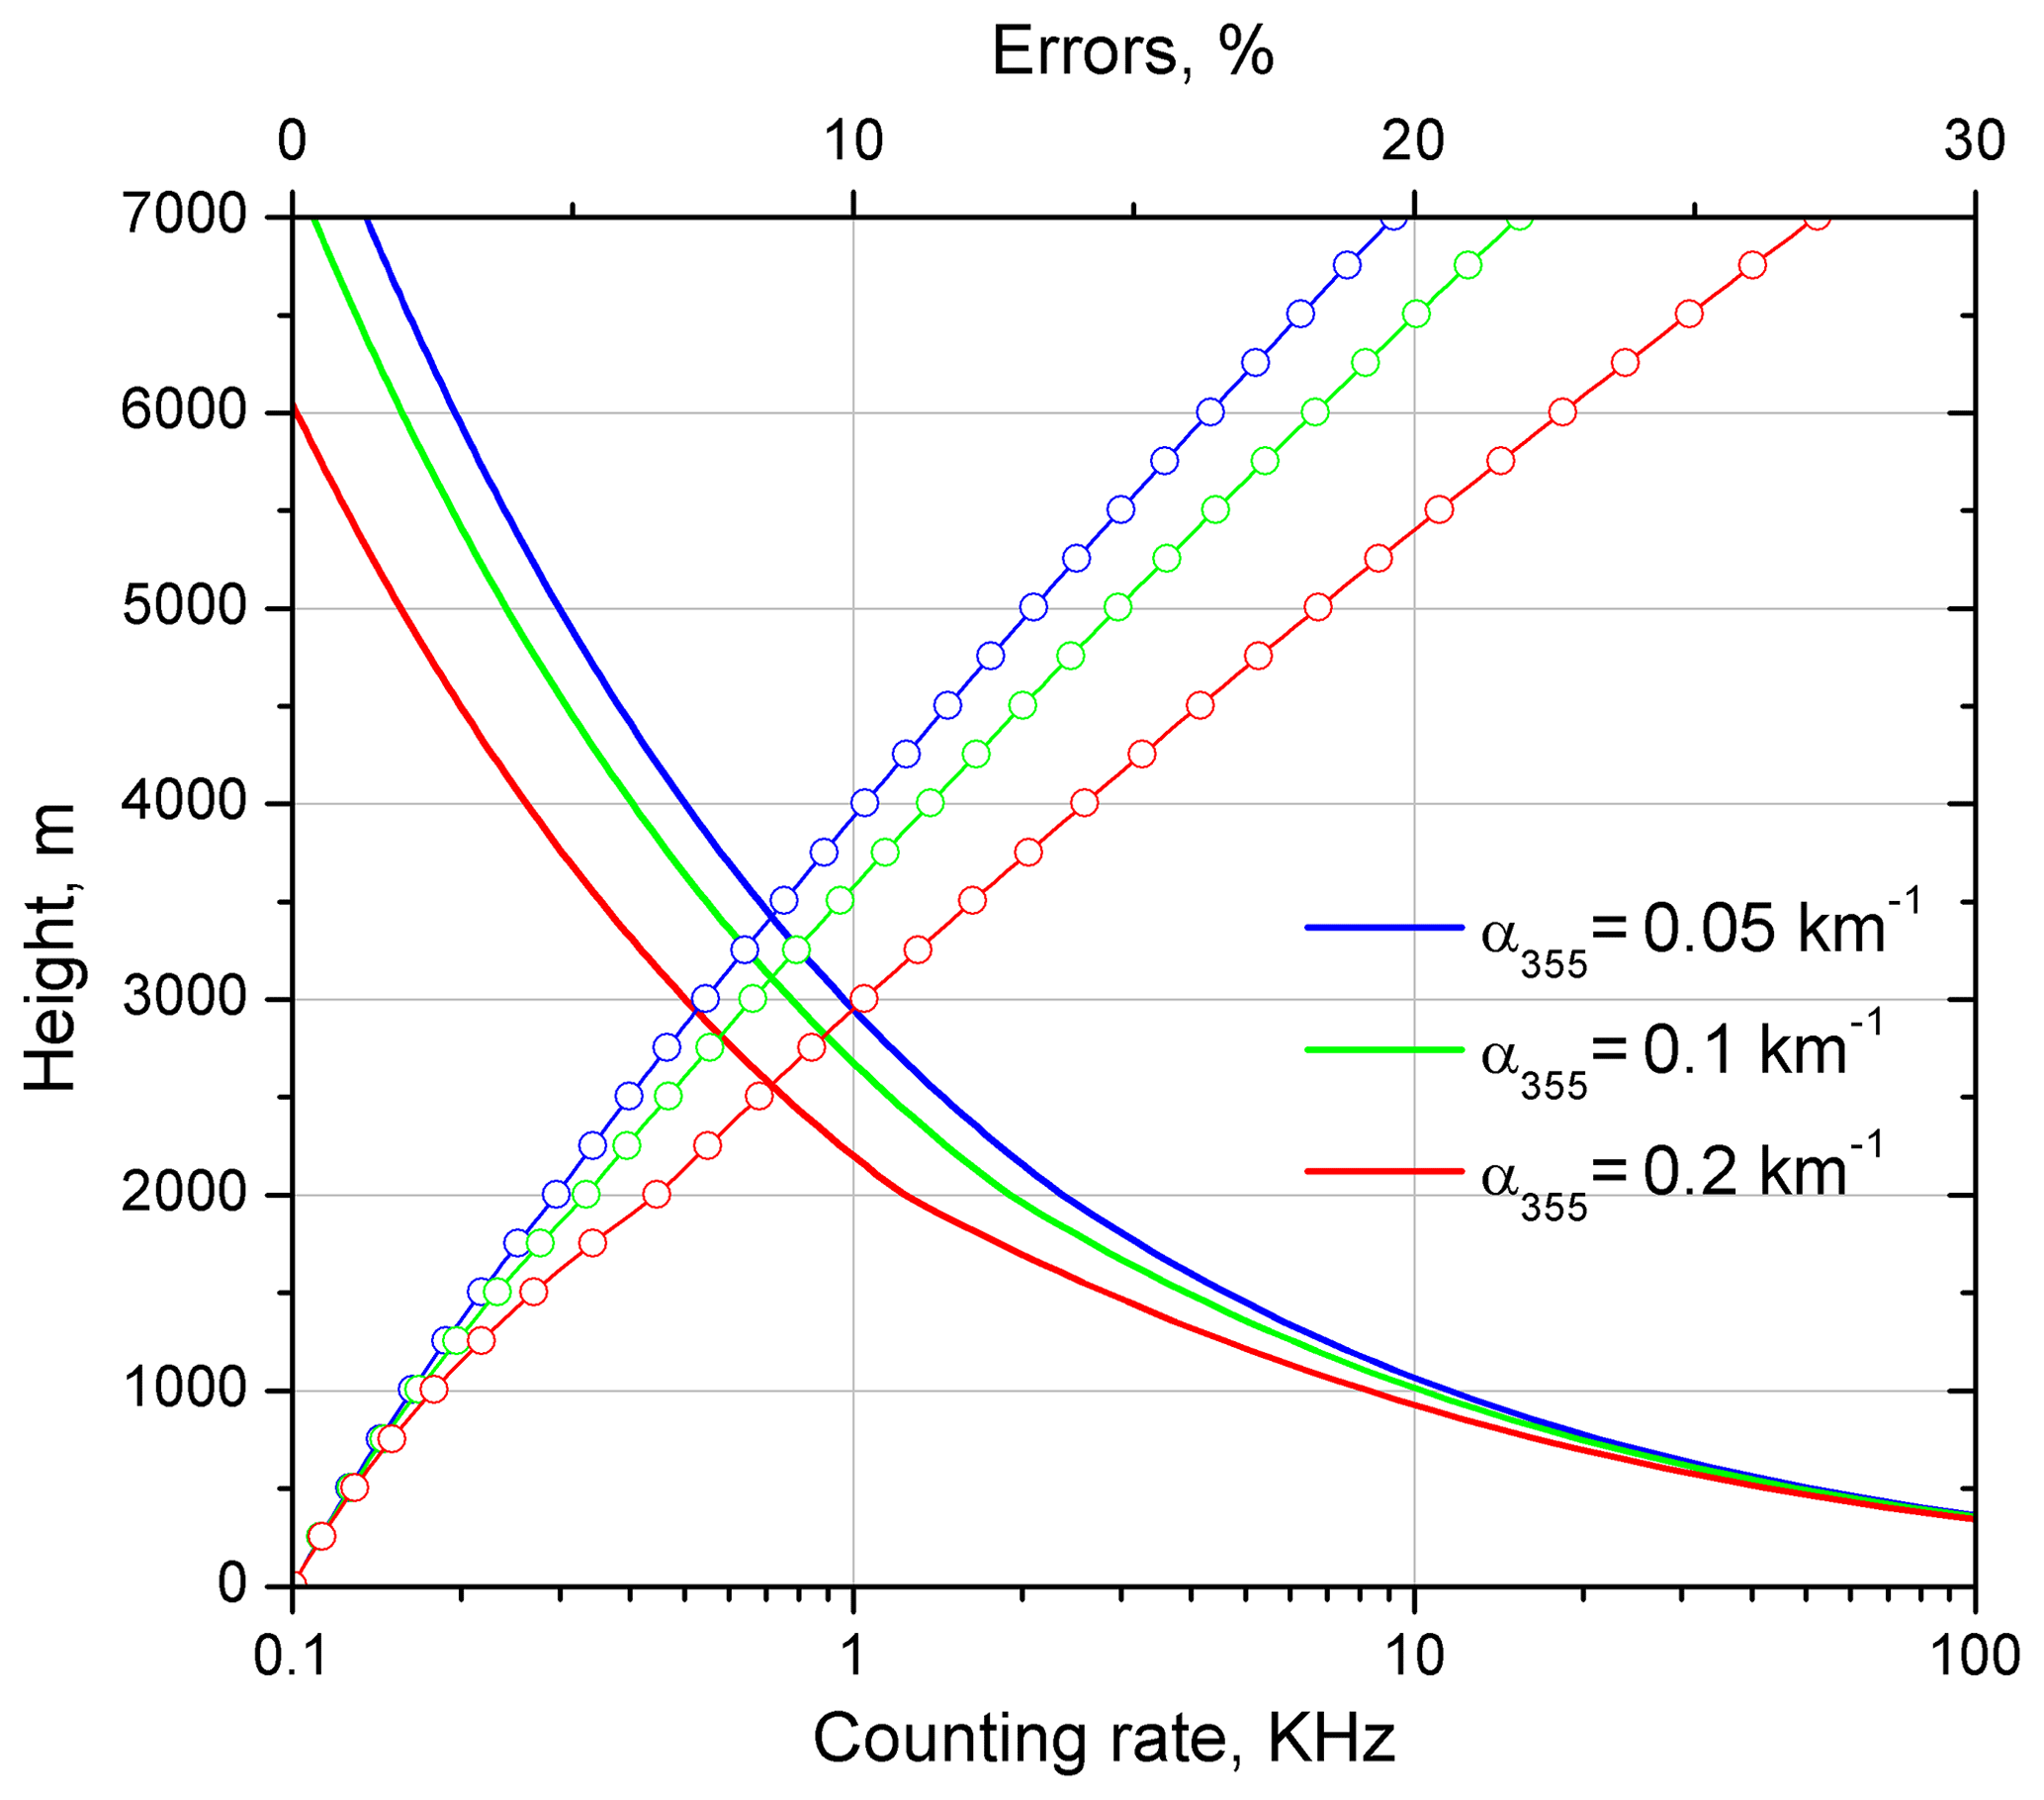
Figure 2Modeled photon-counting rate (lines) and statistical uncertainties of the methane mixing ratio measurements (lines and symbols) for a 2 ppm methane concentration and three values of aerosol extinction coefficient α355=0.05, 0.1, 0.2 km−1. Aerosol extends from z=0 to z=2000 m. Signal-averaging time is 4 h.
Figure 2 shows vertical profiles of statistical uncertainties for three values of the aerosol extinction coefficient: 0.05, 0.1, 0.2 km−1 and a signal-averaging time of 4 h. The figure also shows the photon-counting rate in the methane Raman channel , where c is the speed of the light. For the clean atmosphere (α355=0.05 km−1) the measurements with uncertainty below 10 % are possible up to 4 km, while for α355=0.2 km−1 the corresponding range decreases to 3 km. The simulation results confirm the necessity of long-term (several hours) signal accumulation in methane measurements using Raman lidar.
Measurements were taken on the Lille University observatory platform, France, during the period May–June 2018. In total, 20 nighttime observation sessions were accomplished. Figure 3 shows CH4 and N2 Raman lidar signals together with the backscattered signal at 1064 nm on the night of 14–15 June 2018. The results are averaged over the temporal interval τav=4.0 h. Aerosols are mainly located below 1700 m (maximal value of aerosol extinction α355 inside the PBL is about 0.1 km−1), though a weak aerosol layer is also visible in the 1064 nm lidar signal in the 2.5–4.0 km height interval. HYSPLIT back-trajectory analysis (Stein et al., 2015; Rolph et al., 2017) shows that the air mass in this layer originates from Canada, having been transported over the Atlantic. The photon-counting rate in the methane channel at 2000 m is about 1.8 KHz, which agrees with simulation results in Fig. 2 for α355=0.1 km−1. As mentioned, for a 2 ppm CH4 mixing ratio, the nitrogen Raman backscatter should be approximately 6×10⁴ stronger than that from methane. The value estimated from our measurements of 5×10⁴ agrees well with this prediction, which confirms that we observed methane Raman scattering. The profile of the methane mixing ratio calculated from the measurements in Fig. 3 and averaged over 100 m height bins is shown in Fig. 4. The same figure provides the profile of the backscattering coefficient at 532 nm. The mixing ratio is given in arbitrary units, assuming that the value of 1.0 corresponds to ppm. The mixing ratio inside the PBL exceeds the corresponding values above 4000 m by approximately a factor of 2. The profiles of and β532 are not correlated: inside the PBL the maximum of β532 is at a height of 1500 m, while the maximum of is at 1100 m. The backscattering coefficient β532 of the weak aerosol layer at 3500 m is about km−1 sr−1, which is almost a factor of 50 lower than the maximum value of β532 inside the PBL. In this elevated layer, the CH4 mixing ratio also increases; however at 3500 m is 1.5, which is close to the values in the PBL. Thus, the enhancement of at 3500 nm is very unlikely to be an artifact related to aerosol interference.

Figure 3Lidar signals corresponding to elastic scattering at 1064 nm, nitrogen Raman scattering at 387 nm and methane Raman scattering at 396 nm on the night of 14–15 June 2018. The units are MHz for 387 and 396 nm, and mV for 1064 nm. Black lines show the profiles of molecular scattering. Measurements were taken from 22:00 to 02:00 UTC. Signal-averaging time taver=4.0 h.
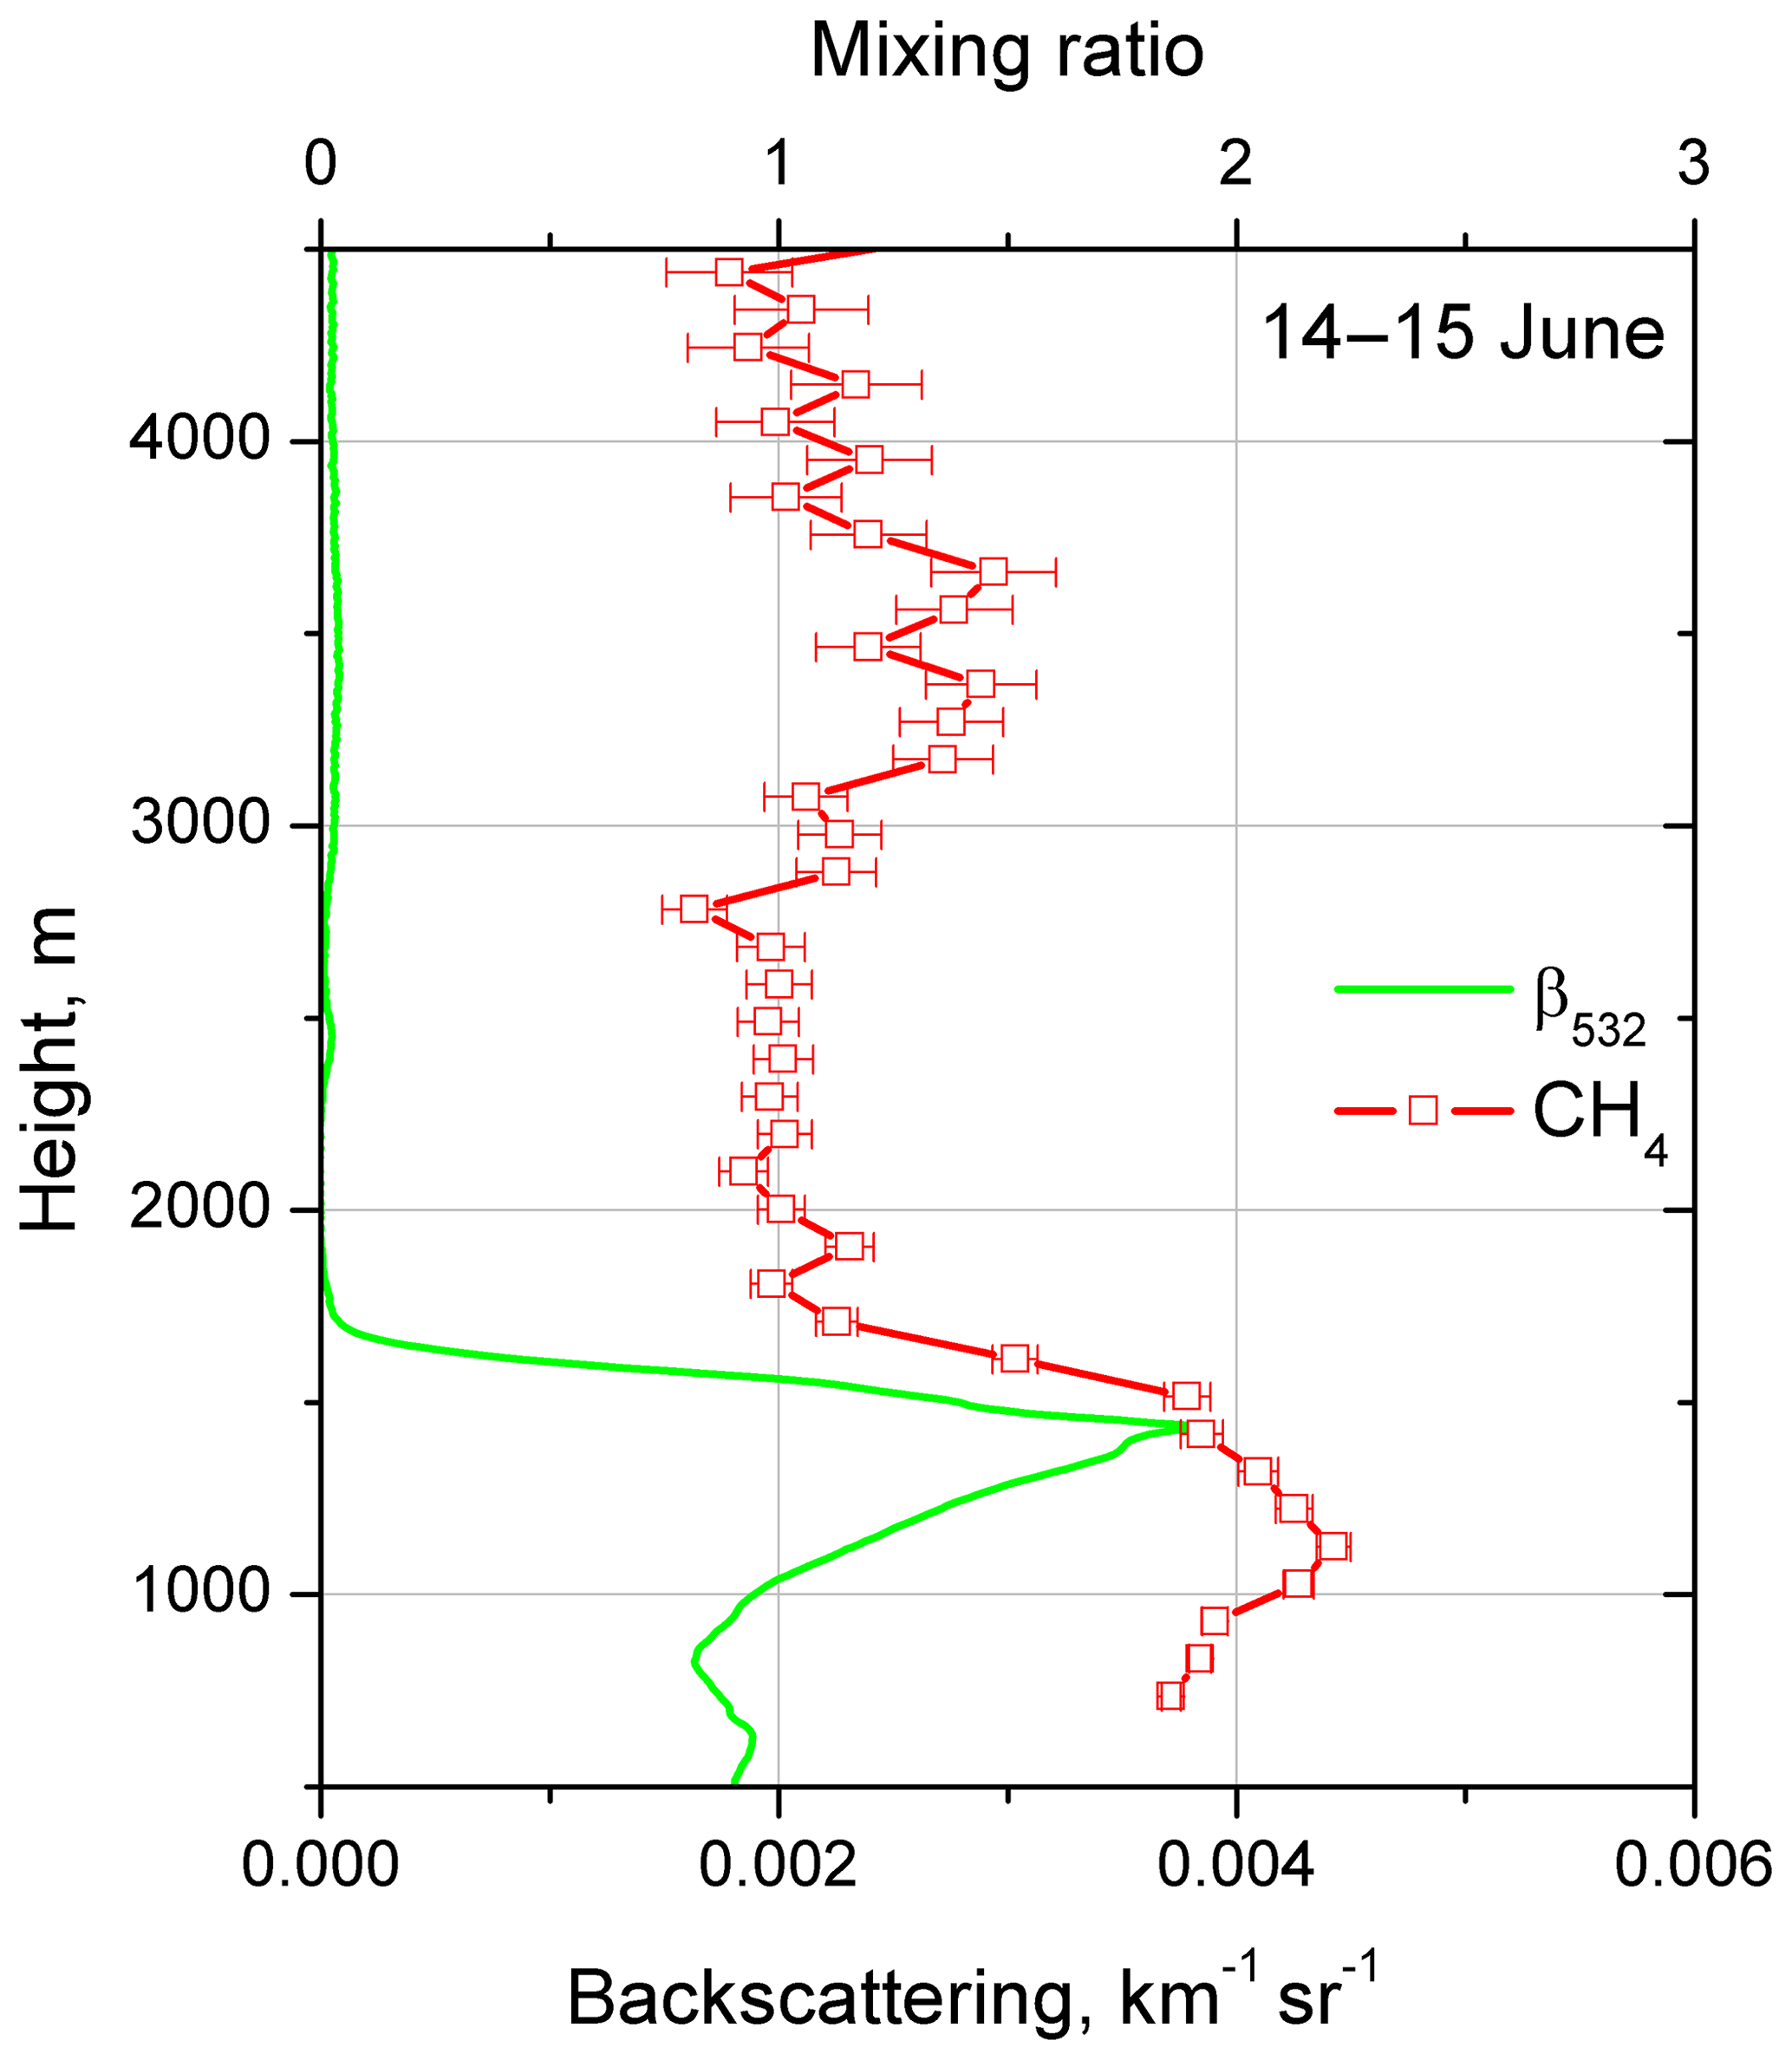
Figure 4Vertical profiles of aerosol backscattering coefficient at 532 nm and methane mixing ratio calculated from measurements on 14–15 June for the same temporal interval as in Fig. 3. Mixing ratio is uncalibrated and the value 1.0 corresponds to approximately 2 ppm.
The derived methane profiles exhibited strong night-to-night variation. Figure 5 shows the results of six measurement sessions, representing nights with different aerosol loadings. On the night of 20–21 May (Fig. 5a) a scattering layer with a peak value of β532=0.09 km−1 sr−1 occurs in the 2500–3100 m height range. The low lidar ratio (below 20 sr) and low depolarization ratio (below 5 %) indicate that this layer is likely a water cloud. Strong cloud scattering demonstrates no influence on the mixing ratio, which is about 1.0 in the center of the cloud, proving that the interference filters provide sufficient rejection of elastic scattering. It should also be mentioned that the Raman band of the liquid water extends from 395 to 409 nm (Avila et al., 2004; Reichardt, 2014), so potentially it can be an interfering factor in the methane measurements. However, Fig. 5a does not reveal a noticeable effect of liquid water Raman scattering on the methane profile due to the narrowband filter in the CH4 channel. Cloud layers also occurred on 26–27 and 27–28 May (Fig. 5b, c) at a height of approximately 4000 m with maximum values of backscattering coefficients of β532=0.006 and 0.02 km−1 sr−1. As in Fig. 5a, the presence of clouds does not influence the methane measurements. By contrast, the night of 12–13 June (Fig. 5f) was characterized by a low aerosol backscattering coefficient in the 500–4000 m range (β532 is below km−1 sr−1) and the mixing ratio shows no significant deviation from the 1.0 value in the whole height range.
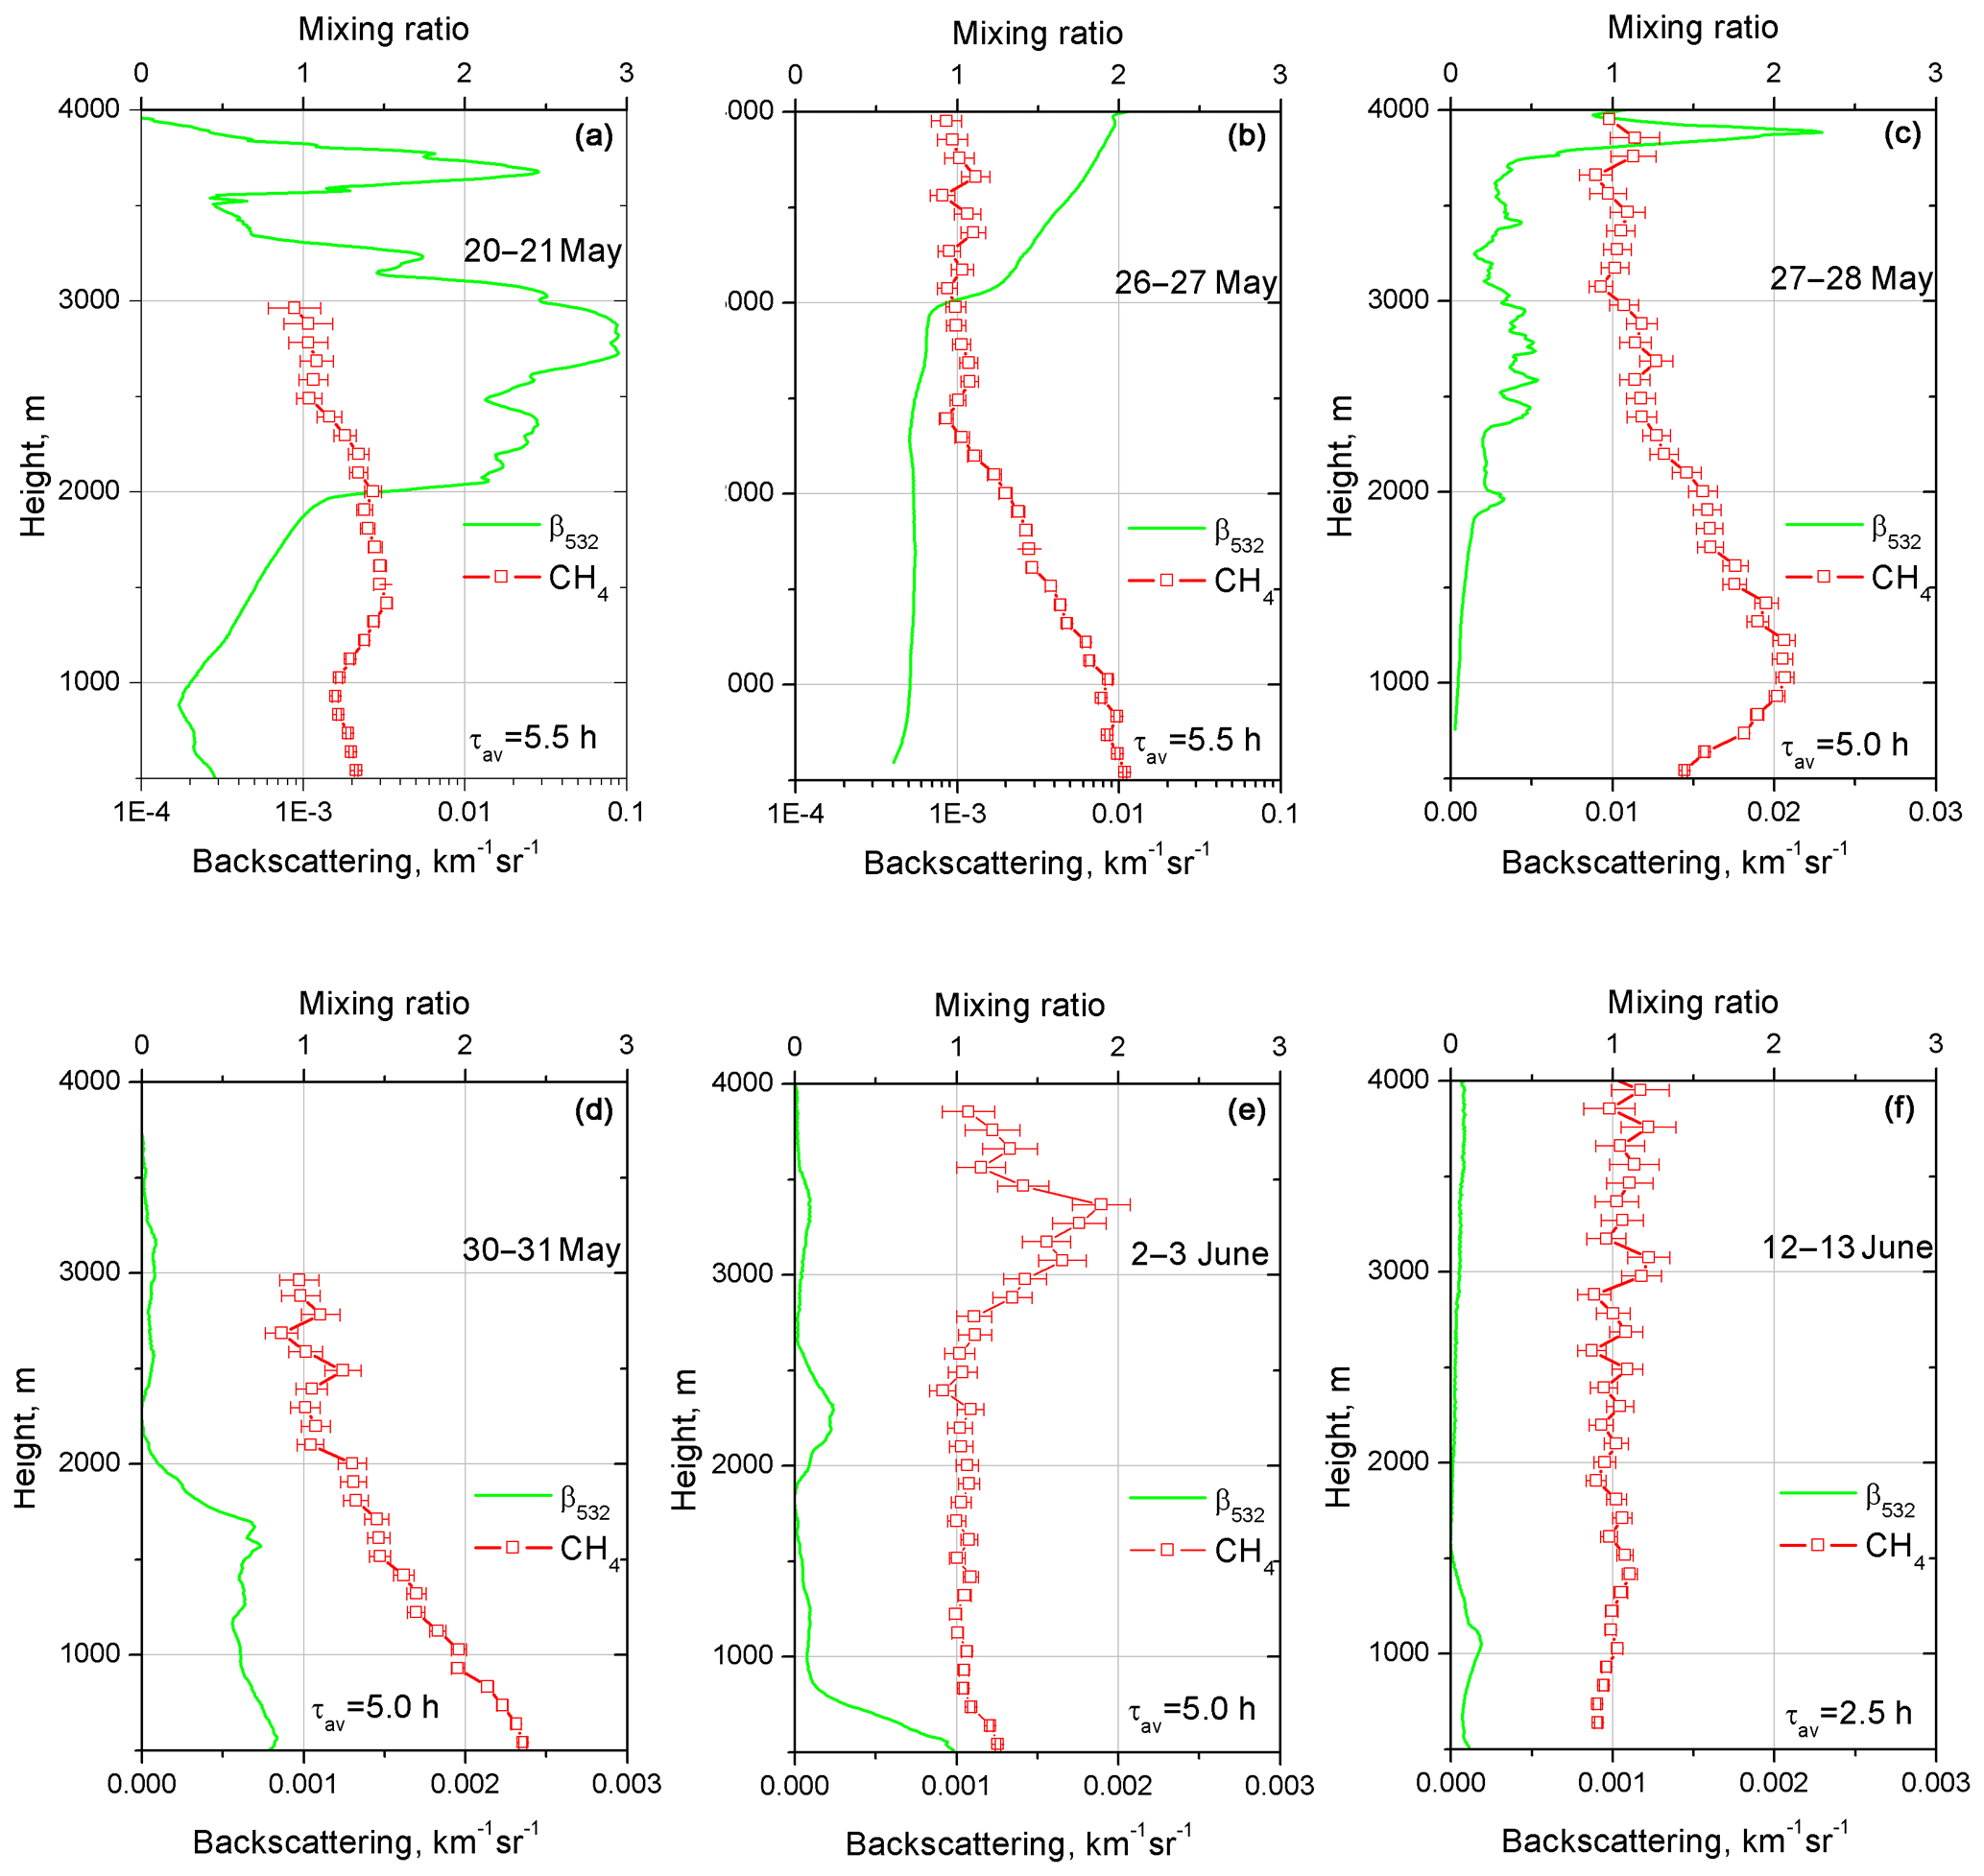
Figure 5Vertical profiles of the methane mixing ratio and aerosol backscattering at 532 nm for six nighttime measurement sessions: (a) 20–21 May, (b) 26–27 May, (c) 27–28 May, (d) 30–31 May, (e) 2–3 June and (f) 12–13 June 2018. Mixing ratios are not calibrated and the value 1.0 corresponds to approximately 2 ppm. Signal-averaging time τav is given in hours.
The vertical variation of methane content was related to the PBL height, as can be concluded from a comparison of Fig. 5d and e. On 30–31 May the aerosol is confined below 2000 m, while on 2–3 June it is below 750 m. The decreases from 2.4 at 500 m to 1.0 at 2000 m in the first case, while in the second case the background level of 1.0 is observed for the heights above 750 m. On 2–3 June, the increase of the CH4 mixing ratio at 3400 m correlates with a weak aerosol layer (β532 < 10−4 km−1 sr−1) at the same height. It is interesting that a stronger aerosol layer at 2300 m is not accompanied by an increase in . The air masses in both layers were transported over the Atlantic from Canada and corresponding backward trajectories are close, so we are not able to make conclusions about the difference in the nature of these layers.
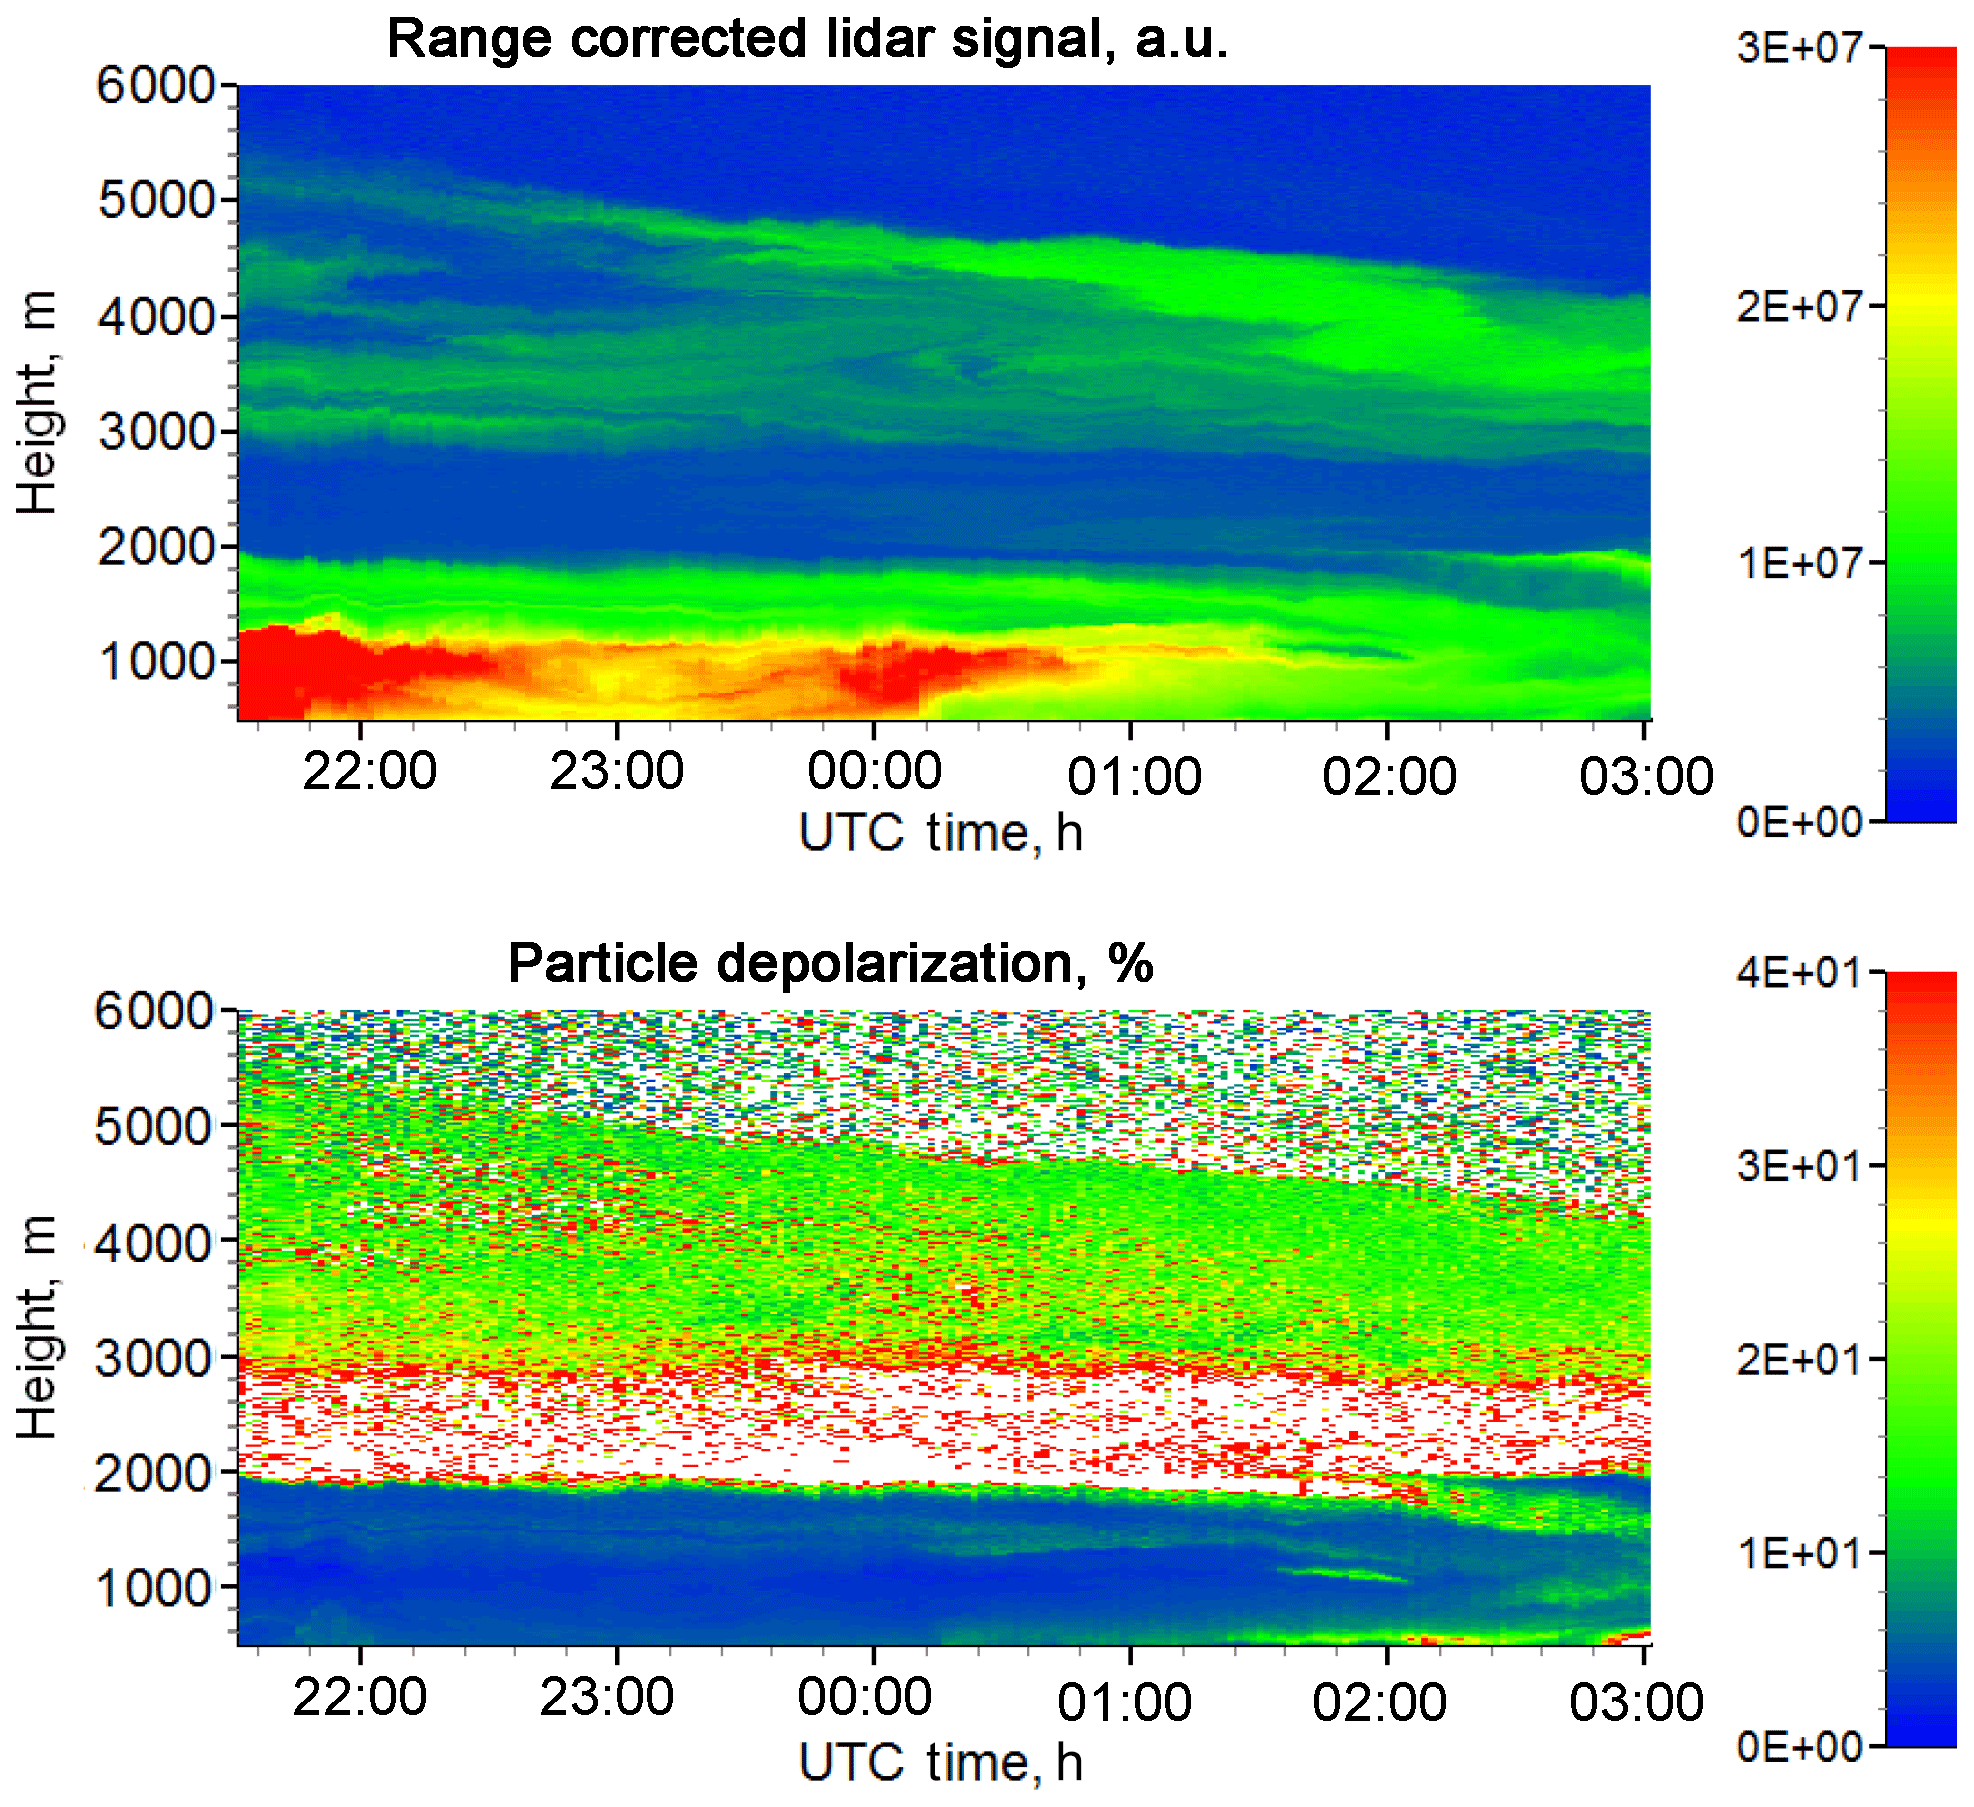
Figure 6Range-corrected lidar signal at 1064 nm and the particle depolarization ratio at 532 nm for the night of 13–14 June 2018.
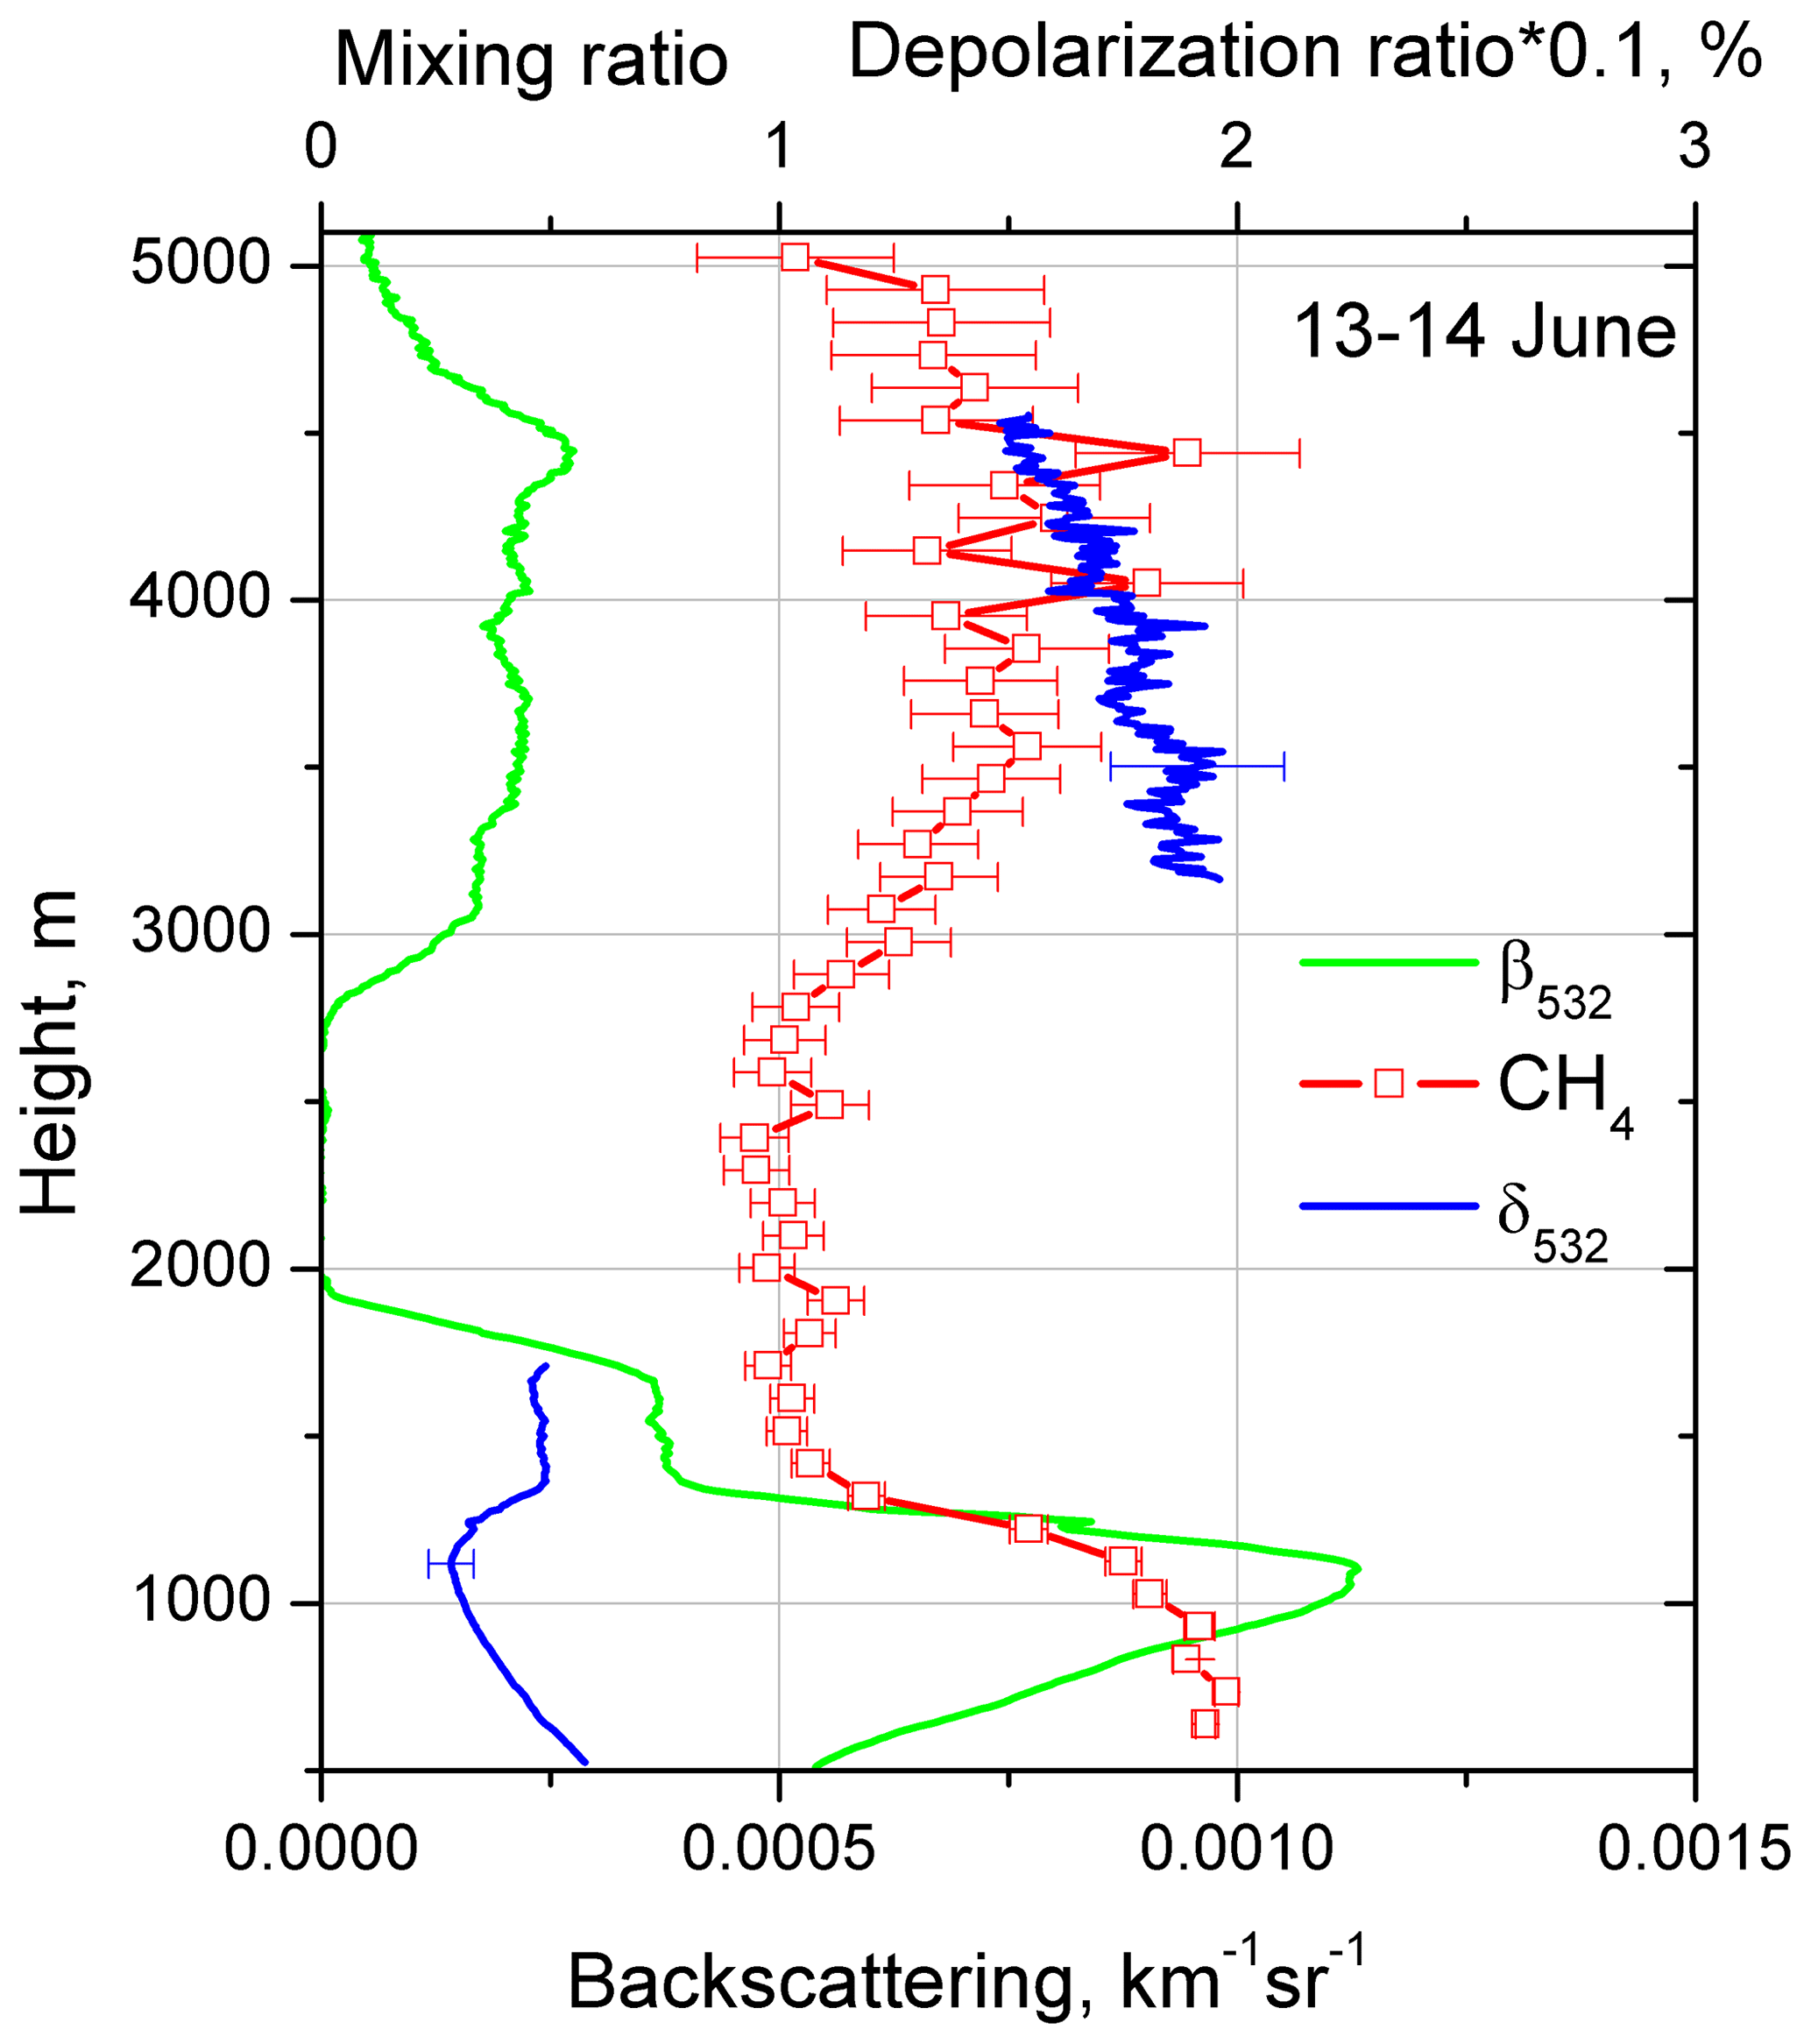
Figure 7Aerosol backscattering coefficient β532, particle depolarization δ532 and CH4 mixing ratio on 13–14 June 2018 for the temporal interval 22:00–02:00 UTC. Values of δ532 are multiplied by a factor of 0.1. Mixing ratios are not calibrated and the value 1.0 corresponds to approximately 2 ppm.
Enhancement of in weak elevated aerosol layers was observed several times during the campaign. In all cases the air mass was transported over the Atlantic. One such observation session was on the night of 13–14 June 2018. Figure 6 shows the temporal–spatial distribution of the range-corrected lidar signal at 1064 nm and the particle depolarization ratio at 532 nm for this session. Most of the aerosols are below 2000 m, but there is an elevated layer in the 3000–5000 m height range. The depolarization ratio inside the PBL is low (δ532 < 5 %), while in the elevated layer δ532 increases up to approximately 18 %. The available radiosonde data from Paris (France) and Essen (Belgium) show that the relative humidity in the elevated layer is below 40 %. The profiles of aerosol backscattering coefficient β532, particle depolarization δ532 and CH4 mixing ratio on 13–14 June for the temporal interval of 22:00–02:00 UTC are given in Fig. 7. In the PBL the mixing ratio is about 2.0, and in the elevated layer the also demonstrates an increase up to approximately 1.5.
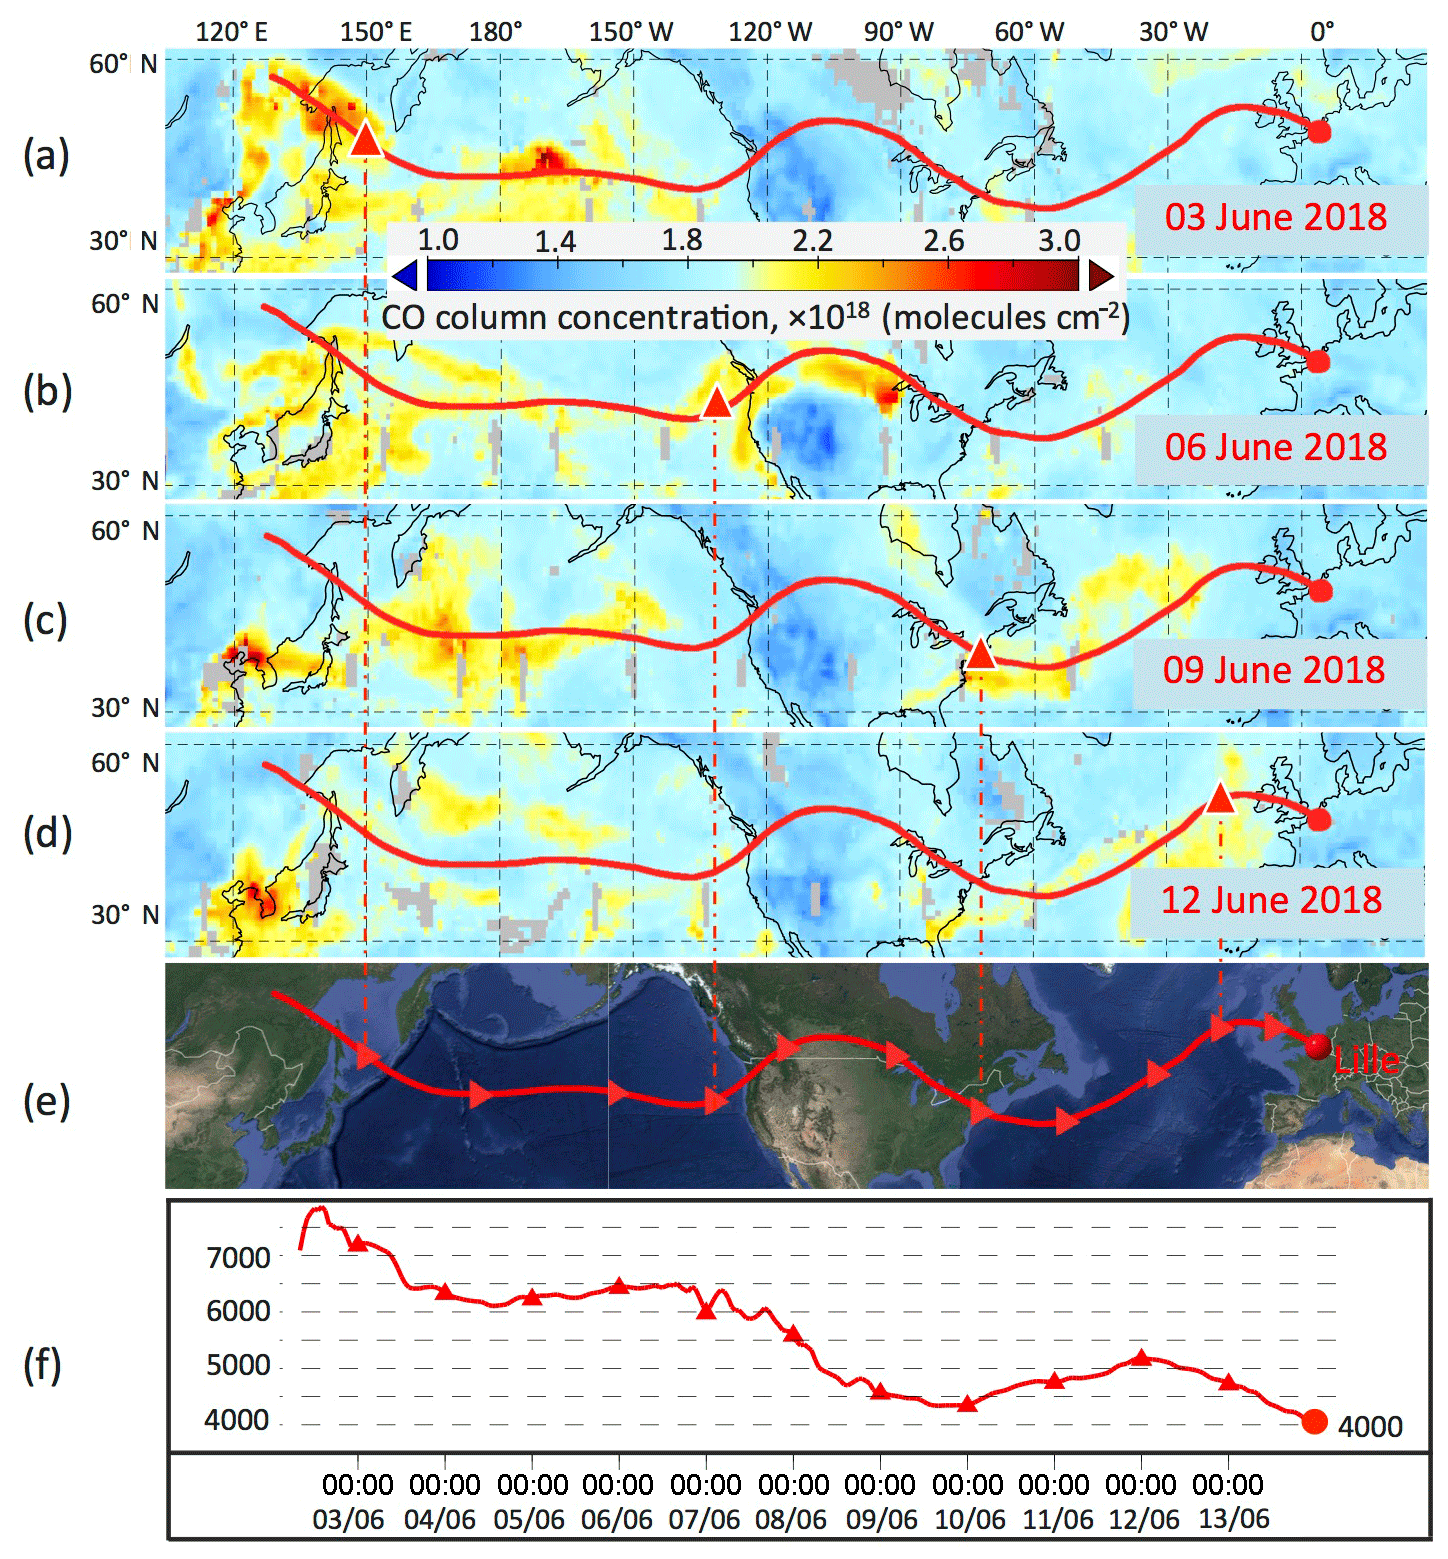
Figure 8Ten-day backward trajectories for the air mass in Lille at an altitude of 4000 m on 14 June 2018 at 00:00 UTC. Panels (a)–(d) show the trajectory pathways overlaid with CO columnar concentration maps retrieved from AIRS data. The triangles represent the location of the traced air mass on corresponding dates. Panels (e) and (f) show the trajectory and vertical propagation of air mass.
To understand the origin of this elevated layer, a 10-day back-trajectory analysis was performed for the air mass over Lille, at 4000 m, on 14 June 2018 at 00:00 UTC, using the HYSPLIT model. According to the analysis, the air mass was transported from eastern Asia (Russia and China) to North America and then over the Atlantic Ocean to Europe. Large-scale boreal fire activities were detected near the border of Russia and China in early June; thus the air mass at 4000 m could have contained fire emissions. Figure 8a–d plot the transport pathway of the air mass overlaid with the CO columnar concentration maps on 3, 6, 9 and 12 June. The CO concentration is derived from AIRS Level 3 CO products (Texeira, 2013). The propagation of the air mass is clearly coincident with the transport of CO plumes. Studies have shown that CO2, CO and CH4 are among the main products of boreal forest fires (Hao et al., 1993; Worden et al., 2013). CO originating from boreal fires is positively correlated with CH4 concentration; however, the CH4 product of AIRS is not as mature as the CO product due to the low sensitivity to CH4 in the lower troposphere, so CO is a favorable tracer of fire emissions. In Fig. 8a, intense CO plumes are detected at the origin of the trajectory, which is close to the fire activities. Hence, it is possible that the observed methane plume comes from fire emissions in eastern Asia. Aged smoke particles mixed with Asian dust particles could be the reason for the high particle depolarization ratio observed in the elevated layer.
The results presented here demonstrate the feasibility of profiling the background mixing ratios of methane in the lower troposphere using Raman lidar. The photon-counting rate in the methane Raman channel agrees with numerical simulation for typical aerosol loading and a background CH4 mixing ratio of 2 ppm, which confirms that we observe the methane Raman scattering. In our measurements we always observed enhanced concentrations of the methane inside the PBL compared to aerosol-free regions; thus analysis of methane ground sources in northern France is in our upcoming plans.
Taking Raman measurements of CH4 mixing ratio close to 2 ppm is a challenging task due to different potential interfering factors, such as leakage of the elastic signal into the Raman channel, contribution of liquid water Raman scattering and aerosol fluorescence. Measurements taken inside the clouds revealed no interference of elastic signal or Raman liquid water spectra. Estimation of aerosol fluorescence contributions is more difficult. The aerosol fluorescence at wavelengths above 440 nm was reported recently by Reichardt et al. (2017). For profiling, the authors had to integrate the fluorescence signal over the spectral range of approximately 80 nm. In our system the filter bandwidth is only 0.3 nm, so we expect the fluorescence contribution to be suppressed. The CH4 profiles are not always correlated with aerosol backscattering, which corroborates the hypothesis that, in the PBL, not aerosol fluorescence but methane is measured. However, we cannot completely exclude the fluorescence contribution. To measure and correct for it, if necessary, in future measurements we plan to introduce an additional control channel close to 393 nm, where no strong Raman lines exist and only fluorescence can be detected (Reichardt, 2014). Furthermore, an additional filter will be used to increase the rejection in 450–480 nm spectral range.
One of the main problems in the measurements presented is the long signal accumulation time, which was about 4 h in our case. A more powerful laser is needed to improve the temporal resolution of the measurements. Today, compact diode pumped lasers, with pulse energies of 60 mJ at 355 nm and 200 Hz repetition rate have become widely available (e.g., http://www.quantel-laser.com/en/products/item/q-smart-dpss-650-mj.html, last access: 20 December 2018), so it is possible to decrease the measurement time to less than 30 min. Numerous lidar technologies developed previously for H2O Raman systems can be used for the methane Raman lidar. In particular, the calibration technique based on the tungsten lamp spectrum can provide absolute values of methane mixing ratio from first principles (Venable et al., 2011).
Raman lidars for CH4 monitoring cannot, of course, compete with airborne DIAL systems in sensitivity and accuracy, especially when column concentrations are considered. However, when one needs to evaluate the vertical profile of methane concentrations through the boundary layer, the Raman lidar may have some advantages. In particular, the IR DIALs can profile methane only in the region loaded with aerosol, while Raman lidar is also capable of profiling in the aerosol-free atmosphere. Our results demonstrate that conventional Mie–Raman lidars designed for aerosol and the water vapor observations can be relatively easily modified for methane observations. Such ground-based lidars can be also used for ground validation activities during the upcoming MERLIN mission.
Lidar measurements in Lille can be accessed under the following link: http://loa-ptfi.univ-lille1.fr/lidar/calendars/cal_2018_lillelilas.php (last access: 3 January 2019)
The authors declare that they have no conflict of interest.
The authors are very grateful to the labex CaPPA for
supporting this study. The CaPPA project (Chemical and Physical Properties of
the Atmosphere) is funded by the French National Research Agency (ANR)
through the PIA (Programme d'Investissement d'Avenir) under contract
“ANR-11-LABX-0005-01” and by the Regional Council “Nord-Pas de Calais” and
the “European Funds for Regional Economic Development” (FEDER).
Edited by: Vassilis Amiridis
Reviewed by: Sergei Bobrovnikov and one anonymous referee
Ansmann, A., Riebesell, M., Wandinger, U., Weitkamp, C., Voss, E., Lahmann, W., and Michaelis, W.: Combined Raman elastic-backscatter lidar for vertical profiling of moisture, aerosols extinction, backscatter, and lidar ratio, Appl. Phys. B, 55, 18–28, 1992.
Avila, G., Fernidndez, J. M., Tejeda, G., and Montero, S.: The Raman spectra and cross-sections of H20, D20, and HDO in the OH/OD stretching regions, J. Mol. Spectr., 228, 38–65, 2004.
Baray, S., Darlington, A., Gordon, M., Hayden, K. L., Leithead, A., Li, S.-M., Liu, P. S. K., Mittermeier, R. L., Moussa, S. G., O'Brien, J., Staebler, R., Wolde, M., Worthy, D., and McLaren, R.: Quantification of methane sources in the Athabasca Oil Sands Region of Alberta by aircraft mass balance, Atmos. Chem. Phys., 18, 7361–7378, https://doi.org/10.5194/acp-18-7361-2018, 2018.
Bovensmann, H., Burrows, J. P., Buchwitz, M., Frerick, J., Noël, S., Rozanov, V. V., Chance, K. V., and Goede, A. H. P.: SCIAMACHY – Mission objectives and measurement modes, J. Atmos. Sci., 56, 127–150, 1999.
Etminan, M., Myhre, G., Highwood, E., and Shine, K.: Radiative forcing of carbon dioxide, methane, and nitrous oxide: A significant revision of the methane radiative forcing, Geophys. Res. Lett., 43, 12614–12623, https://doi.org/10.1002/2016GL071930, 2016.
Hao, W. M. and Ward, D. E.: Methane production from global biomass burning, J. Geophys. Res.-Atmos., 98, 20657–20661, 1993.
Heaps, W. S. and Burris, J.: Airborne Raman lidar, Appl. Opt., 35, 7128–7135, 1996.
Houston, J. D., Sizgoric, S., Ulitsky, A., and Banic, J.: Raman lidar system for methane gas concentration measurements, Appl. Opt., 25, 2115–2121, 1986.
Inaba, H. and Kobayasi, T.: Laser-Raman Radar – Laser-Raman scattering methods for remote detection and analysis of atmospheric pollution, Opto-Electronics, 4, 101–123, 1972.
IPCC: Climate Change 2013: The Physical Science Basis, Contribution of Working Group I to the Fifth Assessment Report of the Intergovernmental Panel on Climate Change, Cambridge University Press, Cambridge, United Kingdom and New York, NY, USA, 2013.
Kavitha, M. and Nair, P. R.: Non-homogeneous vertical distribution of methane over Indian region using surface, aircraft and satellite based data, Atmos. Environ., 141, 174–185, 2016.
Kovalev, V. A. and Eichinger, W. E.: Elastic lidar: theory, practice, and analysis methods, Wiley-Interscience, New York, 2004.
Kuze, A., Suto, H., Nakajima, M., and Hamazaki, T.: Thermal and near infrared sensor for carbon observation Fourier-transform spectrometer on the Greenhouse Gases Observing Satellite for greenhouse gases monitoring, Appl. Opt., 48, 6716–6733, 2009.
Müller, D., Mattis, I., Tatarov, B., Noh, Y. M., Shin, D. H., Shin, S. K., Lee, K. H., Kim, Y. J., and Sugimoto, N.: Mineral quartz concentration measurements of mixed mineral dust/urban haze pollution plumes over Korea with multiwavelength aerosol Raman-quartz lidar, Geophys. Res. Let., 37, L20810, https://doi.org/10.1029/2010GL044633, 2010.
Penney, C. M., Peters, R. L. S., and Lapp, M. : Absolute rotational Raman cross sections for N2, 02, and CO2, J. Opt. Soc. Am., 64, 712–716, 1974.
Reichardt, J.: Cloud and aerosol spectroscopy with Raman lidar, J. Atmos. Ocean. Tech., 31, 1946–1963, 2014.
Reichardt, J., Leinweber, R., and Schwebe, A.: Fluorescing aerosols and clouds: investigations of co-existance, Proceedings of the 28th ILRC, 25–30 June, Bucharest, Romania, 2017.
Refaat, T. F., Ismail, S., Nehrir, A. R., Hair, J. W., Crawford, J. H., Leifer, I., and Shuman, T.: Performance evaluation of a 1.6 µm methane DIAL system from ground, aircraft and UAV platforms, Opt. Expr., 21, 30415–30432, 2013.
Riris, H., Numata, K., Wu, S., Gonzalez, B., Rodriguez, M., Scott, S., Kawa, S., and Mao, J.: Methane optical density measurements with an integrated path differential absorption lidar from an airborne platform, J. Appl. Remote Sens., 11, 034001–034019, 2017.
Rolph, G., Stein, A., and Stunder, B.: Real-time Environmental Applications and Display system: READY, Environ. Modell. Soft., 95, 210–228, 2017.
Stein, A. F., Draxler, R. R, Rolph, G. D., Stunder, B. J. B., Cohen, M. D., and Ngan, F.: NOAA's HYSPLIT atmospheric transport and dispersion modeling system, B. Am. Meteorol. Soc., 96, 2059–2077, 2015.
Sugimoto, N., Huang, Z., Nishizawa, T., Matsui, I., and Tatarov, B.: Fluorescence from atmospheric aerosols observed with a multichannel lidar spectrometer, Opt. Expr., 20, 20800–20807, 2012.
Texeira, A. S. T.: AIRS/Aqua L3 Daily Standard Physical Retrieval (AIRS-only) V006, Greenbelt, MD, USA, Goddard Earth Sciences Data and Information Services Center (GES DISC), https://doi.org/10.5067/Aqua/AIRS/DATA303, 2013.
Venable, D. D., Whiteman, D. N., Calhoun, M. N., Dirisu, A. O., Connell, R. M., and Landulfo, E.: Lamp mapping technique for independent determination of the water vapor mixing ratio calibration factor for a Raman lidar system, Appl. Opt., 50, 4622–4632, 2011.
Veselovskii, I., Whiteman, D. N., Korenskiy, M., Suvorina, A., and Pérez-Ramírez, D.: Use of rotational Raman measurements in multiwavelength aerosol lidar for evaluation of particle backscattering and extinction, Atmos. Meas. Tech., 8, 4111–4122, https://doi.org/10.5194/amt-8-4111-2015, 2015.
Veselovskii, I., Goloub, P., Podvin, T., Bovchaliuk, V., Derimian, Y., Augustin, P., Fourmentin, M., Tanre, D., Korenskiy, M., Whiteman, D. N., Diallo, A., Ndiaye, T., Kolgotin, A., and Dubovik, O.: Retrieval of optical and physical properties of African dust from multiwavelength Raman lidar measurements during the SHADOW campaign in Senegal, Atmos. Chem. Phys., 16, 7013–7028, https://doi.org/10.5194/acp-16-7013-2016, 2016.
Weber, A.: Raman spectroscopy of gases and liquids, Springer, New York, 1979.
Whiteman, D. N., Melfi, S. H., and Ferrare, R. A.: Raman Lidar System for Measurement of Water Vapor and Aerosols in the Earth's Atmosphere, Appl. Opt., 31, 3068–3082, 1992.
Whiteman, D. N., Veselovskii, I., Cadirola, M., Rush, K., Comer, J., Potter, J. R., and Tola, R.: Demonstrations measurements of water vapor, cirrus clouds, and carbon dioxide using a high-performance Raman lidar, J. Atmos. Ocean. Tech. 24, 1377–1388, 2007.
Worden, J., Wecht, K., Frankenberg, C., Alvarado, M., Bowman, K., Kort, E., Kulawik, S., Lee, M., Payne, V., and Worden, H.: CH4 and CO distributions over tropical fires during October 2006 as observed by the Aura TES satellite instrument and modeled by GEOS-Chem, Atmos. Chem. Phys., 13, 3679–3692, https://doi.org/10.5194/acp-13-3679-2013, 2013.
Zhao, P., Zhang, Y., Wang, L., Cao, K., Su, J., Hu, S., and Hu, H.: Measurement of tropospheric CO2 and aerosol extinction profiles with Raman lidar, Chinese Opt. Lett., 6, 157–160, 2008.