the Creative Commons Attribution 4.0 License.
the Creative Commons Attribution 4.0 License.
 | 24 Apr 2019
Development of an incoherent broadband cavity-enhanced absorption spectrometer for measurements of ambient glyoxal and NO2 in a polluted urban environment
Shuaixi Liang
Min Qin
Pinhua Xie
Wu Fang
Yabai He
Jin Xu
Jingwei Liu
Ke Tang
Fanhao Meng
Kaidi Ye
Jianguo Liu
Wenqing Liu
We report the development of an instrument for simultaneous fast measurements of glyoxal (CHOCHO) and NO2 based on incoherent broadband cavity-enhanced absorption spectroscopy (IBBCEAS) in the 438–465 nm wavelength region. The highly reflective cavity mirrors were protected from contamination by N2 purge gas. The reduction of the effective cavity length was calibrated by measuring collision-induced oxygen absorption at ∼477 nm of pure oxygen gas input with and without the N2 mirror purge gas. The detection limits of the developed system were evaluated to be 23 parts per trillion by volume (pptv, 2σ) for CHOCHO and 29 pptv (2σ) for NO2 with a 30 s acquisition time. A potential cross-interference of NO2 absorption on accurate CHOCHO measurements has been investigated in this study, as the absorption of NO2 in the atmosphere could often be several hundred-fold higher than that of glyoxal, especially in contaminated areas. Due to non-linear spectrometer dispersion, simulation spectra of NO2 based on traditional convolution simulation did not match the measurement spectra well enough. In this work, we applied actual NO2 spectral profile measured by the same spectrometer as a reference spectral profile in subsequent atmospheric spectral analysis and retrieval of NO2 and CHOCHO concentrations. This effectively reduced the spectral fitting residuals. The instrument was successfully deployed for 24 d of continuous measurements of CHOCHO and NO2 in the atmosphere in a comprehensive field campaign in Beijing in June 2017.
- Article
(5010 KB) - Full-text XML
- BibTeX
- EndNote


Glyoxal (CHOCHO) is a typical intermediary for most volatile organic compound (VOC) oxidations in the atmosphere. It plays an important role in quantifying VOC emissions, understanding VOC oxidation mechanisms and further understanding the formation of O3 and secondary organic aerosol (SOA). On a global scale, simulations show that biogenic isoprene is the largest source of glyoxal (47 % of total contributions); anthropogenic acetylene also contributes significantly to glyoxal (20 % of contributions) (Fu et al., 2008). The loss of glyoxal is mainly due to photolysis, OH and NO3 oxidation reactions, wet and dry deposition and irreversible absorption of water-soluble aerosols and clouds (Fu et al., 2008; Min et al., 2016). The ratio of glyoxal to formaldehyde, RGF, is often used as an indicator of hydrocarbon precursor speciation in contaminated areas; observations in the field can give divergent conclusions (Vrekoussis et al., 2010; Kaiser et al., 2015; DiGangi et al., 2012). Glyoxal readily undergoes heterogeneous reactions to form SOA, but the contribution to SOA has a high uncertainty (Li et al., 2016; Washenfelder et al., 2011; Volkamer et al., 2007). Therefore, accurate quantification of glyoxal is a prerequisite for studies of the source, sink and atmospheric chemistry of glyoxal.
Several technologies are currently used for measurements of glyoxal in the atmosphere, including chemical and spectroscopic methods. The common wet chemistry method is based on a derivatization reagent such as agent o-(2,3,4,5,6-pentafluorobenzyl) hydroxylamine (PFBHA), 2,4-dinitrophenylhydrazine (DNPH) or pentafluorophenyl hydrazine (PFPH), with subsequent analysis using liquid chromatography or mass spectrometry techniques (Temime et al., 2007; Ho and Yu, 2004; Munger et al., 1995; Pang et al., 2014). Some successful spectroscopic techniques for glyoxal include differential optical absorption spectroscopy (DOAS), laser-induced fluorescence (LIF) and incoherent broadband cavity-enhanced absorption spectroscopy (IBBCEAS). Long-path DOAS (LP-DOAS) was used to measure the glyoxal concentration for the first time at a total atmospheric light path of 4420 m with a detection limit of 0.1 parts per billion by volume (ppbv, 2σ) in Mexico City (Volkamer et al., 2005a). In 2008, LP-DOAS was used to measure glyoxal above the rainforest and then compared with multi-axis DOAS (MAX-DOAS), suggesting that local CHOCHO was confined to the first 500 m of the boundary layer (MacDonald et al., 2012). LIF can quantify both glyoxal and methylglyoxal with a detection limit of 2.9 pptv (2σ) in 5 min for glyoxal (Henry et al., 2012). IBBCEAS is an excellent method for measuring atmospheric trace gases. It features high sensitivity, small chemical interference and simultaneous measurement of multiple components. IBBCEAS has been rapidly developed since Fiedler et al. (2003) first described it in 2003. More recently, the technology has been successfully applied to measure a variety of trace gases (Min et al., 2016; Wang et al., 2017; Yi et al., 2016; Volkamer et al., 2015), weakly absorbed cross sections of different trace gases (Chen and Venables, 2011; Kahan et al., 2012) and aerosol extinction (Washenfelder et al., 2013). Using a xenon arc lamp as a light source, Washenfelder et al. (2008) reported the first measurement of glyoxal using the IBBCEAS technique in the laboratory with a detection limit of 58 pptv (2σ) within 1 min. Later, Thalman and Volkamer (2010) coupled CEAS hardware with a DOAS retrieval algorithm to measure glyoxal in open cavity mode with a detection limit of 19 pptv (2σ, 1 min). Coburn et al. (2014) subsequently measured the eddy covariance flux of glyoxal with LED-CE-DOAS for the first time and found that the nocturnal oxidation reaction on an ocean surface organic microlayer was a source of the oxygenated VOCs. With significant improvements, Min et al. (2016) developed an aircraft IBBCEAS instrument and used it to measure tropospheric glyoxal with a detection limit of 34 pptv (2σ) within 5 s. Table 1 compares different measurement techniques for glyoxal. Based on these technologies, Thalman et al. (2015) conducted a comprehensive instrument intercomparison campaign for glyoxal.
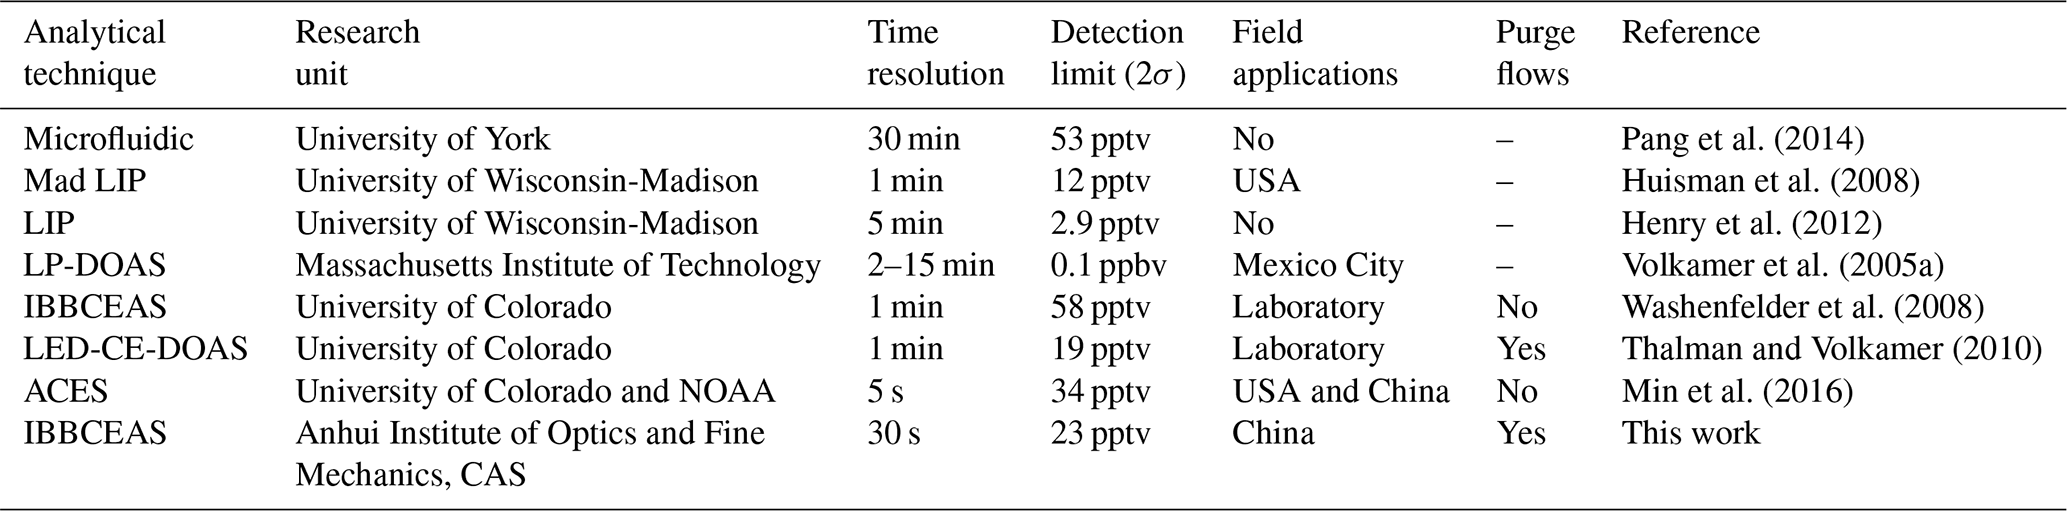
Table 1Comparison of different techniques for measuring glyoxal.
Spectral measurement techniques using broadband light sources, such as DOAS and IBBCEAS, can simultaneously observe a wide range of spectral bands during a single measurement. Thus, many contaminants can be measured concurrently. The overlap of the NO2 and glyoxal absorption bands at 438–465 nm allows us to simultaneously measure their concentrations. However, NO2 can interfere with the measurement of glyoxal, especially for high concentration of NO2 (Thalman et al., 2015). This is a key factor that needs to be considered to improve the data retrieval of glyoxal in China's highly polluted environment.
Here, we describe the development of an incoherent broadband cavity-enhanced absorption spectrometer for sensitive detection of CHOCHO and NO2 in the atmosphere. The effective length of the optical cavity with purge-gas protected mirrors was accurately calibrated based on the collision-induced oxygen (O4) absorption at 477 nm. The instrument detection limit was estimated using the Allan variance analysis. The effects of NO2 on glyoxal were evaluated via spectral simulation and measurements. The results show that using the measured NO2 reference spectrum can overcome the interference of NO2 to glyoxal due to conventional convolution methods from the uneven dispersion of the grating spectrometer. We then applied the measured reference spectrum to the retrieval of glyoxal in the same wavelength band and obtained the glyoxal concentration in heavily polluted air in China. The IBBCEAS instrument was successfully deployed during the APHH China (Air Pollution and Human Health in a Chinese Megacity) project, and we obtained the profiles of glyoxal and NO2 concentrations in Beijing's summer atmosphere during the APHH China campaign (2–26 June 2017).
2.1 Description of the IBBCEAS set-up
The IBBCEAS technology is an absorption spectroscopy technique. It improves the effective path length via multiple light reflections in an optical cavity. This leads to a significant improvement of the detection sensitivity. Our design of the IBBCEAS set-up consists of a light-emitting diode (LED) light source, a pair of off-axis parabolic mirrors, a pair of high-reflectivity cavity mirrors, Teflon perfluoroalkoxy polymer resin (PFA) optical cavity, optical band-pass filter, an optical fibre-coupled grating spectrometer and some other components. A schematic diagram of the instrument is shown in Fig. 1.
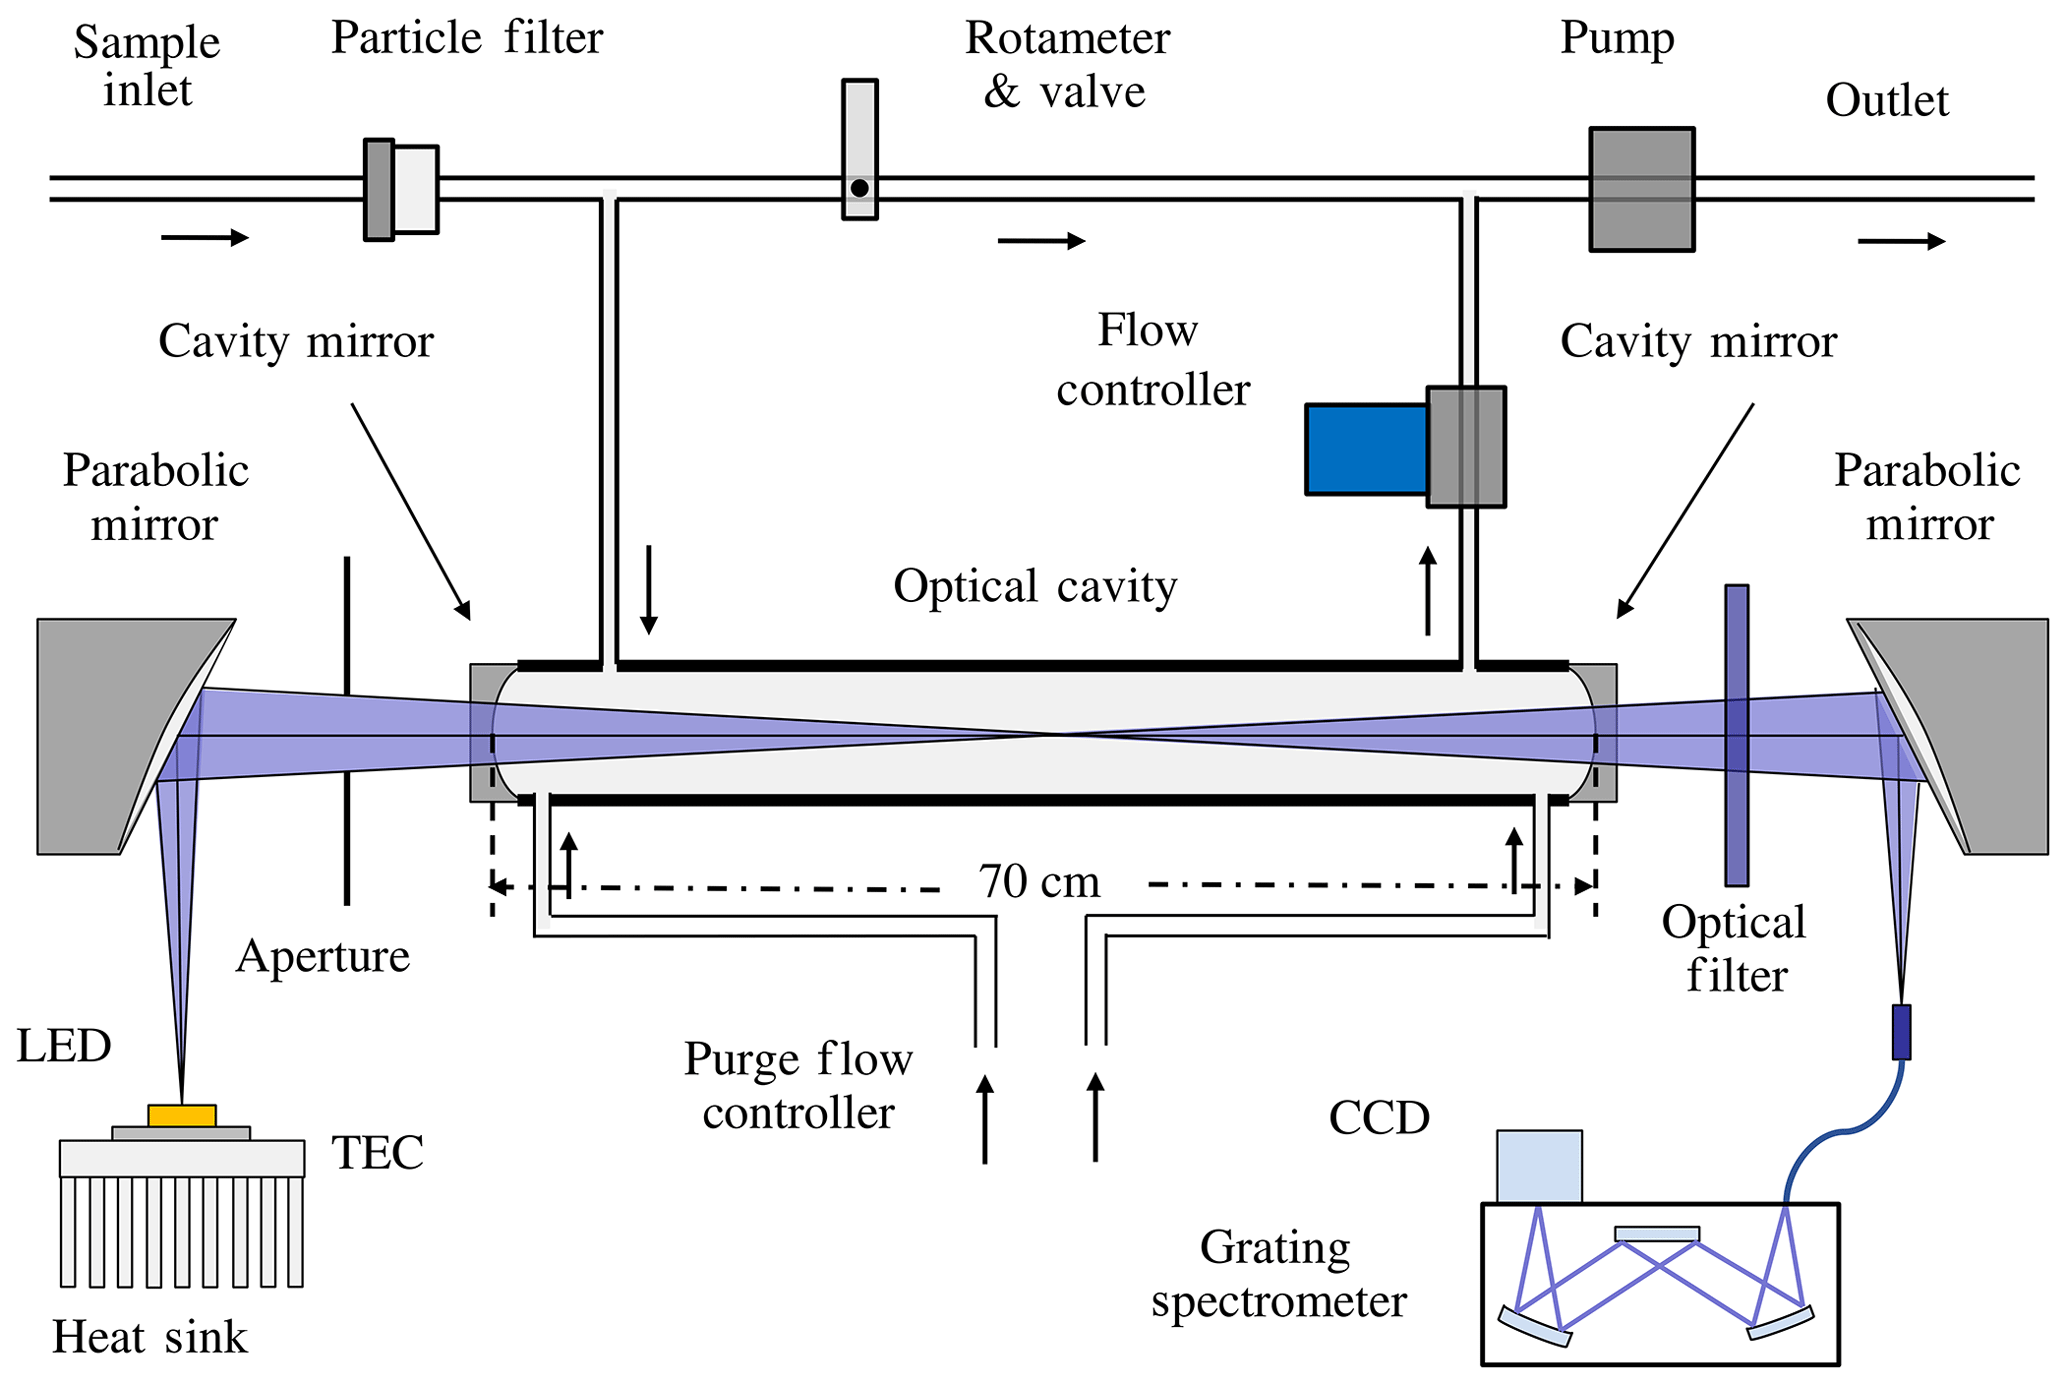
The light from a high-power blue LED (LZ1-04B2P5, LedEngin) with a peak wavelength of ∼448 nm was coupled to the optical cavity via a 90∘ off-axis parabolic mirror (Edmund Optics). The temperature of the LED was measured by a temperature sensor (PT1000) and controlled by a thermoelectric cooler (TEC) at 20 ∘C ± 0.1 ∘C to reduce the impact of temperature fluctuations on the LED. The optical cavity consisted of two 1 in. diameter mirrors (Advanced Thin Films) with 1 m radius of curvature, and the manufacturer stated that the reflectivity was greater than 99.995 % at 455 nm. Multiple reflections of light between two high-reflectivity cavity mirrors increased the effective absorption path length. The light exiting the cavity passed through an optical band-pass filter (FB450-40, Thorlabs) to eliminate stray light. It was then focused onto a 1 m optical fibre (600 µm in diameter with a numerical aperture of 0.22) by a second off-axis parabolic mirror. Finally, the other end of the fibre cable was coupled to a compact Czerny–Turner spectrometer (Ocean Optics, QE65000) with a spectral resolution of ∼0.57 nm around 450 nm. The CCD in the QE65000 spectrograph is thermally regulated at −10.0 ∘C to minimize the dark current. A 2 µm teflon polytetrafluoroethylene (PTFE) membrane filter (Tisch Scientific) was used in the front of the inlet to remove aerosols – this reduced scattering losses by particulate matter and its impacts on the effective path length (Thalman and Volkamer, 2010). Each cavity mirror was purged with a constant flow of dry nitrogen at a rate of 0.1 sL min−1 (standard litres per minute) to block their contact with air samples inside the cavity. This ensured cleanness of the cavity mirror throughout the experiment. The combination of a mass flow controller and a rotameter maintained a constant combined sample and purge gas flow rate of 1.2 sL min−1, which resulted in a gas residence time of about 16 s in the optical cavity.
2.2 Theory of IBBCEAS
The total extinction in the optical cavity includes the absorption by trace gases, Rayleigh scattering by gas molecules and Mie scattering by particles. The use of a filter in an air-sampling pipeline removes the particles. The Rayleigh scattering extinction of pure N2 is about cm−1 at 455 nm, which is comparable to the cavity loss cm−1 based on mirror reflectivity and cavity length (i.e. ). Thus, the general description of the total optical extinction αabs within the optical cavity is (Washenfelder et al., 2008):
where R(λ) is the wavelength-dependent reflectivity of the cavity mirrors, αRay(λ) is the extinction for Rayleigh scattering, I0(λ) and I(λ) are the light intensities transmitted through the optical cavity without and with the absorbing species, and deff is the effective cavity length. The mirror reflectivity R(λ) is determined from the Rayleigh scattering of N2 and He via the following equation (Washenfelder et al., 2008):
Here, and IHe(λ) are the light intensities measured when the cavity is filled with N2 and He, respectively. Terms and are the extinction caused by Rayleigh scatterings of N2 and He. Term d0 is the distance between the two cavity mirrors. Terms d0 and deff are not equal due to cavity mirror purging. Determination of the deff will be described in the Sect. 3.2. After obtaining the mirror reflectivity R(λ), the absorption coefficient αabs can be calculated according to Eq. (1). If the chamber contains a variety of gas absorbers (including NO2 and CHOCHO), then the absorption coefficient αabs will be the sum of their individual contributions and can be written via the following equation:
Here, σi(λ) and Ni are the absorption cross section and number density for the ith trace absorber, and n is the total number of absorbers. Finally, the absorber concentrations can be retrieved from the measured broadband spectrum via the DOASIS programme (Kraus, 2006).
3.1 Determination of the cavity mirror reflectivity
The cavity mirror reflectivity needs to be accurately determined for subsequent measurements of the concentrations of trace gases inside the cavity. We measure and update the value of the mirror reflectivity once every 2 d to ensure the reliability of the retrieval data. Using the difference of Rayleigh scattering cross sections between N2 and He, we calculated the mirror reflectivity R(λ) according to Eq. (2). The values of and were taken from published references (Shardanand and Rao, 1977; Sneep and Ubachs, 2005). The black and red curves in Fig. 2 were the spectrometer's signal intensity when the cavity was filled with high-purity N2 (99.999 %) and He (99.999 %). The difference in light intensity due to Rayleigh scattering by N2 vs. He is clearly visible. The shaded spectral region (438–465 nm) indicated in the figure contains the main absorption peak of glyoxal and is of primary interest for its spectral retrieval. The mirror reflectivity at the maximum absorption position of glyoxal (455 nm) is about 0.999942. The cross sections were obtained by convolving the high-resolution literature cross sections of CHOCHO (Volkamer et al., 2005b), NO2 (Voigt et al., 2002) and H2O with the nominal spectrometers' instrument function of 0.57 nm full width at half maximum (FWHM). The H2O absorption cross section was calculated with the SpectraPlot programme based on the HITRAN2012 database (Rothman et al., 2013).
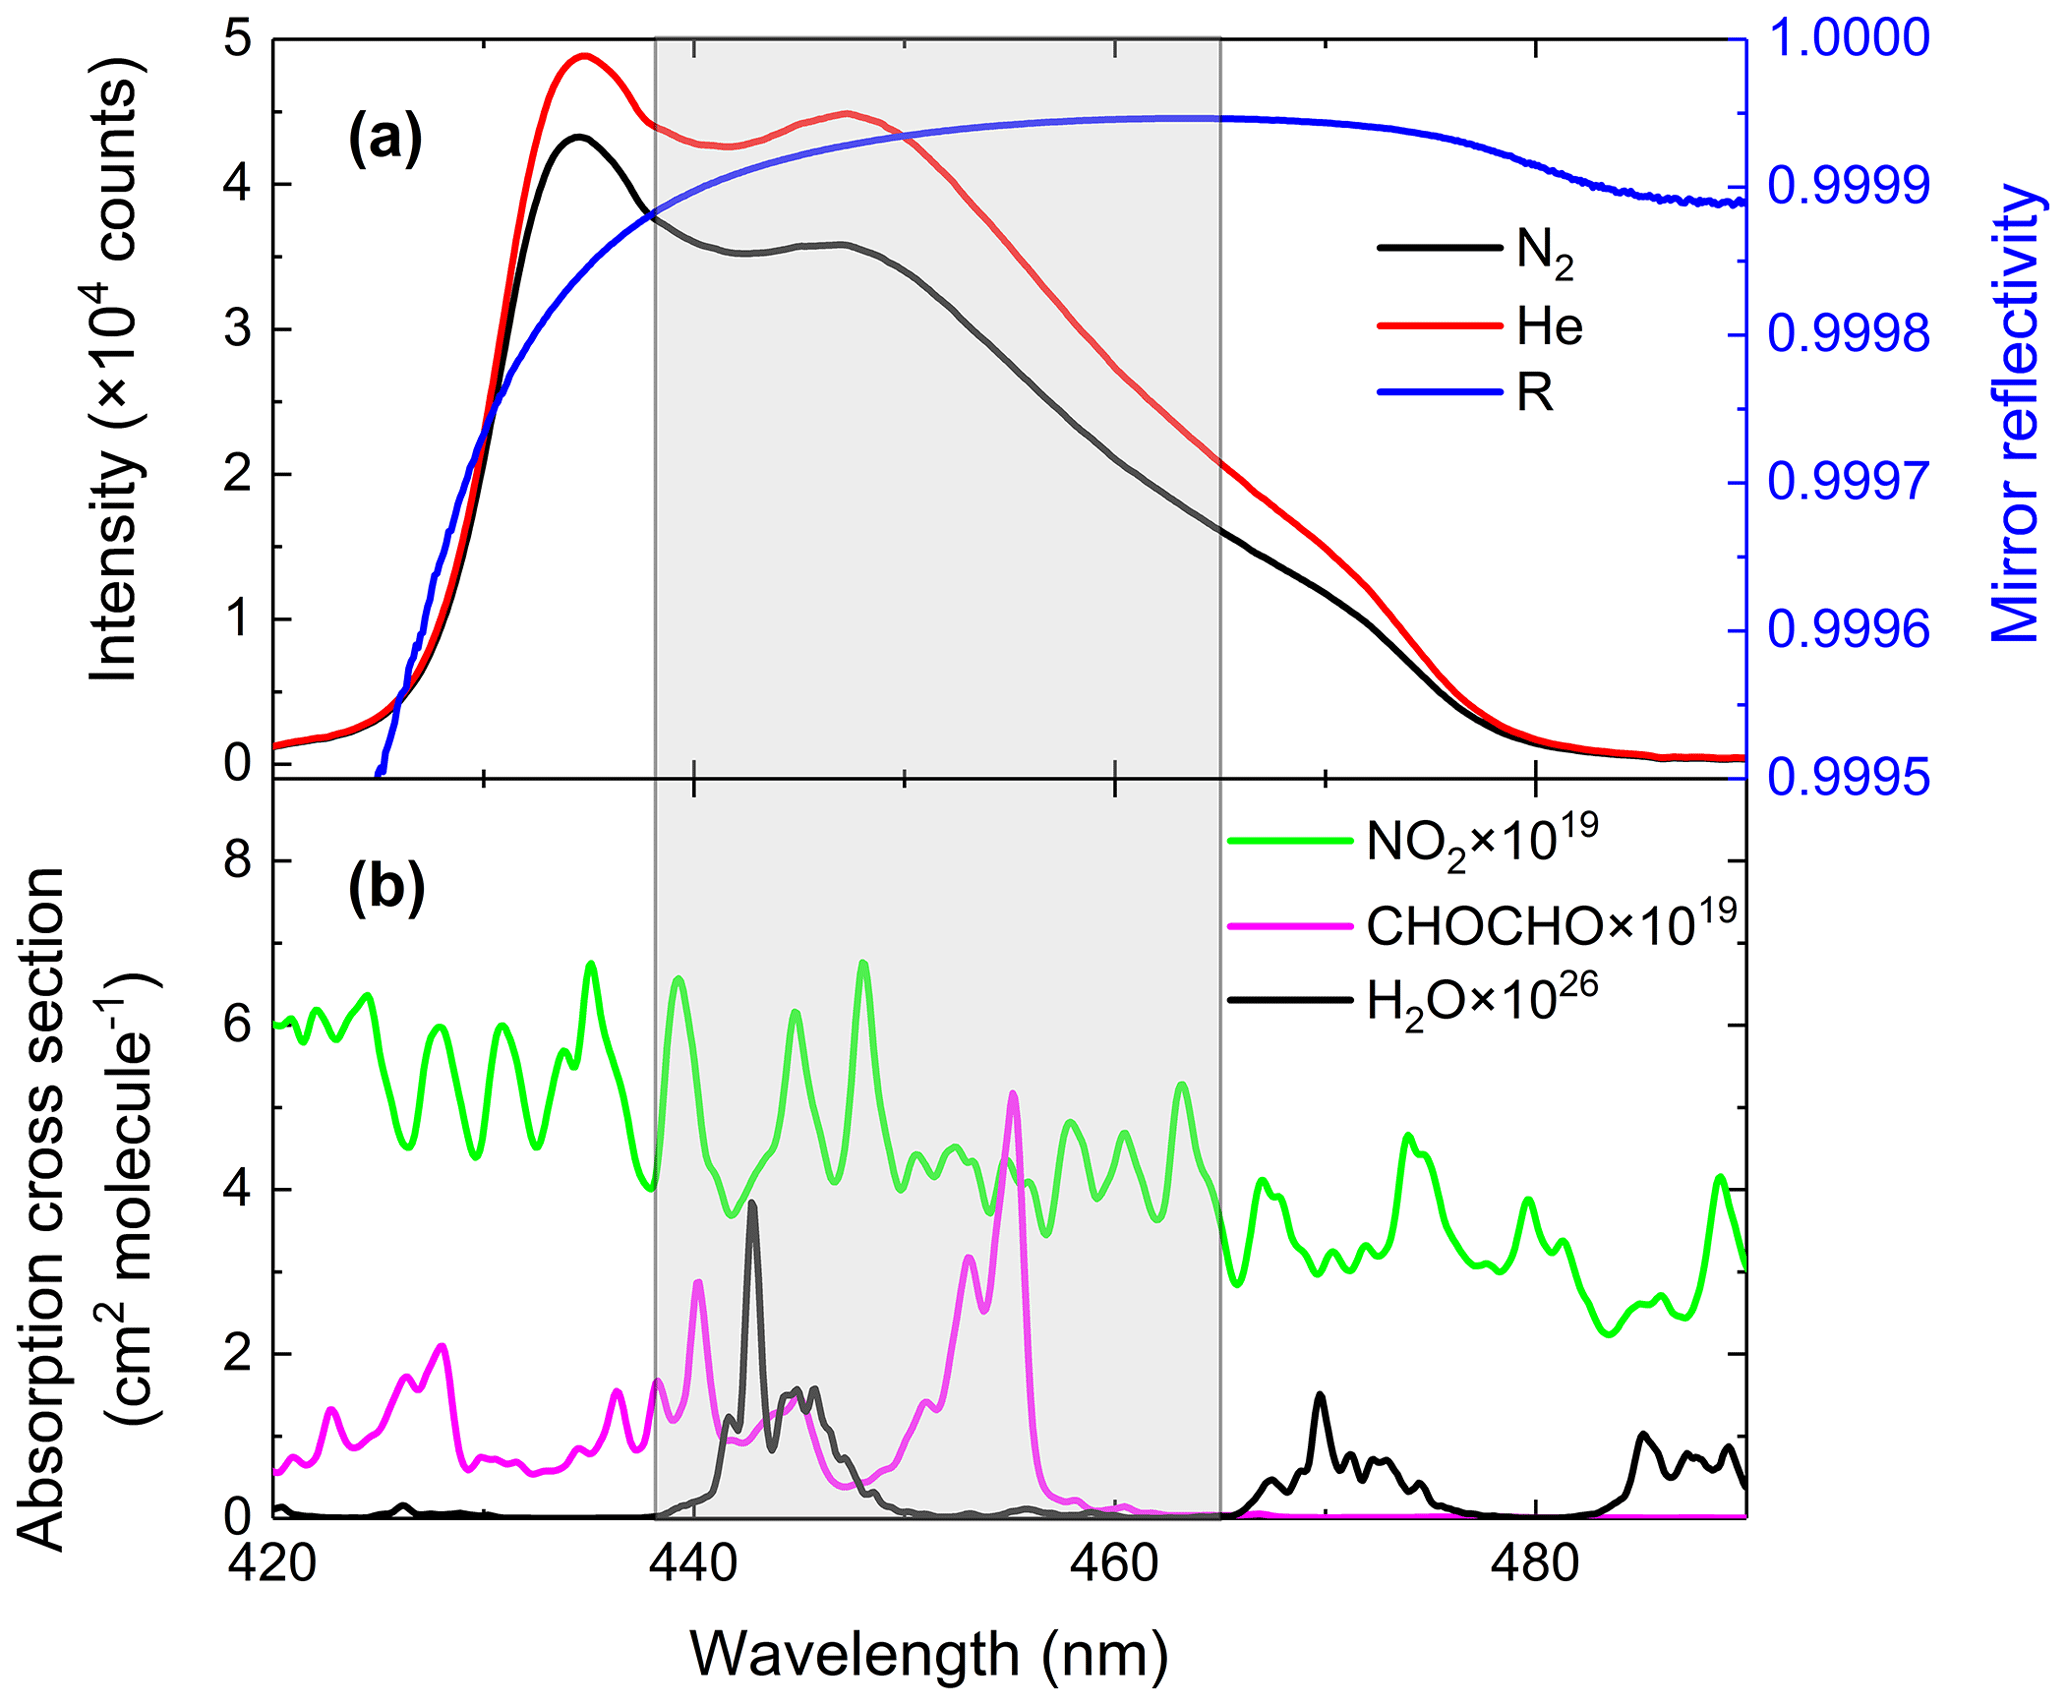
Figure 2(a) Calibration of the mirror reflectivity. The black and red curves represent spectrometer CCD traces of nitrogen and helium, respectively, with a spectral acquisition time of 30 s. The blue line is the resulting mirror reflectivity curve. (b) The green, magenta and black lines are convolution-based literature absorption cross sections of NO2, glyoxal and H2O vapour.
3.2 Calibration of the effective cavity length
Considering the intended application's environmental conditions of high-load particulate matter and high-concentration polluting gases, we used an aerosol filter to reduce particles entering the optical cavity and purged the immediate space in front of the cavity mirrors with pure N2 gas to keep the cavity mirrors clean (see Fig. 1). This purging made it difficult to accurately measure the effective cavity length. However, the effective cavity length is required for retrieving trace gas concentrations. Here, we utilized the collision-induced oxygen absorption (referred as O2–O2 or O4 absorption) (Thalman and Volkamer, 2013) at ∼ 477 nm within our operation wavelength region to quantify the effective cavity length. Pure O2 gas was introduced into the optical cavity and the O2–O2 477 nm absorptions with and without the N2 mirror purges were then measured. The O2 flow rate was 1 sL min−1 and the total N2 purge flow rate was 0.2 sL min−1. Figure 3a and b show an example of O2–O2 measurement spectrum, its model fitting, and the fit residuals. Figure 3c shows the time series of equivalent O2 concentrations when N2 mirror purge gas alternated between being on and off. A coarse estimation for the cavity length reduction factor was calculated to be 0.87 at room temperature and standard atmospheric pressure according to Eq. (4).
Here, the O4 signals were the retrieved concentrations of O4 with and without the N2 purge flows. Furthermore, we modelled the reduction factor of the effective cavity length due to purge gas to include the effect of the dilution of sample gases by purge gases inside the cavity and the fact that the measured O4 spectra were proportional to the product of [O2]×[O2] concentrations. According to the simulation results, if N2 purge gases distributed evenly to both ends of the cavity and 50 % of the total purge N2 was involved in the dilution of O2, the reduction factor for linear absorption process was 0.841, which was 3.3 % less than the coarse-estimation value of 0.87. An uncertainty of the purge N2 participating in the O2 mixture at 40 % or 60 % could cause a ∼2 % uncertainty in the cavity length reduction factor. In this experiment, d0 was 70.0 cm and the calculated deff was 58.9 cm.
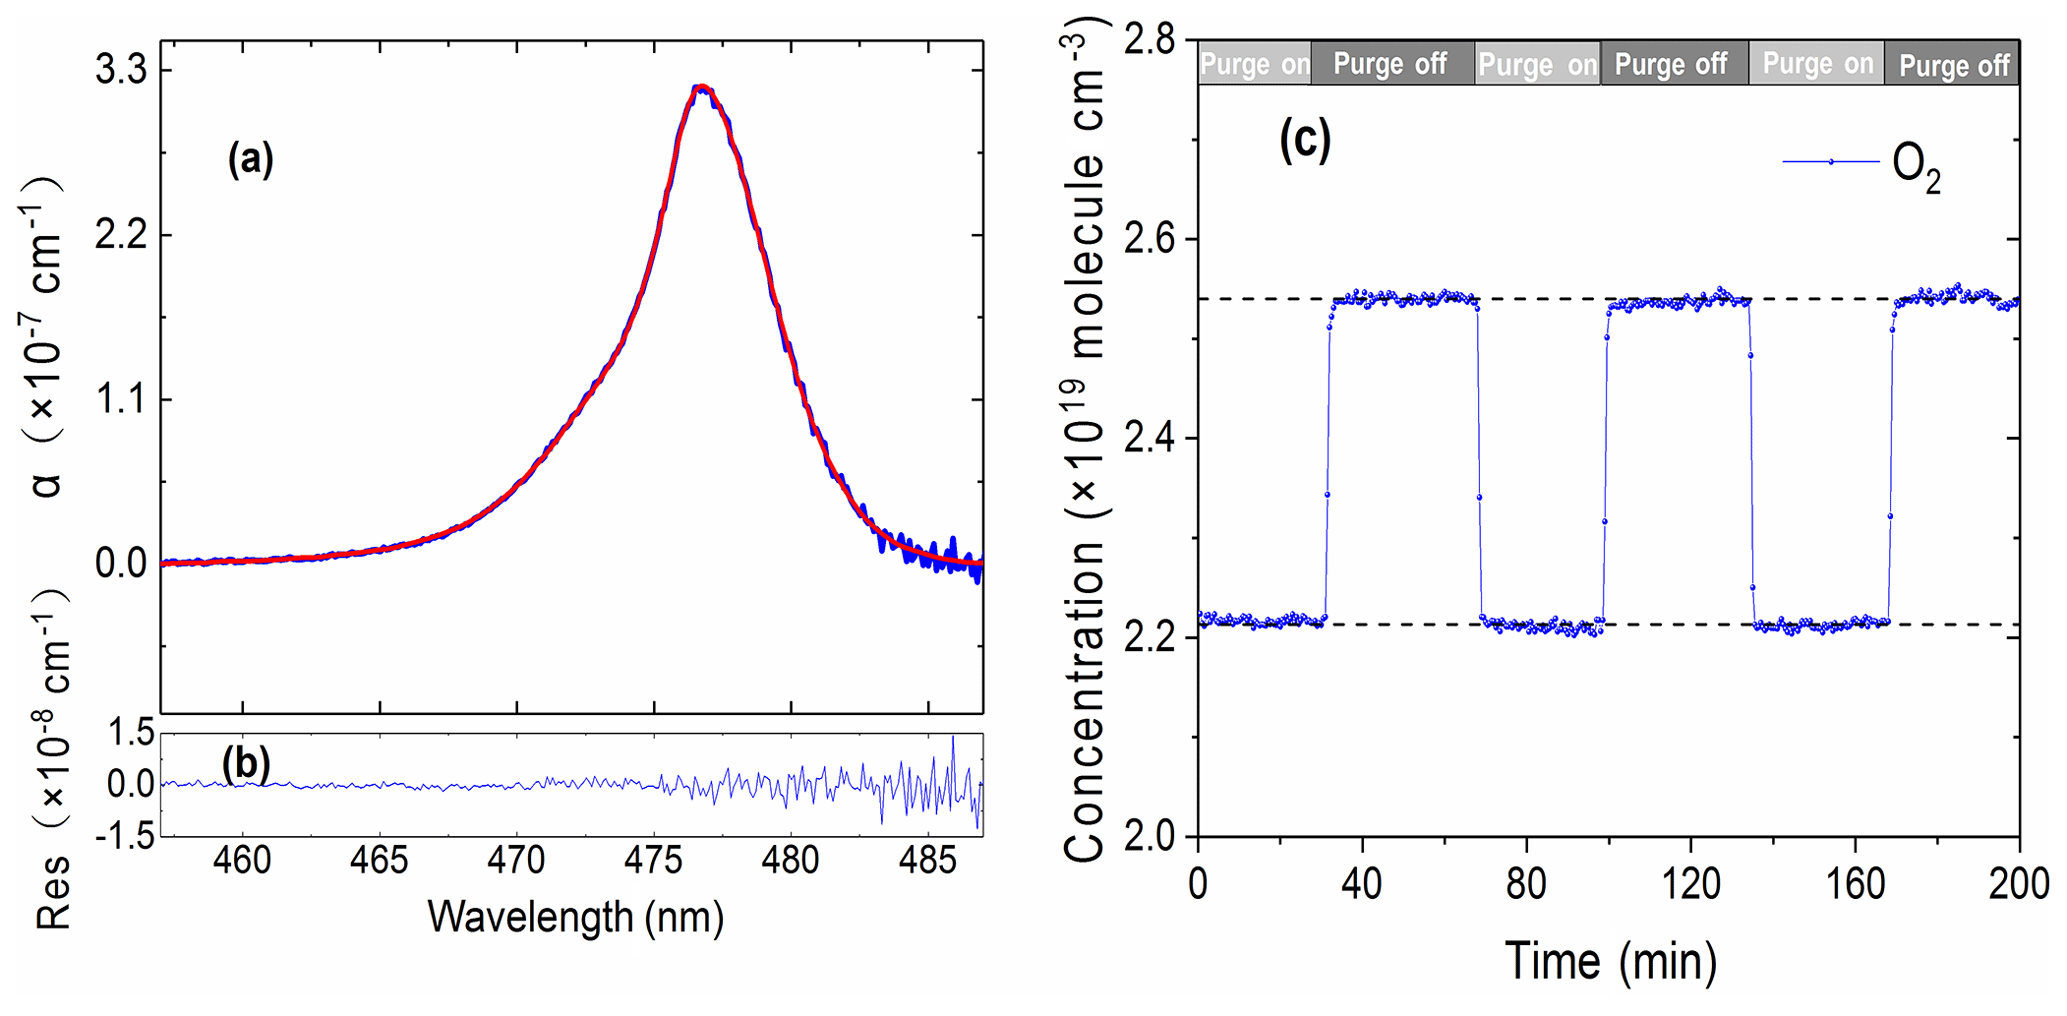
Figure 3(a) Example of retrieved and fitted absorption spectrum of O4. The blue line is the measured spectrum and the red line is the fitted spectrum of O4. (b) Fit residuals and (c) the time series of equivalent O2 concentrations when N2 purge gas alternated between being on and off.
3.3 Instrument stability and detection limit
The stability of the system affects its detection sensitivity. An ideal stable system can theoretically achieve an extremely high sensitivity by averaging measurements over a long period of time. However, there are practical considerations that limit this to a certain time range (Werle et al., 1993). For an IBBCEAS system, its stability is mainly affected by the mechanical drifts of the system and the change in the intensity and central wavelength emission of the light source due to temperature variations.

Figure 4Evaluation of the instrument performance. Panels (a) and (b) are the time series of NO2 and CHOCHO with 3 s acquisition time. Panels (c) and (d) show the histogram analyses of the measurements of NO2 and CHOCHO. Panels (e) and (f) are Allan deviation plots for measurements of NO2 and CHOCHO.
We used two methods to describe the performance of the system: distribution analysis and Allan variance analysis of a large number of measurements. For more than 8 h, 10 000 spectra were continuously acquired with the optical cavity filled with dry nitrogen. As the cavity was free of any NO2 and CHOCHO, these measurements reveal the fluctuations around zero concentration. The acquisition time of each spectrum was 3 s (which combined 10 spectrometer CCD traces with an exposure time of 300 ms each). The concentrations of NO2 and CHOCHO time series (Fig. 4a and b) were obtained by retrieving the spectral measurements. The histograms (Fig. 4c and d) were constructed from this data (Fig. 4a and b). The standard deviation (σGaussian) and mean value (μ) were calculated from the Gaussian distributions of the histograms for each gas. The mean value was an offset from the expected zero and was considered to be a residual “background”. The limit of detection (LOD) can be defined as Eq. (5) from analytical chemistry and this method was also commonly used in cavity-enhanced systems to evaluate instrument performance (Thalman et al., 2015; Fang et al., 2017).
According to Eq. (5), the detection limits (with a 3 s acquisition time) for NO2 and CHOCHO were calculated to be about 0.094 ppb (2σ) and 0.058 ppb (2σ).
Allan variance analysis has been also a convenient way to describe the stability and detection limit of a system as a function of averaging time. We used Allan variance analysis to characterize the overall stability of our system and to determine the optimum averaging time and predict the detection limit of the system. The above-mentioned 10 000 spectral concentration values were divided into M groups – each containing N values (N=1, 2, …, 2000; ). The average of N values is denoted by yi (), and the corresponding averaging time is s. Since each spectrum was measured in the optical cavity filled with dry nitrogen, the yi values contain only measurement noise as a function of averaging times (Langridge et al., 2008). The Allan variance and standard deviation of NO2 and CHOCHO concentrations are calculated according to Eqs. (6) and (7), as shown in Fig. 4e and f. The Allan deviation initially decreases with a gradient −0.5 as averaging time increases, before it starts to gradually increase towards a longer averaging time. The optimum integration time (210 s for CHOCHO) of the instrument is around the minimum of Allan deviation. A further increase of the integration times yield no more decrease in the Allan deviation due to system drift. For a total acquisition time of 3 s, the detection limits (standard deviation) of NO2 and CHOCHO are 0.083 and 0.052 ppbv (2σ). This result is consistent with LODexp (0.094 and 0.058 ppbv). By increasing the spectral averaging time to 30 s (which combined 100 spectrometer CCD traces with an exposure time of 300 ms each), the NO2 and CHOCHO detection limits (standard deviation) were reduced to 29 pptv (2σ) and 23 pptv (2σ). To capture the rapid variation of CHOCHO in the field,the time resolution of the IBBCEAS instrument was typically set to 30 s. During field measurements, the system drift was managed by frequently measuring the I0 spectrum and stabilizing the temperature of the system.
In the above formulas, yi(tavg) is the averaging concentration of the ith group. Term μ is the average concentration over the entire measurement period.
3.4 Sampling loss of glyoxal and measurement of glyoxal sample gas
In order to obtain a stable concentration of glyoxal, we used a mass flow controller to allow the quantitative high-purity nitrogen through the trap containing solid glyoxal at atmospheric pressure and at −72 ∘C. The sample stream out of the glyoxal trap was further diluted with dry high-purity nitrogen in a sampling bag (PFA) before entering the inlet of the IBBCEAS.
3.4.1 Sampling tube loss of glyoxal
We measured the glyoxal sample gas in the sampling bag alternately using 3 m and 10 m sampling tubes (PFA) at a flow rate of 1 L min−1 to study the loss of CHOCHO in the sampling tube. The experimental results showed that sampling tube length has no obvious impact on glyoxal loss (Fig. 5). This is consistent with previous findings (Min et al., 2016).
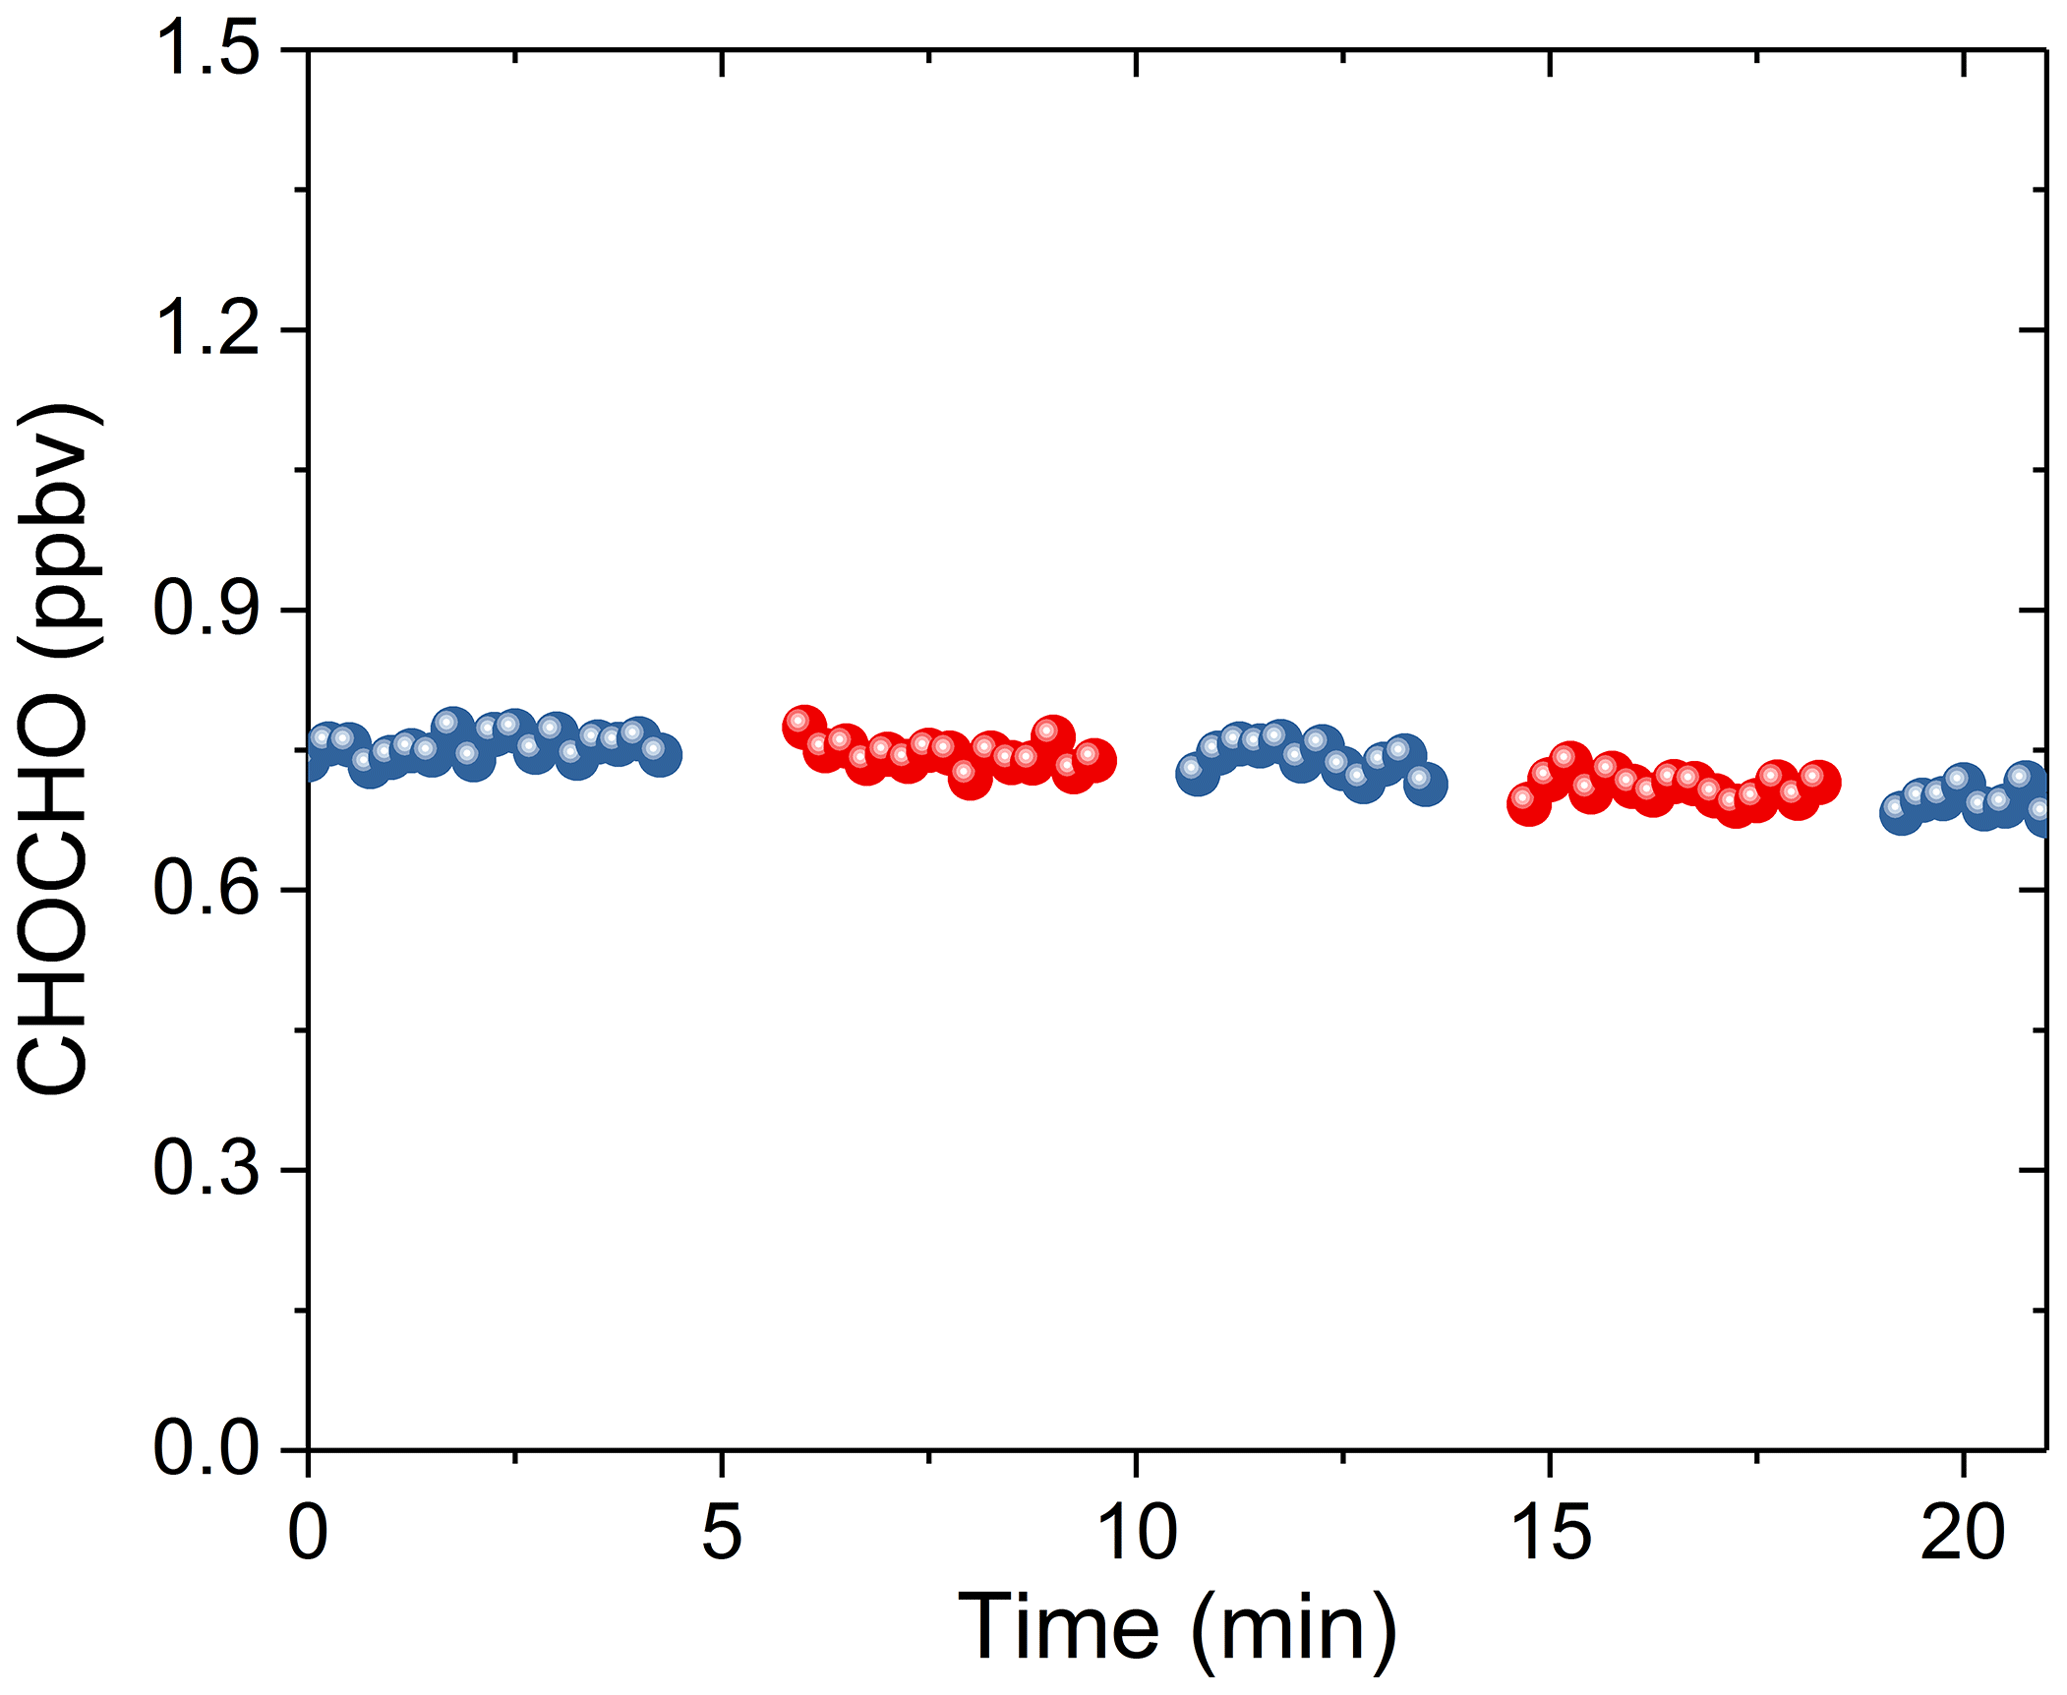
Figure 5Measurements of CHOCHO loss in the sampling tube. Blue dots correspond to the measured CHOCHO with the extra 3 m PFA inlet tube. Red dots correspond to the measured CHOCHO with the extra 10 m PFA inlet tube.
3.4.2 Measurements of CHOCHO standard additions
The high concentration of glyoxal was diluted several times in proportion to obtain the concentration time series as shown in Fig. 6a. The last five low-concentration gradients in Fig. 6a are diluted proportionally by the first maximum concentration gradient. Figure 6b shows the average of these concentration gradients and the normalized mixing ratios, with high linearity (R2=0.9996). Here, the normalized mixing ratio is calculated based on the dilution flows. The intercept value of −2.4 ppbv may be due to the loss of glyoxal onto the surfaces exposed to the gas samples during the experiment.
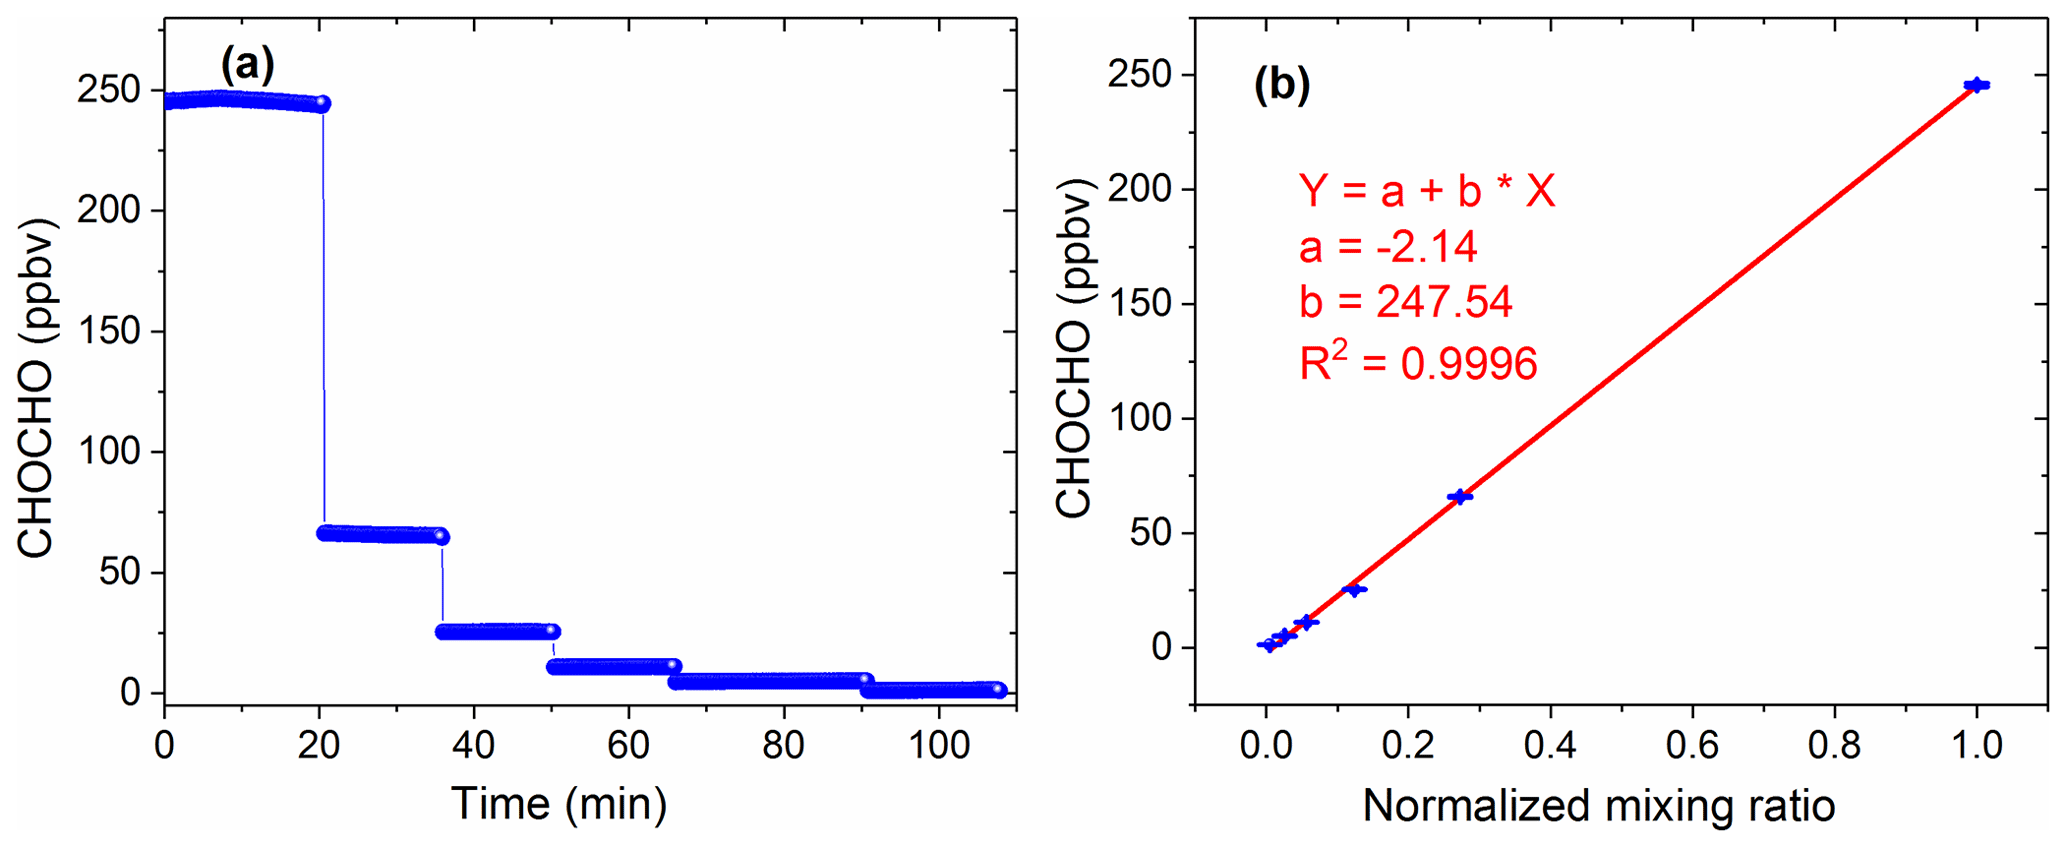
Figure 6Measurement of glyoxal sample gas. (a) Different concentrations of CHOCHO measured by IBBCEAS. Panel (b) shows the correlation between the average of these concentration gradients and the normalized mixing ratio.
3.5 Interference from NO2 and spectral fitting
Both the glyoxal and NO2 have absorption bands in the same wavelength region as shown in Fig. 2. Therefore, it is important to select suitable absorption features for their retrieval to reduce cross-interferences. Various factors, such as the performance of the instrument (e.g. the intensity wavelength range of the LED light source, the mirror reflectivity, and the spectrometer resolution), the absorption strength of the gas, the concentration level in the actual atmosphere, and the correlation between the absorption features of different gas species in the same wavelength region should be considered to obtain the best-fitting wavelength interval. Figure 7 shows the correlation matrix of absorption cross sections of CHOCHO and NO2 for a range of fitting intervals starting between 429 and 448 nm and ending between 457 and 475 nm. We hope to find an optimal fit interval with minimal correlation (Pinardi et al., 2013). In this paper, the retrieval band of glyoxal and NO2 is finally 438–465 nm.
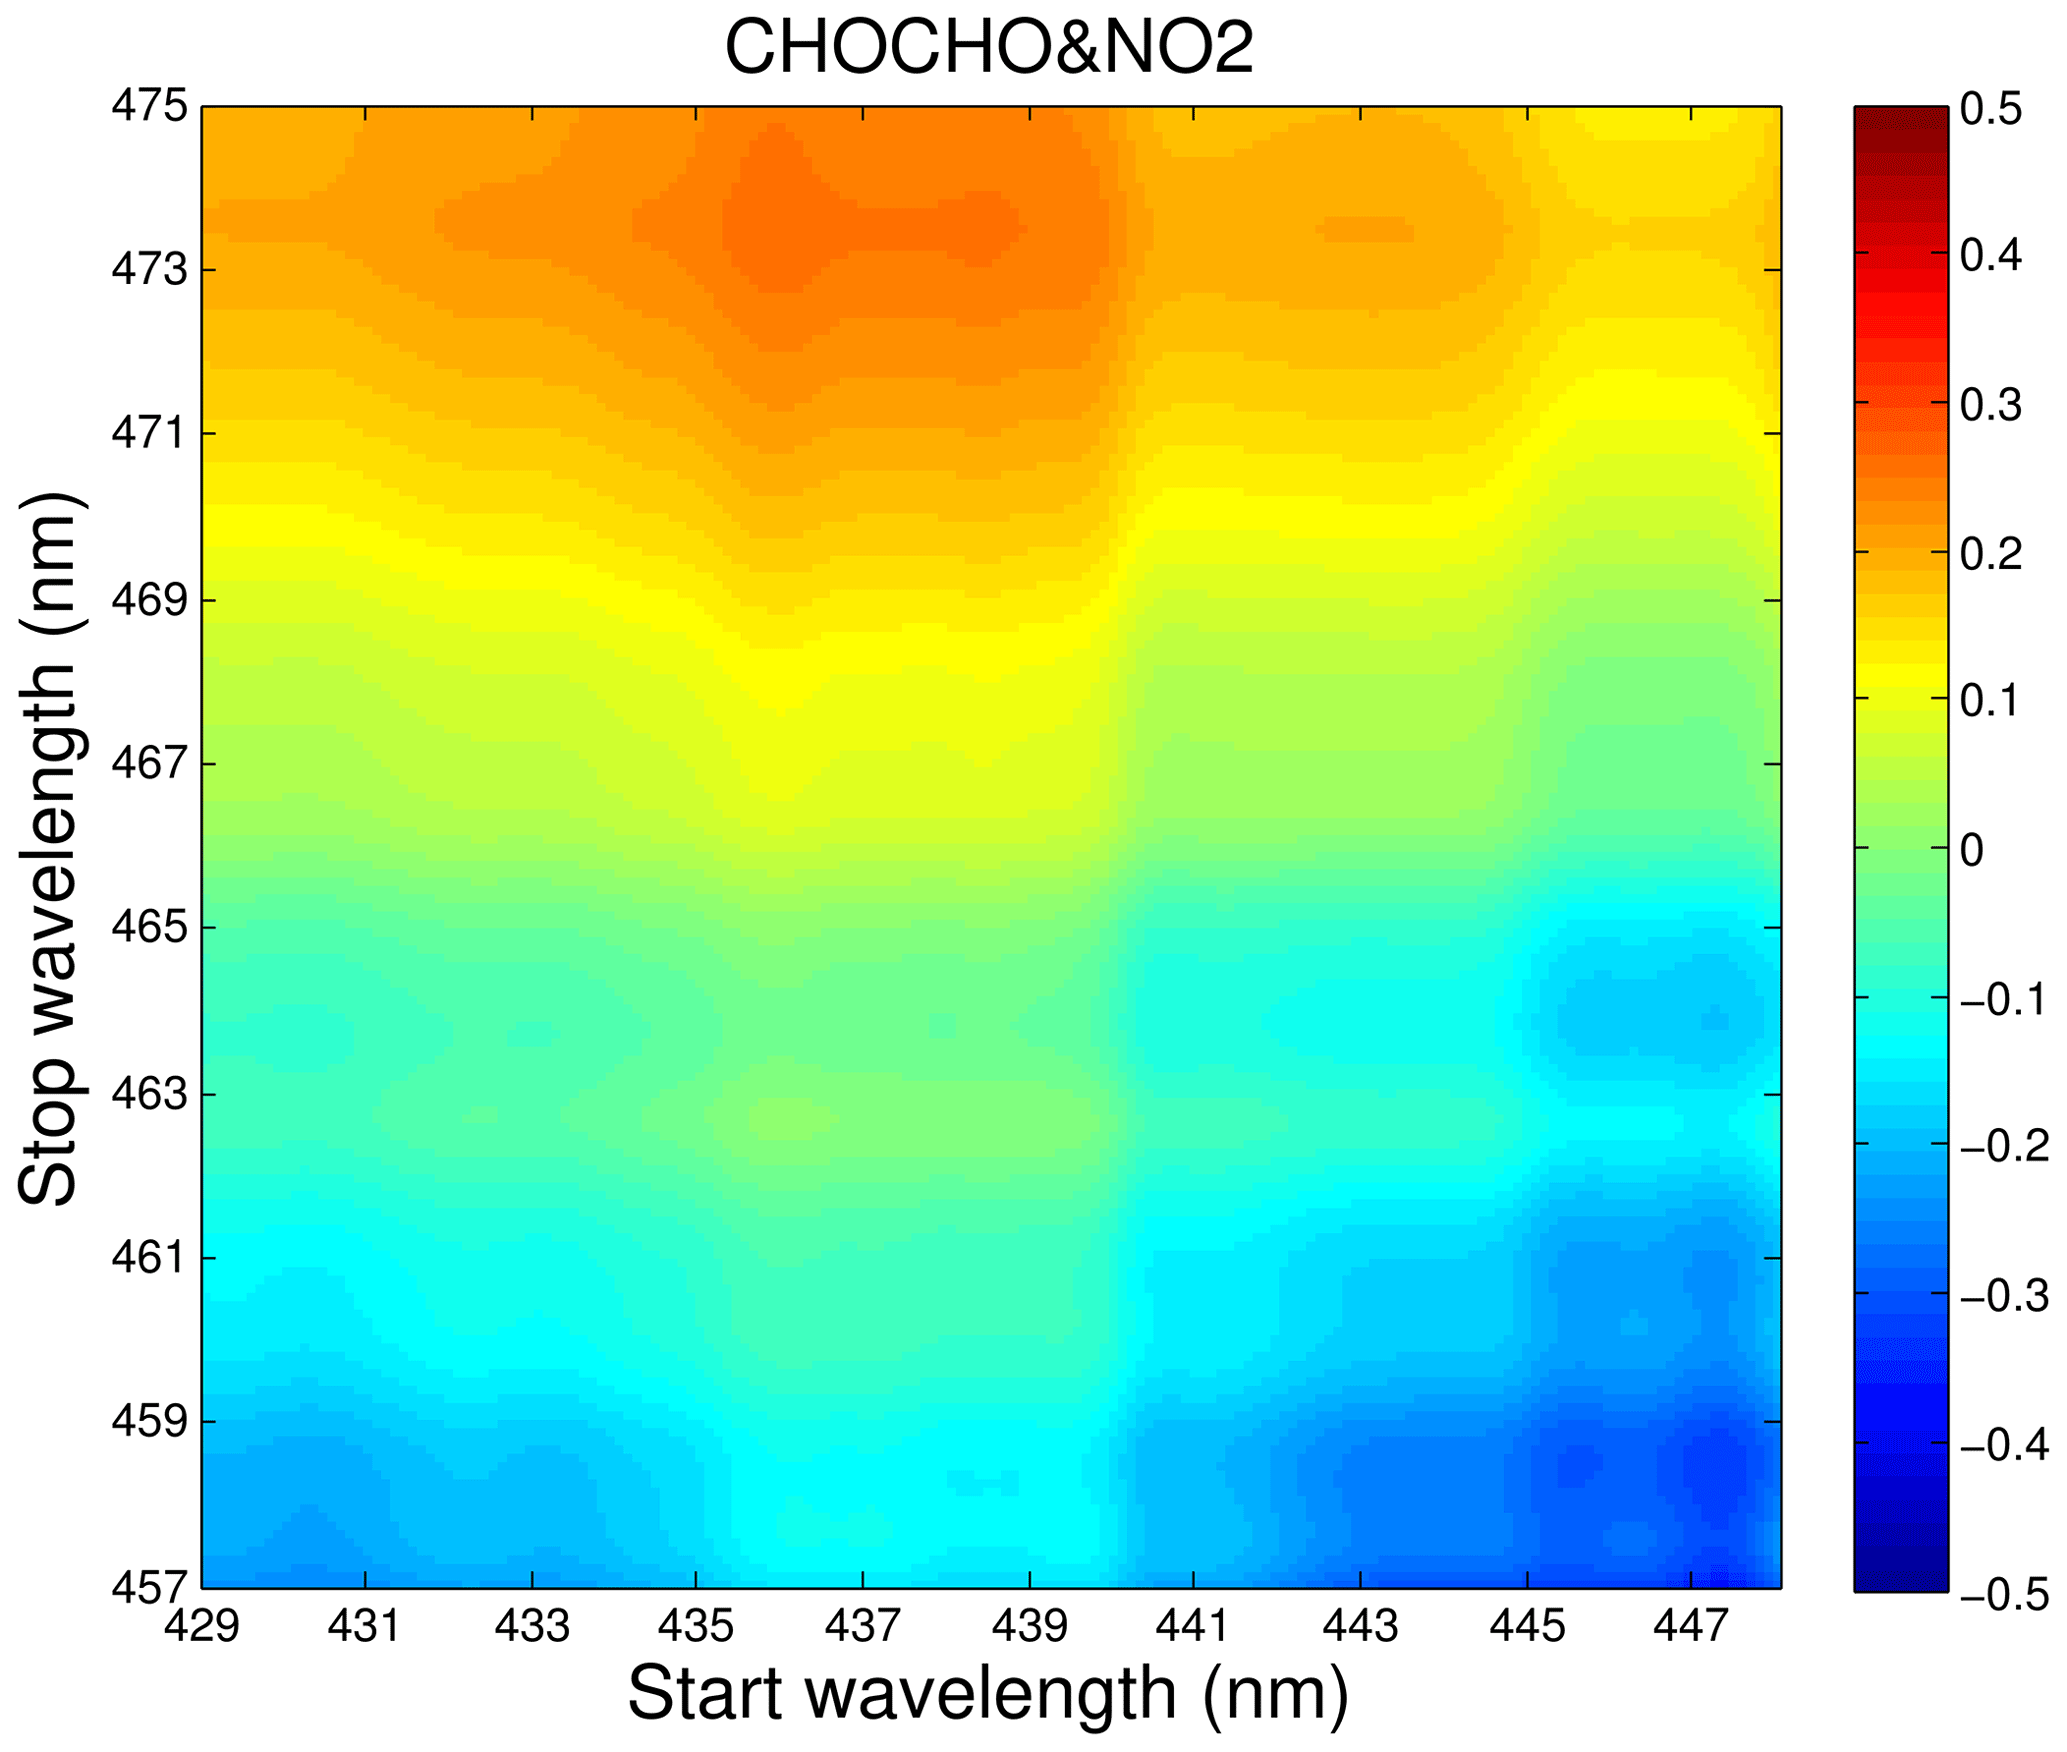
Figure 7Correlations matrix of absorption cross sections of CHOCHO and NO2 for different wavelength intervals in the 429–475 nm wavelength range.
When the concentration of NO2 exceeds ∼12 ppbv in the actual atmosphere, the absorption due to NO2 is more than 100-fold higher than that due to a typical 0.1 ppbv glyoxal in the atmosphere. The concentration of NO2 in the atmosphere of polluted urban areas in China could reach tens or even hundreds of ppbv (Qin et al., 2009). Concurrently, the accumulation of NO2 at night further challenges accurate glyoxal measurements. Therefore, accurate data analysis of the NO2 absorption contributions became critical to reducing its impact on the determination of the glyoxal absorption and concentration. For modelling of measurement spectra, one common approach was to first determine a nominal spectrometer resolution profile as the instrumental function and then the literature reference spectrum was convoluted with the instrumental function of the spectrometer. However, we noticed that the grating spectrometer had non-uniform dispersions. We measured the wavelength dependence of the grating spectrometer's resolution by using narrow atomic emission lines of low-pressure Hg, Kr and Zn lamps. These results were summarized in the Table 2. The non-uniform dispersions make spectral modelling less accurate. Subsequently, inaccurate modelling makes it difficult to overcome cross-interference of strongly absorbed interference gases with weakly absorbed gases of interest within the same wavelength region. A more reliable approach we used to obtain NO2 reference spectra was to make a direct measurement of known concentrations of NO2 standard gases with the spectrometer and further calibrate with the convolved literature reference spectrum. Samples of NO2 in N2 were prepared by flow dilution from a standard cylinder containing 5 ppm NO2 in N2. We verified the measured NO2 reference spectrum and the convolved literature NO2 reference spectrum by retrieval of the same NO2 spectra. The difference was about 1.4 %.
Table 2Wavelength dependence of the grating spectrometer's resolution.
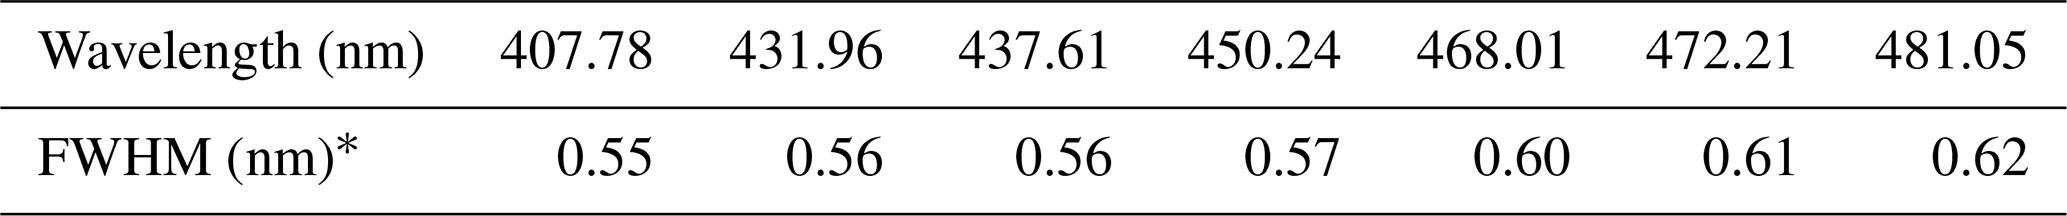
∗ The full width at half maximum (FWHM) values were determined from the emission line width measurements of low-pressure Hg, Kr and Zn lamps.
3.5.1 Residual structure from NO2 fitting
For our application, inaccurate NO2 fitting produces a large residual structure, especially in the case of high concentrations of NO2 (see Fig. 8). Figure 8 shows the variation characteristics of fit residuals from fitting different concentrations of standard NO2 when using the convolution-based NO2 reference spectrum. As is clear from Fig. 8, there is a similar residual structure in the fit residual and it increases with increasing NO2 concentration. Such a residual structure will have a disastrous effect on the retrieval of glyoxal in the atmosphere. Figure 9 shows that the standard deviation of these fit residuals has a good dependence on the NO2 concentration.
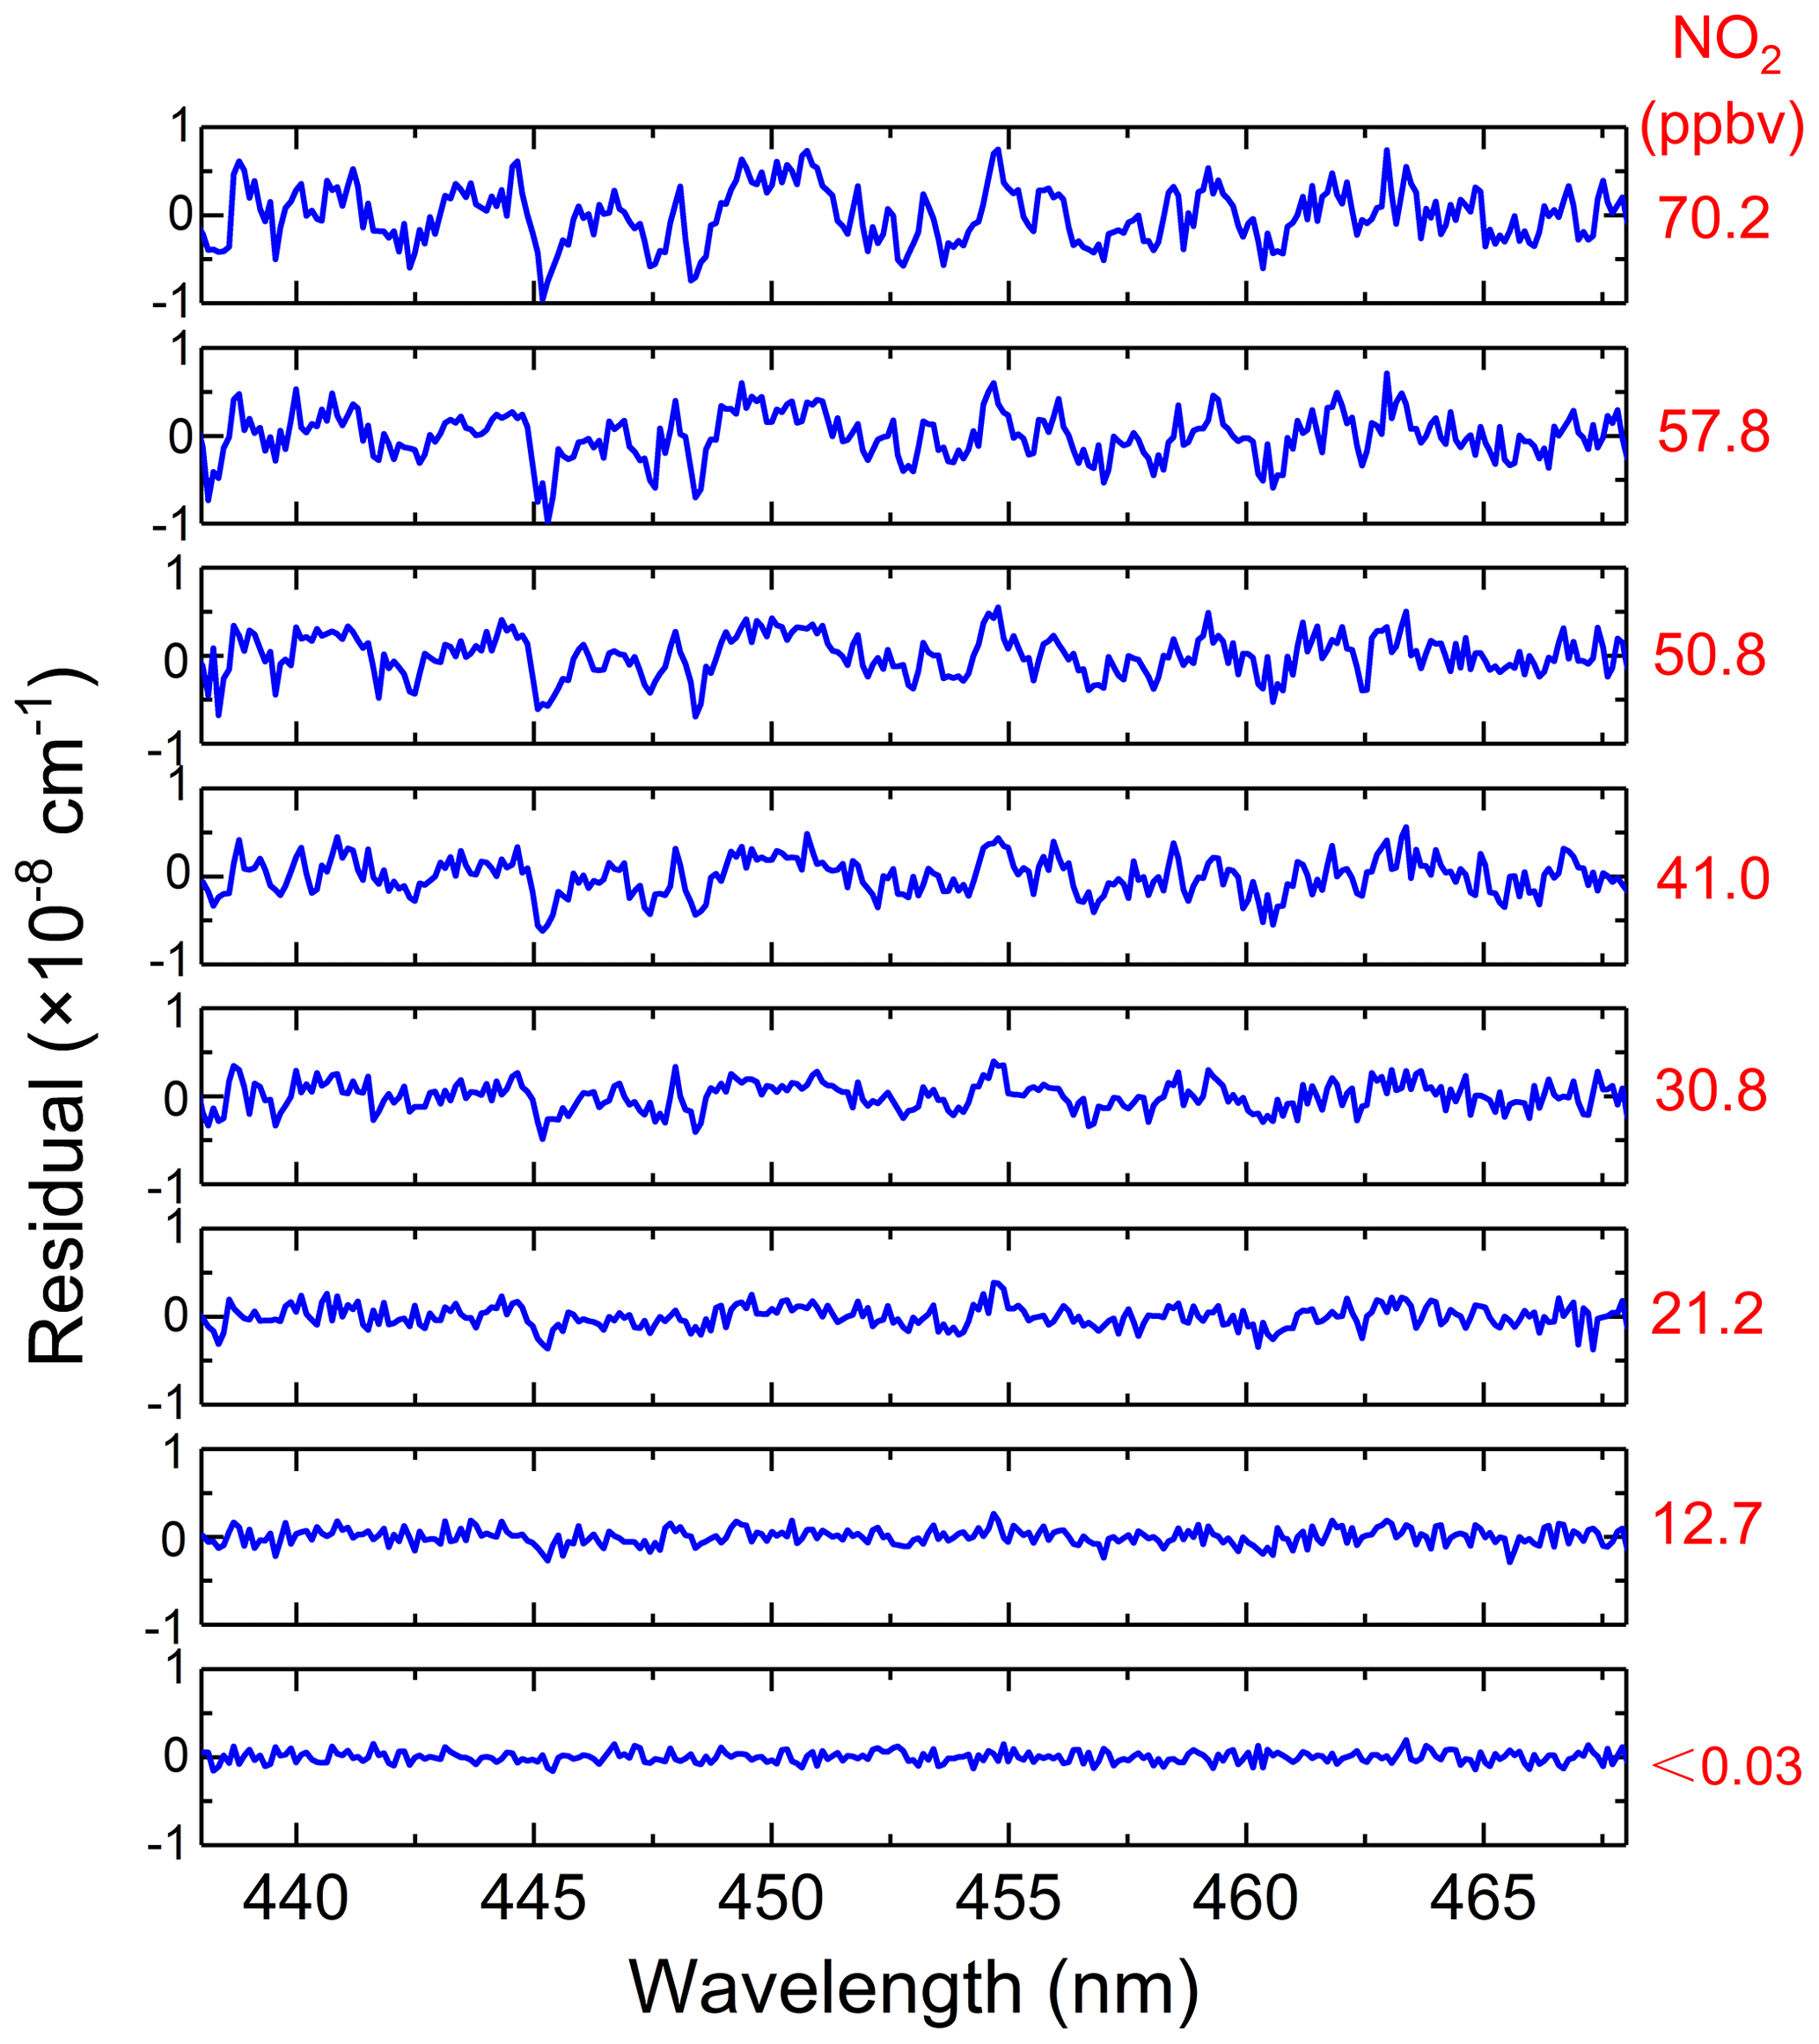
Figure 8Fitting residuals of different concentrations of standard NO2 when using the convolution-based NO2 reference spectrum.

Figure 9The standard deviation of the fit residual from Fig. 8 as a function of NO2 concentrations.
3.5.2 Spectral simulation of NO2 interference with glyoxal
The influence of residual structures in the absorption spectra has been evaluated by Stutz and Platt (1996). Due to the non-uniform dispersion of the spectrometer, a stable residual structure was produced when a NO2 reference spectrum based on a simple convolution calculation (by using a nominal function for the instrument line profile) was used for experimental spectral profile fitting (Fig. 8). We evaluated this non-uniform dispersion effect of the coexisting NO2 absorption on glyoxal spectral analysis.
The simulation spectra we used to test the accuracy of the spectral extraction comprised three components: NO2 reference spectra based on measurements according to Eq. (1), as well as the Rayleigh spectrum of N2 at 1 atm, and convolution-simulated spectrum of 0.1 ppbv CHOCHO. We obtained simulation spectra containing different concentrations of NO2 (0–200 ppbv) and 0.1 ppbv glyoxal according to Eq. (3) as a summation. The spectral retrieval was conducted by using a non-linear least-squares fitting routine. We tested the retrieval accuracy of CHOCHO by applying either a convolution-based NO2 reference spectrum or a measurement-based NO2 reference spectrum in the non-linear least-squares fitting routine for the modelling of the NO2 spectral contribution.
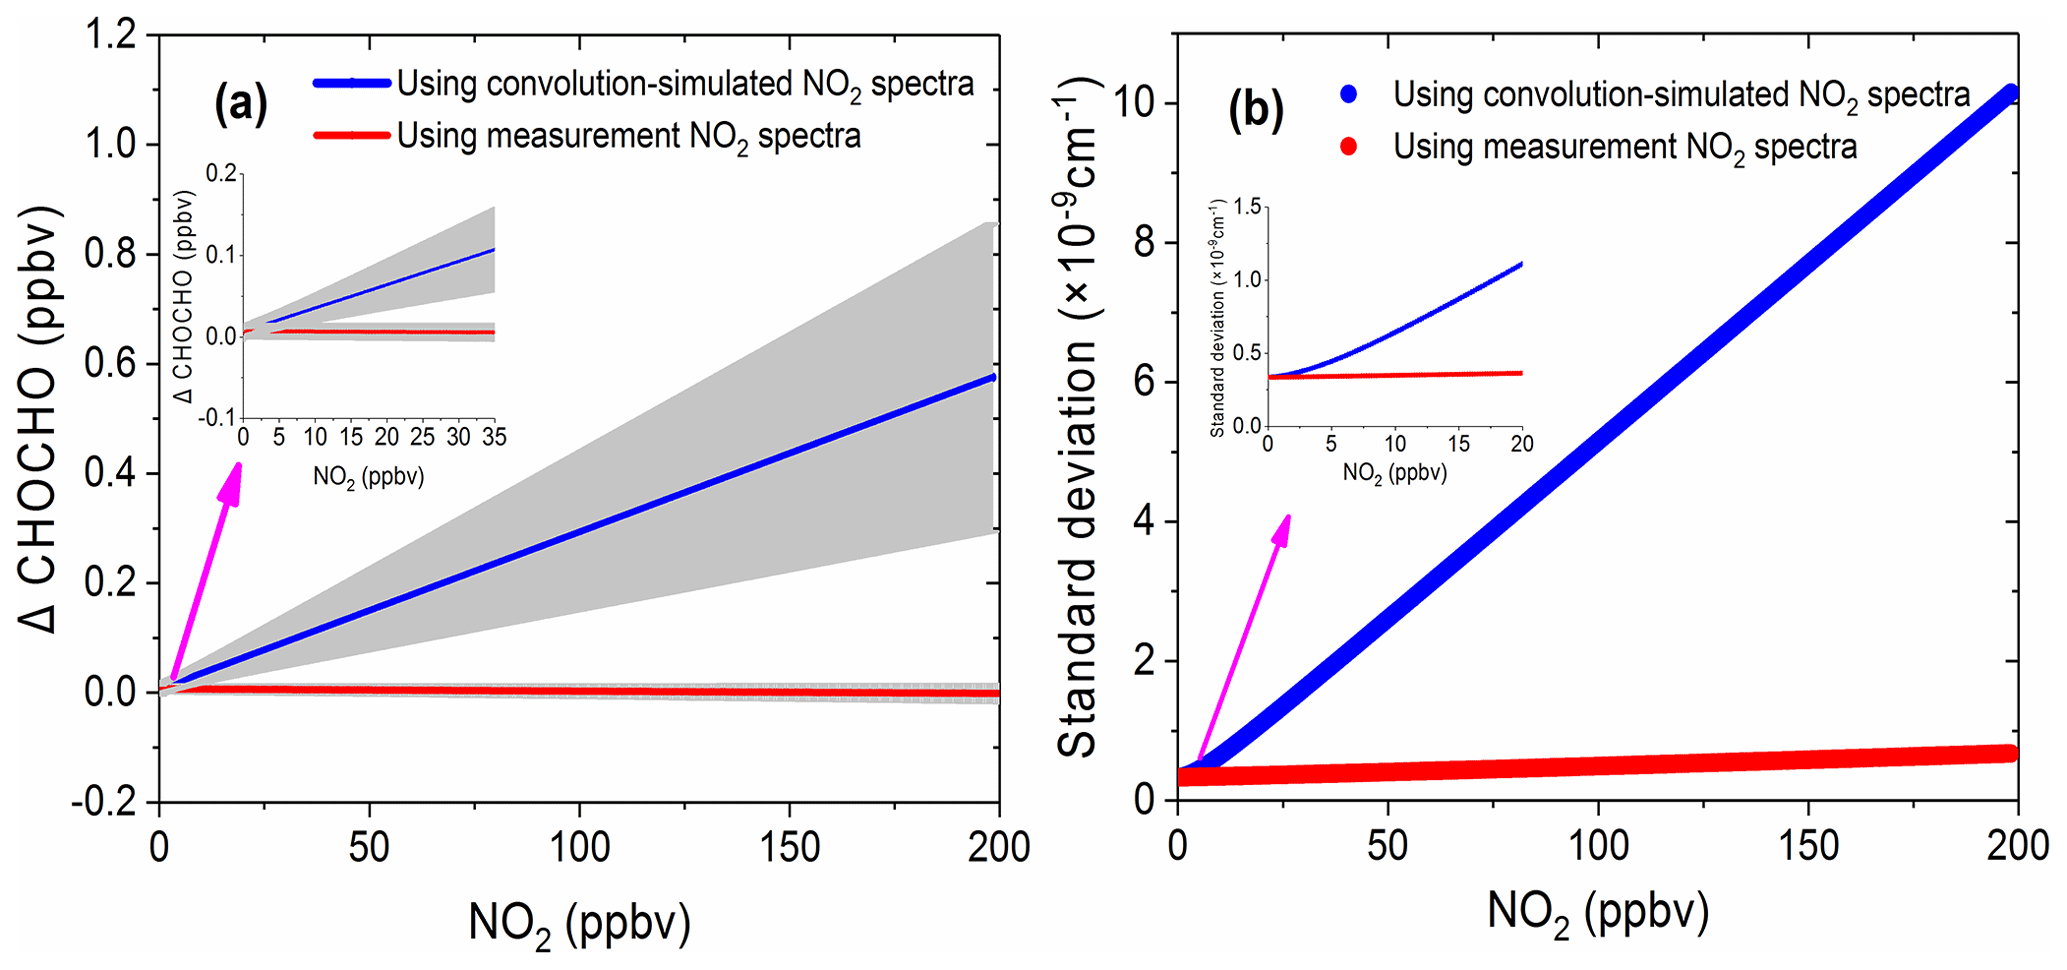
Figure 10The simulation results of the effect of NO2 on glyoxal. (a) The deviation of the retrieved glyoxal concentration from its nominal value of 0.1 ppbv as a function of NO2 concentrations. The blue line is the retrieval result using the convolution-simulated NO2 reference spectra (grey area is the range of fitting uncertainty). The red line is the result of the retrieval via the measured NO2 reference spectrum (grey area is the range of the fitting uncertainty). (b) The corresponding standard deviations of the spectral fit residual.
Figure 10a shows the deviation of the retrieved CHOCHO concentration from its nominal 0.1 ppbv value as a function of NO2 concentration. The blue line in Fig. 10a is the retrieval result when using convolution-based NO2 reference spectrum as its model function (The grey area indicates the range of fitting uncertainties). The deviation of the extracted glyoxal concentration and estimated uncertainty increase linearly as the concentration of NO2 increases. The deviation of glyoxal reaches 0.58 ppbv when the concentration of NO2 is 198 ppbv. In other words, for our instrument, the large bias is characterized as 2.9 pptv glyoxal per ppbv NO2. Thalman et al. (2015) showed in their experiment that the CE-DOAS and BBCEAS systematic bias is 1 pptv glyoxal per ppbv NO2 at higher NO2. The difference between our findings and his findings may be due to differences in instruments – especially the spectrometers. When the concentration of NO2 is less than ∼8 ppbv, its effect on the deviation of glyoxal is less than the detection limit of the instrument (23 pptv, 2σ). The NO2 likely has only a minor effect on glyoxal measurements in this low-concentration case. When the retrieval is performed using the measurement-based NO2 reference spectrum, the deviation of the extracted glyoxal concentration value (Fig. 10a, red line) remains close to zero. The uncertainty of the fitting error (grey area) is also small, indicating that the effect of NO2 on glyoxal is negligible. Figure 10b compares the standard deviations of the fit residual as a function of NO2 concentration. The standard deviation is reduced from cm−1 per ppbv NO2 when using the convolution-based NO2 reference spectrum in the least-squares fitting, which reduced to cm−1 per ppbv NO2 when using the measurement-based NO2 reference spectrum. This is an improvement of over 30 times.
3.5.3 Spectral fitting of field measurement spectra
We compared the effects of using the convolution-based and the measurement-based NO2 reference spectra to fit real atmospheric spectral measurements. As the simulation analysis in the previous Sect. 3.5.2 indicated already, using the measurement-based NO2 reference spectrum for data analysis of the real atmospheric measurements achieved a more precise NO2 fitting, as both the NO2 reference spectrum and the real atmospheric measurements share the same instrument (i.e. the grating spectrometer) function. The results of the real experimental spectral fitting are shown in Fig. 11. A comparison of the spectral retrievals using both the convolution-based NO2 reference spectrum and the measurement-based NO2 reference spectrum are displayed in the left and right columns of Fig. 11. Corresponding fit residuals are shown in the bottom panels, and the standard deviations are and cm−1. The standard deviation of the fitting residuals by using a measurement-based NO2 reference spectrum is 33 % smaller than those with a convolution-based reference spectrum. Moreover, the fitting residual using measurement-based NO2 reference spectrum showed no obvious structure. The fitting of glyoxal is more precise, and the fitting error is reduced by 31.7 % (Fig. 11g and h) when using the measured NO2 reference spectrum. For NO2, the fitting exhibits almost no difference. The result demonstrates that it is critical to use the measured NO2 reference spectrum. Any tiny distortion in the NO2 reference spectral profile could have a severe effect on the CHOCHO extraction, because NO2 absorption is about 2 orders of magnitude stronger than that of the CHOCHO in the local atmosphere. Figure 12 shows the standard deviation of the fitting residual of the absorption coefficient as a function of NO2 concentration for measurements conducted during the APHH China project (June 2017). The standard deviation is reduced from to cm−1 per ppbv NO2 by using the measurement-based NO2 reference spectrum, which is 2.3 times smaller. The uncertainties in absorption cross sections are 4 % for NO2 (Voigt et al., 2002), and 5 % for CHOCHO (Volkamer et al., 2005b). The difference in NO2 between the literature reference spectrum and the measured reference spectrum is 1.5 %. Our experimental uncertainties in cavity mirror reflectivity and effective cavity length are 5 % and 2 %. The propagated errors (summed in quadrature) are estimated to be 6.7 % for NO2 when the convolution-based NO2 reference spectrum was used or 6.9 % when its measurement-based reference spectrum was used, and 7.3 % for CHOCHO using the convolution-based literature reference spectrum.
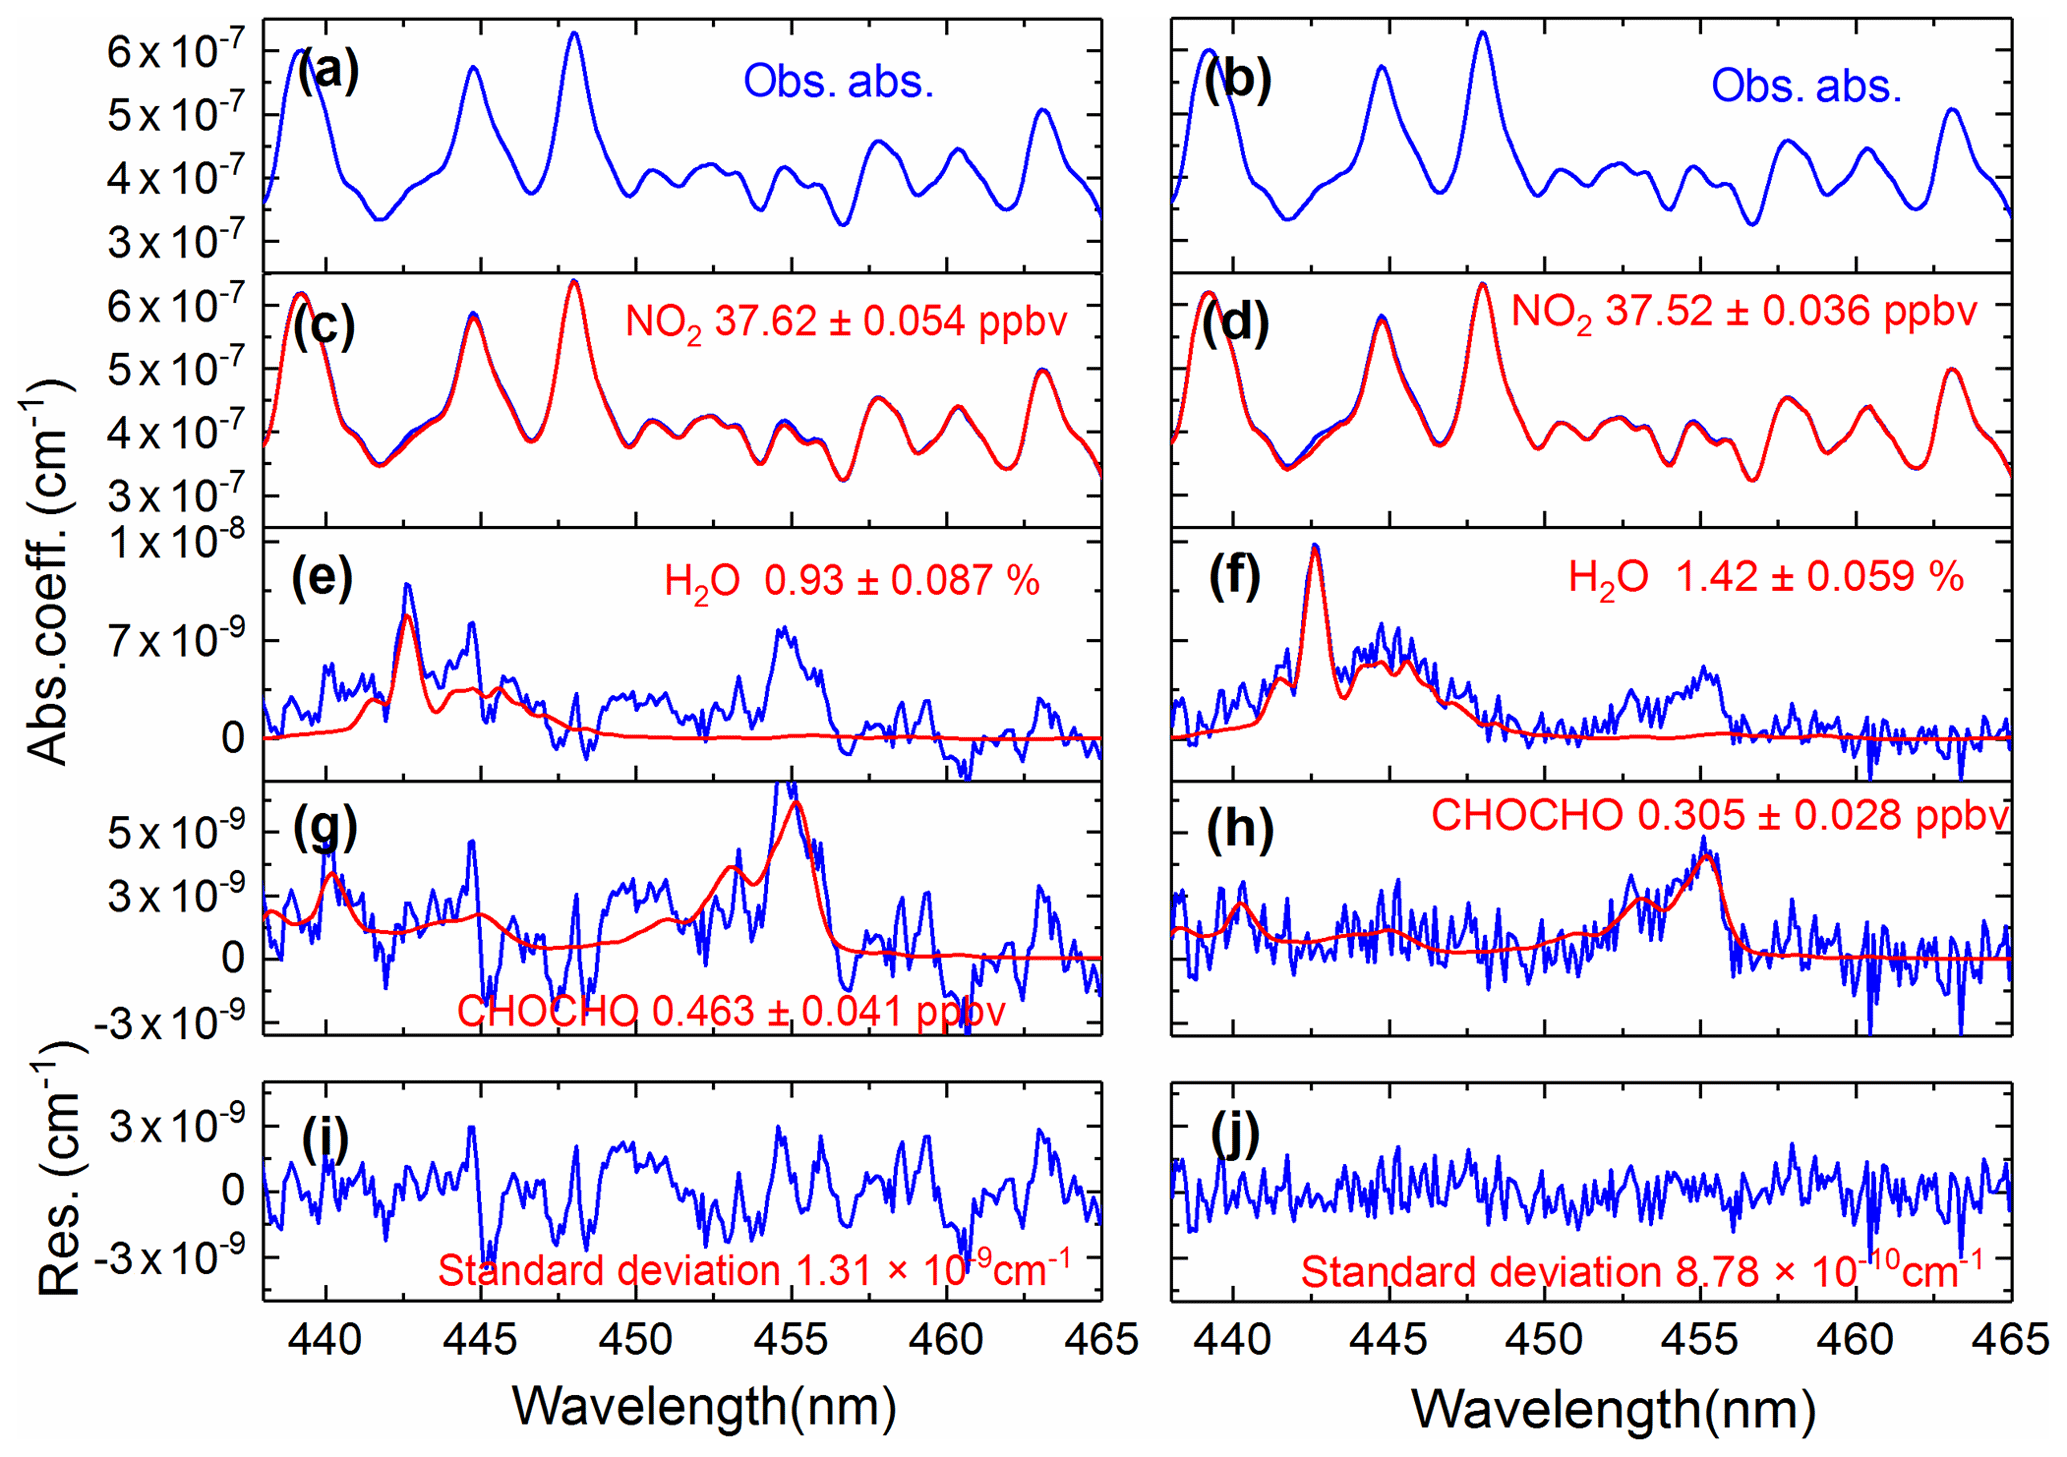
Figure 11A comparison of the experimental atmospheric spectral retrievals using both the convolution-based NO2 reference spectrum (left column) and the measurement-based NO2 reference spectrum (right column). Panels (a) and (b) show the same atmospheric spectrum (recorded on 9 June 2017 at 12:28 LT). The retrieved NO2, H2O, and CHOCHO concentrations are shown in panels (c) and (d), (e) and (f), (g) and (h). Two overall fit residuals are shown in the bottom panels (i) and (j), with the standard deviations of and cm−1.
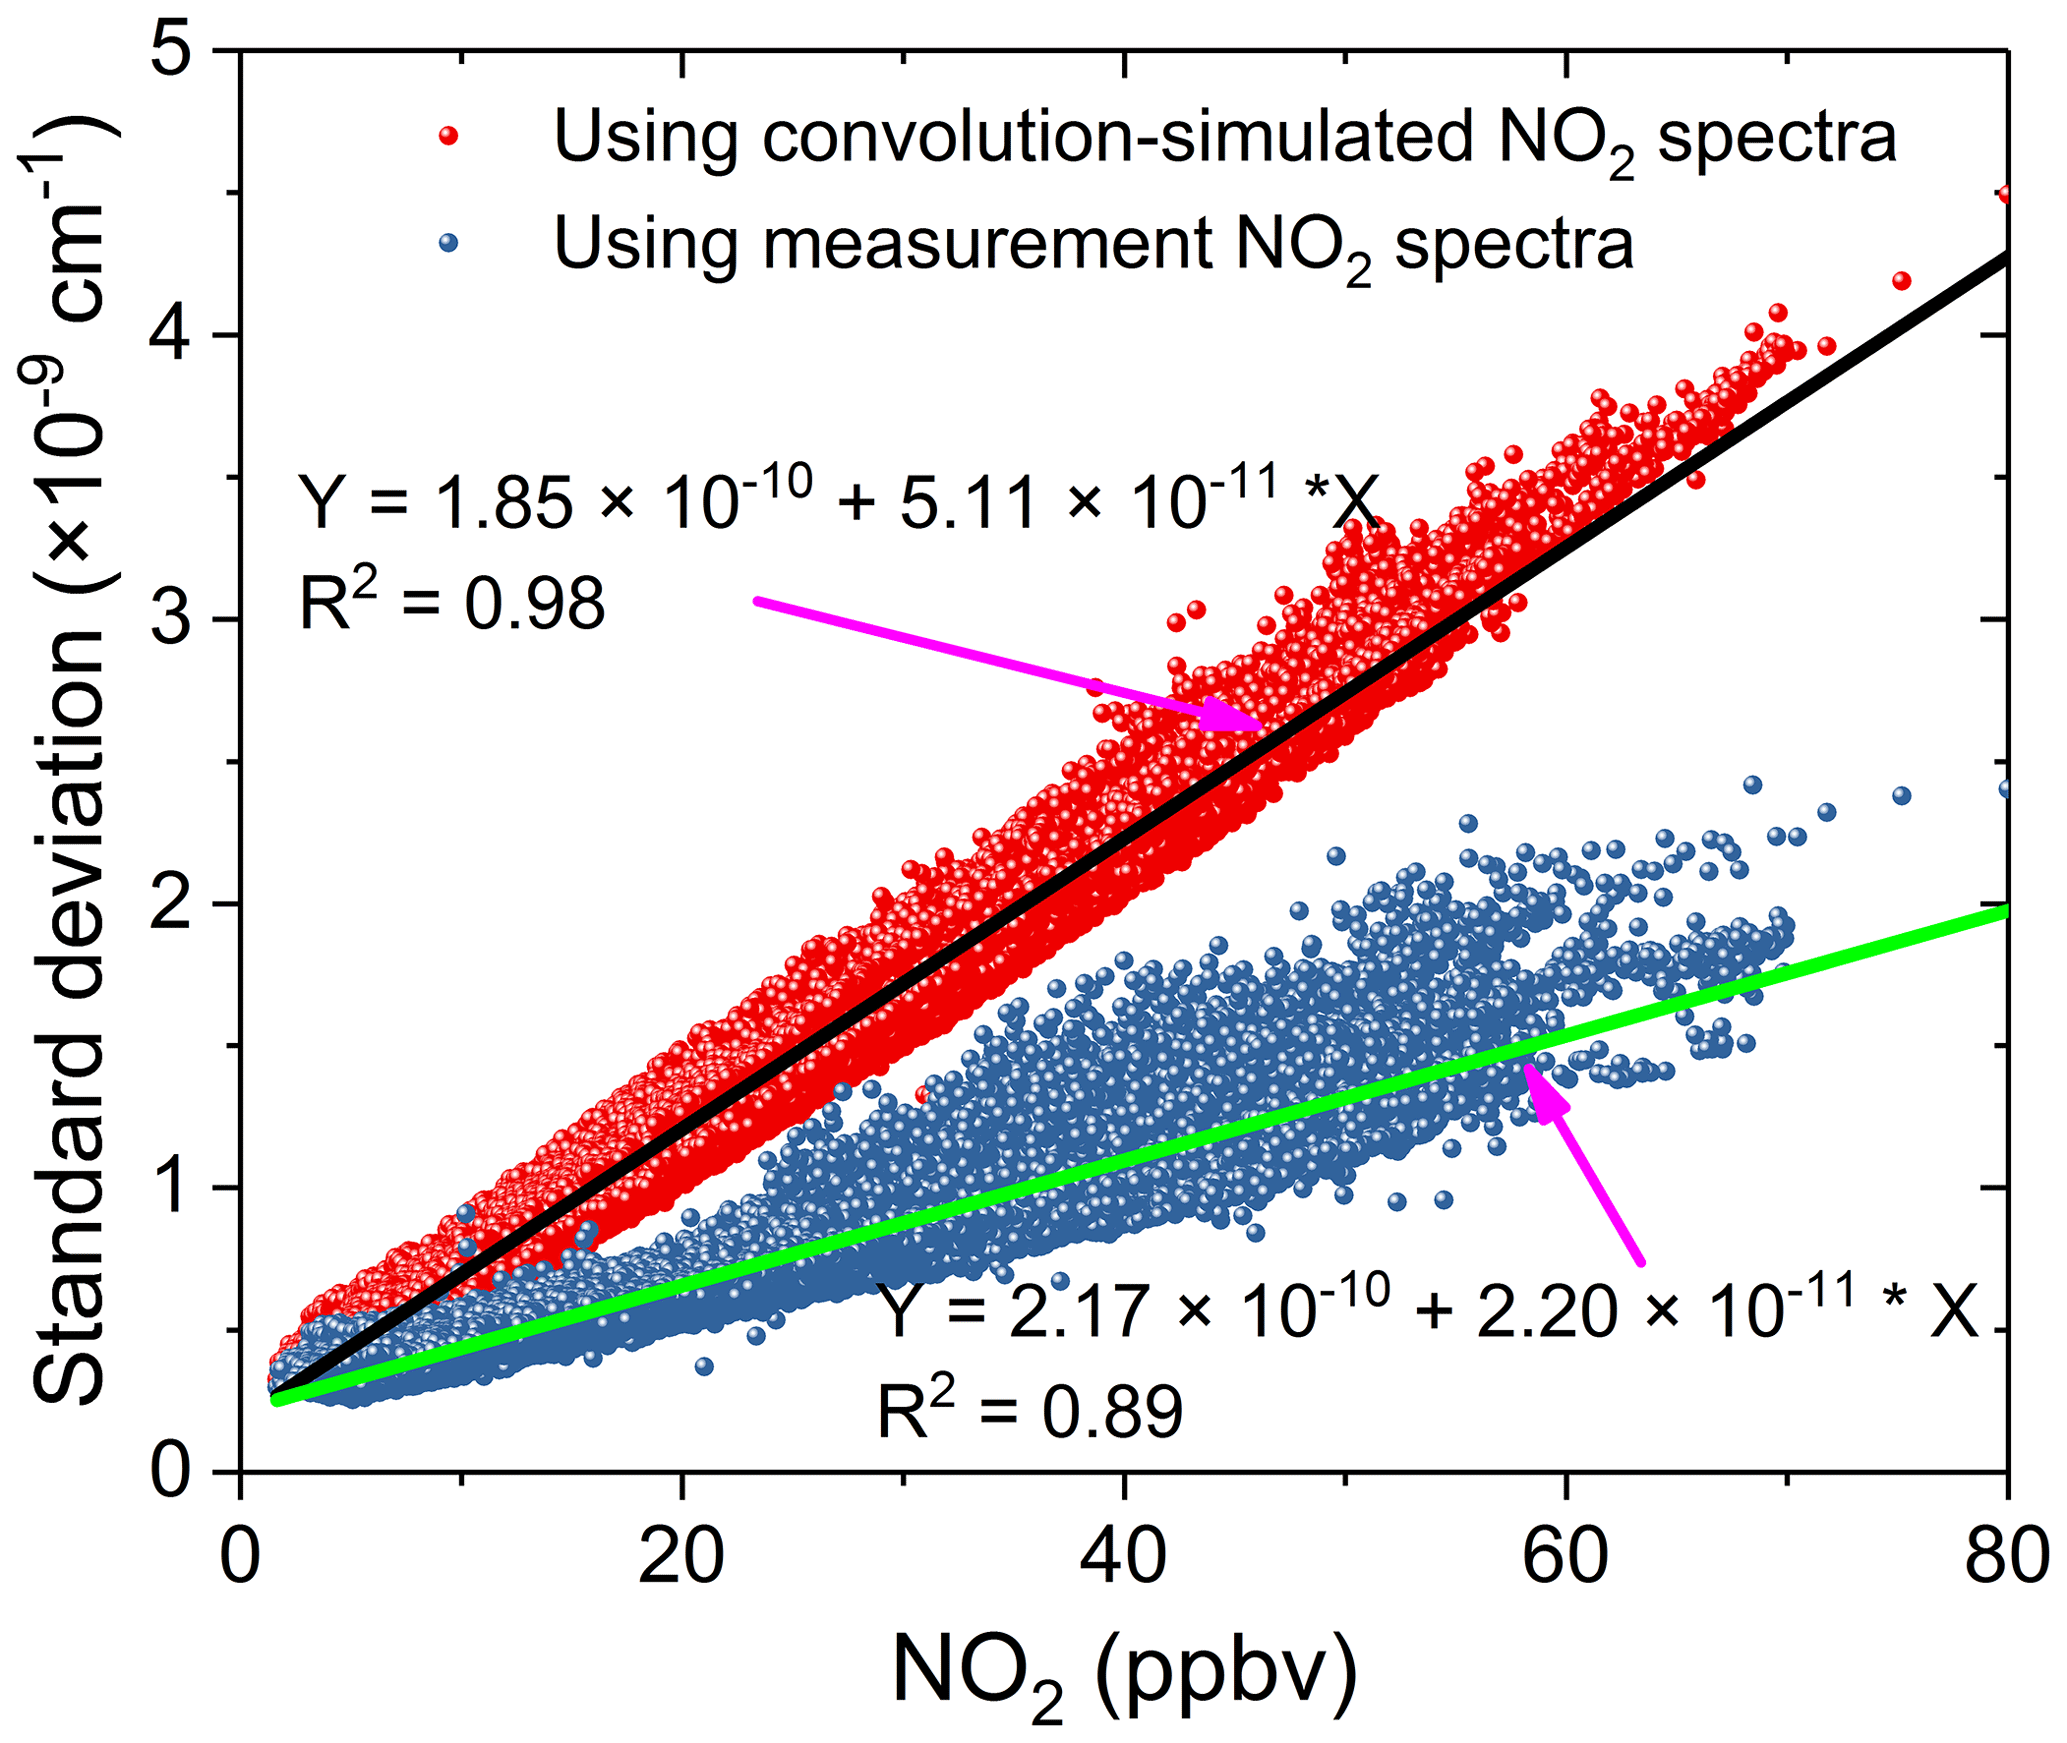
Figure 12The standard deviation of the fit residual of the absorption coefficients as a function of NO2 concentrations for spectral data analysis during the APHH field measurements in Beijing, June 2017. The red dots were the standard deviations of the fit residuals by using a convolution-based NO2 spectral profile and the black line is the linear fit of the data. The blue dots were the standard deviations of the fit residuals by using a measurement-based NO2 reference spectral profile and the green line is the linear fit of the corresponding data.
3.6 Field measurements
The field campaign was conducted in the city Beijing at the Iron Tower Department of the Institute of Atmospheric Physics, Chinese Academy of Sciences during the APHH China project (2–26 June 2017). The IBBCEAS system was deployed to measure both CHOCHO and NO2, supplemented by many other atmospheric measurement instruments. The sampling height of the IBBCEAS system was about 4 m above the ground. A cavity-attenuated phase shift (CAPS) spectroscopy system (University of York) for NO2 data comparison was located in another container about 30 m away from the IBBCEAS system. Figure 13 shows the 24 d continuous measurements of CHOCHO and NO2 in the atmosphere by our IBBCEAS instrument. Each measurement data point was derived from each absorption spectrum acquired over 30 s (which averaged 100 spectrometer CCD traces with an exposure time of 300 ms each). The concentration of glyoxal in the city reached 0.572 ppbv at the maximum; the average was 0.091 ppbv. Time series data for NO2 measured by IBBCEAS was compared with the data from the CAPS spectroscopy system (Fig. 13b). Overall, both sets of measurements were in very good agreement. The average concentration of NO2 was ∼20.0 ppbv and the maximum value was ∼80 ppbv. A correlation plot comparing the IBBCEAS and CAPS NO2 concentration data is shown in Fig. 14, with the data averaged to 1 h. The linear regression exhibits [NO2] CAPS IBBCEAS with a correlation coefficient of R2=0.99. Discrepancies of ∼3 % between the two data sets may be partly due to the different air sampling locations of these two instruments and the uncertainty of the effective cavity length calibration of the IBBCEAS. Overall this 3 % deviation was within the expected 6.9 % uncertainty mentioned in Sect. 3.5.3.

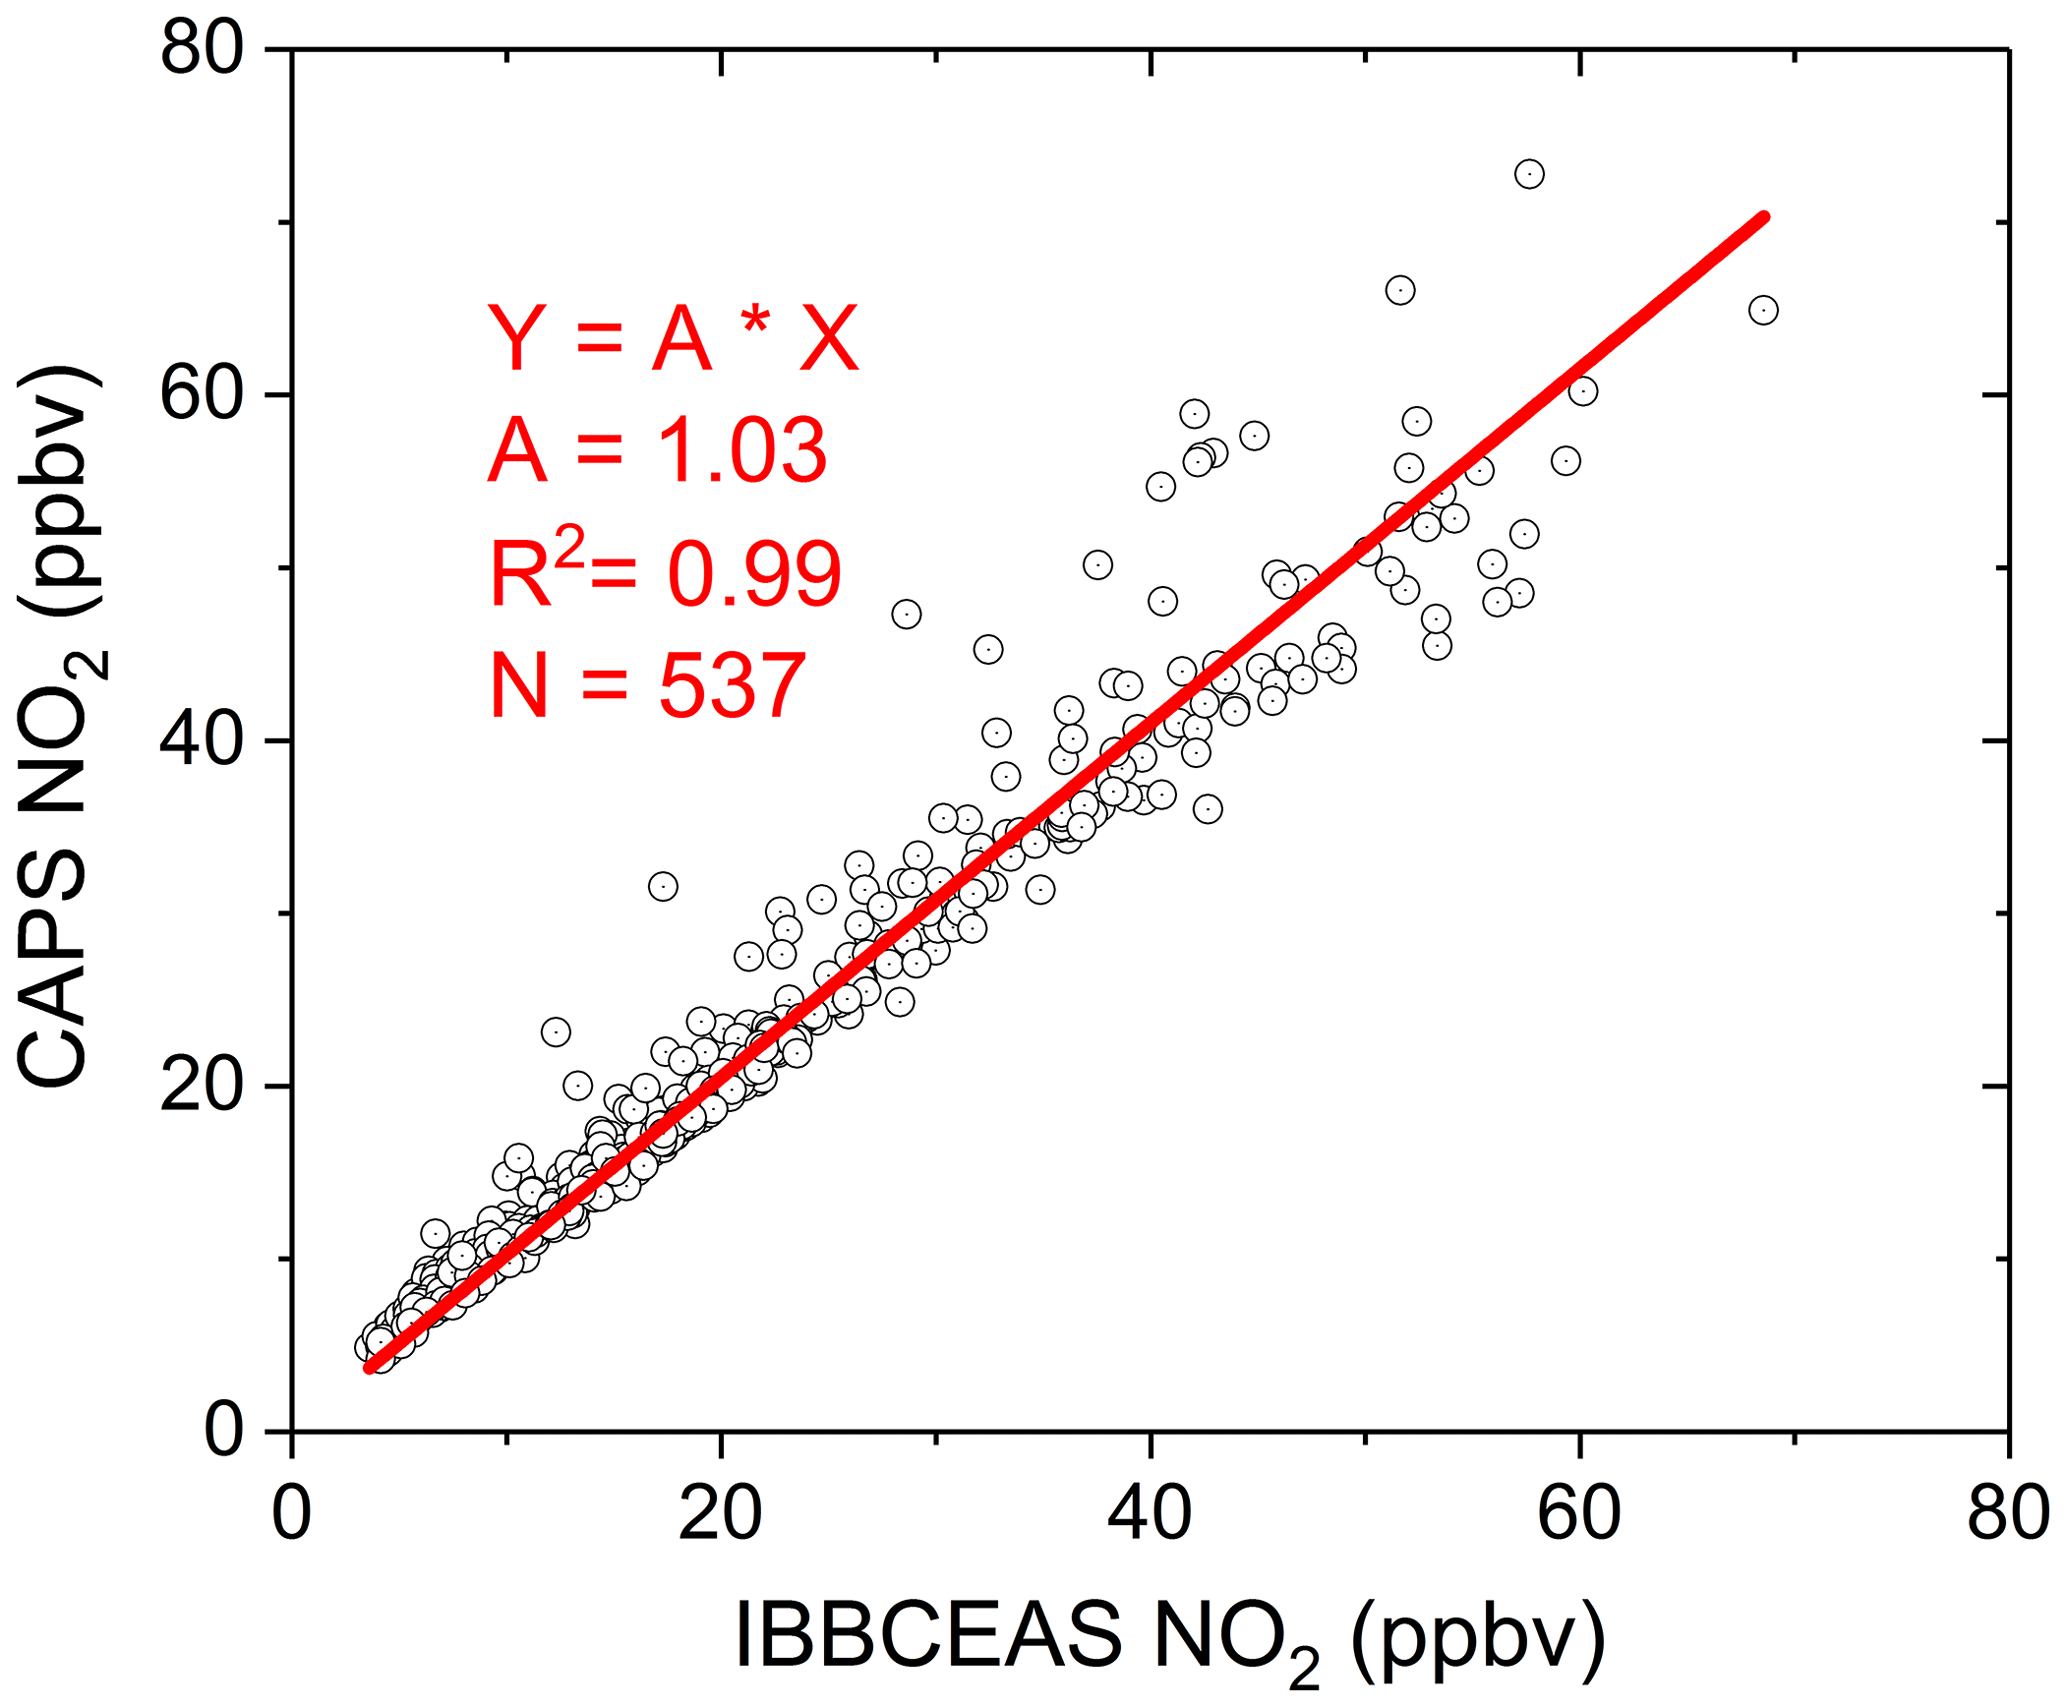
Figure 14Correlation plot of NO2 concentration values between IBBCEAS and CAPS measurements. Each NO2 data point was represented by averaged values to 1 h. The slope of the straight line fit (red line) is 1.03 with R2=0.99.
This paper describes the development of an IBBCEAS system and its field application to high-sensitivity measurements of atmospheric glyoxal and NO2. The mirror reflectivity of the optical cavity was calibrated using the difference in Rayleigh scattering cross sections between N2 and He gases. The mirror reflectivity R is greater than 0.99994 at 455 nm, and the corresponding effective absorption pathlength is about 11.7 km (cavity dimension 0.7 m, in the absence of Rayleigh scattering). To accurately obtain a reduction factor for the cavity length when the cavity mirrors were protected by N2 pure gases, the O4 absorption in pure oxygen (at the 477 nm band) was used to calibrate the effective cavity length. The reduction factor of the cavity length was 0.841 at an inlet flow rate of 1 sL min−1 and a total purge flow rate of 0.2 sL min−1. Here, the cavity length d0 is 70 cm, and the calculated deff is 58.9 cm. We used Allan variance analysis to identify the system's detection limits for NO2 and CHOCHO. They were 0.083 ppbv (2σ) and 0.052 ppbv (2σ) at a 3 s time resolution in the laboratory. Further increases in acquisition time to 30 s improve the detection limits of CHOCHO and NO2 to 23 pptv (2σ) and 29 pptv (2σ). The overall uncertainties of the instrument are 6.7 % or 6.9 % for NO2 using convolution-based or measurement-based reference spectrum and 7.3 % for CHOCHO. The effect of NO2 on glyoxal was evaluated via spectral simulations and measurements. When using a convolution-based NO2 reference spectral profile, the high concentration of NO2 had a large effect on glyoxal and the bias was characterized as 2.9 pptv glyoxal per ppbv NO2. The effect of NO2 on glyoxal became negligible when the retrieval was performed using the measurement-based NO2 reference spectral profile. The measured NO2 reference spectrum was applied to the retrieval of the actual atmospheric spectrum, effectively reducing the impact of NO2 on the retrieval of CHOCHO during the APHH China field measurement project (2–26 June 2017). The standard deviation of the fitting residual was reduced from to cm−1 per ppbv NO2 by using the measured NO2 reference spectrum, which is 2.3 times smaller. The concentrations of CHOCHO and NO2 in the Beijing summer atmosphere were obtained during the APHH China project. There was good agreement in NO2 concentrations acquired by the IBBCEAS and another independent instrument using a different measurement technique–CAPS. The maximum concentrations of glyoxal and NO2 in Beijing in summer reached 0.572 and ∼80 ppbv. This has demonstrated that our IBBCEAS instrument is capable of making accurate continuous measurements in atmospheric environments of high-load particulate matters and high-concentration polluting gases.
The data used in this study are available from the corresponding author upon request (mqin@aiofm.ac.cn).
MQ, PX, JiaL, and WL contributed to the conception of the study. SL, JD, and WF built the IBBCEAS instrument. XL and JinL designed the standard gas generator for glyoxal. SL, JD, KT, FM, and KY performed the experiments. JX and MQ contributed ideas about spectral simulation. SL performed the data analyses and wrote the manuscript. YH and MQ edited and developed the manuscript.
The authors declare that they have no conflict of interest.
This article is part of the special issue “Advances in cavity-based techniques for measurements of atmospheric aerosol and trace gases”. It is not associated with a conference.
This work was supported by the National Natural Science Foundation of China (grant no. 91544104, 41705015 and 41571130023), the Science and Technology Major Special Project of Anhui Province, China (16030801120) and the National Key R&D Programme of China (2017YFC0209400). The co-author Yabai He is also associated with Macquarie University, Australia. The authors would like to thank Lee James from the University of York for providing NO2 data. We gratefully acknowledge the discussions with Bin Ouyang from the Lancaster Environment Centre, Lancaster University, UK.
This paper was edited by Weidong Chen and reviewed by two anonymous referees.
Chen, J. and Venables, D. S.: A broadband optical cavity spectrometer for measuring weak near-ultraviolet absorption spectra of gases, Atmos. Meas. Tech., 4, 425–436, https://doi.org/10.5194/amt-4-425-2011, 2011.
Coburn, S., Ortega, I., Thalman, R., Blomquist, B., Fairall, C. W., and Volkamer, R.: Measurements of diurnal variations and eddy covariance (EC) fluxes of glyoxal in the tropical marine boundary layer: description of the Fast LED-CE-DOAS instrument, Atmos. Meas. Tech., 7, 3579–3595, https://doi.org/10.5194/amt-7-3579-2014, 2014.
DiGangi, J. P., Henry, S. B., Kammrath, A., Boyle, E. S., Kaser, L., Schnitzhofer, R., Graus, M., Turnipseed, A., Park, J.-H., Weber, R. J., Hornbrook, R. S., Cantrell, C. A., Maudlin III, R. L., Kim, S., Nakashima, Y., Wolfe, G. M., Kajii, Y., Apel, E. C., Goldstein, A. H., Guenther, A., Karl, T., Hansel, A., and Keutsch, F. N.: Observations of glyoxal and formaldehyde as metrics for the anthropogenic impact on rural photochemistry, Atmos. Chem. Phys., 12, 9529–9543, https://doi.org/10.5194/acp-12-9529-2012, 2012.
Fang, B., Zhao, W., Xu, X., Zhou, J., Ma, X., Wang, S., Zhang, W., Venables, D. S., and Chen, W.: Portable broadband cavity-enhanced spectrometer utilizing Kalman filtering: application to real-time, in situ monitoring of glyoxal and nitrogen dioxide, Opt. Express, 25, 26910–26922, https://doi.org/10.1364/OE.25.026910, 2017.
Fiedler, S. E., Hoheisel, G., Ruth, A. A., and Hese, A.: Incoherent broad-band cavity-enhanced absorption spectroscopy of azulene in a supersonic jet, Chem. Phys. Lett., 382, 447–453, https://doi.org/10.1016/j.cplett.2003.10.075, 2003.
Fu, T.-M., Jacob, D. J., Wittrock, F., Burrows, J. P., Vrekoussis, M., and Henze, D. K.: Global budgets of atmospheric glyoxal and methylglyoxal, and implications for formation of secondary organic aerosols, J. Geophys. Res., 113, D15303, https://doi.org/10.1029/2007JD009505, 2008.
Henry, S. B., Kammrath, A., and Keutsch, F. N.: Quantification of gas-phase glyoxal and methylglyoxal via the Laser-Induced Phosphorescence of (methyl)GLyOxal Spectrometry (LIPGLOS) Method, Atmos. Meas. Tech., 5, 181–192, https://doi.org/10.5194/amt-5-181-2012, 2012.
Ho, S. S. H. and Yu, J. Z.: Determination of airborne carbonyls: comparison of a thermal desorption/GC method with the standard DNPH/HPLC method, Environ. Sci. Technol., 38, 862–870, https://doi.org/10.1021/es034795w, 2004.
Huisman, A. J., Hottle, J. R., Coens, K. L., DiGangi, J. P., Galloway, M. M., Kammrath, A., and Keutsch, F. N.: Laser-induced phosphorescence for the in situ detection of glyoxal at part per trillion mixing ratios, Anal. Chem. 80, 5884–5891, 2008.
Kahan, T. F., Washenfelder, R. A., Vaida, V., and Brown, S. S.: Cavity-enhanced measurements of hydrogen peroxide absorption cross sections from 353 to 410 nm, J. Phys. Chem. A, 116, 5941–5947, 2012.
Kaiser, J., Wolfe, G. M., Min, K. E., Brown, S. S., Miller, C. C., Jacob, D. J., deGouw, J. A., Graus, M., Hanisco, T. F., Holloway, J., Peischl, J., Pollack, I. B., Ryerson, T. B., Warneke, C., Washenfelder, R. A., and Keutsch, F. N.: Reassessing the ratio of glyoxal to formaldehyde as an indicator of hydrocarbon precursor speciation, Atmos. Chem. Phys., 15, 7571–7583, https://doi.org/10.5194/acp-15-7571-2015, 2015.
Kraus, S. G.: DOASIS: A Framework Design for DOAS, Dissertation, University of Mannheim, Mannheim, Germany, 2006.
Langridge, J. M., Ball, S. M., Shillings, A. J. L., and Jones, R. L.: A broadband absorption spectrometer using light emitting diodes for ultrasensitive, in situ trace gas detection, Rev. Sci. Instrum., 79, 123110, https://doi.org/10.1063/1.3046282, 2008.
Li, J., Mao, J., Min, K. E., Washenfelder, R. A., Brown, S. S., Kaiser, J., Keutsch, F. N., Volkamer, R., Wolfe, G. M., Hanisco, T. F., Pollack, I. B., Ryerson, T. B., Graus, M., Gilman, J. B., Lerner, B. M., Warneke, C., de Gouw, J. A., Middlebrook, A. M., Liao, J., Welti, A., Henderson, B. H., McNeill, V. F., Hall, S. R., Ullmann, K., Donner, L. J., Paulot, F., and Horowitz, L. W.: Observational constraints on glyoxal production from isoprene oxidation and its contribution to organic aerosol over the Southeast United States, J. Geophys. Res.-Atmos. 121, 9849–9861, https://doi.org/10.1002/2016JD025331, 2016
MacDonald, S. M., Oetjen, H., Mahajan, A. S., Whalley, L. K., Edwards, P. M., Heard, D. E., Jones, C. E., and Plane, J. M. C.: DOAS measurements of formaldehyde and glyoxal above a south-east Asian tropical rainforest, Atmos. Chem. Phys., 12, 5949–5962, https://doi.org/10.5194/acp-12-5949-2012, 2012.
Min, K.-E., Washenfelder, R. A., Dubé, W. P., Langford, A. O., Edwards, P. M., Zarzana, K. J., Stutz, J., Lu, K., Rohrer, F., Zhang, Y., and Brown, S. S.: A broadband cavity enhanced absorption spectrometer for aircraft measurements of glyoxal, methylglyoxal, nitrous acid, nitrogen dioxide, and water vapor, Atmos. Meas. Tech., 9, 423–440, https://doi.org/10.5194/amt-9-423-2016, 2016.
Munger, J. W., Jacob, D. J., Daube, B. C., and Horowitz, L. W.: Formaldehyde, glyoxal, and methylglyoxal in air and cloudwater at a rural mountain site in central Virginia, J. Geophys. Res.-Atmos., 100, 9325–9333, 1995.
Pang, X., Lewis, A. C., Rickard, A. R., Baeza-Romero, M. T., Adams, T. J., Ball, S. M., Daniels, M. J. S., Goodall, I. C. A., Monks, P. S., Peppe, S., Ródenas García, M., Sánchez, P., and Muñoz, A.: A smog chamber comparison of a microfluidic derivatisation measurement of gas-phase glyoxal and methylglyoxal with other analytical techniques, Atmos. Meas. Tech., 7, 373–389, https://doi.org/10.5194/amt-7-373-2014, 2014.
Pinardi, G., Van Roozendael, M., Abuhassan, N., Adams, C., Cede, A., Clémer, K., Fayt, C., Frieß, U., Gil, M., Herman, J., Hermans, C., Hendrick, F., Irie, H., Merlaud, A., Navarro Comas, M., Peters, E., Piters, A. J. M., Puentedura, O., Richter, A., Schönhardt, A., Shaiganfar, R., Spinei, E., Strong, K., Takashima, H., Vrekoussis, M., Wagner, T., Wittrock, F., and Yilmaz, S.: MAX-DOAS formaldehyde slant column measurements during CINDI: intercomparison and analysis improvement, Atmos. Meas. Tech., 6, 167–185, https://doi.org/10.5194/amt-6-167-2013, 2013.
Qin, M., Xie, P., Su, H., Gu, J., Peng, F., Li, S., Zeng, L., Liu, J., Liu, W., and Zhang, Y.: An observational study of the HONO–NO2 coupling at an urban site in Guangzhou City, South China, Atmos. Environ., 43, 5731–5742, https://doi.org/10.1016/j.atmosenv.2009.08.017, 2009.
Rothman, L. S., Gordon, I. E., Babikov, Y., Barbe, A., Chris Benner, D., Bernath, P. F., Birk, M., Bizzocchi, L., Boudon, V., Brown, L. R., Campargue, A., Chance, K., Cohen, E. A., Coudert, L. H., Devi, V. M., Drouin, B. J., Fayt, A., Flaud, J. -M., Gamache, R. R., Harrison, J. J., Hartmann, J. -M., Hill, C., Hodges, J. T., Jacquemart, D., Jolly, A., Lamouroux, J., Le Roy, R. J., Li, G., Long, D. A., Lyulin, O. M., Mackie, C. J., Massie, S. T., Mikhailenko, S., Müller, H. S. P., Naumenko, O. V., Nikitin, A. V., Orphal, J., Perevalov, V., Perrin, A., Polovtseva, E. R., Richard, C., Smith, M. A. H., Starikova, E., Sung, K., Tashkun, S., Tennyson, J., Toon, G. C., Tyuterev, Vl. G., Wagner, G.: The HITRAN 2012 Molecular Spectroscopic Database, J. Quant. Spectrosc. Ra., 130, 4–50, https://doi.org/10.1016/j.jqsrt.2013.07.002, 2013.
Shardanand and Rao, A. D. P.: Absolute Rayleigh scattering cross sections of gases and freons of stratospheric interest in the visible and ultraviolet regions, NASA Technical Note, National Aeronautics And Space Administration Washington, D.C., USA, 1977.
Sneep, M. and Ubachs, W.: Direct measurement of the Rayleigh scattering cross section in various gases, J. Quant. Spectrosc. Ra., 92, 293–310, 2005.
Stutz, J. and Platt, U.: Numerical analysis and estimation of the statistical error of differential optical absorption spectroscopy measurements with least-squares methods, Appl. Optics, 35, 6041–6053, 1996.
Temime, B., Healy, R. M., and Wenger, J.: A denuder-filter sampling technique for the detection of gas and particle phase carbonyl compounds, Environ. Sci. Technol., 41, 6514–6520, https://doi.org/10.1021/es070802v, 2007.
Thalman, R. and Volkamer, R.: Inherent calibration of a blue LED-CE-DOAS instrument to measure iodine oxide, glyoxal, methyl glyoxal, nitrogen dioxide, water vapour and aerosol extinction in open cavity mode, Atmos. Meas. Tech., 3, 1797–1814, https://doi.org/10.5194/amt-3-1797-2010, 2010.
Thalman, R. and Volkamer, R.: Temperature dependent absorption cross-sections of O2-O2 collision pairs between 340 and 630 nm and at atmospherically relevant pressure, Phys. Chem. Chem. Phys., 15, 15371–15381, https://doi.org/10.1039/c3cp50968k, 2013.
Thalman, R., Baeza-Romero, M. T., Ball, S. M., Borrás, E., Daniels, M. J. S., Goodall, I. C. A., Henry, S. B., Karl, T., Keutsch, F. N., Kim, S., Mak, J., Monks, P. S., Muñoz, A., Orlando, J., Peppe, S., Rickard, A. R., Ródenas, M., Sánchez, P., Seco, R., Su, L., Tyndall, G., Vázquez, M., Vera, T., Waxman, E., and Volkamer, R.: Instrument intercomparison of glyoxal, methyl glyoxal and NO2 under simulated atmospheric conditions, Atmos. Meas. Tech., 8, 1835–1862, https://doi.org/10.5194/amt-8-1835-2015, 2015.
Volkamer, R., Molina, L. T., Molina, M. J., Shirley, T., and Brune, W. H.: DOAS measurement of glyoxal as an indicator for fast VOC chemistry in urban air, Geophys. Res. Lett., 32, L08806, https://doi.org/10.1029/2005GL022616, 2005a.
Volkamer, R., Spietz, P., Burrows, J., and Platt, U.: High-resolution absorption cross-section of glyoxal in the UV-vis and IR spectral ranges, J. Photoch. Photobio. C, 172, 35–46, https://doi.org/10.1016/j.jphotochem.2004.11.011, 2005b.
Volkamer, R., Martini, F. S., Molina, L. T., Salcedo, D., Jimenez, J. L., and Molina, M. J.: A missing sink for gas-phase glyoxal in Mexico City: Formation of secondary organic aerosol, Geophys. Res. Lett. 34, L19807, https://doi.org/10.1029/2007GL030752, 2007.
Volkamer, R., Baidar, S., Campos, T. L., Coburn, S., DiGangi, J. P., Dix, B., Eloranta, E. W., Koenig, T. K., Morley, B., Ortega, I., Pierce, B. R., Reeves, M., Sinreich, R., Wang, S., Zondlo, M. A., and Romashkin, P. A.: Aircraft measurements of BrO, IO, glyoxal, NO2, H2O, O2–O2 and aerosol extinction profiles in the tropics: comparison with aircraft-/ship-based in situ and lidar measurements, Atmos. Meas. Tech., 8, 2121-2148, https://doi.org/10.5194/amt-8-2121-2015, 2015.
Voigt, S., Orphal, J., and Burrows, J. P.: The temperature and pressure dependence of the absorption cross-sections of NO2 in the 250–800 nm region measured by Fourier-transform spectroscopy, J. Photoch. Photobio. C, 149, 1–7, 2002.
Vrekoussis, M., Wittrock, F., Richter, A., and Burrows, J. P.: GOME-2 observations of oxygenated VOCs: what can we learn from the ratio glyoxal to formaldehyde on a global scale?, Atmos. Chem. Phys., 10, 10145–10160, https://doi.org/10.5194/acp-10-10145-2010, 2010.
Wang, H., Chen, J., and Lu, K.: Development of a portable cavity-enhanced absorption spectrometer for the measurement of ambient NO3 and N2O5: experimental setup, lab characterizations, and field applications in a polluted urban environment, Atmos. Meas. Tech., 10, 1465–1479, https://doi.org/10.5194/amt-10-1465-2017, 2017.
Washenfelder, R. A., Langford, A. O., Fuchs, H., and Brown, S. S.: Measurement of glyoxal using an incoherent broadband cavity enhanced absorption spectrometer, Atmos. Chem. Phys., 8, 7779–7793, https://doi.org/10.5194/acp-8-7779-2008, 2008.
Washenfelder, R. A., Young, C. J., Brown, S. S., Angevine, W. M., Atlas, E. L., Blake, D. R., Bon, D. M., Cubison, M. J., de Gouw, J. A., Dusanter, S., Flynn, J., Gilman, J. B., Graus, M., Griffith, S., Grossberg, N., Hayes, P. L., Jimenez, J. L., Kuster, W. C., Lefer, B. L., Pollack, I. B., Ryerson, T. B., Stark, H., Stevens, P. S., and Trainer, M. K.: The glyoxal budget and its contribution to organic aerosol for Los Angeles, California, during CalNex 2010, J. Geophys. Res.-Atmos., 116, D00V02, https://doi.org/10.1029/2011JD016314, 2011.
Washenfelder, R. A., Flores, J. M., Brock, C. A., Brown, S. S., and Rudich, Y.: Broadband measurements of aerosol extinction in the ultraviolet spectral region, Atmos. Meas. Tech., 6, 861–877, https://doi.org/10.5194/amt-6-861-2013, 2013.
Werle, P., Mücke, R., and Slemr, F.: The limits of signal averaging in atmospheric trace-gas monitoring by tunable diode-laser absorption spectroscopy (TDLAS), Appl. Phys. B, 57, 131–139, 1993.
Yi, H., Wu, T., Wang, G., Zhao, W., Fertein, E., Coeur, C., Gao, X., Zhang, W., and Chen, W.: Sensing atmospheric reactive species using light emitting diode by incoherent broadband cavity enhanced absorption spectroscopy, Opt. Express, 24, A781–790, https://doi.org/10.1364/OE.24.00A781, 2016.