the Creative Commons Attribution 4.0 License.
the Creative Commons Attribution 4.0 License.
 | 16 Jan 2019
Development of an online-coupled MARGA upgrade for the 2 h interval quantification of low-molecular-weight organic acids in the gas and particle phases
Bastian Stieger
Gerald Spindler
Dominik van Pinxteren
Achim Grüner
Markus Wallasch
A method is presented to quantify the low-molecular-weight organic acids such as formic, acetic, propionic, butyric, pyruvic, glycolic, oxalic, malonic, succinic, malic, glutaric, and methanesulfonic acid in the atmospheric gas and particle phases, based on a combination of the Monitor for AeRosols and Gases in ambient Air (MARGA) and an additional ion chromatography (Compact IC) instrument. Therefore, every second hourly integrated MARGA gas and particle samples were collected and analyzed by the Compact IC, resulting in 12 values per day for each phase. A proper separation of the organic target acids was initially tackled by a laboratory IC optimization study, testing different separation columns, eluent compositions and eluent flow rates for both isocratic and gradient elution. Satisfactory resolution of all compounds was achieved using a gradient system with two coupled anion-exchange separation columns. Online pre-concentration with an enrichment factor of approximately 400 was achieved by solid-phase extraction consisting of a methacrylate-polymer-based sorbent with quaternary ammonium groups. The limits of detection of the method range between 0.5 ng m−3 for malonate and 17.4 ng m−3 for glutarate. Precisions are below 1.0 %, except for glycolate (2.9 %) and succinate (1.0 %). Comparisons of inorganic anions measured at the TROPOS research site in Melpitz, Germany, by the original MARGA and the additional Compact IC are in agreement with each other (R2 = 0.95–0.99). Organic acid concentrations from May 2017 as an example period are presented. Monocarboxylic acids were dominant in the gas phase with mean concentrations of 306 ng m−3 for acetic acid, followed by formic (199 ng m−3), propionic (83 ng m−3), pyruvic (76 ng m−3), butyric (34 ng m−3) and glycolic acid (32 ng m−3). Particulate glycolate, oxalate and methanesulfonate were quantified with mean concentrations of 26, 31 and 30 ng m−3, respectively. Elevated concentrations of gas-phase formic acid and particulate oxalate in the late afternoon indicate photochemical formation as a source.
- Article
(4439 KB) - Full-text XML
-
Supplement
(3573 KB) - BibTeX
- EndNote


Low-molecular-weight organic acids have been measured in the gas (Lee et al., 2009; Bao et al., 2012) and particle phases (Boreddy et al., 2017; Miyazaki et al., 2014; van Pinxteren et al., 2014) as well as in precipitation and cloud water (Sun et al., 2016; van Pinxteren et al., 2005). Next to known primary anthropogenic (Bock et al., 2017; Kawamura and Kaplan, 1987; Legrand et al., 2007) and biogenic sources (Falkovich et al., 2005; Stavrakou et al., 2012), organic acids are formed as secondary products by atmospheric oxidation processes (Lim et al., 2005; Tilgner and Herrmann, 2010; Hoffmann et al., 2016). However, there are still unknown sources of these short-chained compounds (Millet et al., 2015; Stavrakou et al., 2012).
Because of their hygroscopicity (Kawamura and Bikkina, 2016), the organic acids contribute to the acidity of precipitation, dew, fog and clouds (Lee et al., 2009; van Pinxteren et al., 2016). Atmospheric transport processes also lead to dry and wet deposition in remote areas, where they can have an influence on the sensitive ecosystem (Friedman et al., 2017; Himanen et al., 2012; Sabbioni et al., 2003).
Owing to the low concentrations and the high diversity of organic acids compared to inorganic compounds, a highly resolved and near-real-time quantification of organic acids is challenging. Studies on organic compounds in particulate matter (PM) were performed with filter measurements followed by off-line analysis with ion chromatography (IC) (Röhrl and Lammel, 2002; Granby et al., 1997; Legrand et al., 2007), gas chromatography coupled with mass spectroscopy (GC–MS) (Mochizuki et al., 2018; Miyazaki et al., 2014; Kawamura et al., 2012; Hu et al., 2018) or a flame ionization detector (GC–FID) (Deshmukh et al., 2018), capillary electrophoresis (CE) (Müller et al., 2005; van Pinxteren et al., 2009, 2014), or Raman spectroscopy (Kuo et al., 2011).
Gas-phase compounds were sampled for a few hours and analyzed off-line with coated filters and GC–MS (Limbeck et al., 2005), a denuder and GC–MS (Bao et al., 2012), a denuder and IC (Dawson et al., 1980), and a mist chamber and IC (Preunkert et al., 2007; Schultz Tokos et al., 1992).
Due to the long sampling time of filter and wet sampling techniques followed by laboratory analyses, these methods did not allow for a near-real-time quantification and the laboratory effort is huge. Recently, Stieger et al. (2018) showed that off-line filter analysis involves the risk of possible evaporation artifacts of volatile particulate compounds from the filter or the adsorption of gaseous compounds. Additionally, Boring et al. (2002) mentioned the difficulty of sampling very small particles using impaction techniques.
Over the last few years, new instruments have allowed online measurements with increased time resolution. Zander et al. (2010) and Pommier et al. (2016) quantified the vertical column of gaseous formic acid with ground-based Fourier-transform infrared spectroscopy (FTIR). However, the focus of the present work is on the ground-based detection of the carboxylic acids because of possible influences on the lower troposphere.
Gas-phase concentrations on the ground were monitored with a chemical ionization mass spectrometer (CIMS) (Veres et al., 2011; J. M. Liu et al., 2012; Crisp et al., 2014; Mungall et al., 2018). This instrument also enabled airborne measurements of formic acid (Jones et al., 2014). Recently, Nah et al. (2018b) assessed the use of sulfur hexafluoride () anions as CIMS reagent ions as they are more sensitive for the detection of oxalic, propionic and glycolic acid.
As all organic acids are ionic, an application of the IC for the analysis is obvious. Boring et al. (2002) first described an instrument based on an IC system. The separation of the gas and particle phases was performed by the application of a parallel plate denuder and a particle collection system consisting of glass fiber filters. The filters were washed online with deionized water and the dissolved anions from the gas and particle phases, including formic, acetic and oxalic acid, were analyzed. The resulting time resolution from their example measurement period was approximately 30 min. A disadvantage in this study was the necessary exchange of the inserted glass fiber filters every 12 h. Fisseha et al. (2006) published results of formic, acetic, propionic and oxalic acid in Zurich, Switzerland, for 3 months in different seasons. These authors used a flattened denuder and an aerosol chamber under supersaturated conditions to quantify formate, acetate, propionate and oxalate in the gas and particle phases. The detection of other dicarboxylic acids (DCAs) was not possible due to co-elution with the carbonate peak and atmospheric concentrations of other monocarboxylic acids (MCAs) were mostly below the detection limit of the method. Lee et al. (2009) and Ku et al. (2010) sampled only gaseous compounds with a parallel plate denuder. While the first group analyzed C1–C3 MCAs within an hourly time resolution, the second group concentrated on the quantification of acetic acid every 10 min. Recently, Zhou et al. (2015) observed gaseous and particulate oxalate in their MARGA (Monitor for AeRosols and Gases in ambient Air) measurements in Hong Kong for 1 year. In this case, a pre-concentration column was installed instead of the injection loop, but the analysis of more carboxylic acids (CAs) was limited by the short separation column and thus separation efficiency.
Recently, Nah et al. (2018a) presented measurements of low-molecular-weight organic acids within the gas and particle phases with the use of a CIMS and a particle-into-liquid sampler (PILS) coupled with capillary high-pressure ion chromatography (HPIC). They received hourly concentrations of these compounds at a rural southeastern United States site for 1 month and were able to investigate the gas–particle partitioning.
Ullah et al. (2006) developed an online instrument to measure ionic species within the gas and particle phases. For the separation, they used a membrane denuder to collect the water-soluble gases, and a hydrophilic filter sampled the particles. In their IC analysis, it was possible to quantify formic and acetic acid every 40 min.
However, to the author's knowledge, online instruments properly quantifying a variety of low-molecular-weight organic acids (formic, acetic, propionic, butyric, glycolic, pyruvic, oxalic, malonic, succinic, malic, glutaric and methanesulfonic acid) within the gas and particle phases at a high time resolution do not exist yet.
The present study describes the instrumental development of an online-coupled pre-concentration and IC separation system to determine organic acids in the gas and particle phases as an extension of the MARGA. The MARGA has been reported to be a reliable field instrument for long-time measurements in Melpitz and other sites (Stieger et al., 2018, and references therein) and its upgrade with an additional IC separation allows for the analysis of all target compounds with a low risk of interferences from other species.
The developed setup was employed from November 2016 until October 2017 at the TROPOS research site in Melpitz. As a demonstration of a successful field application, the first tropospheric measurements will be presented. Data interpretation of the 1-year measurement campaign with a focus on the phase distribution and the investigation of primary and secondary sources will be published elsewhere.
2.1 MARGA
Water-soluble chloride (Cl−), nitrate (), sulfate (), ammonium (), sodium (Na+), potassium (K+), magnesium (Mg2+) and calcium (Ca2+) in particles smaller than 10 µm (PM10) as well as the trace gases hydrochloric acid (HCl), nitrous acid (HONO), nitric acid (HNO3), sulfur dioxide (SO2) and ammonia (NH3) are quantified hourly by the commercial MARGA 1S ADI 2080 (Metrohm Applikon, the Netherlands) (Chen et al., 2017). Its technical principles and long-term operation at the TROPOS research site in Melpitz (Spindler et al., 2004, 2013) were recently described in Stieger et al. (2018). Briefly, the separation of the gas and particle phases is performed through the usage of a wet rotating denuder (WRD) and a steam-jet aerosol collector (SJAC), respectively. Both the WRD and SJAC are continuously filled with an absorption solution. For 1 h, syringe pumps sample 25 mL of the liquid solutions of the WRD and SJAC. Within the next hour, approximately 7 mL of each solution is transported to two IC systems to quantify the inorganic anions and cations in both phases. The remaining sample solution is directly discarded. A continuous calibration with an internal standard (lithium bromide) is applied.
2.2 Additional IC system
In addition to the two IC systems integrated into the MARGA, an additional one (930 Compact IC Flex, Metrohm, Switzerland; hereafter called Compact IC) together with an autosampler (robotic sample processor XL, Metrohm, Switzerland) is used for the determination of organic acids. The setup of the complete system is shown in Fig. 1. Therein, the different components that will be explained in the following are tagged. Comparable IC systems, for example from Thermo Scientific, were considered as possible alternatives. However, the liquid handling via the autosampler, especially the liquid flows from the MARGA to the necessary autosampler and the capacity of the autosampler, limited the use of other IC systems.
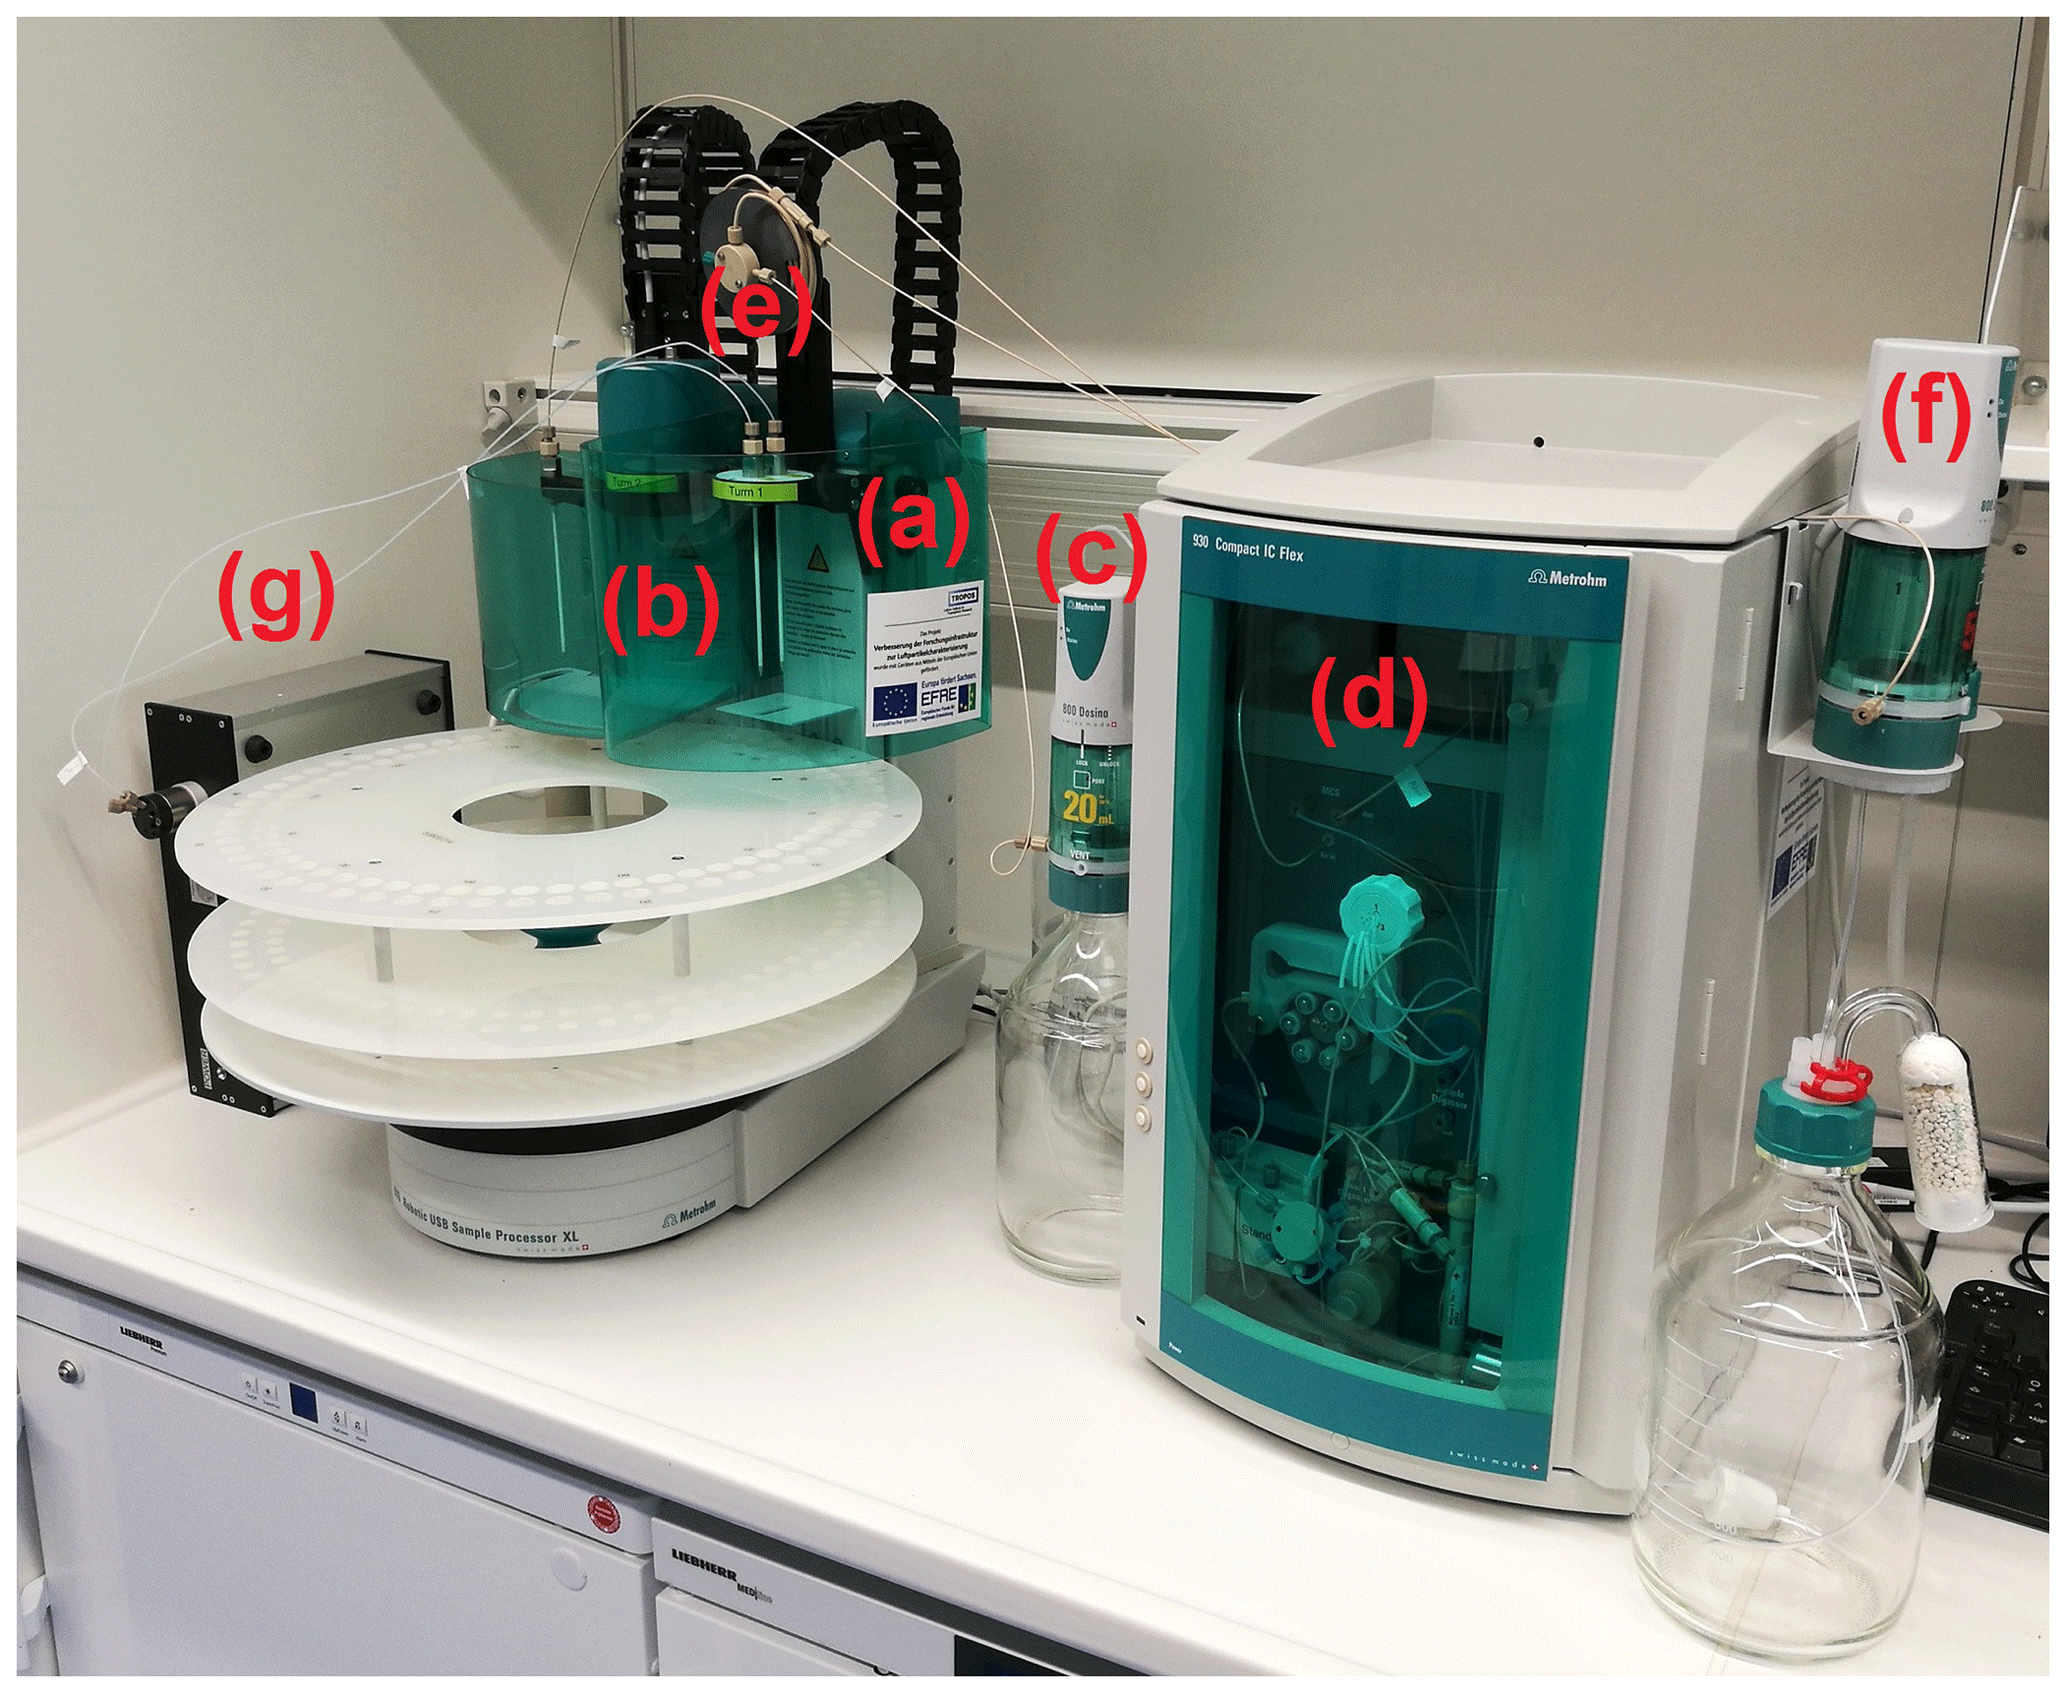
Figure 1Setup of the IC system with (a) the first working station and (b) the second working station of the autosampler, (c) the 800 Dosino for the sample transportation, (d) the Compact IC, (e) the 10 mL sample loop, (f) the 800 Dosino for the gradient system and (g) an external six-way valve for the combination of MARGA and the IC system.
An autosampler with two working stations (a) and (b) has a sample plate with 120 slots for 12.5 mL vials with perforated plugs (polypropylene; Metrohm, Switzerland). The slots are arranged in two circles. Additionally, one working station is equipped with inner and outer sample needles (a) so that the WRD and SJAC solutions can be pumped into the respective vial simultaneously. After storage, the filled vials go to the second working station consisting of a swing head with a further sample needle (b). To avoid contamination, this sample needle is cleaned in a washing station with ultrapure water after each suction. A commercial syringe pump (800 Dosino, Metrohm, Switzerland; c) transports 10 mL of one sample from the autosampler via a six-way injection valve within the Compact IC (d) to a sample loop (e) with a velocity of 2 mL min−1. A graphical explanation of the different modes of the six-way valve is in the Supplement (Fig. S1 in the Supplement). Afterwards, the injection valve switches to the fill mode and the 800 Dosino transfers the complete sample volume into a pre-concentration column (Metrosep A PCC 2 VHC, Metrohm, Switzerland) consisting of a spherical methacrylate polymer with quaternary ammonium groups in the Compact IC. In the injection mode, the degassed eluent consisting of 7 mM sodium carbonate (Na2CO3)∕0.75 mM sodium hydroxide (NaOH) desorbs the trapped ionic compounds from the pre-concentration column with a flow of 0.8 mL min−1 while the sample path is rinsed with ultrapure water. The anion-exchange separation column (Metrosep A Supp 16 250 mm, Metrohm, Switzerland) is stored in a column oven. Before the ionic signals are measured with a conductivity detector, the background conductivity of the anion eluent is chemically suppressed using 100 mM sulfuric acid (H2SO4) and 20 mM oxalic acid.
For gradient applications, a second 800 Dosino (f) was combined with the Compact IC. With an identical flow rate, a defined amount of a more highly concentrated eluent was added to the eluent flow in front of the eluent degasser. A trap column (Metrosep A Trap 1 100/4.0) cleans and ensures a complete mixing of both eluent solutions before the eluent is injected into the pre-concentration column. For the combination of the MARGA and Compact IC, an external six-way valve (Metrohm, Switzerland) is required (g). The complete setup and the time program for the gradient system is controlled by the Metrohm MagIC Net software (Metrohm, Switzerland).
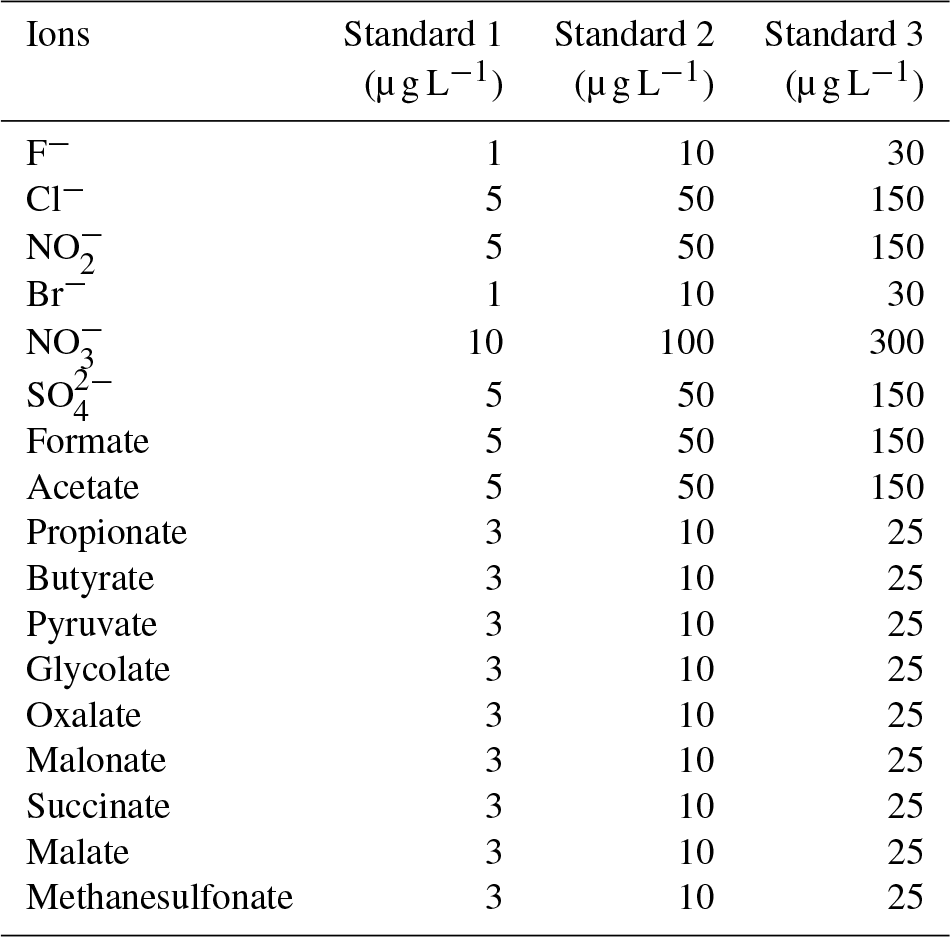
The Compact IC is manually calibrated with three standard solutions twice a week, when the vials of the autosampler are replaced. The standard solutions are prepared in 50 mL flasks, stored in the refrigerator and renewed every 2 weeks. The concentrations of each inorganic and organic ion in the standard are given in Table 1.
Table 1Aqueous standard solution concentrations used for the calibration of the Compact IC.
2.3 Materials
Hydrogen peroxide (H2O2, 30 %, Fluka) is used for the preparation of the MARGA absorption and cleaning solution. The MARGA anion and cation eluents are aqueous solutions of sodium carbonate monohydrate (99.5 %, Sigma Aldrich) and sodium bicarbonate (99.7 %, Sigma Aldrich) as well as 2 M nitric acid solution (Fluka). The MARGA internal standard and the suppressor regenerant solution are prepared with lithium bromide (99 %, Fluka) and with phosphoric acid (85 %, Fluka), respectively. For the Compact IC eluent, sodium carbonate (Na2CO3) (99.5 %, Sigma Aldrich) and sodium hydroxide (NaOH) solution (50 %–52 %, Fluka) is dissolved. Sulfuric acid (98 %, ChemSolute) and oxalic acid (99 %, Sigma Aldrich) are mixed for the suppressor regenerant solution. The following chemicals are used for peak identification and calibration: fluoride (F−), chloride, nitrite (), bromide (Br−), nitrate, sulfate, formate, acetate, oxalate, methanesulfonate standards for IC (all 1000 mg L−1, Fluka), propionic acid (99.5 %, Fluka), butyric acid (99 %, Aldrich), pyruvic acid (98 %, Aldrich), glycolic acid (99 %, Fluka), malonic acid (99 %, Fluka), succinic acid (99.5 %, Fluka), malic acid (99 %, Fluka) and glutaric acid (98 %, Fluka). All chemicals are dissolved in ultrapure water (18.2 MΩ cm).
3.1 Development of the IC separation
The IC separation was developed in laboratory studies to ensure the best separation efficiency of the target compounds formate, acetate, glycolate, pyruvate, oxalate, malonate, succinate, malate and glutarate. The further organic anions propionate, butyrate and methanesulfonate were later identified in the first field applications and then included into the standard solution. Due to their expected low concentrations, it was considered important to pre-concentrate the ions online within the aqueous MARGA sample streams from both the WRD and SJAC. Therefore, a pre-concentration column was applied from the beginning of the optimization studies, as described above. An enrichment factor of 400 was achieved by the comparison of the peak areas of standard solutions applying a 20 µL injection loop and the pre-concentration column.

Figure 2(a) First chromatogram of a standard solution with aqueous concentrations of 10 µg L−1 for Cl−, , and ; 5 µg L−1 for ; and 1 µg L−1 for F−, Br− and all organic acids. Numbers in front of the ion names are the retention times. T=65 ∘C and eluent flow is 0.8 mL min−1. (b) Zoom in of (a).
First analyses were performed with an isocratic system and the separation column Metrosep A Supp 16 250 mm with an eluent of 7 mM Na2CO3 and 0.75 mM NaOH. The resulting chromatogram is shown in Fig. 2, based on aqueous standards with concentrations of 10 µg L−1 (Cl−, , ), 5 µg L−1 () and 1 µg L−1 (F−, Br−, all organic acids). The standards were loaded with a volume of 10 mL on the pre-concentration column and then desorbed into the separation column as described above. Regarding the MARGA system, these liquid concentrations would correspond to the mass concentrations of 250, 125 and 25 ng m−3, respectively. The chosen organic acid concentrations were in agreement with impactor measurements sampled in Melpitz (van Pinxteren et al., 2014). However, there was no baseline separation of acetate and Cl− and the concentrations of the inorganic compounds can exceed 10 µg m−3, resulting in wider peaks and co-elution. This behavior was observed for and oxalate as well as for the first peaks between F− and Cl− (Fig. S2).
Since, at this stage, a satisfying separation was not achieved, other columns were additionally tested within the isocratic setup. An anion-exchange column named Shodex IC SI-50 4E (Showa Denko Europe GmbH, Germany) was included with an eluent of 3.2 mM Na2CO3 and 1 mM NaHCO3 and an operating temperature of 30 ∘C. The resulting chromatogram is shown in Fig. 3a. As can be seen, almost all CAs co-eluted in two distinct peaks (peaks A and B in Fig. 3a). The MCAs formate, acetate, glycolate and pyruvate could not be separated as well as with the DCAs malonate, succinate, malate and glutarate. As a result, this column was discarded. A Metrosep A Supp 7 250 mm (Metrohm, Switzerland) was tested with an eluent consisting of 3.2 mM Na2CO3 at 45 ∘C. The target MCAs in the chromatogram in Fig. 3b eluted close together between 7 and 9 min and a baseline separation was not achieved. Regarding the low standard concentrations, the separation can be expected to worsen for high concentrations with this anion-exchange column. Higher ion concentrations would broaden the single peaks, which leads to co-elution. The advantage of the last two columns was the excellent separation of oxalate. However, as the aim of this work was the detection of all the target organic acids and the initial Metrosep A Supp 16 provided a good separation of all target compounds with no co-elution, this column was chosen for further improvements of the separation.
Table 2Overview of the varied flows and eluent compositions in the isocratic system using the Metrosep A Supp 16 250 mm column with their effects on separation and reference to the corresponding figures in the Supplement.
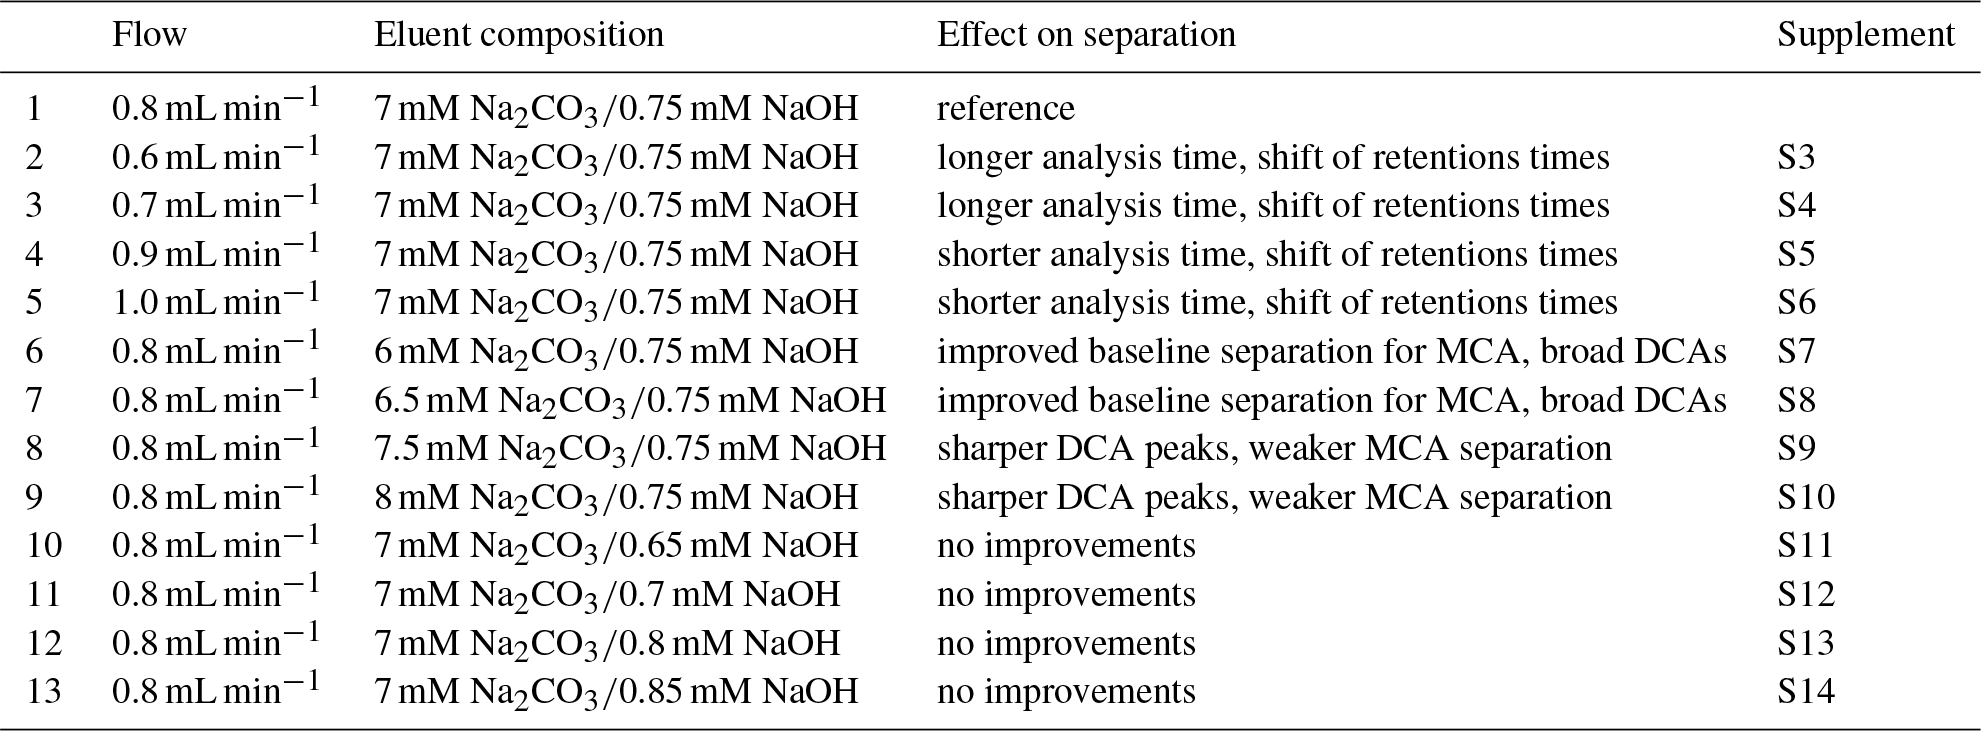
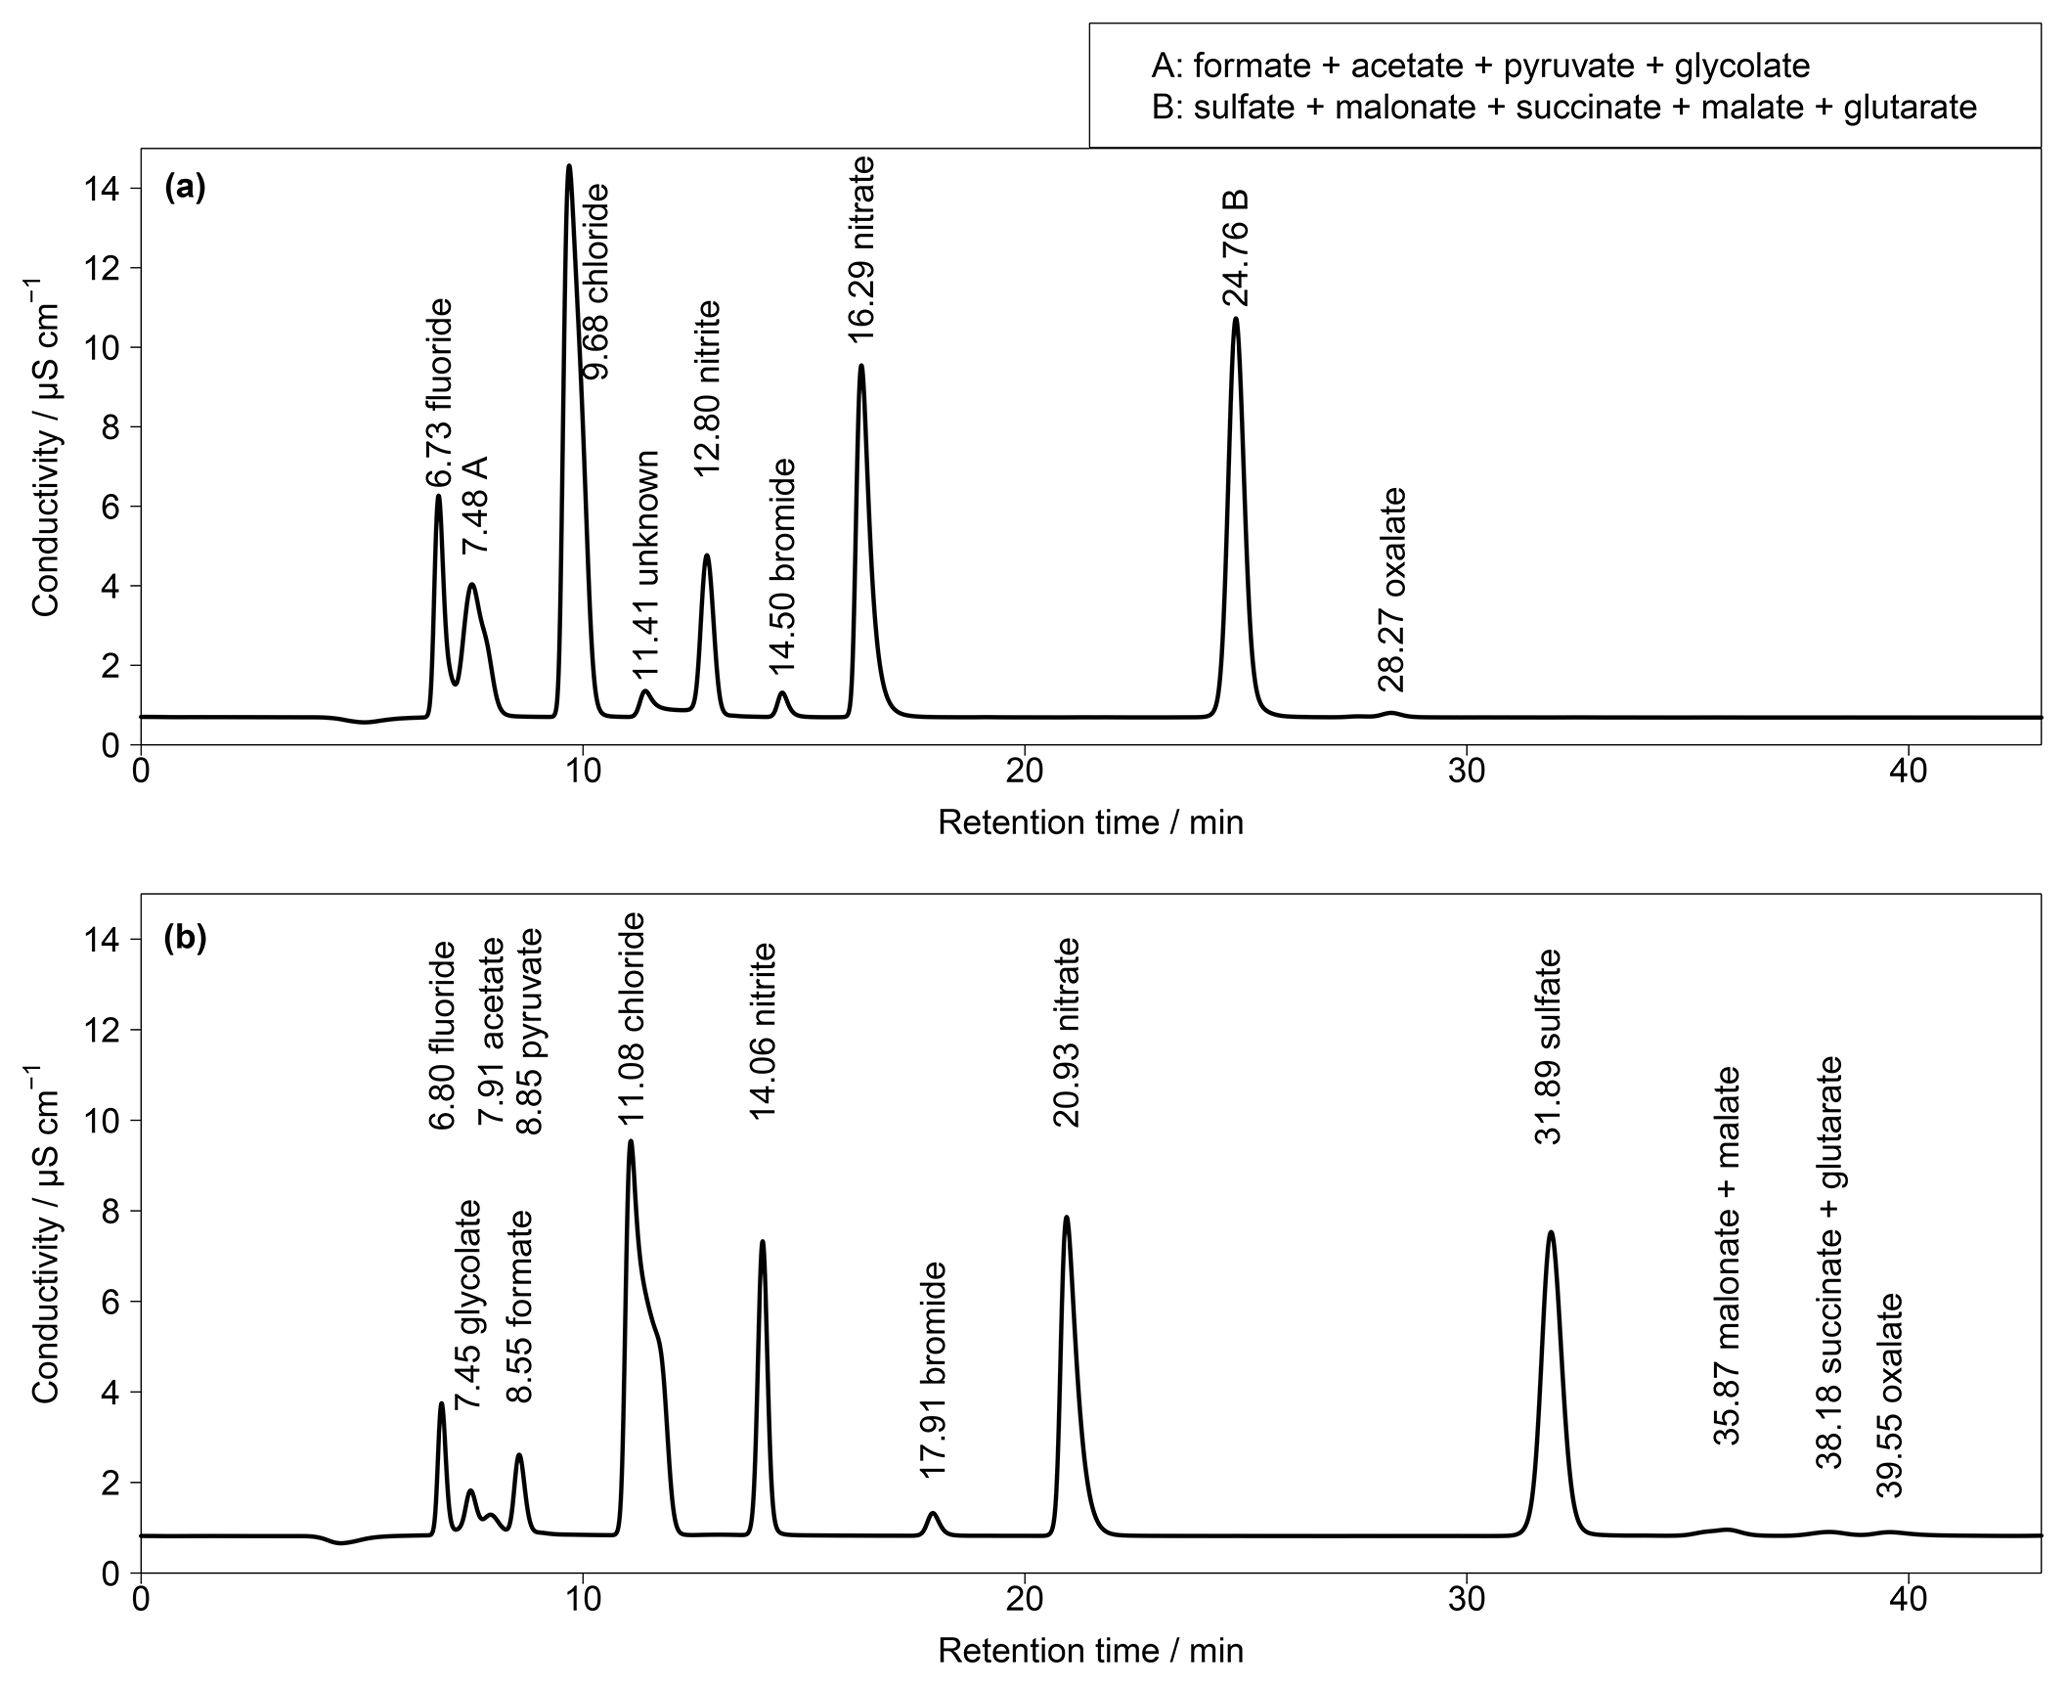
Figure 3(a) Isocratic chromatogram for Shodex IC SI-50 4E with a standard solution of 50 µg L−1 for Cl−, , and ; 25 µg L−1 for ; 5 µg L−1 for F− and Br−; and 2 µg L−1 for all organic acids (T=30 ∘C, eluent flow = 0.7 mL min−1). (b) Isocratic chromatogram for Metrosep A Supp 7 with a standard solution of 50 µg L−1 for Cl−, , and ; 25 µg L−1 for ; 5 µg L−1 for F− and Br−; and 3 µg L−1 for all organic acids (T=45 ∘C, eluent flow = 0.8 mL min−1). Numbers in front of the ion names indicate the retention times in minutes.
Possible improvements were investigated by changing the eluent flow and the eluent composition, which are summarized in Table 2. The flow was increased to 0.9 and 1.0 mL min−1 and decreased to 0.7 and 0.6 mL min−1. However, only a shift of the retention times was observed that shortened or extended the analysis time. Afterwards, the eluent concentrations were varied. An impact of NaOH in the eluent was not observed. The retention time shift was negligible and the separation was not affected. Detectable improvements were found for lower Na2CO3 concentrations between F− and Cl−. The best separation for the MCAs was found for 6 mM Na2CO3. Here, glycolate and formate were baseline separated and the separation of acetate and Cl− was improved. However, the small peaks of the DCA were broadened, which could have a negative influence on the peak detection, especially for oxalate that is near the tail of . An eluent composition of 8 mM Na2CO3 led to sharper DCA peaks, but worsened the MCA separation.
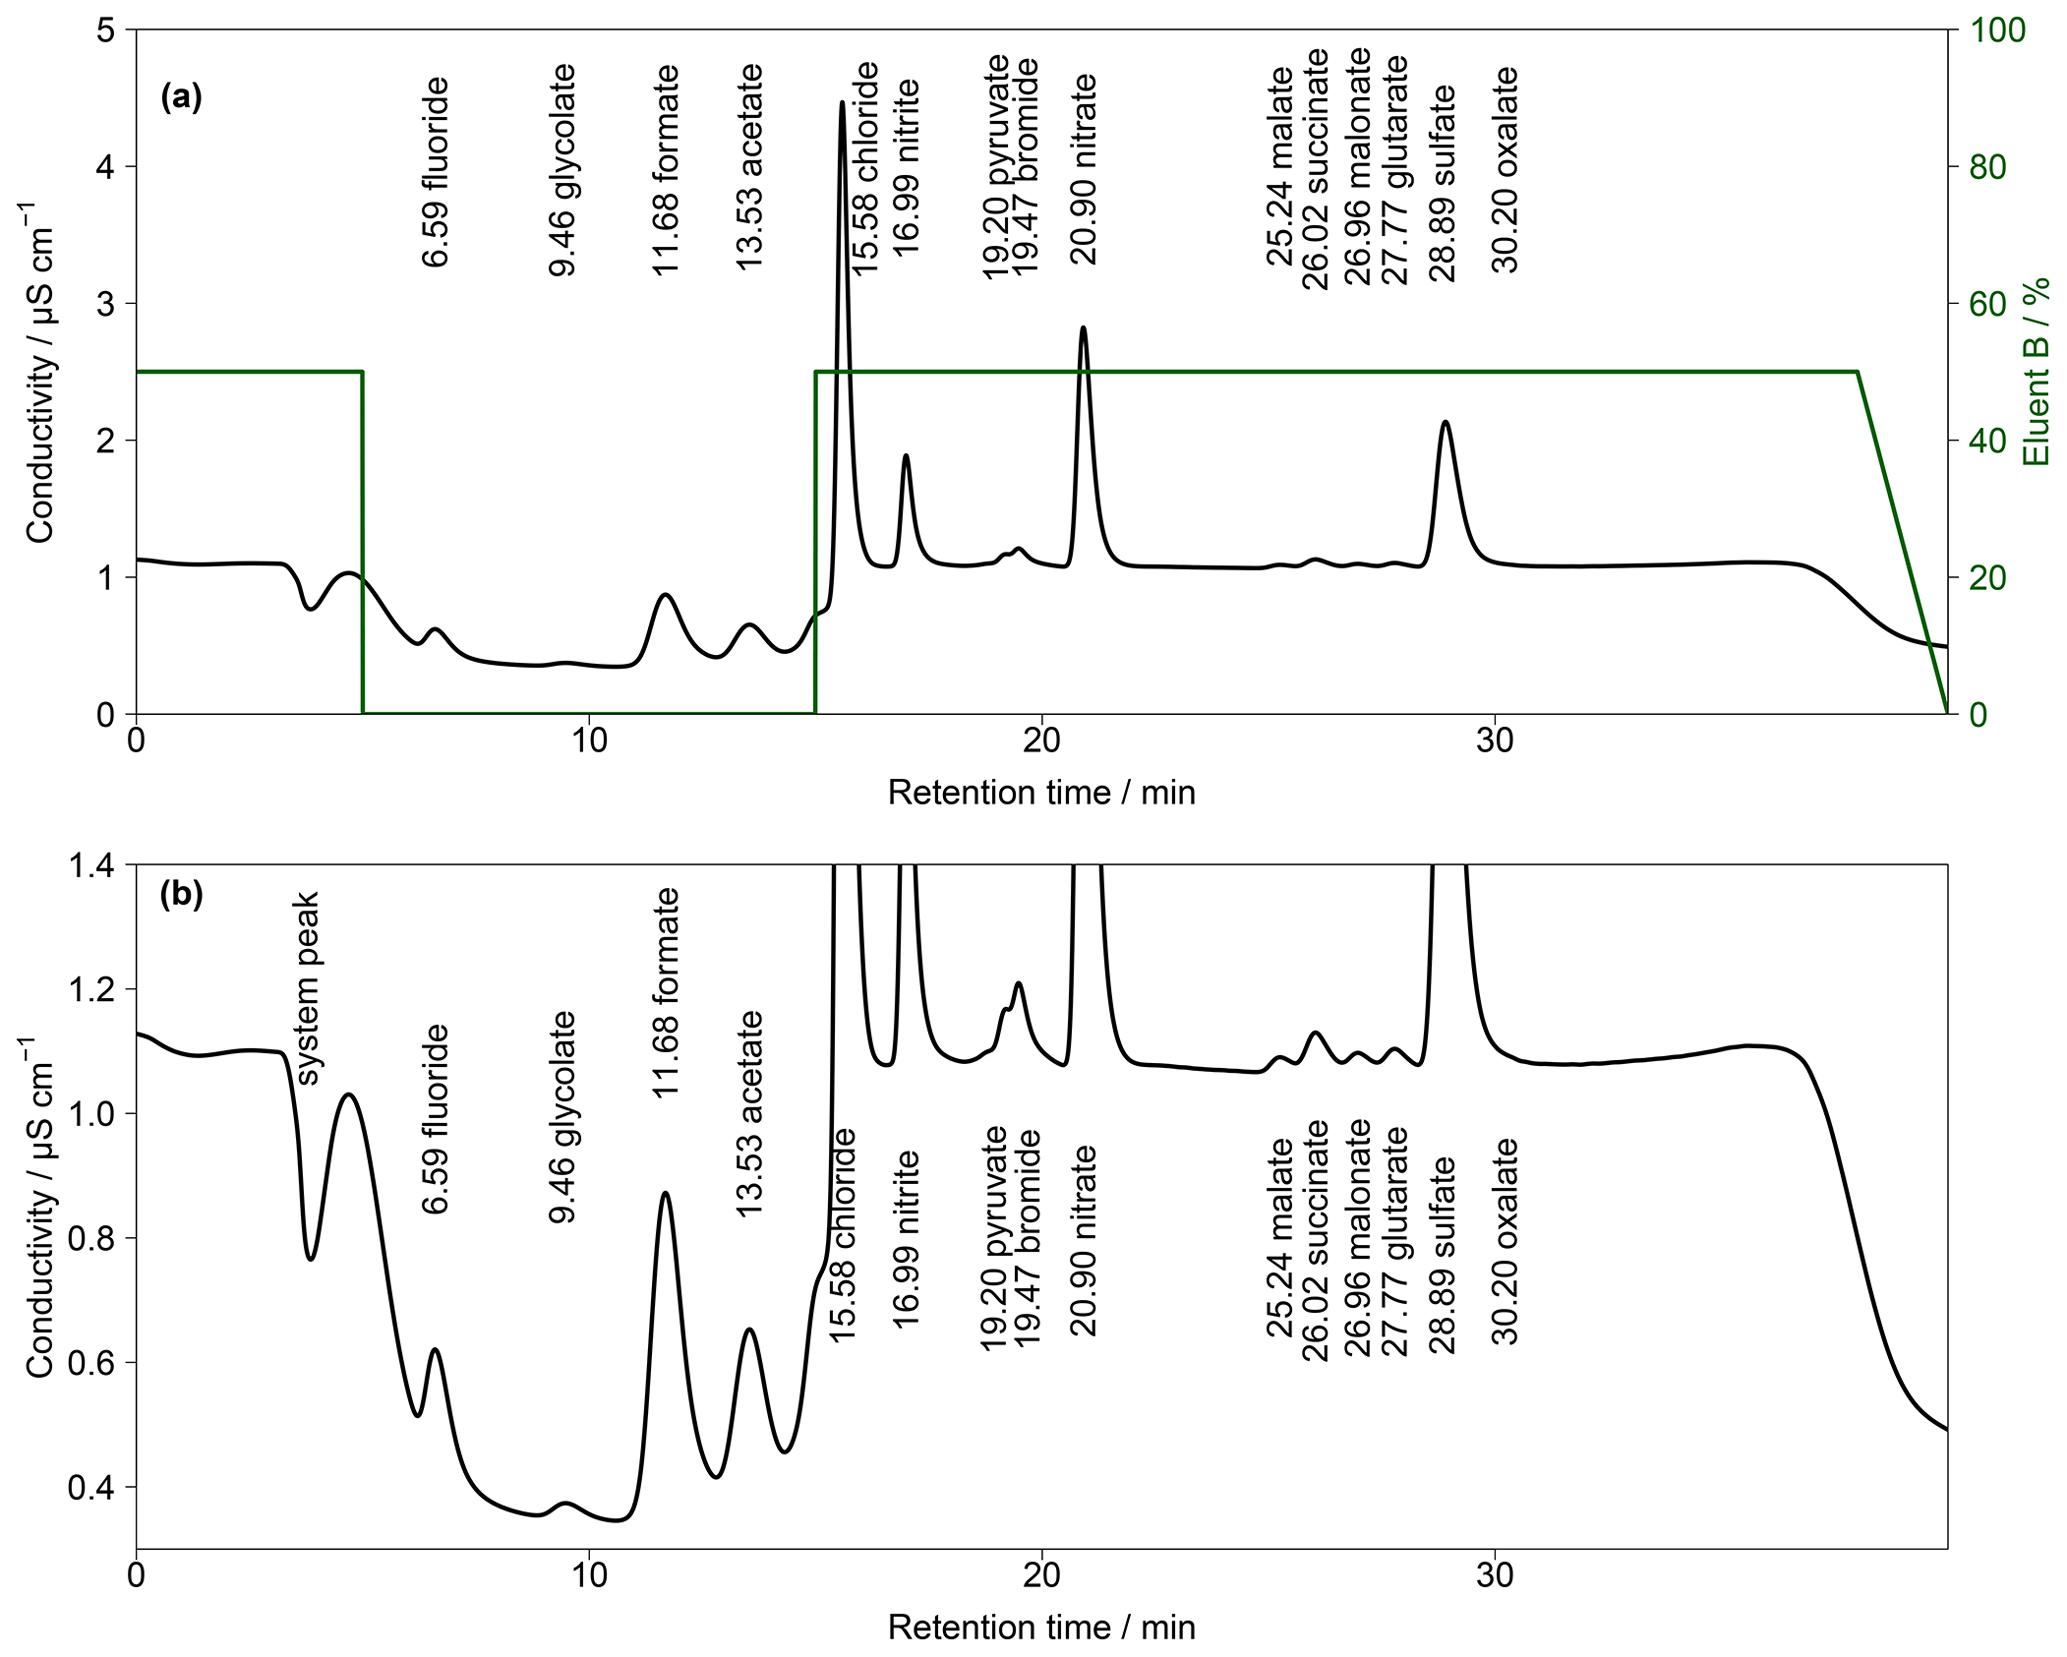
Figure 4(a) Chromatogram of an aqueous standard solution with concentrations of 10 µg L−1 for Cl−, , and ; 5 µg L−1 for ; and 1 µg L−1 for F−, Br− and all organic acids with the gradient system. Numbers in front of the ion names indicate the retention times in minutes. The fraction of eluent B within the eluent mixture over time is given as the green line. The eluent concentration of A is 0.5 mM Na2CO3∕0.75 mM NaOH and of B is 20 mM Na2CO3∕0.75 mM NaOH. T=65 ∘C and eluent flow is 0.8 mL min−1. (b) Zoom in of (a).
To combine the advantages of the different eluent compositions, a gradient system was applied. Two different concentrated eluents were prepared. Within the Compact IC, a highly concentrated eluent B (20 mM Na2CO3 and 0.75 mM NaOH) was mixed with a lower-concentration eluent A (0.5 mM Na2CO3 and 0.75 mM NaOH). An example of the resulting chromatogram with the respective time program is shown in Fig. 4. In this example, the fraction of eluent B was increased to 50% shortly before the beginning of the analysis to shorten the analysis time before the F− peak eluted. At retention time t=5 min eluent B was set to 0 %, which enabled a baseline separation of the MCAs. At t=15 min, eluent B was rapidly increased to 50 % to accelerate the analysis and, additionally, to obtain sharper peaks of and the DCAs. For subsequent analyses, it was important to decrease eluent B to 0 % at t=38 min. Otherwise, a shift of the retention times in the next analysis occurred because of a carryover of eluent B. Thus, the column was flushed with 100 % eluent A between analyses. The overall eluent profile is shown in Fig. 4a.
Although the MCA separation was improved by applying the described gradient, no baseline-separated pyruvate and Br− was observed. In addition, the DCA eluted very closely and oxalate co-eluted with the tail of the peak.
Changing the oven temperature was also considered. All measurements with the Metrosep A Supp 16 250 mm were executed with a temperature of 65 ∘C, which is the maximum temperature of the oven. Tests with 55 ∘C resulted in a shift of the retention times compared to an analysis with 65 ∘C, which is shown in Fig. S15. While the oxalate peak was sharper for the lower oven temperature, separation of the pyruvate and Br−, as well as the other DCAs, was still not satisfactory.
To improve peak resolutions, the Metrosep A Supp 16 250 mm was extended with an additional Metrosep A Supp 16 150 mm (Metrohm, Switzerland) column. An even longer second column could not be chosen because of a system pressure limitation of 20 MPa that would otherwise be exceeded. Due to the increased back-pressure of the coupled columns, it was necessary to keep the oven temperature at 65 ∘C because lower temperatures would increase the system pressure above its limit. The chromatogram in Fig. 5 shows an improved separation with the extended column system.
The gradient profile was adjusted for this separation. First analyses were performed with the described profile of Fig. 4 but the retention times were not stable. The longer analysis time of 52.5 min and thus the shorter regeneration time between the analyses led to a carryover of eluent B. Therefore, other gradient profiles were tested and the best result was found for starting with 100 % of eluent A. Afterwards, eluent B was slowly increased to 40 % from t=8 min until t=25 min. This ensured a proper separation of all MCAs. The concentration of eluent B was kept constant until t=50 min, yielding an improved separation of DCAs as well as of and oxalate, even for higher concentrations. After t=50 min, eluent B was decreased to 0 %. The overall eluent profile is shown in Fig. 5. The small peak behind acetate was identified as lactate. This ion was only detected in standard solutions and was not observed in ambient samples. Thus, a contamination from the chemicals or glassware used is likely.
The described method allowed for the proper separation of all organic target anions, which is why this system was selected and applied for real atmospheric analyses.
3.2 Limits of detection, linearity and precision
All values of the limits of detection (LODs), linearity and precision for each species are given in Table 3. The linearity of the calibration curve was determined after Funk et al. (2005). For the linear calibration function (), the slope b and the intercept a can be calculated as follows (DIN 32645, 2008):
where Qxx, Qyy, and Qxy are the square sums, and the means, and n the number of calibration points.
Table 3Type of calibration curve, LODs and the method precision for each ion.
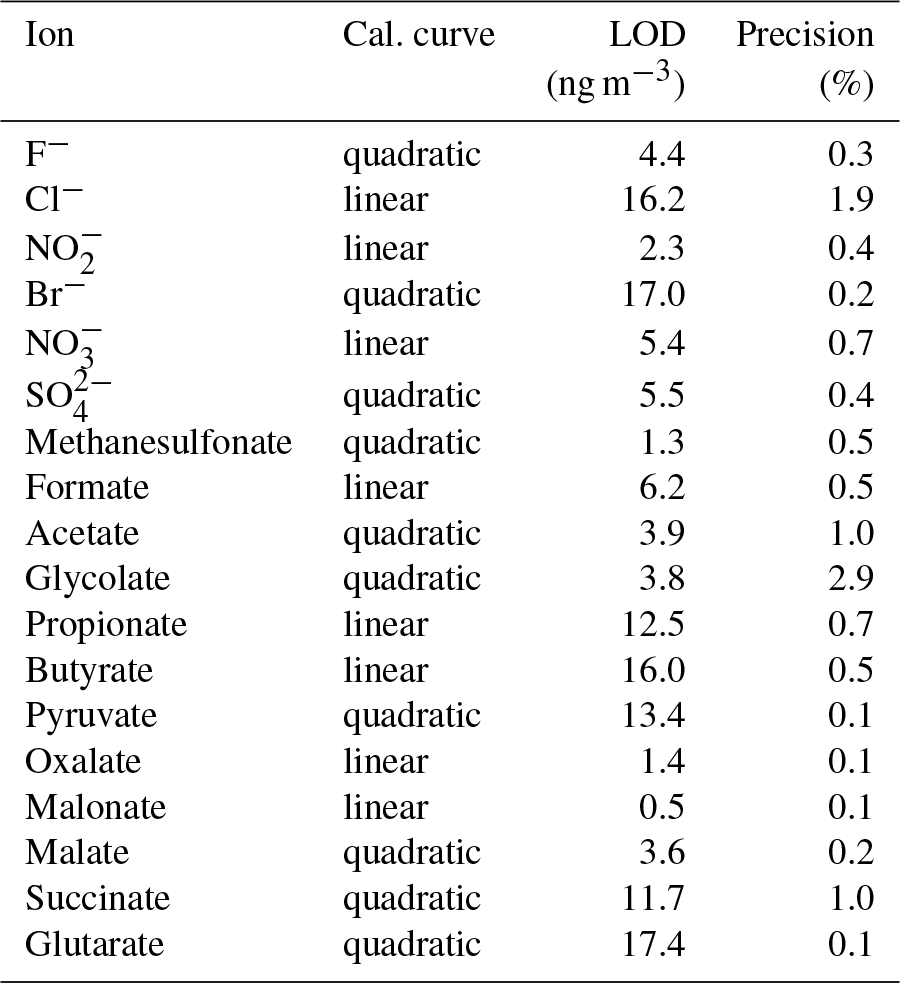
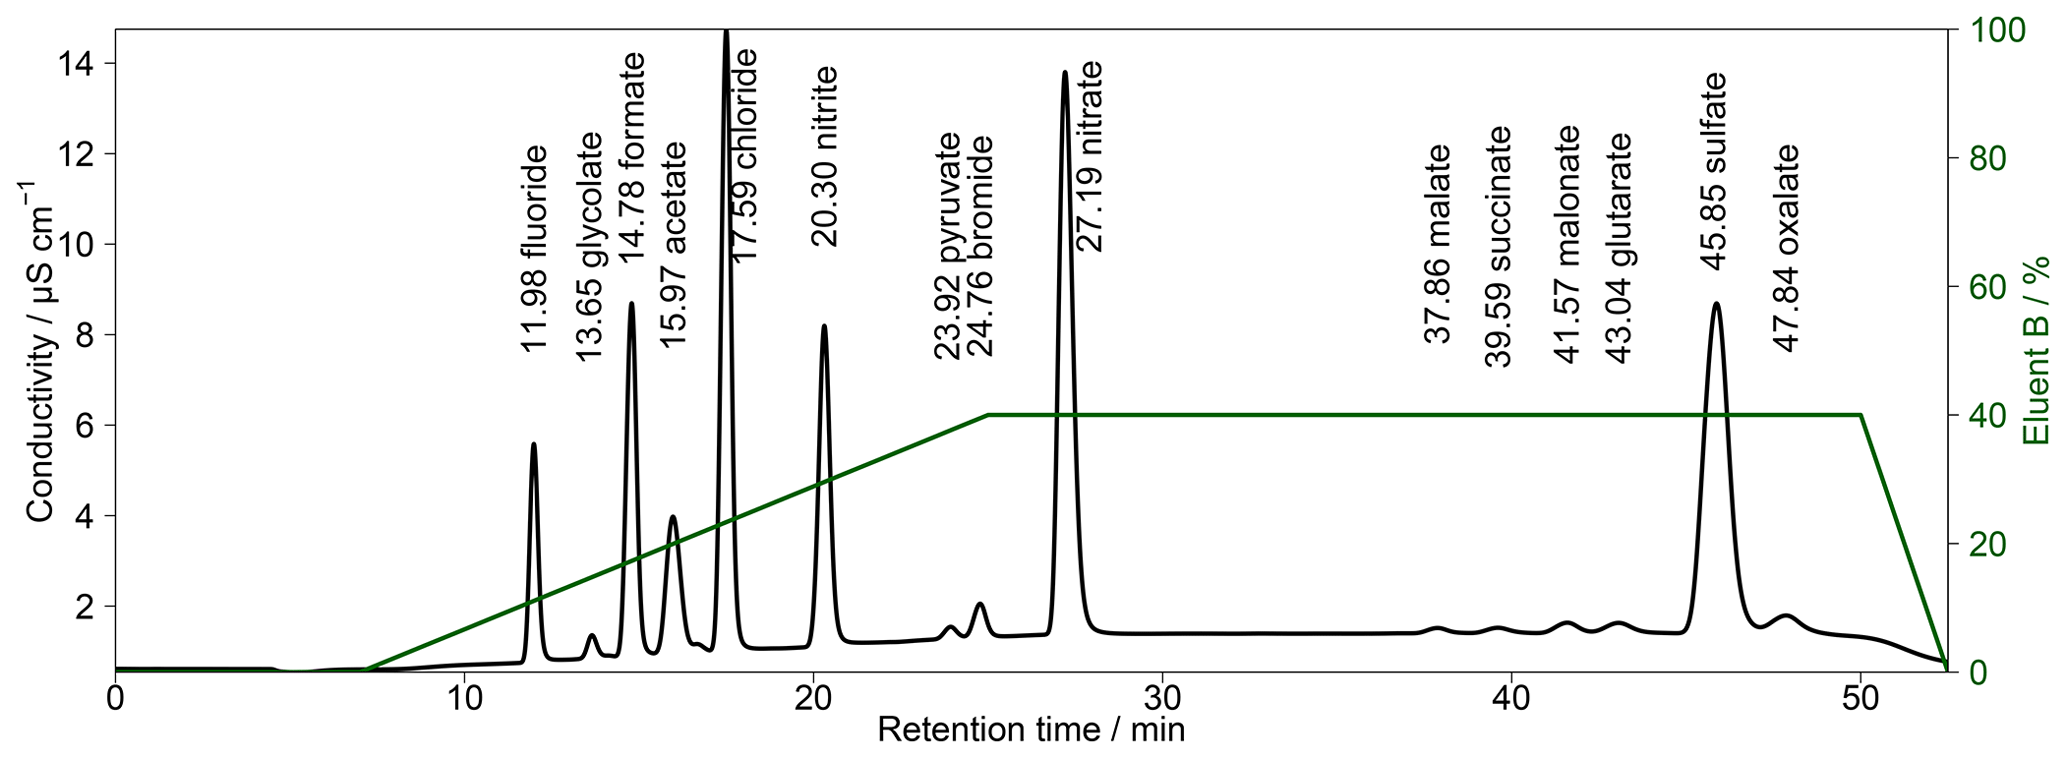
Figure 5Chromatogram of combined Metrosep A Supp 16 250 and 150 mm columns with a gradient eluent. The concentrations of the standard solution are 50 µg L−1 for Cl−, , formate and acetate; 100 µg L−1 for and ; and 10 µg L−1 for F−, Br− and all organic acids. Numbers in front of the ion names indicate the retention times in minutes. The fraction of eluent B within the eluent mixture over time is given as the green line. The eluent concentration of A is 0.5 mM Na2CO3∕0.75 mM NaOH and of B is 20 mM Na2CO3∕0.75 mM NaOH. T=65 ∘C and eluent flow is 0.8 mL min−1.
The calibration of a nonlinear second-order function () was calculated considering DIN ISO 8466-2 (2004). Simultaneous to Eqs. (1) to (3), the following quadratic sums were added.
The intercept a and the coefficients b and c were calculated as follows.
The residual standard deviation for the linear sy,l and the nonlinear case sy,nl is
To test each ion's linearity, the difference of the variances DS2 was calculated after Funk et al. (2005):
with a degree of freedom of f=1. For an F test, the test value (TV) was determined:
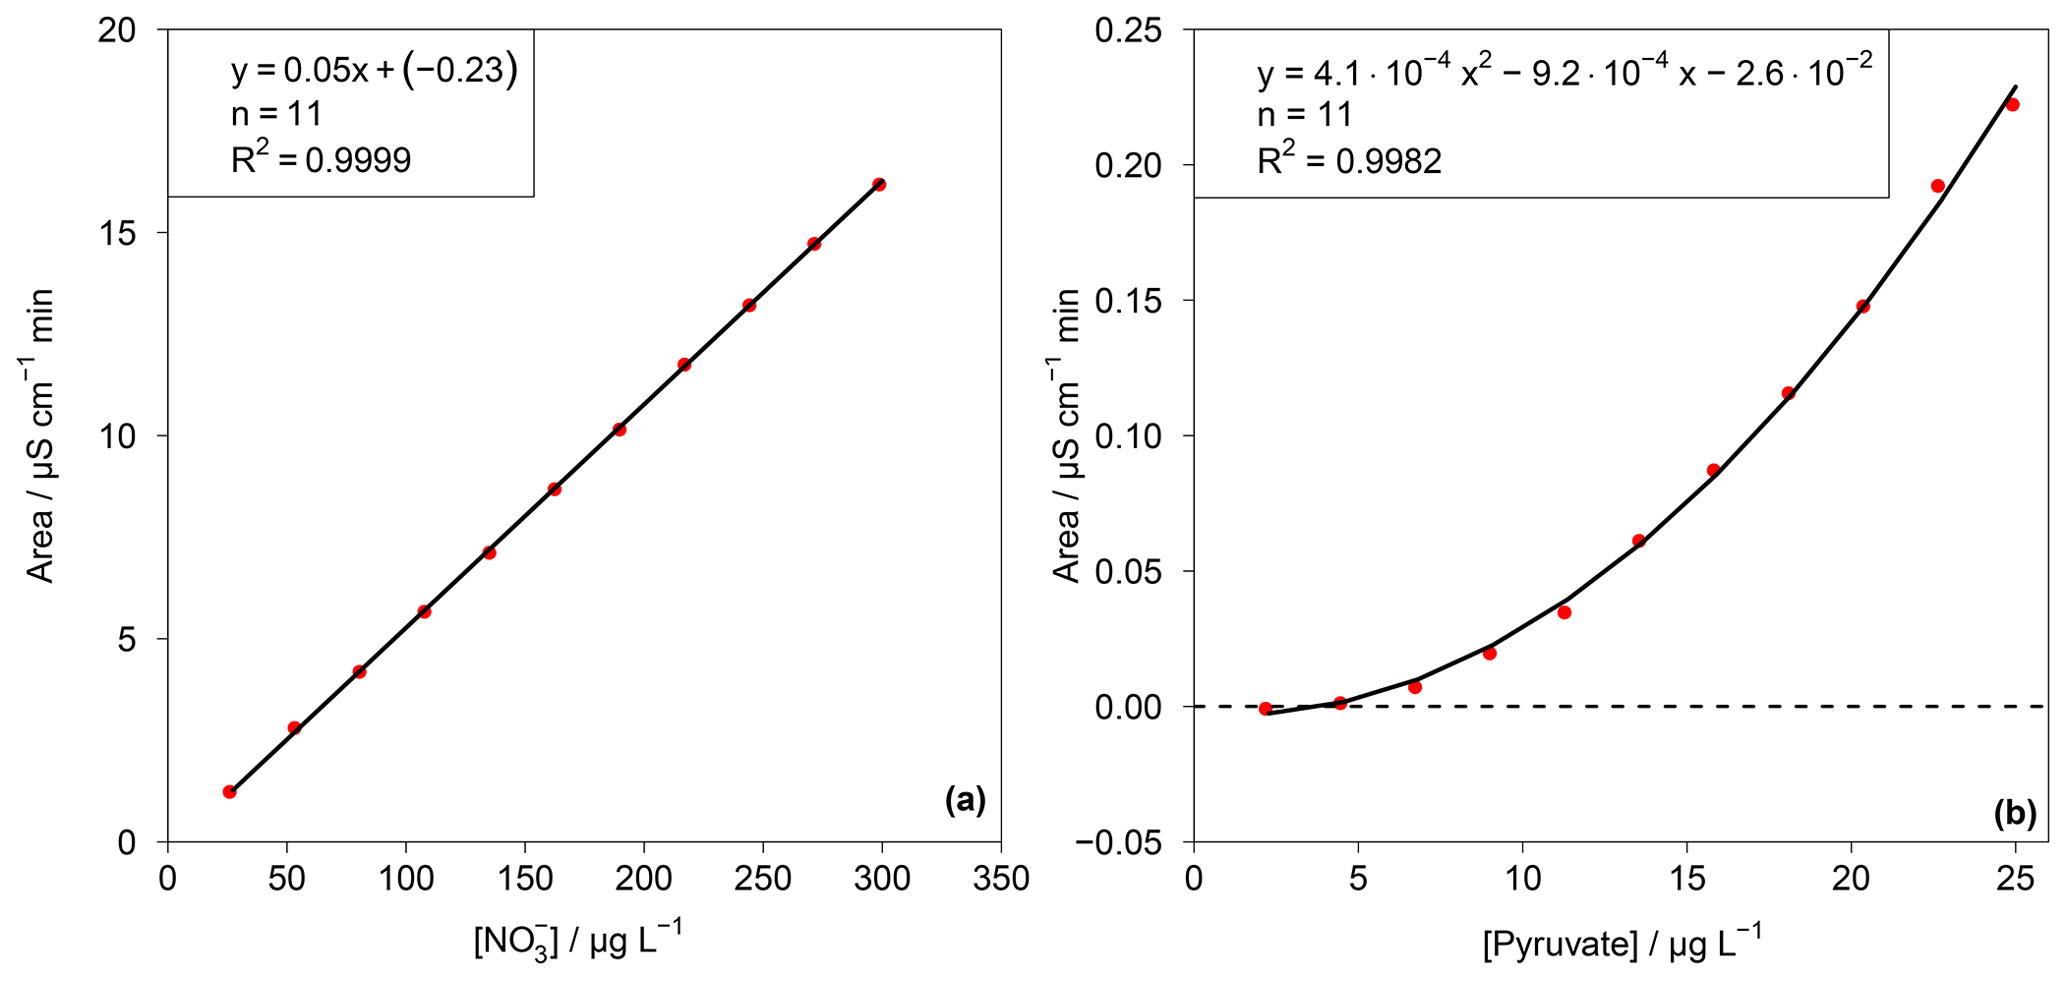
This test value was compared with an F test table (f1=1, , P=99 %). If TV≤F, the calibration function is linear. For the other cases, the calibration function is a nonlinear second-order function. In the case of the present work F=11.26. The resulting TV values for each ion are summarized in Table S1 in the Supplement. Depending on the result of the linearity test, linear or quadratic calibration functions were fitted. As examples for a linear and a quadratic fit, the calibration functions of and pyruvate are displayed in Fig. 6. Other calibration functions are given in the Supplement (Fig. S16). The linearity test was performed through a double injection of 11 standards with evenly distributed concentrations over 1 order of magnitude, for which the maximum concentration corresponded to standard 3 in Table 1.
The LODs for the Compact IC were estimated from mean blank values plus 3 times the standard deviation (3σ). For species that were not found in the blank measurements, the LOD represents the smallest observable peak. The LODs as atmospheric concentrations varied between 0.5 ng m−3 for malonate and 17.4 ng m−3 for glutarate and were considered sufficiently low for field application of the system. The precision of the method was calculated as the relative standard deviation (RSD) of the peak area of 11 injections of standard 3 (Table 1) over 1 month. For all ions, the precision is below 3 %, indicating a good repeatability.
3.3 Sample handling
For the combination of the MARGA and the Compact IC, the liquid flows in the system had to be adjusted to achieve a high time resolution and to analyze the solutions as fast as possible after the sampling. As an overview, a schematic setup and a time diagram in Fig. 7 display the important steps for the CA analysis of the WRD and SJAC samples. Therein, the sampled airflow is described with green arrows. Syringe pumps within the MARGA collected the dissolved ions within the WRD (blue arrows) and SJAC (red arrows) solutions. This sampling required 1 h and yields 25 mL of sample solution in each of the two syringes.
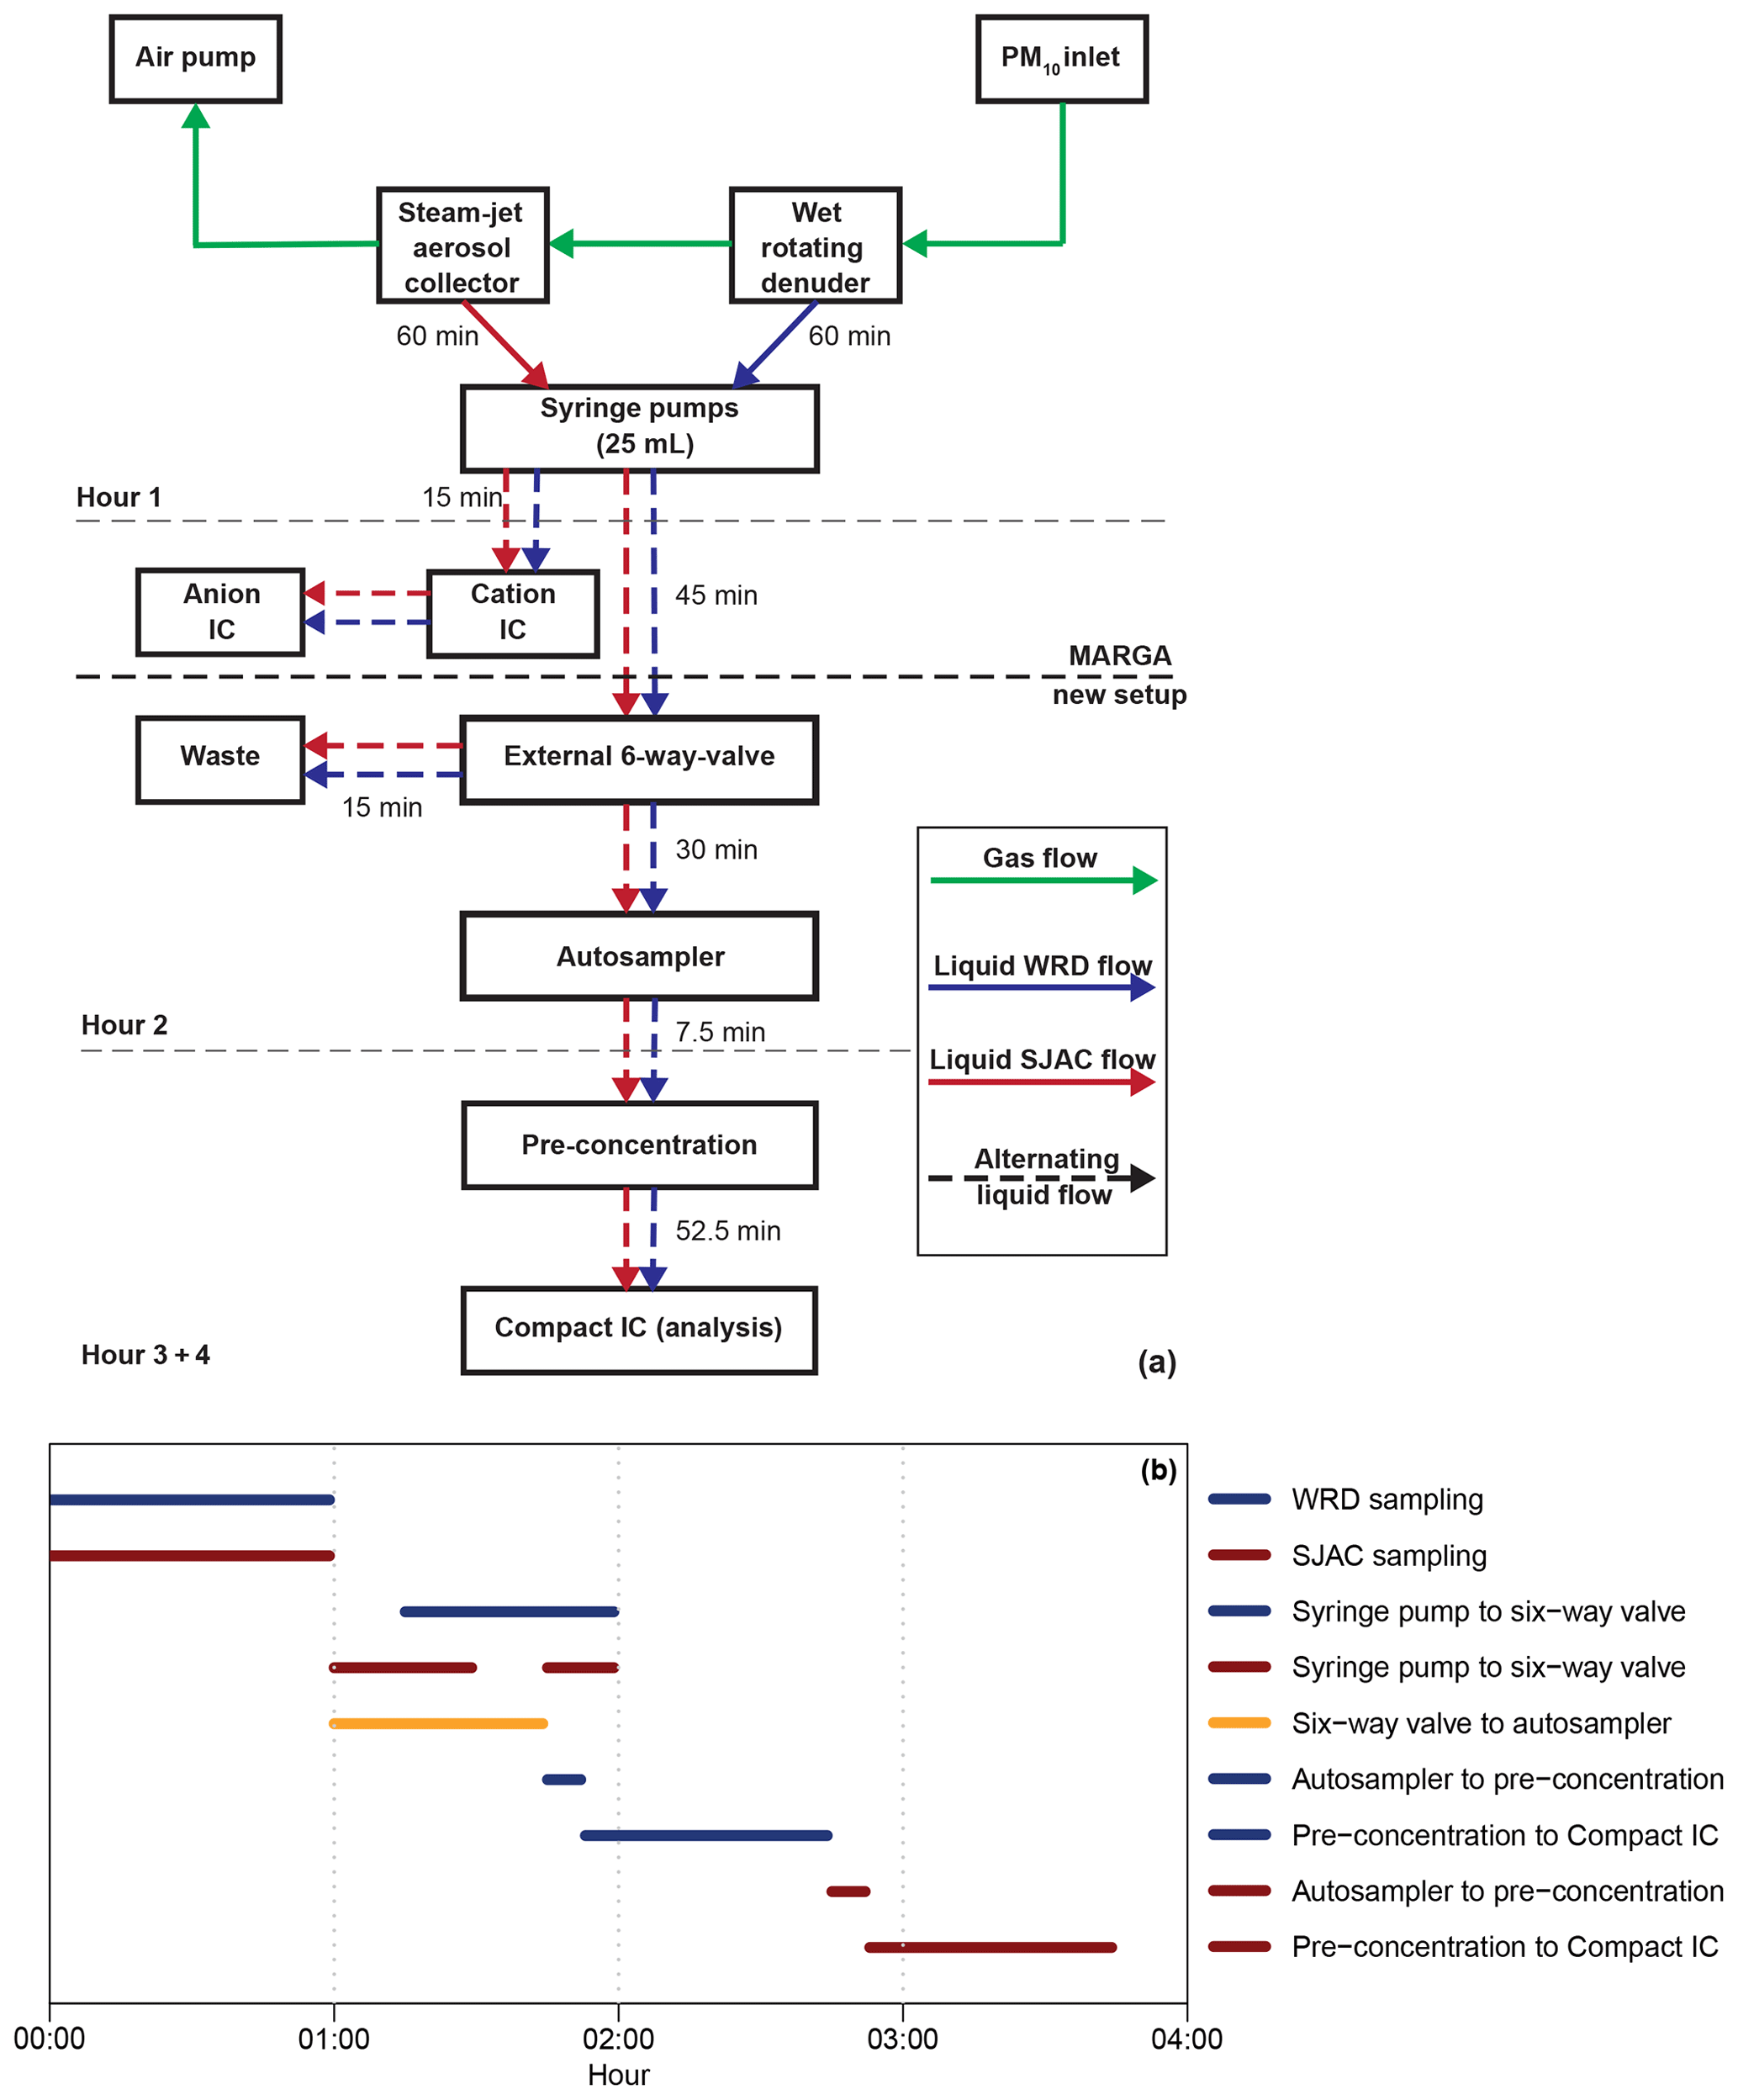
Figure 7(a) Schematic overview of the sample handling for the complete setup (MARGA, autosampler and Compact IC). Green arrows illustrate gas flow, while blue and red are the aqueous WRD and SJAC samples, respectively. The time on the arrows represents the flow duration. Dashed arrows stand for alternating flows. Dashed grey lines illustrate the hourly time steps, while the bold dashed black line is the border between MARGA and the Compact IC. (b) Time diagram of the liquid handling (blue: WRD; red: SJAC). Black is the open mode of the six-way valve for liquid transport from the syringe pumps to the autosampler.
In the second hour, the MARGA syringe pumps transported the solutions to the IC system within the MARGA for analysis of the inorganic compounds, and the solutions were transported to the autosampler and Compact IC where the organic compounds were quantified. Thereby, the WRD solution was injected with a flow of 0.417 mL min−1 into the MARGA-IC to rinse the sampling lines and to fill the injection loop for the first 13 min. Afterwards the analysis of this sample followed for 17 min. In the second 30 min interval, the SJAC sample was injected and analyzed. Only during the injections into the MARGA-IC of both the WRD and SJAC samples, were no solutions transported via an external six-way valve (Fig. 1g) to either the autosampler or the waste. As the vials in the autosampler had a volume of 12.5 mL, the six-way valve transferred the samples from the WRD and SJAC to the autosampler only for the first 45 min and the rest of the solutions were directed to waste. In the third hour, the WRD sample was pre-concentrated and was analyzed by the Compact IC. Afterwards, the SJAC sample was pre-concentrated and was analyzed in the fourth hour.
To achieve a pre-concentration and analysis of one sample in 1 h, the transfer of analytes from the autosampler to the Compact IC and the pre-concentration of the sample had to be performed within the remaining 7.5 min, as the final Compact IC analysis described previously needed 52.5 min. Therefore, the sample flows were increased to 4 mL min−1, which is the maximum for what is allowed for the pre-concentration column. For the quantification of the organic acids with the Compact IC, the hourly integrated MARGA samples were collected every 2 h.
In the following, the MARGA and the Compact IC analysis will be distinguished. Ions analyzed by the MARGA were measured by the original MARGA system, while ions from the Compact IC were measured by the added setup.
3.4 MARGA absorption solution
The original MARGA absorption solution in the denuder and SJAC contains 10 mg L−1 H2O2 to avoid biological contamination of the system and to oxidize absorbed SO2 into . However, H2O2 can affect the concentration of dissolved CAs through oxidation. As an example, Schöne and Herrmann (2014) described a fast degradation of pyruvate in an aqueous H2O2 solution and a simultaneous increase in acetate as a product. This would result in incorrect concentrations within the aqueous gas- and particle-phase samples. Therefore, H2O2 was not added during the CA measurements and ultrapure water was used as the absorption solution. With the missing oxidant, however, an underestimation of measured MARGA SO2 occurred that required further adjustments. A MARGA software update by Metrohm Applikon (the Netherlands) allowed for integration of the sulfite peak and calculation of the overall SO2 concentration as a sum of sulfite and . For the Compact IC analysis, the sulfite peak was located between glutarate and and did not interfere with the quantification of the organic acids.
Because of the missing biocide H2O2, the MARGA was cleaned more frequently, at least every 2 weeks to avoid bacterial contamination. The WRD and SJAC were rinsed with ethanol as well as ultrapure water and afterwards a system cleaning procedure was applied. Therein, the absorption solution was replaced by a 1 % H2O2 solution with maximal syringe pump speed for at least 3 h. Before the next MARGA analysis, the complete MARGA system was rinsed for 2 h with ultrapure water to remove the H2O2.
3.5 WRD efficiency and WRD particle collection
When measuring the gas and particle phases with a combination of WRD and SJAC, the collection efficiency of gases and the particle penetration within the denuder should be investigated. In the literature, experimentally derived collection efficiencies are available for annular denuders that correspond with the WRD within the MARGA. Wyers et al. (1993) published an NH3 efficiency of 98 % with an air flow of 30 L min−1. Khlystov et al. (2009) investigated the HNO3 breakthrough in the presence of particles. They found a breakthrough of 0.6 % under urban background conditions. The MARGA manufacturer Metrohm Applikon already tested the denuder efficiency of the WRD for SO2 and found a recovery of 99.7 % (Rob Proost and Metrohm Applikon, personal communication, 2018).
Table 4Diffusion coefficients (D) calculated according to Fuller et al. (1966) and calculated annular denuder efficiencies (E) according to the equations of Winiwarter (1989), Possanzini et al. (1983), De Santis (1994) and Berg et al. (2010) for gases.
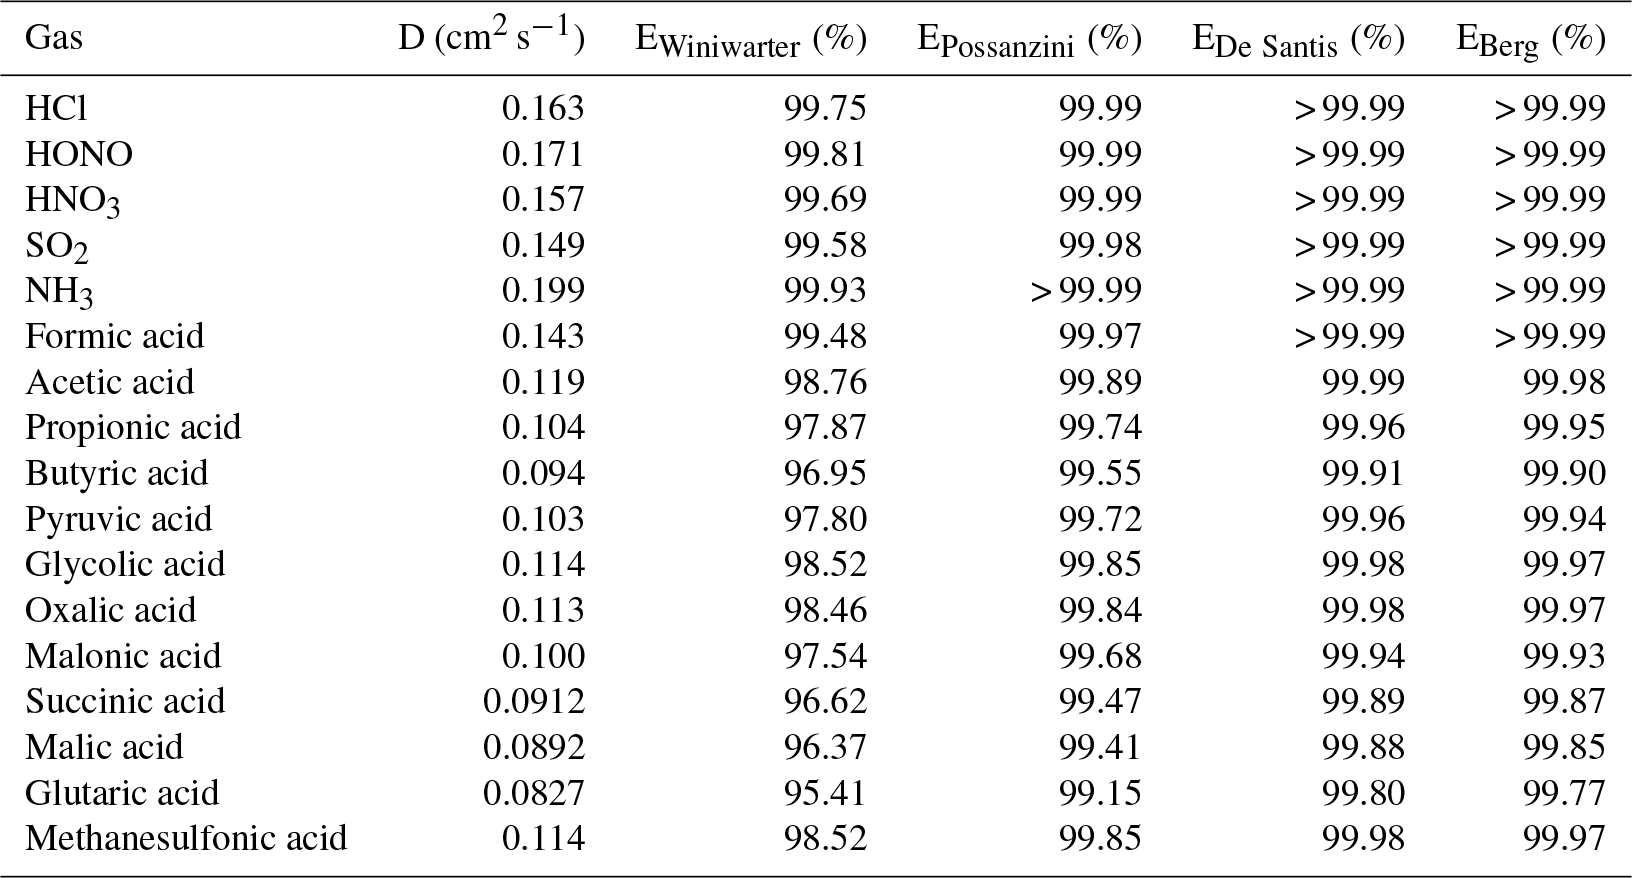
In the present study, the collection efficiencies of the annular WRD were theoretically calculated for the different inorganic and organic acids following different approaches suggested in the literature (Possanzini et al., 1983; Winiwarter, 1989; De Santis, 1994; Berg et al., 2010). For each approach, all equations for the denuder efficiency calculation are given in the Supplement. Calculated denuder efficiencies are summarized in Table 4. The calculated efficiencies according to Possanzini et al. (1983), De Santis (1994) and Berg et al. (2010) are higher than 99 %, indicating a nearly complete absorption of the investigated gases within the WRD. Denuder efficiencies derived from the approach of Winiwarter (1989) range between 95 % for glutaric acid and nearly 100 % for the inorganic gases as well as formic acid. However, compared to the other three studies, Winiwarter (1989) did not consider the geometry of an annular denuder in his approach and is therefore considered to be less accurate. Regarding the efficiencies calculated after Possanzini et al. (1983) and the highest formic acid gas-phase concentrations of 7.58 µg m−3 measured by the Compact IC, the potential particulate artifact concentration would result in 2.3 ng m−3, which is below the LOD of the method. The calculated WRD efficiencies of Possanzini et al. (1983) were used to calculate the potential particulate artifact concentrations from the gaseous concentrations for the complete measurement campaign. These concentrations were compared with real particulate concentrations. It was found that the artifact concentration is far below the real measurements. Only an average of 0.15 % of the real particulate formate concentrations could be explained by possible formic acid breakthrough. For acetate, propionate, butyrate, pyruvate and glycolate, percental values of 3.7 %, 0.6 %, 0.3 %, 0.4 % and 0.2 % were calculated, respectively, and were similarly low. Thus, interferences of gaseous compounds in the SJAC are negligible.
Another method to evaluate the WRD collection efficiency of gases is the comparison of measured compounds that are predominantly found in the gas phase. The inorganic nitrite () of HONO is quantified by the Compact IC. The concentration within the particle phase is near zero. For the three highest HONO concentrations during the measurement campaign (on average 5.1 µg m−3) only 66.2 ng m−3 of particle-phase was observed, resulting in a maximum HONO breakthrough of 1.3 %. The same calculation was performed for formic and acetic acid, which are most abundant in the gas phase (Nah et al., 2018a), resulting in a potential maximal breakthrough of 0.7 % and 0.1 %, respectively. Thus, the calculated denuder efficiencies are in same range with the experimental derived ones reported in the literature.
For the WRD particle collection, Wyers et al. (1993) investigated possible particulate ammonium collection within the denuder. A sampling of ammonium sulfate particles of 0.1 and 1 µm median volume diameter resulted in a particle collection of 0.6 % within the denuder for both sizes. In the same range are the experimentally derived particle collections of Possanzini et al. (1983) with 0.2 % for 0.3–0.5 µm particles and 1.4 % for particles larger than 3 µm.
The three highest concentrations of the DCAs were compared with the gas-phase concentrations measured in the field. The oxalate concentrations in the particle phase ranged between 327 and 543 ng m−3. At the same time, no gas-phase concentrations were detected. For the other particulate dicarboxylic acids and methanesulfonate, detectable gas-phase concentrations were not observed during periods with high particulate concentrations, indicating a negligible effect of particle collection within the WRD.
In conclusion, the calculated denuder efficiencies that are in agreement with the literature as well as low rates of denuder breakthrough and low particulate losses within the WRD approve the use of a coupled WRD–SJAC system as a valid method to separate the gas and particle phases for the sampling of the low-molecular-weight organic acids.
3.6 Intercomparison of inorganic ions
Both the MARGA and Compact IC determined the inorganic compounds in the gas and particle phases from the same aqueous solution but used different IC methods, including a different calibration, different sample enrichments, different separation columns, and different eluent compositions and profiles. For quality assurance, the inorganic ions were compared in the gas and particle phases for the complete 1-year field application of the extended MARGA system and the results are summarized numerically in Table 5 as well as graphically in Figs. S17 and S18.
Table 5Orthogonal regression parameters of the comparison of inorganic compounds measured by the MARGA and Compact IC in Melpitz for 1 year. Scatter plots are given in Figs. S17 and S18.
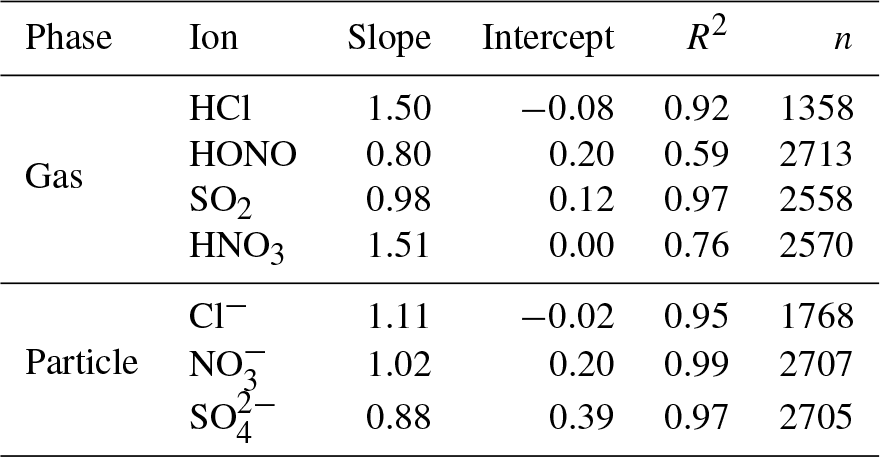
The Cl−, and concentrations measured by the MARGA and the Compact IC were in good agreement with R2=0.95, R2=0.97 and R2=0.99, respectively, and slopes were close to unity. It should be noted that the MARGA measured the overall SO2 concentration because of the quantification of sulfite and , while the Compact IC quantified only and not the sulfite peak. Thus, higher MARGA SO2 concentrations were expected. An underestimation of the SO2 concentration by the Compact IC was indeed obvious, especially for lower concentrations. However, the overall correlation for SO2 was found to be good, with a slope of 0.98 and a R2 of 0.97. It is likely that the WRD absorbed gaseous atmospheric oxidants that oxidized sulfite into in the aqueous WRD solution, even without the addition of H2O2 to the absorption solution, as described above. With slopes of around 1.5, the regression parameters of HCl and HNO3 are comparable with each other. The slope for the HCl comparison is a result of three MARGA outliers with concentrations higher than 4 µg m−3. Without these outliers the slope decreased to 1.16 and the coefficient of determination to R2=0.79. A decrease from R2=0.77 to R2=0.57 was observed when HNO3 concentrations above 3 µg m−3 were removed. The elimination of the outliers did not result in an improvement of the slope. In the case of HNO3 and partly of HCl, the MARGA quantified higher concentrations for the same aqueous solution. Rumsey and Walker (2016) found a quadratic response for low HNO3 concentrations and hypothesized an overestimation of MARGA concentrations. The same was possible for HCl. In the present study, the particulate concentrations were higher and the quadratic influence is of minor importance, leading to slopes near unity.
The HONO comparison revealed an obvious scattering (R2=0.59). Possible reactions between sampling and analysis altered the HONO concentrations. Spindler et al. (2003) observed and quantified the artifact sulfate and HONO formation by reactions of dissolved NO2 and SO2 within the aqueous solution of the WRD. Such artifact formation could occur as the MARGA and Compact IC analyses for the same WRD sample are temporally shifted by 1 h. However, the intercomparison of the more stable inorganic ions demonstrated a good comparability between the MARGA and Compact IC data.
3.7 Example application in the field
To prove the suitability of the complete setup, 2 weeks of the 1-year measurement campaign are presented. Figure 8 displays the measured organic acids in the gas and particle phases from 3 to 14 May 2017. Included grey shaded periods display downtimes of both the MARGA and the Compact IC because of the MARGA cleaning procedure (12 May), blank measurements of the complete new MARGA setup (12 May) or measurements of calibration standards (5, 9, 12 May). Table 6 gives the percentage of data coverage, i.e., concentrations above LOD, for each organic acid in the gas and particle phases during the uptime periods.

Figure 8Measured concentrations for gaseous formic, acetic, propionic, butyric, glycolic and pyruvic acid as well as for particulate glycolate, methanesulfonate and oxalate from 3 to 14 May 2017 for an example application. The shaded grey areas represent periods without data because of instrumental issues.
Very good data coverages were found for formate and acetate in both phases as well as for glycolate and methanesulfonate in the particle phase with percentage values of over 90 %. Table 6 indicates the dominance of non-glycolate MCAs in the gas phase while DCAs were predominantly detected in the particle phase. This finding is in agreement with the higher vapor pressures of MCAs (Howard and Meylan, 1997).
Table 6Data coverage for the organic species measured in the gas and particle phases from 3 to 14 May 2017 during instrument uptime periods shown for data above the LOD.
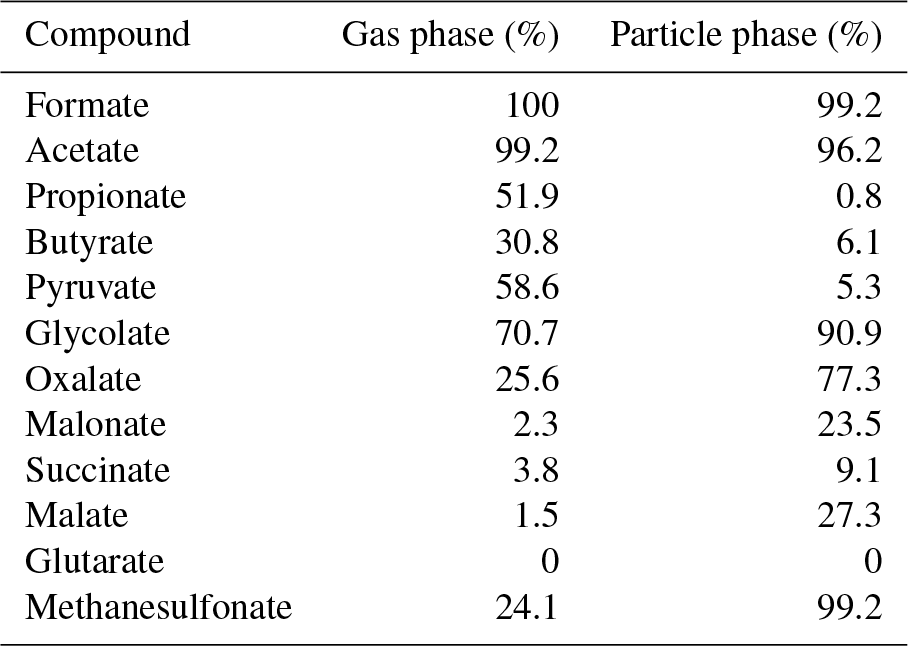
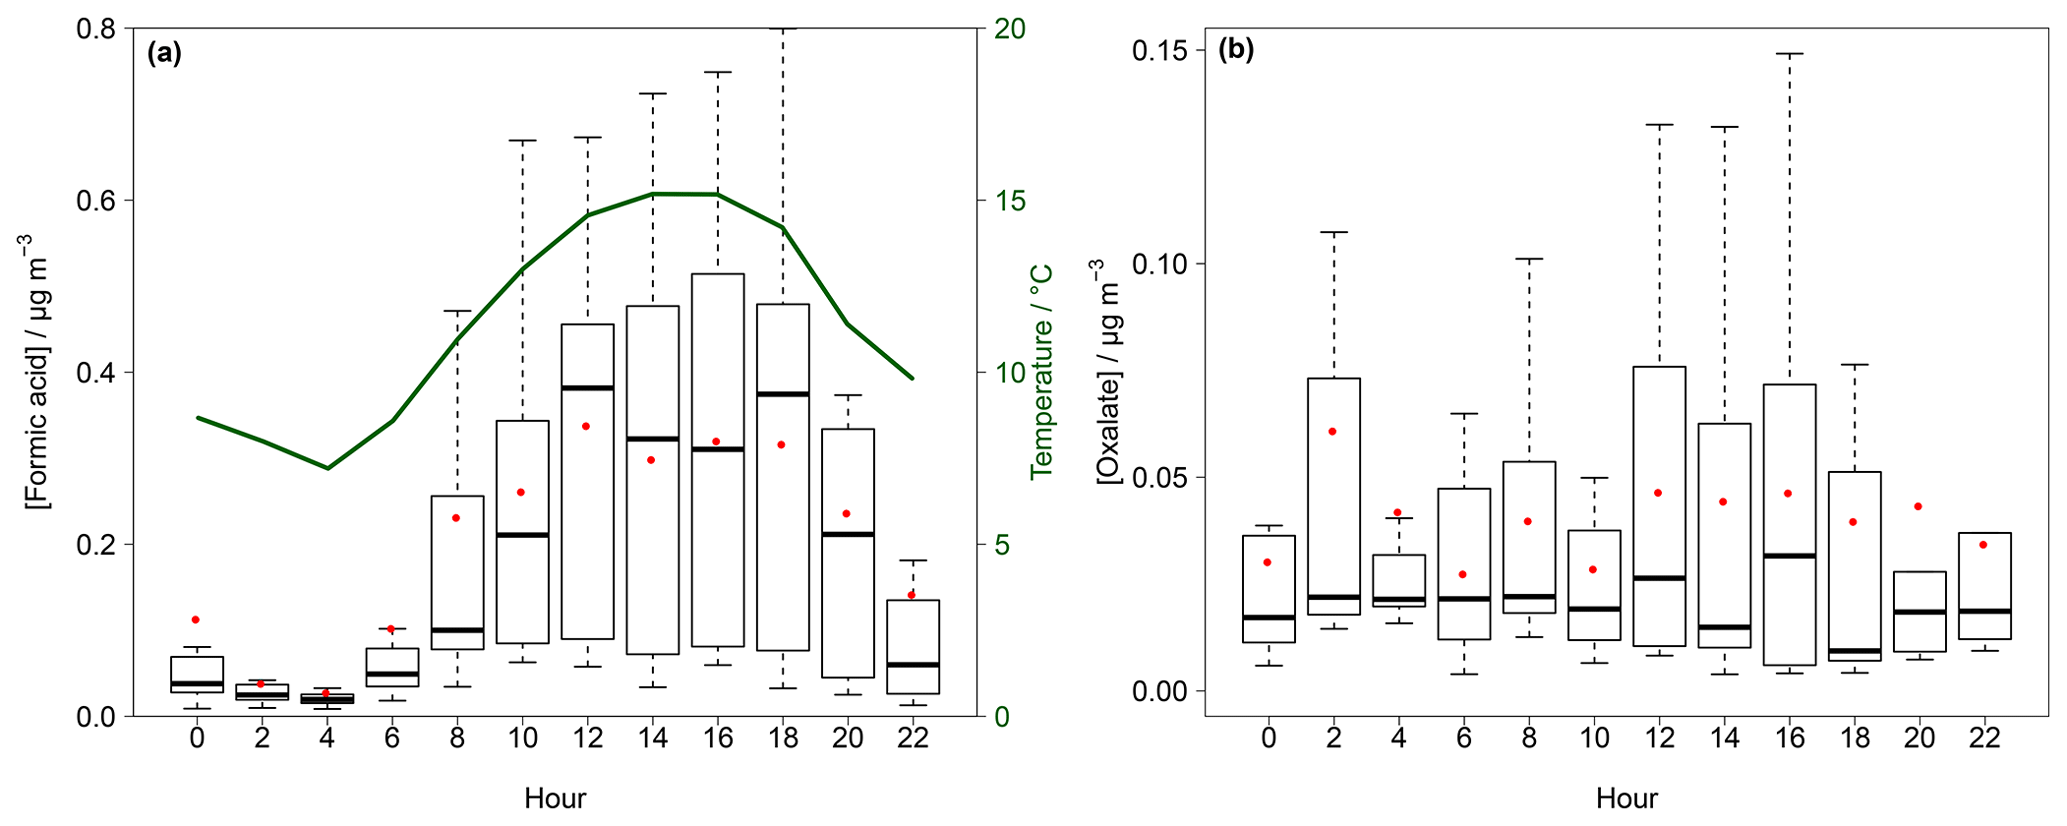
Figure 9Box–whisker plot for the diurnal variation in gaseous formic acid (a) and particulate oxalate (b) in Melpitz for the example application in the field. The red dots represent the mean, the box the 25th and 75th percentiles, and the upper whisker the 75th percentile plus the 1.5-fold interquartile range (IQR) and the lower whisker the 25th percentile minus the 1.5-fold IQR. In (a) the average temperature is given in green.
For the calculations of mean concentrations, all values below LOD were included and not-detected data were set to zero. Mean (maximum) concentrations of 306 ng m−3 (2207 ng m−3) were observed for gaseous acetic acid followed by formic 199 (919), propionic 83 (524), pyruvic 76 (253), butyric 34 (343) and glycolic acid 32 ng m−3 (259 ng m−3). This is in agreement with other studies. In the city of Zurich, Switzerland, Fisseha et al. (2006) monitored mean concentrations of acetic acid of between 1.09 µg m−3 in September and 1.97 µg m−3 in March. Formic and propionic acid ranged between 0.24 and 1.07 µg m−3 and between 0.16 and 0.03 µg m−3, respectively. Another urban site is described by Lee et al. (2009). In Seoul, they reported formic, acetic and propionic acid concentrations of around 3.83, 4.99 and 1.54 µg m−3, respectively. Higher concentrations of formic and acetic acid at urban sites could be favored due to anthropogenic emissions. Khare et al. (1999) and references therein summarized formic and acetic acid concentrations and reported concentrations of 1.72 and 2.25 µg m−3 at a semiurban site in central Germany, respectively. The amount of formic and acetic acid measured at the semiurban site Bondville, United States, is around 0.6 and 1 µg m−3, respectively (Ullah et al., 2006). Nah et al. (2018a) detected averaged concentrations of formic and acetic acid of 2.2 and 1.9 µg m−3, respectively, at the rural Yorkville, Georgia, site.
DCAs and methanesulfonate were rarely detected in the gas phase due to the low vapor pressures of these compounds. Thus, an existence of these species is more likely in the particle phase. However, malonate, succinate, malate and glutarate were rarely or not at all detected in the particulate phase (Table 6). Oxalate is the predominant DCA in the particle phase with a percentage data coverage of 77.3 %. Interestingly, formic and acetic acid were also detected in the particulate phase. Mean (maximum) concentrations of 31 (209), 30 (465), 34 (282), 26 (162) and 18 ng m−3 (54 ng m−3) were monitored for oxalate, methanesulfonate, formate, glycolate and acetate, respectively.
As a comparison, Parworth et al. (2017) detected average glycolate concentrations of 26.7 ng m−3 with a nighttime maximum of around 60 ng m−3 in Fresno during winter. Mean concentrations of particulate oxalate, acetate and formate of 0.07, 0.06 and 0.05 µg m−3, respectively, were measured by Nah et al. (2018a). Van Pinxteren et al. (2014) presented oxalate concentrations measured by impactors in Melpitz during autumn. A mean concentration of 52 ng m−3 was published. Additionally, mean values measured in Falkenberg (approximately 25 km northeast of Melpitz) during summer showed peaks at 80 ng m−3. A predominant peak of methanesulfonate was observed on 8 May 2017. This happened simultaneously with a sudden increase in wind speed (Fig. S19). Northwesterly winds transporting marine air masses to Melpitz appear to be the most likely explanation as marine DMS oxidizes within the aqueous phase to methanesulfonate (Hoffmann et al., 2016; Lana et al., 2011).
The comparison with the literature shows rather low concentrations of the organic acids in the particle phase during the example application in the field. A possible reason are the changeable weather conditions. The temperature varied during the first 7 days between 0 and 15 ∘C. Afterwards, sunnier and warmer conditions were present, resulting in an increase in formic, acetic and propionic acid concentrations, probably because of a relationship among temperature, global radiation and higher organic acid concentration.
The highest values for temperature and global radiation were observed during the daytime (Fig. S19) when elevated concentrations are expected. Diurnal cycles of formic acid and particulate oxalate are illustrated in Fig. 9a and b, respectively. Both compounds had the lowest concentrations in the early morning and increased in the afternoon until the maxima were reached in the evening following the observed average temperature. This trend is in agreement with previous studies (Lee et al., 2009; Millet et al., 2015; Khare et al., 1997; Nah et al., 2018b; Martin et al., 1991). During the night, concentration decreases due to deposition processes. Simultaneously, a decreasing surface temperature cools down the lower air layers, leading to an inversion layer that suppresses the vertical mixing. The increasing concentrations after sunrise are likely a result of downward mixing of enriched layers above the boundary layer (Khare et al., 1999). Biogenic emissions and photochemical processes lead to increasing concentrations during the daytime (Khare et al., 1999; Y. Liu et al., 2012).
Nah et al. (2018a) reached the same conclusion from their study. They found higher concentrations during warm and sunny days caused by elevated availability of biogenic precursors. During their 2-month measurement campaign in late summer and autumn, the maximum temperature ranged on average between 25 and 30 ∘C with high solar irradiances. Interestingly, for several days the temperature decreased below 20 ∘C with a simultaneous decrease of several DCA concentrations. Thus, the low concentration found during the example application is probably a result of lower temperatures, low global radiation and, probably, lower amounts of biogenic precursors in spring.
The application in the field demonstrates the suitability of the developed setup. The measured concentrations of low-molecular-weight organic acids in Melpitz are partly lower than concentrations, which can be found in the literature. The increase in the concentrations after 11 May 2017 indicates an influence of the increasing temperature and the available sunlight, which is needed for biogenic emissions or photochemical reactions of atmospheric precursors. Further in-depth analyses and detailed results of the 1-year measurements with the extended MARGA system will be presented elsewhere (Stieger et al., 2019).
An extension of the MARGA analysis was described to quantify online low-molecular-weight organic acids. Therefore, the MARGA was combined with a new setup consisting of an autosampler and a Compact IC with an internal pre-concentration. Laboratory optimizations of the Compact IC were performed to improve the separation of the target organic acids formate, acetate, propionate, butyrate, glycolate, pyruvate, oxalate, malonate, succinate, malate, glutarate and methanesulfonate. An upgrade to a gradient system and an extension of the Metrosep A Supp 16 column to a total length of 400 mm allowed for a satisfactory separation of all MCAs and DCAs with low limits of detection and precisions.
The example application of the system in May 2017 illustrated high concentrations of formic acid and oxalate in the late afternoon, indicating a photochemical formation by atmospheric precursors. Variations in the wind direction resulted in sudden changes in the concentrations, as was the case for methanesulfonate.
To the authors' knowledge, highly resolved data of low-molecular-weight organic acids are not available for rural central Europe. Before our investigation, a quantification of these acids in the particle phase was only possible with filter measurements resulting in a low time resolution and potential artifacts from adsorption or revolatilization. The results of the example application proved the suitability of the MARGA extension for field measurements. Compared to other online systems, the variety of quantifiable organic acids in the gas and particle phases is unique. The application of this online method reduces laboratory work and sampling artifacts by filter and impactor measurements. Additionally, obtaining information of the organic acids every second hour allowed for the investigation of diurnal cycles, improving the knowledge of their primary and/or secondary sources. For the investigation of tropospheric multiphase chemistry, simultaneous quantification of the gas- and the particle-phase concentrations promises interesting analyses of the phase distribution of each organic acid.
Data can be made available by the authors upon request.
The supplement related to this article is available online at: https://doi.org/10.5194/amt-12-281-2019-supplement.
HH provided the concept for the MARGA extension. BS performed the experimental development, the calculations, the combination in the field, and the measurements and wrote the paper. GS, DvP and HH contributed ideas and suggestions during the method development and the field measurements. AG helped during infrastructural issues in Melpitz. All authors provided additional input and comments during the preparation of the paper.
The authors declare that they have no conflict of interest.
We thank René Rabe for the support, especially in the field. The authors
acknowledge financial support for this study and the deployment of the MARGA
system from the German Federal Environment Agency (UBA) research foundation
under contract no. 52436 as well as from the European Regional Development
fund by the European Union under contract no. 100188826. This study is partly
supported by ACTRIS-2 (Aerosol, Clouds, and Trace gases Research
InfraStructure network) from the European Union's Horizon 2020 research and
innovation program under grant agreement no. 654109.
The publication of this article was funded by the
Open Access Fund of the Leibniz
Association.
Edited by: Pierre Herckes
Reviewed by: two anonymous referees
Bao, L. F., Matsumoto, M., Kubota, T., Sekiguchi, K., Wang, Q. Y., and Sakamoto, K.: Gas/particle partitioning of low-molecular-weight dicarboxylic acids at a suburban site in Saitama, Japan, Atmos. Environ., 47, 546–553, https://doi.org/10.1016/j.atmosenv.2009.09.014, 2012.
Berg, J. M., James, D. L., Berg, C. F., Toda, K., and Dasgupta, P. K.: Gas collection efficiency of annular denuders: A spreadsheet-based calculator, Anal. Chim. Acta, 664, 56–61, https://doi.org/10.1016/j.aca.2010.02.006, 2010.
Bock, N., Baum, M. M., Anderson, M. B., Pesta, A., and Northrop, W. F.: Dicarboxylic Acid Emissions from Aftertreatment Equipped Diesel Engines, Environ. Sci. Technol., 51, 13036–13043, https://doi.org/10.1021/acs.est.7b03868, 2017.
Boreddy, S. K. R., Mochizuki, T., Kawamura, K., Bikkina, S., and Sarin, M. M.: Homologous series of low molecular weight (C1-C10) monocarboxylic acids, benzoic acid and hydroxyacids in fine-mode (PM2.5) aerosols over the Bay of Bengal: Influence of heterogeneity in air masses and formation pathways, Atmos. Environ., 167, 170–180, https://doi.org/10.1016/j.atmosenv.2017.08.008, 2017.
Boring, C. B., Al-Horr, R., Genfa, Z., Dasgupta, P. K., Martin, M. W., and Smith, W. F.: Field measurement of acid gases and soluble anions in atmospheric particulate matter using a parallel plate wet denuder and an alternating filter-based automated analysis system, Anal. Chem., 74, 1256–1268, https://doi.org/10.1021/ac015643r, 2002.
Chen, X., Walker, J. T., and Geron, C.: Chromatography related performance of the Monitor for AeRosols and GAses in ambient air (MARGA): laboratory and field-based evaluation, Atmos. Meas. Tech., 10, 3893–3908, https://doi.org/10.5194/amt-10-3893-2017, 2017.
Crisp, T. A., Brady, J. M., Cappa, C. D., Collier, S., Forestieri, S. D., Kleeman, M. J., Kuwayama, T., Lerner, B. M., Williams, E. J., Zhang, Q., and Bertram, T. H.: On the primary emission of formic acid from light duty gasoline vehicles and ocean-going vessels, Atmos. Environ., 98, 426–433, https://doi.org/10.1016/j.atmosenv.2014.08.070, 2014.
Dawson, G. A., Farmer, J. C., and Moyers, J. L.: Formic and Acetic-Acids in the Atmosphere of the Southwest USA, Geophys. Res. Lett., 7, 725–728, https://doi.org/10.1029/GL007i009p00725, 1980.
De Santis, F.: Comment on Wet Effluent Denuder Coupled Liquid/Ion Chromatography Systems: Annular and Parallel Plate Denuders, Anal. Chem., 66, 3503–3504, https://doi.org/10.1021/ac00092a032, 1994.
Deshmukh, D. K., Haque, M. M., Kawamura, K., and Kim, Y.: Dicarboxylic acids, oxocarboxylic acids and alpha-dicarbonyls in fine aerosols over central Alaska: Implications for sources and atmospheric processes, Atmos. Res., 202, 128–139, https://doi.org/10.1016/j.atmosres.2017.11.003, 2018.
DIN 32645: Chemische Analytik – Nachweis-, Erfassungs- und Bestimmungsgrenze unter Wiederholbedingungen – Begriffe, Verfahren, Auswertung, 2008.
DIN ISO 8466-2: Wasserbeschaffenheit – Kalibrierung und Auswertung analytischer Verfahren und Beurteilung von Verfahrenskenndaten – Teil 2: Kalibrierstrategie für nichtlineare Kalibrierfunktionen zweiten Grades, 2004.
Falkovich, A. H., Graber, E. R., Schkolnik, G., Rudich, Y., Maenhaut, W., and Artaxo, P.: Low molecular weight organic acids in aerosol particles from Rondônia, Brazil, during the biomass-burning, transition and wet periods, Atmos. Chem. Phys., 5, 781–797, https://doi.org/10.5194/acp-5-781-2005, 2005.
Fisseha, R., Dommen, J., Gaeggeler, K., Weingartner, E., Samburova, V., Kalberer, M., and Baltensperger, U.: Online gas and aerosol measurement of water soluble carboxylic acids in Zurich, J. Geophys. Res.-Atmos., 111, D12316, https://doi.org/10.1029/2005jd006782, 2006.
Friedman, B., Link, M. F., Fulgham, S. R., Brophy, P., Galang, A., Brune, W. H., Jathar, S. H., and Farmer, D. K.: Primary and Secondary Sources of Gas-Phase Organic Acids from Diesel Exhaust, Environ. Sci. Technol., 51, 10872–10880, https://doi.org/10.1021/acs.est.7b01169, 2017.
Fuller, E. N., Schettle, P. D., and Giddings, J. C.: A New Method for Prediction of Binary Gas-Phase Diffusion Coeffecients, Ind. Eng. Chem., 58, 18–27, https://doi.org/10.1021/ie50677a007, 1966.
Funk, W., Dammann, V., and Donnevert, G.: Qualitätssicherung in der Analytischen Chemie, WILEY-VCH Verlag, Weinheim, 2005.
Granby, K., Egeløv, A. H., Nielsen, T., and Lohse, C.: Carboxylic acids: Seasonal variation and relation to chemical and meteorological parameters, J. Atmos. Chem., 28, 195–207, https://doi.org/10.1023/A:1005877419395, 1997.
Himanen, M., Prochazka, P., Hänninen, K., and Oikari, A.: Phytotoxicity of low-weight carboxylic acids, Chemosphere, 88, 426–431, https://doi.org/10.1016/j.chemosphere.2012.02.058, 2012.
Hoffmann, E. H., Tilgner, A., Schrödner, R., Bräuer, P., Wolke, R., and Herrmann, H.: An advanced modeling study on the impacts and atmospheric implications of multiphase dimethyl sulfide chemistry, P. Natl. Acad. Sci. USA., 113, 11776–11781, https://doi.org/10.1073/pnas.1606320113, 2016.
Howard, P. M. and Meylan, W. M.: Handbook of Physical Properties of Organic Chemicals, CRC Press, Boca Raton, 1997.
Hu, Q. H., Xie, Z. Q., Wang, X. M., Kang, H., Zhang, Y. Q., Ding, X., and Zhang, P. F.: Monocarboxylic and dicarboxylic acids over oceans from the East China Sea to the Arctic Ocean: Roles of ocean emissions, continental input and secondary formation, Sci. Total. Environ., 640, 284–292, https://doi.org/10.1016/j.scitotenv.2018.05.311, 2018.
Jones, B. T., Muller, J. B. A., O'Shea, S. J., Bacak, A., Le Breton, M., Bannan, T. J., Leather, K. E., Booth, A. M., Illingworth, S., Bower, K., Gallagher, M. W., Allen, G., Shallcross, D. E., Bauguitte, S. J. B., Pyle, J. A., and Percival, C. J.: Airborne measurements of HC(O)OH in the European Arctic: A winter–summer comparison, Atmos. Environ., 99, 556–567, https://doi.org/10.1016/j.atmosenv.2014.10.030, 2014.
Kawamura, K. and Kaplan, I. R.: Motor Exhaust Emissions as a Primary Source for Dicarboxylic Acids in Los Angeles Ambient Air, Environ. Sci. Technol., 21, 105–110, https://doi.org/10.1021/es00155a014, 1987.
Kawamura, K. and Bikkina, S.: A review of dicarboxylic acids and related compounds in atmospheric aerosols: Molecular distributions, sources and transformation, Atmos. Res., 170, 140–160, https://doi.org/10.1016/j.atmosres.2015.11.018, 2016.
Kawamura, K., Ono, K., Tachibana, E., Charriére, B., and Sempéré, R.: Distributions of low molecular weight dicarboxylic acids, ketoacids and a-dicarbonyls in the marine aerosols collected over the Arctic Ocean during late summer, Biogeosciences, 9, 4725–4737, https://doi.org/10.5194/bg-9-4725-2012, 2012.
Khare, P., Satsangi, G. S., Kumar, N., Kumari, K. M., and Srivastava, S. S.: Surface measurements of formaldehyde and formic and acetic acids at a subtropical semiarid site in India, J. Geophys. Res.-Atmos., 102, 18997–19005, https://doi.org/10.1029/97jd00735, 1997.
Khare, P., Kumar, N., Kumari, K. M., and Srivastava, S. S.: Atmospheric formic and acetic acids: An overview, Rev. Geophys., 37, 227–248, https://doi.org/10.1029/1998rg900005, 1999.
Khlystov, A., Lin, M., Bolch, M. A., and Ma, Y.: Investigation of the positive artifact formation during sampling semi-volatile aerosol using wet denuders, Atmos. Environ., 43, 364–370, https://doi.org/10.1016/j.atmosenv.2008.09.038, 2009.
Ku, Y. P., Yang, C., Lin, G. Y., and Tsai, C. J.: An Online Parallel-Plate Wet Denuder System for Monitoring Acetic Acid Gas, Aerosol Air Qual Res, 10, 479-488, https://doi.org/10.4209/aaqr.2010.03.0023, 2010.
Kuo, S. C., Tsai, Y. I., Tsai, C. H., and Hsieh, L. Y.: Carboxylic acids in PM2.5 over Pinus morrisonicola forest and related photoreaction mechanisms identified via Raman spectroscopy, Atmos. Environ., 45, 6741–6750, https://doi.org/10.1016/j.atmosenv.2011.08.007, 2011.
Lana, A., Bell, T. G., Simo, R., Vallina, S. M., Ballabrera-Poy, J., Kettle, A. J., Dachs, J., Bopp, L., Saltzman, E. S., Stefels, J., Johnson, J. E., and Liss, P. S.: An updated climatology of surface dimethlysulfide concentrations and emission fluxes in the global ocean, Global. Biogeochem. Cy., 25, GB1004, https://doi.org/10.1029/2010gb003850, 2011.
Lee, B., Hwangbo, Y., and Lee, D. S.: Determination of Low Molecular Weight Monocarboxylic Acid Cases in the Atmosphere by Parallel Plate Diffusion Scrubber-Ion Chromatography, J. Chromatogr. Sci., 47, 516–522, https://doi.org/10.1093/chromsci/47.7.516, 2009.
Legrand, M., Preunkert, S., Oliveira, T., Pio, C. A., Hammer, S., Gelencsér, A., Kasper-Giebl, A., and Laj, P.: Origin of C2-C5 dicarboxylic acids in the European atmosphere inferred from year-round aerosol study conducted at a west-east transect, J. Geophys. Res.-Atmos., 112, GB1004, https://doi.org/10.1029/2006jd008019, 2007.
Lim, H. J., Carlton, A. G., and Turpin, B. J.: Isoprene forms secondary organic aerosol through cloud processing: Model simulations, Environ. Sci. Technol., 39, 4441–4446, https://doi.org/10.1021/es048039h, 2005.
Limbeck, A., Kraxner, Y., and Puxbaum, H.: Gas to particle distribution of low molecular weight dicarboxylic acids at two different sites in central Europe (Austria), J. Aerosol. Sci., 36, 991–1005, https://doi.org/10.1016/j.jaerosci.2004.11.013, 2005.
Liu, J. M., Zhang, X. L., Parker, E. T., Veres, P. R., Roberts, J. M., de Gouw, J. A., Hayes, P. L., Jimenez, J. L., Murphy, J. G., Ellis, R. A., Huey, L. G., and Weber, R. J.: On the gas-particle partitioning of soluble organic aerosol in two urban atmospheres with contrasting emissions: 2. Gas and particle phase formic acid, J. Geophys. Res.-Atmos., 117, D00V21, https://doi.org/10.1029/2012jd017912, 2012.
Liu, Y., Monod, A., Tritscher, T., Praplan, A. P., DeCarlo, P. F., Temime-Roussel, B., Quivet, E., Marchand, N., Dommen, J., and Baltensperger, U.: Aqueous phase processing of secondary organic aerosol from isoprene photooxidation, Atmos. Chem. Phys., 12, 5879–5895, https://doi.org/10.5194/acp-12-5879-2012, 2012.
Martin, R. S., Westberg, H., Allwine, E., Ashman, L., Farmer, J. C., and Lamb, B.: Measurement of Isoprene and Its Atmospheric Oxidation Products in a Central Pennsylvania Deciduous Forest, J. Atmos. Chem., 13, 1–32, https://doi.org/10.1007/Bf00048098, 1991.
Millet, D. B., Baasandorj, M., Farmer, D. K., Thornton, J. A., Baumann, K., Brophy, P., Chaliyakunnel, S., de Gouw, J. A., Graus, M., Hu, L., Koss, A., Lee, B. H., Lopez-Hilfiker, F. D., Neuman, J. A., Paulot, F., Peischl, J., Pollack, I. B., Ryerson, T. B., Warneke, C., Williams, B. J., and Xu, J.: A large and ubiquitous source of atmospheric formic acid, Atmos. Chem. Phys., 15, 6283–6304, https://doi.org/10.5194/acp-15-6283-2015, 2015.
Miyazaki, Y., Sawano, M., and Kawamura, K.: Low-molecular-weight hydroxyacids in marine atmospheric aerosol: evidence of a marine microbial origin, Biogeosciences, 11, 4407–4414, https://doi.org/10.5194/bg-11-4407-2014, 2014.
Mochizuki, T., Kawamura, K., Miyazaki, Y., and Boreddy, S. K. R.: Distributions and sources of gaseous and particulate low molecular weight monocarboxylic acids in a deciduous broadleaf forest from northern Japan, Atmos. Chem. Phys. Discuss., https://doi.org/10.5194/acp-2018-444, in review, 2018.
Müller, K., van Pinxteren, D., Plewka, A., Svrcina, B., Kramberger, H., Hofmann, D., Bächmann, K., and Herrmann, H.: Aerosol characterisation at the FEBUKO upwind station Goldlauter (II): Detailed organic chemical characterisation, Atmos. Environ., 39, 4219–4231, https://doi.org/10.1016/j.atmosenv.2005.02.008, 2005.
Mungall, E. L., Abbatt, J. P. D., Wentzell, J. J. B., Wentworth, G. R., Murphy, J. G., Kunkel, D., Gute, E., Tarasick, D. W., Sharma, S., Cox, C. J., Uttal, T., and Liggio, J.: High gas-phase mixing ratios of formic and acetic acid in the High Arctic, Atmos. Chem. Phys., 18, 10237–10254, https://doi.org/10.5194/acp-18-10237-2018, 2018.
Nah, T., Guo, H., Sullivan, A. P., Chen, Y., Tanner, D. J., Nenes, A., Russell, A., Ng, N. L., Huey, L. G., and Weber, R. J.: Characterization of aerosol composition, aerosol acidity, and organic acid partitioning at an agriculturally intensive rural southeastern US site, Atmos. Chem. Phys., 18, 11471–11491, https://doi.org/10.5194/acp-18-11471-2018, 2018a.
Nah, T., Ji, Y., Tanner, D. J., Guo, H., Sullivan, A. P., Ng, N. L., Weber, R. J., and Huey, L. G.: Real-time measurements of gas-phase organic acids using chemical ionization mass spectrometry, Atmos. Meas. Tech., 11, 5087–5104, https://doi.org/10.5194/amt-11-5087-2018, 2018b.
Parworth, C. L., Young, D. E., Kim, H., Zhang, X. L., Cappa, C. D., Collier, S., and Zhang, Q.: Wintertime water-soluble aerosol composition and particle water content in Fresno, California, J. Geophys. Res.-Atmos., 122, 3155–3170, https://doi.org/10.1002/2016jd026173, 2017.
Pommier, M., Clerbaux, C., Coheur, P.-F., Mahieu, E., Müller, J.-F., Paton-Walsh, C., Stavrakou, T., and Vigouroux, C.: HCOOH distributions from IASI for 2008–2014: comparison with ground-based FTIR measurements and a global chemistry-transport model, Atmos. Chem. Phys., 16, 8963–8981, https://doi.org/10.5194/acp-16-8963-2016, 2016.
Possanzini, M., Febo, A., and Liberti, A.: New Design of a High-Performance Denuder for the Sampling of Atmospheric Pollutants, Atmos. Environ., 17, 2605–2610, https://doi.org/10.1016/0004-6981(83)90089-6, 1983.
Preunkert, S., Legrand, M., Jourdain, B., and Dombrowski-Etchevers, I.: Acidic gases (HCOOH, CH3COOH, HNO3, HCl, and SO2) and related aerosol species at a high mountain Alpine site (4360 m elevation) in Europe, J. Geophys. Res.-Atmos., 112, D23S12, https://doi.org/10.1029/2006jd008225, 2007.
Röhrl, A. and Lammel, G.: Determination of malic acid and other C4 dicarboxylic acids in atmospheric aerosol samples, Chemosphere, 46, 1195–1199, https://doi.org/10.1016/S0045-6535(01)00243-0, 2002.
Rumsey, I. C. and Walker, J. T.: Application of an online ion-chromatography-based instrument for gradient flux measurements of speciated nitrogen and sulfur, Atmos. Meas. Tech., 9, 2581–2592, https://doi.org/10.5194/amt-9-2581-2016, 2016.
Sabbioni, C., Ghedini, N., and Bonazza, A.: Organic anions in damage layers on monuments and buildings, Atmos. Environ., 37, 1261–1269, https://doi.org/10.1016/S1352-2310(02)01025-7, 2003.
Schöne, L. and Herrmann, H.: Kinetic measurements of the reactivity of hydrogen peroxide and ozone towards small atmospherically relevant aldehydes, ketones and organic acids in aqueous solutions, Atmos. Chem. Phys., 14, 4503–4514, https://doi.org/10.5194/acp-14-4503-2014, 2014.
Schultz Tokos, J. J., Tanaka, S., Morikami, T., Shigetani, H., and Hashimoto, Y.: Gaseous Formic and Acetic-Acids in the Atmosphere of Yokohama, Japan, J. Atmos. Chem., 14, 85–94, https://doi.org/10.1007/Bf00115225, 1992.
Spindler, G., Hesper, J., Brüggemann, E., Dubois, R., Müller, T., and Herrmann, H.: Wet annular denuder measurements of nitrous acid: laboratory study of the artefact reaction of NO2 with S(IV) in aqueous solution and comparison with field measurements, Atmos. Environ., 37, 2643–2662, https://doi.org/10.1016/S1352-2310(03)00209-7, 2003.
Spindler, G., Müller, K., Brüggemann, E., Gnauk, T., and Herrmann, H.: Long-term size-segregated characterization of PM10, PM2.5, and PM1 at the IfT research station Melpitz downwind of Leipzig (Germany) using high and low-volume filter samplers, Atmos. Environ., 38, 5333–5347, https://doi.org/10.1016/j.atmosenv.2003.12.047, 2004.
Spindler, G., Grüner, A., Müller, K., Schlimper, S., and Herrmann, H.: Long-term size-segregated particle (PM10, PM2.5, PM1) characterization study at Melpitz - influence of air mass inflow, weather conditions and season, J. Atmos. Chem., 70, 165–195, https://doi.org/10.1007/s10874-013-9263-8, 2013.
Stavrakou, T., Muller, J. F., Peeters, J., Razavi, A., Clarisse, L., Clerbaux, C., Coheur, P. F., Hurtmans, D., De Maziere, M., Vigouroux, C., Deutscher, N. M., Griffith, D. W. T., Jones, N., and Paton-Walsh, C.: Satellite evidence for a large source of formic acid from boreal and tropical forests, Nat. Geosci., 5, 26–30, https://doi.org/10.1038/Ngeo1354, 2012.
Stieger, B., Spindler, G., Fahlbusch, B., Müller, K., Grüner, A., Poulain, L., Thöni, L., Seitler, E., Wallasch, M., and Herrmann, H.: Measurements of PM10 ions and trace gases with the online system MARGA at the research station Melpitz in Germany – A five-year study, J. Atmos. Chem., 75, 33–70, https://doi.org/10.1007/s10874-017-9361-0, 2018.
Sun, X., Wang, Y., Li, H. Y., Yang, X. Q., Sun, L., Wang, X. F., Wang, T., and Wang, W. X.: Organic acids in cloud water and rainwater at a mountain site in acid rain areas of South China, Environ. Sci. Pollut. R., 23, 9529–9539, https://doi.org/10.1007/s11356-016-6038-1, 2016.
Tilgner, A. and Herrmann, H.: Radical-driven carbonyl-to-acid conversion and acid degradation in tropospheric aqueous systems studied by CAPRAM, Atmos. Environ., 44, 5415–5422, https://doi.org/10.1016/j.atmosenv.2010.07.050, 2010.
Ullah, S. M. R., Takeuchi, M., and Dasgupta, P. K.: Versatile gas/particle ion chromatograph, Environ. Sci. Technol., 40, 962–968, https://doi.org/10.1021/es051722z, 2006.
van Pinxteren, D., Plewka, A., Hofmann, D., Müller, K., Kramberger, H., Svrcina, B., Bachmann, K., Jaeschke, W., Mertes, S., Collett, J. L., and Herrmann, H.: Schmücke hill cap cloud and valley stations aerosol characterisation during FEBUKO (II): Organic compounds, Atmos. Environ., 39, 4305–4320, https://doi.org/10.1016/j.atmosenv.2005.02.014, 2005.
van Pinxteren, D., Brüggemann, E., Gnauk, T., Iinuma, Y., Müller, K., Nowak, A., Achtert, P., Wiedensohler, A., and Herrmann, H.: Size- and time-resolved chemical particle characterization during CAREBeijing-2006: Different pollution regimes and diurnal profiles, J. Geophys. Res.-Atmos., 114, D00G09, https://doi.org/10.1029/2008jd010890, 2009.
van Pinxteren, D., Neusüß, C., and Herrmann, H.: On the abundance and source contributions of dicarboxylic acids in size-resolved aerosol particles at continental sites in central Europe, Atmos. Chem. Phys., 14, 3913–3928, https://doi.org/10.5194/acp-14-3913-2014, 2014.
van Pinxteren, D., Fomba, K. W., Mertes, S., Müller, K., Spindler, G., Schneider, J., Lee, T., Collett, J. L., and Herrmann, H.: Cloud water composition during HCCT-2010: Scavenging efficiencies, solute concentrations, and droplet size dependence of inorganic ions and dissolved organic carbon, Atmos. Chem. Phys., 16, 3185–3205, https://doi.org/10.5194/acp-16-3185-2016, 2016.
Veres, P. R., Roberts, J. M., Cochran, A. K., Gilman, J. B., Kuster, W. C., Holloway, J. S., Graus, M., Flynn, J., Lefer, B., Warneke, C., and de Gouw, J.: Evidence of rapid production of organic acids in an urban air mass, Geophys. Res. Lett., 38, L17807, https://doi.org/10.1029/2011gl048420, 2011.
Winiwarter, W.: A Calculation Procedure for the Determination of the Collection Efficiency in Annular Denuders, Atmos. Environ., 23, 1997–2002, https://doi.org/10.1016/0004-6981(89)90526-X, 1989.
Wyers, G. P., Otjes, R. P., and Slanina, J.: A Continuous-Flow Denuder for the Measurement of Ambient Concentrations and Surface-Exchange Fluxes of Ammonia, Atmos. Environ. A-Gen., 27, 2085–2090, https://doi.org/10.1016/0960-1686(93)90280-C, 1993.
Zander, R., Duchatelet, P., Mahieu, E., Demoulin, P., Roland, G., Servais, C., Auwera, J. V., Perrin, A., Rinsland, C. P., and Crutzen, P. J.: Formic acid above the Jungfraujoch during 1985–2007: observed variability, seasonality, but no long-term background evolution, Atmos. Chem. Phys., 10, 10047–10065, https://doi.org/10.5194/acp-10-10047-2010, 2010.
Zhou, Y., Huang, X. H., Bian, Q. J., Griffith, S. M., Louie, P. K. K., and Yu, J. Z.: Sources and atmospheric processes impacting oxalate at a suburban coastal site in Hong Kong: Insights inferred from 1year hourly measurements, J. Geophys. Res.-Atmos., 120, 9772–9788, https://doi.org/10.1002/2015jd023531, 2015.