the Creative Commons Attribution 4.0 License.
the Creative Commons Attribution 4.0 License.
 | 04 Jun 2019
Comparison of the GRUAN data products for Meisei RS-11G and Vaisala RS92-SGP radiosondes at Tateno (36.06° N, 140.13° E), Japan
Eriko Kobayashi
Shunsuke Hoshino
Masami Iwabuchi
Takuji Sugidachi
Kensaku Shimizu
Masatomo Fujiwara
A total of 87 dual flights of Meisei RS-11G radiosondes and Vaisala RS92-SGP radiosondes were carried out at the Aerological Observatory of the Japan Meteorological Agency (36.06∘ N, 140.13∘ E, 25.2 m) from April 2015 to June 2017. Global Climate Observing System (GCOS) Reference Upper-Air Network (GRUAN) data products from both sets of radiosonde data for 52 flights were subsequently created using a documented processing program along with the provision of optimal estimates for measurement uncertainty. Differences in the performance of the radiosondes were then quantified using the GRUAN data products. The temperature measurements of RS-11G were, on average, 0.4 K lower than those of RS92-SGP in the stratosphere for daytime observations. The relative humidity measurements of RS-11G were, on average, 2 % RH (relative humidity) lower than those of RS92-SGP under 90 % RH–100 % RH conditions, while RS-11G gave on average 5 % RH higher values than RS92-SGP under ≤50 % RH conditions. The results from a dual flight of RS-11G and a cryogenic frost point hygrometer (CFH) also showed that RS-11G gave 1 % RH–10 % RH higher values than the CFH in the troposphere. Differences between the RS-11G and RS92-SGP temperature and relative humidity measurements, based on combined uncertainties, were also investigated to clarify major influences behind the differences. It was found that temperature differences in the stratosphere during daytime observation were within the range of uncertainty (k=2), and that sensor orientation is the major source of uncertainty in the RS92-SGP temperature measurement, while sensor albedo is the major source of uncertainty for RS-11G. The relative humidity difference in the troposphere was larger than the uncertainty (k=2) after the radiosondes had passed through the cloud layer, and the temperature–humidity dependence correction was the major source of uncertainty in RS-11G relative humidity measurement. Uncertainties for all soundings were also statistically investigated. Most nighttime temperature measurements for pressures of >10 hPa were in agreement, while relative humidity in the middle troposphere exhibited significant differences. Around half of all daytime temperature measurements at pressures of ≤150 hPa and relative humidity measurements around the 500 hPa level were not in agreement.
- Article
(11044 KB) - Full-text XML
-
Supplement
(352 KB) - BibTeX
- EndNote


The Aerological Observatory of the Japan Meteorological Agency (JMA) (location: Tateno, 36.06∘ N, 140.13∘ E, 25.2 m above mean sea level) has played a leading role in the operation of all JMA radiosonde stations since its establishment in 1920. The Tateno station was chosen as a candidate site for the Global Climate Observation System (GCOS) Reference Upper-Air Network (GRUAN; Seidel et al., 2009; Bodeker et al., 2016) in 2009, and was certified as a GRUAN site in 2018. The Vaisala RS92-SGP radiosonde (referred to here as RS92; Dirksen et al., 2014) was used for routine observation at the site from December 2009 to June 2013 (Kobayashi, 2015), after which it was replaced with the Meisei RS-11G radiosonde (Kizu et al., 2018). The Meisei RS-11G radiosonde was also replaced with the Meisei iMS-100 radiosonde (Kizu et al., 2018) in September 2017. RS-11G is equipped with a thermistor, a capacitive relative humidity (RH) sensor, a Global Positioning System (GPS) receiver for monitoring altitude, pressure, and horizontal wind, and a transmitter at 400 MHz (Kizu et al., 2018). Compared with the previous-generation Meisei RS-06G radiosonde (Nash et al., 2011), the quality of the temperature and RH measurements has been improved via hardware and software upgrades. RS-11G is used at a variety of JMA stations, at stations of other meteorological service providers, and by numerous research institutes and universities.
GRUAN provides long-term, high-quality climate data records ranging from the surface to the troposphere to the stratosphere (Seidel et al., 2009; Bodeker et al., 2016). GRUAN data products (GDPs) are open, are documented in peer-reviewed literature and traceable to SI standards, and have the best possible estimates of vertically resolved measurement uncertainties (Dirksen et al., 2014). When measurement systems, including instrument types, are changed, any systematic biases between the old and new systems need to be characterized (GCOS-134, 2009; GCOS-170, 2013). In this context, JMA previously made several changes in radiosonde types for improved upper-air measurement with state-of-the-art technology (Kizu et al., 2018), and regularly makes dual flights of old and new radiosondes to characterize these measurements (Aerological Division of JMA, 1983; Sakoda et al., 1999; Kobayashi et al., 2012). Kobayashi et al. (2012) reported results from 103 dual flights of the Meisei RS2-91 rawinsonde and RS92 when the latter was introduced at Tateno.
Following the change in routine radiosonde type from RS92 to RS-11G at Tateno in July 2013, manufacturer-independent ground checking for RS-11G was started from July 2014, and a thin hydrophilic polymer of RH sensor was updated in January 2015. And then a total of 87 weekly dual flights of RS-11G and RS92 were conducted from April 2015 to June 2017 (avoiding the July to mid-September period when there is a heightened likelihood that a radiosonde may fall into the densely populated Tokyo metropolitan area). The GRUAN data product made from RS92 measurements at Tateno was created at the GRUAN Lead Centre, and is available on the GRUAN website at https://www.gruan.org/ (last access: 24 May 2019). The GRUAN data product made from RS-11G measurements was created at Tateno and submitted to the GRUAN Lead Centre, and will be available on the GRUAN website when this paper is published. GRUAN sites take over some of the duties of the Lead Centre to reduce its workload and Tateno accepted the role of generating GDP of Meisei GPS sondes. A novel aspect of GRUAN data products is that vertically resolved uncertainty estimates and metadata are provided for each sounding. Quantitative comparisons of GRUAN data products based on data from these radiosondes are important in securing the temporal homogeneity of climate data records (GCOS-134, 2009). This paper details results from comparison of GRUAN data products based on data collected by RS-11G and RS92 on dual flights conducted from Tateno between April 2015 and June 2017.
In this paper, Sect. 2 describes the instrumentation used and GRUAN data products (i.e., data processing details) for RS-11G and RS92, Sect. 3 outlines the methods used for dual launches, Sect. 4 details the comparison analysis methods, Sect. 5 gives the comparison results, Sect. 6 discusses outcomes from a dual flight of RS-11G and a cryogenic frost point hygrometer (CFH; Vömel et al., 2007, 2016), and Sect. 7 summarizes the findings.
Table 1 shows the specifications of RS92 and RS-11G. The ground station for the RS92 was a Vaisala DigiCORA III Sounding System, while the ground station for the RS-11G was a Meisei MGPS2.
Table 1Specifications of radiosondes and GRUAN data products (Meisei Electric Co., Ltd., 2016; Vaisala Oyj, 2013; Dirksen et al., 2014; Kizu et al., 2018).
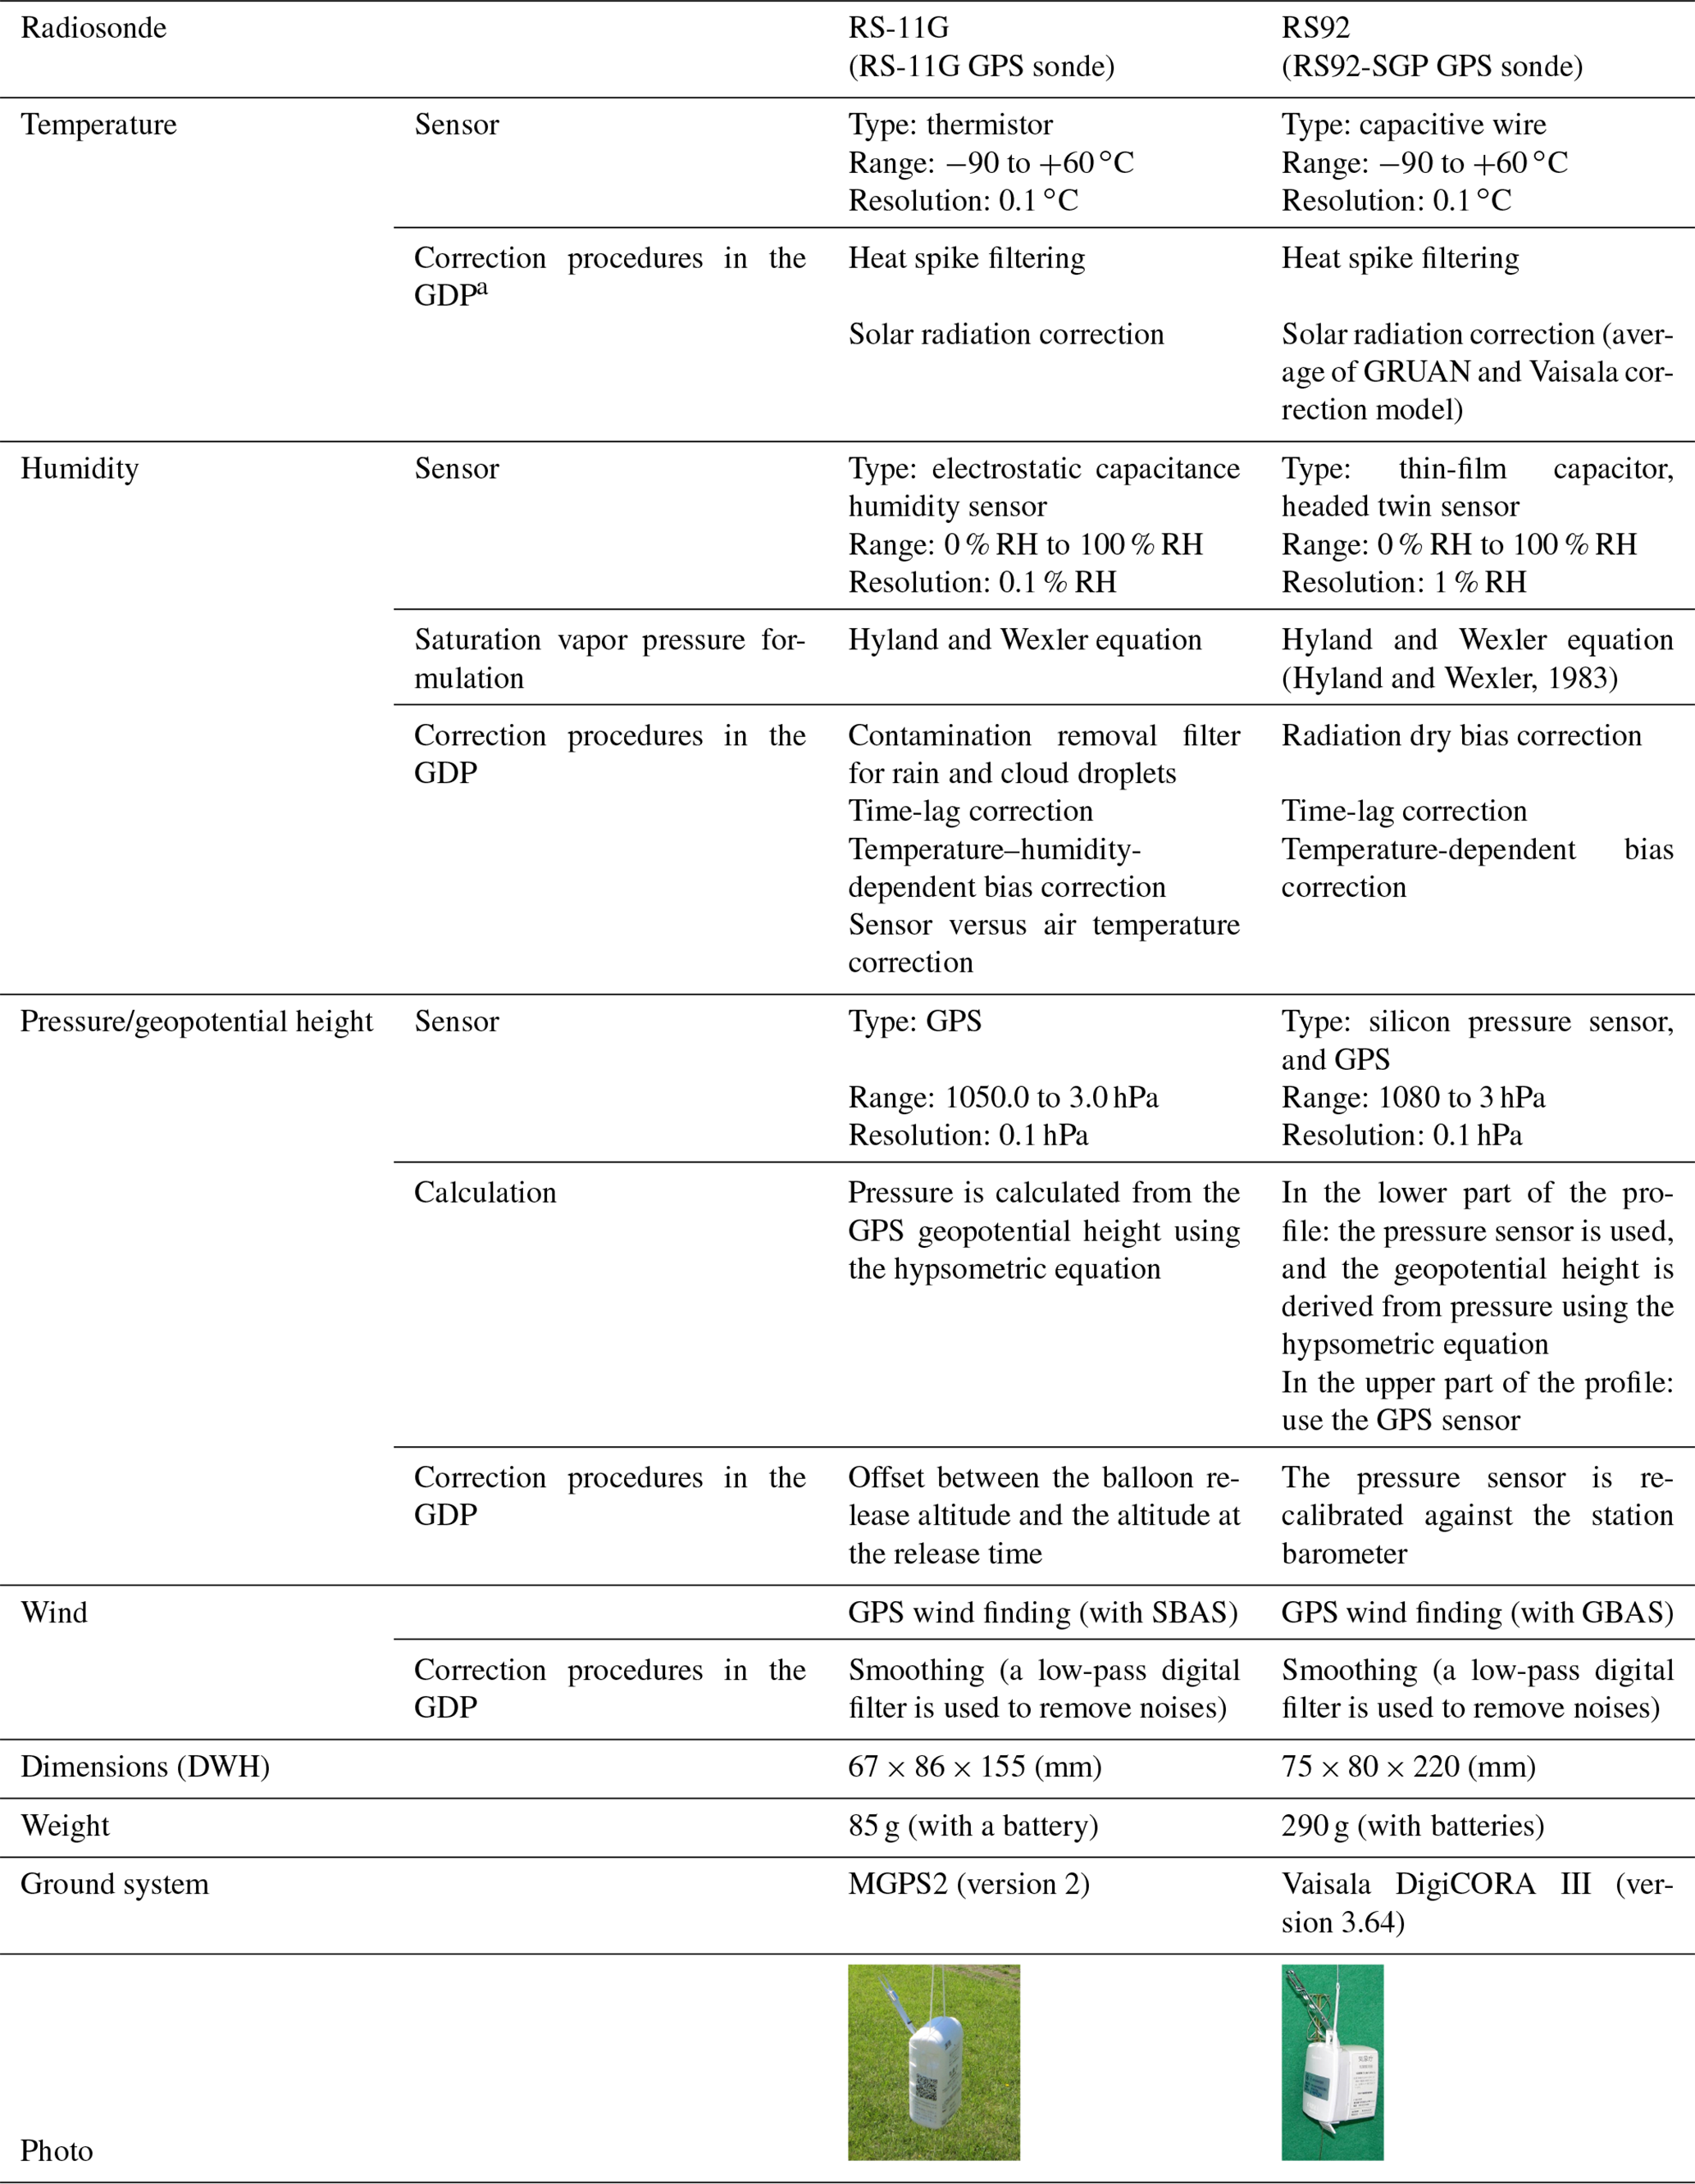
a GRUAN data product.
2.1 Sensor material and GRUAN data processing for RS-11G
RS-11G has a thermistor temperature sensor and an electrostatic capacitance humidity sensor. Geopotential height is derived from GPS data, and pressure is derived from GPS geopotential height. Wind speed and wind direction are calculated from GPS Doppler speed data.
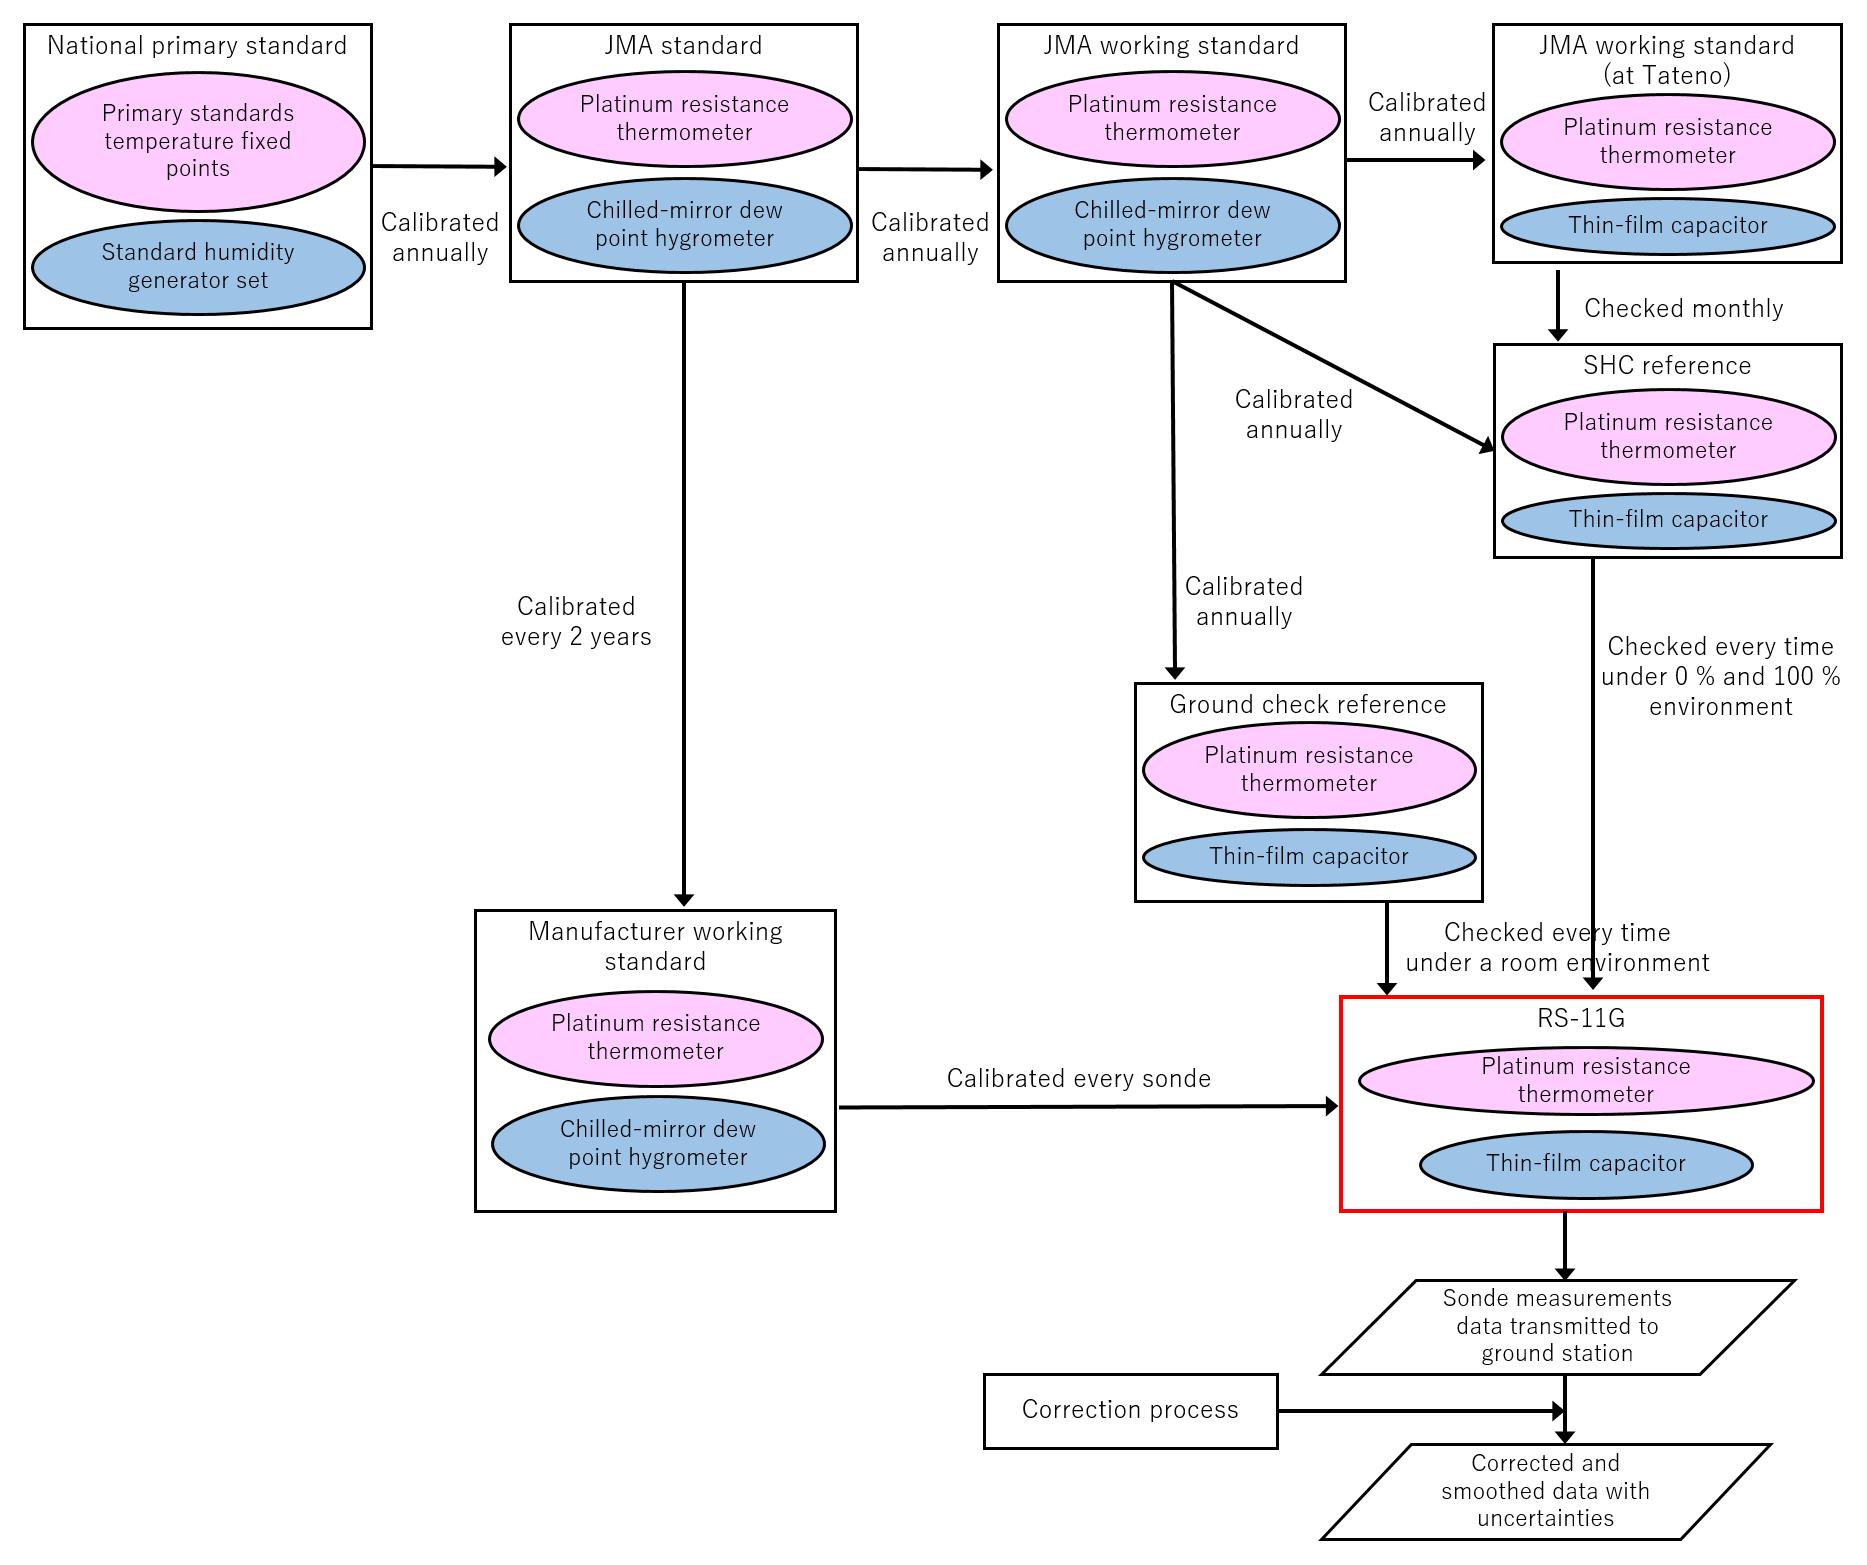
Figure 1Traceability of the temperature and RH sensors on RS-11G. Pink and blue ellipses indicate temperature and RH sensors, respectively. Parallelograms indicate data. The details of the correction procedures are shown in Figs. 2–5. Further details of the traceability of the RS-11G sensors can be found in Sect. 5 of Kizu et al. (2018).
Figure 1 shows traceability of the temperature and RH sensors on RS-11G. Further details of traceability of the RS-11G sensors can be found in Sect. 5 of Kizu et al. (2018). All the RS-11G radiosondes used are subjected to the manufacturer's specified ground check before launch. At this time, the temperature and RH sensors are compared with reference sensors under indoor conditions (Appendix 7 of Kizu et al., 2018). If the differences between RS-11G and the reference sensors are within % RH and ∘C, the radiosonde is considered suitable for observation. The units are also subjected to manufacturer-independent ground checking with a standard humidity chamber (SHC; Appendix F of Kizu et al., 2018) at least a day before launch. The SHC provides conditions of approximately 0 % RH using a molecular sieve and 100 % RH using a sponge saturated with distilled water. The RH sensor of RS-11G is compared with the reference sensor inside the SHC during this additional ground check. The results of the SHC ground check are used to create new calibration coefficients together with the values of the original manufacturer's calibration, which is conducted between 15 % RH and 95 % RH (Kizu et al., 2018).
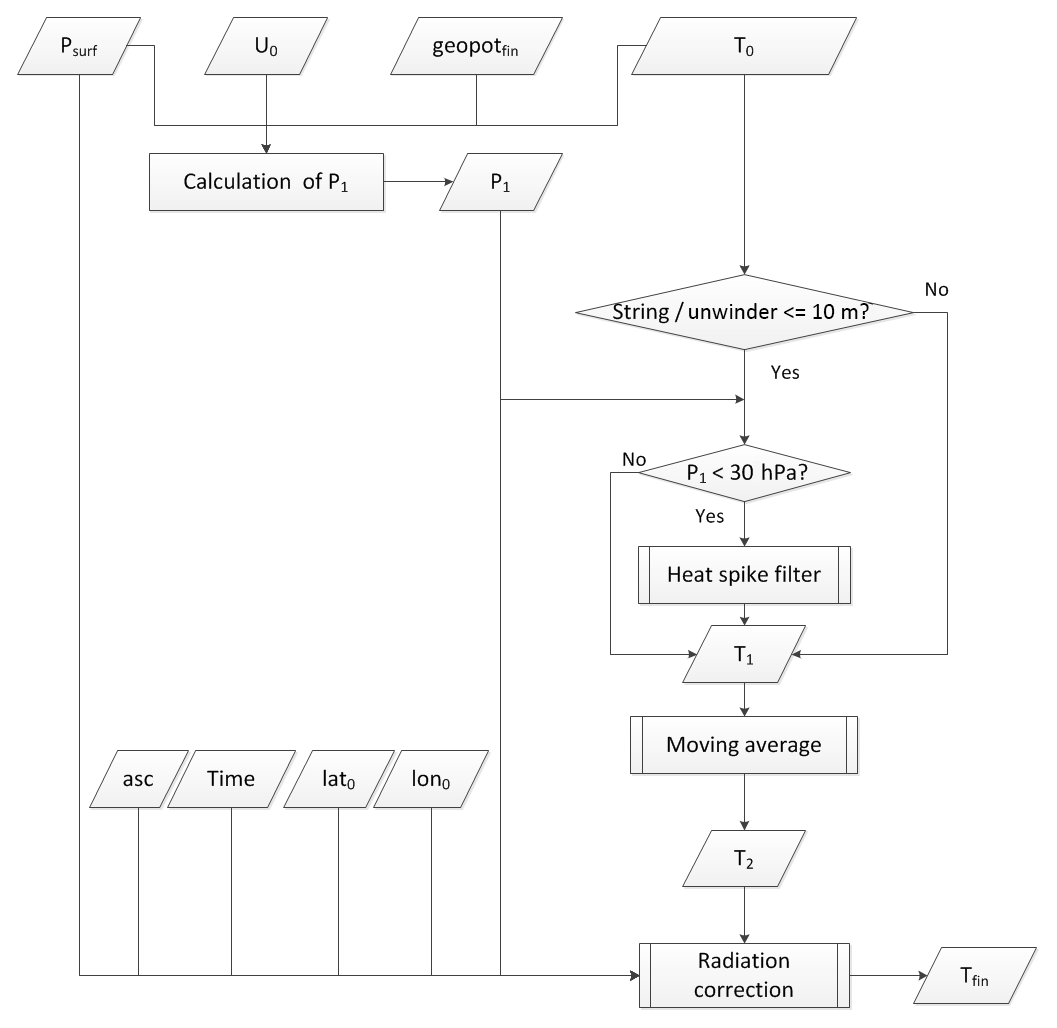
Figure 2GRUAN data processing flow for RS-11G temperature measurement (excerpt from Kizu et al., 2018). T0 and U0 represent uncorrected temperature and RH, respectively, Psurf is surface pressure, lat0 and lon0 are the initial data set of GPS latitude and longitude, respectively, geopotfin is the final geopotential height as derived from GPS altitude and latitude, asc is the ascent rate, and Tfin is the corrected final temperature value. Parallelograms, rectangles, diamonds, and rectangles with double vertical lines indicate input or output data, processes, decisions, and correction processes, respectively.
Figure 2 shows the processing flow followed to derive temperature values from RS-11G GRUAN data processing-version 1. RS-11G observation data are collected at 1 s intervals and the raw data are converted into the RS-11G GRUAN data product (Kizu et al., 2018). The received frequency for temperature is converted into thermistor resistance, which is then converted into temperature using factory-set calibration coefficients. The raw temperature data need to be corrected for heat spike influences and solar radiation influences. Heat spike influences result from air being heated by the sensor frame, package, and balloon, but warm air from the balloon may be the main source (e.g., Shimizu and Hasebe, 2010). Such external influences on the temperature measurements are corrected when the string between the balloon and the radiosonde is too short (e.g., 10 m with a 600 g balloon) using minima-pass filtering and a moving-average procedure. The minima-pass filter is applied to the temperature measurements and only picks up minimum values within a certain time window (Kizu et al., 2018). Solar radiation errors result from solar heating, particularly at higher altitudes during daytime soundings. The amount of such heating can be estimated theoretically using a heat-balance equation (JMA, 1995) as a function of solar radiative flux, solar elevation angle, pressure, temperature, and ventilation speed at the measurement time. Although there are other error sources such as infrared radiation, evaporative cooling when the thermistor is coated with water or ice during flight through a cloud layer, and sensor response time, correction to remove errors from these sources is not applied for the current RS-11G GDP because their impacts are negligible compared to the abovementioned sources or are difficult to quantify.
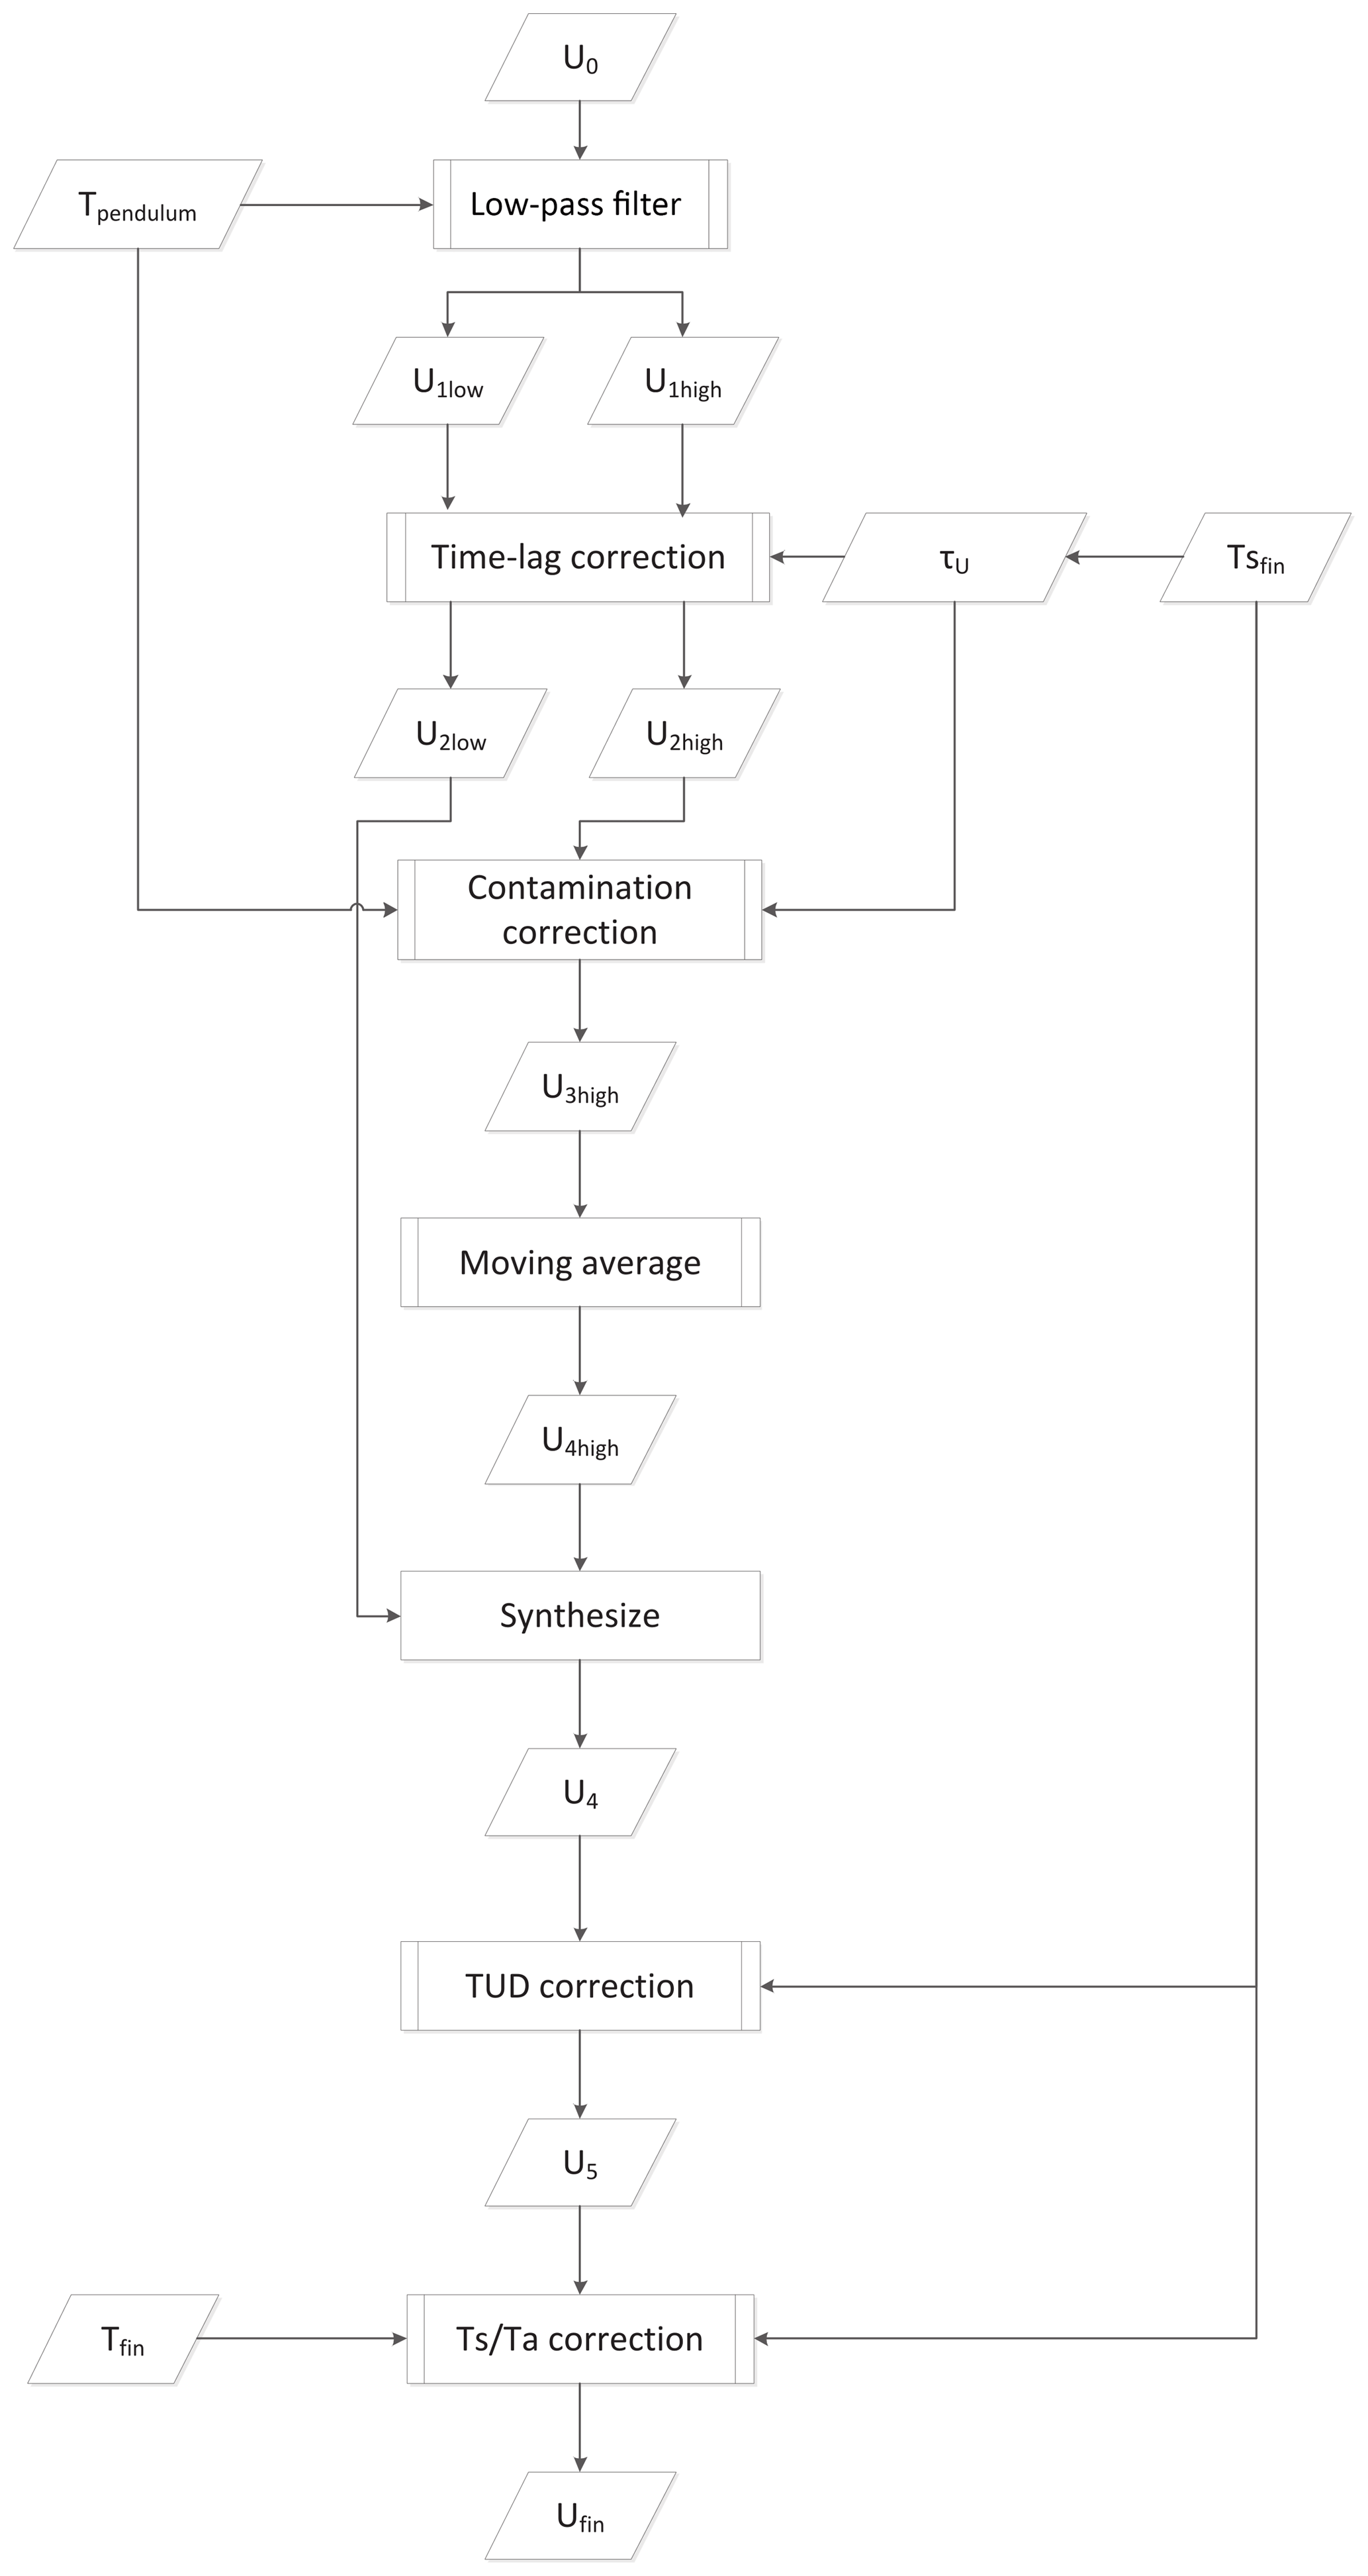
Figure 3GRUAN data processing flow for RS-11G RH measurement (Kizu et al., 2018). U0 is the uncorrected RH, Tpendulum is the period of pendulum motion, U1low and U1high are low- and high-frequency components of U0, τU is the sensor response time, is the corrected RH sensor temperature, Tfin is the corrected final temperature, and Ufin is the corrected final RH value. The different shaped boxes indicate as per Fig. 2.
Figure 3 shows the processing flow followed to derive RH measurements for RS-11G GDP. The received frequency for RH is converted into capacitance, which is then converted into raw RH data using sensor-specific calibration coefficients. The raw RH data need to be corrected for sensor time lag, contamination, temperature–humidity dependence, and sensor-versus-air temperature difference. The response time of thin-film polymer RH sensors increases exponentially at lower temperatures, and has been measured in laboratory experiments at various temperature points in a chamber (Kizu et al., 2018). The response time also depends on the direction of change between wet and dry conditions. Current GRUAN data processing for RS-11G uses the response time values from dry to wet conditions because the use of values from wet to dry conditions could result in overcorrection. A contamination filter is used to remove errors caused by water droplets or ice in rainy conditions. This type of wet contamination error manifests as spikes in the raw RH profile; therefore, a minimum filter, which is similar to the filter for heat spikes in the temperature measurements, with a window width of pendulum frequency, is applied to the high-frequency components of raw RH data (Kizu et al., 2018). The temperature dependence of thin-film polymer RH sensors in colder environments was evaluated under laboratory conditions by comparison with reference values from a chilled mirror hygrometer, and a correction curve was developed using the least-squares method. The RH sensor has wet biases between −60 and 40 ∘C and dry biases below −60 ∘C. Further details of the temperature-dependence correction of RH sensor can be found in Kizu et al. (2018, Fig. 3.19). As the temperature of the RH sensor is not exactly the same as that of ambient air due to solar heating and heat conduction from the RS-11G unit, RH values from RS-11G need to be adjusted with respect to the saturation pressure of the ambient air temperature (a process referred to as Ts∕Ta correction). The temperature of the RH sensor is estimated using data on air temperature and the amount of solar heating on the RH sensor. A further error source is the hysteresis property of the RH sensor. The results of chamber experiments showed that RH values exhibited wet biases when the condition was changed from 100 % RH to 0 % RH. As related quantification is rather complicated, this influence is not corrected in the current GDP version.
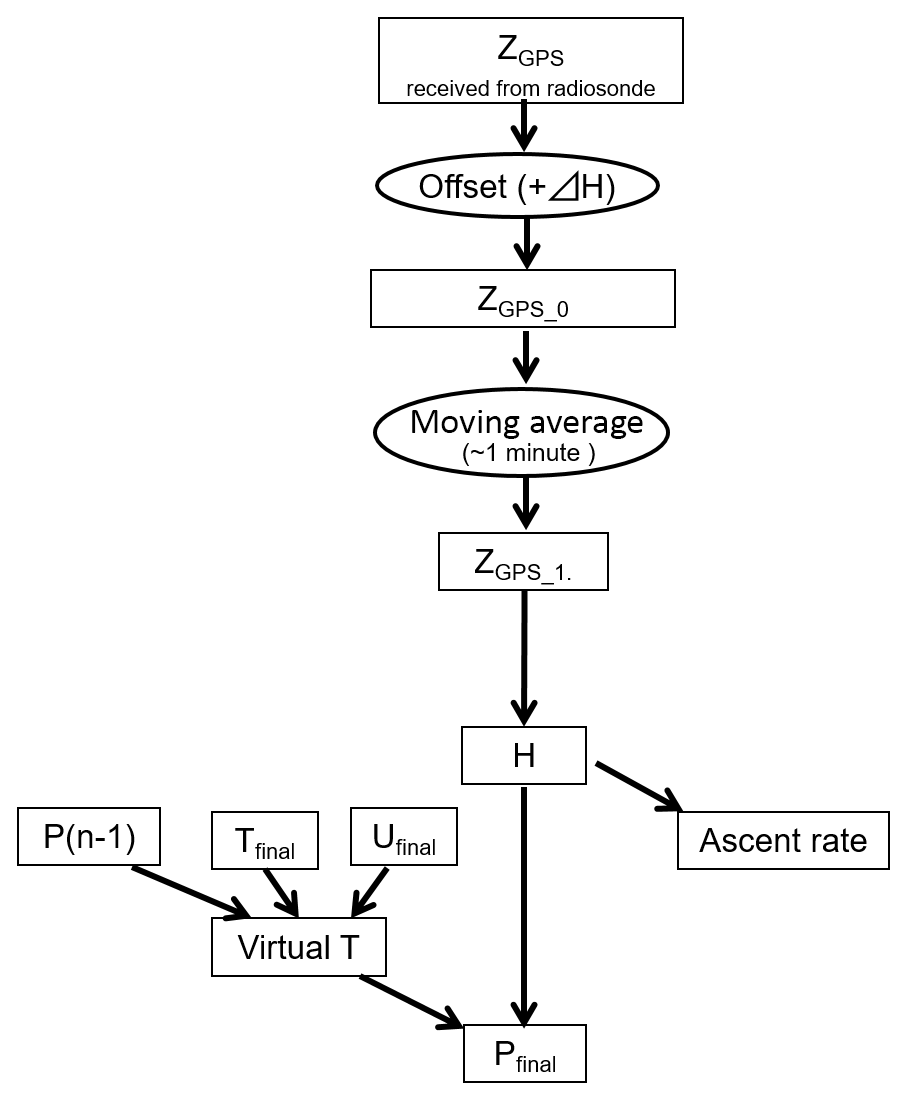
Figure 4GRUAN data processing flow for RS-11G geopotential height and pressure measurement (Kizu et al., 2018). ZGPS is the GPS geometric altitude, ΔH is the offset between balloon release altitude and GPS geometric altitude upon balloon release, H is the geopotential height, Tfinal and Ufinal are the corrected final temperature and RH, respectively, and Pfinal is the corrected final pressure. Rectangles and ellipses indicate input or output data and correction processes, respectively.
Figure 4 shows the processing flow followed to derive geopotential height and pressure measurements for RS-11G GDP. Geopotential height is calculated from geometric altitude data provided by the GPS receiver on RS-11G. The offset between the altitude when the balloon is actually released and the altitude at release time, as determined by the sounding system, is added to the measurement value. As altitude data are also affected by the payload, a moving average is applied to the data with a 61-point-wide window.
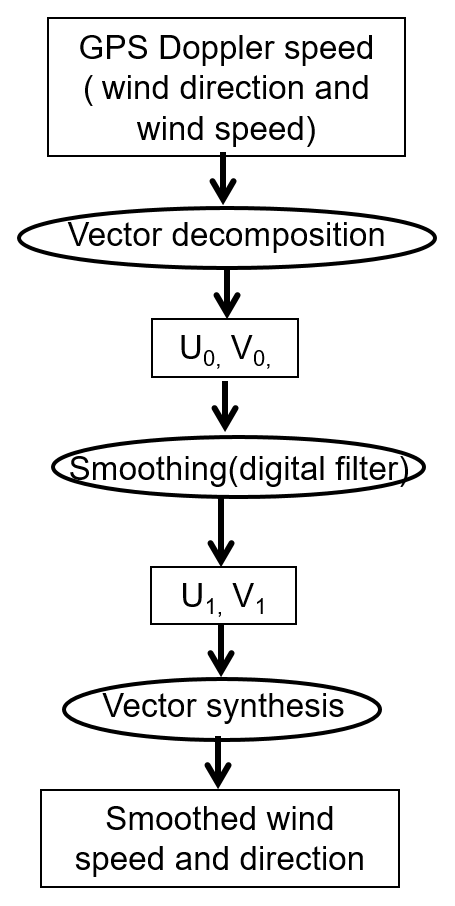
Figure 5GRUAN data processing flow for RS-11G horizontal wind measurement (Kizu et al., 2018). U0 and V0 are uncorrected zonal wind and meridional wind, respectively, U1 is smoothed zonal wind, and V1 is smoothed meridional wind. The different shaped boxes indicate as per Fig. 4.
Figure 5 shows the processing flow followed to derive horizontal wind measurement values for RS-11G GDP. Zonal and meridional winds (U and V, respectively) are derived from GPS Doppler speed data. As U and V data include random noise caused by pendulum motion, as with altitude data, a low-pass digital filter with a Kaiser window (Appendix E of Kizu et al., 2018) is applied to remove this influence, and the final wind speed and wind direction data are derived from the smoothed values of U and V.
Further details of data processing for RS-11G GDP can be found in Kizu et al. (2018).
2.2 Sensor material and GRUAN data processing for RS92
RS92 has a capacitive wire temperature sensor, a thin-film capacitor with a heated twin humidity sensor, a silicon pressure sensor (optional), and a GPS receiver (Dirksen et al., 2014). All RS92 units are subjected the manufacturer's specified ground check before launch. At this time, the temperature and RH sensors are inserted into a ground check unit (GC25) and heated to remove contamination. The temperature sensor is then compared with the reference sensors under indoor conditions and the RH sensor is checked under dry (about 0 % RH) conditions maintained with a desiccant bed. Pressure is compared with the reference value of the Automated Meteorological Data Acquisition System (AMeDAS) run by JMA at Tateno. If the differences between RS92 and the reference values are within % RH, ∘C, and hPa, the radiosonde is considered suitable for observation. Additional ground checking with the SHC (under 100 % RH conditions) for RS92 is not conducted at the Tateno station. Version 2 of RS92 GDP (Dirksen et al., 2014) was created at the GRUAN Lead Centre. Related processing is briefly outlined below.
The processing flow followed for temperature data is shown in Fig. 2 of Dirksen et al. (2014). Raw temperature data are corrected for solar radiation errors and heat spike errors. Solar radiation errors relate to overall direct and scattered solar irradiance, ambient pressure, and ventilation, and are estimated from a radiative transfer model that takes into account the solar elevation angle at the measurement time. Vaisala radiation error correction data are also available in table form. GRUAN data processing for RS92 involves application of the average of the two, as it remains unclear which correction model is more appropriate (Dirksen et al., 2014; Sommer et al., 2016). Heat spike errors are removed by applying a low-pass digital filter with a cutoff frequency of 0.1 Hz (Dirksen et al., 2014).
RS92 RH sensors have a temperature-dependent dry bias. GRUAN data processing corrects for this based on multiplication with an empirical correction factor before other forms of correction are applied. The raw RH data are corrected for radiation dry bias, sensor time lag, and temperature-dependence errors. Radiation dry bias is caused by solar heating on the RH sensors, and the same approach as for the temperature sensor is used to estimate the amount of correction required. RH sensor response slows at low temperatures, and time lag becomes significant below −40 ∘C. Time lag is corrected based on the relationship between a time constant and temperature using a low-pass filter in the GRUAN data product for RS92 (Dirksen et al., 2014).
The RS92 used at Tateno has a pressure sensor and a GPS receiver, both of which can be used to calculate geopotential height. Pressure measurement data are used to derive geopotential height in the lower part of the profile where the signal-to-noise performance of the pressure sensor is sufficiently good, and measurements from the GPS sensor are used in the upper part of the profile. The altitude of the switch is typically between 9 and 17 km (Sommer et al., 2016). The pressure sensor is recalibrated against the reference value from a station barometer during the ground check, and calculation is performed to determine the correction factor for application to the entire pressure profile during sounding (Dirksen et al., 2014).
U and V data are retrieved from the Doppler shift in the GPS carrier signal, and noise is removed using a low-pass digital filter. The smoothed data are converted into wind speed and direction values (Dirksen et al., 2014).
While the authors used version 2 of the RS92 GDP, version 3 is supposed to be available in the near future (Sommer, 2016) and it would be useful to redo the analysis with it.
GDPs produced from RS-11G and RS92 data between April 2015 and June 2017 were chosen for this study. Among the 87 dual flights, 25 RS92 GDPs failed the quality control procedures at the GRUAN Lead Centre and were not available at the GRUAN data archive. These quality control procedures for the RS92 GDP (Dirksen et al., 2014) consist of the following two steps. First, the results of the ground check procedure are verified. In a second step, after applying the GRUAN corrections to the raw RS92 measurements, it is checked whether the estimated uncertainties of the GDP are within the uncertainties provided by the manufacturer. For instance, for one of the 25 rejected RS92 data, there was more than 1.5 % RH difference between the two RH sensors at the ground check. However, most of the excluded 25 RS92 flights failed the second step of the quality control procedures. Among these, two-thirds were daytime observations, and eight dual soundings of the excluded 25 had large differences between RS-11G and RS92 in temperature or RH profiles (checked with processed data at Tateno with the manufacturer's software). At the time of the analysis, the RS-11G GDP was not open yet, and was created at Tateno for the analysis of this paper. In the near future, quality control procedures similar to those for RS92 GDP should be taken for the RS-11G GDP; however the quality control procedures have not been established and are still under consideration. Therefore, the quality of RS-11G was checked from temperature and RH differences from RS92 in this paper. Out of the remaining 62 dual soundings, five dual soundings were additionally blacklisted due to spurious RS-11G RH measurements or based on outlying temperature differences, Furthermore, another five RS-11G GDPs were not used simply because of the delay in data preparation (not due to data quality). So we end up with 52 sets of dual flight data for the data analysis. Analysis of 22 daytime (09:00 LT, 00:00 UTC) and 30 nighttime (21:00 LT, 12:00 UTC) measurements (52 in all) is reported below. Table 2 shows surface observations and balloon burst heights for each of the 52 flights. The burst heights were mostly above 30 km.
Table 2Flight information including surface observation, cloud cover data, and balloon burst height from RS-11G data. CL, CM, and CH denote types of low, medium, and high cloud. The N denotes total cloud cover, Nh the fraction covered by all CL cloud, and h the coded height of the lowest cloud layer.
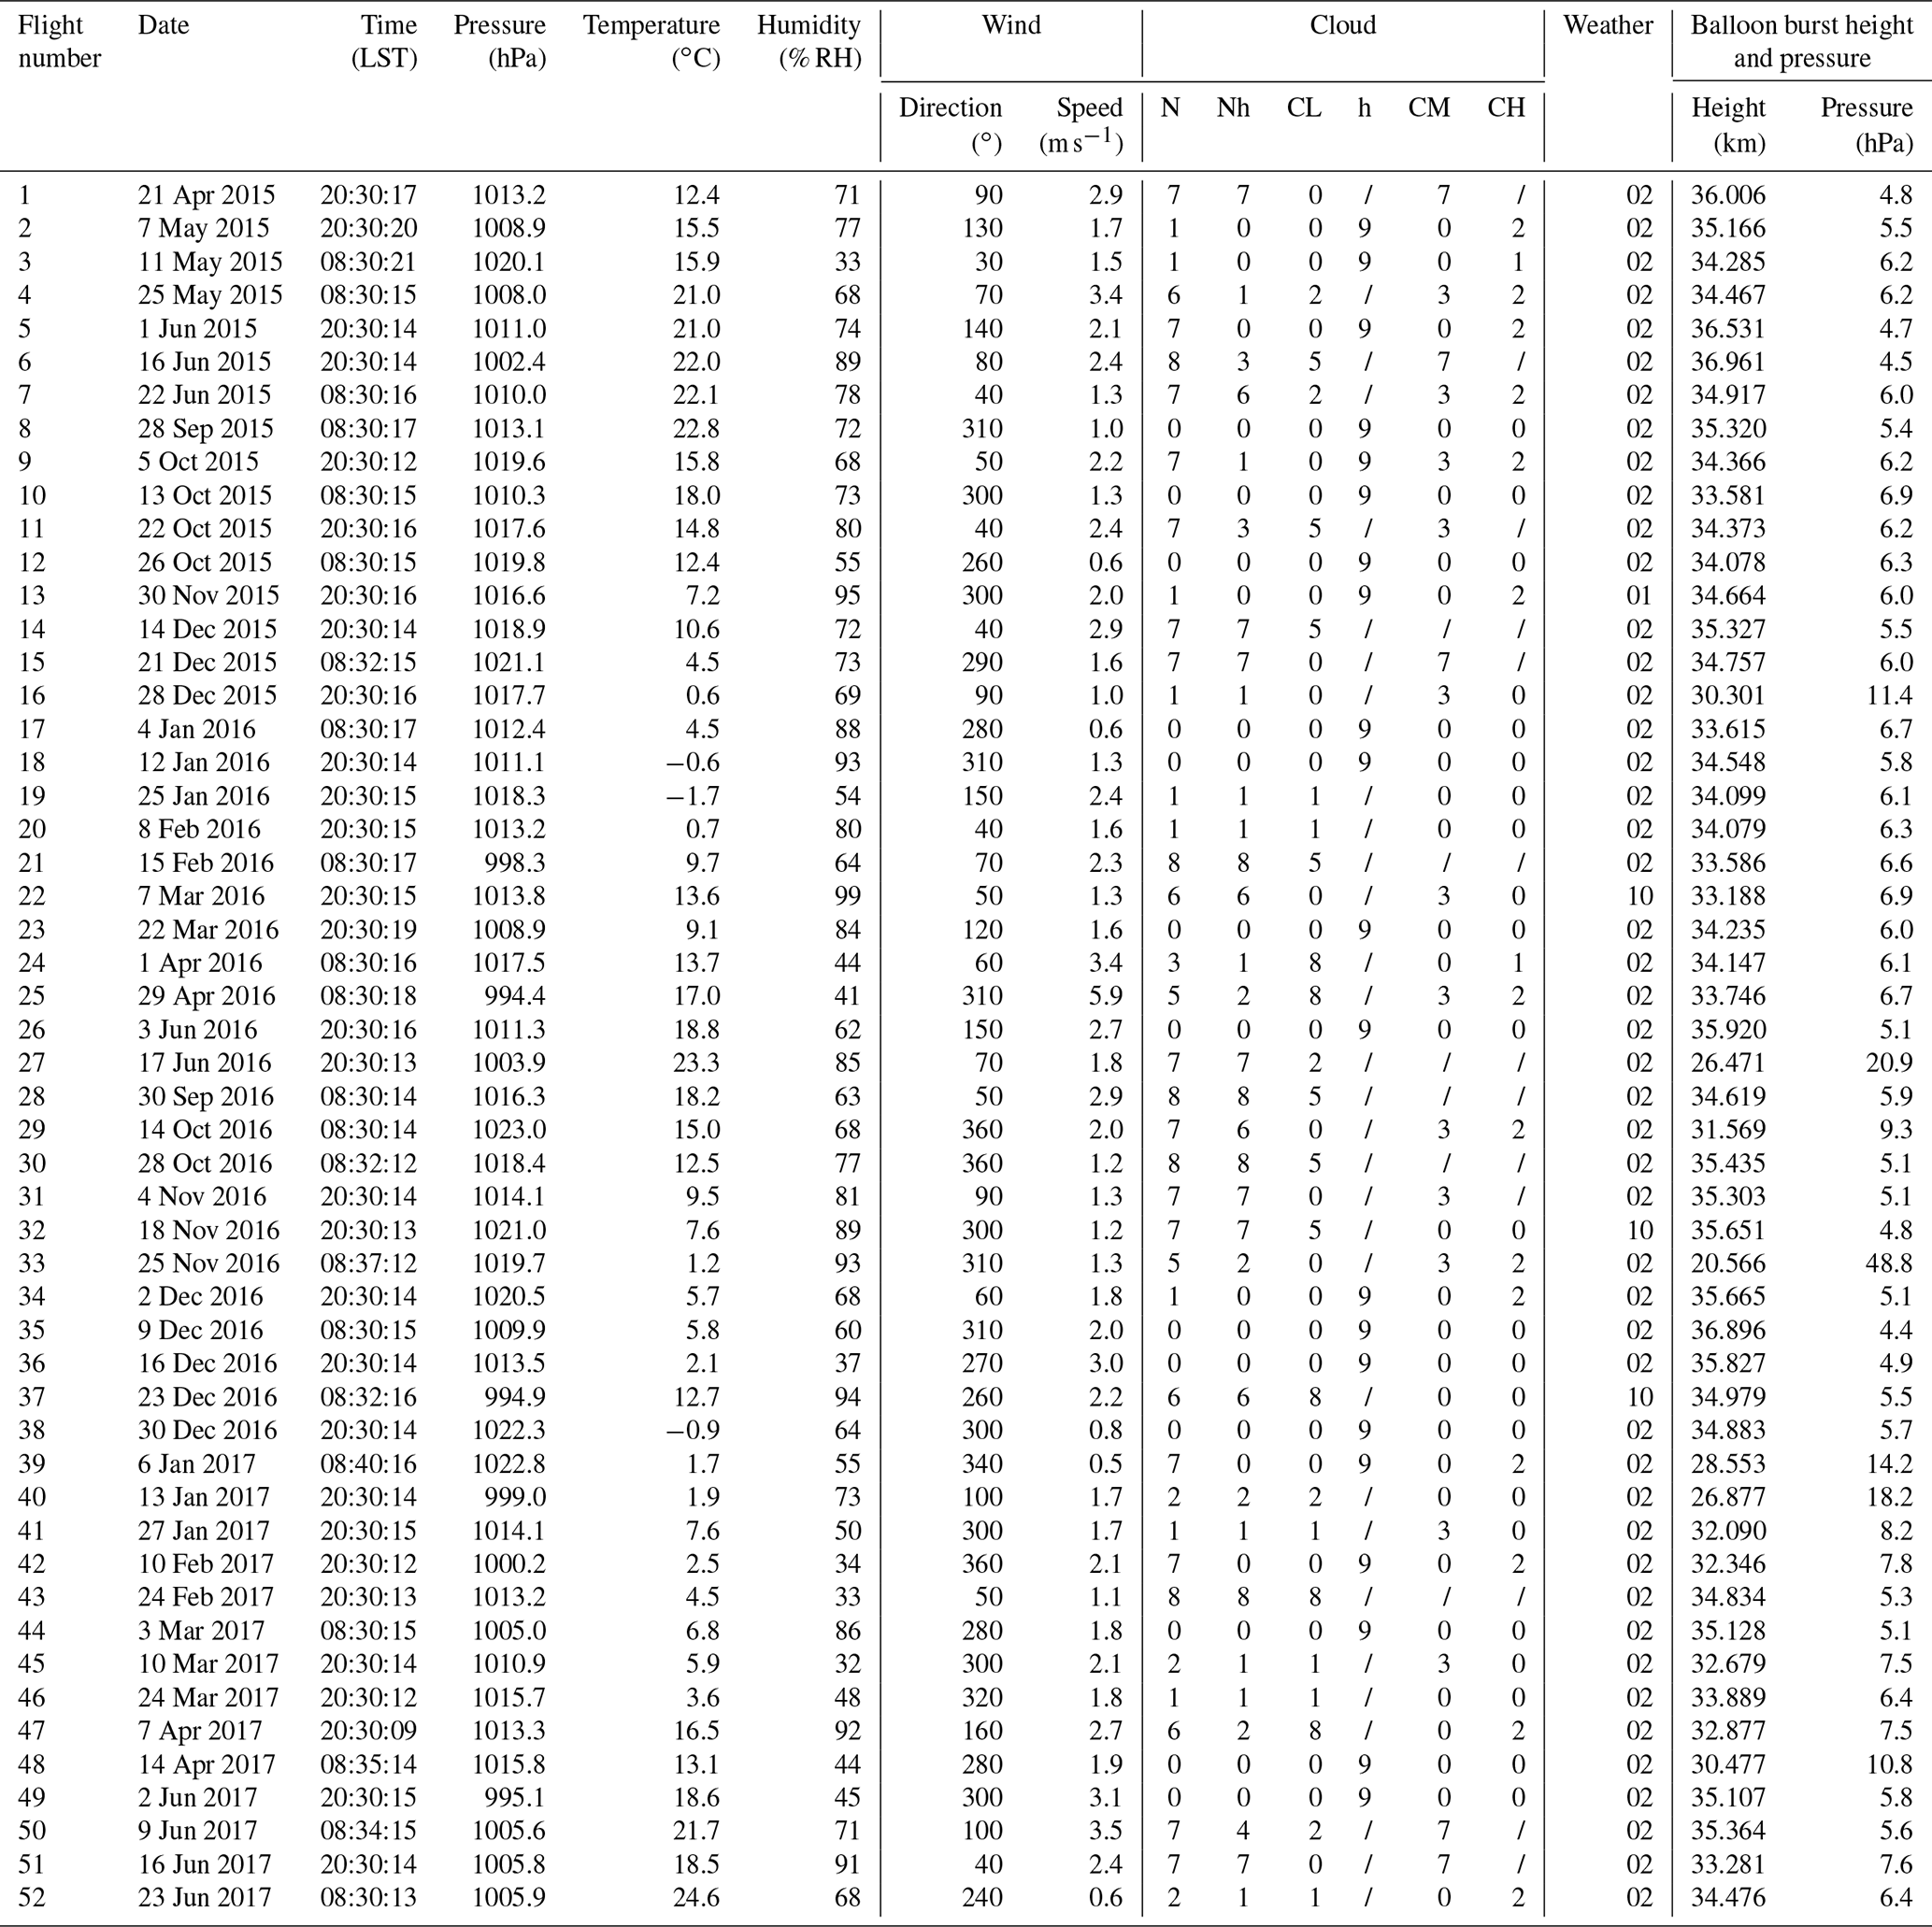

Figure 6 shows the flight configurations. For all soundings, a 1200 g balloon was used. The RS-11G and RS92 units were attached to both ends of a 1 or 0.9 m rod. Table 3 shows the details of the rigs used for the comparison flights. The bamboo rod used from April 2015 to September 2015 was replaced with a lightweight paper cardboard rod in October 2015 for safety in the event of a fall to the ground. During these periods, the radiosondes were directly attached to the rod with elevated temperature sensors to avoid any rod-related influence on temperature and humidity measurement. However, the paper cardboard rod was thicker than the bamboo rod and kept much air inside, which might have caused unexpected heat flow and influenced the temperature measurements. The temperature differences investigated for each of the four different rig configurations are shown in Fig. 7. The temperature differences are averaged for each pressure layer based on the method described in Sect. 4.2. Note that the five outliers are not excluded in Fig. 7. Although the temperature differences of the four different rig configurations are similar between 500 and 50 hPa, the temperature difference for the paper cardboard rod (Fig. 7c, d) tend to be somewhat larger than those for the bamboo rod with radiosondes hanging freely (Fig. 7e, f) and plastic rod (Fig. 7g, h) in the lower troposphere (between 1000 and 500 hPa) and at pressures <10 hPa. The source of these differences is unclear at present. In the main analysis (Figs. 8–20), three among the soundings with the paper cardboard rod were excluded because of very large temperature differences. When these three outliers are excluded, the mean difference for those with the paper cardboard rod is found to be essentially within the standard deviation of differences for all the four configurations combined. Additionally, for radiosondes with a direct rod attachment (Fig. 7a, b and c, d), temperature differences can be expected due to varying sensor orientation with respect to the position of the sun. Accordingly, the rig was replaced with a bamboo rod from which radiosondes were hung in September 2016. The latest rod, which is a plastic cardboard composite with an aluminum tape covering (Table 3) applied to reduce the effects of radiation, has been used since December 2016 based on the GRUAN recommendation (Rohden et al., 2016). The temperature differences for the different rig configurations were not significantly different and the authors did not separate data depending on the rig configurations in this study. However, an estimation of the impact of rod on observation data is important for dual soundings and it is our future task.

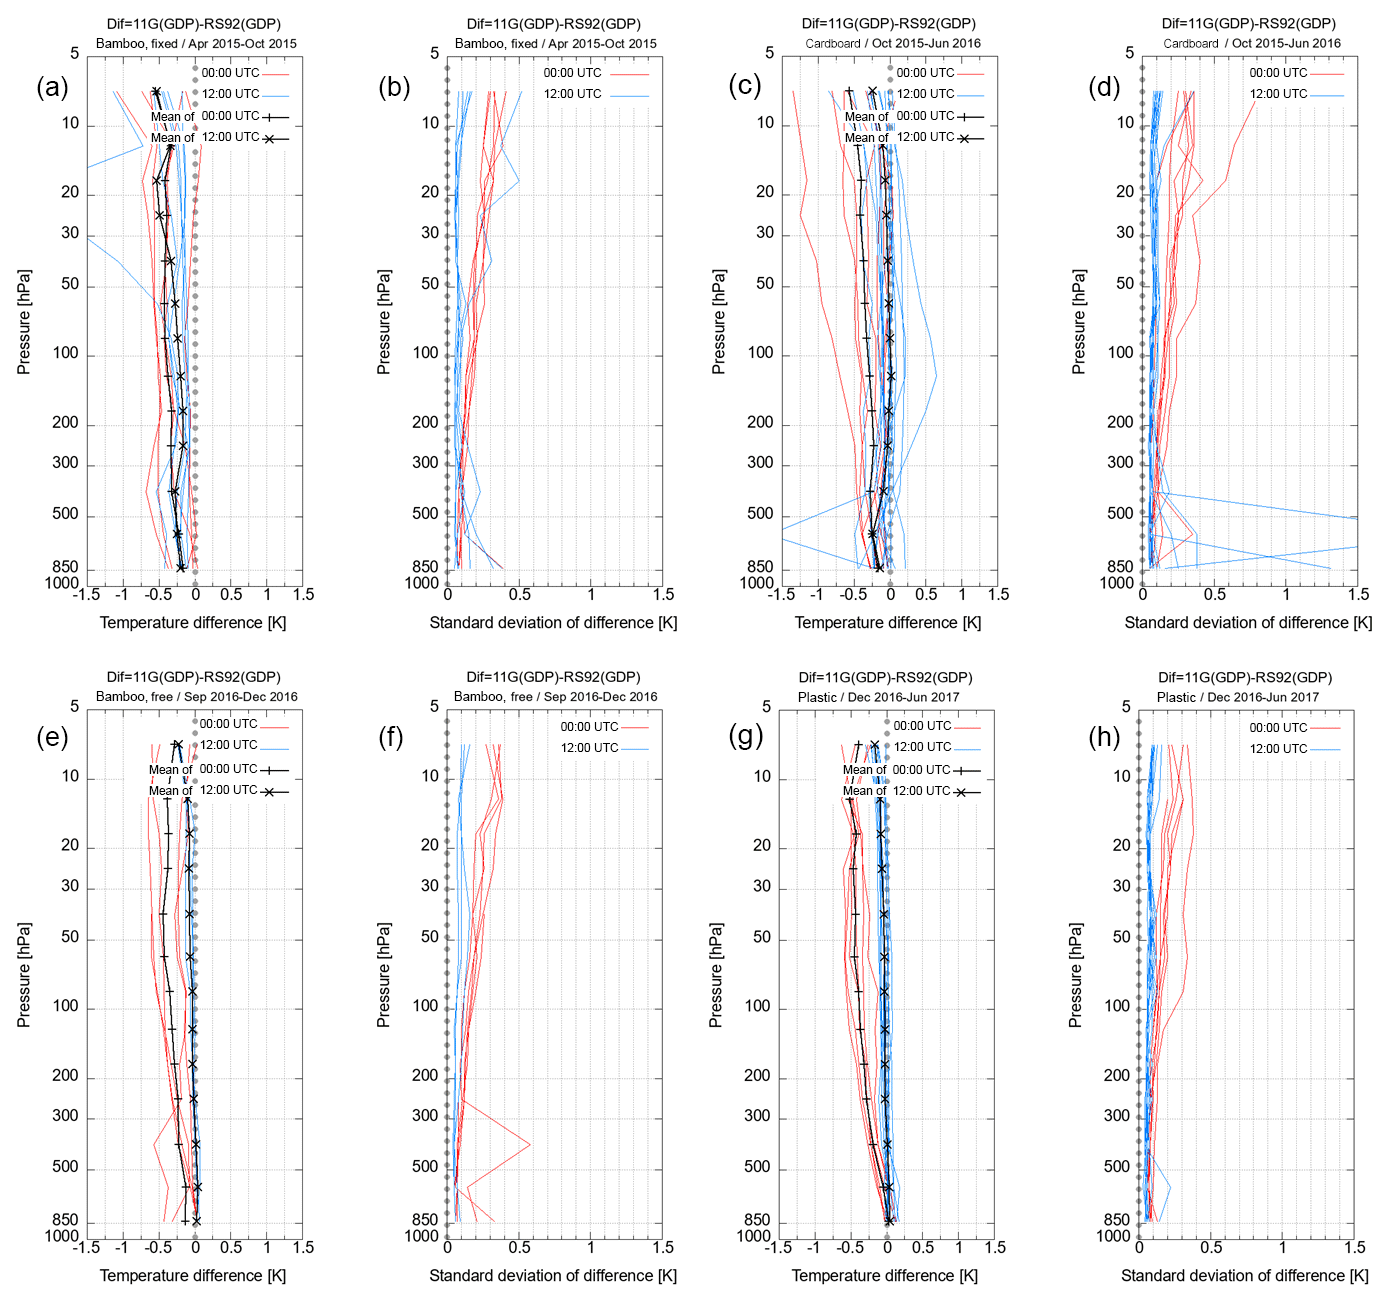
Figure 7Temperature differences and standard deviation for four different rig configurations. The temperature data were allocated to four categories, i.e., bamboo rod with fixed radiosondes (a, b), paper cardboard rod (c, d), bamboo rod with radiosondes hanging freely (e, f), and plastic cardboard rod (g, h). Red and blue lines show the results in daytime and nighttime observations, respectively. Black lines show means of temperature differences for daytime (00:00 UTC) and nighttime (12:00 UTC) data.
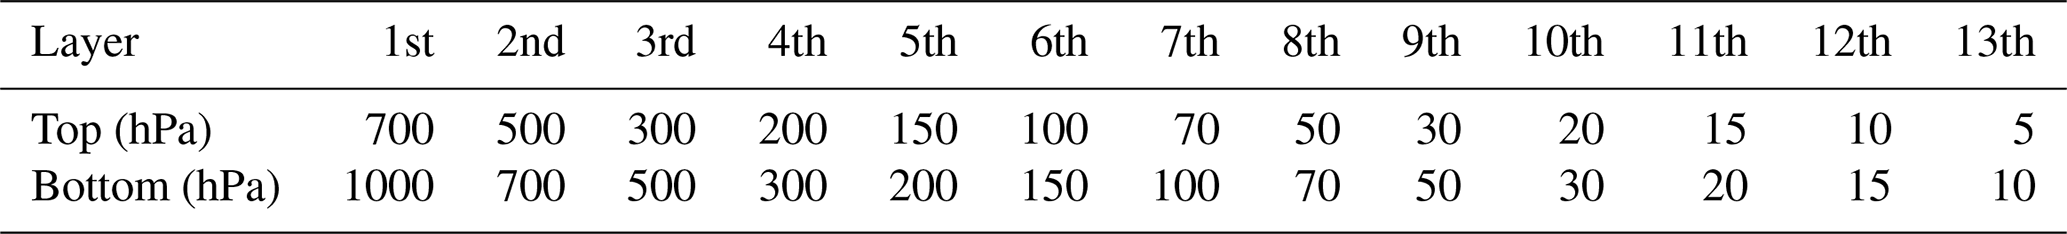
Table 4Pressure range for an allocation of RS-11G and RS92 measurements. The differences between RS-11G and RS92 measurements were allocated to the 13 pressure layers based on RS92 pressure data ().
Data for the GDPs of RS-11G and RS92 are collected at 1 s intervals. Temporally simultaneous observations were compared, using the statistical approach adopted by Kobayashi et al. (2012) to evaluate differences in sensors and correction methods.
4.1 Time adjustment procedure
Observation data from each radiosonde have a time stamp from the relevant sounding system. As there may be minor discrepancies in balloon-launch time stamps, these data are time-adjusted using temperature as a parameter based on Kobayashi et al. (2012). Values in any 5 min period during which the temperature difference between two radiosondes is smaller than 1 K with a marked change (e.g., in the inversion layer) are chosen from temperature data between 3 and 30 min after balloon release. Correlation coefficients are calculated by shifting the two temperature profiles every second. The lag time that gives the greatest correlation coefficient is used to shift one of the two sets of profiles. In this study, the time lag between RS-11G and RS92 was less than 3 s in most cases.
4.2 Statistical procedure
After time adjustment, per-second differences between RS-11G and RS92 measurements were calculated and the resulting data were allocated to the 13 pressure layers based on RS92 pressure data (, where 92 represents RS92 and i indicates the time step) as per Kobayashi et al. (2012). The bins for 13 pressure layers are listed in Table 4.
and are RS-11G and RS92 values, respectively, at time step i. The mean of each variable (, ) and the mean of the difference ( are calculated using Eqs. (1)–(3) below for each pressure layer (from i=is to i=ie). The difference is defined as the RS-11G value minus the RS92 value ().
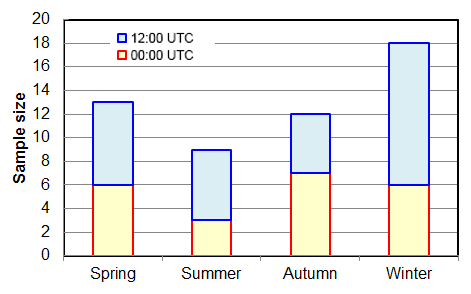
Statistics for each pressure layer are calculated separately for daytime, nighttime, and individual seasons. Figure 8 shows the number of flights for each season. M is defined as the total number of soundings () in each condition; e.g., M=6 for daytime in spring, and M=7 for nighttime in spring.
The ensemble mean of the RS-11G GDP for individual pressure layers with each condition is
The ensemble mean of RS92 GDP for each pressure layer for each condition is
The ensemble mean difference for each pressure layer is
The standard deviation of the ensemble mean difference for individual pressure layers for each condition is
Daytime observation is conducted at 00:00 UTC (09:00 LT, launched at 08:30 LT) and nighttime observation at 12:00 UTC (21:00 LT, launched at 20:30 LT). Spring is defined as March to May, summer June to August, autumn September to November, and winter December to February. Figure 9 shows mean profiles of temperature and RH from RS-11G.
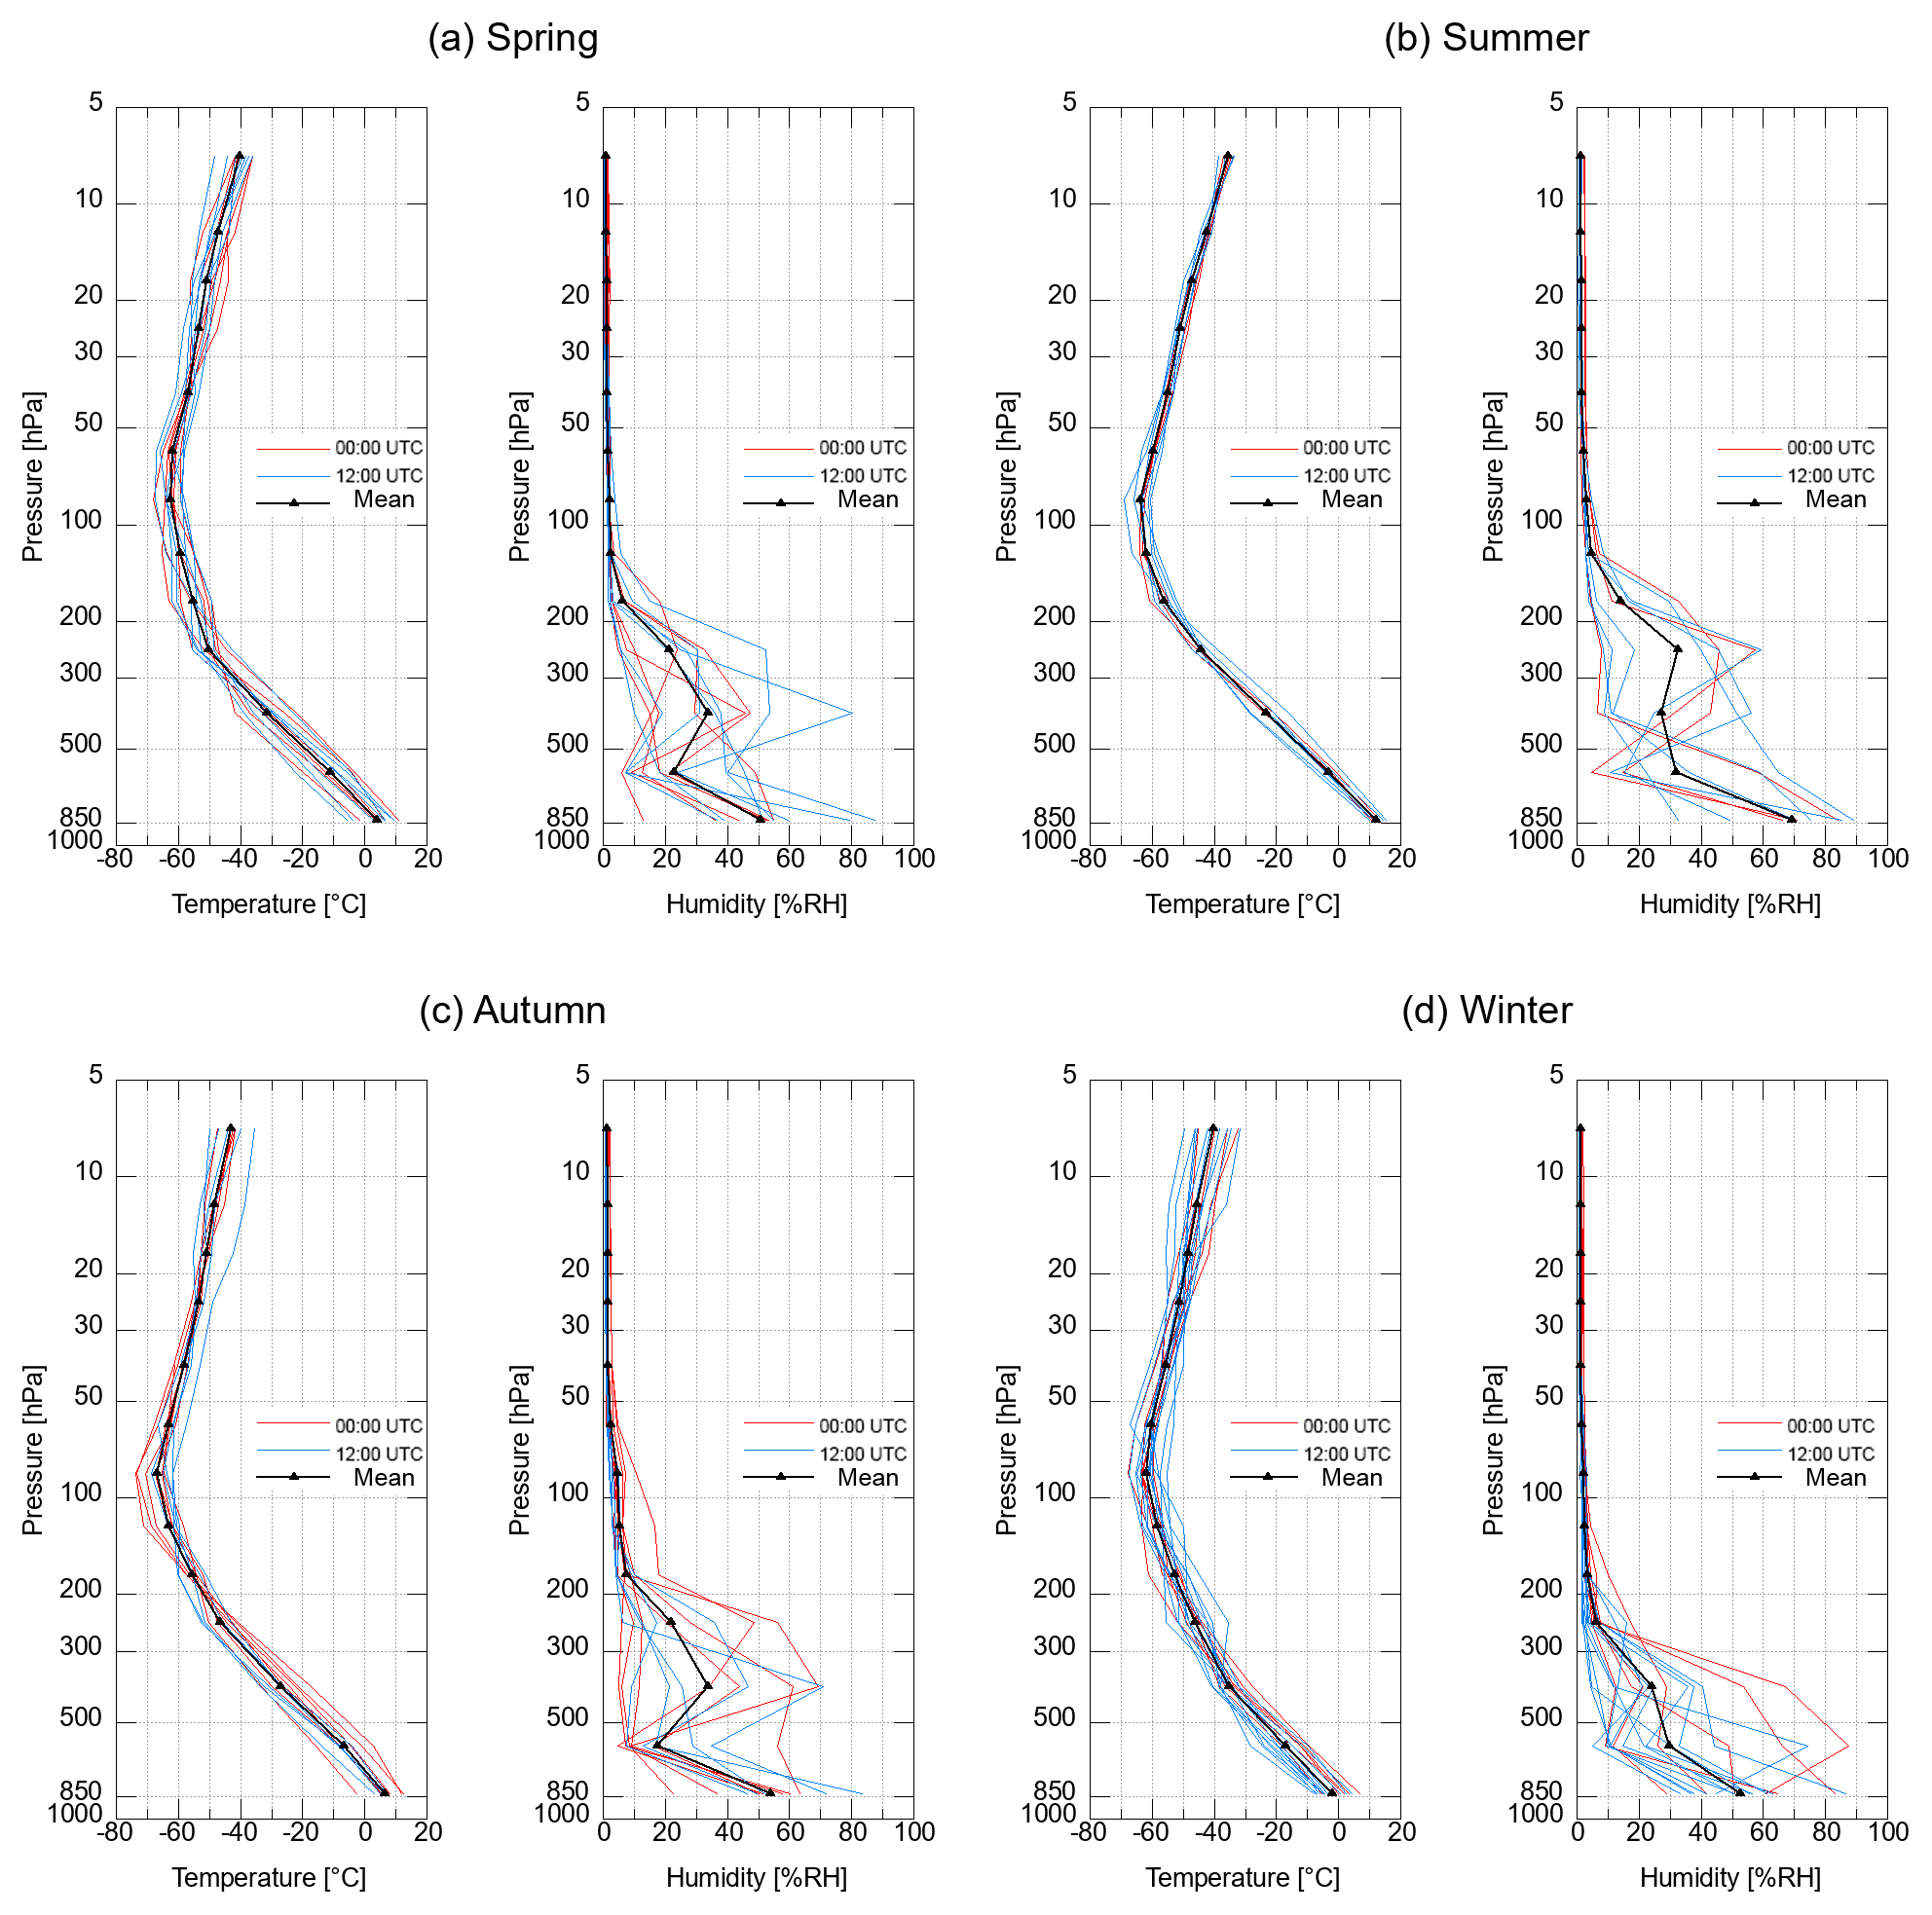
Figure 9Seasonal profiles of temperature and RH from RS-11G. Red and blue lines show daytime and nighttime observations, respectively, and black lines show means for all observations.
5.1 Comparison of simultaneous measurements
Figure 10 shows ensemble mean temperature differences and the standard deviation of these differences. The RS92 GDP was chosen as the reference in this study for its status as a GRUAN-certified data product. In the stratosphere during the daytime, the RS-11G GDP value is about −0.4 K lower than the RS92 GDP value. At nighttime, temperature differences are very small at pressures >20 hPa. Differences among the four seasons are limited.

Figure 10Profiles of mean temperature differences (RS-11G GDP minus RS92 GDP) and standard deviations for each season and for all seasons combined. Brown, blue, green, and red lines show means for autumn, winter, spring, and summer, respectively, and black lines show means for all seasons.
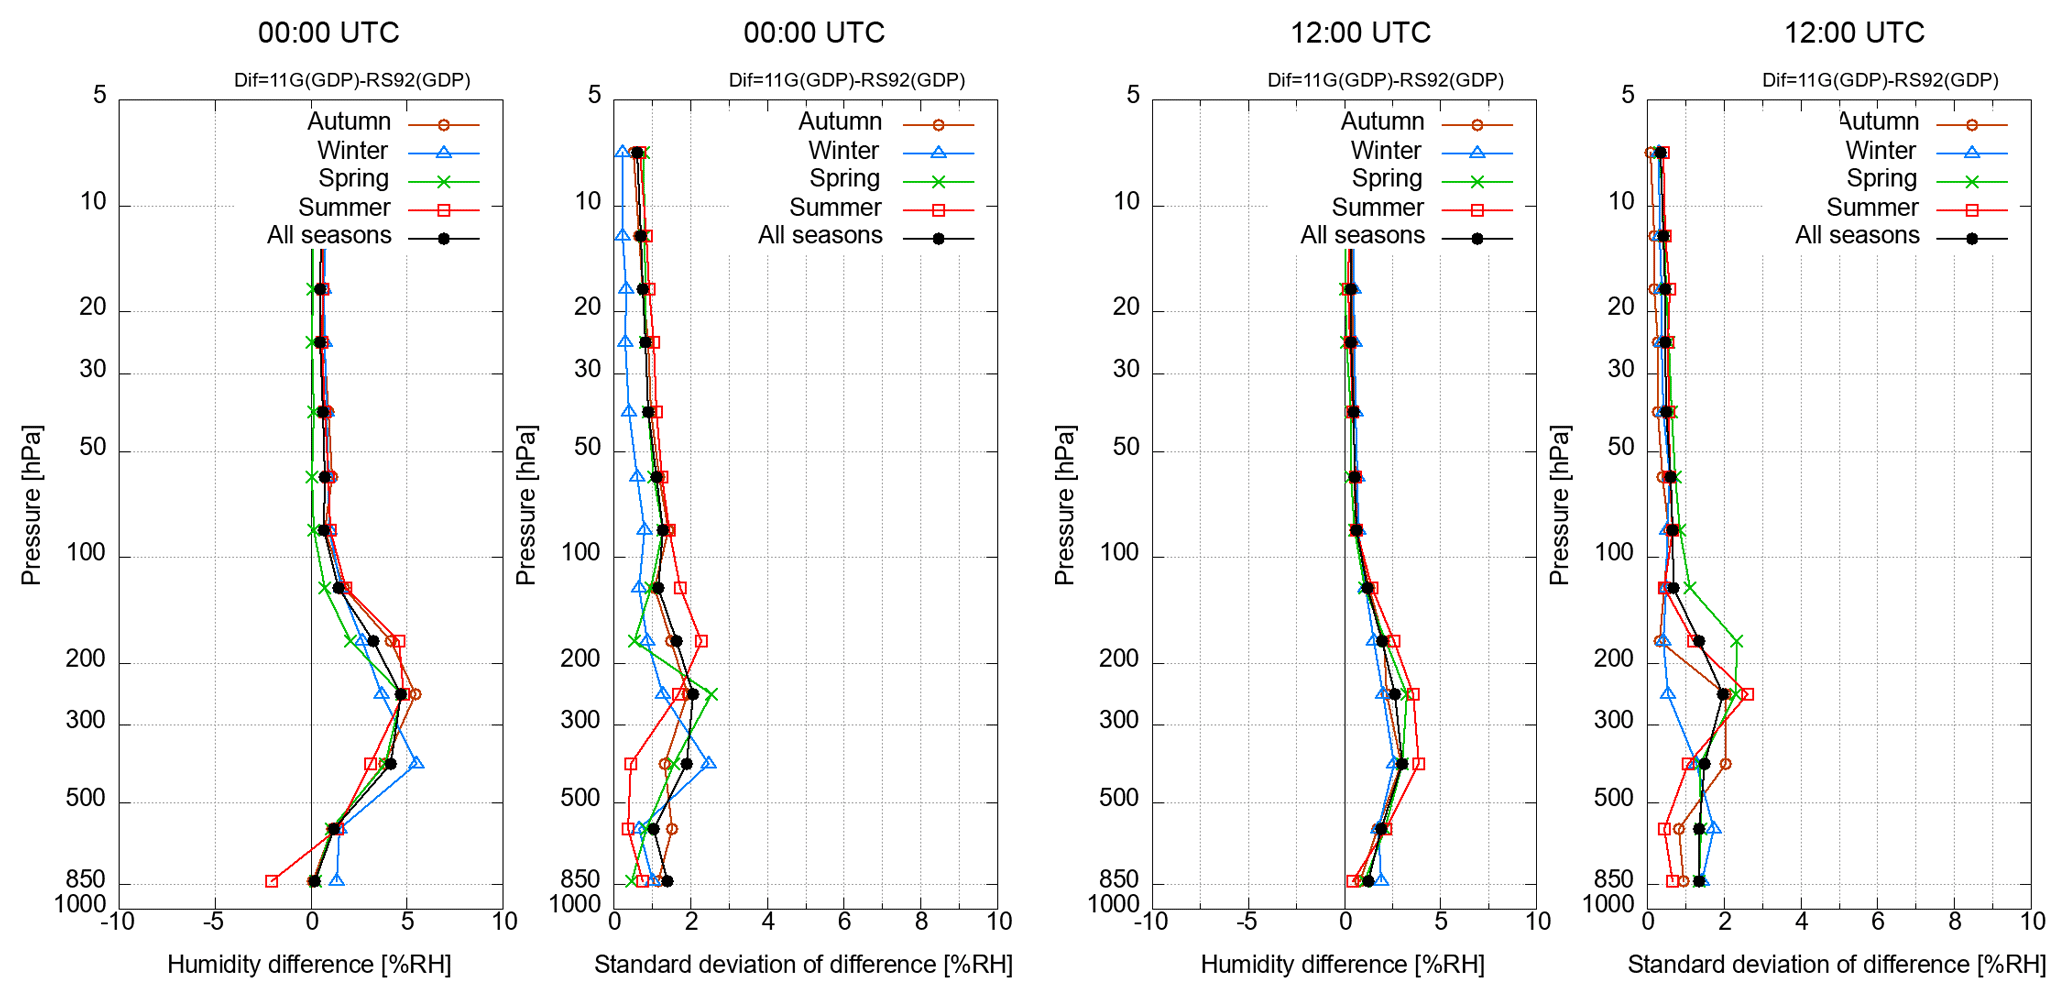
Figure 11 shows ensemble mean RH differences and the standard deviation of these differences. The RH values of RS-11G GDPs are larger than those of RS92 GDPs, and the RH difference exceeds 2 % RH between 500 and 150 hPa in both daytime and nighttime data. Figure 12 shows ensemble mean RH differences classified for six RH ranges. Most samples in the 90 % RH–100 % RH range are found at pressures >300 hPa, and the RS-11G GDP value in this range is 2 % RH smaller than the RS92 GDP value. The RH differences in the 50 % RH–70 % RH and 70 % RH–90 % RH ranges are very small at pressures >500 hPa. In dry conditions with values less than 50 % RH, the RS-11G GDP value is larger than the RS92 GDP value and the RH difference is approximately 5 % RH between 500 and 150 hPa. RH differences in the 0 % RH–10 % RH range are within 1 % RH at pressures ≤70 hPa. The results shown in Fig. 12 also indicate that absolute RH differences at pressures >500 hPa in Fig. 11 are smaller than those between 500 and 200 hPa because the mean differences are balanced out by the values in both dry and humid conditions.
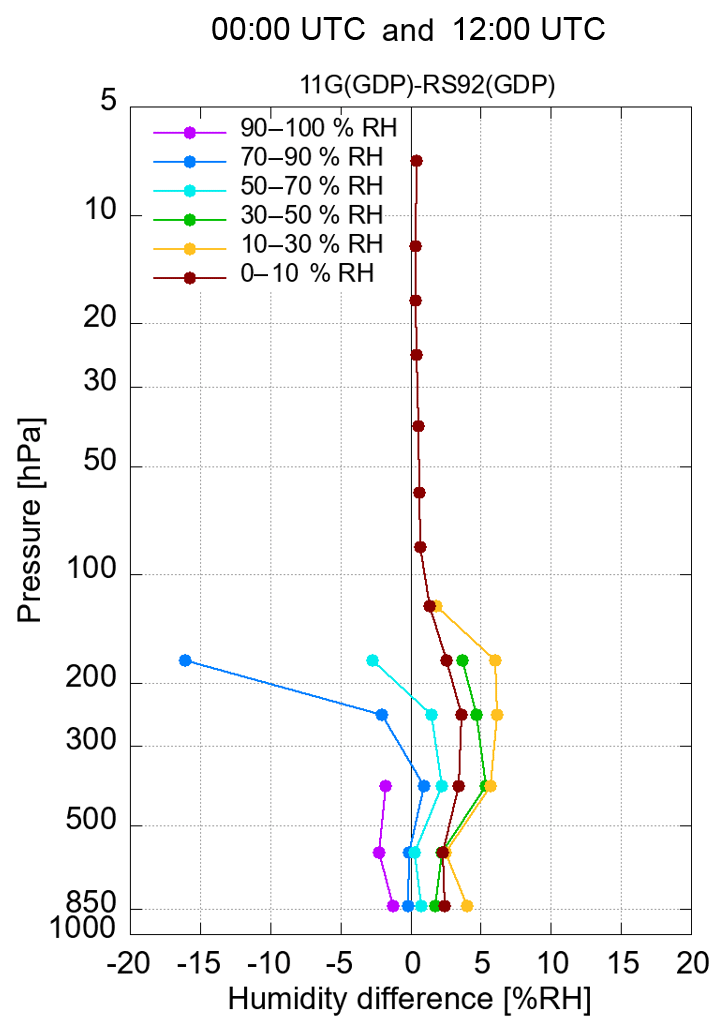
Figure 12Profiles of mean differences (RS-11G GDP minus RS92 GDP) for all seasons and day and night combined for different RH ranges.
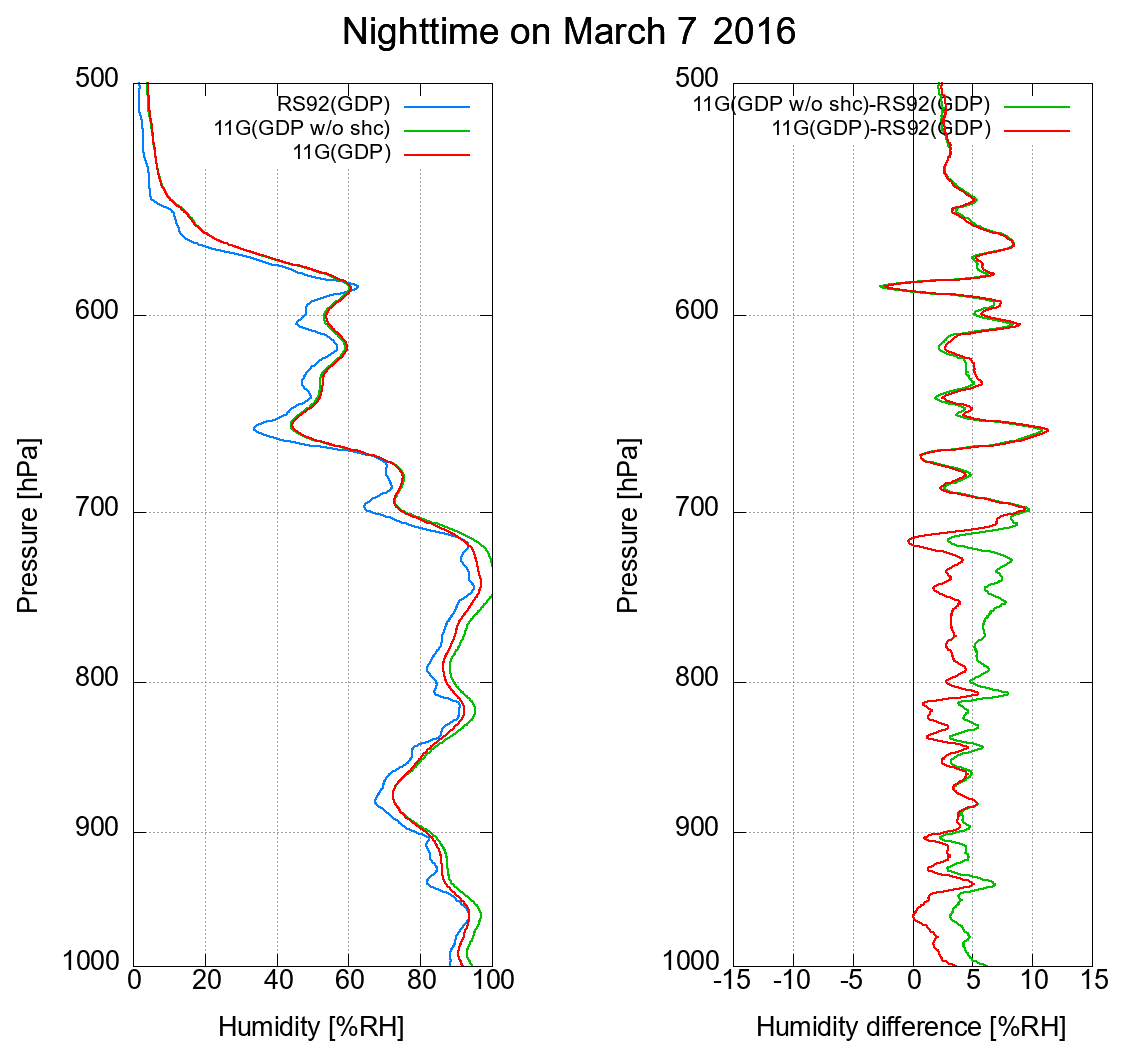
Figure 13Profiles of relative humidity and differences (RS-11G GDP minus RS92 GDP). RS-11G (GDP) shows RS-11G GDP RH with SHC correction, and RS-11G (GDP w/o SHC) shows RS-11G GDP RH without SHC correction. RS92 data are not included in SHC checking at Tateno.
The RH sensor for the RS-11G GDP is checked using SHC values of 0 % RH (a desiccant-based dry condition) and 100 % RH (a distilled water-based wet condition) before launch, and the check data are utilized for correction of the RH calibration curve in the GDP. Figure 13 shows RH profiles with and without SHC correction for 7 March 2016 at 12:00 UTC as an example of the effects of SHC correction. The difference between RS-11G GDP with correction and RS92 GDP is smaller in wet conditions at values greater than 90 % RH, and SHC correction can therefore be deemed effective in this case. Half of the samples including very humid conditions indicate that SHC correction for RS-11G gives improved results. However, the effects of SHC correction for very dry conditions are relatively limited.
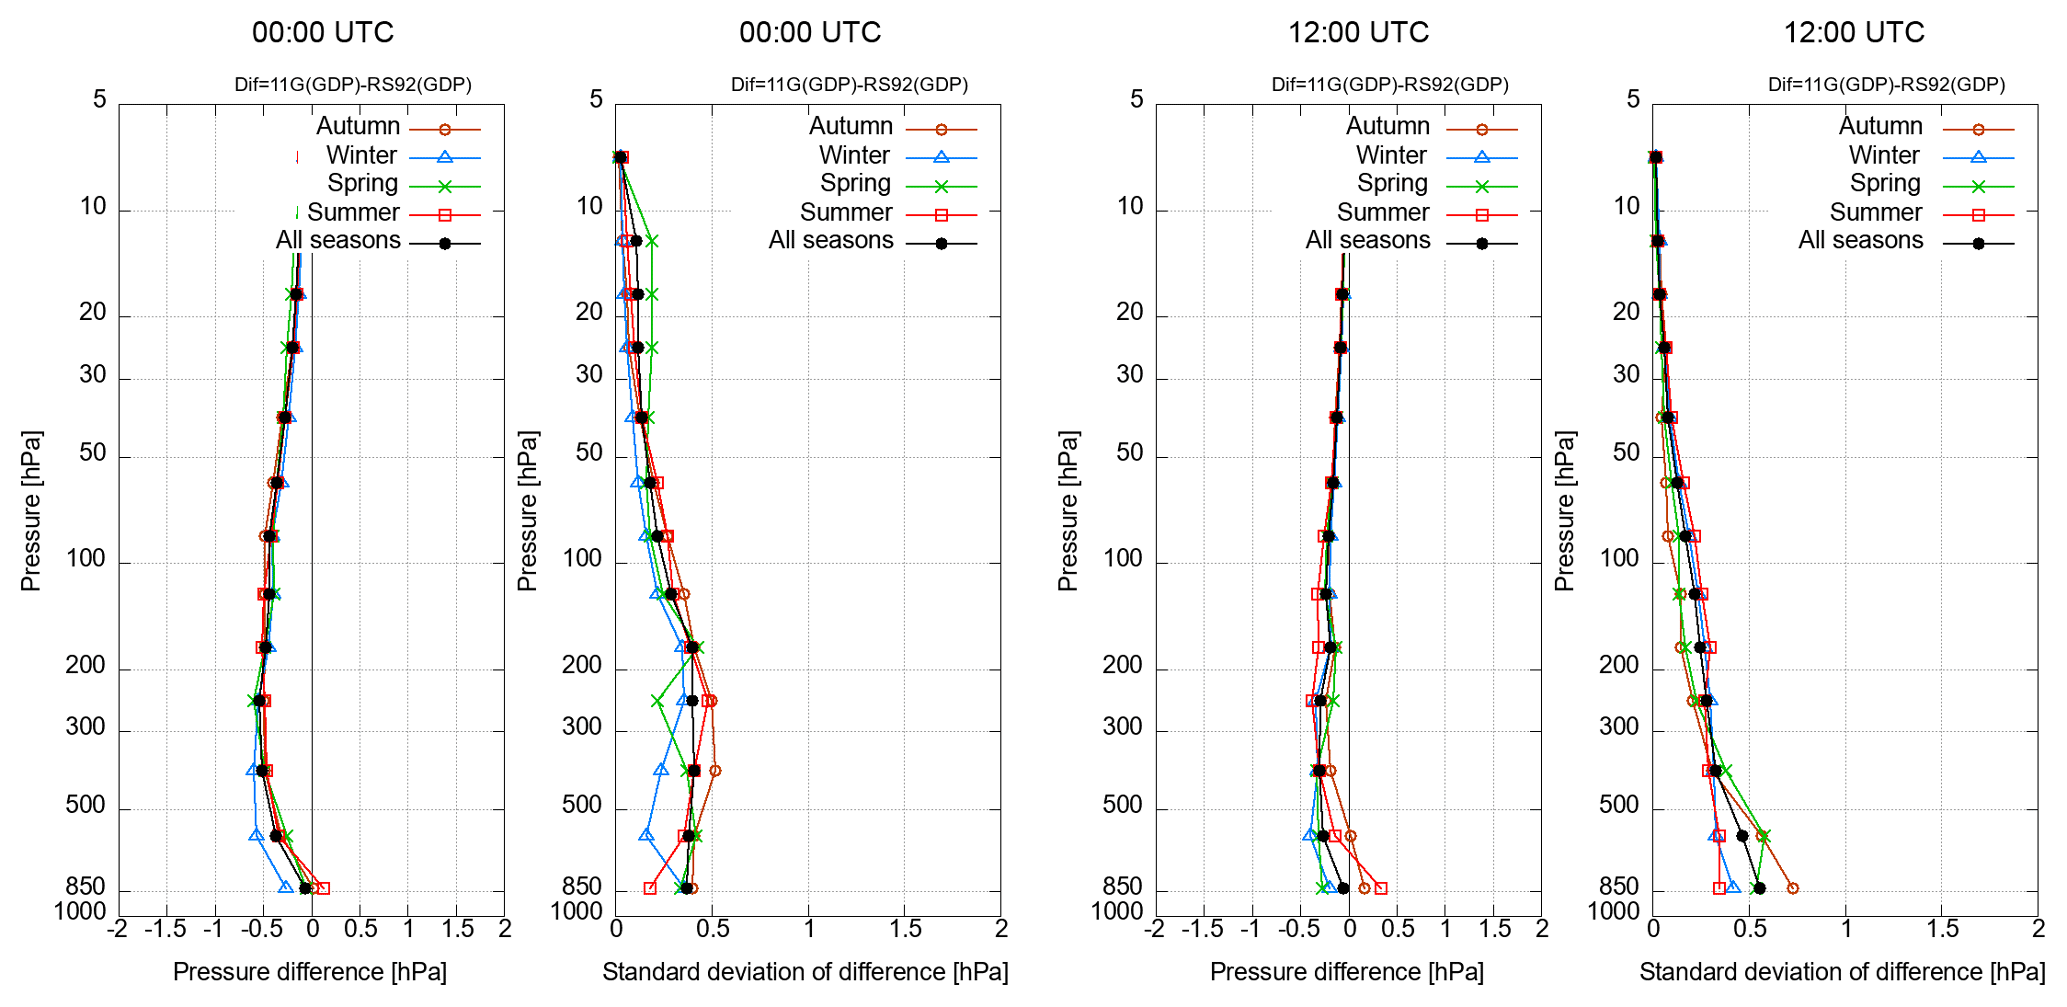

Figures 14 and 15 show seasonal ensemble mean differences of pressure and geopotential height and the related standard deviations, respectively. RS-11G GDP pressure is generally lower than that of RS92 GDP except at pressures >700 hPa in summer and autumn. In the daytime, RS-11G GDP pressure is 0.5 hPa lower than RS92 GDP between 500 and 50 hPa, and the pressure difference is small at pressures ≤50 hPa. The pressure difference at nighttime is smaller than during the day. The measurement methods used contribute to pressure differences in tropospheric data; RS-11G GDP pressure is derived from GPS data, while RS92 GDP pressure is derived from pressure sensor data. Temperature differences also influence pressure differences, particularly in the stratosphere, because both radiosondes use temperature, relative humidity, and GPS altitude data to derive pressure data. In Fig. 10, the daytime temperature difference is larger than at nighttime, which may cause differences between daytime and nighttime data in pressure comparison results. The RS-11G GDP geopotential height is larger than that of RS92 GDP in the daytime, and the difference is 10–20 m at pressures ≤100 hPa. The geopotential height difference at nighttime is smaller than during the day. The daytime difference and standard deviation in spring at pressures ≤30 hPa is much larger than the difference and standard deviation in other seasons, but if the exceptional case causing this, for which difference from the ensemble mean difference exceeds more than 90 m (there is one such sample out of six in total), is removed, the seasonal difference and standard deviation are very small.
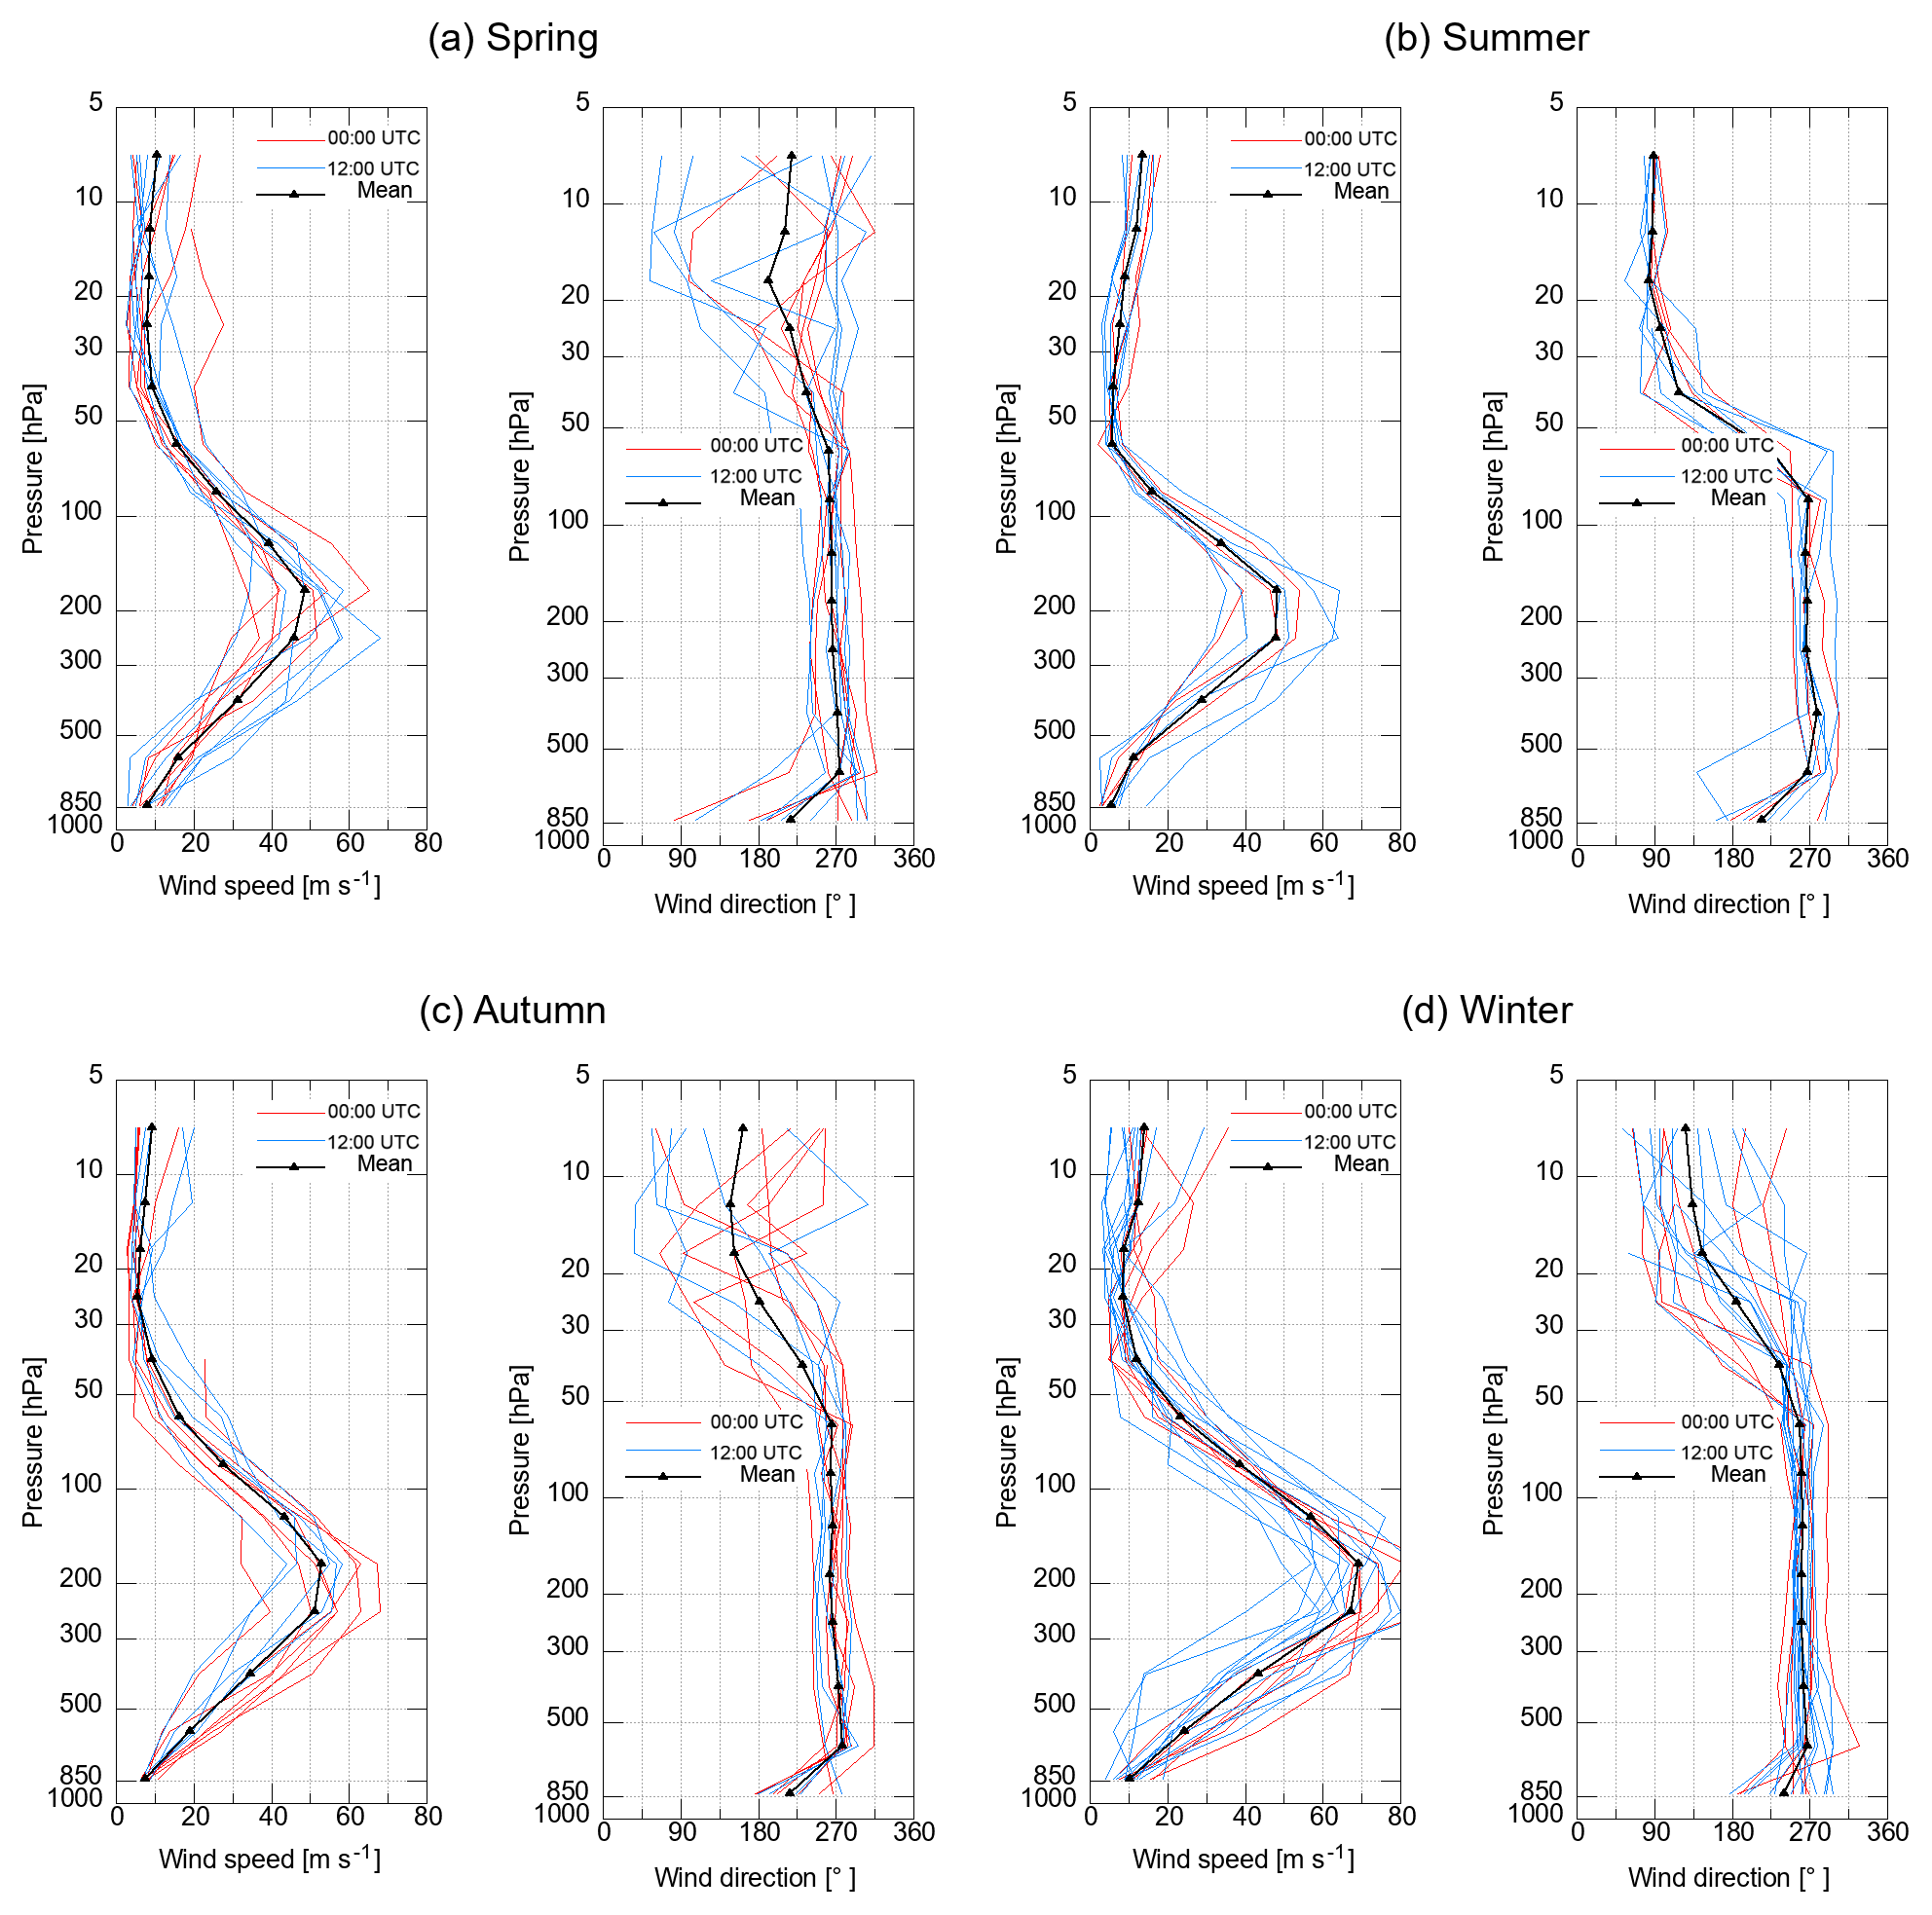
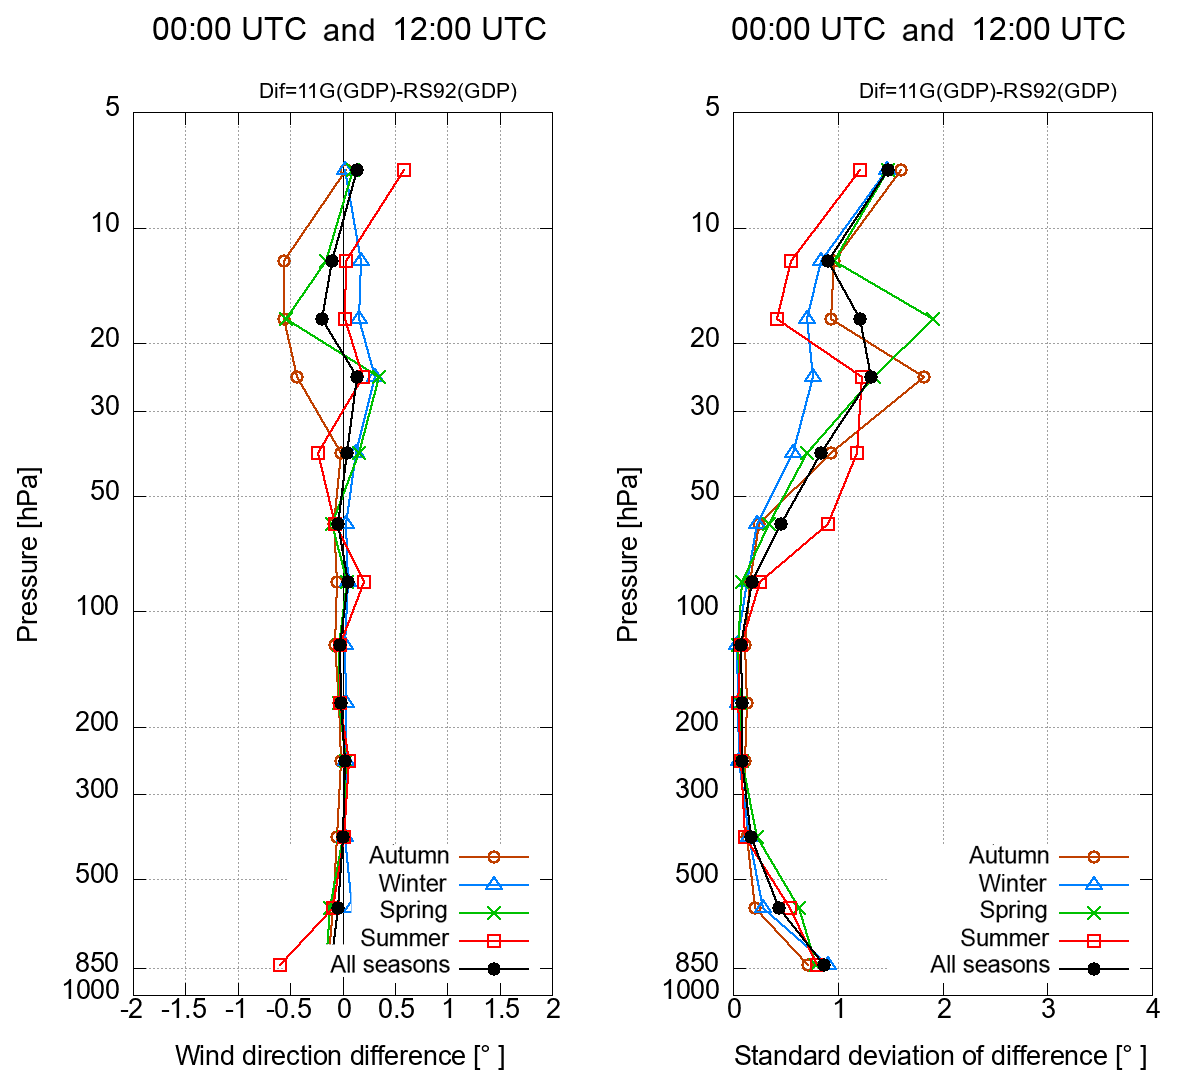
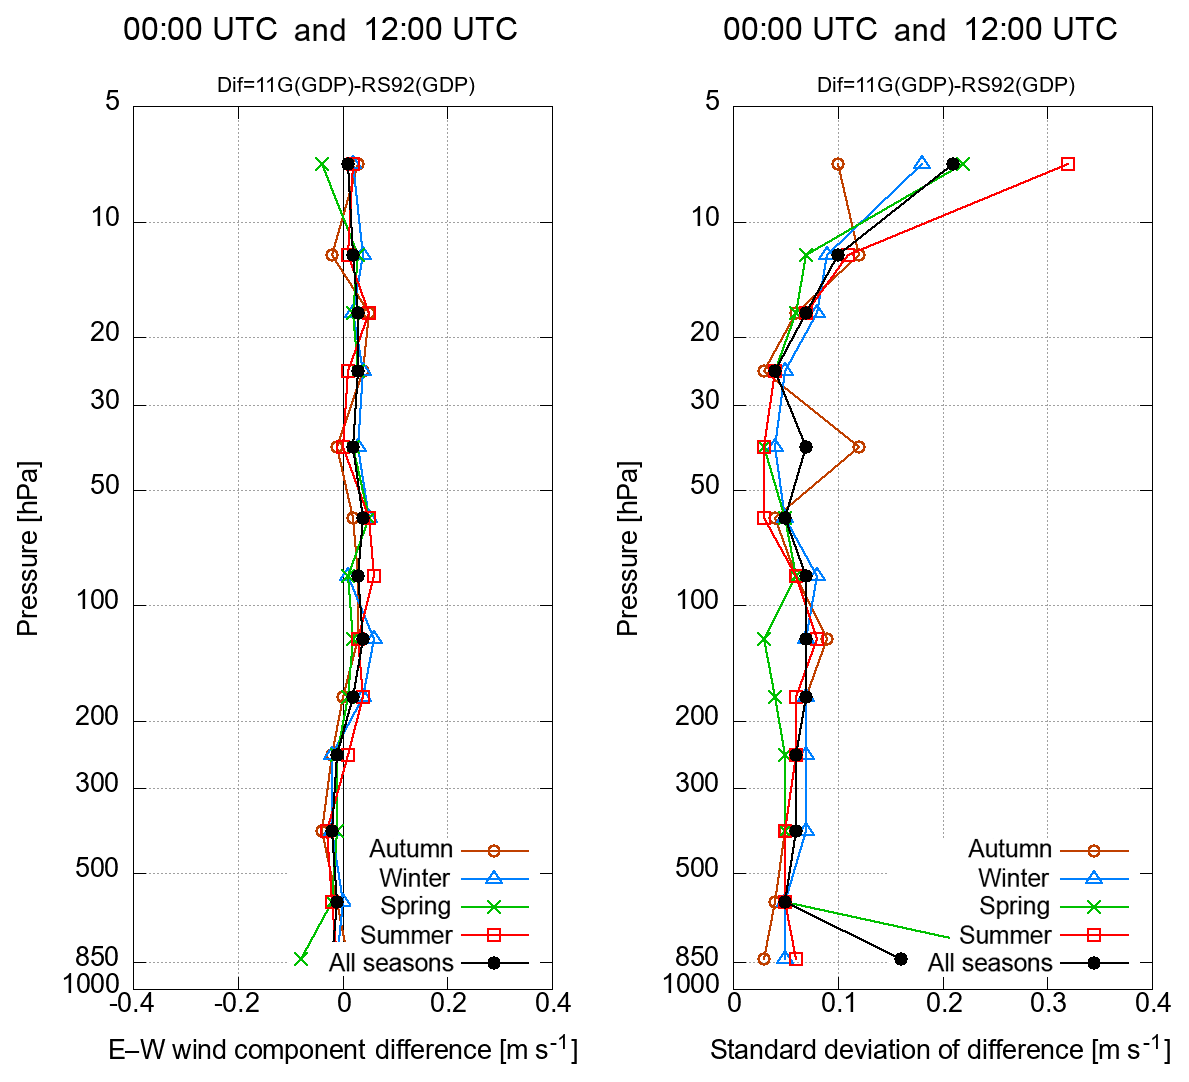
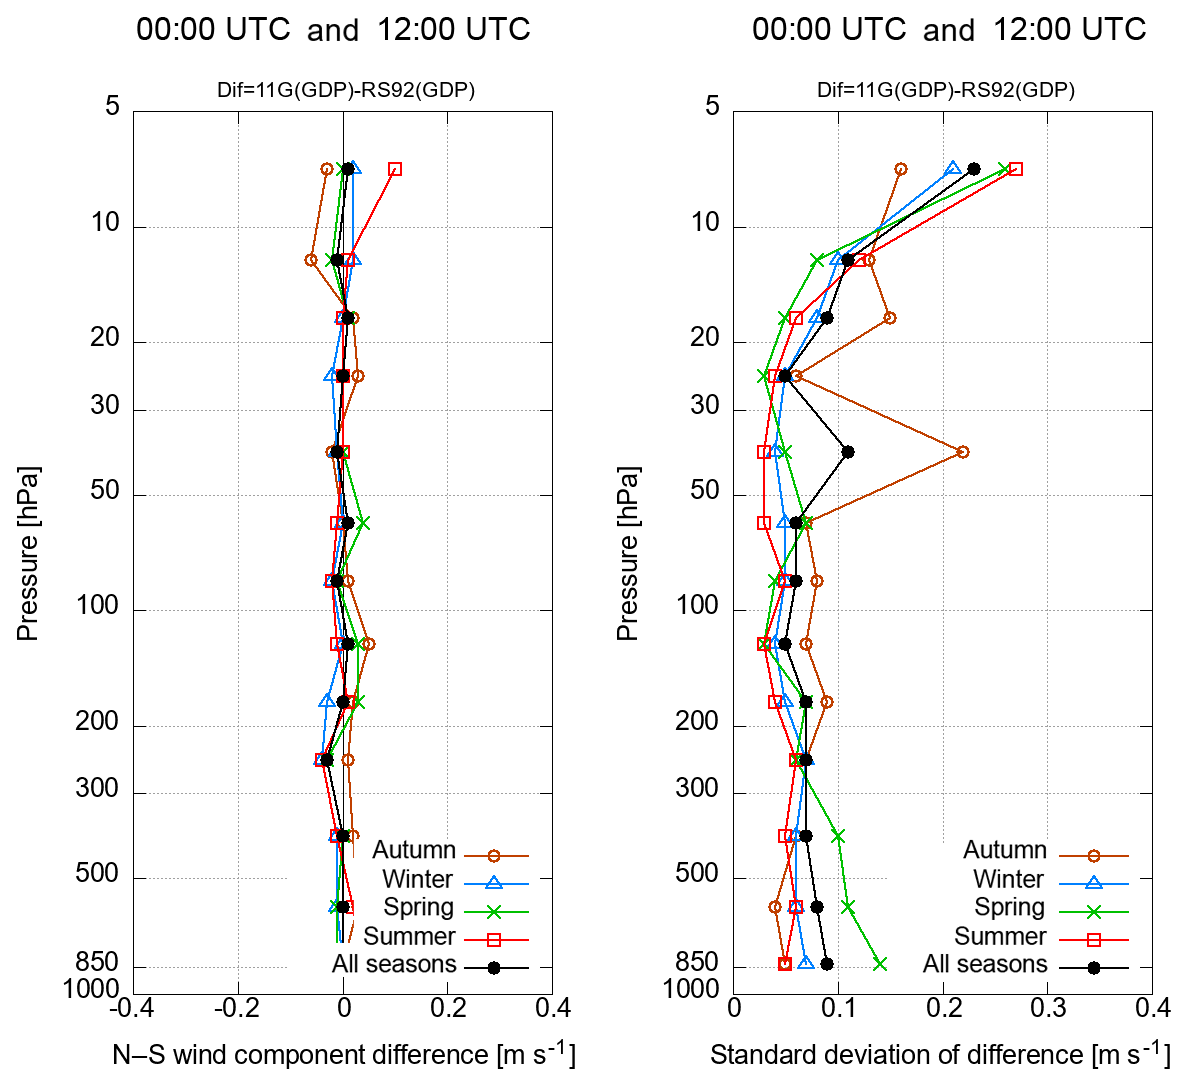
Figure 16 shows wind speed and wind direction profiles from each RS-11G sounding. Figures 17, 18, 19, and 20 show seasonal ensemble mean differences of wind speed and wind direction. The mean wind speed differences are smaller than 0.2 m s−1, and the mean wind direction differences are smaller than 1∘. The mean wind component differences are also smaller than 0.1 m s−1, and the standard deviations for all seasons are smaller than 0.1 m s−1 between 700 and 15 hPa. As RS-11G and RS92 both use GPS-based wind measurement procedures, RS-11G GDP winds and RS92 GDP winds show a close statistical correlation.
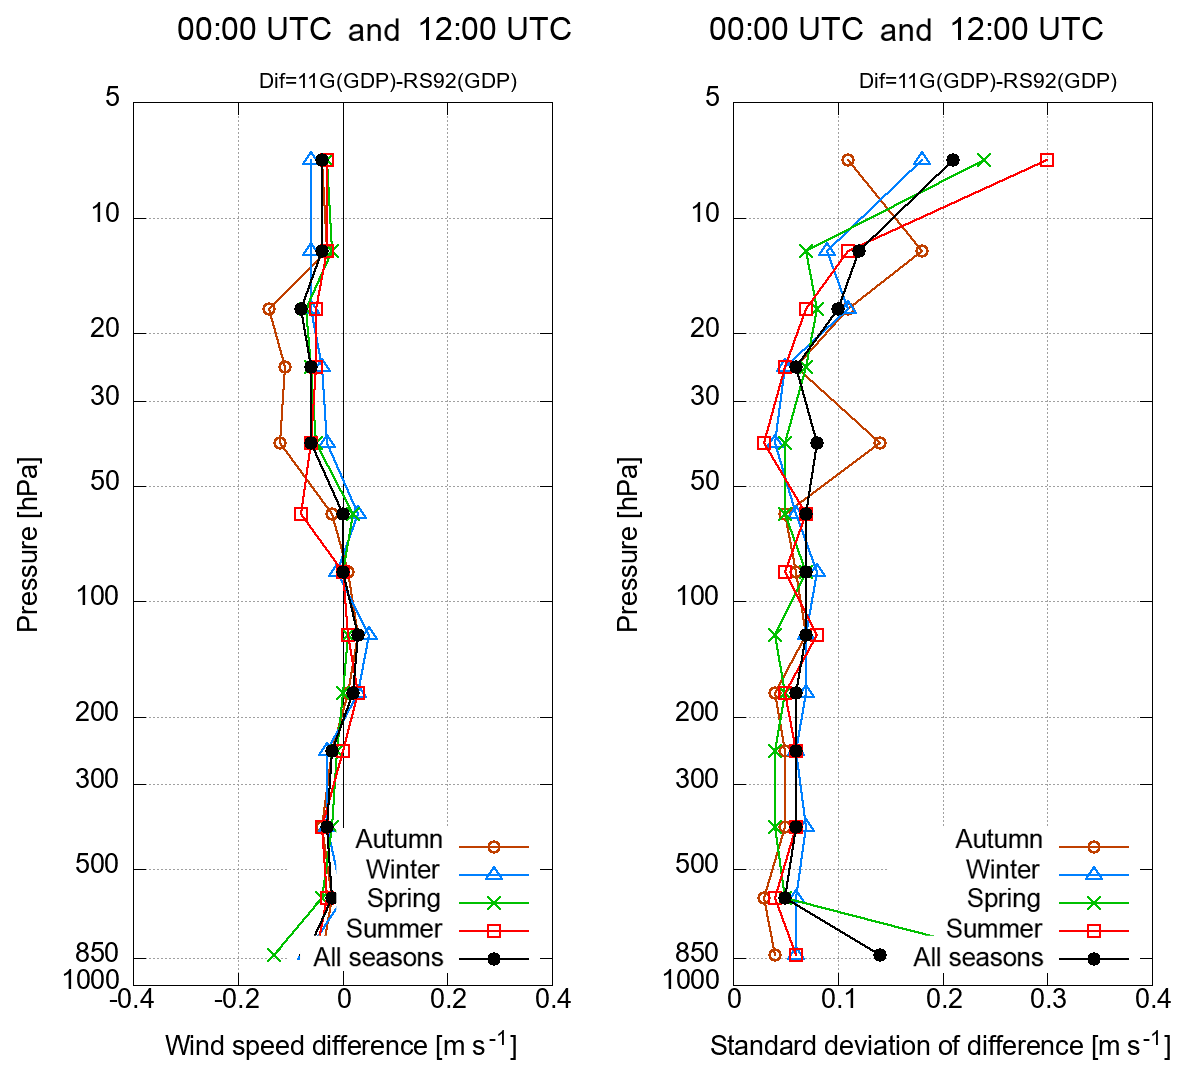
Figure 17Profiles of differences and standard deviation, as for Fig. 10, but for wind speed for all soundings (00:00 and 12:00 UTC combined).
5.2 Case analysis with consideration of uncertainty estimates in GRUAN data products
An important aspect of GDP data is that uncertainty estimates are given for each measurement point to support climate record quality. Immler et al. (2010) defined terminology for comparing pairs of independent measurements of the same quantity for consistency using estimated uncertainties as described here. Consider two independent measurements, m1 and m2, of the same measurand with standard uncertainties u1 and u2, respectively. Assume that m1=m2 is true and that uncertainty follows normal distribution. Expression of the degree of consistency between m1 and m2 is given as in Table 5, where k is a coverage factor. Overall uncertainty is calculated from independent sources of uncertainties. The sources contributing to the RS-11G temperature and RH uncertainty budget are listed in Tables 6 and 7, respectively. Uncertainty estimates for RS92 and RS-11G GDPs are described in Dirksen et al. (2014) and Kizu et al. (2018), respectively.
Table 5Terminology for comparing pairs of independent measurements of the same quantification for consistency; excerpt from Sect. 2 of Immler et al. (2010).
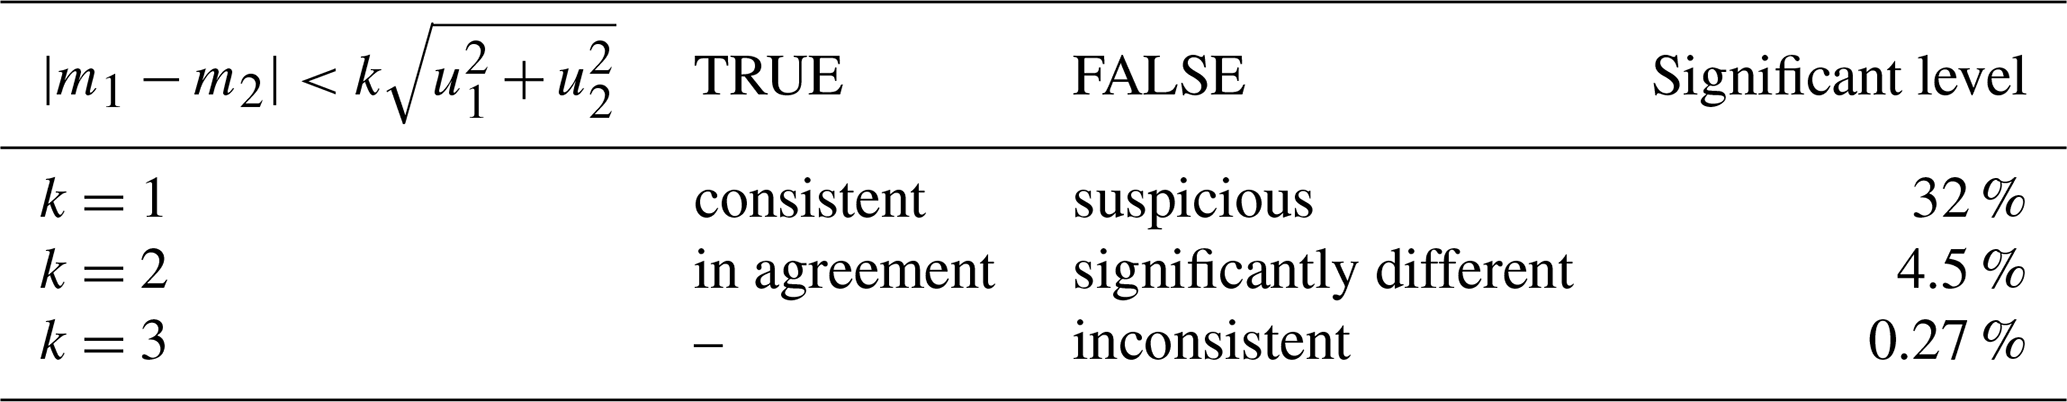
Table 6Sources contributing to RS-11G temperature measurement uncertainty.
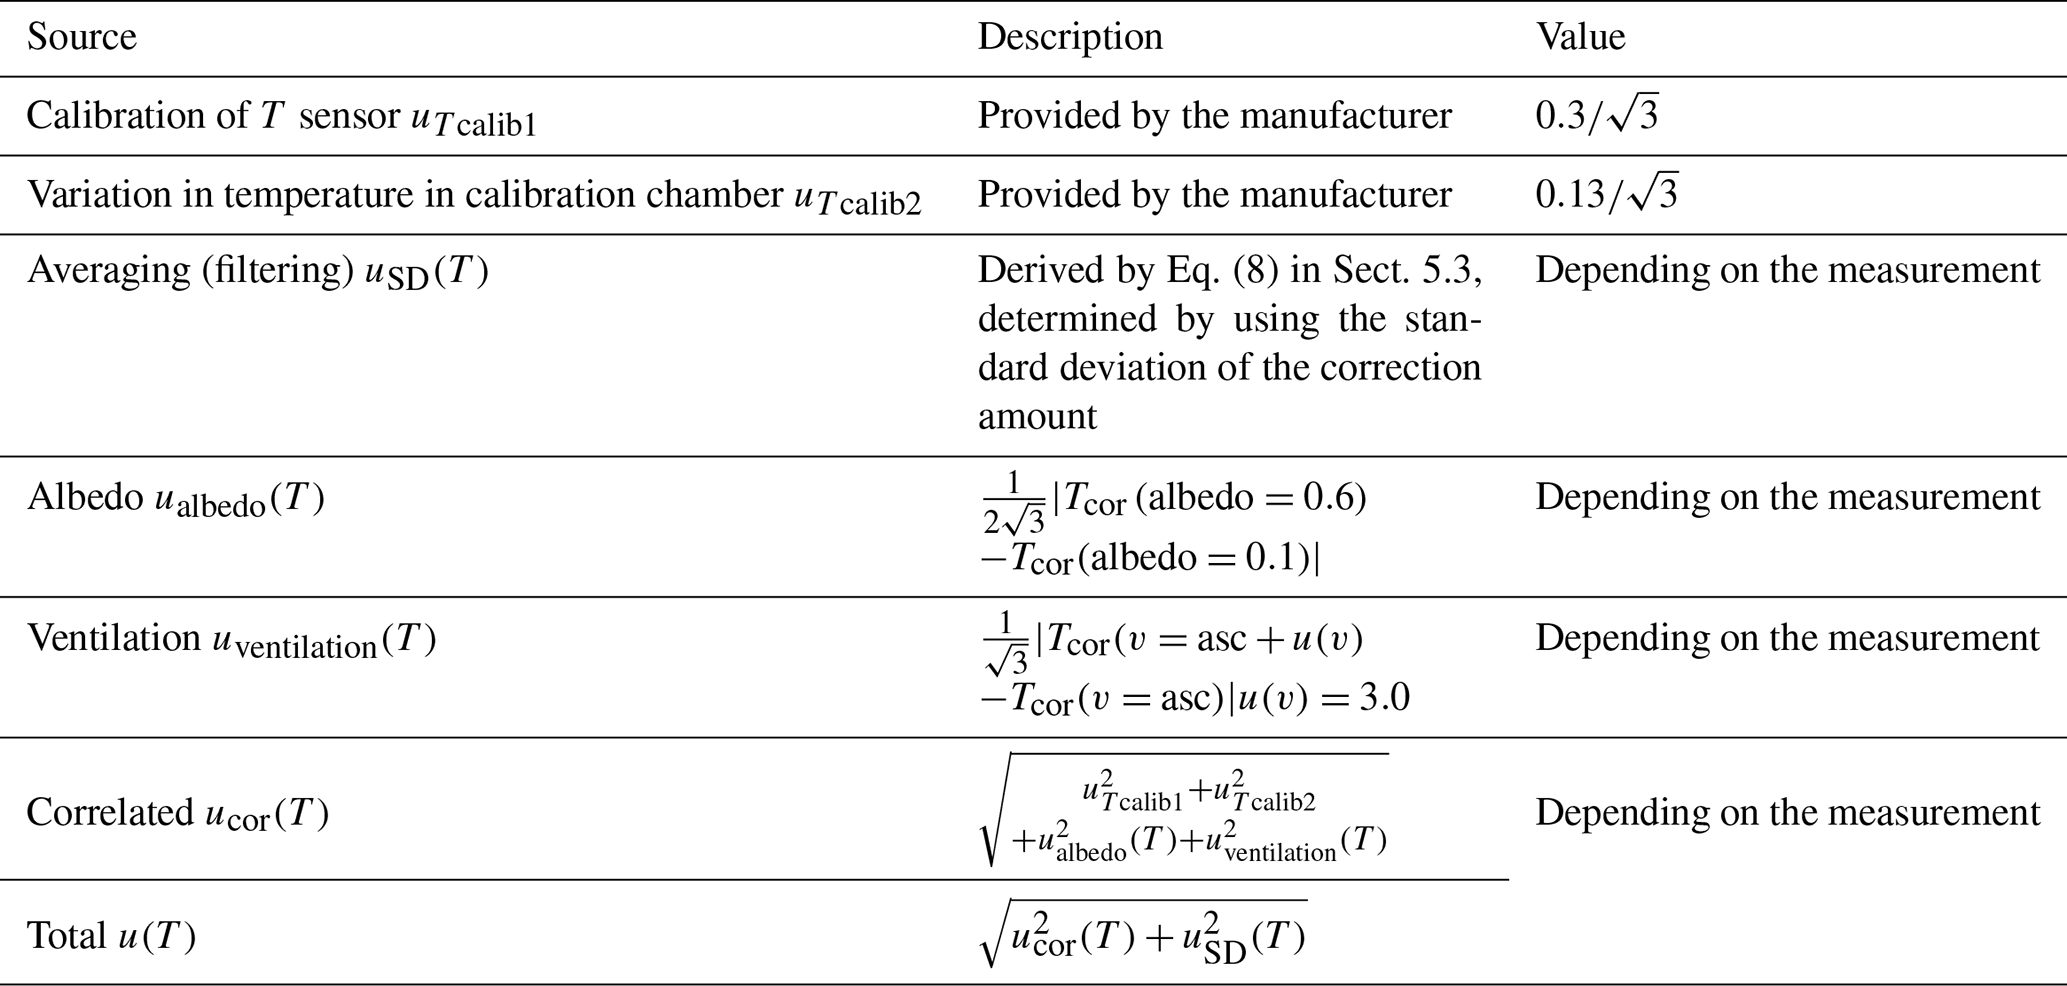
Table 7Sources contributing to RS-11G RH measurement uncertainty. Uncertainties for frequency splitting, contamination correction, and moving averaging are associated with the use of filtering or moving averaging, which are determined by using the standard deviation of the correction amounts. TUD denotes temperature–humidity dependence.

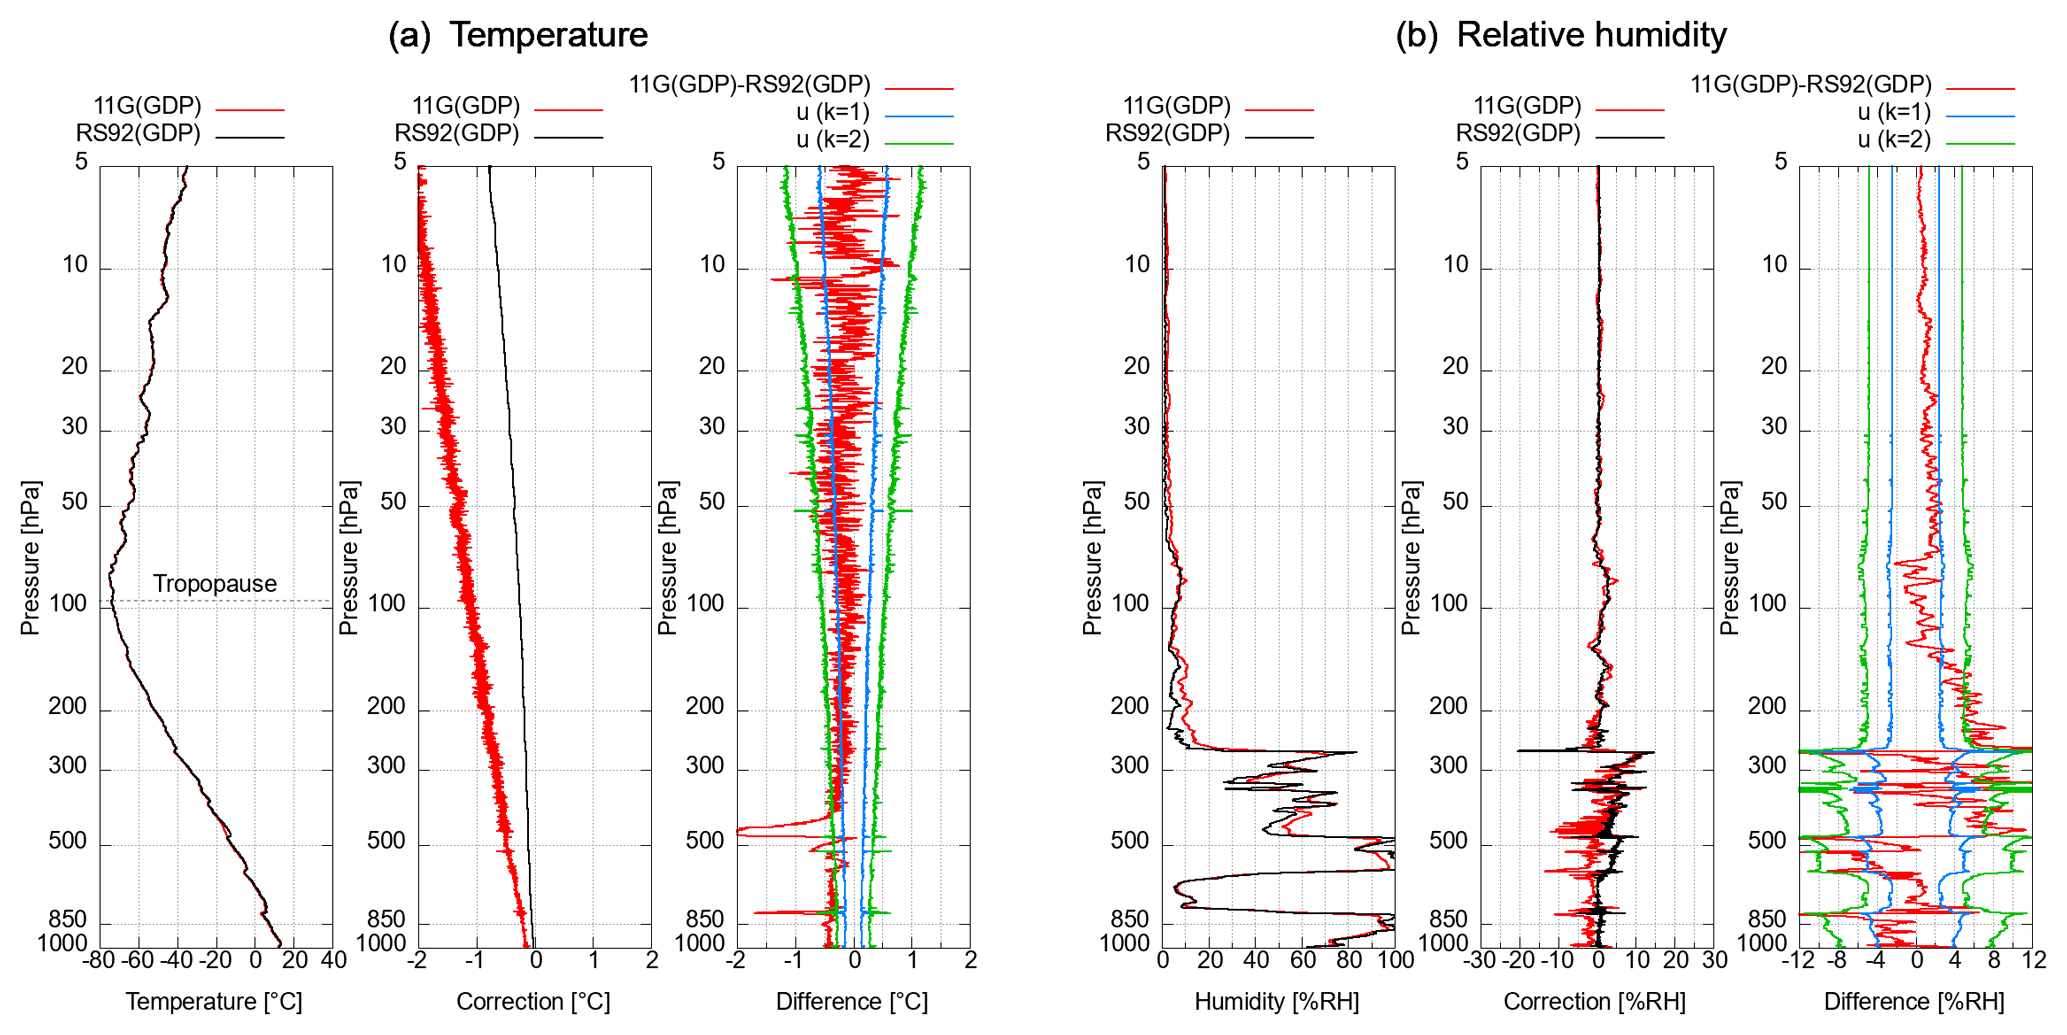
Figure 21Temperature (a) and RH (b) profiles from the dual flight launched at 08:32 (LST) on 28 October 2016. The panels on the left in (a) and (b) show temperature and RH profiles, respectively, from RS-11G GDP (red) and RS92 GDP (black). The middle panels show the total amount of correction. The panels on the right show differences (RS-11G GDP minus RS92 GDP) (red) and estimated uncertainties for k=1 in blue and k=2 in green. RH results for the stratosphere are not discussed here because measurement values for the stratosphere are considered to exceed the limit for reliable measurement.
Figure 21 shows temperature and RH profiles along with related uncertainties for a dual flight conducted at 00:00 UTC on 28 October 2016 as an example of a daytime flight. The radiosondes appear to pass through cloud layers around 850 and 500 hPa, at which a value of almost 100 % RH is observed. The RS-11G GDP temperature is lower than that of RS92 GDP at pressures >400 hPa, and the related difference is larger than the expanded uncertainty (with k=2). The temperature difference is notably larger than the uncertainty when the RH drops quickly (around 850 and 500 hPa). The temperature difference between 400 hPa and the tropopause is within the standard uncertainty (with k=1). For RH, the RS-11G GDP is larger than the RS92 GDP after the radiosondes pass through the layer in which humidity drops rapidly (around 500 and 250 hPa) where the RH difference is larger than the expanded uncertainty. When radiosondes leave clouds, temperature data and RH sensors may be affected by cooling as water or ice evaporates from the sensor surface, leading to errors in measurement. Additionally, the RH measurement may be affected by sensor hysteresis characteristics. The RS-11G GDP includes a noise filter that removes the influence of water or ice when radiosondes pass through clouds, and the RH sensor of RS92 has a heating function to prevent icing during flight. The RS-11G GDP appears to be affected by water droplets or ice more than the RS92 GDP in this case. The temperature difference in the stratosphere is also larger than that in the troposphere, probably due to errors in the treatment of solar radiation effects for both GDPs. However, the difference is within the expanded uncertainty, and the discrepancy is categorized as being in agreement. The RH of the RS-11G GDP in the stratosphere is a few percent RH larger than the RS92 GDP and within the standard uncertainty. However, the water vapor mixing ratios derived from the RH of the RS-11G GDP and the RS92 GDP in the lower stratosphere (between 70 and 60 hPa) in Fig. 21 are approximately 4.7 and 3.0 ppmv, respectively, and the difference between RS-11G GDP and RS92 GDP is around 1.7 ppmv, which is approximately half the RS92 GDP value. Hurst et al. (2016) reported that water vapor mixing ratios at 68 hPa in the northern middle latitudes are roughly 3.5–5.0 ppmv, and the mixing ratio discrepancy caused by differences in the measurement method (e.g., the difference between balloon-borne frost point hygrometers and Aura Microwave Limb Sounder) may be 0.3 ppmv. Hurst et al. (2016) also reported that rates for the stratospheric average trend of the mixing ratio from 2010 to mid-2015 ranged from 0.03 to 0.07 ppmv yr−1. The RH difference between RS-11G GDP and RS92 GDP in Fig. 21 is much larger than these index values, and the RH sensors of RS-11G and RS92 are deemed too unresponsive for stratospheric evaluation in this case. Accordingly, no discussion will be made here regarding RH measurement differences in the stratosphere based on the results shown in Fig. 21.
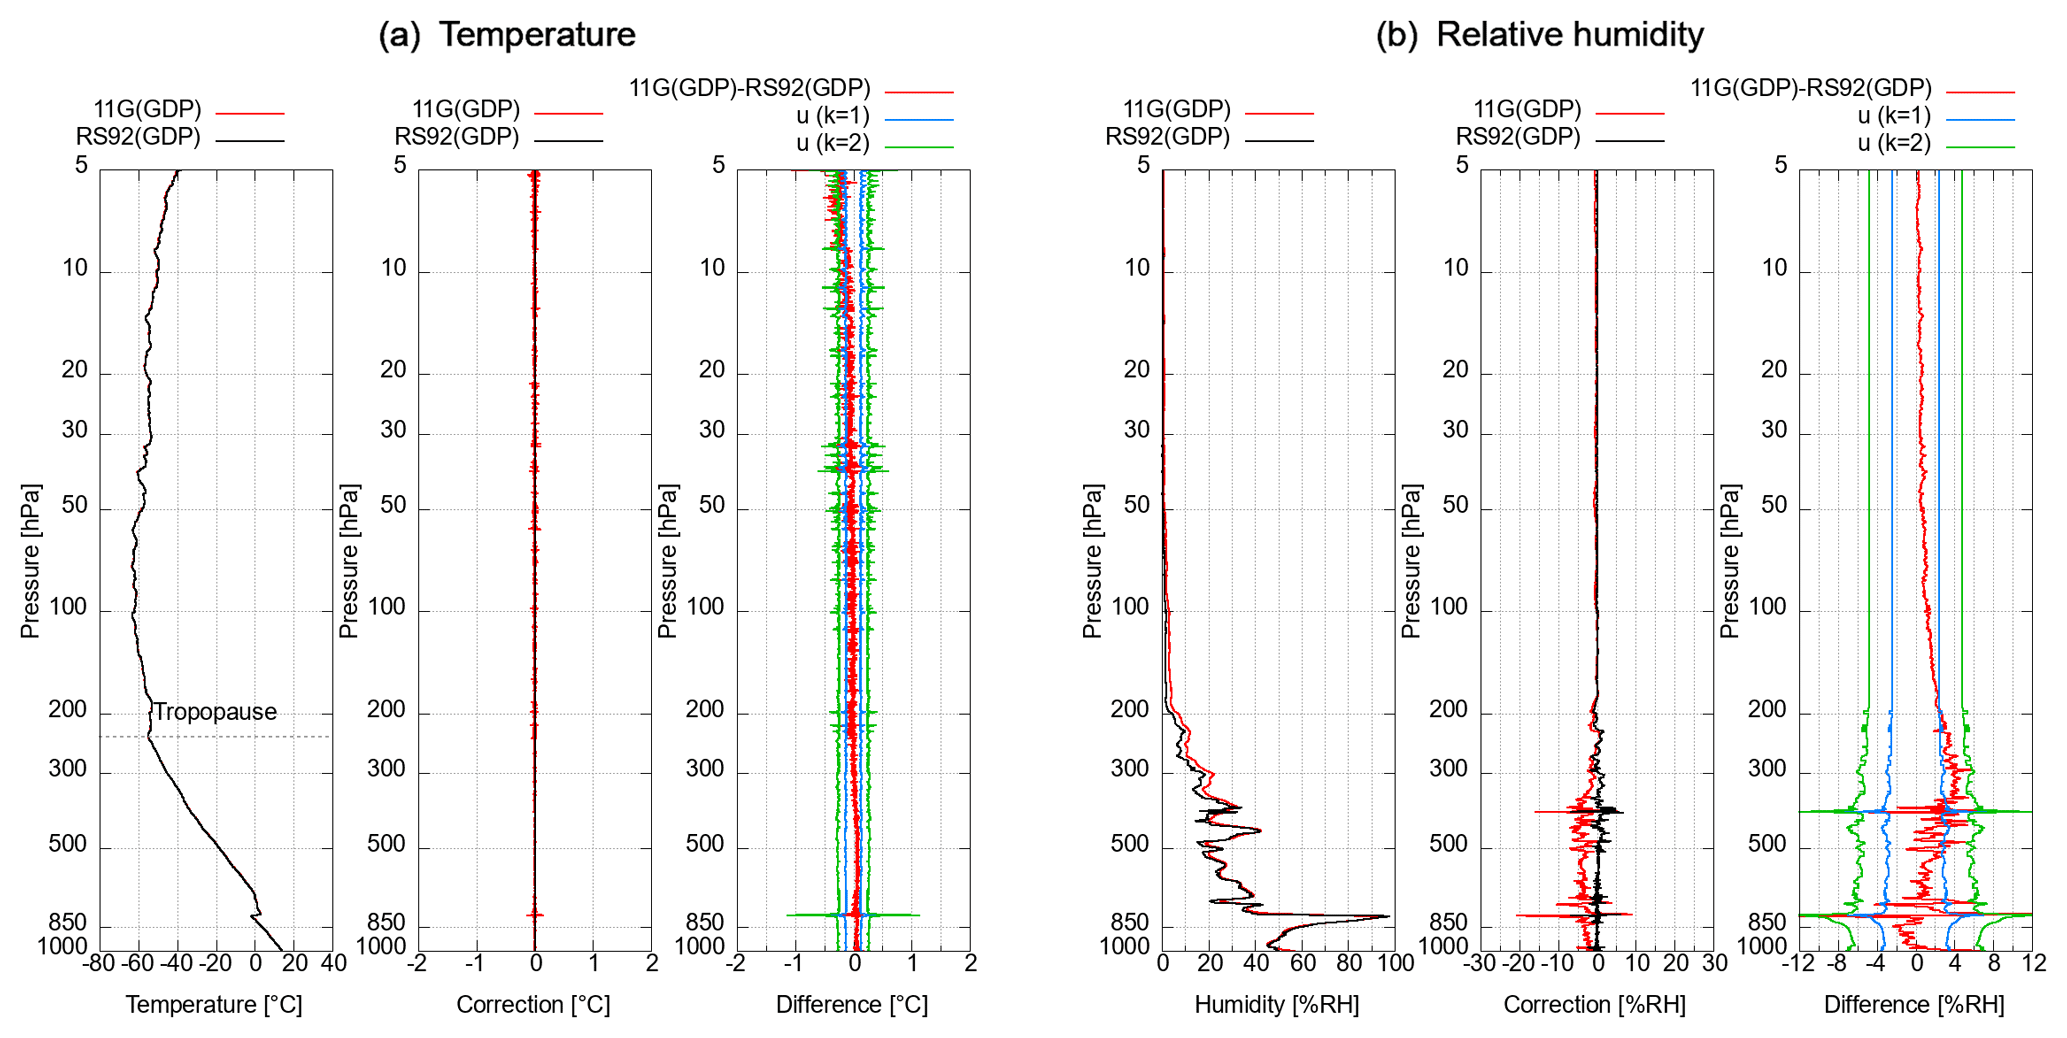
Figure 22 shows a nighttime situation with a launch at 12:00 UTC on 4 November 2016. In contrast to the daytime situation, in which temperature uncertainty increases with height due to solar radiation, nighttime temperature uncertainty does not depend on height and remains within the standard range at pressures >30 hPa. For RH, although RS-11G GDP is a few percent RH larger than RS92 GDP between 850 and 200 hPa at nighttime, the values correspond within the expanded uncertainty.
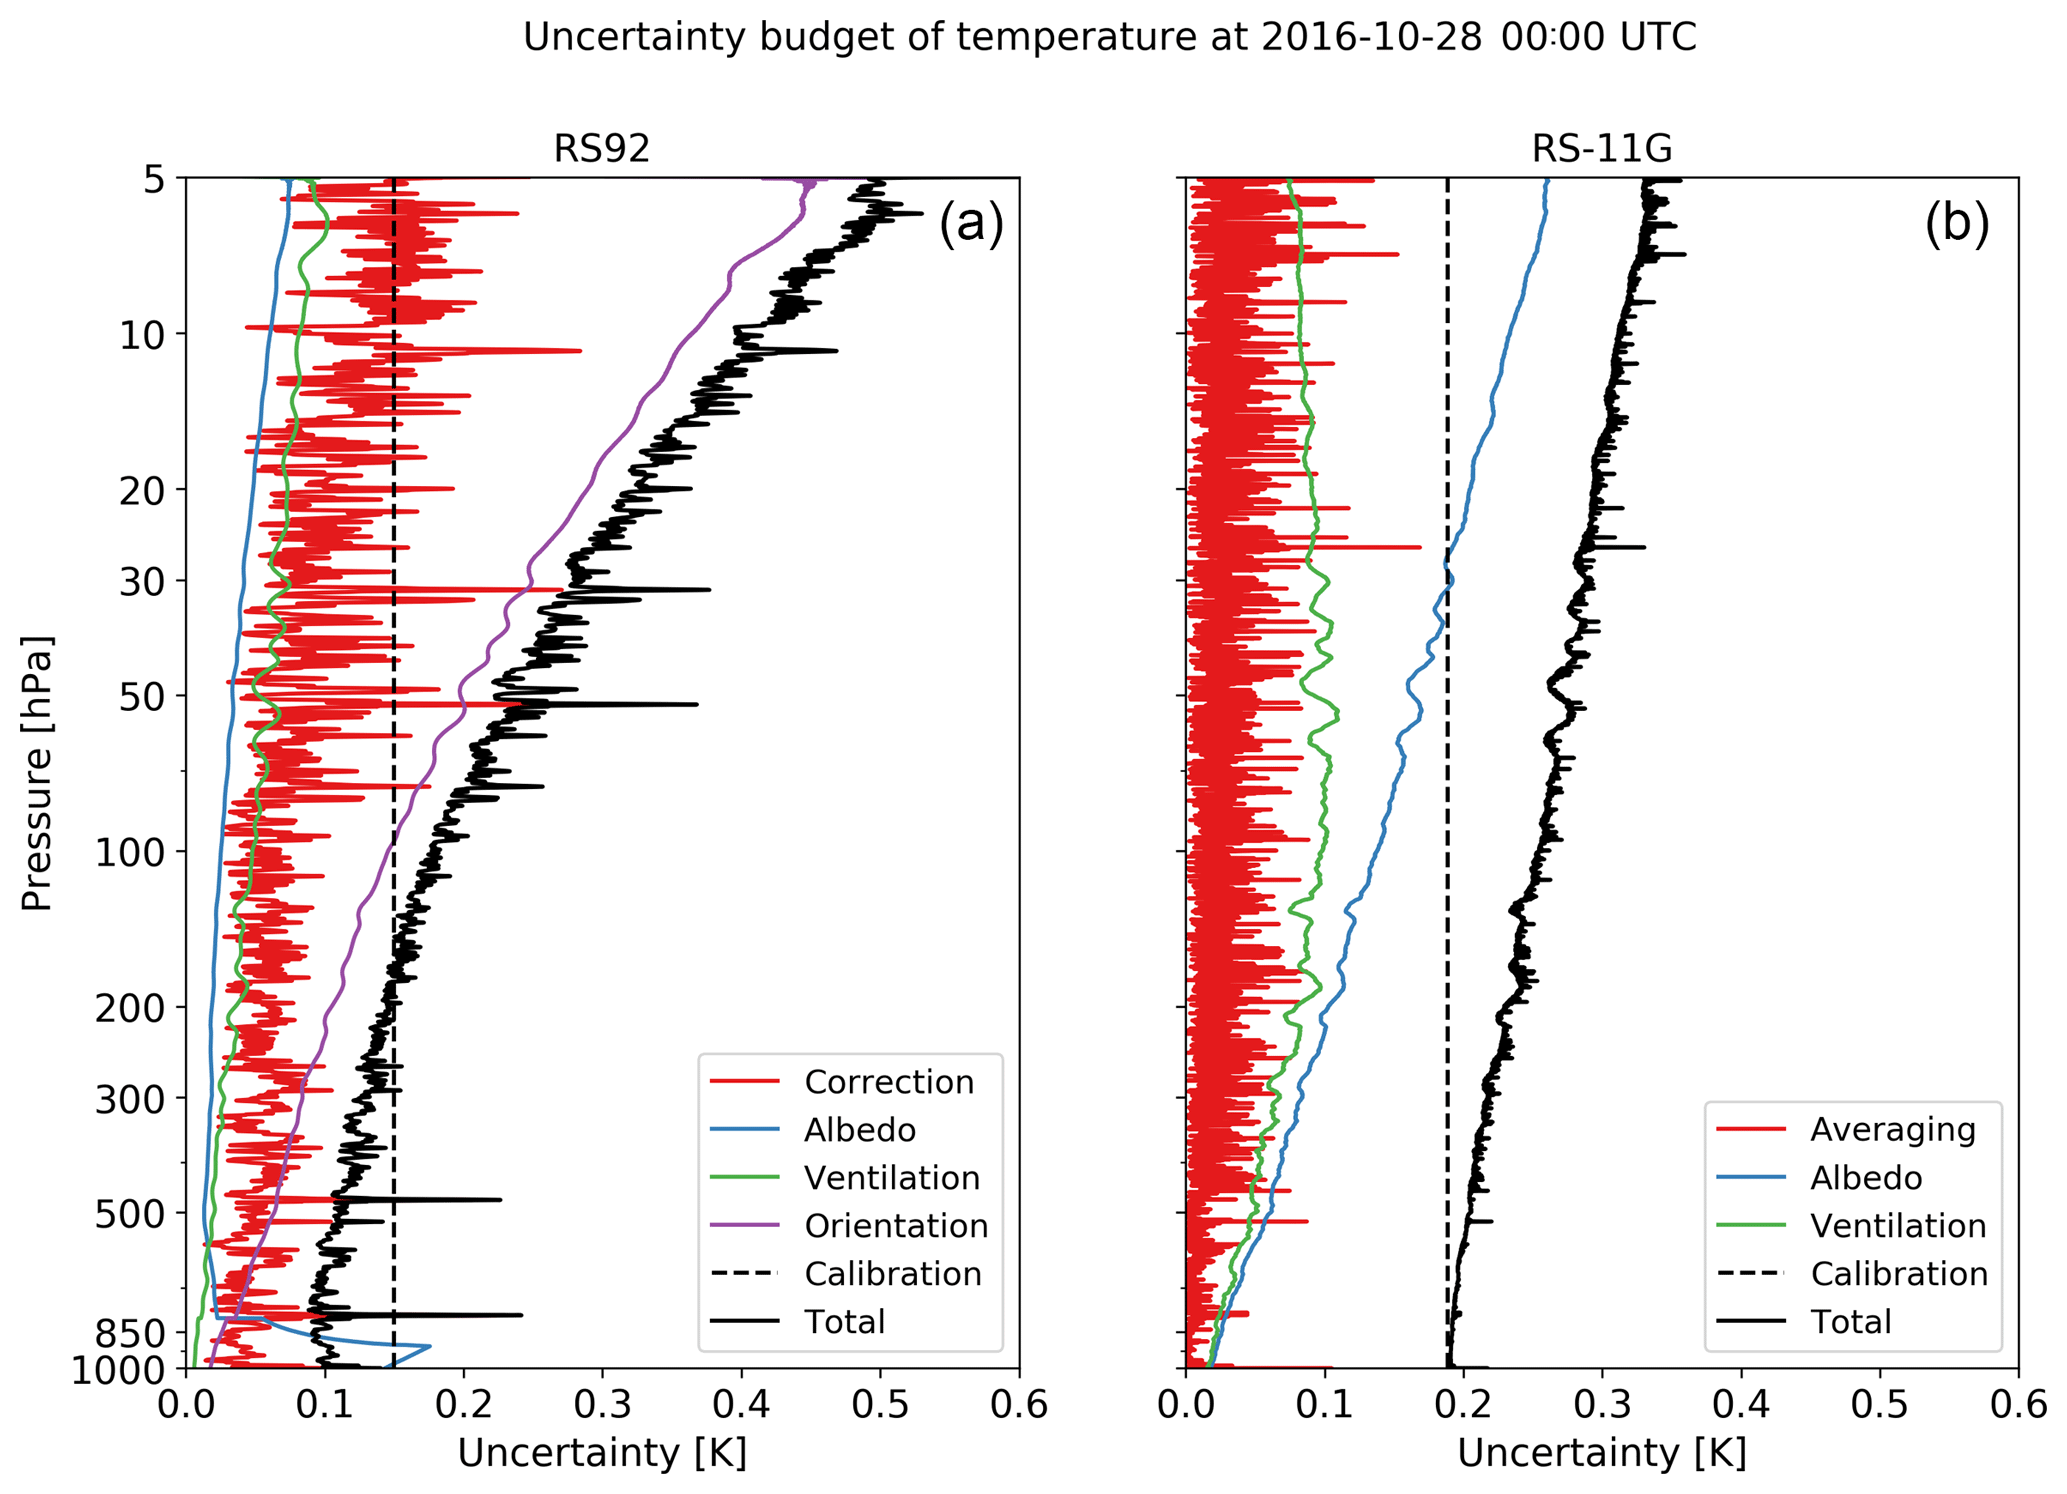
Figure 23Uncertainty budget for temperature measurements at 00:00 UTC (daytime) on 28 October 2016, for RS92 GDP (a) and RS-11G GDP (b).
5.3 Consistency of temperature measurements from RS-11G and RS92
Overall uncertainty in GDPs is estimated from all sources of uncertainty, and measurement results can be assessed using the quantified uncertainties of each source. The sources contributing to the RS-11G temperature uncertainty budget are listed in Table 6 (Kizu et al., 2018). Uncertainty associated with filtering (including moving averaging) is derived using
where ci represents the coefficients of filtering at time step i and N′ is the effective sample size. For the RS92 temperature, uncorrelated uncertainty is based on statistical uncertainty and determined via spike removal. Correlated uncertainty consists of the uncertainty associated with radiation correction and the calibration uncertainty of the temperature sensor (Dirksen et al., 2014; Sommer et al., 2016). The standard uncertainty of each source for observation at 00:00 UTC on 28 October 2016 is illustrated in Fig. 23. While sensor orientation derived from Table 2 in Dirksen et al. (2014) is the major source of uncertainty in RS92 temperature measurement, albedo is the major source for RS-11G because orientation is not explicitly considered in RS-11G GDPs. The JMA solar radiation correction model (JMA, 1995) assumes that the surface and cloud albedo is constant at 20 %. However, the actual albedo during the flight depends on surface and cloud conditions, and the correction amount is underestimated when highly reflective clouds are present (Kizu et al., 2018).
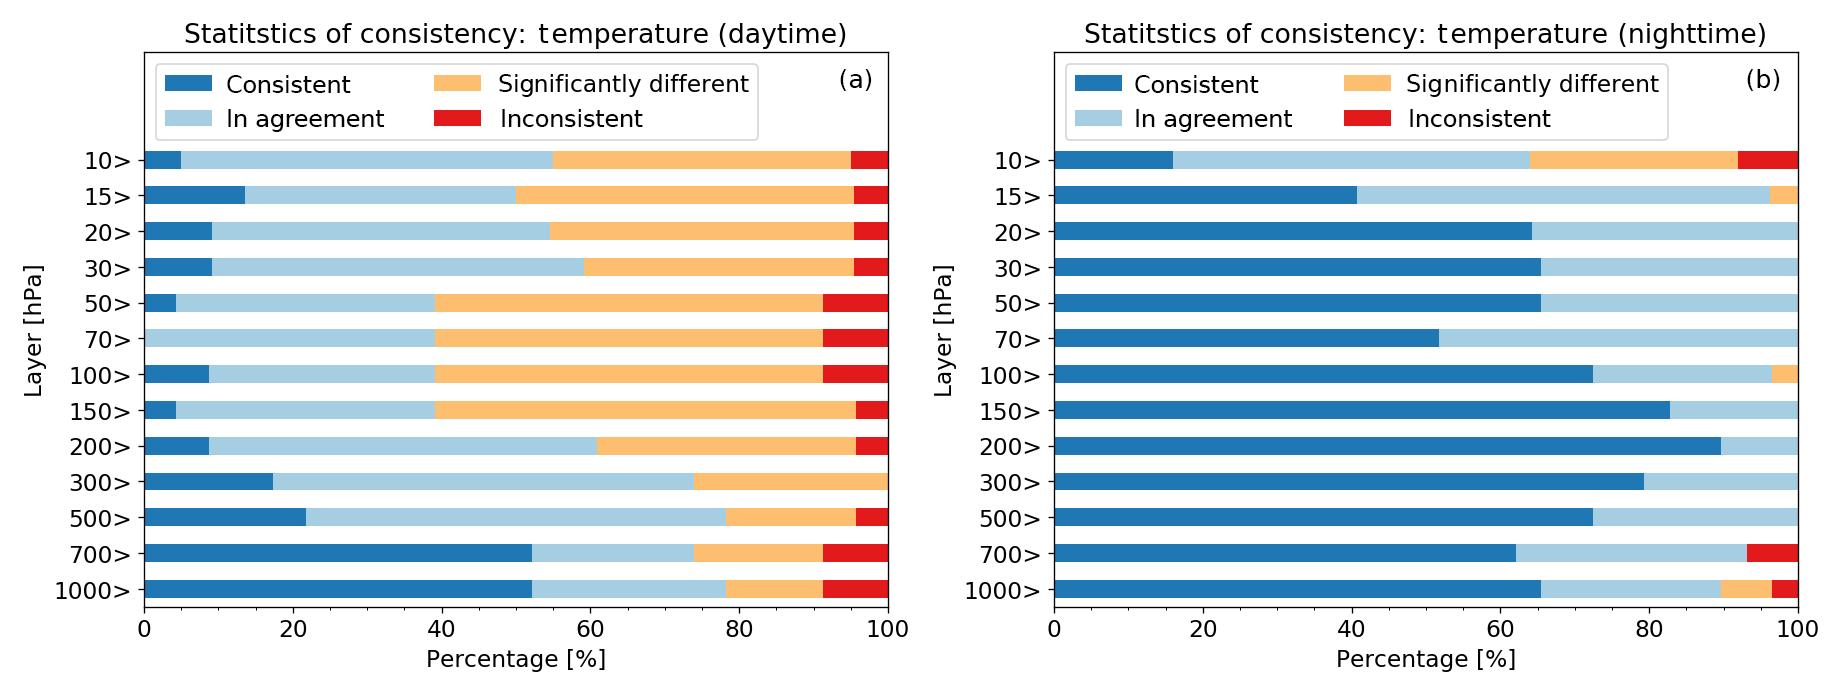
Figure 24Percentages of consistency ranks “consistent,” “in agreement,” “significantly different”, and “inconsistent” for temperature measurements between RS92 GDP and RS-11G GDP in each pressure layer for daytime (a) and nighttime (b) dual flights.

Figure 25Distribution of the temperature differences between RS-11G GDP and RS92 GDP for daytime observations (histogram in a, d, g, box plot in b, e, h, and quantile–quantile plot in c, f, i). Shown are the results for the pressure layers between 70 and 50 hPa (a–c), between 200 and 150 hPa (d–f), and between 500 and 300 hPa (g–i).
For statistical comparison, the percentages of consistency ranks (1, 2, 3, or 4) between RS92 GDP and RS-11G GDP in a particular pressure layer are calculated as follows:
-
Calculate the combined uncertainty uc for every data point with a 1 s resolution.
-
Define T11G, T92, and as temperature measurements from RS-11G GDP and RS92 GDP and the absolute value of the difference between RS-11G GDP and RS92 GDP at every data point, respectively. Rank d is then defined as 1 (d≤uc: consistent), 2 (: in agreement), 3 (: significantly different), and 4 (3uc<d: inconsistent).
-
Arrange the rank values in ascending order for the pressure layer; the 95 % value is assigned as the consistency rank of the layer for each flight.
The percentages of consistency ranking for all daytime and nighttime flights are illustrated in Fig. 24. While most measurements at pressures >10 hPa are consistent at nighttime, most are not consistent during the daytime for all layers. Such uncertainty estimates enable vertical evaluation of measurement uncertainty. Possible reasons for the fact that the percentages of “inconsistent” and “significantly different” categories are larger at pressures <150 hPa at daytime are as follows: the ensemble average difference is not zero, the distribution is not Gaussian, and the number of samples is small. We investigated the histogram of temperature difference. Figure 25 shows distribution of the temperature differences between RS-11G GDP and RS92 GDP for daytime observations. We found that it is normally distributed between 70 and 50 hPa and that the number of samples is large enough. Therefore, the temperature difference in the stratosphere at daytime is thought to be caused by unexpected systematic effects. Also, some samples showed large temperature differences (about −0.5 K) even in the troposphere, which is considered to be due to either some issues during the flights or possible calibration problems. Further work, including comparisons with high-performance temperature instruments and additional ground checks, are required. Also, RS92 GDP version 3 will be available in the near future (Ruud Dirksen, private communication, 2018; Sommer, 2016), and it would be useful to redo the analysis with the new RS92 GDP.
5.4 Consistency of RH measurements from RS-11G and RS92
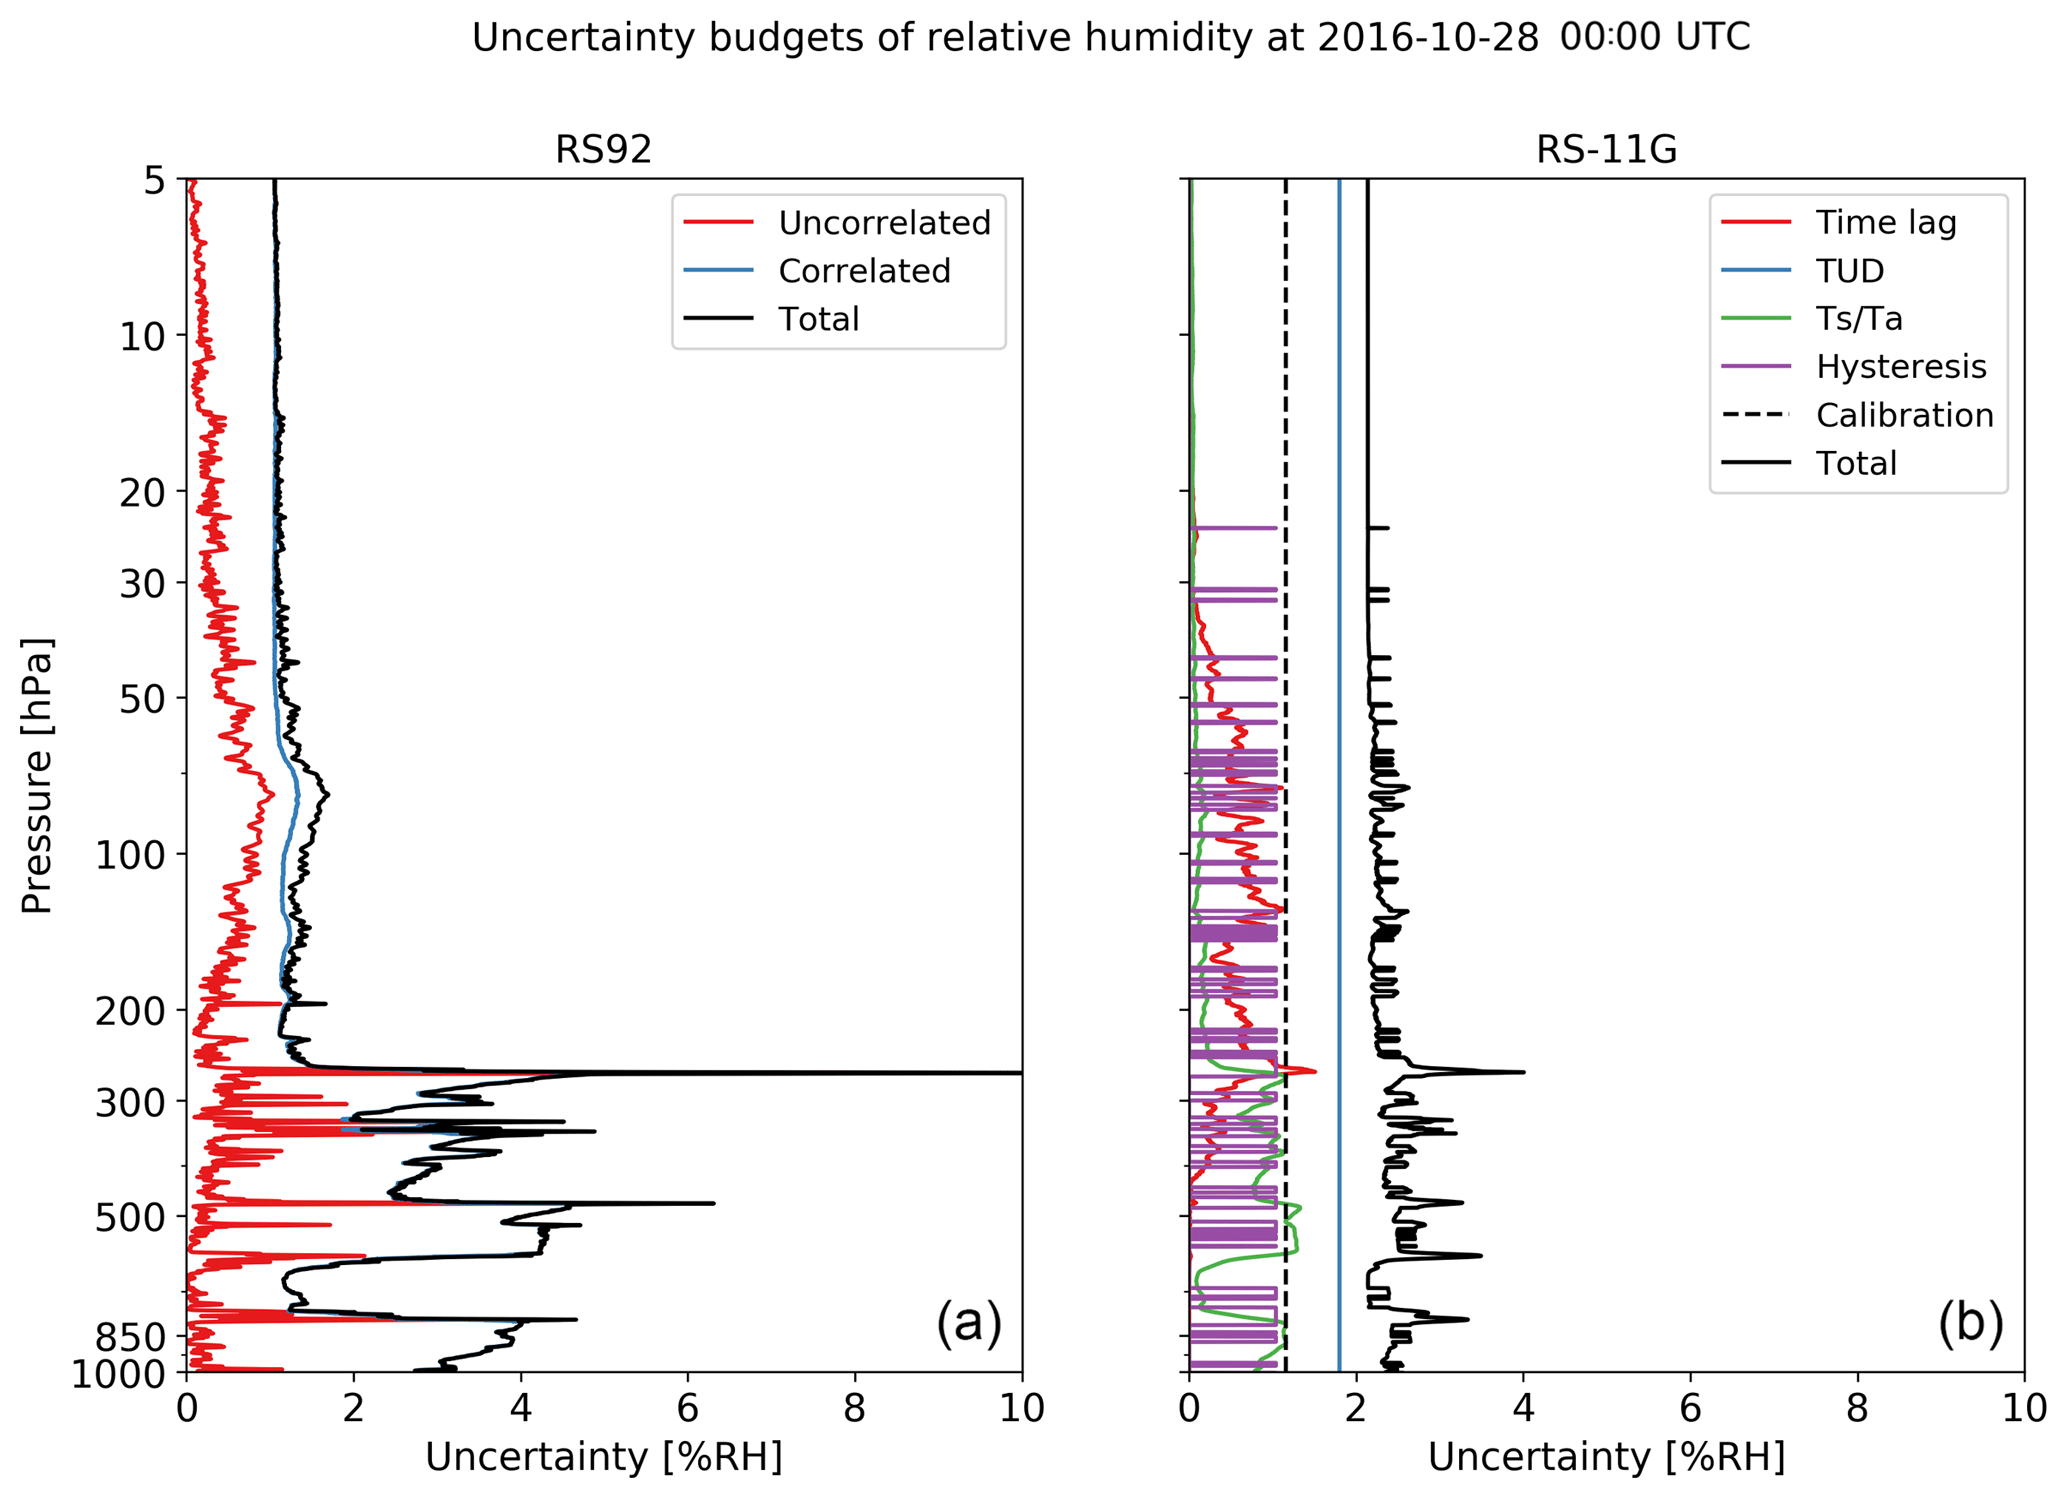
Sources contributing to the RS-11G RH uncertainty budget are listed in Table 7 (Kizu et al., 2018). The standard uncertainty of each source for observation at 00:00 UTC on 28 October 2016, is illustrated in Fig. 26. For RS92 RH, uncertainty consists of correction for calibration uncertainty and temperature-dependent calibration uncertainty, radiation dry bias, the time-lag constant, and the statistical uncertainty of time-lag correction (Dirksen et al., 2014). As the calculation method for each component with RS92 is not detailed in Dirksen et al. (2014), only uncorrelated and correlated uncertainties are illustrated for RS92. For RS-11G, the major source of uncertainty is temperature–humidity dependence correction for the whole layer. Statistical uncertainty and uncertainty from the sensor versus air temperature correction (green) are important in the lower and middle troposphere, and uncertainty from time-lag correction (red) is important near the tropopause.
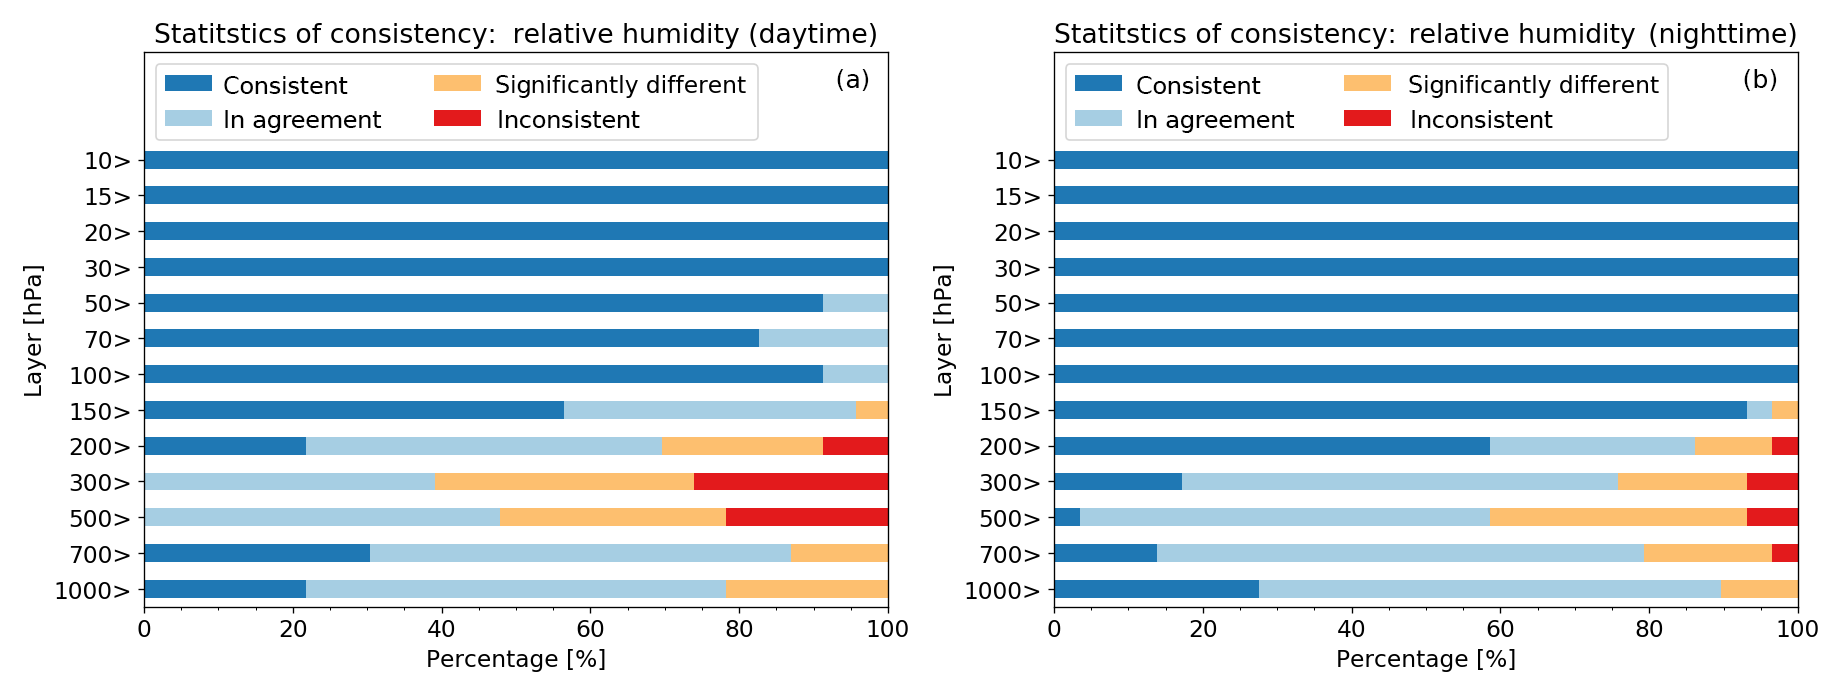
Figure 27As per Fig. 24, but for RH. RH results for the stratosphere are not discussed here because measurement values for the stratosphere are considered to exceed the limit for reliable measurement.
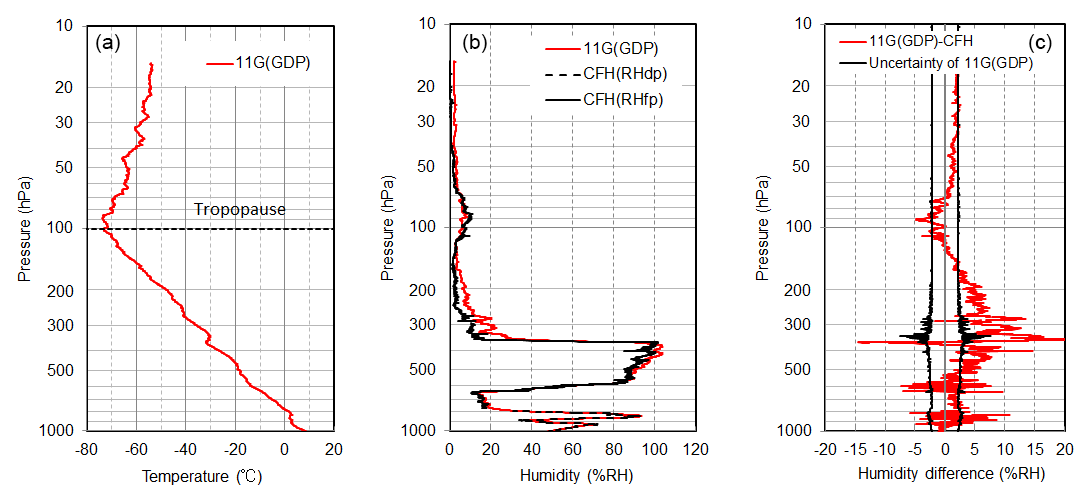
Figure 28Profiles of temperature and RH∕RH difference from an RS-11G and CFH comparison flight launched at 14:50 (LST) on 10 November 2016. Panel (a) shows temperature data from RS-11G GDP. Panel (b) shows the RH of RS-11G GDP (red), converted RH from CFH dew point temperature (black dashed line) below the height of the forced freezing point (Vömel et al., 2007), and converted RH from CFH frost point temperature (black thick line) above the height of the forced freezing point. Panel (c) shows RS-11G GDP minus CFH humidity difference (red) and the overall uncertainty of RS-11G GDP (black).
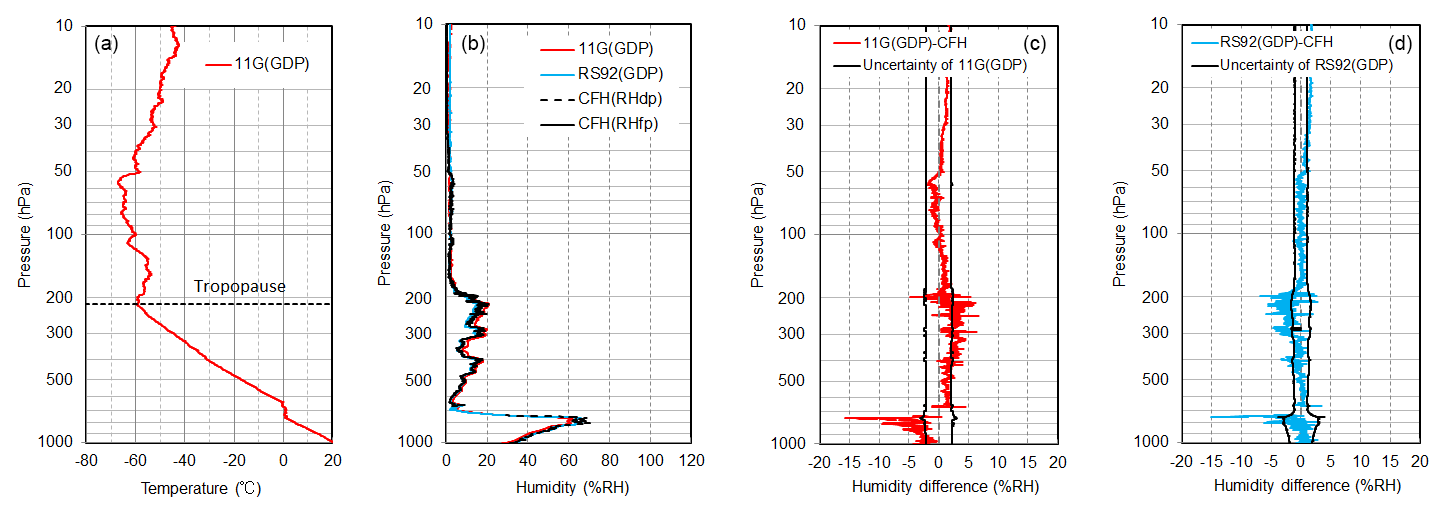
Figure 29Profiles of temperature and RH∕RH difference from an RS-11G, RS92, and CFH comparison flight launched at 14:50 (LST) on 20 April 2018. Panel (a) shows temperature data from RS-11G GDP. Panel (b) shows RH of RS-11G GDP (red), RS92 (light blue), converted RH from CFH dew point temperature (dashed black line) below the height of the forced freezing point, and converted RH from CFH frost point temperature (thick black line) above the height of the forced freezing point. Panel (c) shows RH differences for RS-11G GDP (red) from CFH and the overall uncertainties of RS-11G GDP (black). Panel (d) shows RH differences for RS92 GDP (light blue) from CFH and the overall uncertainties of RS92 GDP (black).
The percentages of consistency ranking (calculated as for temperature) are illustrated in Fig. 27. In the middle troposphere (between 500 and 200 hPa), half of RS92 GDP and RS-11G GDP values are significantly different or inconsistent. There are some samples with large RH differences (more than 10 % RH), which is considered to be either due to evaporative cooling effects or related to the sensor hysteresis characteristics as mentioned in Sect. 5.2. In addition, we noted that the humidity sensor of RS-11G has a dry bias in the lower troposphere and a wet bias in the upper troposphere when compared to chilled-mirror hygrometer measurements (see Sect. 6). In the future, we will try to improve the RS-11G RH GDP when more intercomparison data with chilled-mirror hygrometers become available. In the stratosphere, RS92 GDP and RS-11G GDP are always consistent. However, as discussed in Sect. 5.2, RH values in the stratosphere range across a few percent RH, and the RH sensors of RS92 and RS-11G are considered unresponsive in relation to conditions in the troposphere. Although the availability of measurement values from the stratosphere depends on use and related accuracy requirements (Miloshevich et al., 2009), the consistency of RH measurements from the stratosphere is not discussed here.
At Tateno, radiosonde and cryogenic frost point hygrometer (CFH, Vömel et al., 2007, 2016) comparison flights have been conducted twice a year since 2015. Figure 28 shows the results of a RS-11G and CFH comparison flight conducted on 10 November 2016. This CFH is interfaced with RS-11G, and RH calculation for CFH involves the use of temperature values from RS-11G GDP. Figure 28 shows RH profiles from RS-11G GDP and CFH. The RH of the RS-11G GDP is around 7 % RH greater than that of CFH between 500 and 200 hPa, and around 1 % RH greater at pressures >500 hPa. The difference is also more than 10 % RH around 350 hPa, where RH drops rapidly and the difference is larger than the overall uncertainty. This significant difference is influenced by water or ice on the sensor and related hysteresis characteristics. The tropopause is recorded at 100.5 hPa with temperatures lower than −70∘C, and the RH difference is somewhat large, RS-11G GDP being a few percent smaller than CFH. In low-temperature conditions (Fig. 26), sensor time lag and RS-11G RH sensor temperature dependence may be important factors in the humidity difference. Figure 29 shows results from a RS-11G, RS92, and CFH comparison flight conducted on 20 April 2018. The RH of the RS-11G GDP is around 4 % RH smaller than that of CFH at pressure >700 hPa, while that of the RS92 GDP is largely in agreement with the RH of CFH. Meanwhile, the RH of the RS-11G GDP is 2 % RH greater than that of CFH between 400 and 200 hPa, while the RH of the RS92 GDP is 2 % RH smaller than that of CFH. These comparisons confirm that the RS-11G GDP has a wet bias between 400 and 200 hPa, as was also common in the results shown in Fig. 11. We ascribed this to RS-11G RH sensor time lag and sensor temperature dependence in low-temperature conditions.
To help characterize the GDPs of RS-11G and RS92, data collected on dual flights conducted from Tateno between April 2015 and June 2017 were analyzed in this study. The RS-11G GDP temperature was around −0.4 K lower than RS92 GDP data in daytime measurement in the stratosphere, while nighttime measurements generally agree well. The RS-11G GDP RH was 2 % RH smaller than the RS92 GDP for 90 % RH–100 % RH, and the RS-11G GDP was around 5 % RH larger than the RS92 GDP at values lower than 50 % RH. The effects of SHC correction were also verified, with samples featuring highly humid conditions showing improved results for RS-11G data. The pressure difference was 0.5 hPa in the troposphere, and the geopotential height difference was around 10–20 m in the stratosphere. We compared the GDPs using a general statistical approach based on 13 allocated pressure layers, but an analysis using the functional regression approach (e.g., Fassò et al., 2014) might be applied in the future as well.
The consistency of temperature and RH measurements from RS-11G and RS92 with uncertainties was also analyzed. The major sources of uncertainty in temperature measurements for RS-11G and RS92 GDPs were albedo and sensor orientation, respectively. Statistical comparison showed that most daytime temperature measurements were not consistent for any pressure layer. For RH measurements, the major source of uncertainty for the RS-11G GDP was temperature–humidity dependence correction for the whole layer, and half of RS92 and RS-11G GDP values were significantly different or inconsistent in the middle troposphere.
RS-11G GDP RH data were also evaluated based on comparison with CFH data, with results showing a wet bias in the former from CFH values between 400 and 200 hPa. The same characteristic was also observed in comparison with RS92 GDP data. The RH sensor time lag and sensor temperature dependence in low-temperature conditions may be main factors in this wet bias. The extent of CFH measurements to date remains limited, but plans are being made to conduct temperature and humidity measurement using high-quality radiosondes twice a year along with continuous comparison flights of a high-quality radiosonde and a routine radiosonde to facilitate GDP evaluation and further analysis of RS-11G characteristics.
This study involved evaluation of the characteristics of RS-11G GDP values with RS92 GDP as base data due to the latter's GRUAN radiosonde certification. The GRUAN certification process for RS-11G is underway, and ongoing analysis of GDP data is considered important for the provision of high-quality products to the user community.
The GRUAN data products for RS92-GDP.2 are available from https://doi.org/10.5676/GRUAN/RS92-GDP.2 (Sommer et al., 2012). The GRUAN data products for RS-11G.1 are available from https://doi.org/10.5676/GRUAN/RS-11G-GDP.1 (Kizu et al., 2019).
The supplement related to this article is available online at: https://doi.org/10.5194/amt-12-3039-2019-supplement.
SH, TS, KS, and EK developed the RS-11G GRUAN data product. EK and SH performed the data analysis and created the figures. All authors provided further ideas and contributed to the interpretation of the results. The first draft of the paper was written by EK and SH. All authors contributed to improvement of the paper.
The authors declare that they have no conflict of interest.
The authors are grateful to the Aerological Observatory, the Observation Division of JMA's Observation Department and Meisei Electric for their support and helpful advice. Thanks are also due to GRUAN staff for their support.
This paper was edited by Roeland Van Malderen and reviewed by two anonymous referees.
Aerological Division of JMA: Comparisons of the RS2-80 type Rawinsonde with the RSII-56 Type One, Sokkou-jihou, 50, 373–384, 1983 (in Japanese).
Bodeker, G. E., Bojinski, S., Cimini, D., Dirksen, R. J., Haeffelin, M., Hannigan, J. W., Hurst, D. F., Leblanc, T., Madonna, F., Maturilli, M., Mikalsen, A. C., Philipona, R., Reale, T., Seidel, D. J., Tan, D. G. H., Thorne, P. W., Vömel, H., and Wang, J.: Reference Upper-Air Observations for Climate: From Concept to Reality, B. Am. Meteorol. Soc., 97, 123–135, https://doi.org/10.1175/bams-d-14-00072.1, 2016.
Dirksen, R. J., Sommer, M., Immler, F. J., Hurst, D. F., Kivi, R., and Vömel, H.: Reference quality upper-air measurements: GRUAN data processing for the Vaisala RS92 radiosonde, Atmos. Meas. Tech., 7, 4463–4490, https://doi.org/10.5194/amt-7-4463-2014, 2014.
Fassò, A., Ignaccolo, R., Madonna, F., Demoz, B. B., and Franco-Villoria, M.: Statistical modelling of collocation uncertainty in atmospheric thermodynamic profiles, Atmos. Meas. Tech., 7, 1803–1816, https://doi.org/10.5194/amt-7-1803-2014, 2014.
GCOS-134: GRUAN Implementation Plan 2009-2013.WMO/TD No.1506, World Meteorological Organization (WMO), Geneva, Switzerland, 2009.
GCOS-170: The GCOS Reference Upper-Air Network (GRUAN) MANUAL, Technical Report No.2013-02, World Meteorological Organization (WMO), Geneva, Switzerland, 2013.
Hurst, D. F., Read, W. G., Vömel, H., Selkirk, H. B., Rosenlof, K. H., Davis, S. M., Hall, E. G., Jordan, A. F., and Oltmans, S. J.: Recent divergences in stratospheric water vapor measurements by frost point hygrometers and the Aura Microwave Limb Sounder, Atmos. Meas. Tech., 9, 4447–4457, https://doi.org/10.5194/amt-9-4447-2016, 2016.
Hyland, R. and Wexler, A.: Formulations for the thermodynamic properties of the saturated phases of H2O from 173.15 K to 473.15 K, ASHRAE Trans., 89, 500–519, 1983.
Immler, F. J., Dykema, J., Gardiner, T., Whiteman, D. N., Thorne, P. W., and Vömel, H.: Reference Quality Upper-Air Measurements: guidance for developing GRUAN data products, Atmos. Meas. Tech., 3, 1217–1231, https://doi.org/10.5194/amt-3-1217-2010, 2010.
JMA: Guidelines of radiosonde soundings, Technical report, Japan Meteorological Agency, Tokyo, Japan, 1995 (in Japanese).
Kizu, N., Sugidachi, T., Kobayashi, E., Hoshino, S., Shimizu, K., Maeda, R., and Fujiwara, M.: Technical characteristics and GRUAN data processing for the Meisei RS-11G and iMS-100 radiosondes (GRUAN-TD-5), GRUAN Lead Centre, Lindenberg, Germany, 2018.
Kizu, N., Sugidachi, T., Kobayashi, E., Hoshino, S., Shimizu, K., Maeda, R., and Fujiwara, M.: RS-11G GRUAN Data Product Version 1 (RS-11G-GDP.1), Tateno Aerological Observatory (JMA), https://doi.org/10.5676/GRUAN/RS-11G-GDP.1, 2019.
Kobayashi, E.: Quantitative comparison of the Meisei RS-11G radiosonde and the Vaisala RS92-SGP radiosonde for characterization of routine soundings, J. of the Aerological Observatory, 73, 11–24, 2015 (in Japanese).
Kobayashi, E., Noto, Y., Wakino, S., Yoshii, H., Ohyoshi, T., Saito, S., and Baba, Y.: Comparison of Meisei RS2-91 Rawinsondes and Vaisala RS92-SGP Radiosondes at Tateno for the Data Continuity for Climatic Data Analysis, J. Meteor. Soc. Jpn., 90, 923–945, 2012.
Meisei Electric Co., Ltd.: GPS Radiosonde RS-11G, available at: http://www.meisei.co.jp/english/products/RS-11G_E.pdf (last access: 4 June 2018), 2016.
Miloshevich, L. M., Vömel, H., Whiteman, D. N., and Leblanc, T.: Accuracy assessment and correction of Vaisala RS92 radiosonde water vapor measurements, J. Geophys. Res., 114, D11305, https://doi.org/10.1029/2008JD011565, 2009.
Nash, J., Oakley, T., Vömel, H., and Wei, L.: WMO Intercomparison of High Quality Radiosonde Systems Yangjiang, China, 12 July–3 August 2010, WMO/TD-No.1580, Instruments And Observing Methods Report No.107, Geneva, Switzerland, 2011.
Rohden, C., Sommer, M., and Dirksen, R.: Rigging Recommendations For Dual Radiosonde Soundings (GRUAN-TD-7), GRUAN Lead Centre, Lindenberg, Germany, 2016.
Sakoda, Y., Naganuma, K., Ogihara, H., Inoue, N., and Mita, A.: RS-91 Rawinsonde, Meteorological Research Note, 194, 3–24, 1999 (in Japanese).
Seidel, D. J., Berger, F. H., Immler, F., Sommer, M., Vömel, H., Diamond, H. J., Dykema, J., Goodrich, D., Murray, W., Peterson, T., Sisterson, D., Thorne, P., and Wang, J.: Reference Upper-Air Observations for Climate: Rationale, Progress, and Plans, B. Am. Meteorol. Soc., 90, 361–369, https://doi.org/10.1175/2008BAMS2540.1, 2009.
Shimizu, K. and Hasebe, F.: Fast-response high-resolution temperature sonde aimed at contamination-free profile observations, Atmos. Meas. Tech., 3, 1673–1681, https://doi.org/10.5194/amt-3-1673-2010, 2010.
Sommer, M.: New GRUAN data processor for radiosonde measurements – status of RS92 (v3) and RS41 (alpha) data products. GRUAN ICM-8, available at: https://www.gruan.org/gruan/editor/documents/meetings/icm-8/pres/pres_0606_ICM-8_Sommer_GDPS-RS92_v4.pdf (last access: 13 February 2019), 2016.
Sommer, M., Dirksen, R., and Immler, F.: RS92 GRUAN Data Product Version 2 (RS92-GDP.2), GRUAN Lead Centre, https://doi.org/10.5676/GRUAN/RS92-GDP.2, 2012.
Sommer, M., Dirksen, R., and Rohden, C.: Brief Description of the RS92 GRUAN Data Product (GRUAN-TD-4), GRUAN Lead Centre, Lindenberg, Germany, 2016.
Vaisala Oyj: Vaisala Radiosonde RS92-SGP, available at: https://www.vaisala.com/sites/default/files/documents/RS92SGP-Datasheet-B210358EN-F-LOW.pdf (last access: 4 June 2018), 2013.
Vömel, H., David, D. E., and Smith, K.: Accuracy of tropospheric and stratospheric water vapor measurements by the cryogenic frost point hygrometer: Instrumental details and observations, J. Geophys. Res., 112, D08305, https://doi.org/10.1029/2006JD007224, 2007.
Vömel, H., Naebert, T., Dirksen, R., and Sommer, M.: An update on the uncertainties of water vapor measurements using cryogenic frost point hygrometers, Atmos. Meas. Tech., 9, 3755–3768, https://doi.org/10.5194/amt-9-3755-2016, 2016.