the Creative Commons Attribution 4.0 License.
the Creative Commons Attribution 4.0 License.
 | 12 Jun 2019
Simultaneous detection of C2H6, CH4, and δ13C-CH4 using optical feedback cavity-enhanced absorption spectroscopy in the mid-infrared region: towards application for dissolved gas measurements
Loic Lechevallier
Erik Kerstel
Daniele Romanini
Jérôme Chappellaz
Simultaneous measurement of C2H6 and CH4 concentrations, and of the δ13C-CH4 isotope ratio is demonstrated using a cavity-enhanced absorption spectroscopy technique in the mid-IR region. The spectrometer is compact and has been designed for field operation. It relies on optical-feedback-assisted injection of 3.3 µm radiation from an interband cascade laser (ICL) into a V-shaped high-finesse optical cavity. A minimum absorption coefficient of cm−1 is obtained in a single scan (0.1 s) over 0.7 cm−1. Precisions of 3 ppbv, 11 ppbv, and 0.08 ‰ for C2H6, CH4, and δ13C-CH4, respectively, are achieved after 400 s of integration time. Laboratory calibrations and tests of performance are reported here. They show the potential for the spectrometer to be embedded in a sensor probe for in situ measurements in ocean waters, which could have important applications for the understanding of the source and fate of hydrocarbons from the seabed and in the water column.
- Article
(4969 KB) - Full-text XML
- BibTeX
- EndNote


Methane (CH4) is the second most abundant anthropogenic greenhouse gas after carbon dioxide (CO2), but with a 25 times higher global warming potential. Monitoring and identifying the different sources of CH4 is therefore important, for the future climate projections. Among these sources, one can distinguish biogenic and abiogenic processes. Methane is mostly produced through biological processes, with the decomposition of organic matter under anoxic conditions. The abiogenic processes include biomass burning and thermal breakdown of organic molecules at high temperature in deep reservoirs. CH4 is the main component of natural gas, but heavier hydrocarbons (HCs) can also be present in natural gas such as ethane (C2H6) and propane (C3H8), depending on the gas origin. In addition the carbon isotopic composition of methane (δ13C-CH4 hereafter) differs between biogenic and abiogenic sources. While biogenic gas has a high concentration of CH4 with respect to heavier HCs and a more negative δ13C-CH4 (typically from −60 ‰ to −90 ‰), thermogenic gas is characterized by a lower ratio of CH4∕C2H6 and a less negative δ13C-CH4 signature (−50 ‰ to −40 ‰). The combination of these two measurements leads to a quite unambiguous identification of the origin of natural gas (Claypool and Kvenvolden, 1983). A significant part of Earth's HC reservoirs lies in marine environments, at variable depth below the seafloor. Questions arise about their origin and fate, and notably about their contribution through leakage into the ocean. Such leakage contributes to the carbon balance of the oceans, to acidification after oxidation in the water column, and possibly to the atmospheric concentration of these HCs if gas flaring from the seabed reaches the ocean surface. Therefore it is important to document the origin and fate of methane and ethane present below the seabed and dissolved in the water column, for process understanding and for future climate and ocean acidity projections.
Standard techniques for dissolved gas measurements usually rely on discrete sampling of the water column using Niskin bottles, followed by laboratory analysis. This method has the advantage of being simple and easy to set up, but it suffers from possible artifacts of the measurements due to outgassing of sample during the ascent (particularly for deep water samples). In addition, it offers a limited spatial and temporal resolution for probing the variability and mixing of water masses. Thanks to significant efforts in miniaturization of analytical instruments, from mass spectrometers (MSs) to optical techniques, in situ measurements of dissolved gas composition are feasible today (Chua et al., 2016; Grilli et al., 2018; Wankel et al., 2013). Due to the complexity and size of isotopic ratio mass spectrometers (IRMSs), today the application of in situ MS is limited to the measurement of the abundance of dissolved gas species, while the isotopic analysis is most often still performed in the laboratory. Conversely, modern optical spectrometers can offer similar performance for determining isotopic abundance as MSs, while being more compact and easier to use for in situ operations. Cavity-based techniques such as cavity ring-down spectroscopy (CRDS) and cavity-enhanced absorption spectroscopy (CEAS) offer detection of a variety of species, multispecies detection, and access to the isotopic signature of small compounds in gas mixtures (Kerstel, 2004).
The optical feedback cavity-enhanced absorption spectroscopy (OFCEAS) (Morville et al., 2003, 2014) used in this work is a well-known technique belonging to the family of CEAS and widely employed in trace gas detection and related fields (Butler et al., 2009; Grilli et al., 2014; Landsberg, 2014; Lechevallier et al., 2018; Richard et al., 2018; Romanini et al., 2006). It relies on the optical locking of the laser emission to a resonance mode of a high-finesse optical cavity and it has already been demonstrated for distributed feedback (DFB) lasers, quantum cascade lasers (QCLs) (Gorrotxategi-Carbajo et al., 2013; Maisons et al., 2010), and interband cascade lasers (ICLs) (Manfred et al., 2015; Richard et al., 2016). In this work we report a novel application for the simultaneous measurement of C2H6, CH4, and δ13C-CH4, using an ICL radiation source in the mid-IR region that could be applied to the in situ measurement of these compounds in seawater.
The OFCEAS spectrometer (Fig. 1) is composed of an ICL diode laser (from Nanoplus GmbH), an infrared polarizer (ColorPol MIR), two aluminum steering mirrors, and two photodiodes (PCI-2TE-4), all mounted on a stainless-steel optical cavity block. The V-shaped cavity (6 mm internal channel diameter) is composed of two 40 cm long arms, resulting in a free spectral range (FSR) of the optical cavity of 187.4 MHz. The cavity mirrors (Lohnstar Optics) have a reflectivity of 99.9584 %, which provides a ring-down time (lifetime of the photons inside the resonator) of 3.20 µs (∼1 km optical path length) in absence of intracavity absorption (i.e., if the cavity is filled with zero air). This design allows for feeding back to the laser only the photons that are in resonance with the cavity, without any parasitic feedback, such as that from reflections off the entrance mirror. This modifies the laser dynamics, leading to spectral narrowing of the laser emission and forcing its oscillation to match the cavity resonance frequency (Morville et al., 2005). The optical feedback phase matching condition imposes that the laser is placed at a distance from the input mirror equal to an integer number of cavity-arm lengths (in this case equal to one). Fine phase adjustment and continuous phase lock are obtained by a piezoelectric transducer (PZT) mounted on one of the two injection steering mirrors. The phase error was retrieved by analyzing the symmetry of the cavity modes during the acquisition, as explained in Morville et al. (2005). The diode laser is stabilized in temperature and a current ramp is applied in order to produce a scan over a narrow frequency region (typically a few tenths of a nanometer, with a scanning rate of ∼0.2 nm × mA−1 for ICL lasers) and to temporarily lock the laser emission to successive TEM00 longitudinal cavity transmission modes. The interest of the technique is to achieve high signal-to-noise ratio thanks to the narrowing of the laser emission and therefore to a more efficient power coupling to the high-finesse cavity. It also provides an intrinsically linear frequency scale fixed by the cavity geometry (FSR ), where c is the speed of light, L the cavity arm length, N the number of arms, and n the index of the media. The instrument simultaneously records the signal from the two photodiodes (before and after injection) in order to obtain transmission spectra that are subsequently converted to absorption units (absorption coefficients as a function of cavity transmission frequency or wavelength) using a measurement of the ring-down time performed at the end of each scan (Morville et al., 2014). This ring-down event is produced by rapidly switching off the laser emission and acquiring the exponential decay of the light leaking out of the cavity.
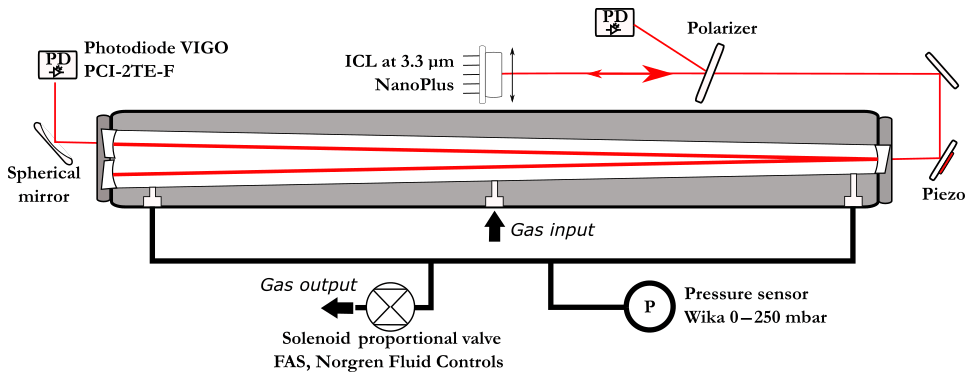
Figure 1Details of the optical setup with the laser injection and phase control (piezo mounted on the injection steering mirror assembly). The polarizer is tilted and its reflection used for acquiring the laser power spectrum before the cavity injection. At the cavity output, a spherical mirror is used to focus the light on the second (signal output) photodiode.
An OFCEAS spectrum acquisition covers more than 100 longitudinal cavity modes (0.7 cm−1) and is repeated at a rate of 10 Hz. For a precise retrieval of the absorption profile, and therefore of the molecular density in the cell, the cavity is precisely temperature and pressure stabilized at respectively ∼308.15 K and 30 mbar. The cell is heated by two resistive heating bands controlled via a proportional–integral–derivative (PID) regulation and a PT1000 sensor positioned at the center of the cell, glued on the stainless-steel block. A second PID loop is used for pressure regulation by acting on a solenoid proportional valve (FAS, Norgren Fluid Controls). The inner pressure in the optical cell is measured by a Wika 0–250 mbar pressure gauge. The temperature and current of the laser and the temperature and pressure of the cell are controlled by a single electronic card developed by the company AP2E, which, by means of a microprocessor, also ensures the fast acquisition of the two photodiode signals (340 kHz per channel). The cavity with the optical assembly, reported in Fig. 1, is suspended by two vibration-isolation dampers and placed in an insulated aluminum casing.
In the infrared region, two fundamental bands are available for detecting CH4: the ν3 mode between 2800 and 3100 cm−1 and the ν4 mode from 1200 to 1300 cm−1. Several reasons make the ν3 transition more suitable for trace gas sensing, and notably, (1) ICLs are today available at this wavelength and they require less effort to cool compared to room-temperature QCLs, and (2) photodetectors have better sensitivity in this spectral region. For this work, the selected laser is centered at 3.325 µm and operates between 8 and 12 ∘C, allowing it to cover the spectral region from 3005.4 to 3009.2 cm−1. This region has been selected to best accommodate the absorption intensities of the species to be detected at a specific range of concentrations (around 200 ppmv for CH4 and 30 ppmv for C2H6) and for the possibility to access the “best” isolated absorption lines. For applications in dissolved gas measurements, the selected wavelength region offers access to water absorption lines, required for the characterization of the dissolved gas extraction system (Grilli et al., 2018).
The selected absorption window reports a relatively large overlap of absorption features, requiring a rigorous optimization of the fit parameters. Here, a multicomponent fit routine is used where line parameters (intensity, position, Lorentzian and Gaussian widths, and the νVC parameter for collision-induced velocity change inducing a so-called Dicke narrowing; Dicke, 1953) are fitted for each absorption transition using a speed-dependent Rautian profile (Varghese and Hanson, 1984). A total number of 46 absorption lines are included in the fit, with 17, 3, 23, and 3 lines for 12CH4, 13CH4, C2H6, and H2O, respectively. In order to reduce the degrees of freedom of the fitting routine and allow a real-time fit for each acquired spectrum, some of the parameters have been pre-optimized and fixed or linked together. The remaining free parameters are (1) the spectrum position, for which the positions of all lines are linked together and only one parameter (which corresponds to the mode shift) is used to adjust the fit with respect to the acquired spectra; (2) the four intensities of 12CH4, 13CH4, C2H6, and H2O from which concentrations are retrieved, and all lines belonging to one of these molecules are fixed in relative intensity to pre-optimized values, with a single intensity scaling parameter for all of them; (3) the coefficients of the polynomial function for drawing the baseline of the fit (here corresponding to three parameters for a second-order polynomial function); (4) one extra parameter can be added per optical fringe that the operator may want to fit. In this case we only have one optical fringe, which has been identified between the output cavity mirror and the signal photodiode. The Gaussian and Lorentzian widths as well as the νVC parameter for Dicke narrowing are optimized line by line and then fixed to their optimum values. The total number of free parameters for the fit is nine for a spectrum composed of 48 individual points. A typical spectrum is reported in Fig. 2 for concentrations of 72 ppmv of methane and 20 ppmv for ethane in dry air. The temperature and pressure of the cell are 35 ∘C and 30 mbar, respectively. The fit is optimized using an interlaced spectrum in order to increase the spectral resolution. The latter is obtained by linearly slightly scanning the temperature of the cavity (0.02 ∘C of excursion), which causes a shift of the cavity mode positions with respect to the absorption lines, due to the mechanical elongation of the cell together with a change in the refractive index of the gas sample. This interlacing is only used for fit optimization, while in normal operation the spectra are only composed by data points separated by the cavity FSR (187.4 MHz) with a total of 48 fitted spectral points. The interlacing is computed by a custom LabVIEW routine that recognizes after how many consecutive spectra a complete scan of the cavity FSR is complete. The spectra are then homogeneously distributed within the one FSR span to originate the interlaced spectrum. For the spectrum of Fig. 2 (experimental data: black and green lines), 200 consecutive spectra are interlaced to achieve a resolution of 935 kHz. In Fig. 2a, the 12CH4 and 13CH4 (red and blue spectra, respectively) are the simulated spectra according to the HITRAN 2016 database (Gordon et al., 2017). This has been carried out for a clearer visualization of the line positions of the two isotopologues. A disagreement between experimental data and the HITRAN database was found for the two superposed lines of 12CH4 at 3008.39 cm−1, which are 16.5 % weaker in amplitude in the simulated spectra with respect to the experimental data. The arrows indicate the best isolated absorption lines, which are used for calculating the isotopic ratio of methane (red and blue spectra) and the ethane concentration (green spectrum). Optical interference fringes are visible on the baseline, with the major fringe corresponding to the optical path between the output cavity mirror and the photodiode. Improvement in the photodiode alignment and the use of an additional spherical mirror at the cavity output for focusing the light into the detector (as shown in Fig. 1) significantly decreased the amplitude of the optical fringe.
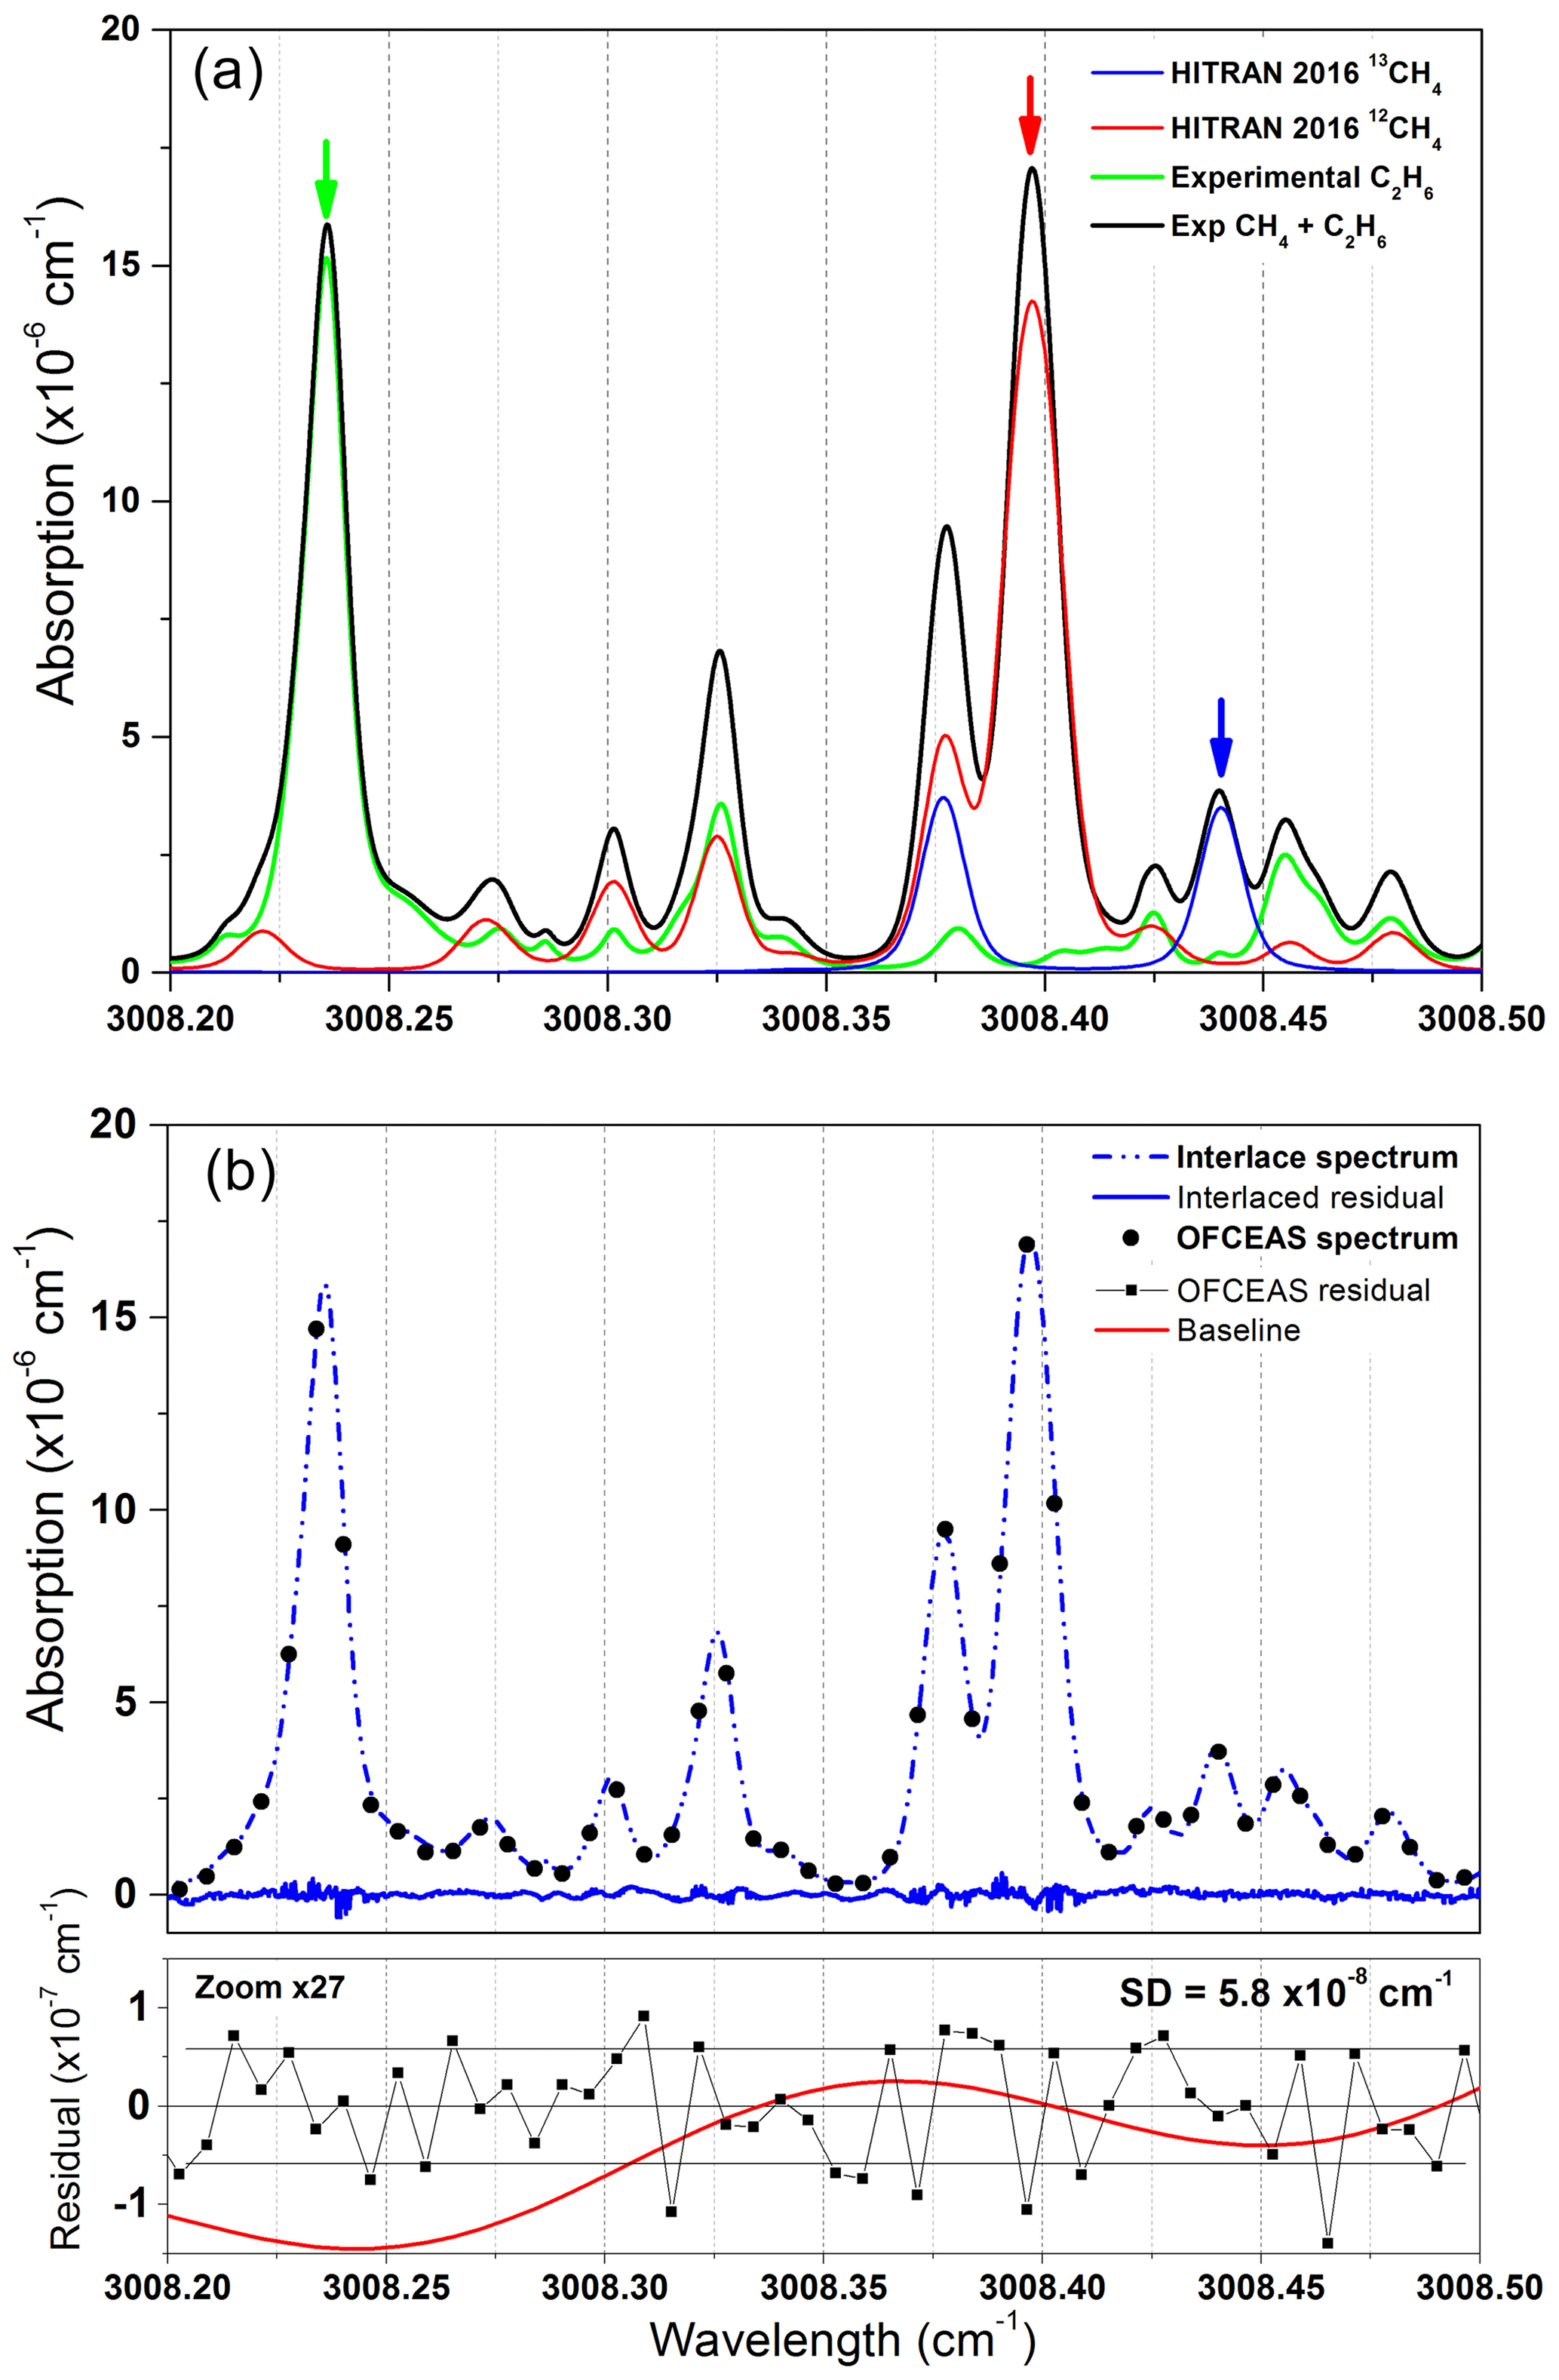
Figure 2(a) A combination of experimental interlaced spectra and spectra simulated using the HITRAN 2016 database at 30 mbar and 35 ∘C. HITRAN profiles show the position of 12CH4 (red) and 13CH4 (blue) at 72 ppmv of CH4 in dry air. In green is the interlaced spectrum acquired with only 20 ppmv of C2H6 in dry air in the cavity. The full experimental spectrum containing absorptions from the three species is reported in black. There is a disagreement for the two superimposed lines at 3008.39 cm−1, with a line intensity discrepancy between experimental data and the HITRAN 2016 database of ∼16 % on the amplitude of the absorption lines (this is outside the reported HITRAN 2016 uncertainties on the cross sections that are between 2 % and 5 %). (b) An example of an OFCEAS spectrum (black circles) and the corresponding interlaced methane–ethane absorption spectrum and its residue (blue lines). At the bottom, the residuals of the OFCEAS spectral fit for one acquisition (0.1 s) and the baseline curve (red) (generated by the fit) are reported.
The standard deviation of the fit residuals for the spectrum obtained with 72 ppmv of methane and 20 ppmv of ethane in dry air is cm−1 for a single acquisition, which corresponds to a precision of 140 ppbv, 1.3 ppbv, 37 ppbv, and 1.5 ‰ for 12CH4, 13CH4, C2H6, and δ13C-CH4, respectively. For the determination of the precision of 13CH4, its natural abundance was taken into account. A contribution from small imperfections of the fit parameters is still present since the standard deviation of the absorption baseline in absence of absorber (i.e., cavity filled with 30 mbar of zero air) is cm−1 for a single acquisition. A more comparative way of describing the performance of the instrument consists of defining the figure of merit normalized by the square root of the bandwidth of the measurement (10 Hz) and the number of spectral elements (48) (Moyer et al., 2008). This leads to a figure of merit (noise equivalent absorption sensitivity, NEAS) of cm−1 Hz per spectral element without account for fit imperfections and cm−1 Hz per spectral element for a typical spectrum of 72 ppmv of CH4 and 20 ppmv of C2H6 in dry air.
The stable carbon isotopic ratio (δ13C) is normally expressed as a comparative measurement with respect to an international reference, in this case Vienna Pee Dee Belemnite (VPDB, for the Belemnitella americana fossil carbonate). It is described by Eq. (1), in which R is the abundance ratio of each isotopologue in the sample material, and RVPDB the corresponding abundance ratio in the standard material. In the linear absorption regime, the number density of the molecule is proportional to the absorption and related to it via the absorption cross section. Therefore, the retrieval of the isotope ratio with respect to a standard gas of known isotopic composition is relatively straightforward (Kerstel, 2004). The δ13C-CH4 gas standards used for the experiments are from Isometric Instruments and certified on the VPDB scale with an uncertainty of ±0.2 ‰.
Because of the complexity of the spectral fit and the discretization on the wavelength or frequency scale dictated by the cavity FSR, the position of the cavity modes with respect to one of the absorption lines affects the results of the fit. This is due to small imperfections of the fit model relative to the real spectrum, which is sampled by the cavity modes. As these move and trace out the real spectrum profile, the model spectrum defects translate into varying errors or biases of the fit parameters, which are optimized to match the model to the data at each time. We thus observed a dependency of the retrieved line surfaces (areas underneath the absorption line) on the cavity mode positions with respect to the absorption features, which affects the isotope ratio determination (also observed and discussed in Favier, 2017). The drift in the cavity mode position is mainly due to mechanical instability and temperature fluctuations. Pressure may also play a role: even if stabilized at ±10 µbar the sensor may experience drifts with respect to the absolute pressure due to, for instance, fluctuations of temperature. In order to compensate for these drifts, we locked the cavity modes' position to the absorption lines' position by dynamically acting on the cavity temperature. The aim of the lock is not to better stabilize the cavity temperature, but to act on this temperature regulation in order to always maintain the cavity comb at the same position with respect to the position absorption lines and compensate for electronic drifts occurring on the circuit for reading pressure and temperature of the cavity. Figure 3 reports long-term measurements for two situations: in red, where the temperature of the cavity is stabilized at 35 (±0.0015) ∘C and the cavity modes are free to move, and in black, where the cavity modes are locked by acting on the temperature set point (the shift reported corresponds to the megahertz-sized excursion of the cavity modes with respect to the absorption feature). Measurements were obtained by continuously flushing the cavity at a gas flow of 10 sccm (standard cubic centimeters per minute) with a sample containing 72 ppmv of CH4 and 20 ppmv of C2H6 in dry air.
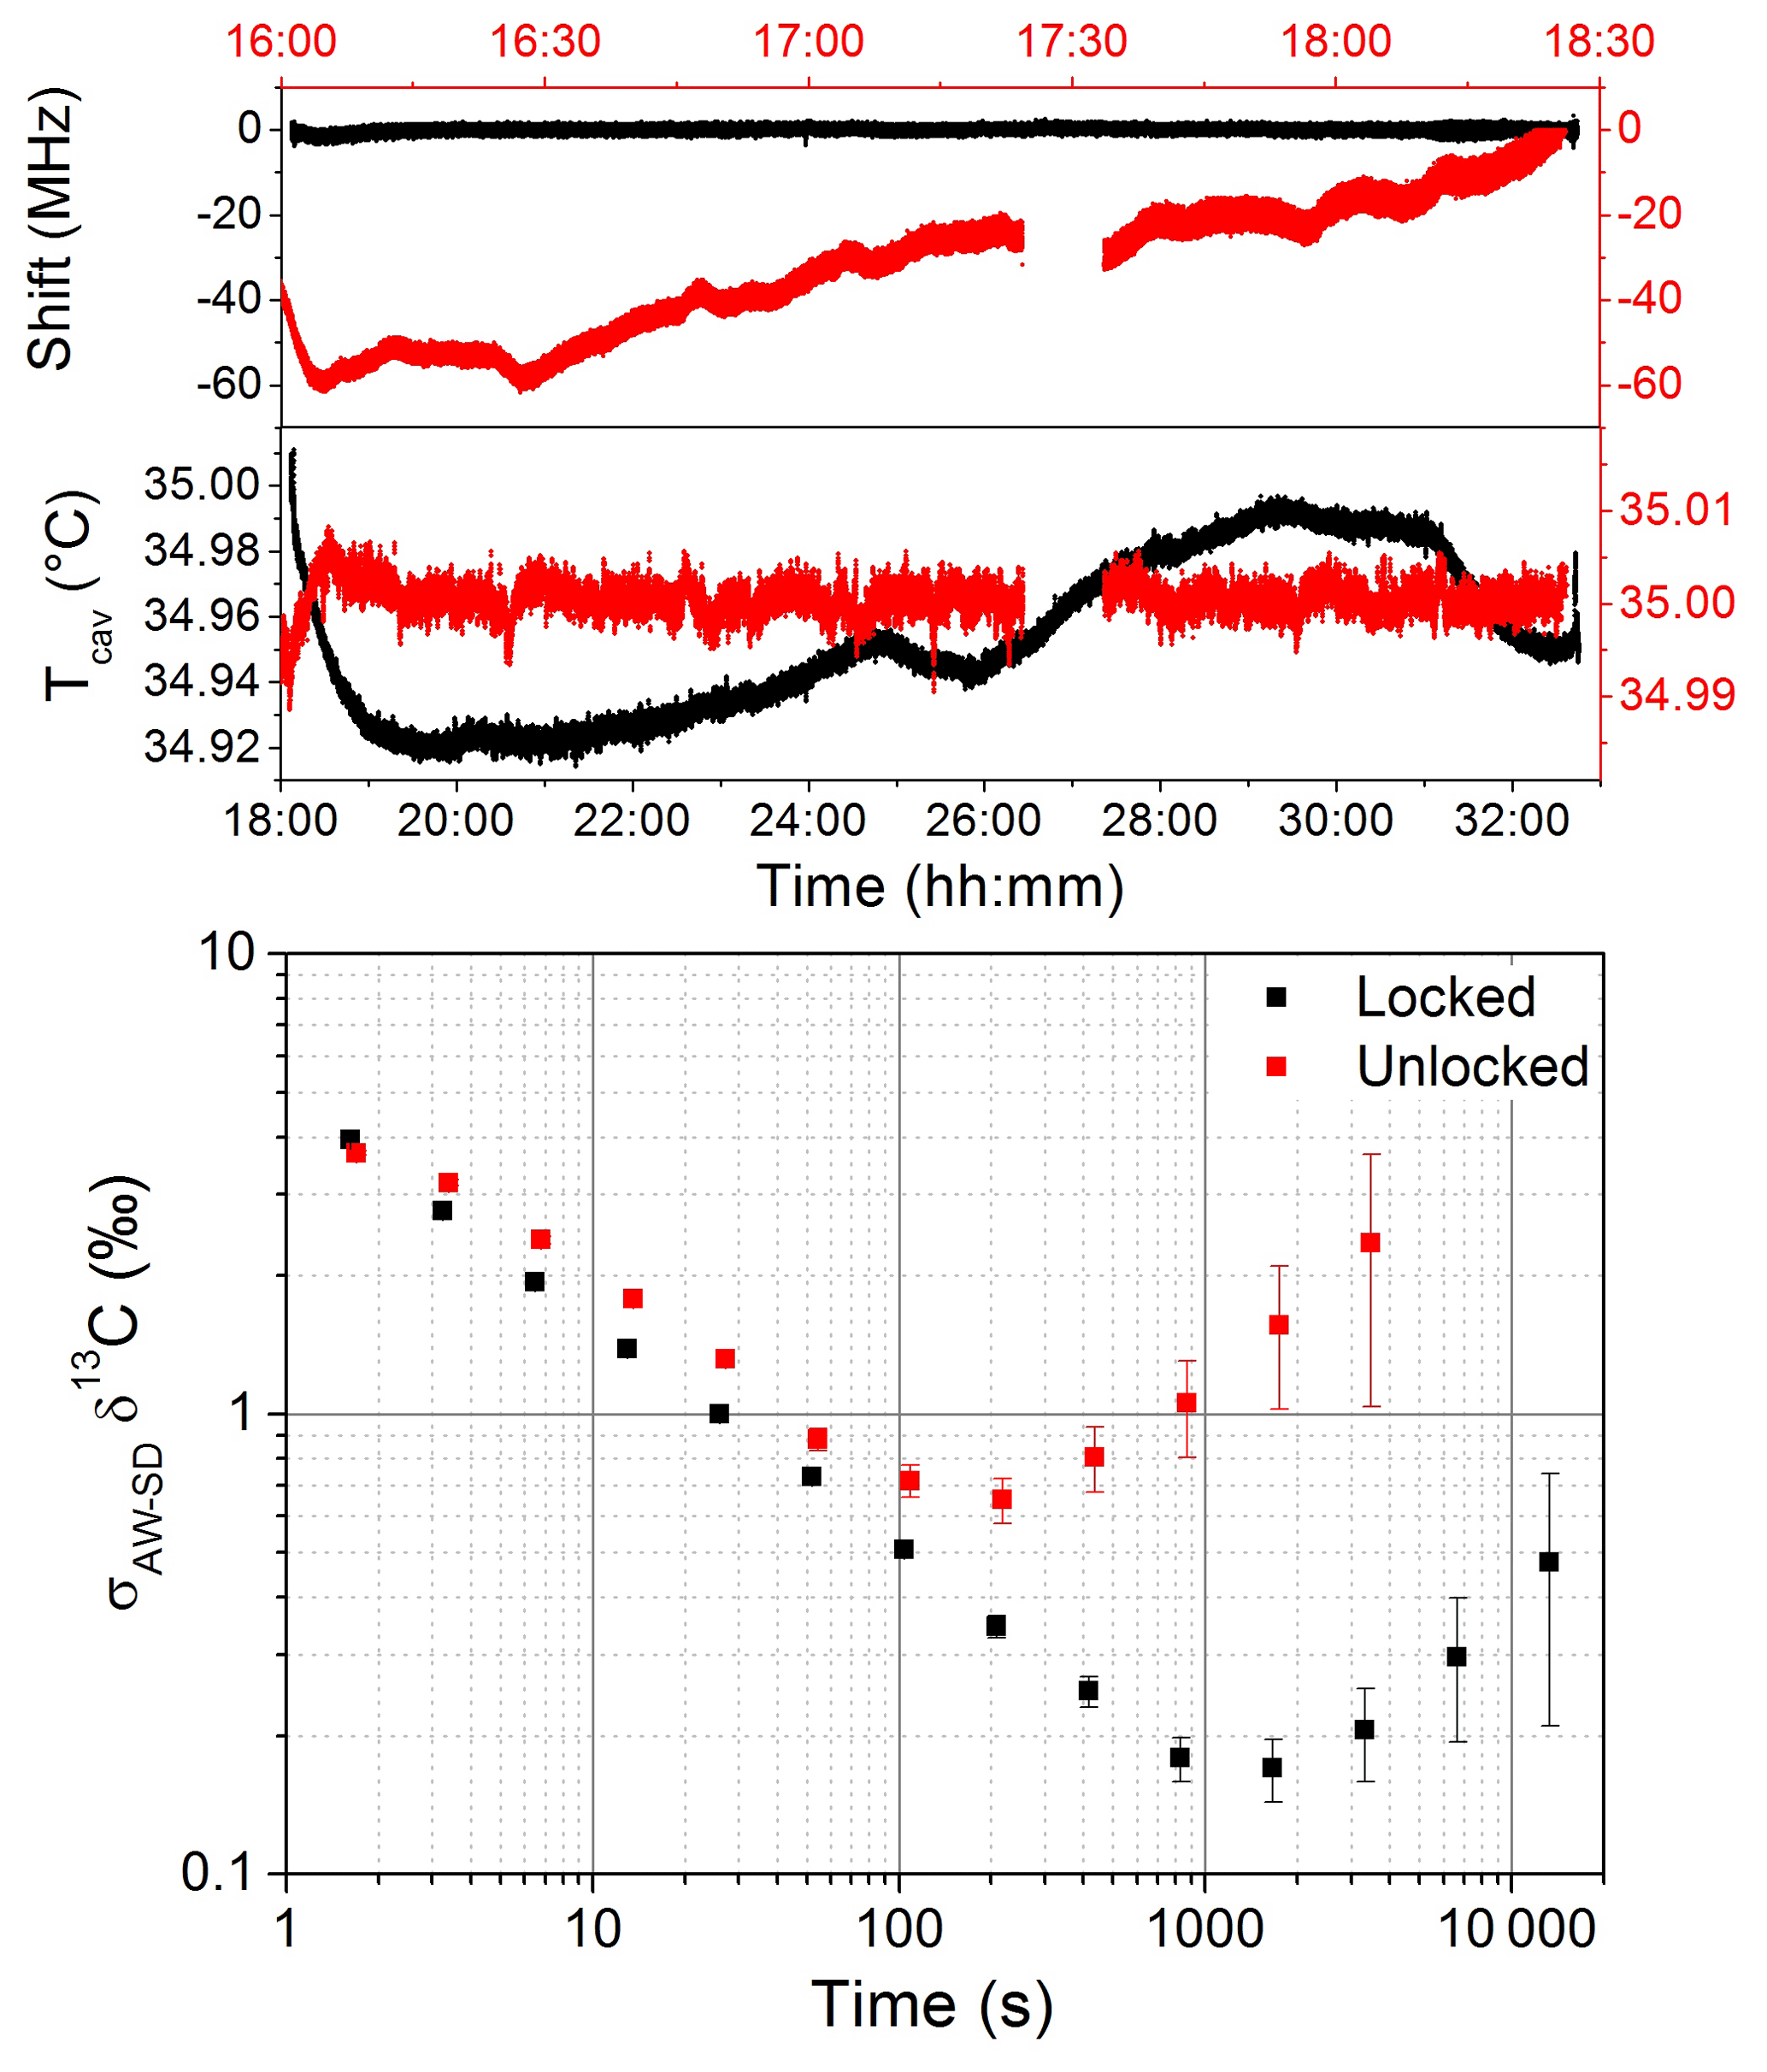
Figure 3A comparison of the performance on the measurement of the δ13C-CH4 with (black) and without (red) the lock of the position of the cavity modes. Without the locking the temperature is stabilized at 35±0.0015 ∘C and the mode position drifts by about 20 MHz h−1. By locking the mode positions acting on the temperature set point, the mode positions are stabilized to 620 kHz. The advantage of the locking configuration is visible in the log–log plot, where the AW standard deviation of the δ13C-CH4 signal is shifted to slightly lower values, with a longer averaging-time stability. Both measurements were performed by continuously flushing the cavity with a 10 sccm gas flow of a synthetic air mixture containing 72 and 20 ppmv of CH4 and C2H6 in dry air, respectively.
Without the locking of the cavity modes' position we observed a drift of 20 MHz h−1 of the cavity modes, while with the servo loop a stabilization of the mode positions better than 620 kHz was obtained. In the unlocked dataset, a fluctuation in the temperature stabilization occurred around 17:30 local time, and the corresponding section of data has been removed for the analysis. The spectral fit was conducted for both situations and an Allan–Werle (AW) statistical analysis (Werle, 2010) was performed on the δ13C-CH4 signal (Fig. 3). From the log–log plot, where the AW standard deviation (σAW-SDδ13C) is plotted against the averaging time (t), a 10-fold improvement of the long-term stability was observed, which translates into an extension of the optimum integration time of the system for the case of temperature locking of the cavity mode positions.
Afterwards, the system was further improved with a better optimization of the fitting parameters and of the optical setup, resulting in a reduction of the optical interference fringes. A second AW statistical analysis was therefore conducted on the simultaneous detection of δ13C-CH4, 12CH4, and C2H6 with the same experimental conditions as for Fig. 3. More than 4 h of continuous measurements were used to produce the log–log plot (Fig. 4). At short times, the measurement is mainly dominated by white noise with the σAW-SD decreasing proportionally to t−0.5. The optimum integration time corresponds to 400 s, reaching precisions of 0.08 ‰, 11 ppbv, and 3 ppbv for δ13C-CH4, 12CH4, and C2H6, respectively. For longer integration times, due to the rise of 1∕f noise (drifts), the σAW-SD starts to increase, leading to a degradation of the precision. In order to fix the accuracy of the instrument at its optimal precision below 0.1 ‰ for δ13C-CH4, injection of a standard gas with a known isotopic composition should thus occur every 400 s. This allows us to overcome the instrumental drifts and to maintain the accuracy of the measurement at about the same level of precision obtained at the optimum integration time. If not, instrument drifts will dominate with a degradation of the accuracy as reported and explained below. A comparison of the two statistical analyses for the δ13C-CH4 measurements (between Figs. 3 and 4) highlights how the improvement on the optical setup allowed us to shift the entire AW curve to lower values (with a decrease in the σAW-SD by a factor of 4); however we could not obtain the long integration time as reported in Fig. 3. This is probably due to the fact that the arise of frequency-dependent noise is dominated by other instabilities, limiting the best precision of the δ13C-CH4 to a value close to 0.1 ‰. Nevertheless, the benefit of the improvements is clearly visible, with the improved setup approaching the same precision as the previous one 10 times faster.
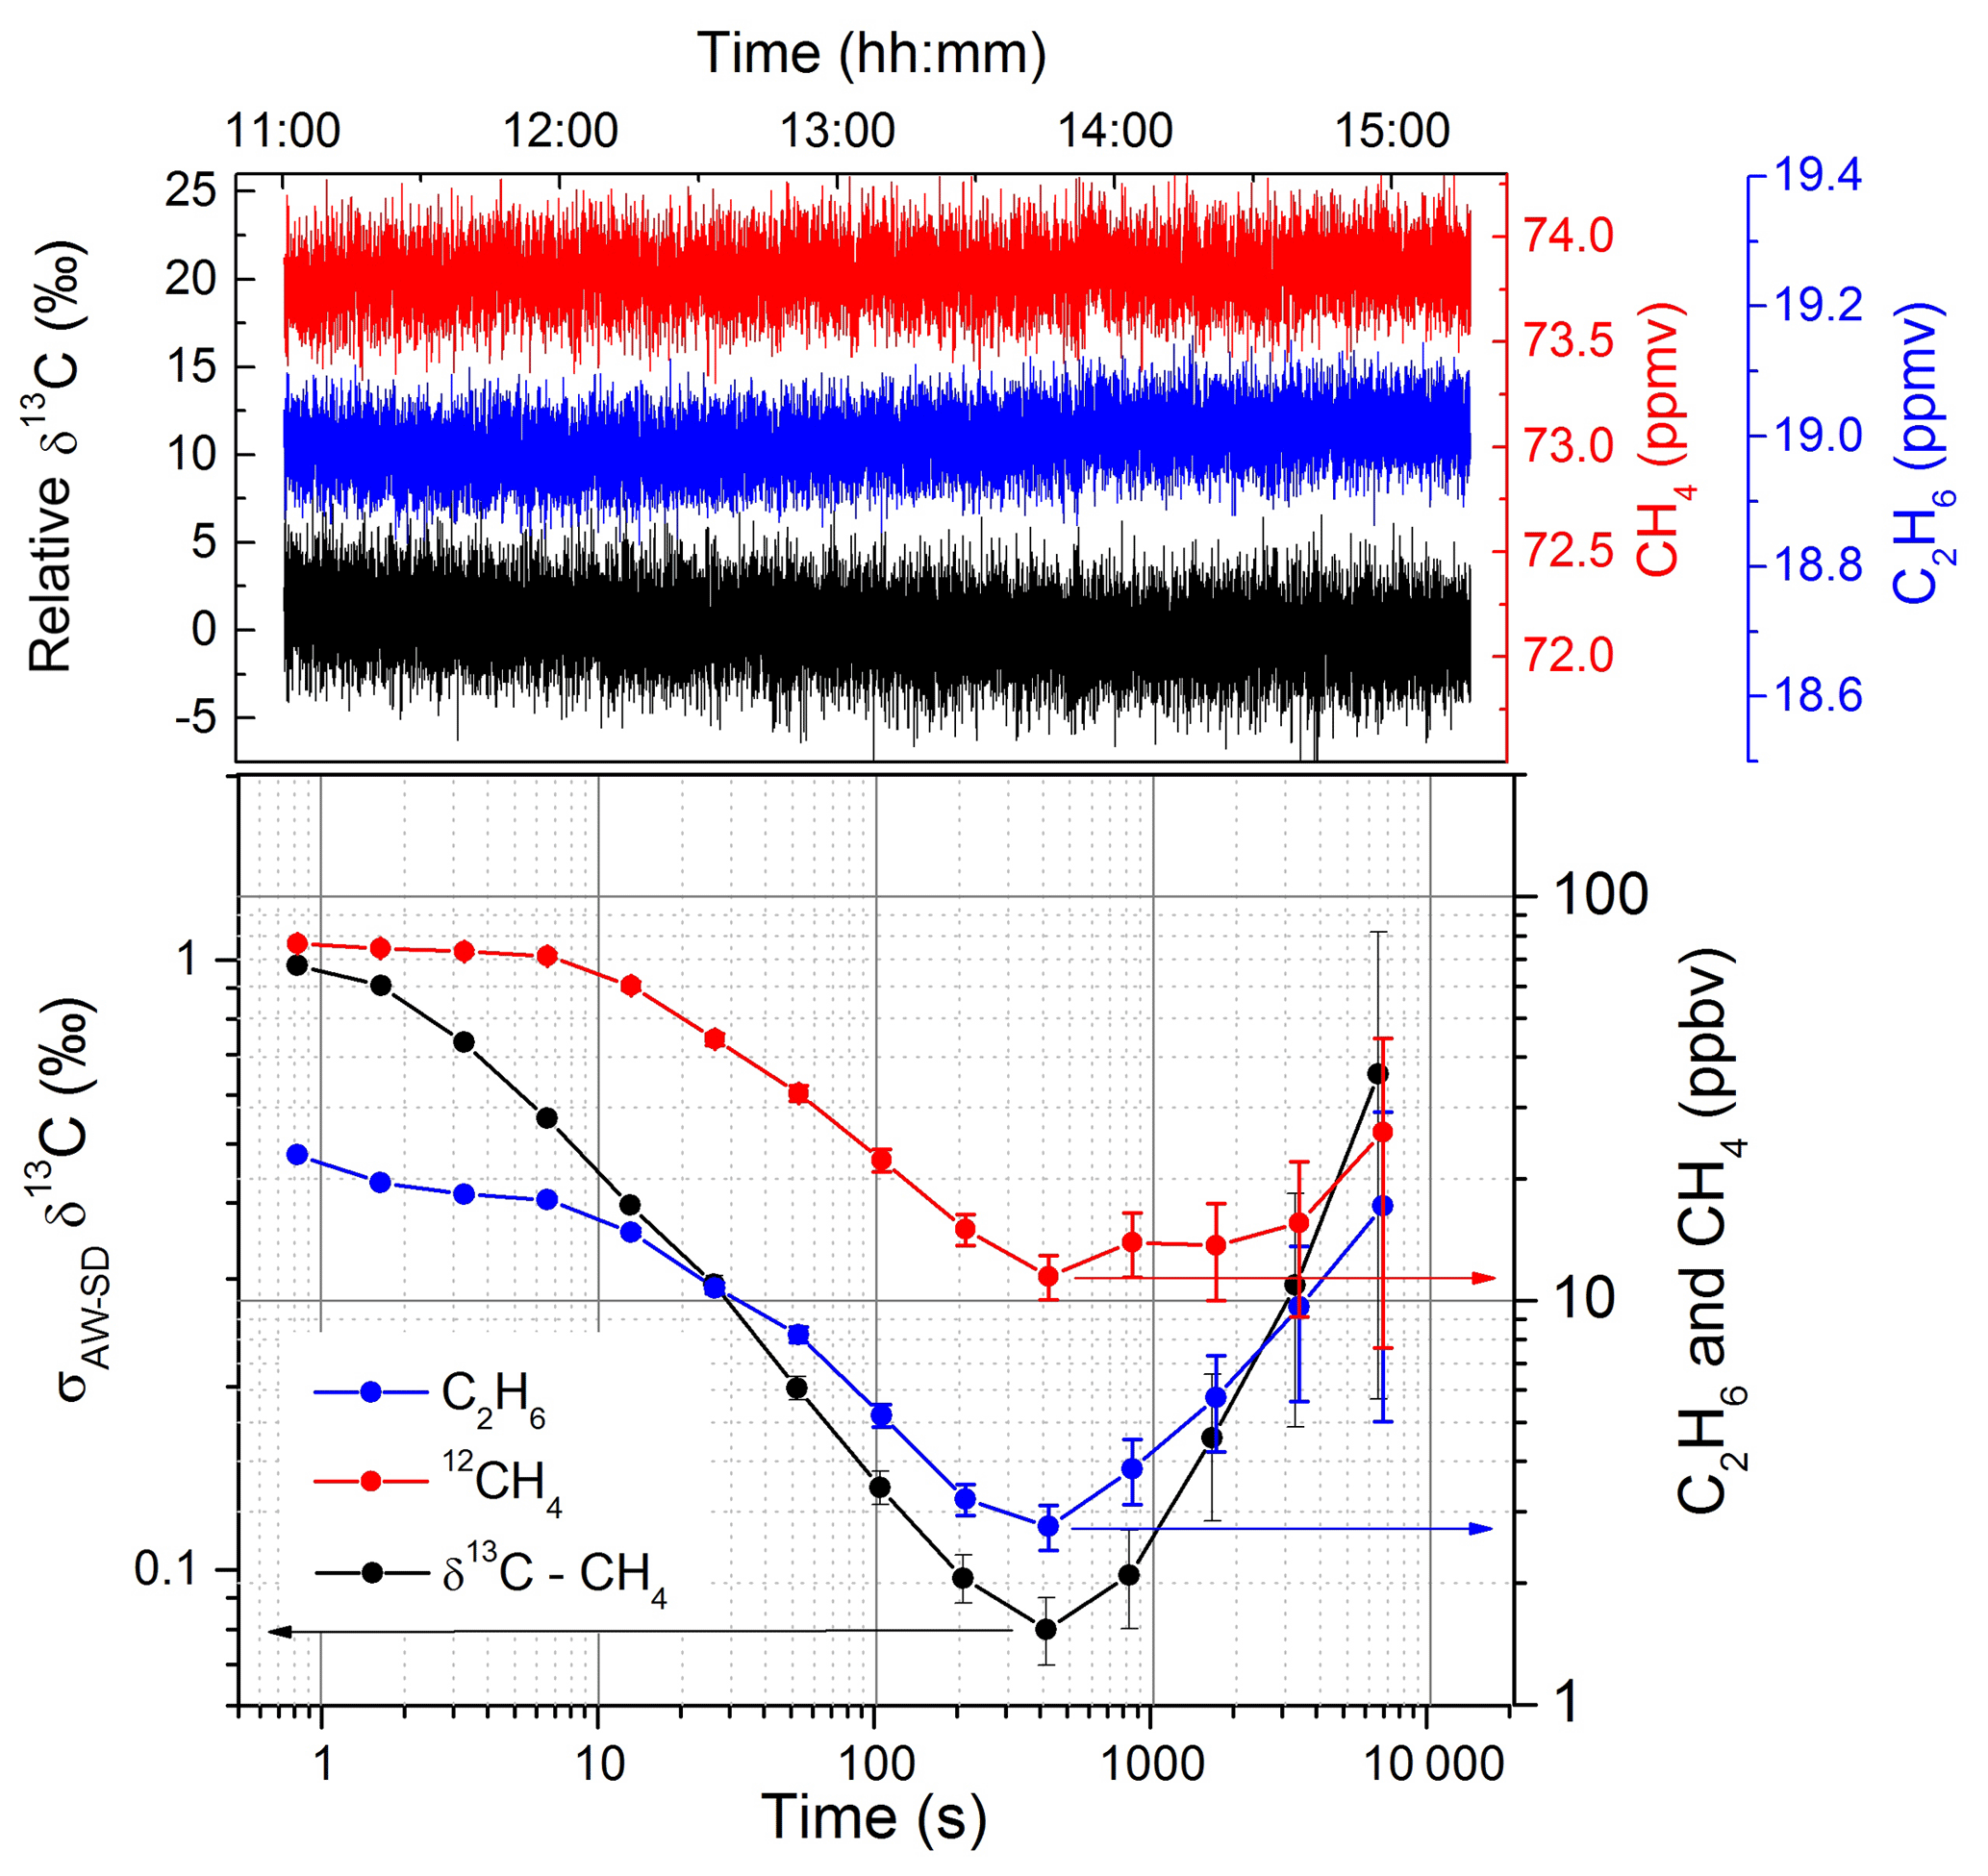
Figure 4The Allan–Werle standard deviation for a 4 h time series of measurement with 73.7 ppmv of methane (black) and 19 ppmv of ethane (blue) in dry air. The best integration time of the system corresponds to ∼8 min and the achieved precision is 0.08 ‰, 11 ppbv, and 3 ppbv for δ13C-CH4, 12CH4, and C2H6, respectively.
In Fig. 5, the dependency of the isotopic ratio with the concentration of methane is reported. This dependency is not caused by isotopic fractionation due to the sample handling, but more probably related to the discretization of the spectra and the precise location of the measurement points with respect to residual optical fringes in the spectrum. The tendency is well reproducible, can be fitted with an exponential function, and can be used for calibration proposes. The same behavior was also observed using the same technique but for H2O and H2S isotopic measurements (Favier, 2017; Landsberg, 2014), as well as with an instrument based on off-axis integrated cavity output spectroscopy (ICOS), as reported by Wankel et al. (2013). With a comparable amplitude variation in the absorption intensity, a similar effect (but less pronounced) was also observed with respect to C2H6 concentrations. By monitoring the carbon isotopic ratio of methane with and without 22.5 ppmv of ethane in the gas mixture, a difference in the δ13C-CH4 of 2.55 ‰ was observed. For this relatively small effect, a linear correction was applied.
The reproducibly of the system was estimated by conducting three measurements per day for 4 d at two methane concentrations (9 and 90 ppmv in dry air). Before each measurement the system was completely switched off. No calibration using a standard gas was carried out before each measurement. Therefore, the resulting reproducibility corresponds to the intrinsic accuracy of the system affected by long-term instabilities. Results are represented by the two histograms of Fig. 5 showing the reproducibility for δ13C-CH4, which is reported on a relative scale (i.e., with respect to an arbitrary reference value). At CH4 concentrations of 9 and 90 ppmv the isotopic ratio is retrieved with an accuracy of ±11.8 ‰ and ±2.9 ‰, respectively (both 1σ). By injecting a standard gas before each measurement for calibration proposes, the accuracy at high concentrations should approach the expected precision of < 0.1 ‰ after 5 min of integration.
Table 1Non-exhaustive comparison between some of the existing techniques for measuring δ13C-CH4.
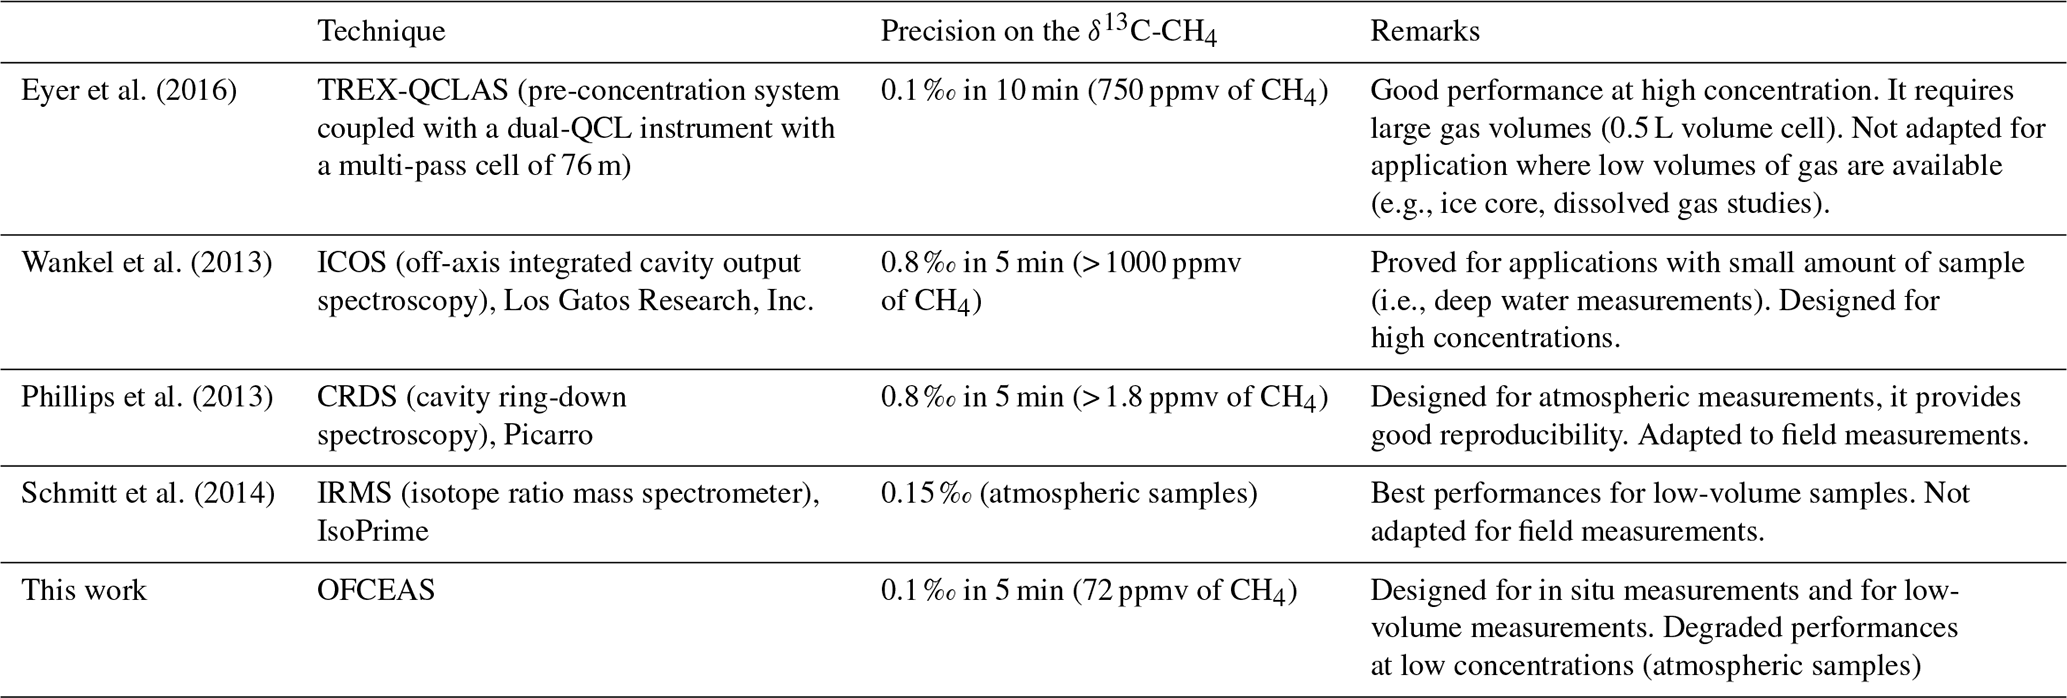
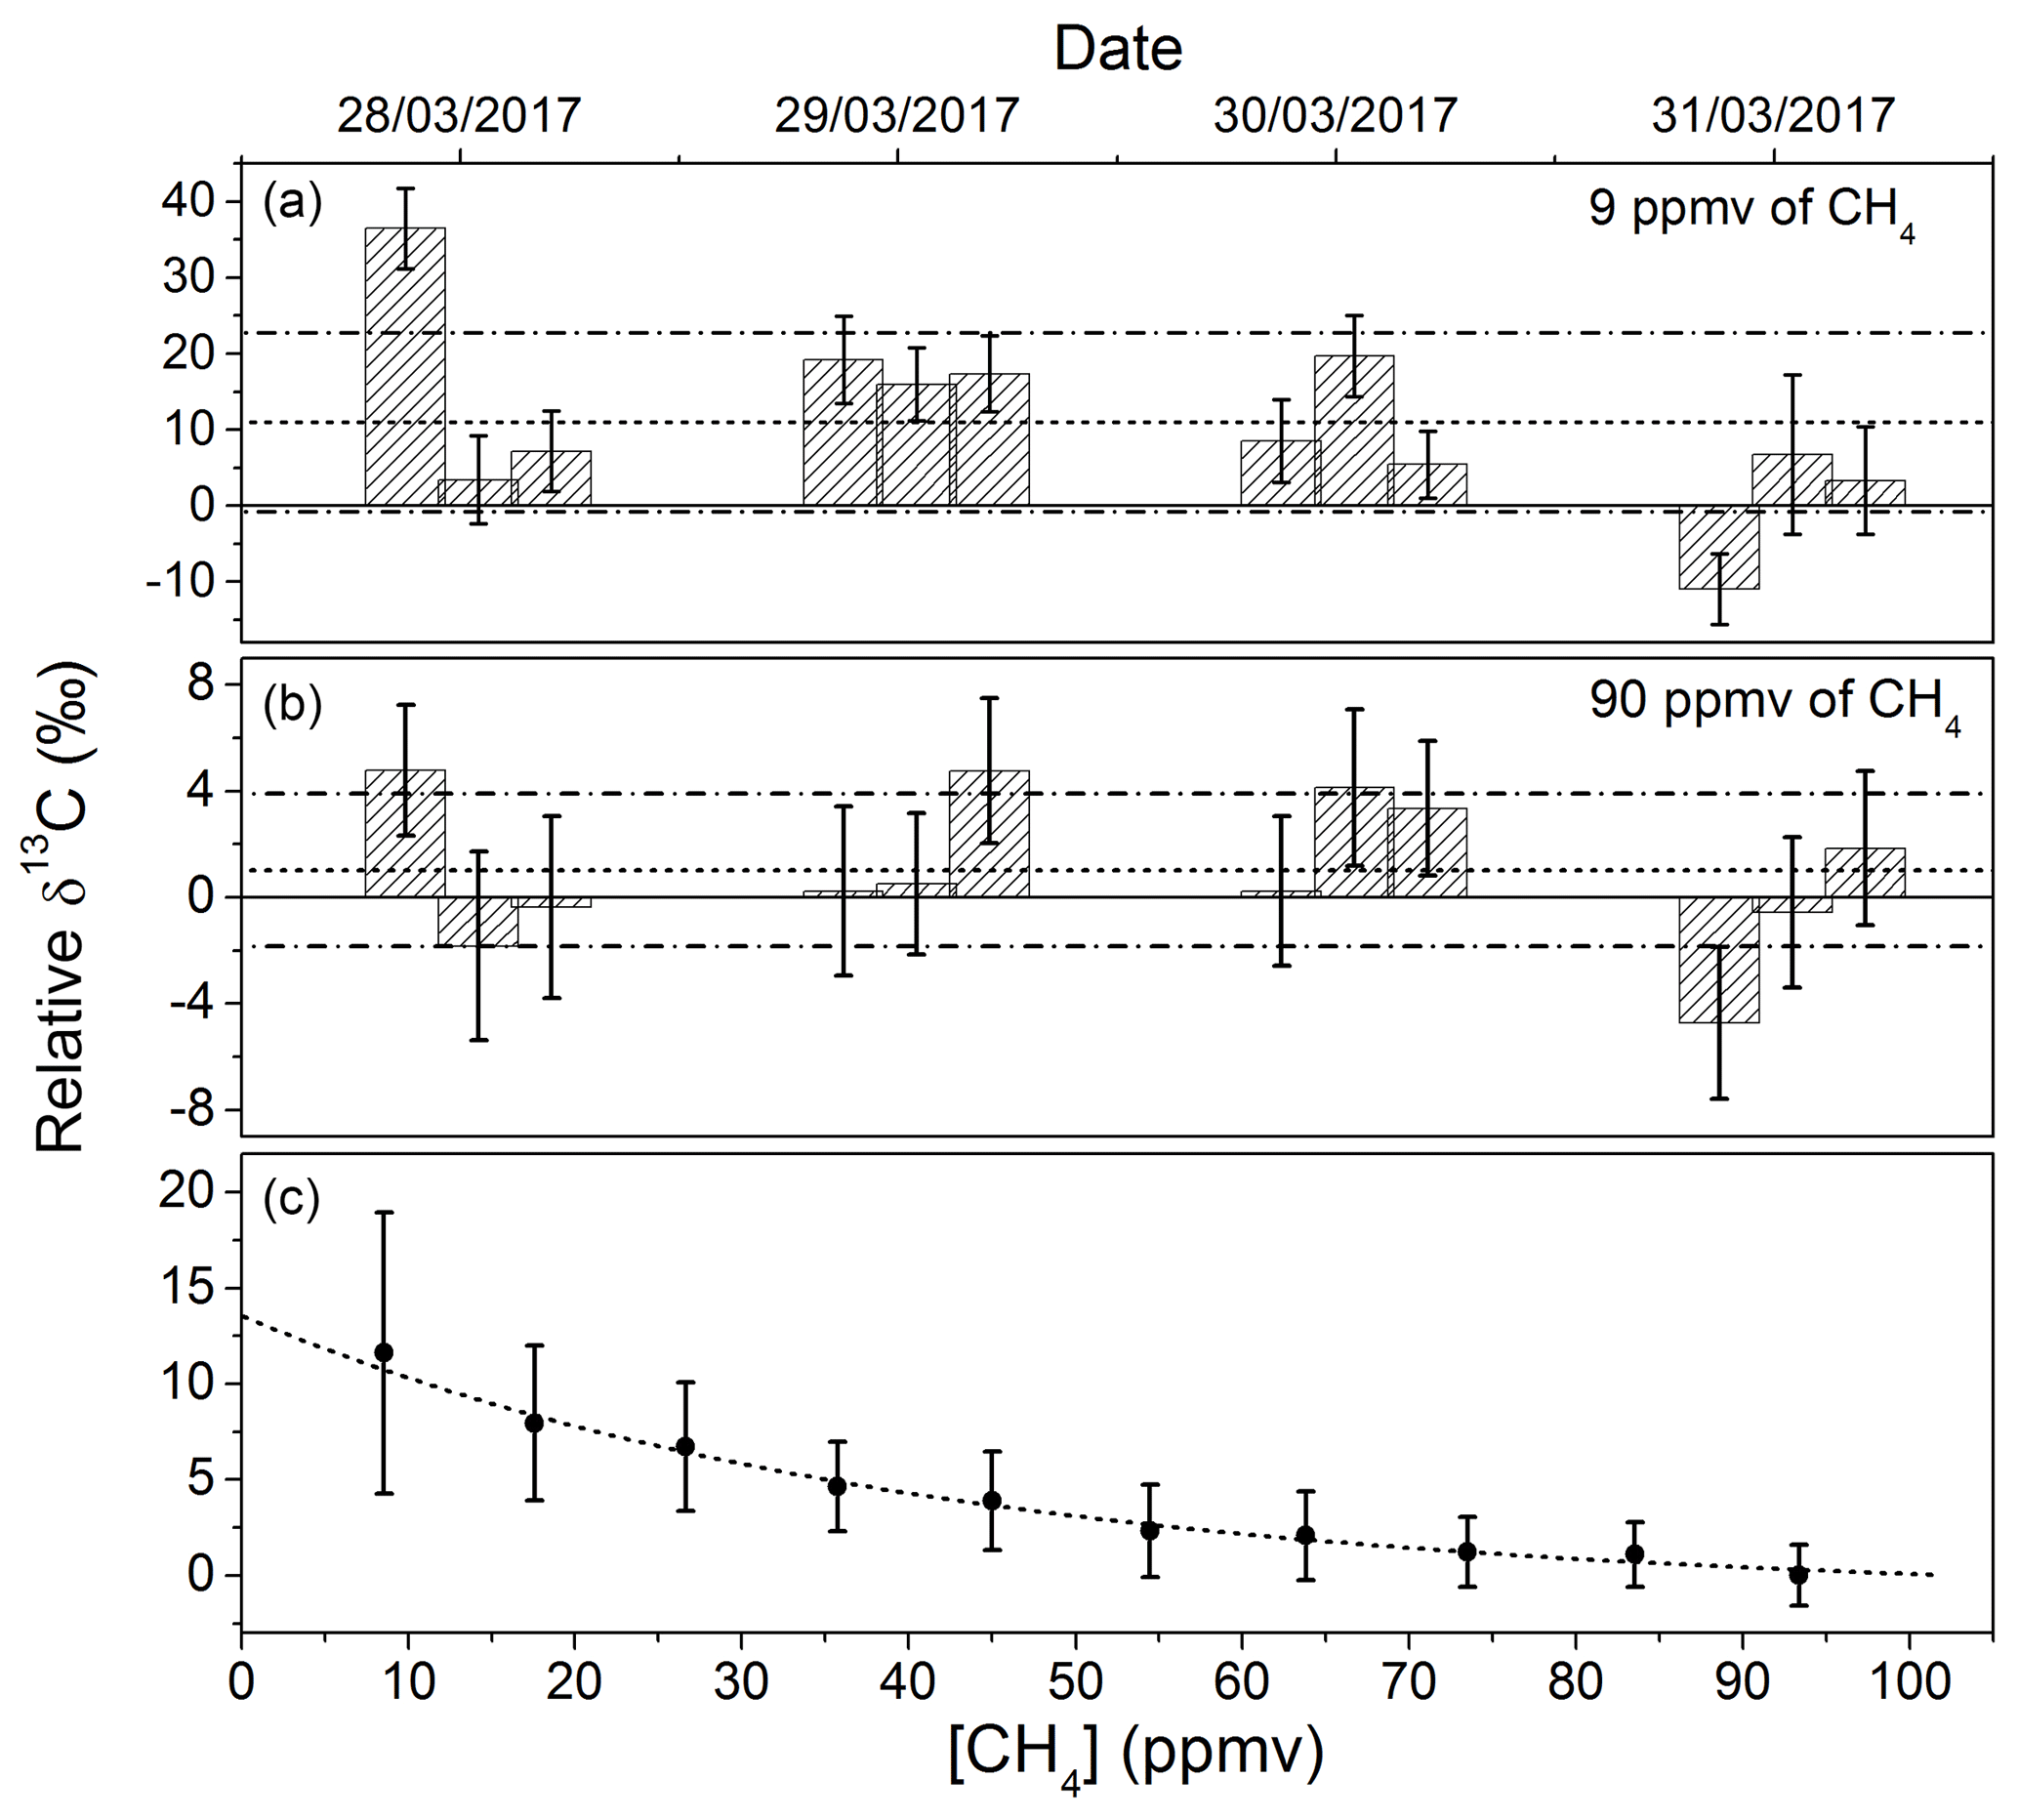
Figure 5(c) The dependency of the relative δ13C-CH4 on the CH4 concentration. (a, b) Reproducibility between discrete measurements made three times a day for 1 week for 9 and 90 ppmv of CH4 in dry air. Accuracies of ±11.8 ‰ and ±2.9 ‰ (represented by the dashed lines) were obtained for the two concentrations (1σ). The instrument was not calibrated before each measurement using a gas standard. For high concentrations, such calibration would make the accuracy approach the expected precision of 0.08 ‰ after 5 min of integration time.
For the purpose of further validating the stability of the system, long-term measurements were made while regularly switching between two samples with different isotopic composition. The two standard mixtures that were used had a composition of 79.4 ppmv of CH4, with a carbon isotopic composition of −54.5 ‰, and of 56.9 ppmv with δ13C-CH4 ‰ (with manufacturer certified uncertainties of ±0.2 ‰). The gas flow was fixed at 2 sccm and the standard gas samples were switched every 5 min for 3 h using a manual three-way two-position valve. In Fig. 6, the measurements of the carbon isotopic ratio are reported. Since the two samples had different CH4 contents, a correction following the curve reported in Fig. 5 was applied in order to account for the dependency of δ13C on the CH4 concentration. The −38.3 ‰ sample was employed as the “known” standard gas, and the isotopic composition of the second sample was then retrieved. Drifts on the isotopic signature of only 0.6 ‰ were observed after 3 h of continuous measurements (which is in agreement with the AW analysis). The response time of the instrument at 2 sccm gas flow is estimated to be 15 s (single exponential), entirely attributed to the renewal of the gas sample in the measurement cell. The standard deviation of the raw measurement (at 10 Hz) is ±1.9 ‰, while after averaging the results over 20 s (blue curve) the noise decreases to ±0.5 ‰.
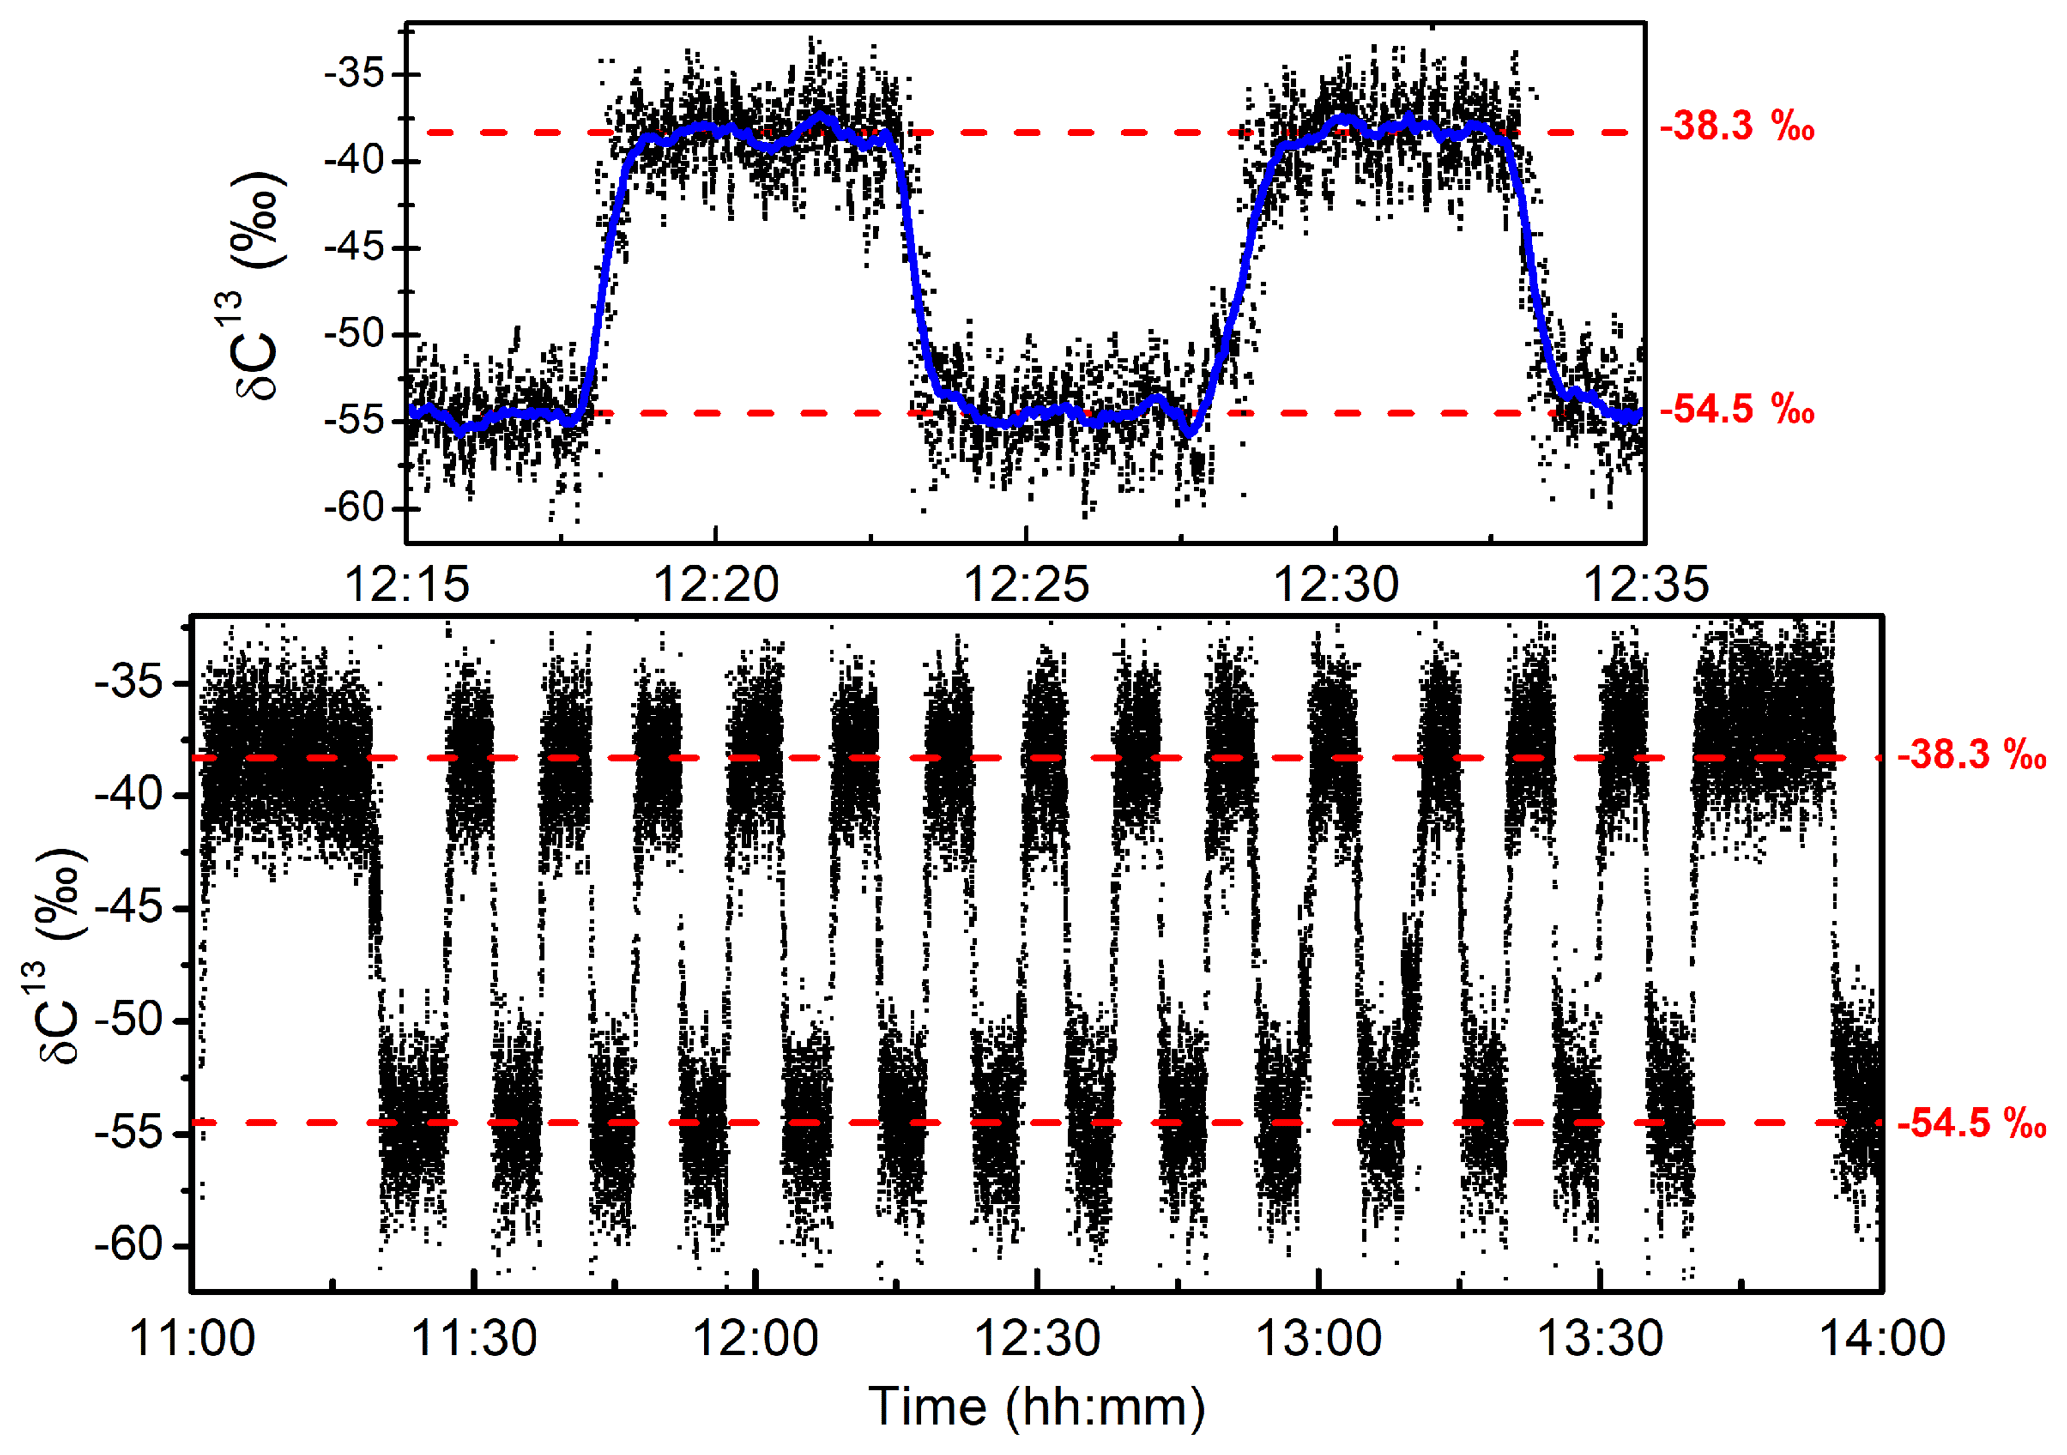
Figure 6Long-term measurements obtained by repeatedly switching between two methane samples in dry air having different stable carbon isotopic composition. The two samples are diluted gas standards from Isometric Instrument with specified δ13C-CH4 of ‰ (79.4 ppmv) and ‰ (56.9 ppmv).
Depending on the application, different instrumental developments with a focus on a particular analytical aspect were carried out in the past. For instance, the concentration range will vary depending on the application: a high sensitivity to measure in the low concentration range is required for environmental sensing (e.g., atmospheric measurements, paleoclimatology), while moderate sensitivity is required to measure in the high concentration range for dissolved gas measurements in seawater, leak detection, and oil and natural gas exploration. Some applications would require low sample volumes (such as ice core and dissolved gas analyses). Finally, different constraints such as compactness, robustness, and power consumption may play a role depending on the measurement strategy (laboratory, on site, or in situ measurements). For this propose, a non-exhaustive comparison with some of the existing techniques for measuring δ13C-CH4 is reported in Table 1. The comparison highlights similar performances, albeit for different conditions, with precisions on δ13C-CH4 below 1 ‰. Up to now, the best performance in terms of precision and the amount of sample required remains the IRMS technique, followed by the CRDS system developed by Picarro (Phillips et al., 2013; Schmitt et al., 2014). The QCLAS system of Eyer et al. (2016) based on a multi-pass cell, the ICOS from Los Gatos Research (Wankel et al., 2013), and the work reported here are more suitable for high methane concentrations. Our development aims at the measurement of dissolved gas in seawater, and therefore was optimized for relatively high methane concentrations of ∼100 ppmv, achieving precision on the δ13C-CH4 below 1 ‰ after 1 s. This development sets itself apart by its compactness and portability as required for in situ measurements. Moreover, thanks to the low volume of the measurement cell, a small amount of sample (< 1 cm3 of gas at STP) is required, making the spectrometer suitable for coupling to a membrane-based extraction system for in situ application in the water column under marine conditions.
In this work we presented a novel optical spectrometer, operating in the mid-IR region and based on the OFCEAS technique, for simultaneous measurement of C2H6 and 12CH4 concentrations and δ13C-CH4. The spectrometer achieved a minimum absorption coefficient of cm−1 over a single frequency scan (0.1 s) over 0.7 cm−1 at low levels of CH4 and C2H6 and cm−1 for a more typical gas mixture (72 ppmv of CH4 and 20 ppmv of C2H6). Precisions of 3 ppbv, 11 ppbv, and 0.08 ‰ for C2H6, 12CH4, and δ13C-CH4, respectively, were demonstrated for an optimum integration time of 400 s. A stability of ±2.9 ‰ for long-term measurements of δ13C-CH4 was obtained without the need of regular injection of known isotopic composition standard gas. The latter is needed if an accuracy of the δ13C-CH4 measurement at the level of 0.1 ‰ is required. The dependency of the isotopic measurement on the composition of the gas mixture was characterized, with calibration curves for both CH4 and C2H6 concentration dependencies. The instrument has the required characteristics of compactness, precision, and time resolution to be coupled with a dissolved gas extraction system and to be integrated in an in situ sensor for continuously monitoring the dissolved gas composition in deep-sea and oceanic environments. A dissolved gas extraction system similar to the one described by Grilli et al. (2018) will provide an adjustable dilution of the gas sample by adding a zero-air carrier gas at the dry side of the extraction unit, therefore increasing the dynamical range of the sensor.
The underlying data require proprietary software and specific knowledge (spectroscopy and technical) of the spectral analysis. This makes it rather useless to make the raw data available to users not involved in the current study. Authors will however respond timely to all motivated requests for data sharing.
LC developed the optical spectrometer and performed the measurements under the supervision of RG and JC. DR and EK contributed prior knowledge, especially to the stabilization of the cavity mode position and the spectral analysis. All authors contributed to the writing and reviewing.
The authors declare that they have no conflict of interest.
This article is part of the special issue “Advances in cavity-based techniques for measurements of atmospheric aerosol and trace gases”. It is not associated with a conference.
The research leading to these results has received funding from the European Community's Seventh Framework Programme ERC-2015-PoC under grant agreement no. 713619 (ERC OCEAN-IDs). The work was made possible thanks to pioneering investigations conducted under the European Community's Seventh Framework Programme ERC-2011-AdG under grant agreement no. 291062 (ERC ICE&LASERS) and with support from SATT Linksium of Grenoble, France, and of the Service Partenariat & Valorisation (SPV) of the CNRS. The authors thank the AP2E company and particularly Kevin Jaulin for exchanges regarding the spectrometer development.
This research has been supported by the European Research Council (grant OCEAN-IDs (713619)) and the European Research Council (grant ICE&LASERS (291062)).
This paper was edited by Katherine Manfred and reviewed by two anonymous referees.
Butler, T. J. A., Mellon, D., Kim, J., Litman, J., and Orr-Ewing, A. J.: Optical-feedback cavity ring-down spectroscopy measurements of extinction by aerosol particles, J. Phys. Chem. A, 113, 3963–3972, https://doi.org/10.1021/jp810310b, 2009.
Chua, E. J., Savidge, W., Short, R. T., Cardenas-valencia, A. M., and Fulweiler, R. W.: A Review of the Emerging Field of Underwater Mass Spectrometry, Front. Mar. Sci., 3, 209, https://doi.org/10.3389/fmars.2016.00209, 2016.
Claypool, G. E. and Kvenvolden, A. K.: Methane and Other Hydrocarbon gases in Marine Sediment, Annu. Rev. Earth Pl. Sc., 11, 299–327, 1983.
Dicke, R. H.: The effect of Collisions upon the doppler width of spectral lines, Phys. Rev., 89, 472–473, 1953.
Eyer, S., Tuzson, B., Popa, M. E., van der Veen, C., Röckmann, T., Rothe, M., Brand, W. A., Fisher, R., Lowry, D., Nisbet, E. G., Brennwald, M. S., Harris, E., Zellweger, C., Emmenegger, L., Fischer, H., and Mohn, J.: Real-time analysis of δ13C- and δD-CH4 in ambient air with laser spectroscopy: method development and first intercomparison results, Atmos. Meas. Tech., 9, 263–280, https://doi.org/10.5194/amt-9-263-2016, 2016.
Favier, M.: Vers un instrument commercial pour la mesure des rapports isotopiques par Optical Feedback Cavity Enhanced Absorption Spectroscopy, PhD Thesis, Université Grenoble Alpes, 2017.
Gordon, I. E., Rothman, L. S., Hill, C., Kochanov, R. V., Tan, Y., Bernath, P. F., Birk, M., Boudon, V., Campargue, A., Chance, K. V., Drouin, B. J., Flaud, J. M., Gamache, R. R., Hodges, J. T., Jacquemart, D., Perevalov, V. I., Perrin, A., Shine, K. P., Smith, M. A. H., Tennyson, J., Toon, G. C., Tran, H., Tyuterev, V. G., Barbe, A., Császár, A. G., Devi, V. M., Furtenbacher, T., Harrison, J. J., Hartmann, J. M., Jolly, A., Johnson, T. J., Karman, T., Kleiner, I., Kyuberis, A. A., Loos, J., Lyulin, O. M., Massie, S. T., Mikhailenko, S. N., Moazzen-Ahmadi, N., Müller, H. S. P., Naumenko, O. V., Nikitin, A. V., Polyansky, O. L., Rey, M., Rotger, M., Sharpe, S. W., Sung, K., Starikova, E., Tashkun, S. A., Auwera, J. Vander, Wagner, G., Wilzewski, J., Wcisło, P., Yu, S., and Zak, E. J.: The HITRAN2016 molecular spectroscopic database, J. Quant. Spectrosc. Ra., 203, 3–69, https://doi.org/10.1016/j.jqsrt.2017.06.038, 2017.
Gorrotxategi-Carbajo, P., Fasci, E., Ventrillard, I., Carras, M., Maisons, G., and Romanini, D.: Optical-Feedback Cavity-Enhanced Absorption Spectroscopy with a quantum-cascade laser yields the lowest formaldehyde detection limit, Appl. Phys. B-Lasers O., 110, 309–314, https://doi.org/10.1007/s00340-013-5340-6, 2013.
Grilli, R., Marrocco, N., Desbois, T., Guillerm, C., Triest, J., Kerstel, E., and Romanini, D.: Invited Article?: SUBGLACIOR?: An optical analyzer embedded in an Antarctic ice probe for exploring the past climate, Rev. Sci. Instrum., 85, 1–8, https://doi.org/10.1063/1.4901018, 2014.
Grilli, R., Triest, J., Chappellaz, J., Calzas, M., Desbois, T., Jansson, P., Guillerm, C., Ferré, B., Lechevallier, L., Ledoux, V., and Romanini, D.: Sub-Ocean: subsea dissolved methane measurements using an embedded laser spectrometer technology, Environ. Sci. Technol., 52, 10543–10551, https://doi.org/10.1021/acs.est.7b06171, 2018.
Kerstel, E.: Isotope Ratio Infrared Spectrometry, in: Handbook of Stable Isotope Analytical Techniques, Volume-I, edited by: de Groot, P. A., Elsevier Science, 1 edition (1 January 2005), 759–787, 2004.
Landsberg, J.: Development of a water vapor isotope ratio infrared spectrometer and application to measure atmospheric water in Antarctica, PhD thesis, Université Grenoble Alpes, available at: https://tel.archives-ouvertes.fr/tel-01369376 (last access: 11 September 2018), 2014.
Lechevallier, L., Vasilchenko, S., Grilli, R., Mondelain, D., Romanini, D., and Campargue, A.: The water vapour self-continuum absorption in the infrared atmospheric windows: new laser measurements near 3.3 and 2.0 µm, Atmos. Meas. Tech., 11, 2159–2171, https://doi.org/10.5194/amt-11-2159-2018, 2018.
Maisons, G., Gorrotxategi Carbajo, P., Carras, M., and Romanini, D.: Optical-feedback cavity-enhanced absorption spectroscopy with a quantum cascade laser, Opt. Lett., 35, 3607–3609, 2010.
Manfred, K. M., Ritchie, G. A. D., Lang, N., Röpcke, J., and van Helden, J. H.: Optical feedback cavity-enhanced absorption spectroscopy with a 3.24 µm interband cascade laser, Appl. Phys. Lett., 106, 221106, https://doi.org/10.1063/1.4922149, 2015.
Morville, J., Romanini, D., and Chenevier, M.: WO03031949, Université J. Fourier, Grenoble France, 2003.
Morville, J., Kassi, S., Chenevier, M., and Romanini, D.: Fast, low-noise, mode-by-mode, cavity-enhanced absorption spectroscopy by diode-laser self-locking, Appl. Phys. B, 80, 1027–1038, https://doi.org/10.1007/s00340-005-1828-z, 2005.
Morville, J., Romanini, D., and Kerstel, E.: Cavity Enhanced Absorption Spectroscopy with Optical Feedback, in: Cavity-Enhanced Spectroscopy and Sensing, edited by: Gagliardi, G. and Loock, H.-P., Springer Berlin Heidelberg, 163–209, 2014.
Moyer, E. J., Sayres, D. S., Engel, G. S., St. Clair, J. M., Keutsch, F. N., Allen, N. T., Kroll, J. H., and Anderson, J. G.: Design considerations in high-sensitivity off-axis integrated cavity output spectroscopy, Appl. Phys. B, 92, 467–474, https://doi.org/10.1007/s00340-008-3137-9, 2008.
Phillips, N. G., Ackley, R., Crosson, E. R., Down, A., Hutyra, L. R., Brondfield, M., Karr, J. D., Zhao, K., and Jackson, R. B.: Mapping urban pipeline leaks: methane leaks across Boston, Environ. Pollut., 173, 1–4, https://doi.org/10.1016/j.envpol.2012.11.003, 2013.
Richard, L., Ventrillard, I., Chau, G., Jaulin, K., Kerstel, E., and Romanini, D.: Optical-feedback cavity-enhanced absorption spectroscopy with an interband cascade laser: application to SO2 trace analysis, Appl. Phys. B, 122, 247, https://doi.org/10.1007/s00340-016-6502-0, 2016.
Richard, L., Romanini, D., and Ventrillard, I.: Nitric oxide analysis down to ppt levels by optical-feedback cavity-enhanced absorption spectroscopy, Sensors (Switzerland), 18, 1997, https://doi.org/10.3390/s18071997, 2018.
Romanini, D., Chenevier, M., Kassi, S., Schmidt, M., Valant, C., Ramonet, M., Lopez, J., and Jost, H.-J.: Optical–feedback cavity–enhanced absorptio: a compact spectrometer for real–time measurement of atmospheric methane, Appl. Phys. B, 83, 659–667, https://doi.org/10.1007/s00340-006-2177-2, 2006.
Schmitt, J., Seth, B., Bock, M., and Fischer, H.: Online technique for isotope and mixing ratios of CH4, N2O, Xe and mixing ratios of organic trace gases on a single ice core sample, Atmos. Meas. Tech., 7, 2645–2665, https://doi.org/10.5194/amt-7-2645-2014, 2014.
Varghese, P. L. and Hanson, R. K.: Collisional narrowing effects on spectral line shapes measured at high resolution, Appl. Opt., 23, 2376–2385, 1984.
Wankel, S. D., Huang, Y.-W., Gupta, M., Provencal, R., Leen, J. B., Fahrland, A., Vidoudez, C., and Girguis, P. R.: Characterizing the distribution of methane sources and cycling in the deep sea via in situ stable isotope analysis, Environ. Sci. Technol., 47, 1478–1486, https://doi.org/10.1021/es303661w, 2013.
Werle, P.: Accuracy and precision of laser spectrometers for trace gas sensing in the presence of optical fringes and atmospheric turbulence, Appl. Phys. B, 102, 313–329, https://doi.org/10.1007/s00340-010-4165-9, 2010.