the Creative Commons Attribution 4.0 License.
the Creative Commons Attribution 4.0 License.
 | 20 Jun 2019
A new method to determine the aerosol optical properties from multiple-wavelength O4 absorptions by MAX-DOAS observation
Chengzhi Xing
Shanshan Wang
Qihou Hu
Haoran Liu
Wei Tan
Wenqiang Zhang
Bo Li
Jianguo Liu
Ground-based multi-axis differential optical absorption spectroscopy (MAX-DOAS) observation was carried out from November 2016 to February 2017 in Beijing, China, to measure the O4 absorptions in UV and visible bands and further to illustrate its relationship with aerosol optical properties (AOPs) under different weather types. According to relative humidity, visibility, and PM2.5, we classified the observation periods into clear, light-haze, haze, heavy-haze, fog, and rainy weather conditions. There are obvious differences for measured AOPs under different weather conditions, especially scattering coefficient (σsca) and absorption coefficient (σsca). It was also found that both the O4 differential slant column densities (DSCDs) at the UV and visible bands varied in the order of clear days > light-haze days > haze days > heavy-haze days > fog days. The correlation coefficients (R2) between O4 DSCDs at 360.8 and 477.1 nm mainly varied in the order of clear days > light-haze days > haze days > heavy-haze days. Based on the statistics of O4 DSCDs at an elevation angle 1∘ with the corresponding linear regression between UV and visible bands of segmental periods, the relationships between O4 DSCDs and AOPs were established. It should mainly be clear or light-haze days when the correlation slope is greater than 1.0, with a correlation coefficient (R2) greater than 0.9, and O4 DSCDs mainly greater than 2.5×1043 molec. cm−2. Meanwhile, σsca and σabs are less than 45 and 12 Mm−1, respectively. For haze or heavy-haze days, the correlation slope is less than 0.6, with an R2 less than 0.8, and O4 DSCDs mainly less than 1.3×1043 molec. cm−2, under which σsca and σabs are mainly located at 200–900 and 20–60 Mm−1. Additionally, the determination method was well validated based on another MAX-DOAS measurement at Gucheng from 19 to 27 November 2016. For more precise and accurate inversion of AOPs, more detailed look-up tables for O4 multiple-wavelength absorptions need to be developed. Since the ground surface AOPs were determined using MAX-DOAS observation at a 1∘ elevation in this study, we hope to highlight the potential of retrieved vertical spatially resolved AOPs being expected when multiple elevation angles of MAX-DOAS observation are used together.
Please read the corrigendum first before continuing.
-
Notice on corrigendum
The requested paper has a corresponding corrigendum published. Please read the corrigendum first before downloading the article.
-
Article
(1919 KB)
- Corrigendum
-
Supplement
(255 KB)
-
The requested paper has a corresponding corrigendum published. Please read the corrigendum first before downloading the article.
- Article
(1919 KB) - Full-text XML
- Corrigendum
-
Supplement
(255 KB) - BibTeX
- EndNote


Atmospheric aerosols influence the radiative budget by scattering and absorbing solar radiation directly. They also affect global climate change, cloud formation, regional air quality, and human health (Seinfeld and Pandis, 2006; Kim and Ramanathan, 2008; Karanasiou et al., 2012; Levy et al., 2013; Viana et al., 2014). It is important to obtain comprehensive knowledge on the spatial distributions, temporal variations in aerosol loading, and aerosol optical properties (AOPs). Different aerosol types have different optical properties. For example, black carbon (BC) aerosols are characterized by strong light absorption. Recent studies indicated that it can heat the air and contributes to global warming (Ramanathan et al., 2007; Galdos et al., 2013; Ramana et al., 2010; Fyfe et al., 2013; Allen et al., 2012). It can also change the atmospheric vertical temperature profile, causing variations in the planetary boundary layer (PBL) structure (Ding et al., 2016; Wilcox et al., 2016; Wang et al., 2018). However, dust aerosol and some secondary heterogeneous-reaction aerosols, playing an important role during pollution episodes in China, are mainly based on scattering optical characteristics (Huang et al., 2014; Wang et al., 2018).
Measurements of AOPs, e.g., aerosol extinction coefficient (AEC), aerosol optical depth (AOD), single-scattering albedo (SSA), asymmetry factor, and Ångström exponent (AE), could provide more comprehensive information for a better understanding of the role of aerosols in atmospheric processes. AOD is an important parameter to evaluate the ability of aerosol particles to attenuate the solar radiation, which is defined as the integration of AEC from the surface to the top of atmosphere. The AE is the sum of aerosol scattering and absorption coefficients. Moreover, SSA is defined as the ratio of scattering efficiency to the total extinction, which is the dominant intensive parameter determining aerosol direct radiative forcing. The asymmetric factor is used to evaluate the aerosol forward scattering ability, while the Ångström exponent is a parameter to evaluate the aerosol particle size. Previous measurements of AOPs indicated that different aerosol types (such as biomass burning, urban–industrial, dust, and sea-salt aerosols) exhibit significant differences in optical properties. The differences of the optical properties of these kinds of aerosols are used to clarify the mechanisms of aerosol radiative forcing (Dubovik et al., 2001). For biomass burning aerosol, the Ångström exponent is mainly distributed between 1.1 and 2.1 at wavelength bands of 440–870 nm and SSA mainly ranging from ∼0.88 to 0.99 at 440 nm (Eck et al., 2003; Bergstrom et al., 2007; Weinzierl et al., 2017). The SSA of urban–industrial aerosol tends to be ∼0.95 in cleaner conditions and ∼0.85 in industrial conditions (Liousse et al., 1996; Remer and Kaufman, 1998; Garland et al., 2009; He et al., 2009; Shen et al., 2018). Dust exhibits a SSA of ∼ 0.92 to 0.93 in the blue spectral range at 440 nm, but ∼0.96–0.99 in wavelengths greater than 550 nm (Kaufman et al., 2001; Dubovik et al., 2001; Bergstrom et al., 2007; Weinzierl et al., 2017). The SSA in oceanic aerosol is mainly greater than 0.97 due to sea salt and water-soluble particles with high relative humidity (Tanré et al., 1999; Dubovik et al., 2001; Hess et al., 1998; Eck et al., 2005).
Multi-axis differential optical absorption spectroscopy (MAX-DOAS) remote sensing is an effective tool for atmospheric aerosol measurements based on O4 molecular ultraviolet–visible light absorption (Platt and Stutz, 2008). O4 is the collision complex of O2 and its concentration is proportional to the square of the O2 concentration. Due to the vertical O4 profile being well known and nearly constant, it can be used as an indicator for the atmospheric distribution photon paths due to its nearly constant characteristics (Wagner et al., 2004; Frieß et al., 2006, 2016). The O4 cross sections exhibit four main absorption bands in the UV–visible region around 360.8, 477.1, 577.1, and 630.8 nm (Thalman and Volkamer, 2013). By collecting the scattered sunlight spectra at zenith and different elevation angles closed to the horizon by MAX-DOAS, the O4 absorptions in four bands (338–370, 425–490, 540–588, and 602–645 nm) can be estimated, and aerosol vertical profiles can be further derived (Honninger and Platt, 2002; Hytch et al., 2003; Hönninger et al., 2004; Wagner et al., 2004; Wittrock et al., 2004; Clémer et al., 2010). The sunlight at different wavelength bands has different abilities to traverse the atmosphere; thus the light path length at different wavelength bands is diverse, which can change the corresponding O4 absorptions. Conversely, the correlation analysis between O4 absorptions retrieved at UV range and visible range could also provide information about the impacts of aerosol scattering on photon paths (Lee et al., 2011). Besides the extinction coefficient profile and AOD, there are no previous detailed studies on the other AOPs' retrieval based on MAX-DOAS measurements.
In this paper, we try to establish a new method to determine several different aerosol optical properties from multiple-wavelength O4 absorptions observed by MAX-DOAS measurement. The measurement of UV and visible O4 absorptions was performed by a MAX-DOAS instrument in Beijing from November 2016 to February 2017. Combining the O4 absorptions and measured AOPs, some empirical relationships between them can be found under different weather conditions, which are fundamental to determine the AOPs from MAX-DOAS-observed O4 absorptions at different wavelength bands. Furthermore, another short measurement campaign was used to validate the feasibility and reliability of the new method to infer the AOPs under different weather conditions based on the O4 absorptions.
2.1 The MAX-DOAS measurements
The MAX-DOAS instrument was installed on the roof of the Chinese Academy of Meteorological Sciences building (CAMS, 39.9475∘ N, 116.3273∘ E) for continuous measurements of O4 absorptions from November 2016 to February 2017. The MAX-DOAS instrument consists of three major parts: a telescope unit, two spectrometers with temperature stabilized at 20∘, and a computer acting as the controlling and data acquisition unit. The viewing elevation angle of the telescope is controlled by a stepping motor. Scattered sunlight collected by the telescope is redirected by a prism reflector and a quartz fiber bundle to the spectrometers. Two spectrometers (Acton Spectrapro 300i Czerny-Turner optical spectrometer) are used to cover both the UV (300–460 nm) and visible (400–560 nm) wavelength ranges. The full width at half maximum (FWHM) spectral resolutions of these two spectrometers are all 0.6 nm, or 7.2 detector pixels. Moreover, the optical spectrometer is equipped with a charge-coupled device (CCD) detector camera (model DU 440-BU) with 2048 pixels. The field of view (FOV) of the instrument is estimated to be less than 0.3∘.
A full measurement scanning sequence consists of 11 elevation angles, i.e., 1, 2, 3, 4, 5, 6, 8, 10, 15, 30, and 90∘. The instrument azimuth angle is 138∘ and the exposure time is fixed to 60 000 ms for each elevation angle measurement. A full measurement sequence takes about 11 min. Dark current and offset spectra were measured by blocking incoming light using a mechanical shutter and were subtracted from the measurement spectra before spectral analysis. The routine measurements were continuously repeated as long as the solar zenith angle (SZA) was lower than 80∘.
2.2 O4 absorptions in UV and visible ranges
The O4 absorptions were derived in the fitting windows of 339 to 387 nm in the UV range and 425 to 490 nm in the visible spectral interval. The measured spectra were analyzed using the QDOAS software developed by BIRA-IASB (http://uv-vis.aeronomie.be/software/QDOAS/, last access: 16 June 2019). The corresponding zenith spectrum was taken as a reference spectrum for off-zenith elevation angles during each measurement scan. The DOAS fitting generates the differential slant column density (DSCD) of O4 between the measured spectra and reference spectrum. Details of DOAS fit settings are listed in Table 1. We used corrected I0 (Aliwell et al., 2002). Figure 1 shows a typical DOAS retrieval for the O4 absorptions at 360.8 and 477.1 nm. Afterwards, DOAS fit results with a root mean square (rms) larger than were filtered out, and about 99.07 % of all O4 measurements remained for further discussion.
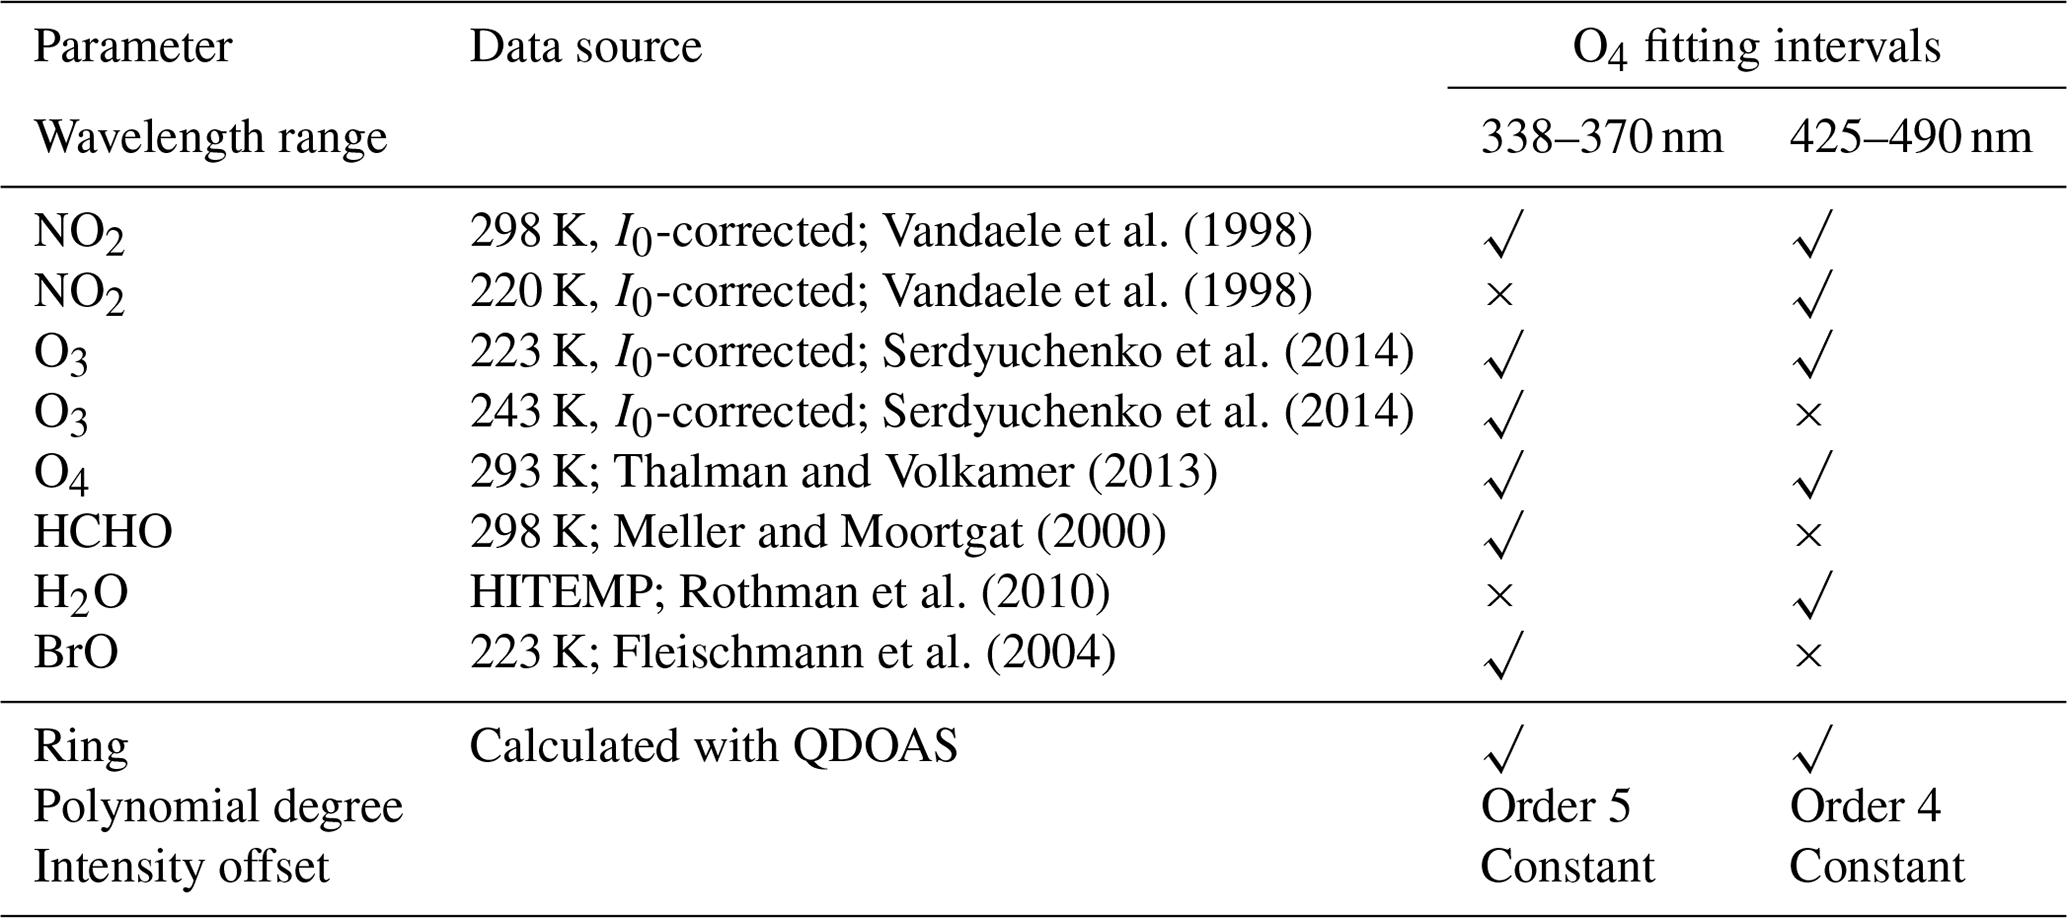
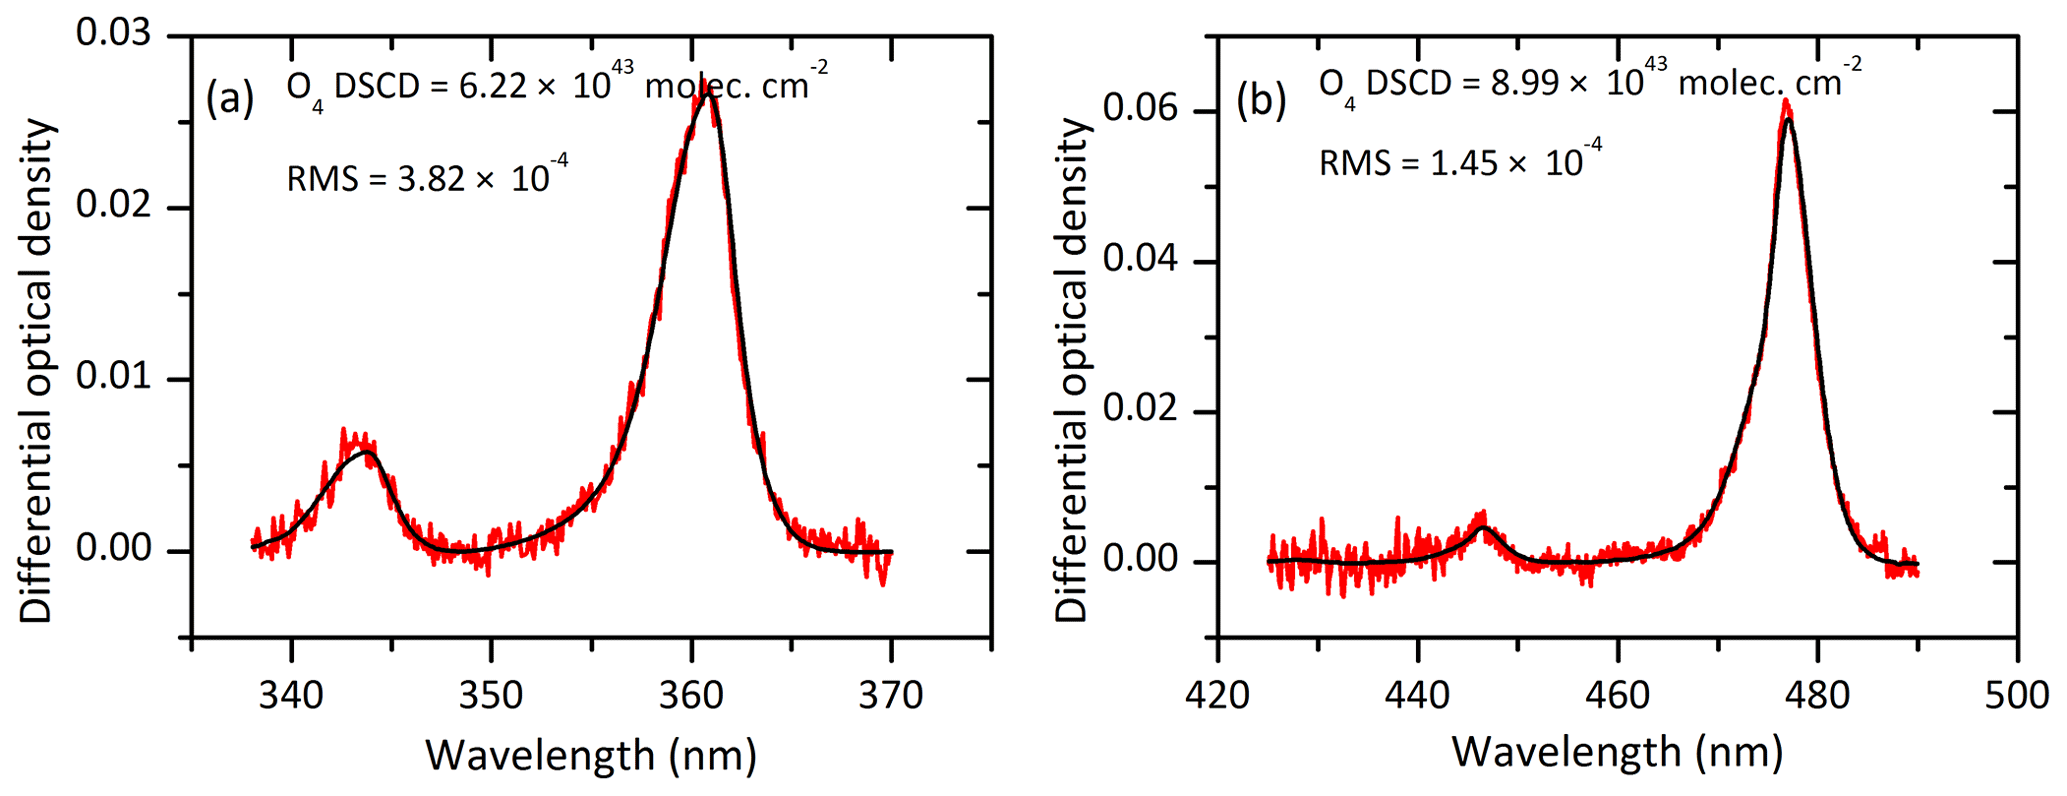
Figure 1Typical DOAS spectral fittings for O4 absorptions in the (a) UV and (b) visible bands. Black lines represent the absorption signal and the red lines represent the sum of the absorption signal and the fit residual.
2.3 Ancillary data
Quality-assured level 2.0 sun photometer AODs, asymmetric factor, and Ångström exponent at the Beijing_CAMS AERONET site (http://aeronet.gsfc.nasa.gov/, last access: 16 June 2019) were employed, which is collocated with the MAX-DOAS instrument just 2 m away. A sun photometer (CE-318) collects direct sunlight about every 15 min during non-rainy daytime hours. These aerosol optical parameters at multiple wavelengths were normalized to 450 nm according to Wang et al. (2016). In addition, the scattering coefficients (σsca) were measured at three wavelengths (λ= 450, 520, and 700 nm) using an integrating nephelometer (Aurora 4000, Ecotech) at Peking University Urban Atmosphere Environment Monitoring Station (PKUERS, 39.9892∘ N, 116.3069∘ E). The absorption coefficients (σabs) were measured using a seven-wavelength Aethalometer (AE-31, Magee Scientific) at λ=370, 470, 520, 660, 880, and 950 nm also located at PKUERS. Both σsca and σabs have the temporal sampling resolution of 5 min. In order to ensure the accuracy of the data, the corrections for σsca and σabs were used as referred to in Shen et al. (2018). The SSA was calculated by the measured σsca at 450 nm and estimated σabs at 450 nm using the following equation:
The visibility and the relative humidity (RH) information were collected from the weather history data at Beijing international airport (http://www.wunderground.com/, last access: 16 June 2019) about 26 km from CAMS. In situ data of PM2.5 concentrations were obtained from Guanyuan station (39.9425∘ N, 116.3610∘ E), belonging to the national environmental monitoring network (http://beijingair.sinaapp.com/, last access: 16 June 2019), which is about ∼2 km from the CAMS site. All these data are normalized to hourly averages for further discussion.
3.1 Wintertime aerosol optical properties
The time series of PM2.5 concentrations, σsca, σabs, SSA, AOD, Ångström exponent, asymmetry factor, and the corresponding meteorological data, i.e., RH and visibility, from November 2016 to February 2017 are presented in Fig. 2. The typical meteorological conditions of high RH and low visibility coincided with significantly high PM2.5 concentration and high AOD. As indicated in the gray areas of Fig. 2, two episodes of particulate pollution during 15 to 22 December 2016 and 29 December 2016 to 2 January 2017 were identified.
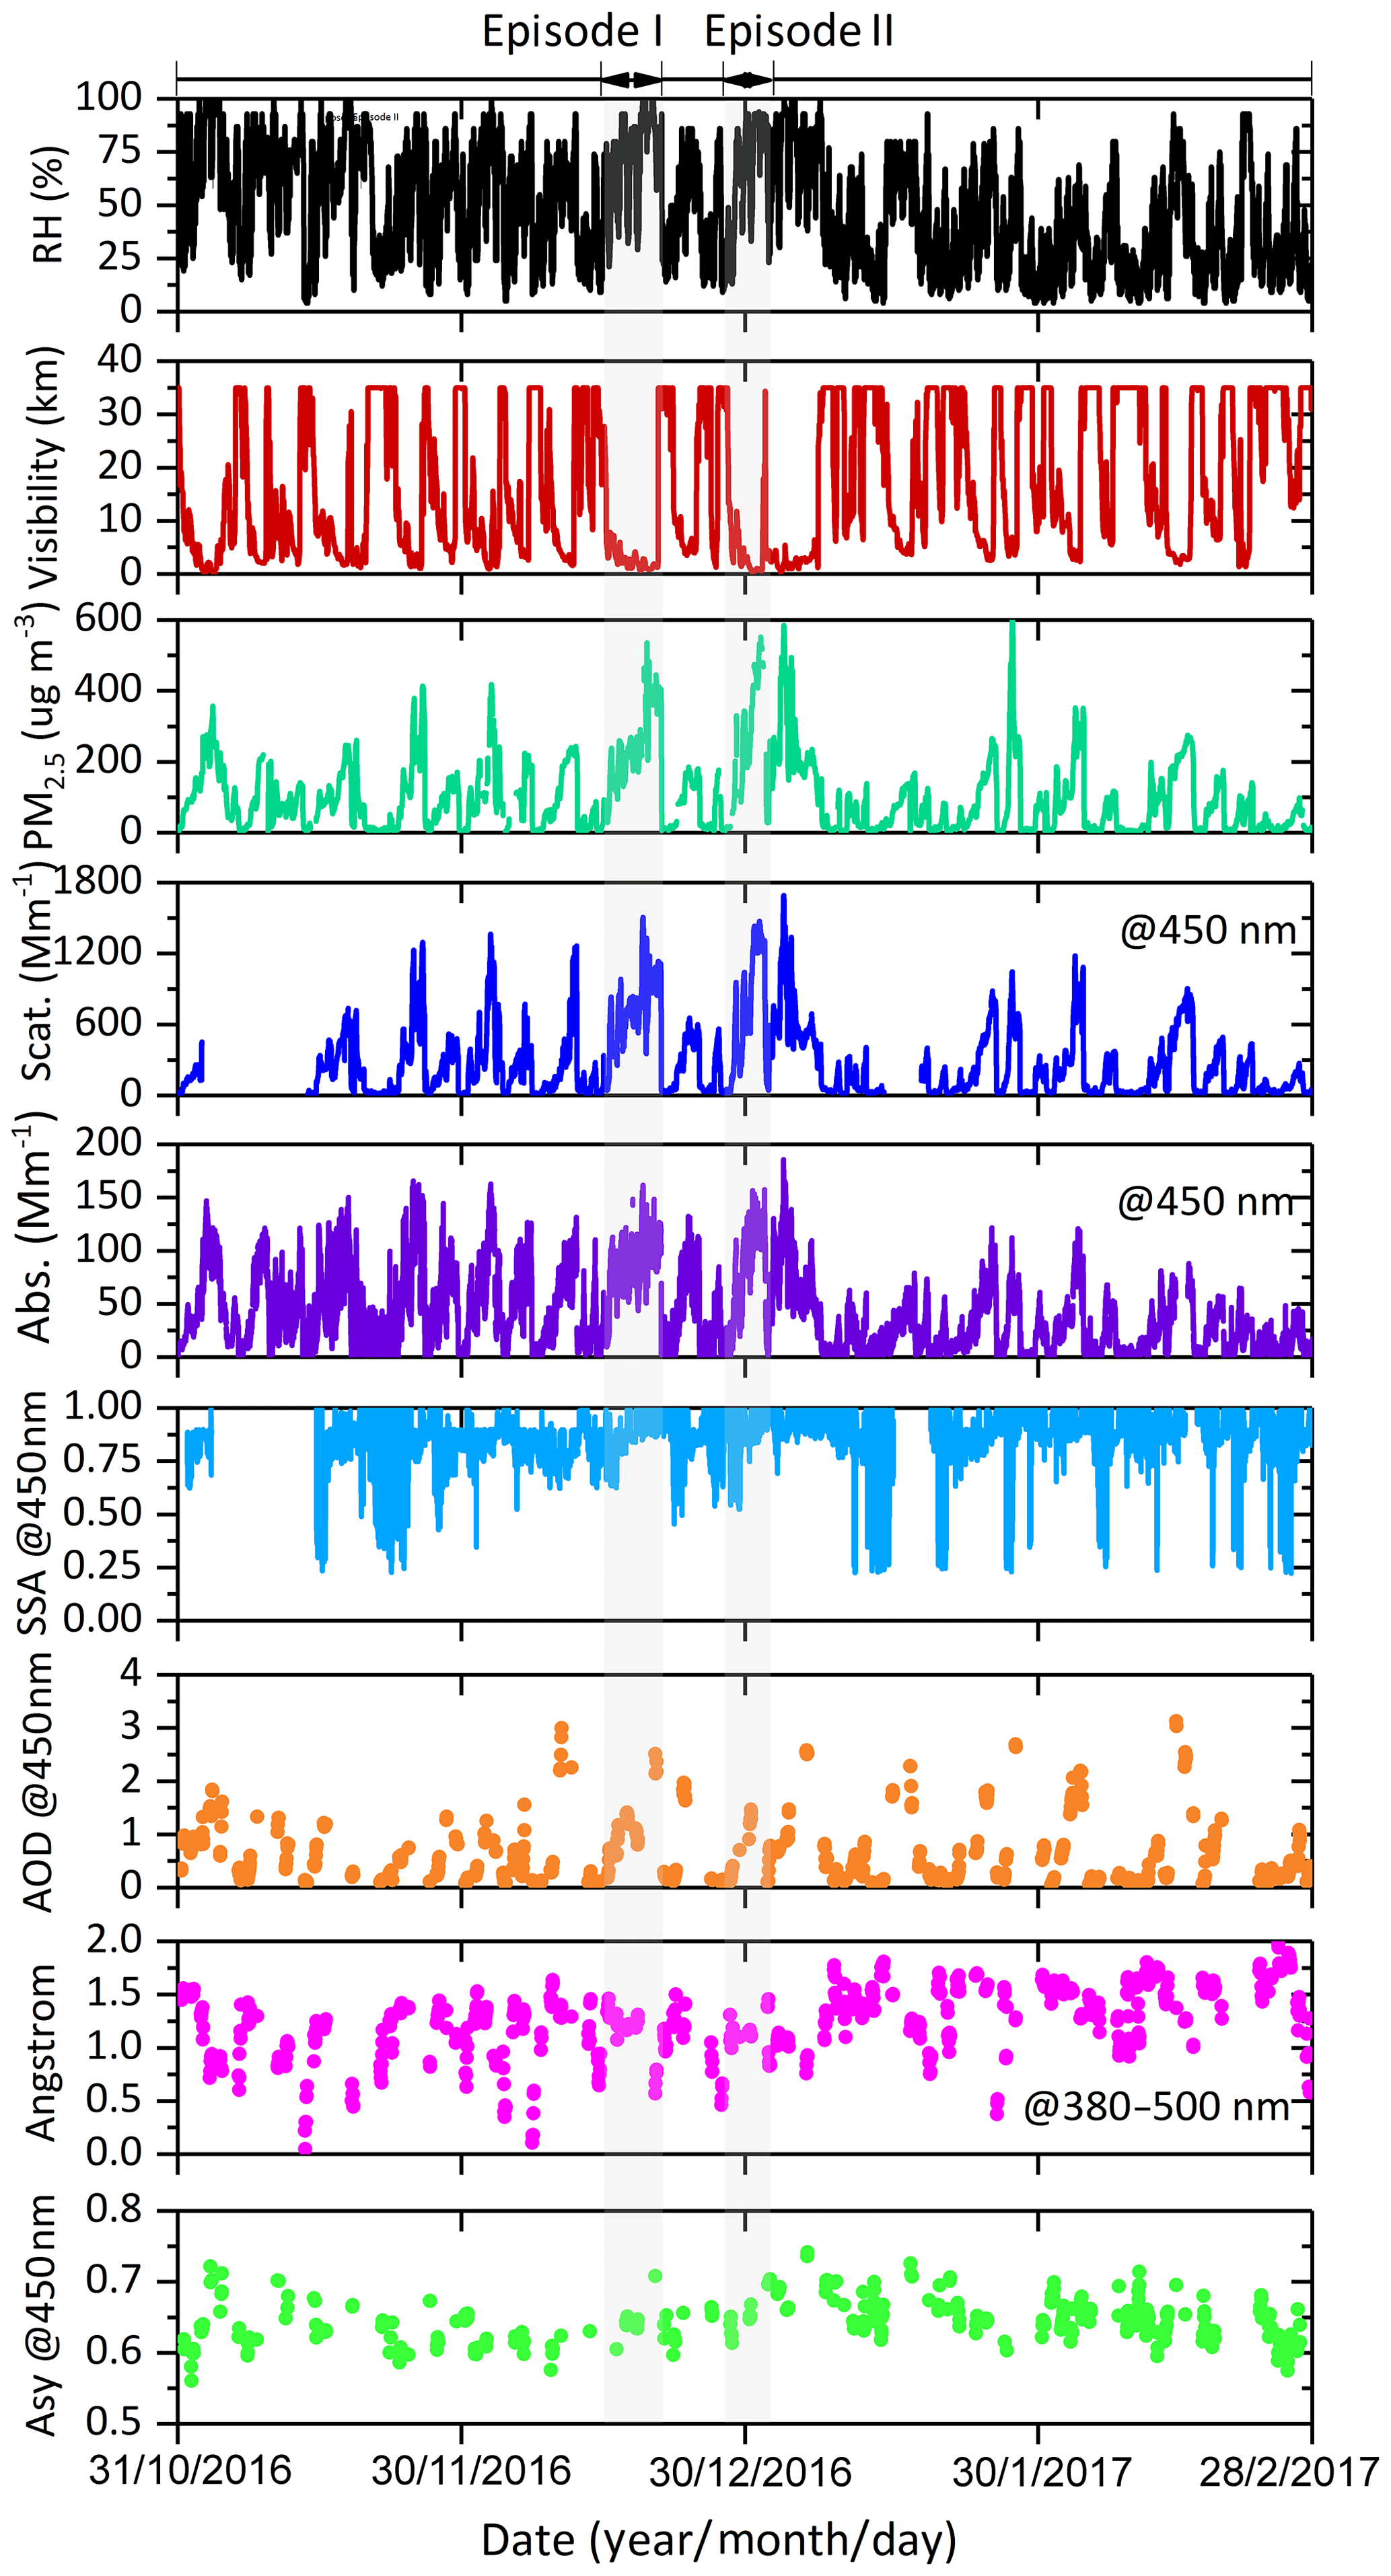
Figure 2Time series of PM2.5 and AOPs (σsca, σabs, SSA, AOD, Ångström exponent, and asymmetry factor) and meteorological parameters (relative humidity and visibility) during the observation in Beijing from November 2016 to February 2017.
During these two episodes, PM2.5 concentrations, σsca, and σabs typically increased and remained at a high level for several days; however, they decrease sharply to a lower value within a shorter period. PM2.5 concentrations, σsca, and σabs increased to exceed the maximum values 465 µg cm−3, 1331.151, and 123.402 Mm−1 within 1–3 h (with increments up to 200 µg cm−3, 600, and 100 Mm−1) during episode I, respectively. In episode II, the maximum values of PM2.5 concentrations, σsca, and σabs are 585 µg cm−3, 1473.523 and 153.431 Mm−1, respectively. In addition, SSA mainly remained over 0.85 during the entire wintertime; except it was observed to be less than 0.8 in late November 2016 and several days during January and February 2017. Generally, the high values of SSA were always accompanied by the peak of PM2.5 concentrations, which suggests that the scattering properties of atmospheric aerosols were enhanced during the explosive increase stage of particle concentrations. Meanwhile, it is also associated with the decrease in Ångström exponent and the increase in asymmetry factors simultaneously. This is typically related to the particle size growth process (Guo et al., 2014; Yu et al., 2011, 2016).
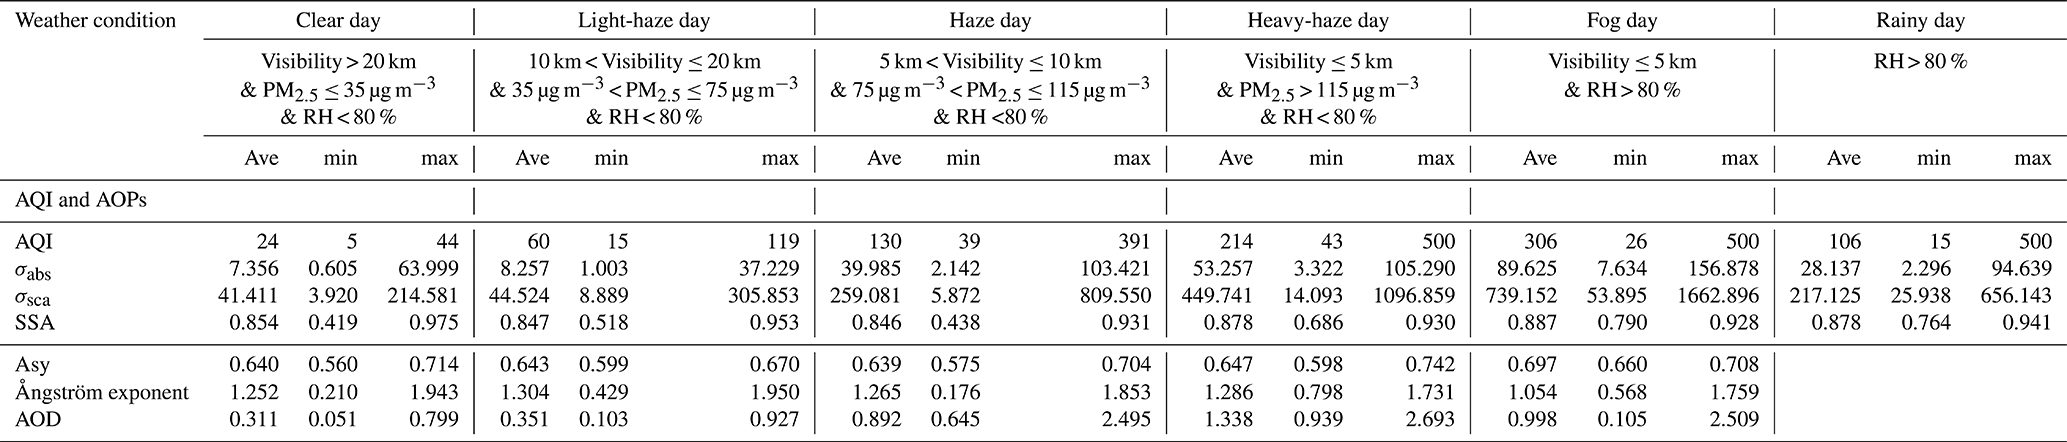
In order to investigate the AOPs under different weather conditions, we classified observation periods of these 4 months into six scenarios according to the RH, visibility, and PM2.5 concentration: Clear days (visibility > 20 km, PM2.5 ≤ 35 µg m−3 , and RH < 80 %), light-haze days (10 km < visibility ≤ 20 km, 35 µg m−3 < PM2.5 ≤ 75 µg m−3, and RH < 80 %), haze days (RH ≤ 80 %, 5 km < visibility ≤ 10 km, and 75 µg m−3 < PM2.5 ≤ 115 µg m−3), heavy-haze days (RH ≤ 80 %, visibility ≤ 5 km, and PM2.5 > 115 µg m−3), fog days (RH > 80 % and visibility ≤ 5 km), and rainy days (Zheng et al., 2015; Duan et al., 2016). As expected, the AOPs showed distinct characteristics during these different weather conditions. Table 2 summarizes the statistics of air quality index (AQI) and AOPs under the six scenarios. AQI is a factor to comprehensively evaluate the air quality, which is based on six pollutants of ambient O3, NO2, CO, SO2, PM10, and PM2.5.
With the increase in pollution level indicated by AQI (except fog and rainy days), AOD increased dramatically from 0.311 under clear days to 1.338 on heavy-haze days. There are no obvious changes for σsca and σabs between clear days and light-haze days. Nevertheless, the σsca increased sharply from light-haze days to heavy-haze days with the averaged value from 44.524 to 449.741 Mm−1. The averaged value of σabs is 8.257 Mm−1 in light-haze days and it increased as much as 5 times on heavy-haze days. Moreover, the averaged SSA was about 0.847 on light-haze days and similar to that on haze days, but it increased about 3.53 % from haze days to heavy-haze days with averaged values of 0.846 to 0.878. This suggests that the aerosol scattering and absorption abilities have changed but the ratio of scattering to extinction changed slightly as the processes of particle pollution became severe. No obvious variations in Ångström exponent were observed among clear days to heavy-haze days, but it decreased by about 2.83 % on fog days. In a previous study, the Ångström exponents were usually higher than 0.80 when AOD was greater than 0.60 in Beijing, which reveals the major contribution of small particles to higher aerosol loading (Che et al., 2015). However, our study demonstrates that small particles made a major contribution to the aerosols throughout the whole winter in Beijing. The obvious decrease in Ångström exponent on fog days is attributed to the increase in water vapor in particles. In addition, the averaged asymmetry factor was about 0.697 on fog days and 8.52 % higher than for other weather conditions. This indicates the increased forward scattering on fog days (Yoon and Kim, 2006).
Table 2Statistics of AQI and several aerosol optical properties under different weather conditions.
3.2 UV and visible O4 absorptions under different weather conditions
Figure 3 shows the examples of diurnal pattern and the corresponding correlation of UV and visible O4 DSCDs (elevation angle = 1∘) at 360.8 and 477.1 nm under five different weather conditions, except for the rainy days. In view of the absolute strength of O4 absorption, both the O4 DSCDs in the UV and visible bands varied in the order of clear days > light-haze days > haze days > heavy-haze days > fog days. This shows the dependency of O4 absorption on the scattering sunlight path impacted by the aerosol loading. Moreover, O4 DSCDs at 477.1 nm are obviously higher than at 360.8 nm on clear and light-haze days, and slightly larger than that at 360.8 nm on haze and heavy-haze days, which can be explained by the fact that the observable light path length in the visible range is longer than in the UV range. Even in UV bands, the observed O4 DSCDs at 353 nm were reported to be lower than those at 380 nm for most of the elevations under haze conditions during winter in Beijing (Lee et al., 2011). This phenomenon revealed that O4 absorptions in the short wavelength range were more significantly affected by light diffusion under hazy conditions. However, we found there are no obvious differences between O4 DSCDs at 360.8 and 477.1 nm on fog days, during which the high contents of water vapor decreased the visibility and the atmospheric absorption paths from the UV to visible ranges.
We further analyzed the relationship of O4 absorptions between the UV and visible bands. As shown in the right column of Fig. 3, the correlation coefficient (R2) of O4 DSCDs between 360.8 and 477.1 nm varied in the order of clear days > light-haze days > haze days > heavy-haze days. Strong correlation between UV and visible O4 absorptions (R2 > 0.9) was achieved for clear and light-haze days. Under haze and heavy-haze conditions, R2 was 0.81 and 0.74, respectively, which is much lower than that on clear and light-haze days. That is because the increase in light-absorbing and light-scattering aerosols can more obviously result in reduced light path lengths in shorter wavelength bands than longer wavelength bands during haze and heavy-haze days.
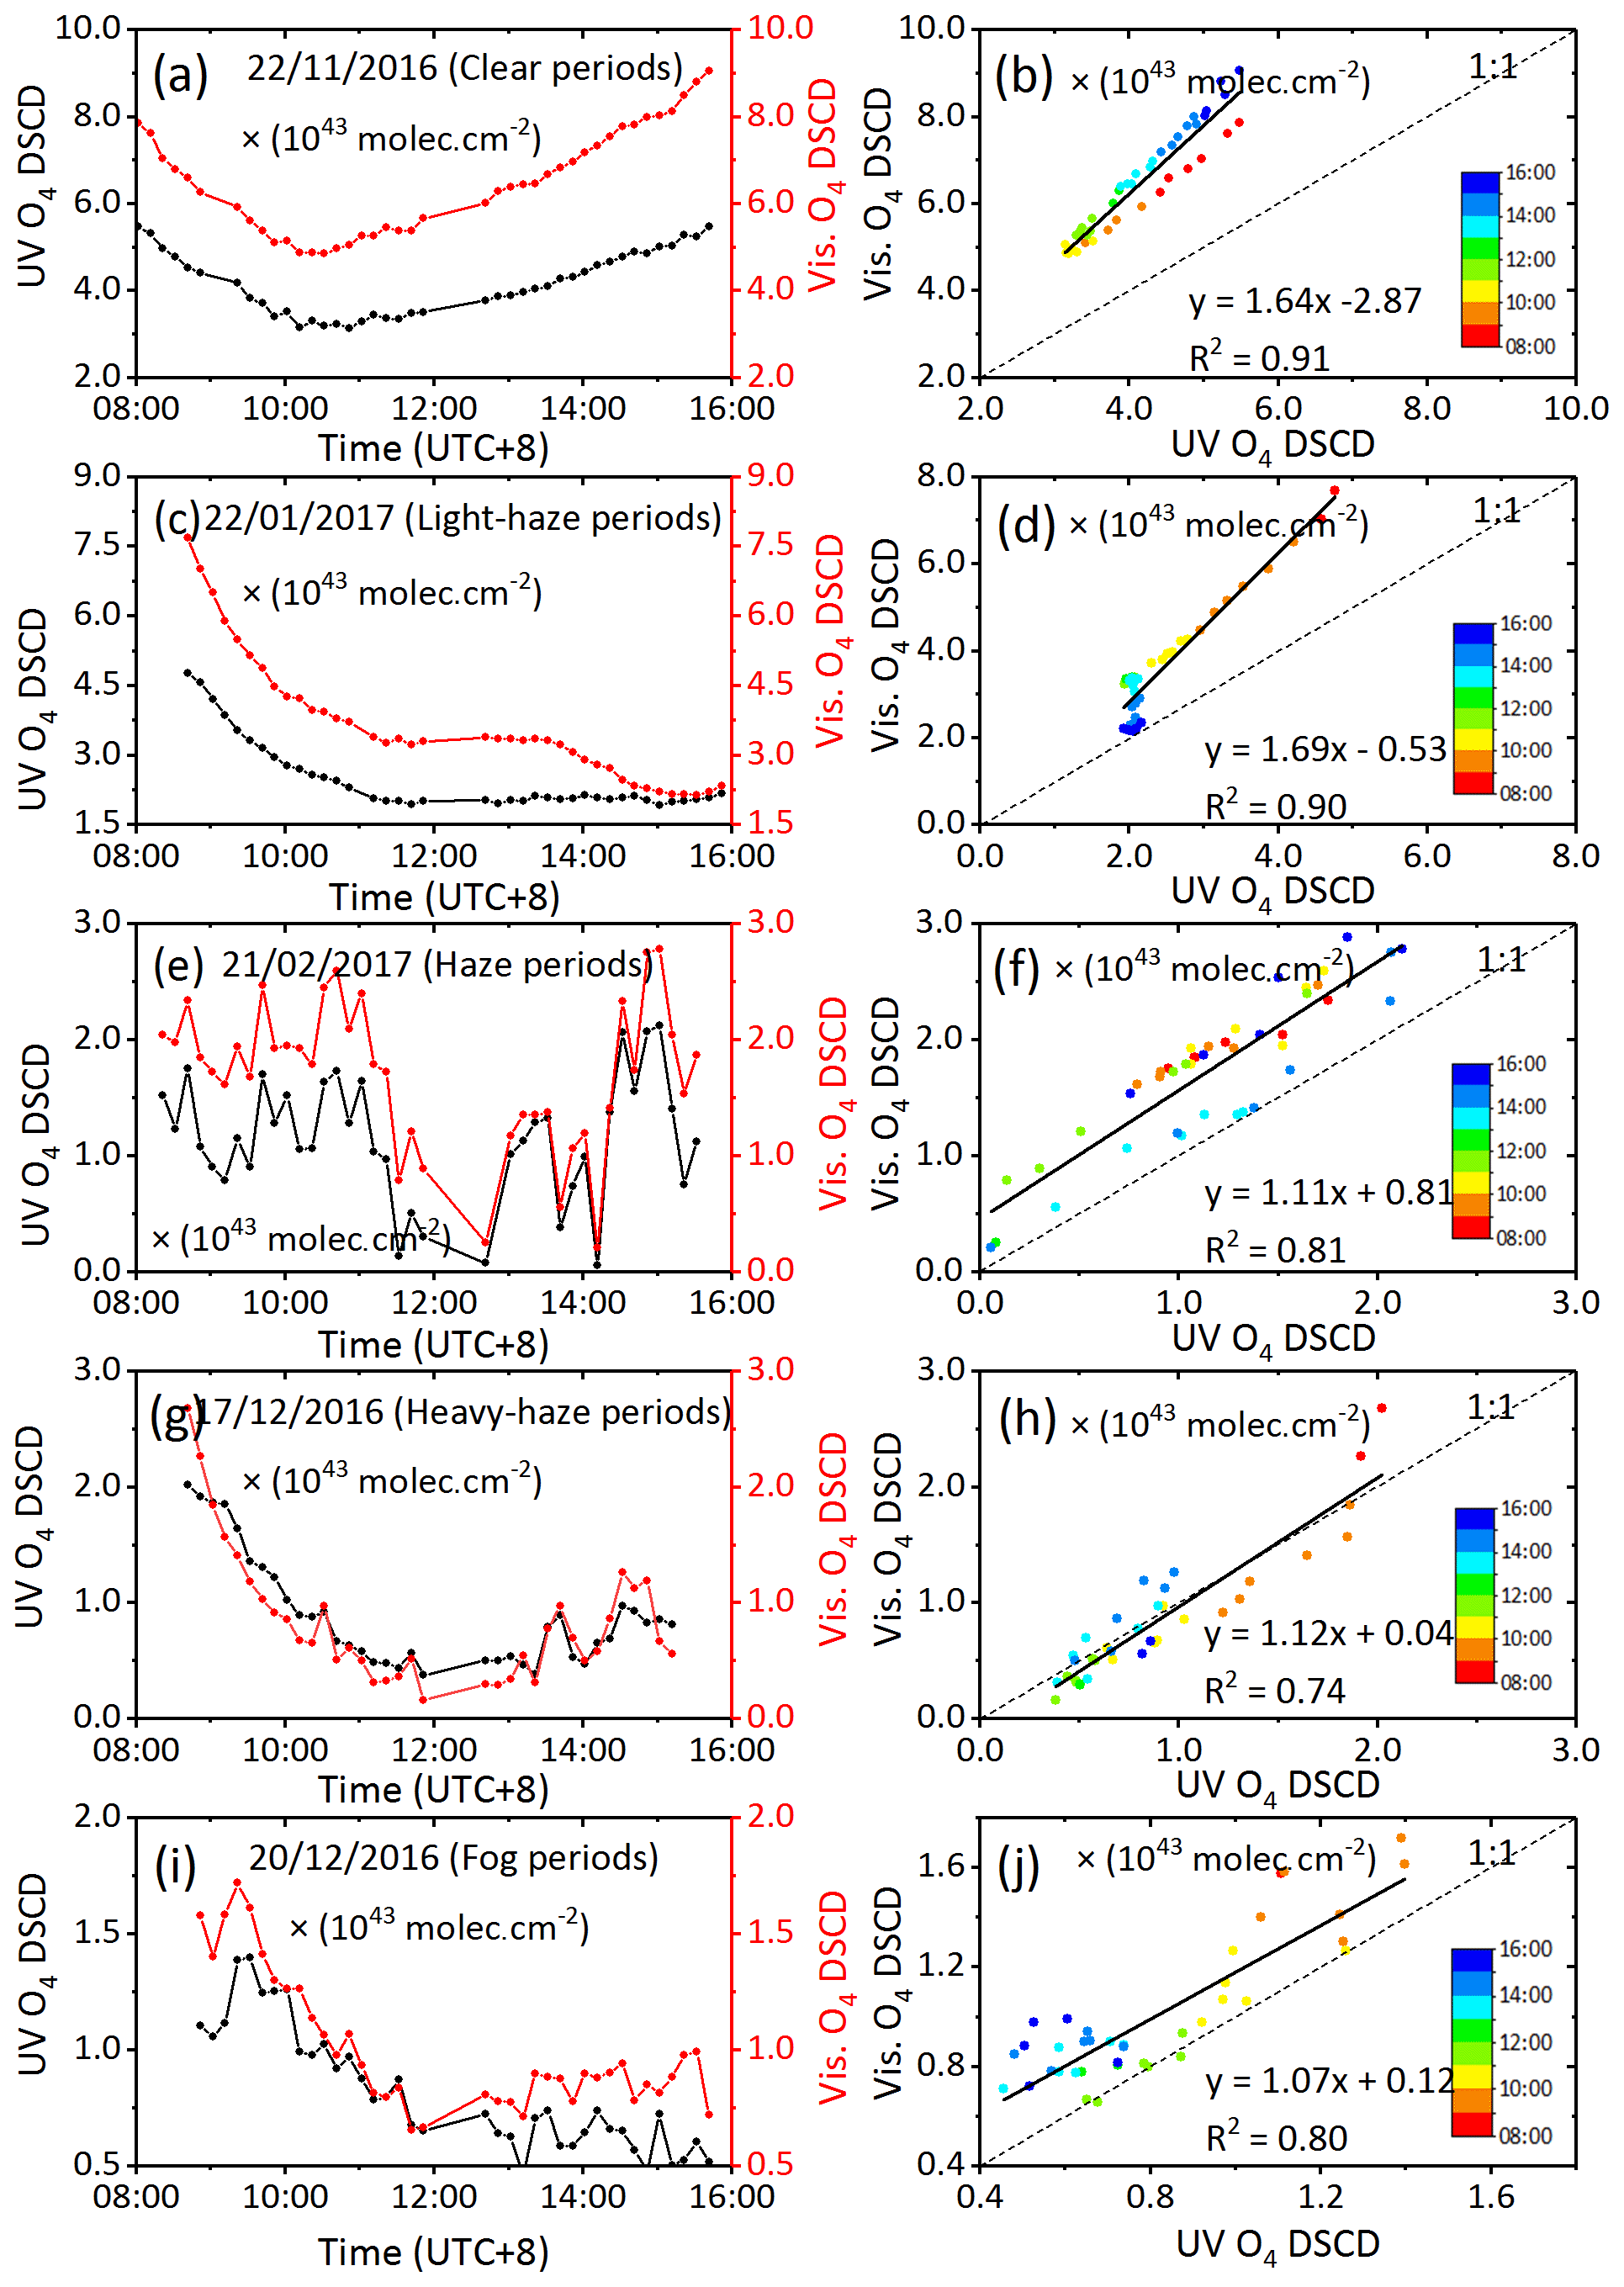
Figure 3Diurnal variation and correlation analysis of O4 DSCDs at 360.8 and 477.1 nm under different weather conditions: (a) and (b) clear day, (c) and (d) light-haze day, (e) and (f) haze day, (g) and (h) heavy-haze day, (i) and (j) fog day. The color bar represents the time sequence.
The changes in AOPs, especially aerosol scattering and absorption properties, are mainly manifested in the variations in O4 absorptions at different wavelength bands. The correlation information of O4 DSCDs at different bands will also be affected by the variation in AOPs. For more details, i.e., 21 February 2017, was chosen to exhibit the influence of AOP changes on O4 DSCDs in Fig. 4. Comparing Fig. 4a to b, it can be found that σsca and σabs have similar variation trends; a slight turning and an abrupt decrease occurred at ∼ 09:05 and ∼ 12:00 (UTC+8 for all times throughout) (especially for σsca), respectively, while the time-indicated O4 DSCDs seem to be three segments with a higher correlation coefficient divided by the breaks at 10:00 and 12:00.
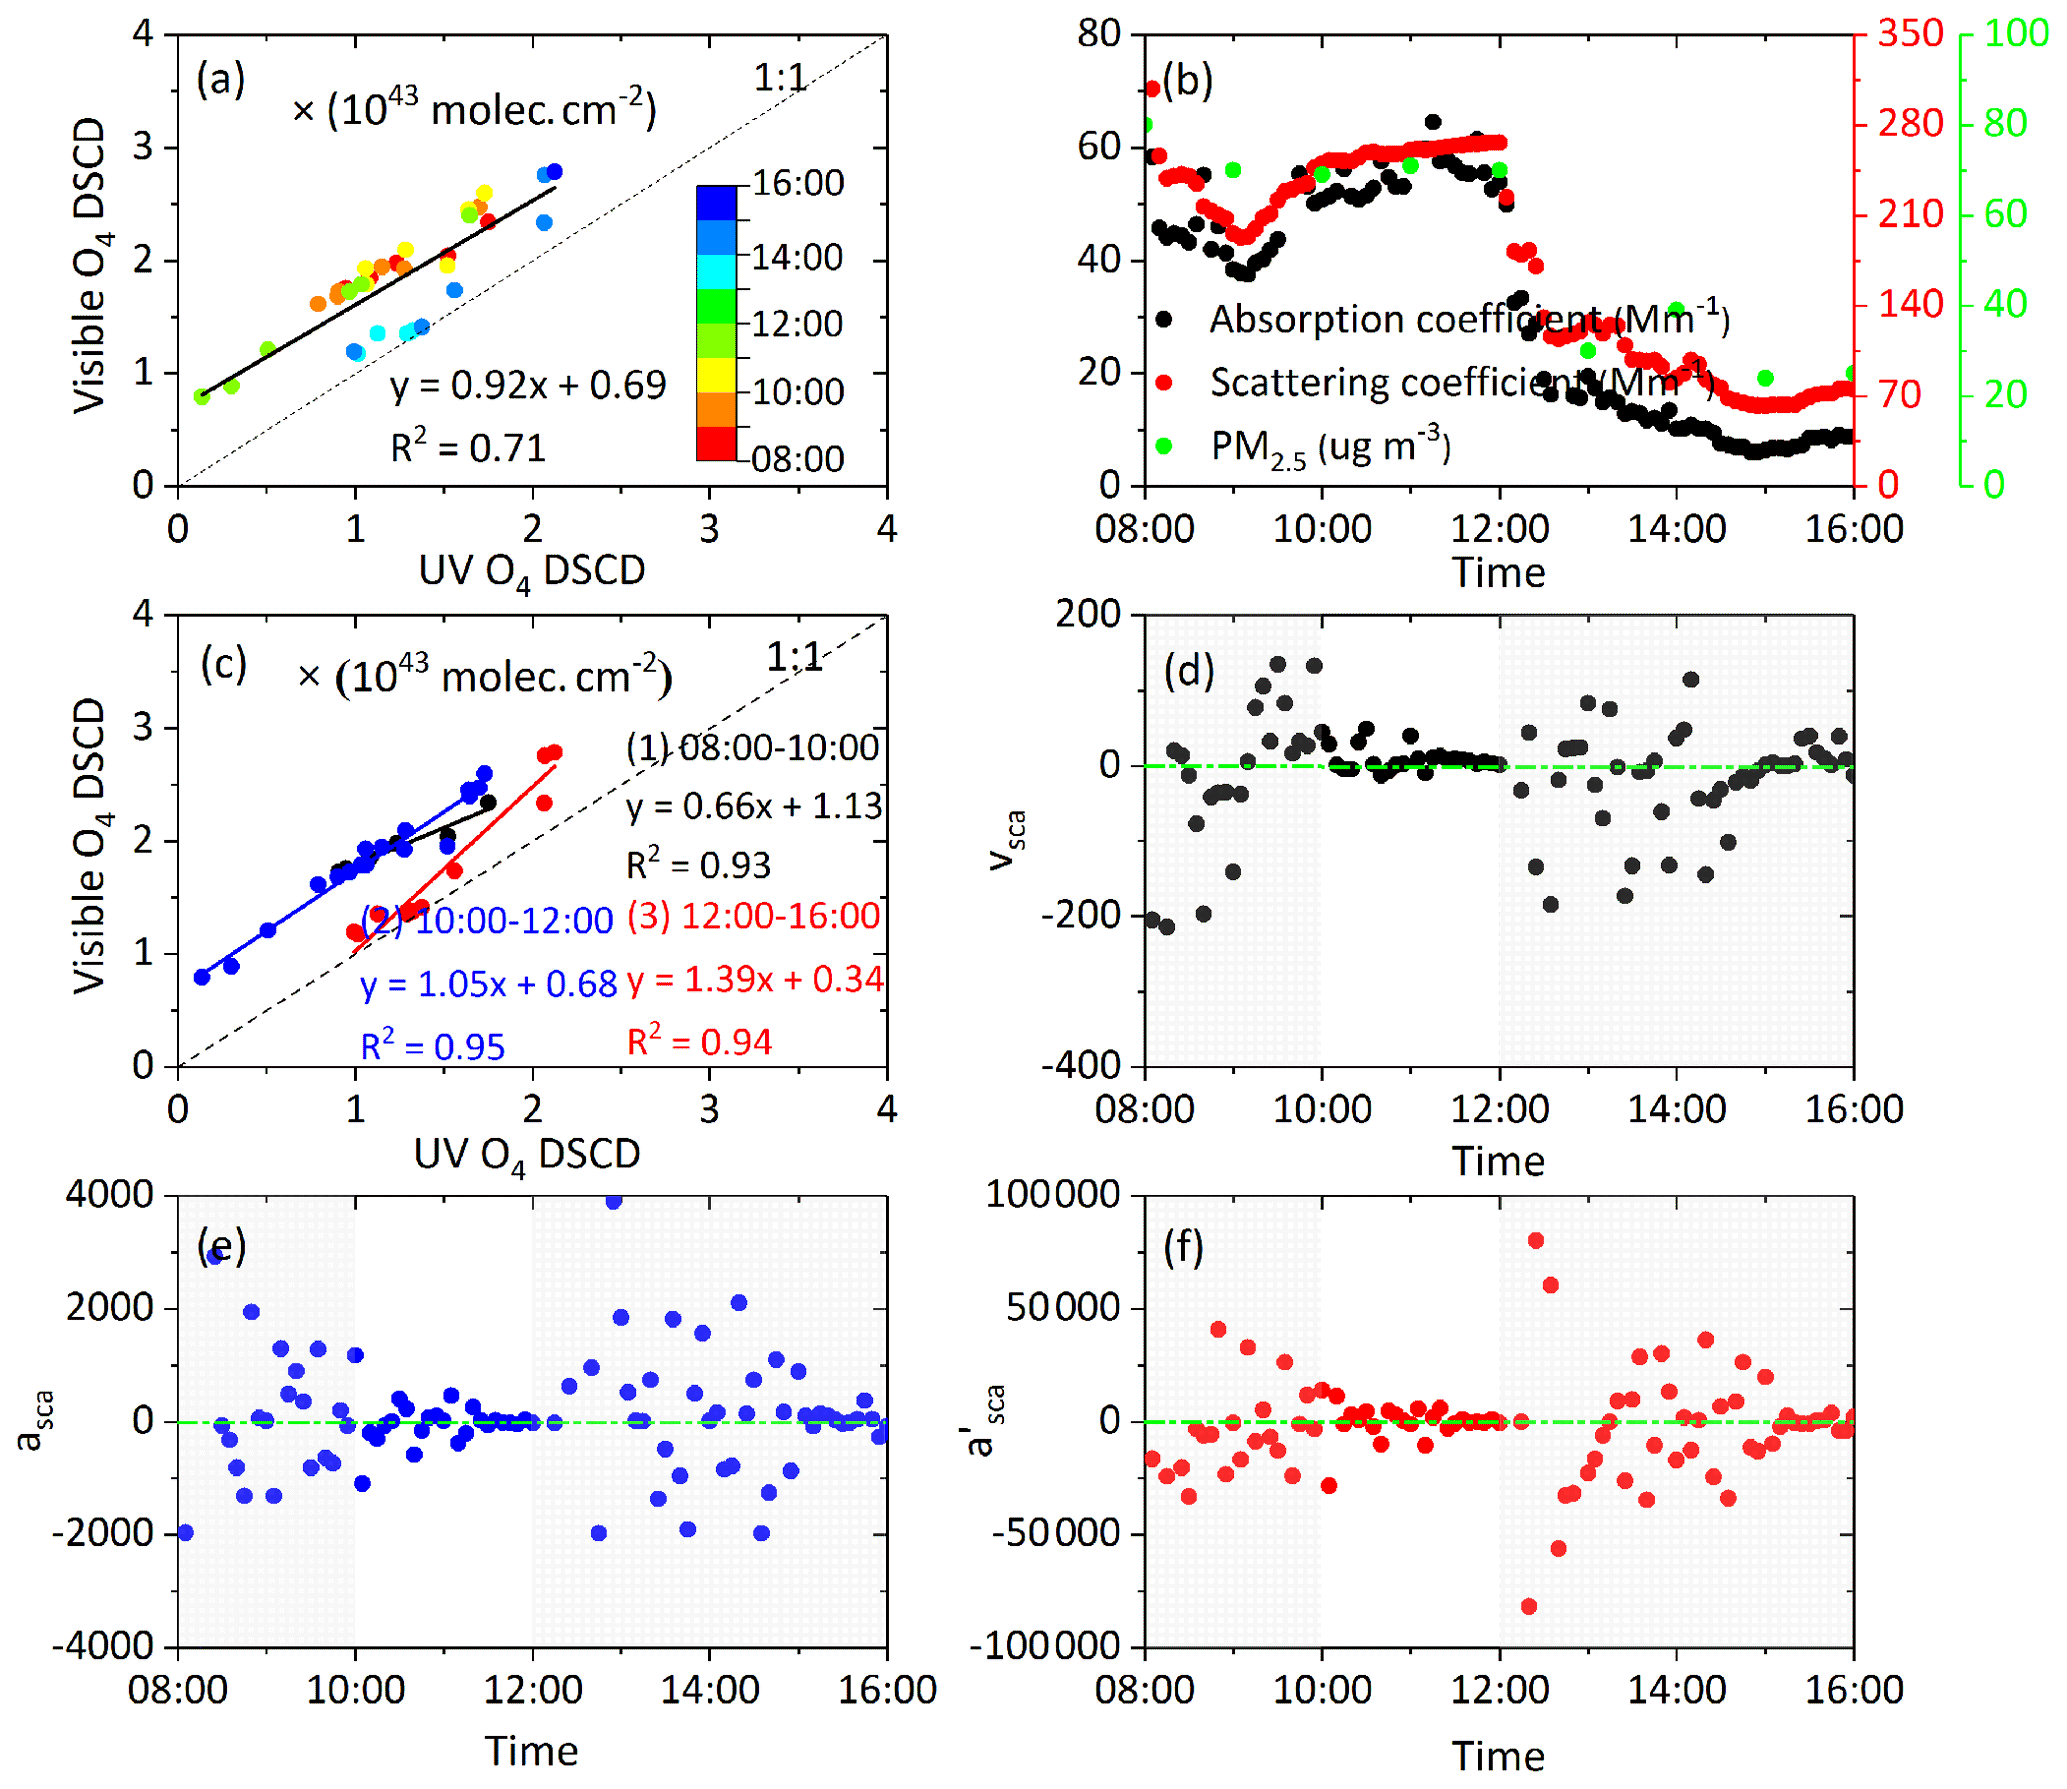
Figure 4An example day on 21 February 2017: (a) the correlations between O4 DSCDs at 360.8 and 477.1 nm. The color bar represents time sequence. Panel (b) shows the time series of aerosol scattering and absorption coefficients. The correlation information between O4 DSCDs at 360.8 and 477.1 nm at 08:00–10:00, 10:00–12:00, and 12:00–16:00 on 21 February 2017 is shown in (c). Panels (d) to (f) show the time series of vsca, asca, and of scattering coefficients, respectively.
In order to explore the relationship between the O4 DSCDs at different wavelength bands and the variations in σsca and σabs, we defined the change speed (vsca), acceleration (asca), and change rate of acceleration () of σsca (Fig. 4b, e, and f) as the following three equations.
Accordingly, the relevant time series of vsca, asca, and are displayed in Fig. 4d to f. In this case, we can find two time break points, defined as t1 and t2 (t1= 10:00 and t2= 12:00), at which σsca and σabs have significant variations based on the calculated vsca, asca, and . In addition, we found the indicator of can describe the specific moment of change (increasing or decreasing) in σsca more clearly than vsca and asca in this case. and are all higher than 20 000.
Consequently, the O4 DSCDs at 360.8 and 477.1 nm can be divided into three segments for the periods of 08:00–10:00, 10:00–12:00, and 12:00–16:00 and the correlation between UV and visible O4 DSCDs was further analyzed individually. As shown in Fig. 4c, the R2 during 08:00–10:00 and 10:00–12:00 is obviously larger than that of all day in Fig. 4a; however, it is smaller for the segment of 12:00–16:00. Moreover, there were huge divergences among the correlation slopes among these three segments due to the change in aerosol scattering and absorption properties. Therefore, it can be concluded that the diurnal variations in O4 DSCDs provide the information of the light path length impacted by aerosol loading. Further, the varied relationship between O4 DSCDs at UV and visible ranges implies change in the aerosol scattering and absorption properties.
Using the method discussed above, we have defined the time break points with aerosol property changes and further classified the observations into several segmental periods with the criteria of |vsca| > 1000, |asca| > 10 000, or > 20 000. The summary of time break points and corresponding change speed (vsca), acceleration (asca), and change rate of acceleration () of σsca are listed in Table S1 in the Supplement.
3.3 Implications of O4 absorptions for aerosol optical properties
In order to derive the aerosol optical properties from multiple-wavelength O4 absorptions, the complete 4 months of observational O4 and AOPs data were used for discussion under different weather conditions. Hourly data of O4 DSCDs were divided into five weather conditions and made the linear regression between UV and visible O4 DSCDs. In total, there were about 218 segments (776 h in 97 d), including 67, 31, 61, 44, and 15 segments for clear, light-haze, haze, heavy-haze, and fog days, respectively. Figure 5 illustrates the statistics of O4 DSCDs in UV and visible bands, and the slope and R2 of correlation analysis between them, as well as the O4 DSCD ratio of UV to visible bands for different weather conditions.
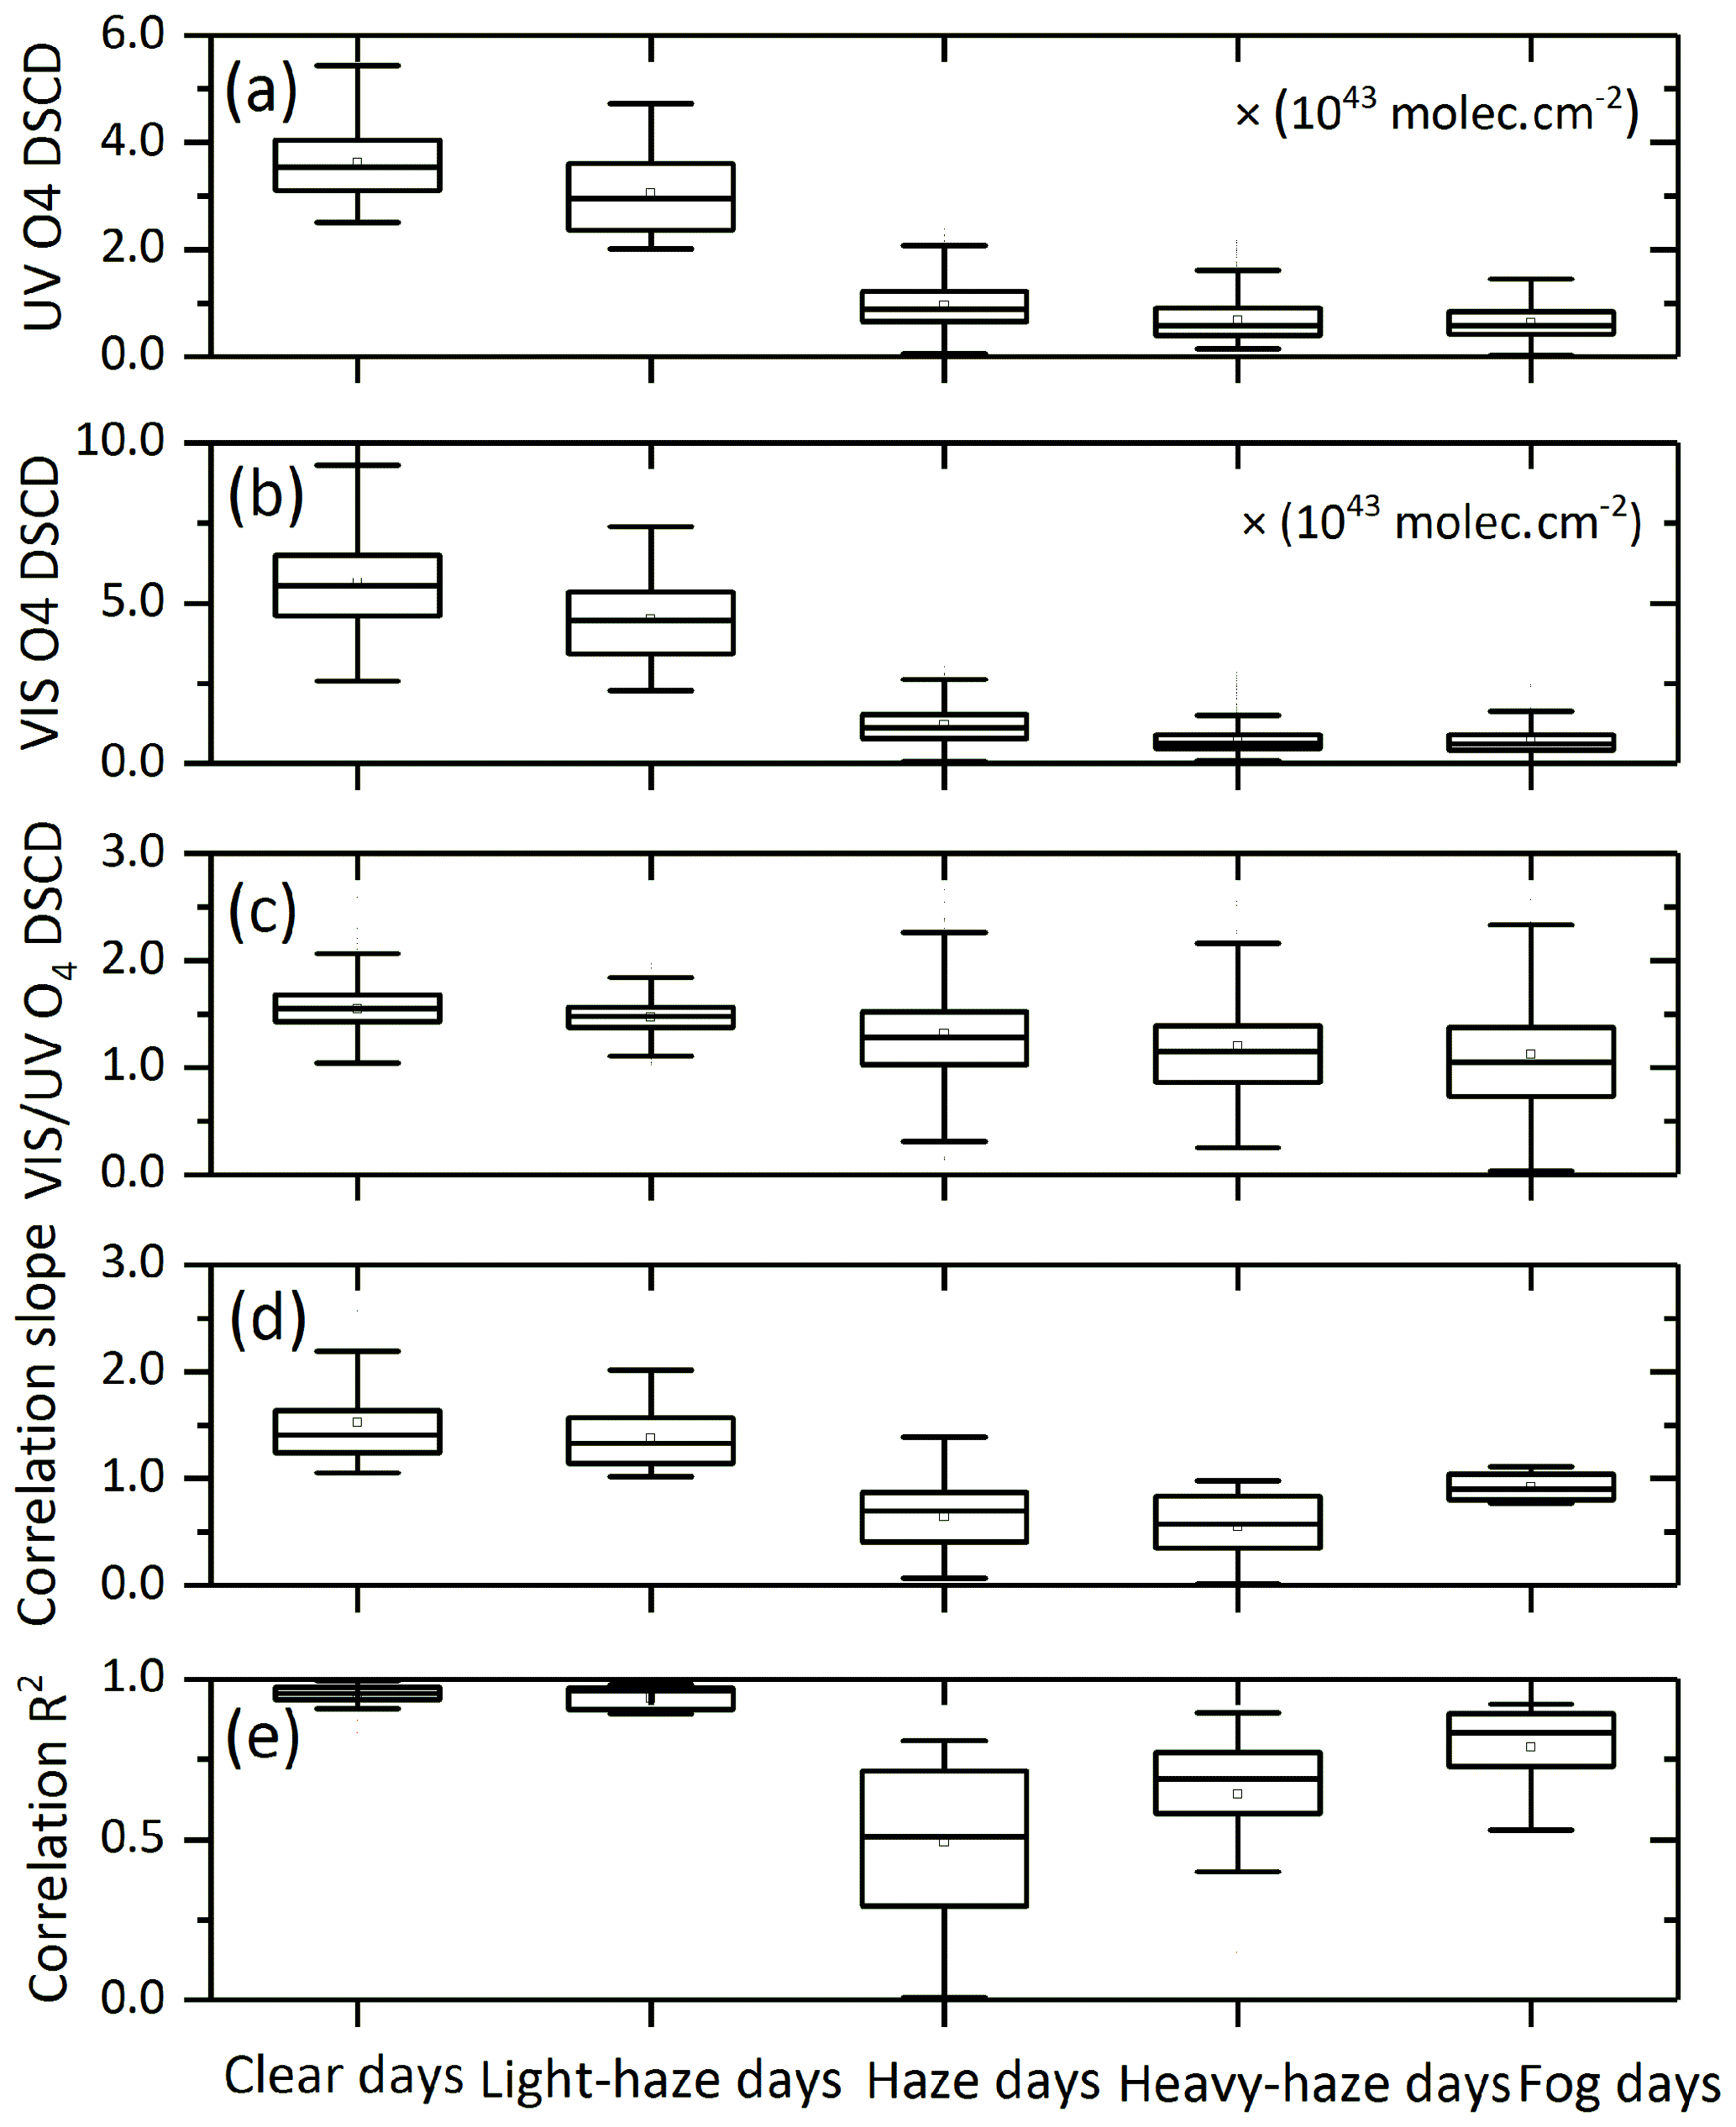
Figure 5Box plots of statistics for the O4 DSCD under different weather conditions: (a) in the UV band, (b) in the visible band, (c) the ratio of visible ∕ UV O4 DSCD, (d) correlation slope, and (e) R2 between the UV and visible ranges (visible O4 DSCD = slope ⋅ UV O4 DSCD + intercept).
In general, the O4 DSCDs in UV wavelengths mainly ranged in 3.00–4.00 × 1043, 2.50–3.50 × 1043, 0.50–1.10 × 1043, 0.25–0.80 × 1043, and 0.20–0.40 × 1043 molec. cm−2 in clear, light-haze, haze, heavy-haze, and fog days, respectively. And the O4 DSCDs in visible wavelengths are mainly distributed between 4.00 and 6.50 × 1043, 3.00 and 5.50 × 1043, 0.50 and 1.30 × 1043, 0.25 and 0.60 × 1043, and 0.25 and 0.60 × 1043 molec. cm−2 under the above five different weather conditions, which are higher than those in UV wavelengths, especially for clear and light-haze days. Moreover, the corresponding ratio of visible to UV O4 DSCDs is 1.45–1.70, 1.45–1.65, 1.00–1.65, 0.85–1.35, and 0.80–1.35 under these five weather conditions, respectively. The linear regression results show that the correlation slopes between UV and visible O4 DSCDs are greater than 1.00 (mainly greater than 1.40) and the correlation R2 values are greater than 0.93 mostly on clear days. Under light-haze conditions, the correlation slopes are greater than 1.00 (mainly greater than 1.20) and the correlation R2 values are mainly greater than 0.90. The correlation slopes are mainly less than 0.60 and the correlation R2 values have a wider range (maximum value < 0.80 and occasional fitting failure) on haze days. On heavy-haze days, the correlation slopes are less than 0.60–0.80 and the correlation R2 values are 0.50–0.80 mostly (some fitting failure cases appeared). On fog days, the correlation slopes are floated around 1.00 and the correlation R2 values are mainly 0.75–0.85.
Meanwhile, the statistical characteristics of AOPs under different weather conditions are shown in Fig. 6. Similar to the results in Table 2, σsca shows the increasing trend and was mainly distributed between 21.83 and 47.01, 28.33 and 57.25, 134.72 and 349.47, 228.42 and 649.11, and 450.00 and 1004.88 Mm−1 on clear, light-haze, haze, heavy-haze and fog days, respectively. The σabs values were mainly distributed between 2.61 and 8.26, 3.99 and 11.89, 22.25 and 57.31, 34.84 and 72.22, and 70.01 and 115.26 Mm−1 under the five different weather conditions above. The AODs were mainly distributed between 0.11 and 0.35, 0.12 and 0.37, 0.76 and 1.70, 1.37 and 2.38, and 0.69 and 1.38 under these five weather conditions. The Ångström exponents were more disperse for clear and light-haze days than the other weather conditions. Except the fog days, the asymmetry factor in other weather conditions is not much different.
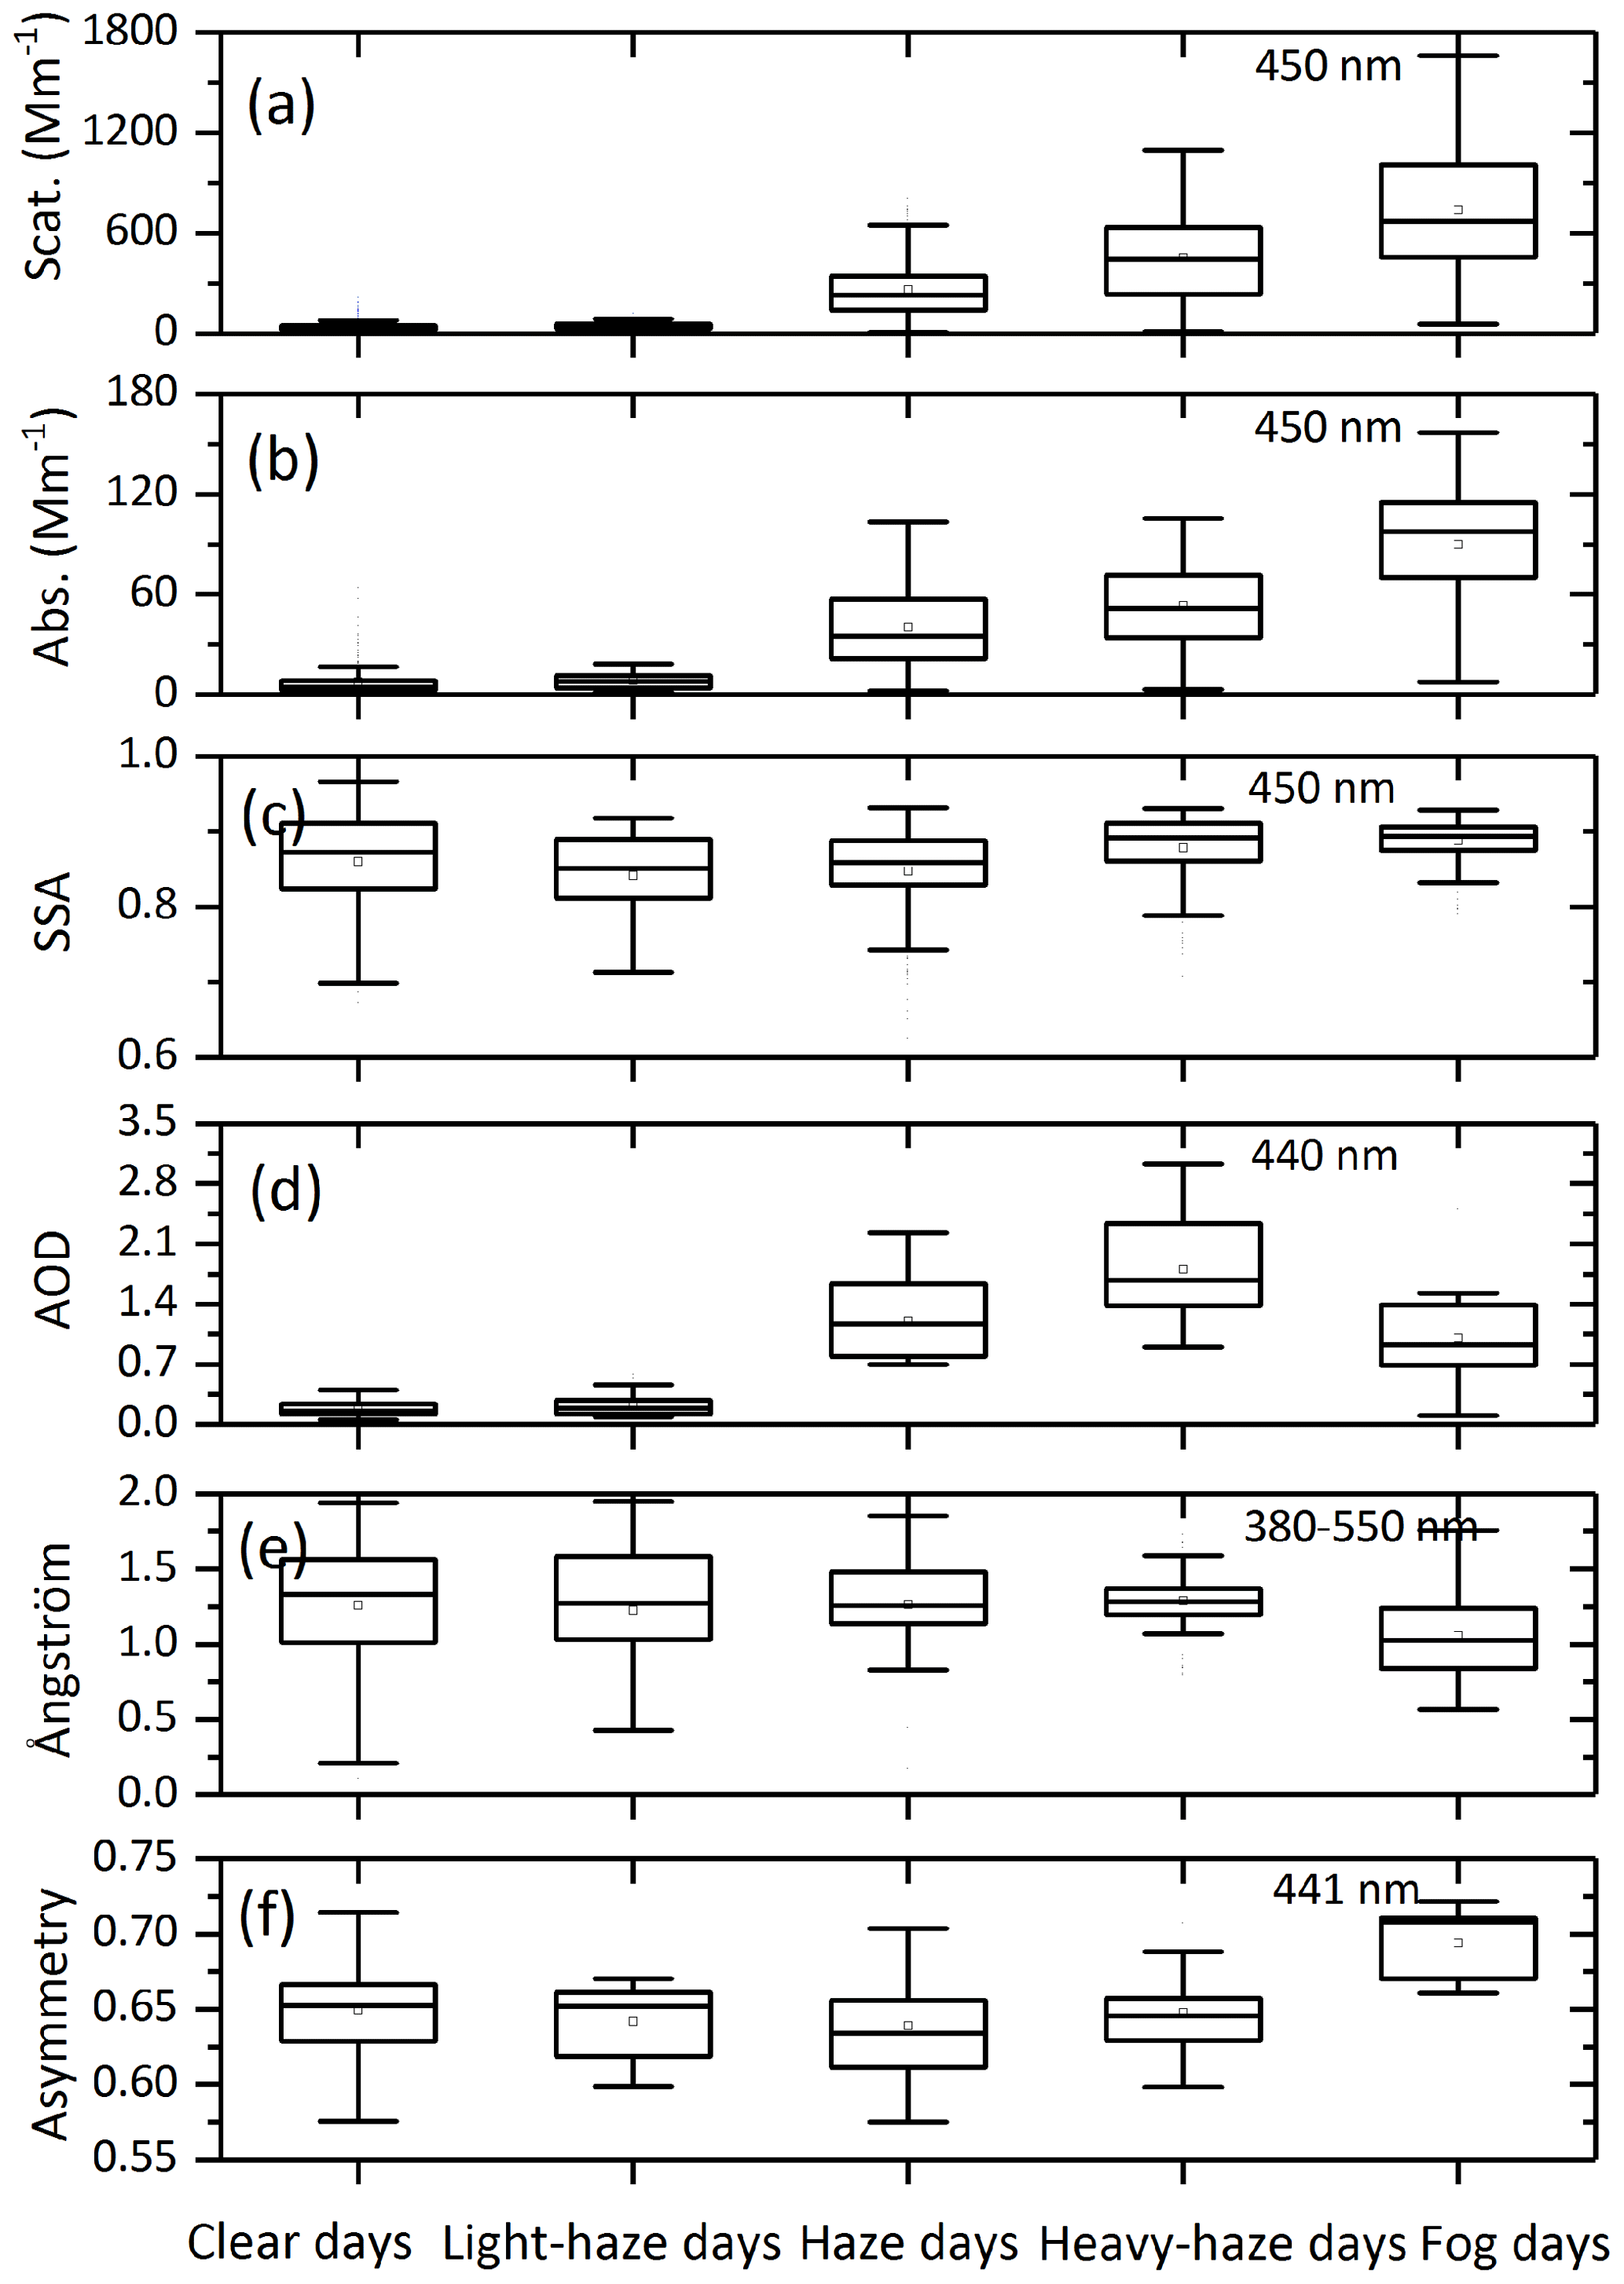
Figure 6Box plots of the statistics on aerosol optical properties under different weather conditions: (a) σsca, (b) σabs, (c) SSA, (d) AOD, (e) Ångström exponent, and (f) asymmetry.
Combining the statistical information on O4 absorptions and AOPs, we could conclude some empirical relationships as follows.
Under the condition that the correlation slopes between UV and visible O4 DSCDs are greater than 1.0 and the correlation R2 values are greater than 0.9, and simultaneously, the UV and visible O4 DSCDs are mainly greater than 2.5 × 1043 molec. cm−2 and 3.0 × 1043 molec. cm−2, we know the weather should mainly be clear or light-haze days. It can be suspected that σsca and σabs are less than 45 and 12 Mm−1, and AODs are less than 0.4.
Under the condition of a correlation slope less than 0.6 and correlation R2 values less than 0.8, simultaneously, and the UV and visible O4 DSCDs are mainly less than 1.1 × 1043 molec. cm−2 and 1.3 × 1043 molec. cm−2, the weather should mainly be haze or heavy-haze days. Moreover, σsca and σabs are estimated to be distributed at 200–900 and 20–60 Mm−1, respectively. AODs are between 0.9 and 2.5. In more detail, σsca, σabs, and AOD will be located at 200–400, 20–50 Mm−1, and 0.9–1.5 under UV and visible O4 DSCDs > 1.0×1043 molec. cm−2.
If the correlation slope is around 1.0 and with a correlation R2 of 0.75–0.85, we know the weather should mainly be fog days. σsca and σabs are located at 450–1200 and 60–90 Mm−1, while AODs are greater than 0.7.
Therefore, the obtained empirical relationships represent the potential ability to determine the basic aerosol loading conditions from the MAX-DOAS observed O4 absorptions.
To investigate the feasibility and reliability, another short MAX-DOAS measurement campaign operating in Gucheng, Hebei Province (39.1382∘ N, 115.7163∘ E) from 19 to 27 November 2016 was used for the application of the new method to determine AOPs from O4 absorptions. The MAX-DOAS instrument is the same as that installed in CAMS. Due to the absence of a sun photometer instrument, AODs at 450 nm were obtained by profiling the aerosol extinction coefficient based on MAX-DOAS measurements by utilizing the optimal estimation method (Frieß et al., 2006, 2016; Xing et al., 2017). In addition, σsca and σabs were acquired using the same co-located integrating nephelometer (Aurora 1000, Ecotech) and seven-wavelength Aethalometer (AE-31, Magee Scientific), respectively. Moreover, the temporal resolution of σsca and σabs measurements is 1 min and 1 h, respectively.
Figure 7a and b show the diurnal variations and segmental correlation of O4 DSCDs in the UV and visible bands during this campaign. According to the empirical relationships discussed in Sect. 3.3, it can be inferred that the period segment during 09:00–11:00 on 25 November should be haze or heavy-haze conditions because the UV and visible O4 DSCDs are all less than 0.5×1043 molec. cm−2, and simultaneously the correlation slope and R2 between them are 0.42 and 0.59, which is in line with the determination conditions that UV and visible O4 DSCDs are mainly less than 1.1×1043 and 1.3×1043 molec. cm−2 and simultaneously the correlation slope and R2 between them are mainly less than 0.6 and 0.8. Similarly, the periods of 09:00–12:00 on 21 November, 10:50–16:00 on 22 November, 10:00–15:00 on 23 November, 08:00–15:00 on 26 November and 11:00–15:00 on 27 November are mainly clear or light-haze weather. And 09:00–10:00 on 19 November, 09:00–12:00 on 20 November, and 09:00–10:50 on 22 November can be mainly regarded as haze or heavy-haze weather types.
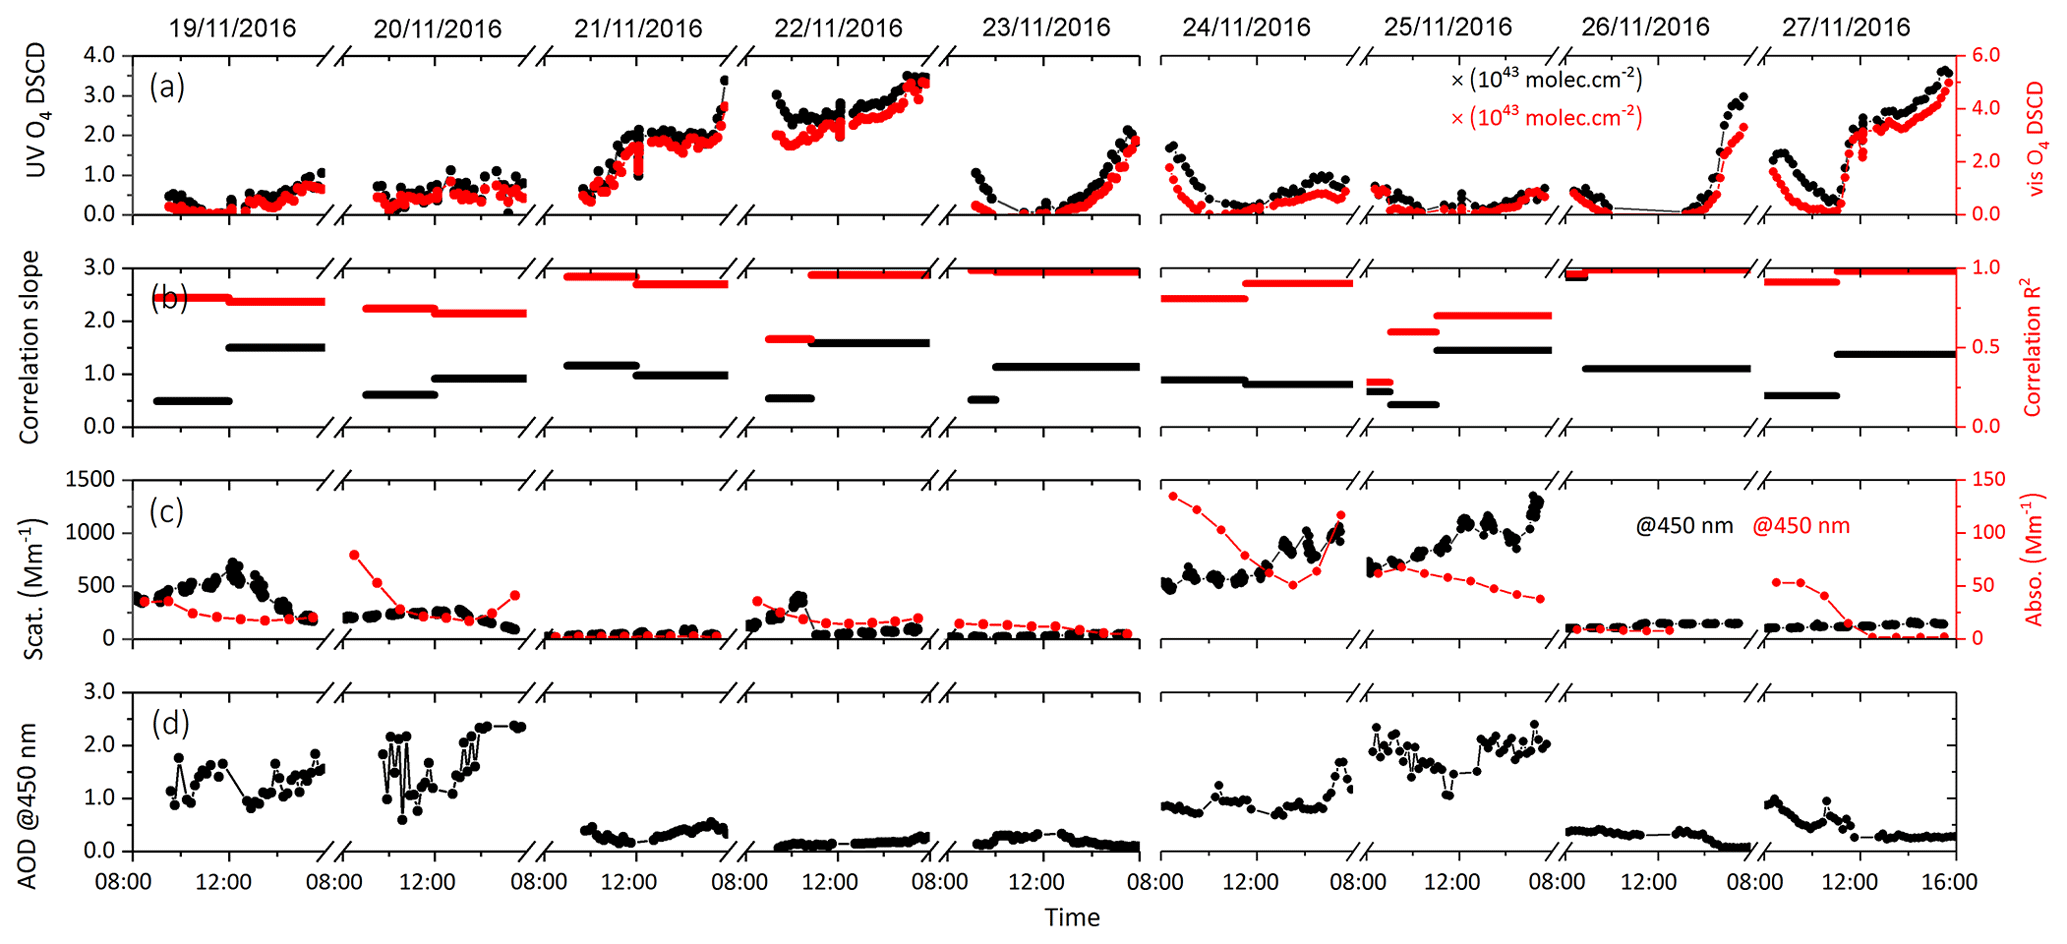
Figure 7Time series of O4 absorptions and aerosol optical properties at Gucheng, Hebei, from 19 to 27 November 2016: (a) UV and visible O4 DSCDs, (b) correlation slopes and R2 between O4 DSCDs at 360.8 and 477.1 nm, (c) σsca and σabs at 450 nm, (d) AOD at 450 nm retrieved by MAX-DOAS.
Furthermore, the time series of in situ σsca, σabs, and MAX-DOAS-retrieved AOD are shown in Fig. 7c and d. According to the empirical relationships summarized above, the σsca, σabs, and AOD are mainly located at 200–900, 20–60 Mm−1, and 0.9–2.5 under the haze segment of 09:00–11:00 of 25 November. Simultaneously, the in situ measured σsca, σabs, and MAX-DOAS-retrieved AOD during the above periods range in 588.30–730.77, 58.19–67.63 Mm−1, and 1.39–2.22. The inferred results are in good agreement with the measured results. This indicates that the concluded empirical relationships can be used as the criterion to accurately determine the ranges of aerosol optical parameters of σsca, σabs, and AOD. Nevertheless, we found two segments with correlation slopes > 1.0 and R2 < 0.9 during 12:00–15:00 on 19 November and 11:00–15:00 on 25 November, which is not included in cases of the empirical relationships. This suggests that more refined and quantitative relationships between aerosol optical parameters and O4 absorptions need to be further achieved with the increases in the measured data, which can be established as a look-up table to retrieve the aerosol optical properties in the future.
Moreover, in order to illustrate the variations in the O4 absorptions due to the change in aerosol loadings, we used a radiative transfer model of SCIATRAN to simulate O4 DSCDs in the UV and visible bands under conditions with different aerosol optical properties, but under a fixed given series of observation geometry with elevation angle, solar zenith angle, and relative azimuth angle. In total, 11 different aerosol scenarios were simulated, and the linear-regression analysis for the simulated UV and visible O4 DSCDs under different aerosol conditions were performed. The forward radiative transfer model (RTM) simulation results presented in the Supplement (Table S2 and Fig. S1) demonstrate that the O4 absorptions information, including the value of UV and Visible O4 DSCDs, the corresponding linear-regression slope and R2 between them, could greatly reflect the variation in aerosol optical properties. More details can be found in the Supplement.
Ground-based MAX-DOAS measurements for O4 DSCDs in the UV and visible wavelength bands were carried out in Beijing from November 2016 to February 2017. Combined with the measured σsca and σabs and AOD, we have summarized the characteristics of O4 absorptions and parameters of AOPs under different weather conditions during autumn–winter seasons. It was found that the averaged AOD increased from 0.311 on clear days to 1.338 on heavy-haze days. The averaged σsca changed dramatically from 44.524 Mm−1 on light-haze days to 449.741 Mm−1 on heavy-haze days. Moreover, the averaged σabs also obviously increased from 8.257 Mm−1 on light-haze days to 53.257 Mm−1 for heavy-haze conditions. Both the measured UV and visible O4 DSCDs varied in the order of clear days > light-haze days > haze days > heavy-haze days > fog days. The corresponding correlation information (slope and R2) between O4 DSCDs at UV and visible wavelength bands also changed synchronously when σsca and σabs have varied.
Considering the simultaneous variation in O4 absorptions and AOPs, the segmental period correlation analysis between UV and visible O4 DSCDs was performed. Afterwards, the empirical relationships between O4 absorptions and AOPs could be concluded for different aerosol loadings. Clear and light-haze days occur under linear-regression slopes greater than 1.0 and R2 mainly greater than 0.9, and simultaneously UV and visible O4 DSCDs mainly greater than 2.5×1043 molec. cm−2. σsca, σabs, and AOD are mainly less than 45, 12 Mm−1, and 0.4 under these conditions, respectively. When the correlation slopes, R2, and O4 DSCDs are less than 0.6, 0.8, and 1.3×1043 molec. cm−2, respectively, it should mainly be haze or heavy-haze days. Under this condition, the σsca, σabs, and AOD can be inferred to be mainly located at 200–900, 20–60 Mm−1, and 0.9–2.5, respectively. In addition, it should be fog days if the correlation slopes are around 1.0 and R2 is 0.75–0.85. Another MAX-DOAS measurement campaign carried out at Gucheng from 19 to 27 November 2016 was used to validate the proposed new method, which could determine the AOPs from the observed O4 absorptions well.
In this paper, we present a new method to directly deduce the parameters of aerosol optical properties from the observed UV and visible O4 absorptions, which expands the usage of the MAX-DOAS technique to quickly semi-quantify the aerosol scattering and absorption properties. With the improvement of the look-up table, more precise and accurate inversion of aerosol optical properties can be achieved. Since only the O4 DSCDs at an elevation angle of 1∘ were employed to obtain the aerosol scattering and absorption at the surface, it can be expected that vertical spatially resolved of aerosol scattering and absorption can be retrieved by using O4 DSCDs at different elevation angles in a future study.
Data of MAX-DOAS and the in situ measured σsca and σabs data used in this study can be made available for scientific purposes upon request to the corresponding authors.
The supplement related to this article is available online at: https://doi.org/10.5194/amt-12-3289-2019-supplement.
CX, CL, and SW designed and implemented the research, as well as prepared the paper. QH contributed to analysis of the in situ AOP data. CX, HL, and WT carried out the MAX-DOAS observations at the CAMS and Gucheng sites. WZ and BL contributed to the MAX-DOAS data retrieval. JL provided constructive comments on this research.
The authors declare that they have no conflict of interest.
This research was supported by grants from the National Key Research and Development Program of China (2018YFC0213104, 2018YFC0213100, 2016YFC0203302, 2017YFC0210002), National Natural Science Foundation of China (41722501, 91544212, 51778596, 41575021), and Shanghai Pujiang Talent Program (17PJC015). We would like to thank CAMS and Peking University for the data of σsca and σabs measured in Gucheng and PKUERS, respectively.
This research has been supported by the National Key Research and Development Program of China (grant nos. 2018YFC0213104, 2018YFC0213100, 2016YFC0203302, and 2017YFC0210002), the National Natural Science Foundation of China (grant nos. 41722501, 91544212, 51778596, and 41575021), and the Shanghai Pujiang Talent Program (grant no. 17PJC015).
This paper was edited by Jun Wang and reviewed by two anonymous referees.
Aliwell, S., Van Roozendael, M., Johnston, P., Richter, A., Wagner, T., Arlander, D., Burrows, J., Fish, D., Jones, R., and Tørnkvist, K.: Analysis for BrO in zenith-sky spectra: An Intercomparison exercise for analysis improvement, J. Geophys. Res., 107, 4199, https://doi.org/10.1029/2001JD000329, 2002.
Allen, R. J., Sherwood, S. C., Norris, J. R., and Zender, C. S.: Recent Northern Hemisphere tropical expansion primarily driven by black carbon and tropospheric ozone, Nature, 485, 350–354, https://doi.org/10.1038/nature11097, 2012.
Bergstrom, R. W., Pilewskie, P., Russell, P. B., Redemann, J., Bond, T. C., Quinn, P. K., and Sierau, B.: Spectral absorption properties of atmospheric aerosols, Atmos. Chem. Phys., 7, 5937–5943, https://doi.org/10.5194/acp-7-5937-2007, 2007.
Che, H., Xia, X., Zhu, J., Wang, H., Wang, Y., Sun, J., Zhang, X., and Shi, G.: Aerosol optical properties under the condition of heavy haze over an urban site of Beijing, China, Environ. Sci. Pollut. Res. Int., 22, 1043–1053, https://doi.org/10.1007/s11356-014-3415-5, 2015.
Clémer, K., Van Roozendael, M., Fayt, C., Hendrick, F., Hermans, C., Pinardi, G., Spurr, R., Wang, P., and De Mazière, M.: Multiple wavelength retrieval of tropospheric aerosol optical properties from MAXDOAS measurements in Beijing, Atmos. Meas. Tech., 3, 863–878, https://doi.org/10.5194/amt-3-863-2010, 2010.
Ding, A. J., Huang, X., Nie, W., Sun, J. N., Kerminen, V. M., Petäjä, T., Su, H., Cheng, Y. F., Yang, X. Q., Wang, M. H., Chi, X. G., Wang, J. P., Virkkula, A., Guo, W. D., Yuan, J., Wang, S. Y., Zhang, R. J., Wu, Y. F., Song, Y., Zhu, T., Zilitinkevich, S., Kulmala, M., and Fu, C. B.: Enhanced haze pollution by black carbon in megacities in China, Geophys. Res. Lett., 43, 2873–2879, https://doi.org/10.1002/2016gl067745, 2016.
Duan, L., Xiu, G., Feng, L., Cheng, N., and Wang, C.: The mercury species and their association with carbonaceous compositions, bromine and iodine in PM2.5 in Shanghai, Chemosphere, 146, 263–271, https://doi.org/10.1016/j.chemosphere.2015.11.058, 2016.
Dubovik, O., Holben, B. R., Eck, T. F., Smirnov, A., Kaufman, Y. J., King, M. D., Tanre, D., and Slutsker, I.: Variability of Absorption and Optical Properties of Key Aerosol Types Observed in Worldwide Locations, J. Atmos. Sci., 59, 590–607, 2001.
Eck, T. F., Holben, B. N., Reid, J. S., O'Neill, N. T., Schafer, J. S., Dubovik, O., Smirnov, A., Yamasoe, M. A., and Artaxo, P.: High aerosol optical depth biomass burning events: A comparison of optical properties for different source regions, Geophys. Res. Lett., 30, 2035, https://doi.org/10.1029/2003gl017861, 2003.
Eck, T. F., Holben, B. N., Dubovik, O., Smirnov, A., Goloub, P., Chen, H. B., Chatenet, B., Gomes, L., Zhang, X. Y., Tsay, S. C., Ji, Q., Giles, D., and Slutsker, I.: Columnar aerosol optical properties at AERONET sites in central eastern Asia and aerosol transport to the tropical mid-Pacific, J. Geophys. Res.-Atmos., 110, D06202, https://doi.org/10.1029/2004jd005274, 2005.
Fleischmann, O. C., Hartmann, M., Burrows, J. P., and Orphal, J.: New ultraviolet absorption cross-sections of BrO at atmospheric temperatures measured by time-windowing Fourier transform spectroscopy, J. Photoch. Photobio. A, 168, 117–132, 2004.
Frieß, U., Monks, P. S., Remedios, J. J., Rozanov, A., Sinreich, R., Wagner, T., and Platt, U.: MAX-DOAS O4measurements: A new technique to derive information on atmospheric aerosols: 2. Modeling studies, J. Geophys. Res., 111, D14230, https://doi.org/10.1029/2005jd006618, 2006.
Frieß, U., Klein Baltink, H., Beirle, S., Clémer, K., Hendrick, F., Henzing, B., Irie, H., de Leeuw, G., Li, A., Moerman, M. M., van Roozendael, M., Shaiganfar, R., Wagner, T., Wang, Y., Xie, P., Yilmaz, S., and Zieger, P.: Intercomparison of aerosol extinction profiles retrieved from MAX-DOAS measurements, Atmos. Meas. Tech., 9, 3205–3222, https://doi.org/10.5194/amt-9-3205-2016, 2016.
Fyfe, J. C., Gillett, N. P., and Zwiers, F. W.: Overestimated global warming over the past 20 years, Nat. Clim. Change, 3, 767–769, https://doi.org/10.1038/nclimate1972, 2013.
Galdos, M., Cavalett, O., Seabra, J. E. A., Nogueira, L. A. H., and Bonomi, A.: Trends in global warming and human health impacts related to Brazilian sugarcane ethanol production considering black carbon emissions, Appl. Energy, 104, 576–582, https://doi.org/10.1016/j.apenergy.2012.11.002, 2013.
Garland, R. M., Schmid, O., Nowak, A., Achtert, P., Wiedensohler, A., Gunthe, S. S., Takegawa, N., Kita, K., Kondo, Y., Hu, M., Shao, M., Zeng, L. M., Zhu, T., Andreae, M. O., and Pöschl, U.: Aerosol optical properties observed during Campaign of Air Quality Research in Beijing 2006 (CAREBeijing-2006): Characteristic differences between the inflow and outflow of Beijing city air, J. Geophys. Res., 114, D00G04, https://doi.org/10.1029/2008jd010780, 2009.
Guo, L., Guo, X., Fang, C., and Zhu, S.: Observation analysis on characteristics of formation, evolution and transition of a long-lasting severe fog and haze episode in North China, Sci. China Earth Sci., 58, 329–344, https://doi.org/10.1007/s11430-014-4924-2, 2014.
He, X., Li, C. C., Lau, A. K. H., Deng, Z. Z., Mao, J. T., Wang, M. H., and Liu, X. Y.: An intensive study of aerosol optical properties in Beijing urban area, Atmos. Chem. Phys., 9, 8903–8915, https://doi.org/10.5194/acp-9-8903-2009, 2009.
Hess, M., Koepke, P., and Schult, I.: Optical Properties of Aerosols and Clouds: The Software Package OPAC, B. Am. Meteorol. Soc., 79, 831–844, 1998.
Honninger, G. and Platt, U.: Observations of BrO and its vertical distribution during surface ozone depletion at Alert, Atmos. Environ., 36, 2481–2489, 2002.
Hönninger, G., von Friedeburg, C., and Platt, U.: Multi axis differential optical absorption spectroscopy (MAX-DOAS), Atmos. Chem. Phys., 4, 231–254, https://doi.org/10.5194/acp-4-231-2004, 2004.
Huang, R. J., Zhang, Y., Bozzetti, C., Ho, K. F., Cao, J. J., Han, Y., Daellenbach, K. R., Slowik, J. G., Platt, S. M., Canonaco, F., Zotter, P., Wolf, R., Pieber, S. M., Bruns, E. A., Crippa, M., Ciarelli, G., Piazzalunga, A., Schwikowski, M., Abbaszade, G., Schnelle-Kreis, J., Zimmermann, R., An, Z., Szidat, S., Baltensperger, U., El Haddad, I., and Prevot, A. S.: High secondary aerosol contribution to particulate pollution during haze events in China, Nature, 514, 218–222, https://doi.org/10.1038/nature13774, 2014.
Hytch, M. J., Putaux, J. L., and Penisson, J. M.: Measurement of the displacement field of dislocations to 0.03 A by electron microscopy, Nature, 423, 270–273, https://doi.org/10.1038/nature01638, 2003.
Karanasiou, A., Moreno, N., Moreno, T., Viana, M., de Leeuw, F., and Querol, X.: Health effects from Sahara dust episodes in Europe: literature review and research gaps, Environ. Int., 47, 107–114, https://doi.org/10.1016/j.envint.2012.06.012, 2012.
Kaufman, Y. J., Tanré, D., Dubovik, O., Karnieli, A., and Remer, L. A.: Absorption of sunlight by dust as inferred from satellite and ground-based remote sensing, Geophys. Res.Lett., 28, 1479–1482, https://doi.org/10.1029/2000gl012647, 2001.
Kim, D. and Ramanathan, V.: Solar radiation budget and radiative forcing due to aerosols and clouds, J. Geophys. Res., 113, D02203, https://doi.org/10.1029/2007jd008434, 2008.
Lee, H., Irie, H., Gu, M., Kim, J., and Hwang, J.: Remote sensing of tropospheric aerosol using UV MAX-DOAS during hazy conditions in winter: Utilization of O4 Absorption bands at wavelength intervals of 338–368 and 367–393 nm, Atmos. Environ., 45, 5760–5769, https://doi.org/10.1016/j.atmosenv.2011.07.019, 2011.
Levy, H., Horowitz, L. W., Schwarzkopf, M. D., Ming, Y., Golaz, J.-C., Naik, V., and Ramaswamy, V.: The roles of aerosol direct and indirect effects in past and future climate change, J. Geophys. Res.-Atmos., 118, 4521–4532, https://doi.org/10.1002/jgrd.50192, 2013.
Liousse, C., Penner, J. E., Chuang, C., Walton, J. J., Eddleman, H., and Cachier, H.: A global three-dimensional model study of carbonaceous aerosols, J. Geophys. Res.-Atmos., D14, 19411–19432, 1996.
Meller, R. and Moortgat, G. K.: Temperature dependence of the absorption cross sections of formaldehyde between 223 and 323 K in the wavelength range 225–375 nm, J. Geophys. Res., 105, 7089–7101, 2000.
Platt, U. and Stutz, J.: Differential Optical Absorption Spectroscopy (DOAS), Principles and Applications, Springer, Berlin-Heidelberg, 138–141, 2008.
Ramana, M. V., Ramanathan, V., Feng, Y., Yoon, S. C., Kim, S. W., Carmichael, G. R., and Schauer, J. J.: Warming influenced by the ratio of black carbon to sulphate and the black-carbon source, Nat. Geosci., 3, 542–545, https://doi.org/10.1038/ngeo918, 2010.
Ramanathan, V., Ramana, M. V., Roberts, G., Kim, D., Corrigan, C., Chung, C., and Winker, D.: Warming trends in Asia amplified by brown cloud solar absorption, Nature, 448, 575–578, https://doi.org/10.1038/nature06019, 2007.
Remer, L. A. and Kaufman, Y. J.: Dynamic aerosol model: Urban/industrial aerosol, J. Geophys. Res.-Atmos., 103, 13859–13871, https://doi.org/10.1029/98jd00994, 1998.
Rothman, L., Gordon, I., Barber, R., Dothe, H., Gamache, R., Goldman, A., Perevalov, V., Tashkun, S., and Tennyson, J.: HITEMP, the high-temperature molecular spectroscopic database, J. Quant. Spectrosc. Ra., 111, 2139–2150, 2010.
Seinfeld, J. H. and Pandis, S. N.: Atmospheric chemistry and physics: from air pollution to climate change, Wiley-Interscience, 1054–1056, 2006.
Serdyuchenko, A., Gorshelev, V., Weber, M., Chehade, W., and Burrows, J. P.: High spectral resolution ozone absorption cross-sections – Part 2: Temperature dependence, Atmos. Meas. Tech., 7, 625–636, https://doi.org/10.5194/amt-7-625-2014, 2014.
Shen, Y., Virkkula, A., Ding, A., Wang, J., Chi, X., Nie, W., Qi, X., Huang, X., Liu, Q., Zheng, L., Xu, Z., Petäjä, T., Aalto, P. P., Fu, C., and Kulmala, M.: Aerosol optical properties at SORPES in Nanjing, east China, Atmos. Chem. Phys., 18, 5265–5292, https://doi.org/10.5194/acp-18-5265-2018, 2018.
Tanré, D., Remer, L. A., Kaufman, Y. J., Mattoo, S., Hobbs, P. V., Livingston, J. M., Russell, P. B., and Smirnov, A.: Retrieval of aerosol optical thickness and size distribution over ocean from the MODIS airborne simulator during TARFOX, J. Geophys. Res.-Atmos., 104, 2261–2278, https://doi.org/10.1029/1998jd200077, 1999.
Thalman, R. and Volkamer, R.: Temperature dependent absorption cross-sections of O2-O2 collision pairs between 340 and 630 nm and at atmospherically relevant pressure, Phys. Chem. Chem. Phys., 15, 15371–15381, https://doi.org/10.1039/c3cp50968k, 2013.
Vandaele, A. C., Hermans, C., Simon, P. C., Carleer, M., Colin, R., Fally, S., Merienne, M.-F., Jenouvrier, A., and Coquart, B.: Measurements of the NO2 absorption cross-section from 42 000 cm−1 to 10 000 cm−1 (238–1000 nm) at 220 K and 294 K, J. Quant. Spectrosc. Ra., 59, 171–184, 1998.
Viana, M., Pey, J., Querol, X., Alastuey, A., de Leeuw, F., and Lukewille, A.: Natural sources of atmospheric aerosols influencing air quality across Europe, Sci. Total Environ., 472, 825–833, https://doi.org/10.1016/j.scitotenv.2013.11.140, 2014.
Wagner, T., Dix, B., Friedeburg, C. V., Frieß, U., Sanghavi, S., Sinreich, R., and Platt, U.: MAX-DOAS O4measurements: A new technique to derive information on atmospheric aerosols-Principles and information content, J. Geophys. Res.-Atmos., 109, D22205, https://doi.org/10.1029/2004jd004904, 2004.
Wang, S., Cuevas, C. A., Frieß, U., and Saiz-Lopez, A.: MAX-DOAS retrieval of aerosol extinction properties in Madrid, Spain, Atmos. Meas. Tech., 9, 5089–5101, https://doi.org/10.5194/amt-9-5089-2016, 2016.
Wang, Z., Huang, X., and Ding, A.: Dome effect of black carbon and its key influencing factors: a one-dimensional modelling study, Atmos. Chem. Phys., 18, 2821–2834, https://doi.org/10.5194/acp-18-2821-2018, 2018.
Weinzierl, B., Sauer, D., Esselborn, M., Petzold, A., Veira, A., Rose, M., Mund, S., Wirth, M., Ansmann, A., Tesche, M., Gross, S., and Freudenthaler, V.: Microphysical and optical properties of dust and tropical biomass burning aerosol layers in the Cape Verde region an overview of the airborne in situ and lidar measurements during SAMUM-2, Tellus B, 63, 589–618, https://doi.org/10.1111/j.1600-0889.2011.00566.x, 2017.
Wilcox, E. M., Thomas, R. M., Praveen, P. S., Pistone, K., Bender, F. A., and Ramanathan, V.: Black carbon solar absorption suppresses turbulence in the atmospheric boundary layer, P. Natl. Acad. Sci. USA, 113, 11794–11799, https://doi.org/10.1073/pnas.1525746113, 2016.
Wittrock, F., Oetjen, H., Richter, A., Fietkau, S., Medeke, T., Rozanov, A., and Burrows, J. P.: MAX-DOAS measurements of atmospheric trace gases in Ny-Ålesund – Radiative transfer studies and their application, Atmos. Chem. Phys., 4, 955–966, https://doi.org/10.5194/acp-4-955-2004, 2004.
Xing, C., Liu, C., Wang, S., Chan, K. L., Gao, Y., Huang, X., Su, W., Zhang, C., Dong, Y., Fan, G., Zhang, T., Chen, Z., Hu, Q., Su, H., Xie, Z., and Liu, J.: Observations of the vertical distributions of summertime atmospheric pollutants and the corresponding ozone production in Shanghai, China, Atmos. Chem. Phys., 17, 14275–14289, https://doi.org/10.5194/acp-17-14275-2017, 2017.
Yoon, S.-C. and Kim, J.: Influences of relative humidity on aerosol optical properties and aerosol radiative forcing during ACE-Asia, Atmos. Environ., 40, 4328–4338, https://doi.org/10.1016/j.atmosenv.2006.03.036, 2006.
Yu, X., Zhu, B., Yin, Y., Yang, J., Li, Y., and Bu, X.: A comparative analysis of aerosol properties in dust and haze-fog days in a Chinese urban region, Atmos. Res., 99, 241–247, https://doi.org/10.1016/j.atmosres.2010.10.015, 2011.
Yu, X., Kumar, K. R., Lu, R., and Ma, J.: Changes in column aerosol optical properties during extreme haze-fog episodes in January 2013 over urban Beijing, Environ. Pollut., 210, 217–226, https://doi.org/10.1016/j.envpol.2015.12.021, 2016.
Zheng, G. J., Duan, F. K., Su, H., Ma, Y. L., Cheng, Y., Zheng, B., Zhang, Q., Huang, T., Kimoto, T., Chang, D., Pöschl, U., Cheng, Y. F., and He, K. B.: Exploring the severe winter haze in Beijing: the impact of synoptic weather, regional transport and heterogeneous reactions, Atmos. Chem. Phys., 15, 2969–2983, https://doi.org/10.5194/acp-15-2969-2015, 2015.
The requested paper has a corresponding corrigendum published. Please read the corrigendum first before downloading the article.
- Article
(1919 KB) - Full-text XML
- Corrigendum
-
Supplement
(255 KB) - BibTeX
- EndNote