the Creative Commons Attribution 4.0 License.
the Creative Commons Attribution 4.0 License.
 | 27 Jun 2019
Evaluating biases in filter-based aerosol absorption measurements using photoacoustic spectroscopy
Nicholas W. Davies
Cathryn Fox
Kate Szpek
Michael I. Cotterell
Jonathan W. Taylor
James D. Allan
Paul I. Williams
Jamie Trembath
Jim M. Haywood
Justin M. Langridge
Biases in absorption coefficients measured using a filter-based absorption photometer (Tricolor Absorption Photometer, or TAP) at wavelengths of 467, 528 and 652 nm are evaluated by comparing to measurements made using photoacoustic spectroscopy (PAS). We report comparisons for ambient sampling covering a range of aerosol types including urban, fresh biomass burning and aged biomass burning. Data are also used to evaluate the performance of three different TAP correction schemes. We found that photoacoustic and filter-based measurements were well correlated, but filter-based measurements generally overestimated absorption by up to 45 %. Biases varied with wavelength and depended on the correction scheme applied. Optimal agreement to PAS data was achieved by processing the filter-based measurements using the recently developed correction scheme of Müller et al. (2014), which consistently reduced biases to 0 %–18 % at all wavelengths. The biases were found to be a function of the ratio of organic aerosol mass to light-absorbing carbon mass, although applying the Müller et al. (2014) correction scheme to filter-based absorption measurements reduced the biases and the strength of this correlation significantly. Filter-based absorption measurement biases led to aerosol single-scattering albedos that were biased low by values in the range 0.00–0.07 and absorption Ångström exponents (AAEs) that were in error by ± (0.03–0.54). The discrepancy between the filter-based and PAS absorption measurements is lower than reported in some earlier studies and points to a strong dependence of filter-based measurement accuracy on aerosol source type.
- Article
(2419 KB) - Full-text XML
- BibTeX
- EndNote


Aerosol–radiation interactions are estimated to contribute a global mean effective radiative forcing of −0.45 (−0.95 to +0.05) W m−2, offsetting a potentially significant but poorly constrained fraction of the positive effective radiative forcing associated with greenhouse gases (2.26 to 3.40) W m−2 (Myhre et al., 2013a). One of the major factors governing the uncertainty in estimates of aerosol direct radiative forcing is the poorly constrained aerosol single-scattering albedo (SSA), defined as the ratio of aerosol scattering to total extinction (Loeb and Su, 2010; McComiskey et al., 2008; Sherman and McComiskey, 2018). Accurate determination of aerosol SSA is limited by uncertainties in aerosol absorption estimates, which could potentially be underestimated by up to a factor of 2 in global climate models (Shindell et al., 2013; Stier et al., 2007).
The main types of absorbing aerosol include black carbon (BC) and light-absorbing organic carbon, commonly referred to as brown carbon (BrC) (e.g. Myhre et al., 2013a). On a global scale, aerosol absorption is dominated by BC, a carbonaceous product formed during incomplete combustion, which may exert the next largest positive radiative forcing after carbon dioxide (Stocker et al., 2013). BC absorbs strongly across visible wavelengths and contributes an estimated 0.71 (0.09 to 1.26) W m−2 to aerosol direct radiative forcing (Bond et al., 2013). In recent years, BrC has received increasing attention as a climate-forcing agent (e.g. Feng et al., 2013). Sources of BrC include primary emissions during biomass and biofuel combustion as well as secondary production via photo-oxidation of volatile organic compounds (Andreae and Gelencsér, 2006; Wang et al., 2018). BrC has been found to absorb strongly towards ultraviolet wavelengths, although the strength and wavelength dependence of this absorption is uncertain, due in part to the wide range of compounds that this term encompasses, many of which are poorly characterised (Andreae and Gelencsér, 2006; Lack et al., 2012b; Pokhrel et al., 2017). Climate models generally only crudely represent the optical properties of BC and BrC and their evolution with time. For example, while the Met Office Hadley Centre HadGEM3 model treats the internal mixing of aerosol components, the real and imaginary parts of the refractive index of organic carbon that are used to calculate the radiative properties of the composite aerosol are fixed (e.g. Johnson et al., 2016). In order to address this deficiency, stronger observational constraints are first required (e.g. Alexander et al., 2008; Bond et al., 2013; Liu et al., 2014; Myhre et al., 2013b; Saleh et al., 2014; Wang et al., 2018).
Over the course of several decades, filter-based absorption photometry has been used to measure aerosol absorption coefficients. The approach has considerable benefits including that it is relatively inexpensive, portable and capable of unattended measurements for long periods of time (Baumgardner et al., 2012). Filter-based instruments measure the light transmittance across a filter continuously, which changes as particles are deposited onto the filter, providing a measure of aerosol absorption (see Sect. 2.1) (e.g. Bond et al., 1999). Absorption coefficients determined using filter-based absorption photometry can be subject to measurement artefacts due to (i) scattering of light away from the light detector leading to erroneous apparent absorption and (ii) enhanced absorption as particles are deposited onto the filter (Bond et al., 1999). The latter leads to multiple scattering between the particles and the filter medium, providing multiple opportunities for absorption. The enhancement is complex to characterise and depends on the filter loading such that an increase in the number of deposited absorbing particles reduces the multiple scattering between the filter and particle layers (Bond et al., 1999; Liousse et al., 1993; Weingartner et al., 2003) leading to lower absorption coefficients for highly loaded filters (Weingartner et al., 2003). The sensitivity of filter-based absorption photometers is also affected by the penetration depth of particles within the filter matrix, which depends on particle size (Moteki et al., 2010; Nakayama et al., 2010). A number of empirical and semi-empirical correction schemes have been derived to correct for the aforementioned artefacts. This study will focus on correction schemes derived for use with glass-fibre Pallflex E70-2075W filters that have been used widely with the Particle Soot Absorption Photometer (PSAP, Radiance Research) (Bond et al., 1999; Müller et al., 2014; Virkkula, 2010; Virkkula et al., 2005). These correction schemes are also valid for similar instruments using this filter substrate, for example the Tricolor Absorption Photometer (TAP, Brechtel Manufacturing) used in this study and described in Sect. 2.2.2 (Ogren et al., 2017).
Another potentially significant measurement artefact is due to liquid-like organic aerosols spreading across the filter fibres (Lack et al., 2008). The mechanisms proposed for this artefact include a change in the physical shape and therefore optical properties of deposited particles, or a coating effect whereby deposited particle absorption is enhanced via a lensing effect (Cappa et al., 2008; Lack et al., 2008; Subramanian et al., 2007). Although recognised as potentially significant, there are no empirical corrections to account for these artefacts.
Previous work has examined the magnitude of biases in filter-based absorption measurements. For example, Lack et al. (2008) found PSAP absorption coefficients were biased high in the range 12 % to over 200 % at 532 nm compared to photoacoustic spectroscopy (PAS) measurements for aerosols over the Gulf of Mexico, which included BC, nitrate, sulfate and organic aerosols from shipping emissions. The PSAP biases were found to be positively correlated to the organic aerosol mass concentration and even more strongly correlated to the ratio of the organic aerosol to light-absorbing carbon mass. To verify these measurements, Cappa et al. (2008) performed laboratory experiments using secondary organic aerosol (SOA) derived from the ozonolysis of α-pinene, which had a SSA > 0.998 at 532 nm. A key finding of this study was that for external mixtures of SOA and soot, the PSAP absorption could be biased high by a factor 2.6, consistent with the findings of Lack et al. (2008). Cappa et al. (2008) also found that the magnitude of the absorption bias was strongly dependent upon the filter transmittance and that the bias was both immediate (clean filter) and cumulative (filter previously exposed to absorbing material). The results from both of these studies (Cappa et al., 2008; Lack et al., 2008) were independent of the correction scheme applied (Bond et al., 1999; Virkkula et al., 2005).
More recently, Subramanian et al. (2010) derived the BC mass absorption coefficient (MAC) at 660 nm for fresh and 1–2 d old aerosol emissions in and around Mexico City by dividing the absorption coefficients measured using a PSAP by the refractory BC mass concentrations measured using a single-particle soot photometer (SP2, Droplet Measurement Technologies). For the fresh emissions, they found a ∼50 % enhancement in their measured BC MAC relative to the value reported by Bond and Bergstrom (2006), whose review was based on an extensive range of measurements. The BC MAC bias was attributed in part to an overestimation of the absorption coefficients measured by the PSAP due to externally mixed liquid-like organic matter. However, the BC MAC values for the relatively thickly coated, aged BC further from the city were in line with those estimated by Bond and Bergstrom (2006), which the authors suggested may indicate that biases in filter-based measurements relating to high organic aerosol loading may only be present when organic aerosol is externally mixed with BC (Subramanian et al., 2010).
Using a similar methodology, McMeeking et al. (2011) derived the BC MAC at 550 nm using PSAP and SP2 measurements for urban pollution aerosols around the UK, reporting organic aerosol mass concentrations in the range 1–7 µg m−3. The work by Lack et al. (2008) indicates that a positive absorption bias of up to 50 % would be expected at these loadings; however, no bias in the BC MAC was observed. McMeeking et al. (2011) postulated that this result could be due to limitations in the PSAP and SP2 measurements or a physical effect whereby absorption enhancements due to coatings were offset by the collapse of fractal BC aggregates (McMeeking et al., 2011). Indeed, another explanation for this discrepancy could have been that the organic aerosol sampled here was not quasi-liquid like and contributed different biases to those seen in previous studies.
Biases in filter-based absorption photometry measurements can limit the accurate determination of key climate-relevant parameters including, for example, the aerosol SSA and absorption Ångström exponent (AAE) (e.g. Sherman and McComiskey, 2018). Mason et al. (2018) compared PAS to filter-based absorption measurements of wildfires and agricultural fires over the continental United States during August and September 2013, which included a PSAP and a continuous light absorption photometer (CLAP) (Ogren et al., 2017). All PSAP and CLAP data were corrected using the Bond et al. (1999) and Ogren (2010) corrections. Biases in filter-based measurements were evaluated by comparison to PAS measurements, which were in the range 0.61 to 1.24, dependent on measurement wavelength (405, 532 and 660 nm). Mean SSA and AAE values derived using filter-based absorption photometry were found to be in error by up to 0.03 and 0.7, respectively, compared to PAS.
Further, Backman et al. (2014) assessed the sensitivity of the PSAP-derived AAE to the Bond et al. (1999) and Virkkula (2010) correction schemes for measurements recorded on the central Highveld in South Africa, where emissions were dominated by fossil-fuel burning activities including from coal-fired power plants. They found that the AAE varied between 1.34 and 1.96, dependent upon the PSAP correction scheme applied, which led to different conclusions regarding the aerosol composition and source (Backman et al., 2014).
Despite this body of previous work, there remains significant uncertainty related to the magnitude of biases in filter-based absorption measurements, particularly regarding dependence on source type and the correction scheme applied. The aim of this study is to address this gap. We assess biases by comparing absorption coefficients determined using multi-wavelength TAP and photoacoustic instruments during a series of research flights aboard the UK Facility for Airborne Atmospheric Measurements (FAAM) BAe-146 aircraft. Aerosol sources sampled include urban aerosol emissions over London, fresh biomass burning aerosol (BBA) over West Africa and aged BBA over the Southeast Atlantic Ocean (see Fig. 2). We follow the methodology of Lack et al. (2008) by looking at the absorption biases as a function of organic aerosol concentration, extending their study by looking at a greater range of wavelengths and aerosol sources as well as evaluating additional correction schemes, namely those developed by Virkkula (2010) and Müller et al. (2014). We then assess the impact that biases in filter-based absorption photometry have on the aerosol SSA and AAE. This is the first study to simultaneously evaluate the Bond et al. (1999), Virkkula (2010) and Müller et al. (2014) correction schemes for ambient aerosol sampling across multiple aerosol types.
2.1 Principles of filter-based absorption photometry
Filter-based absorption photometers measure the light transmitted through a filter as particles are deposited onto the filter such that the attenuation can be defined as
where Is and Ir are the intensities of light transmitted through a filter corresponding to a sample spot (i.e. an area of the filter with deposited aerosols) and reference spot (i.e. an area of the filter without deposited aerosols), respectively (Ogren et al., 2017). The attenuation coefficient can thus be determined using
where A is the area of the aerosol deposited onto a filter, Q is the flow rate of the aerosol-laden stream pulled through a filter, Δt is the time between successive measurements of light attenuation, and I(t) and I(t+Δt) are the light attenuations at times t and t+Δt (Ogren et al., 2017). To correct for apparent and enhanced absorption, we applied the correction schemes developed by Bond et al. (1999), Virkkula (2010) and Müller et al. (2014), which will be referred to as , and respectively. See Sect. 2.1.1–2.1.3. The code used to run the analysis presented in this paper, i.e. relating to the equations presented throughout this section, was implemented in Python.
2.1.1 The Bond et al. (1999) correction scheme (B1999)
The Bond et al. (1999) correction scheme was developed empirically by comparing PSAP absorption coefficients to reference absorption coefficients determined using the difference between extinction as measured by an optical extinction cell and scattering coefficients measured using a nephelometer. Calibration aerosols included polydisperse nigrosin and ammonium sulfate. This correction scheme was updated by Ogren (2010). Bond et al. (1999) found that
with
and where bsp is the scattering coefficient, K1=0.02, K2=1.22 and Tr is the normalised filter transmittance, defined as (Ogren et al., 2017)
This correction scheme was derived at the wavelength 550 nm and is generally assumed to apply over the entire range of visible wavelengths, though there is no empirical basis for this (Bond et al., 1999; Ogren, 2010).
2.1.2 The Virkkula (2010) correction scheme (V2010)
The Virkkula et al. (2005) correction scheme and the subsequent Virkkula (2010) erratum were derived for the PSAP wavelengths 467, 530 and 660 nm, which is reflected by the f(Tr,λ) term described below. The scheme was derived by comparing absorption coefficients determined using a multi-wavelength PSAP to those measured using either photoacoustic spectroscopy or to absorption derived by subtracting scattering from extinction measurements (Virkkula et al., 2005). Calibration aerosols included kerosene soot, graphite, diesel soot, ammonium sulfate and polystyrene latex spheres. Virkkula (2010) proposed that
where
and where k0, k1, h0, h1 and s are wavelength-dependent constants and ω0 is the wavelength-dependent SSA. The values of the constants used in this study were taken directly from Table 1 in Virkkula (2010) and are provided in Table 1. The wavelengths at which these constants were derived differ to those used in the TAP by 2 and 8 nm at the green and red wavelengths, respectively. It is unclear how these constants depend on wavelength. To assess the impact that this wavelength mismatch might have on the absorption coefficients derived using the V2010 correction scheme, the single-wavelength V2010 constants were also applied to TAP measurements. These were taken from Table 1 in Virkkula (2010) and are provided in the fifth column of Table 1. This was found to have a moderate impact on the results of this study as discussed in Sect. 3. The Virkkula (2010) correction is an iterative correction scheme due to its dependence on the SSA. Hence the algorithm was run 10 times for each time step, which was sufficient for the absorption coefficient to converge to a single value with a precision better than 0.001 Mm−1.
Table 1The values of the constants used in the Virkkula (2010) correction scheme (Virkkula, 2010).

2.1.3 The Müller et al. (2014) correction scheme (M2014)
The constrained two-stream (CTS) algorithm developed by Müller et al. (2014) includes a two-stream radiative transfer model that explicitly accounts for the optical properties of the filter substrate and deposited particles and is constrained by either the Bond et al. (1999), Virkkula et al. (2005) or Virkkula (2010) parameterisations. This section covers the key equations from Müller et al. (2014) to show how they have been implemented in this study and the reader is referred to Müller et al. (2014) for a full derivation. The M2014 correction scheme makes use of the relationship between the absorption coefficient and the change in particle absorption optical depth, δap, on the filter medium between two measurements separated by a time step Δt, as represented by
For each time step, δap was calculated iteratively by minimising the difference between the measured total optical depth, δtot (filter + particles), and the relative optical depth, δCTS, which is the change in total optical depth of the filter system after collecting a particle relative to the unloaded filter. A Newton-type solver was applied, as suggested by Müller et al. (2014), and required 10 iterations to converge to a precision better than 0.001 Mm−1. δtot was calculated from measurements of the filter, with and without aerosol, using Eq. (1). The equations outlined in Müller et al. (2014) were used to calculate δCTS and are included here for clarity.
where δsp is the particle scattering optical depth, calculated using
where a0=0.1509, , a2=4.5414, , , a5=0.01 and gp is the average weighted particle asymmetry parameter (see Eq. 24). Using the B1999 empirical correction,
where c1=1.555 and c2=1.023, which were derived in Bond et al. (1999); see the alternative formulation of the B1999 correction in Müller et al. (2014). Alternatively, using the V2010 empirical correction,
where c1, c2, h0, h1 and s correspond to the wavelength-dependent constants k0, k1, h0, h1 and s as defined in Sect. 2.1.2, corresponding to the Virkkula (2010) parameterisation. Finally,
where
and T1 and T2 represent the filter transmittances of the particle-loaded and particle-free layers, respectively. These are represented by layers 1a and 1b in Müller et al. (2014), respectively. The filter transmittance and reflectance are given by
and
where
and
The filter scattering optical depths used in this study were , and and the filter absorption optical depths used were , and , as measured by Müller et al. (2014) for the same type of filters. Small differences between wavelengths that the filter optical properties were measured at by Müller et al. (2014) (467, 530, 660 nm) compared to those at which the TAP measures (467, 528, 652 nm) were assumed to be negligible. Following the nomenclature of M2014, for filter layer 1 (the particle-loaded filter layer) χ=0.2 and for layer 2 (the unloaded filter layer) χ=0.8. This assumes that the particle penetration depth into the filter was 20 % and accounts for the fractional filter optical depths corresponding to each layer. The value used for μ1 was . The value gp is the average weighted asymmetry parameter of all particles deposited onto the filter, given by
where i represents the ith ensemble of particles with scattering coefficient . Equation (24) is a practical way to apply Eq. (5) presented in Müller et al. (2014), who instead used an equivalent method, which utilised individual particle scattering cross sections (as opposed to ensemble scattering coefficients). We used Eq. (24) as opposed to the recommended formulation because nephelometer measurements represent an ensemble. In this study, bulk asymmetry parameters (i.e. corresponding to an ensemble of particles) were calculated for each time step using the parameterisation
where bback−sp is the backscattering ratio measured using a nephelometer (Moosmüller and Ogren, 2017).
To confirm the accuracy of the implementation of the M2014 algorithm used during this analysis, Eqs. (16)–(23) were used to reproduce the results in Fig. 6 of the Müller et al. (2014) study, which were verified against intermediate results (Thomas Müller, personal communication, 2016).
2.2 Measurements and instrumentation
All measurements presented in this study were made aboard the UK's BAe-146-301 large Atmospheric Research Aircraft (ARA) operated by the Facility for Airborne Atmospheric Measurements (FAAM; https://www.faam.ac.uk/, last access: 17 June 2019). The aircraft is capable of carrying three crew members, 18 scientists and a total scientific payload of up to 4000 kg with a range up to 3700 km. This section provides information on the filter-based, photoacoustic, nephelometer and aerosol composition instrumentation used aboard the aircraft and introduces the environments in which measurements were made.
2.2.1 Aerosol sampling and conditioning
An important strength of this dataset is that the TAP, PAS and cavity ring-down spectrometer (CRDS) instruments used to sample aerosol optical properties all shared a common sample inlet and were subject to the same flow conditioning. Aerosols were drawn into the aircraft through a modified Rosemount inlet (Trembath et al., 2012). The aerosol-laden stream was first dried to < 20 % relative humidity (Permapure, PD100T-12MSS) and then passed through a scrubber (MAST Carbon) to remove absorbing gaseous impurities such as ozone and nitrogen dioxide. An impactor removed particles with aerodynamic diameter > 1.3 µm (Brechtel, custom design). A series of flow splits (Brechtel 1110 and 1104) evenly distributed the aerosol-laden stream between the suite of instruments, which each sampled the aerosol at a flow rate of 1 L min−1, as shown in Fig. 1. All measurements were corrected to standard temperature and pressure (PAS, CRDS and TAP: 20 ∘C and 1013 mbar).
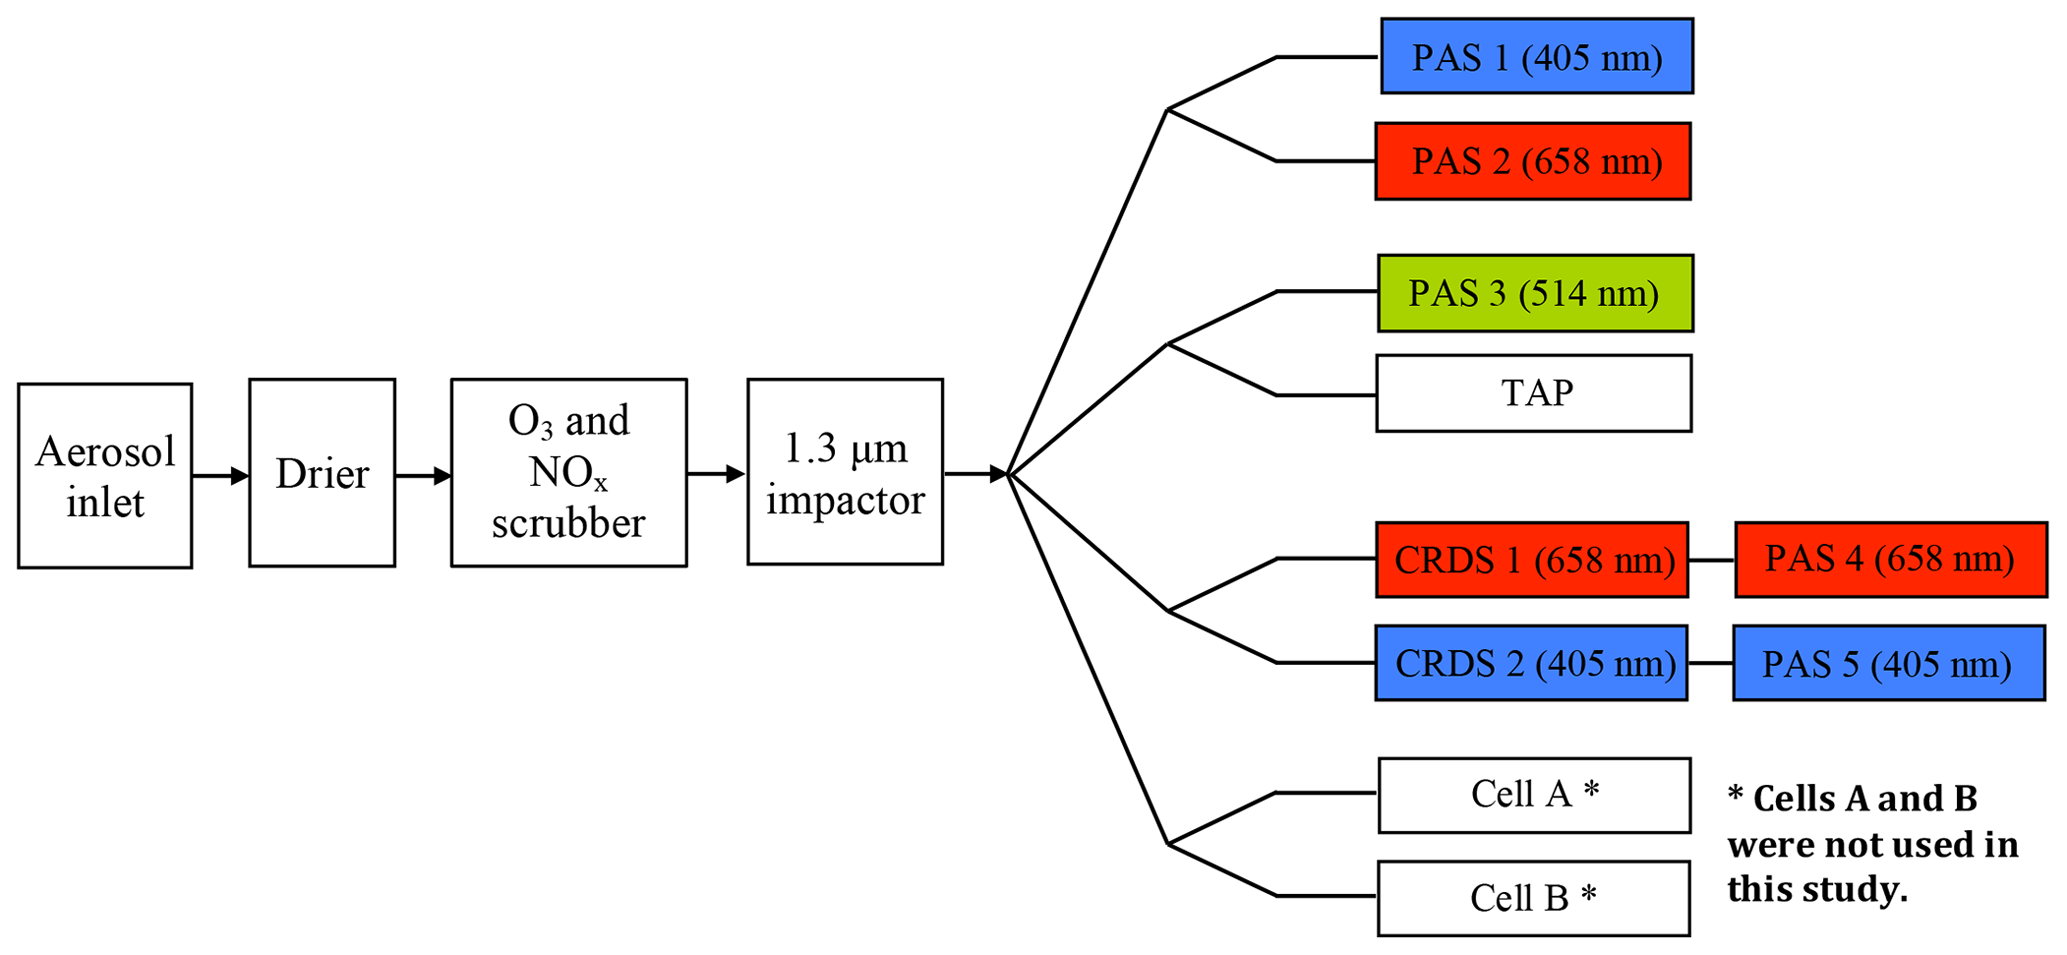
Figure 1Schematic diagram highlighting the flow conditioning and how the aerosol-laden stream was distributed between the PAS and CRDS cells and the TAP. All PAS and CRDS wavelengths were centred at 405, 514 and 658 nm respectively.
2.2.2 Tricolor Absorption Photometer
The TAP is a commercially available (Brechtel) version of the continuous light absorption photometer (CLAP), described by Ogren et al. (2017). The TAP comprises eight sample filter spots and two reference filter spots. The aerosol-laden air passes through one sample spot at a time, which allows for 8 times the filter lifetime compared to single-spot photometers. The filtered air is recirculated through one of the reference spots to enable the attenuation calculation (see Eq. 1) (Ogren et al., 2017). Upon reaching a predefined filter transmittance set point, the TAP automatically changes to the next available sample filter spot. We used 47 mm diameter Pallflex (E70-2075W) glass-fibre filters, which were nominally identical to the filters used to derive the correction schemes applied in this study (see Sect. 2.1.1–2.1.3). The TAP provides measurements at three wavelengths with peaks centred at 467, 528 and 652 nm, which allows the spectral dependence of climate-relevant parameters such as the SSA and AAE to be evaluated (Sect. 3.3). The LEDs are cycled through each wavelength once per second, providing absorption measurements at 1 Hz at all wavelengths. The inlet of the TAP is heated to 35.2±0.2 ∘C to minimise the effects of changing temperature and to prevent water condensing onto the filter. The built-in digital low-pass filter was disabled in all of our measurements to enable calculation of the absorption coefficients from the raw photodiode measurements, as it was unclear how the low-pass filter impacted the measurements. To understand the impact of this on instrument sensitivity, the TAP was run for ∼3 h in the laboratory while it sampled filtered room air to characterise the noise in the system. Uncorrected attenuation coefficients, , were calculated at 1 Hz, and the average and standard deviation for each time interval s) were calculated. The 1σ detection limits at 30 s averaging time were 0.71, 1.37 and 0.89 Mm−1 at wavelengths 652, 528 and 467 nm, respectively. Ogren et al. (2017) calculated the mean 1σ detection limit for their 28 instruments over all three wavelengths to be 0.33 Mm−1. The difference between the detection limits measured in this study, and that presented in Ogren et al. (2017) could be due to running without low-pass digital filtering in the current study and/or differences between the TAP and CLAP. TAP internal particle losses were estimated to be < 1 % for particles with diameters in the range 0.03–2.5 µm (Ogren et al., 2017).
To determine the areas of the spots resulting from particle deposition onto the filter, nigrosin (Sigma Aldrich, product number 198285-100G) was atomised from solution, dried to < 10 % relative humidity using a silica gel diffusion drier (Topas, DDU-570) and sampled by the TAP. The areas of the eight sample spots were determined by measuring the number of pixels corresponding to the diameters in a magnified digital photograph, which yielded areas in the range 32.4–36.8 mm2. The manufacturer-recommended spot sizes are 30.7210 mm2. Filter spot sizes were determined using nigrosin rather than from the ambient aerosol samples themselves as the spot edges were more clearly defined. The spot edges of the deposited ambient aerosol were difficult to detect as the filter spot was changed at the start of each day when measurements were taken. It was possible to detect the aerosol spot for measurements that corresponded to high loadings of absorbing aerosol. In these cases there was evidence of aerosols spreading across the filter and the area of the spots was larger by 5 %–20 %. However, this observation is based on a limited sample of three aerosol spots and the timescale for spread across the filter is unclear. This analysis used the areas determined using the clearly defined nigrosin spots and therefore provides a lower limit of area, absorption coefficient (see Eq. 2), and as will be shown in Sect. 3, the TAP absorption bias.
2.2.3 Photoacoustic and cavity ring-down spectrometers
The photoacoustic and cavity ring-down spectrometers used in this study were based on the designs by Lack et al. (2012) and Langridge et al. (2011), respectively, and are described in detail in Davies et al. (2018) and Szpek et al. (2019). PAS measures absorption directly for aerosols in their suspended state (Arnott et al., 1999). The PAS principle relies on converting energy from a light source into sound. Light-absorbing media, such as aerosol, transfer electromagnetic energy into thermal energy that heats the surrounding air. This gaseous heating generates a pressure wave, which is detected by a microphone located within the PAS cell. The amplitude of the microphone signal is related to the sample absorption coefficient through calibration (Arnott et al., 1999; Davies et al., 2018; Moosmüller et al., 2009).
Much of this analysis relies on accurate PAS absorption measurements and thus we focus here on describing the uncertainty associated with these measurements. The total PAS measurement uncertainty is comprised of the measurement precision and accuracy. The PAS measurement precision was derived by evaluating the minimum sensitivities of the suite of PAS instruments in a similar way to the TAP, as described in Sect. 2.2.2, and were in the range 0.01–0.06 Mm−1 for 30 s averaging across the range of cells used. The minimum sensitivities of the suite of CRDS cells were evaluated in the same way and were found to be 0.02–0.05 Mm−1 across the range of cells used.
The accuracy of PAS absorption measurements was determined primarily by three factors: (i) uncertainty in the ozone calibration, (ii) uncertainty in corrections applied to account for the PAS microphone pressure sensitivity and (iii) uncertainty in subtraction of background noise which arose primarily from laser heating of the PAS cell optical windows. We consider each of these in turn below.
The accuracy of the PAS ozone calibration has previously been evaluated in laboratory experiments that compared measured and modelled absorption and extinction cross sections of strongly absorbing nigrosin aerosol. This analysis showed the PAS calibration accuracy to be better than 8 % and the accuracy of the CRDS instruments used in this study to be better than 2 % (Davies et al., 2018). Moreover, our recent work has demonstrated that the calibration accuracy of PAS using ozone is optimal when the gas-phase composition closely resembles that of ambient air (Cotterell et al., 2019), as is the case for calibrations performed for this work.
The second source of PAS measurement uncertainty was due to the PAS microphone sensitivity to pressure, which was evaluated by performing ozone calibrations at several pressures in the range 600–1000 mbar (typical of those encountered during airborne operation). The measured PAS microphone sensitivities were fit to a linear trend across this range and normalised to yield a correction factor that varied from 0.83 (600 mbar) to 1.00 (1000 mbar). The uncertainty introduced by applying this pressure-dependent correction to PAS calibrations was estimated by propagating the 1σ fitting uncertainties in the linear regression between the calibration factors to in-flight PAS measurements, which led to uncertainties in PAS absorption coefficient measurements of 0.0 %–1.2 %. The smallest uncertainties were associated with measurements around 1000 mbar where there was no correction applied and the largest for relatively low pressures where the largest correction was applied.
The third source of PAS measurement uncertainty was due to subtraction of window-generated background noise, which is unstable for airborne operation due to its dependence on pressure. To account for this, in-flight background noise is typically characterised by periodically measuring a filtered-air stream for 30 s every 300 s. These measurements are then used post-flight to derive a background correction as a function of pressure. To evaluate the uncertainty introduced by this background noise correction, we took continuous PAS measurements of filtered air in the laboratory and varied the pressure within the PAS cells over the range encountered during airborne operation. This laboratory PAS dataset was then processed to mimic in-flight conditions, with 30 s windows of data every 300 s being used to derive a continuous pressure-dependent background correction. Examining the difference between the continuous filtered-air measurements and the synthetically generated background data series provided the uncertainty in the background noise correction under variable pressure conditions. The uncertainty in the background noise correction was found to be normally distributed, with a 1σ width of 1.81 %–2.30 % across the range of cells used. This uncertainty was propagated through in-flight PAS data processing to derive the uncertainties introduced to airborne PAS absorption coefficient measurements from the background noise subtraction. The uncertainty was found to be 0.27–0.54 Mm−1, which led to larger percentage uncertainties for lower absorption coefficients. The noise performance was no worse than a factor of 2 larger for airborne operation.
The total uncertainty in PAS measurements is the combination of the measurement precision and accuracy, including the PAS calibration accuracy, the pressure-dependent calibration correction uncertainty and the background noise correction uncertainty. These factors were combined in quadrature, leading to total PAS measurement uncertainties of 29.0 %–55.0 % for 1 Mm−1 absorption coefficient measurements across the range of cells used (independent of pressure) and approximately 8.1 % for 100 Mm−1. These uncertainties are in-line with previous estimates for airborne PAS measurements, which were found to be ±5 % for ground-based measurements with an additional ±0.5 Mm−1 for airborne measurements (Lack et al., 2012a).
2.2.4 Additional measurements
Nephelometer measurements (TSI 3563) were used to derive the aerosol asymmetry parameter needed to apply the Müller et al. (2014) correction scheme (see Sect. 2.1.3) and were corrected according to Müller et al. (2011). A time-of-flight aerosol mass spectrometer (TOF-AMS) (e.g. Drewnick et al., 2005) measured the aerosol composition. The TOF-AMS was run as described in previous publications (e.g. Morgan et al., 2010).
2.2.5 Data averaging
All absorption, scattering and extinction coefficient data measured using the PAS, TAP, CRDS and nephelometer were recorded at 1 Hz. Data were subsequently averaged to 30 s during post-flight analysis to reduce the noise in these measurements and to aid temporal alignment of the PAS and TAP for direct comparisons. In the case of TAP measurements, the intensities of light transmitted through a filter were first averaged to 30 s and then input into Eqs. (1)–(9) to determine the corresponding absorption coefficients. To account for time lags between the PAS and TAP, an optimisation routine was run that maximised the correlation coefficient (R2) between the absorption coefficients determined using the PAS and TAP by delaying one instrument relative to the other. There was no time lag between the PAS and CRDS when using an averaging time of 30 s. Time alignment was verified by visually confirming that the rising and falling edges of the peaks in the absorption coefficients aligned.
2.2.6 Flights and meteorology
This study uses data collected aboard the FAAM aircraft during 30 research flights (each 3–4 h duration) in three distinct regions: London (three flights, 17 to 20 July 2017, from 1.7∘ W to 2.0∘ E and from 50.6 to 52.9∘ N), West Africa (three flights, 28 February to 1 March 2017, from 14.2 to 17.6∘ W and from 9.6 to 14.8∘ N) and the Southeast Atlantic Ocean (24 flights, 16 August to 7 September 2017, from 8.0 to 18.6∘ W and from 4.6∘ N to 10.9∘ S). Figure 2 shows a map with the flight tracks indicated. All flights involved straight and level runs as well as deep profiles. Also shown in Fig. 2 are the mean aerosol optical depths (AODs) measured using the Moderate Resolution Imaging Spectroradiometer (MODIS) instruments aboard the Terra and Aqua satellite platforms (Remer et al., 2013) for each measurement period. The mean AOD for each region is shown corresponding to all satellite overpasses during the flight periods for both MODIS instruments. Figure 2 also shows time series of the columnar AOD values measured using the Aerosol Robotic Network (AERONET) for the Chilbolton and Oxford (∼95 km southwest and northwest of London respectively), Dakar (West Africa) and Ascension Island (Southeast Atlantic Ocean) sites.
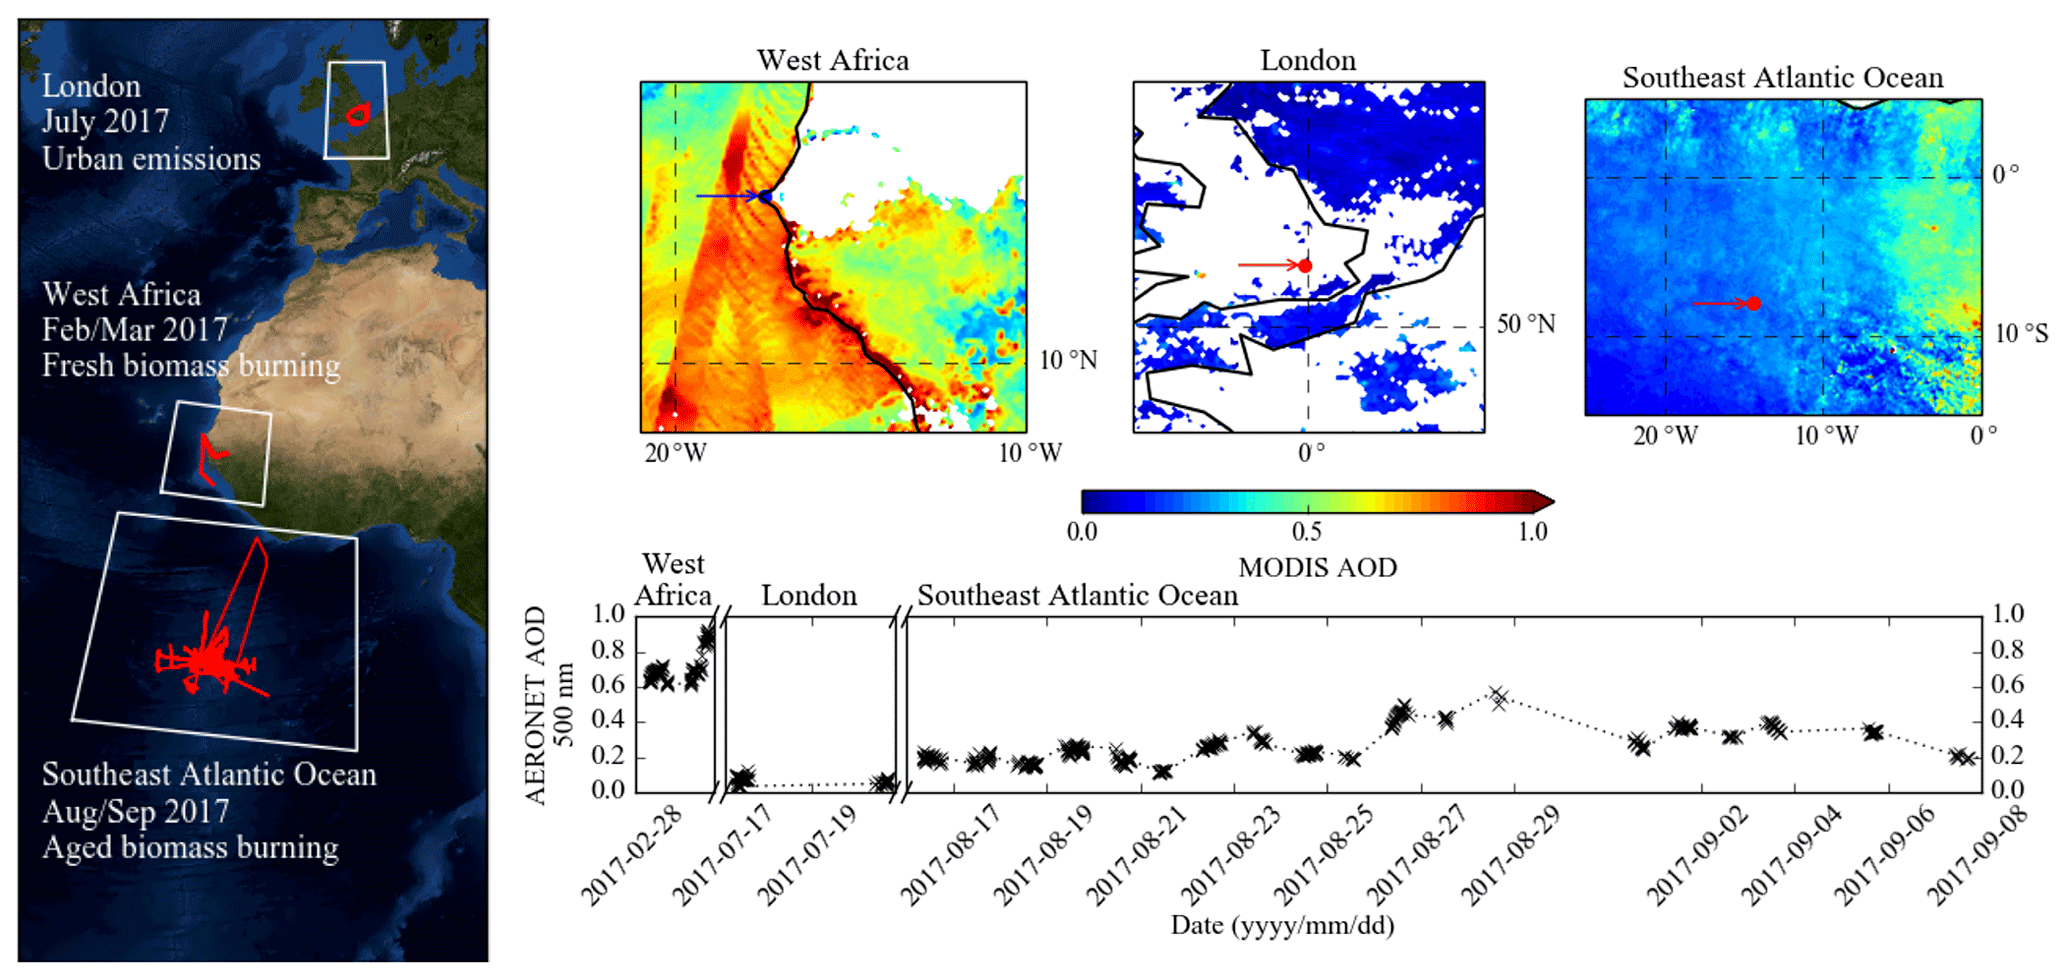
Figure 2FAAM research aircraft flight tracks (red) over London in the United Kingdom (July 2017), West Africa (February and March 2017) and the Southeast Atlantic (August and September 2017). For each of the geographical areas highlighted in the white boxes, the mean aerosol optical depths (AODs) measured using the Moderate Resolution Imaging Spectroradiometer (MODIS) satellite instruments are displayed. A time series of Aerosol Robotic Network (AERONET) data shows AODs at 500 nm corresponding to each measurement period. Note the discontinuous AERONET AOD time axis. AERONET sites are shown on the MODIS AOD plots by arrows.
Urban emissions. During 17–20 July 2017, back trajectory analysis shows north-westerly flow brought air masses from over the Irish Sea to London (Rolph et al., 2017; Stein et al., 2015; available at http://ready.arl.noaa.gov/HYSPLIT_traj.php, last access: 17 June 2019). Flights provided measurements of regional background aerosol (northwest London) as well as the London pollution plume (southeast London). AOD values of ∼0.00–0.13 were measured using the AERONET sites at Chilbolton and Oxford during the measurement period, as shown in Fig. 2. Mean in-flight carbon monoxide (CO) concentrations were 98 ppbv, indicating the presence of fossil-fuel burning, for example from transport emissions and industrial processes (e.g. Dentener et al., 2001). These flights predominantly sampled the boundary layer with a maximum aircraft altitude of 2.2 km.
Fresh biomass burning emissions. Flights over West Africa were dominated by freshly emitted BBA encountering similar conditions to those sampled during previous FAAM flight campaigns at the same time of year (e.g. DABEX; Haywood et al., 2008). Low-level flying through visible smoke plumes enabled measurements of fresh BBA within a few minutes of emission. During the measurement period, MODIS measured mean AOD values ∼0.5–0.7 over large swaths of West Africa, > 1.0 near to the coast and ∼0.5–1.0 over the Atlantic Ocean offshore of West Africa, and AERONET reported AOD values in the range ∼0.5–0.9 over Dakar, as shown in Fig. 2. Many flights targeted measurements close to the source and were dominated by fresh BBA emissions. The impact of dust on our PAS, TAP and CRDS measurements was minimised because of the 1.3 µm aerodynamic impactor used. Based on the scattering Ångström exponent, there was likely a dust influence on this fresh BBA dataset. Mean in-flight CO concentrations were 175 ppbv although concentrations greater than 14 000 ppbv were measured when flying through plumes close to the aerosol source, indicative of fresh biomass burning emissions.
Aged biomass burning emissions. Flights around Ascension Island sampled aged biomass burning aerosols transported from mainland southern Africa in a general anticyclonic circulation (e.g. Garstang et al., 1996; Zuidema et al., 2016). East of ∼8∘ W, MODIS reported mean AOD values generally between 0.1 and 0.5 and up to ∼0.8 in the east of the area in which flights occurred. AERONET consistently measured AOD values between 0.1 and 0.5 over Ascension Island (the campaign base) during the entire 4-week measurement period. Mean CO concentrations were 126 ppbv, confirming that emission likely originated from a combustion source. Flights were performed in both the boundary layer and free troposphere. Based on HYSPLIT back trajectories, aerosols had generally undergone ∼1 week of atmospheric transport since emission.
3.1 TAP–PAS comparisons
The primary result of this study is that the absorption coefficients determined using a TAP and PAS are linearly correlated and that the slope (Rabs) is dependent upon the aerosol source, measurement wavelength and the correction scheme applied to the TAP measurements. Scatter plots showing the relationship between absorption coefficients measured simultaneously by the TAP and PAS for urban, fresh and aged BBA are shown in Figs. 3–5 respectively. Tight correlations between TAP and PAS measurements were observed across all aerosol sources and for all correction schemes. All linear regressions between TAP and PAS measurements were forced through the origin. A summary of Rabs can be found in Table 2.
Table 2A summary of the slopes (Rabs) between PAS and TAP absorption coefficients. Correlation coefficients (R2) are also provided. P10 and P90 are the 10th and 90th percentiles of each dataset. All absorption coefficients correspond to > 1 Mm−1. All linear regressions were forced through the origin.
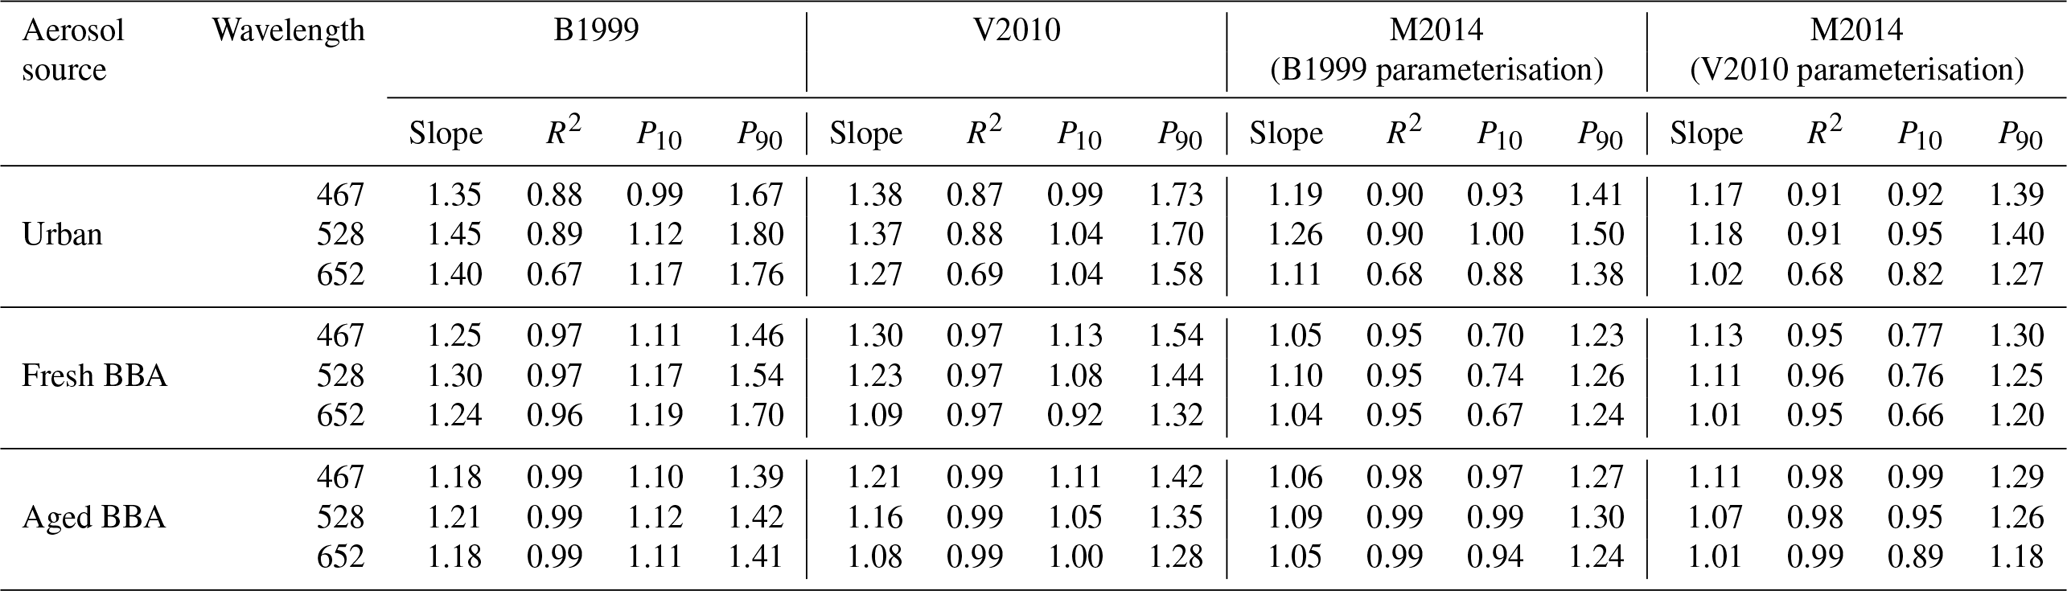
For the B1999 correction scheme, the range of TAP biases across all aerosol sources was 1.18–1.45. The smallest biases were consistently associated with 467 or 652 nm wavelength measurements and the largest for 528 nm wavelength measurements. An interesting feature of this result is that the B1999 scheme led to the largest biases at 528 nm, which is the wavelength closest to that at which the scheme was derived.
For the V2010 correction scheme, the range of TAP biases across all aerosol sources was 1.08–1.38. The largest biases were consistently at 467 nm and the smallest at 652 nm. Relative to the B1999 correction scheme, the V2010 scheme reduced the biases at 528 and 652 nm by 5 %–15 % while it increased the bias at 467 nm by 3 %–5 %, dependent on the aerosol source. The sensitivity of TAP biases to the wavelength-dependent constants used in the V2010 scheme was investigated due to the mismatch in the TAP wavelengths and those for which the V2010 correction scheme was derived. Applying the single-wavelength V2010 correction scheme (i.e. applicable at all wavelengths) decreased TAP biases by 7 %–9 % at 467 nm, increased biases by 1 % at 528 nm and increased biases by 6 %–8 % at 652 nm.
For the M2014 (B1999 parameterisation) correction scheme, the range of TAP biases across all aerosol sources was 1.04–1.26, and for the M2014 (V2010 parameterisation) the range of TAP biases was 1.01–1.18. The M2014 (V2010 parameterisation) scheme reduced TAP biases relative to the B1999 and V2010 schemes by 7 %–38 % and 7 %–25 %, respectively, dependent on the aerosol source and wavelength. The most significant reductions in TAP biases were for urban aerosol emissions and had the most impact on measurements at 652 nm. As discussed in Sect. 2.1.3, the M2014 (V2010 parameterisation) correction scheme applied here used the wavelength-dependent Virkkula (2010) parameterisation, in contrast to Müller et al. (2014), who applied the Virkkula et al. (2005) parameterisation. Although not shown, applying the Virkkula et al. (2005) parameterisation to TAP data in this study would act to decrease TAP biases by 3 %–4 % at 467 nm and increase biases by 1 %–2 % at 528 nm and by 3 % at 652 nm.
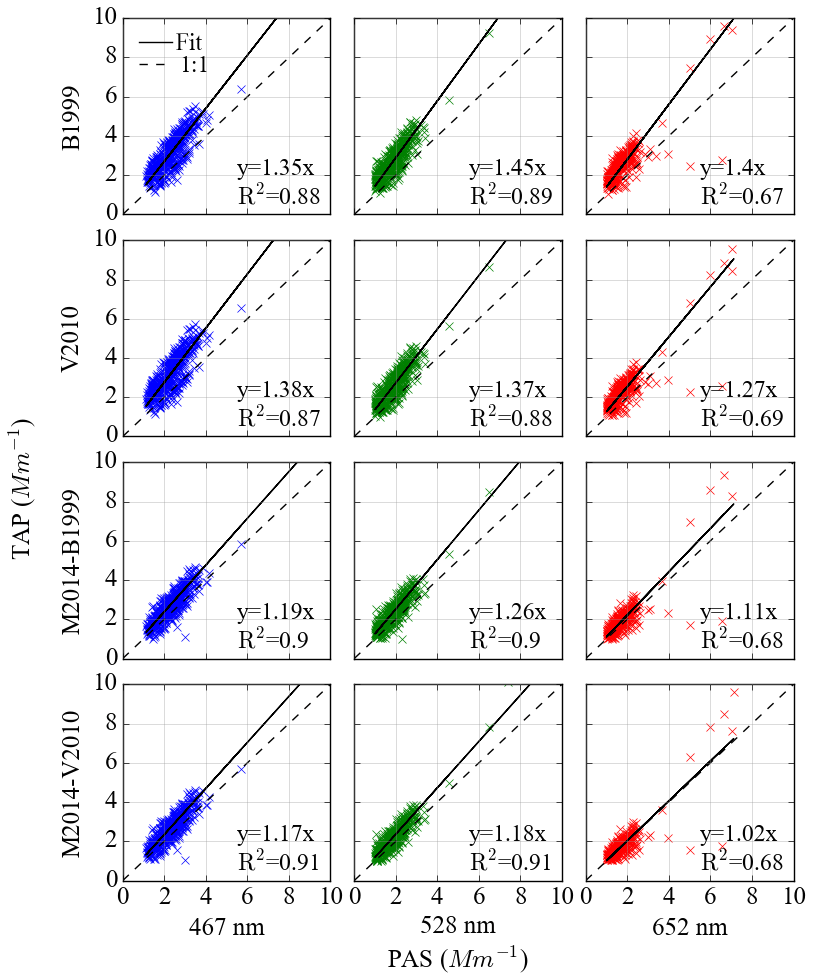
Figure 3Absorption coefficients measured by PAS versus TAP for urban emissions around London in July 2017. The columns correspond to 467 nm (column 1), 528 nm (column 2), and 652 nm (column 3) wavelengths, and the rows correspond to the B1999, V2010 and M2014 corrections. All absorption coefficients correspond to > 1 Mm−1. All linear regressions were forced through the origin.
The Rabs from Figs. 3–5 provide the mean TAP absorption coefficient biases for all measurements corresponding to each measurement wavelength and aerosol source, but it is pertinent to examine the range of biases corresponding to individual 30 s average measurements. Examining the 10th and 90th percentiles of each dataset (see Table 2) revealed that 10 % of TAP measurements were biased by greater than 1.67–1.80, 1.46–1.70 and 1.39–1.42 for urban, fresh BBA and aged BBA when corrected using the B1999 scheme, respectively, dependent on wavelength. The M2014 (V2010 parameterisation) scheme reduced the biases with 10 % of measurements biased greater than 1.27–1.40, 1.20–1.30 and 1.18–1.29 for urban, fresh BBA and aged BBA, respectively, dependent on wavelength.
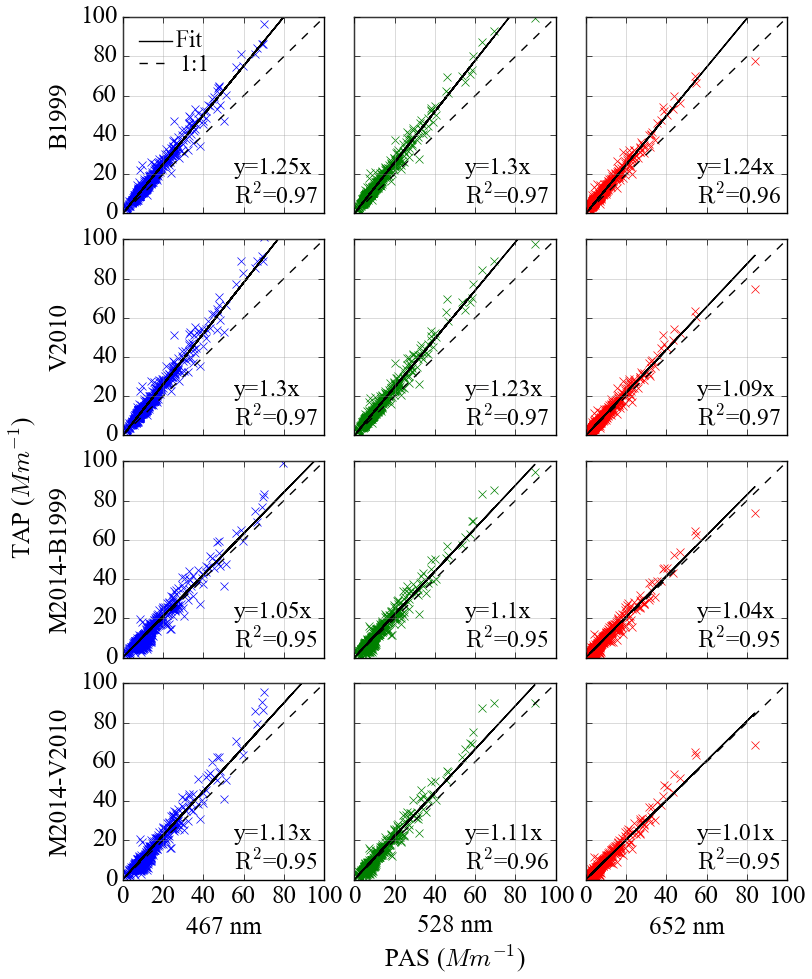
Figure 4As Fig. 3 but for fresh biomass burning aerosol over Senegal in February and March 2017.
An analysis of the dependence of TAP bias as a function of filter loading revealed no point-by-point dependence but potentially a weak signal in the large-scale mean such that the difference in absolute filter transmittance associated with the highest 10 % of TAP biases compared to the lowest 10 % of biases across all channels and wavelengths was up to 0.12. The filter transmittance changed over the course of a flight by a maximum of 0.21.
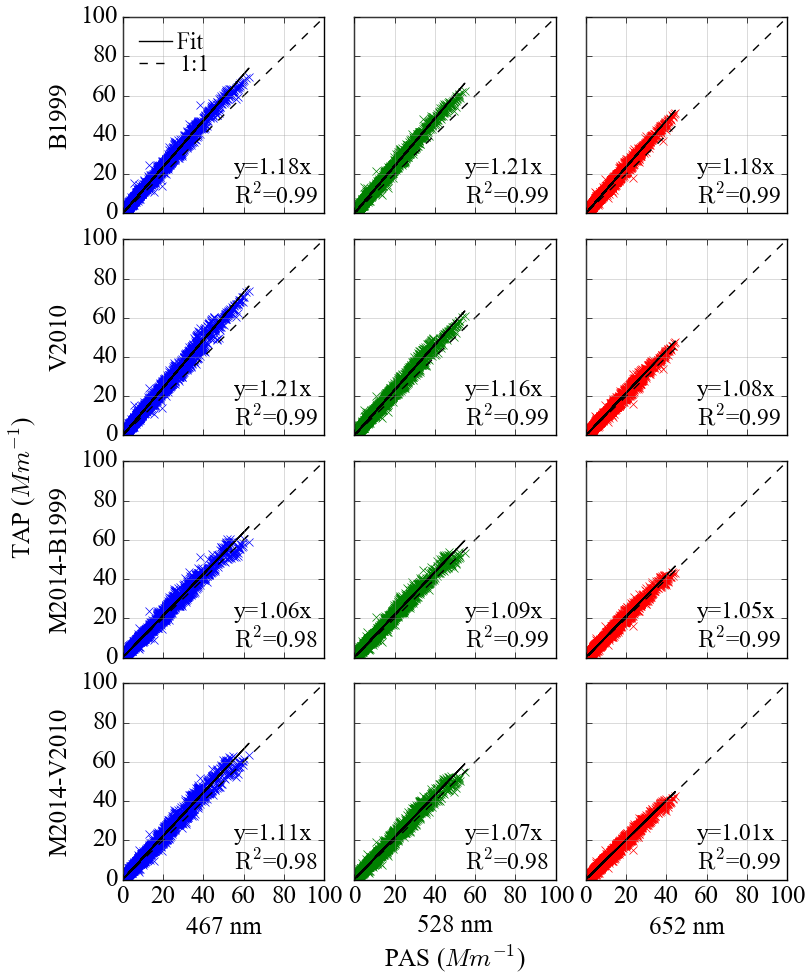
Figure 5As Fig. 3 but for aged biomass burning aerosol over the Southeast Atlantic Ocean in August and September 2017.
The TAP biases exhibited a strong wavelength dependence. In general, the lowest biases were seen at 652 nm and the largest biases at 467 nm when the V2010 and M2014 (V2010 parameterisation) schemes were applied to TAP measurements for all aerosol sources. The exceptions to this trend were when the M2014 scheme (V2010 parameterisation) was applied to urban aerosol measurements, which led to the largest biases at wavelength 528 nm. The M2014 scheme (B1999 parameterisation) also led to the largest biases at 528 nm for all aerosol types.
As highlighted in the introduction, filter-based absorption photometers are sensitive to the particle penetration depth, which is dependent on particle size. Indeed, this sensitivity may have contributed in part to the variation in TAP biases observed for the three types of aerosol investigated during this study.
Perhaps the most important and robust observation is that the M2014 scheme consistently led to the lowest biases across all measurement wavelengths and aerosol sources investigated. The largest biases were associated with TAP measurements corrected using the B1999 scheme at wavelengths 528 and 652 nm and when using the V2010 scheme at wavelength 467 nm for all aerosol sources.
3.2 Evaluating TAP biases as a function of the organic aerosol mass concentration
The biases of 1 %–45 % observed in this study are at the lower end of those measured by Lack et al. (2008) and Cappa et al. (2008), who reported biases of 12 % to ∼200 %, dependent upon the OA concentration. To investigate this apparent discrepancy, we evaluated the TAP biases as a function of the OA mass concentration measured using an Aerodyne aerosol time-of-flight mass spectrometer (TOF-AMS, Aerodyne Research Inc.) (e.g. Drewnick et al., 2005).

Figure 6The ratio of TAP to PAS absorption coefficients at 528 nm as a function of the organic aerosol mass concentration using the B1999 correction scheme (a–c) and as a function of the ratio of the organic aerosol to light-absorbing carbon mass concentrations when using the B1999 correction scheme (d–f) and using the M2014 (V2010 parameterisation) correction scheme (g–i). All absorption coefficients correspond to > 1 Mm−1.
Figure 6a–c show how TAP biases vary with OA mass concentration for TAP measurements corrected using the B1999 correction scheme, for direct comparison with the Lack et al. (2008) study. The linear relationship between the PSAP biases and OA observed by Lack et al. (2008) is superimposed for reference. For urban emissions (Fig. 6a), TAP biases and OA mass are positively correlated, and the trend is broadly consistent with that observed by Lack et al. (2008). There is however no correlation for fresh (Fig. 6b) or aged BBA (Fig. 6c).
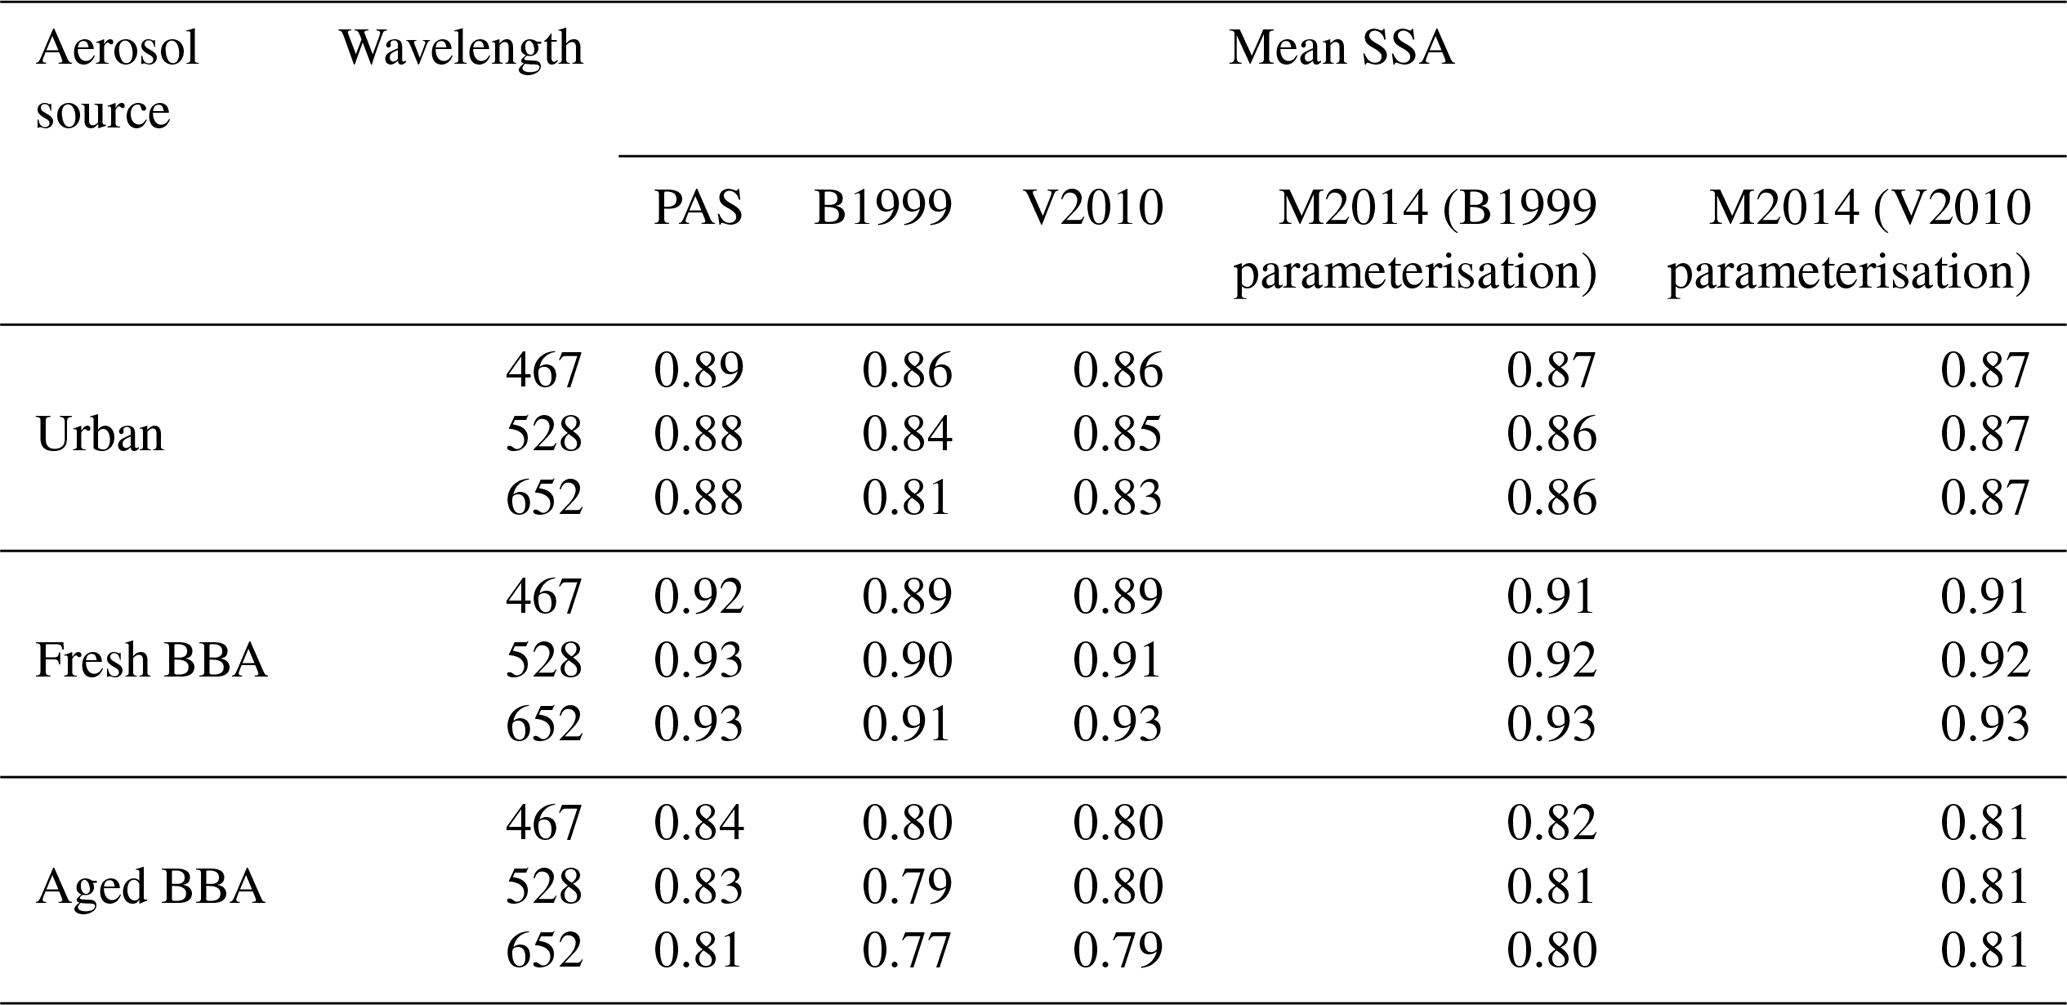
Table 3Campaign-mean single-scattering albedo (SSA) derived using PAS and CRDS measurements and TAP and CRDS measurements.
TAP biases were also plotted as a function of the ratio of the mass concentrations of OA to light-absorbing carbon (LAC), denoted by ROA∕LAC. This was calculated using the method outlined by Lack et al. (2008) by (i) assuming all absorbing mass was black carbon, (ii) converting the mass absorption coefficient (MAC) of black carbon (BC) at 532 nm (7.75 m2 g−1) to the PAS measurement wavelength 528 nm by using a BC AAE of 1 and the method outlined by Moosmüller et al. (2011), and (iii) dividing the PAS-measured absorption coefficient at wavelength 528 nm by the BC MAC at 528 nm. Hence the mass concentration of LAC was calculated as such that (Bond and Bergstrom, 2006; Lack et al., 2008). Figure 6d shows that the TAP bias is positively correlated with ROA∕LAC for urban aerosol emissions when TAP measurements were corrected using the B1999 correction. This is consistent with the Lack et al. (2008) observation although our study shows lower biases. A likely contributor to this difference is that, for consistency with the Lack et al. (2008) study, this analysis assumed all absorption was due to BC. In reality this is a poor assumption for BBA emissions (e.g. Andreae and Gelencsér, 2006) and provides a maximum bound on the MAC value, a minimum bound on absorption attributed to LAC and therefore a maximum bound on ROA∕LAC. A more realistic approach would be to use the MAC value corresponding to BC plus BrC. Using a lower MAC to account for absorption contributions from both BC and BrC would lead to smaller ROA∕LAC values than those shown in Fig. 6d–f and better agreement with the Lack et al. (2008) study. Correcting the TAP data using the M2014 (V2010 parameterisation) correction scheme reduces the positive correlation between TAP biases and both ROA and ROA∕LAC as shown in Fig. 6g–i. This further demonstrates the improvement provided by using the M2014 scheme.
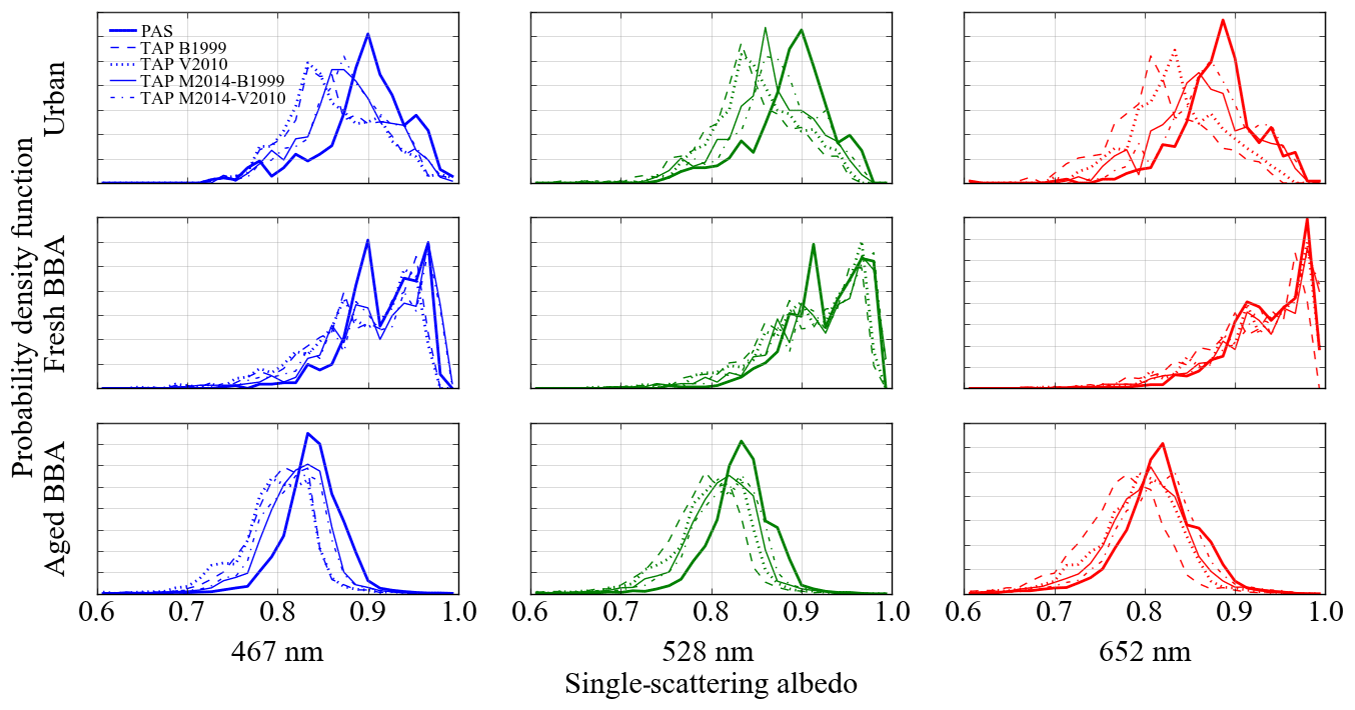
Figure 7Probability density functions of the single-scattering albedo derived using (i) PAS and CRDS and (ii) TAP and CRDS for the range of TAP correction schemes outlined in Sect. 2.1.1–2.1.3 at wavelengths 467, 528 and 652 nm. All absorption coefficients correspond to > 1 Mm−1.
This analysis was repeated at wavelengths of 467 and 652 nm. For measurements at 652 nm, where BrC absorbs relatively weakly (e.g. Andreae and Gelencsér, 2006), stronger correlations between TAP biases and ROA and ROA∕LAC were seen compared to 528 nm measurements. This improved the agreement with Lack et al. (2008). For measurements at 467 nm, where BrC absorbs relatively strongly, weaker correlations between TAP biases and ROA∕LAC were seen compared to 528 nm measurements. This reduced the agreement with Lack et al. (2008) for reasons described above. As for observations at 528 nm, TAP biases showed little dependence on ROA and ROA∕LAC when corrected using the M2014 scheme at 652 and 467 nm. This finding suggests that the source of discrepancy between the results presented in this study and the results of Lack et al. (2008) (i.e. Fig. 6) may be caused by the less advanced correction scheme applied to the Lack et al. (2008) data. However, given the strong dependence of Rabs on the aerosol type and source in Fig. 6, the bias dependence on organic fraction in the Lack et al. (2008) data may well persist, independent of the correction scheme used, because of the different aerosol sources and source locations being studied.
A key result of this analysis is to show that biases observed in filter-based aerosol absorption measurements are strongly dependent on the type of aerosol being sampled. Correlating biases to aerosol composition information may provide tight constraint for a single source study, such as that observed by Lack et al. (2008) for aerosol emissions over the Gulf of Mexico, but care must be taken when applying these findings more broadly to other aerosol types.
3.3 Impact of TAP biases on climate-relevant parameters
We now assess the impact that the observed TAP biases may have on climate-relevant parameters including the aerosol single-scattering albedo and absorption Ångström exponent. Figure 7 shows histograms of the SSA derived using PAS or TAP absorption data together with CRDS extinction data for the aerosol sources described in Sect. 2.2.6 and for the TAP corrections described in Sect. 2.1.1–2.1.3. The SSA is biased towards lower values when derived using TAP measurements, consistent with the results in Figs. 3–5 which typically show a ∼1 %–45 % high bias in absorption. Campaign-mean SSA values derived using PAS and CRDS measurements for each measurement campaign are summarised in Table 3. The mean SSA values derived using TAP and CRDS measurements matched those derived using PAS measurements most closely for fresh BBA, which were biased low by 0.00–0.03, dependent on measurement wavelength and the TAP correction scheme applied.
Table 4Campaign-mean absorption Ångström exponent (AAE) derived using PAS and TAP measurements.
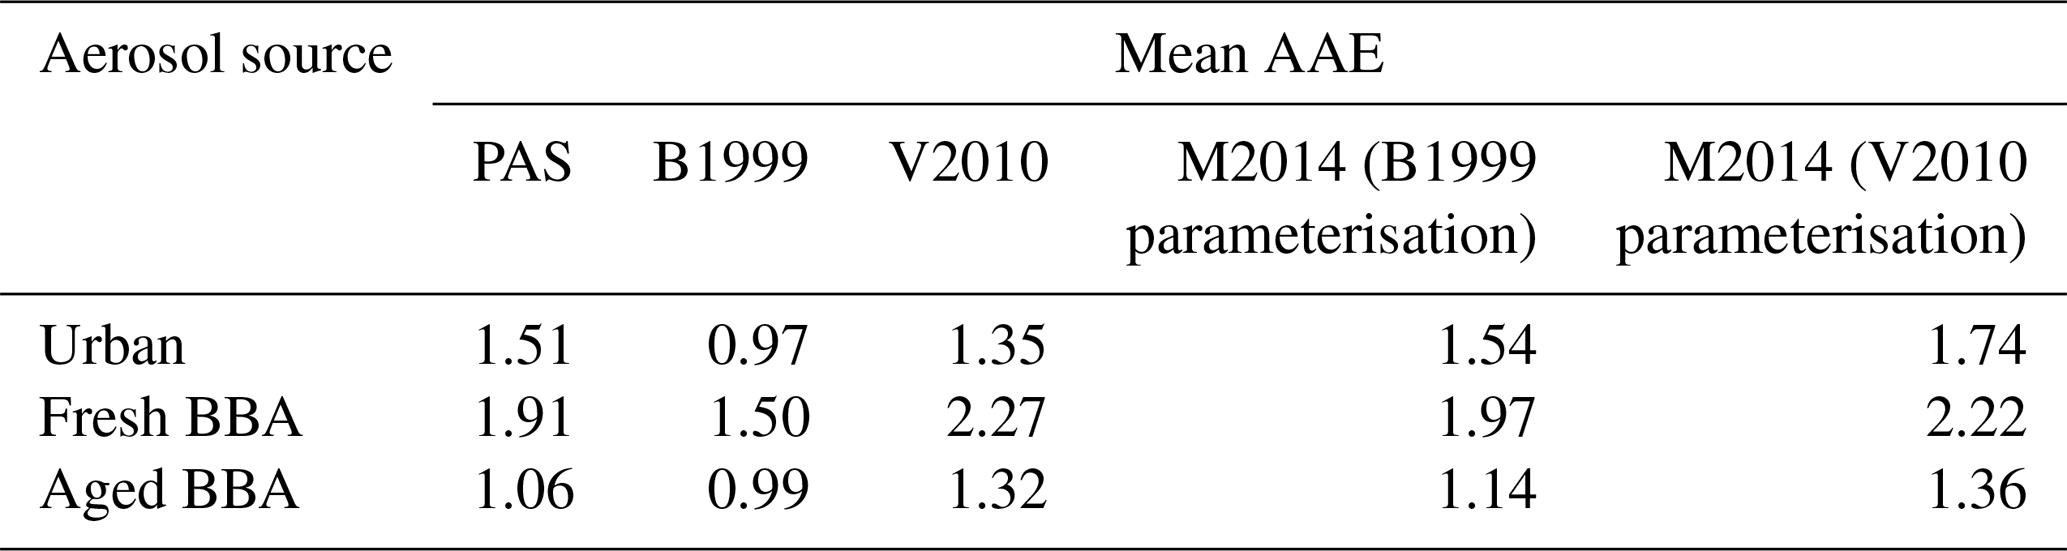
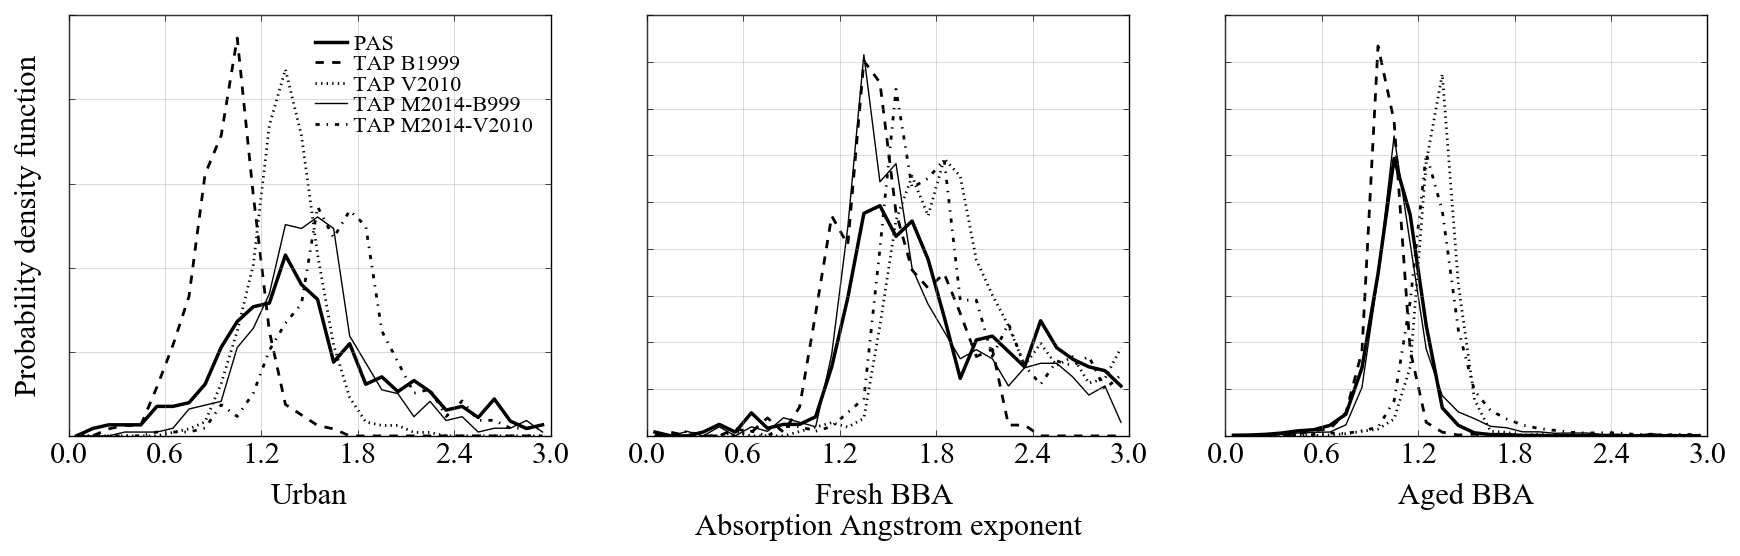
Figure 8Probability density functions of the absorption Ångström exponents derived for PAS and TAP measurements using the range of TAP correction schemes as outlined in Sect. 2.1.1–2.1.3. All absorption coefficients correspond to > 1 Mm−1.
The SSA values were most different for urban aerosols, which were biased low by 0.01–0.07, dependent on wavelength and the TAP correction scheme applied. This is consistent with the results in Table 2, which highlights that TAP biases were largest for urban aerosol measurements. The wavelength dependence of the TAP-derived SSA values depended on the correction scheme applied. SSA values derived using the M2014 correction scheme agreed most closely with those derived using PAS measurements for all measurement wavelengths and correction schemes.
Similarly, Fig. 8 shows histograms of the AAE values derived by performing linear regressions between the logarithms of the PAS-measured absorption coefficients and the PAS measurement wavelengths (405–658 nm) (Moosmüller et al., 2011). It also shows the same information for the TAP-derived AAE values. The AAE values were calculated for the aerosol sources outlined in Sect. 2.2.6 and TAP correction schemes outlined in Sect. 2.1.1–2.1.3.
The AAE values were strongly dependent on the TAP correction scheme applied. Campaign-mean AAE values are summarised in Table 4, which highlights that the highest mean AAE values were associated with fresh BBA emissions and the lowest for aged BBA emissions. TAP-derived AAE values were in absolute error by ±0.54. The M2014 (B1999 parameterisation) led to mean AAE values that were in closest agreement with AAE values derived using PAS measurements for all aerosol types. The V2010 scheme led to mean AAE values that were in second-closest agreement with the AAE values derived using PAS measurements for urban aerosols, whereas the M2014 (V2010 parameterisation) scheme provided the second-closest match for fresh BBA and the B1999 scheme for aged BBA. It is unclear why the different TAP correction schemes perform so differently for the different aerosol sources sampled. However, what is clear from this analysis is that there are large uncertainties in this important parameter when calculated from filter-based absorption measurements and that these uncertainties are strongly source and correction scheme dependent. This cautions that significant uncertainties could be introduced if using the AAE to differentiate between types of aerosol.
Measurement artefacts in a commercially available filter-based absorption photometer (TAP) were evaluated as a function of wavelength and aerosol source. A range of correction schemes have been proposed in the literature to account for these artefacts and thus to maximise the accuracy of aerosol absorption coefficients determined using this technique, although biases can remain. Three correction schemes were evaluated, which all reduced the TAP mean bias to within 1 % to +45 % of the PAS absorption, dependent upon aerosol source and wavelength. The largest biases were associated with urban aerosols and the lowest for aged BBA. The M2014 correction scheme consistently led to the lowest biases across all wavelengths and aerosol sources. To our knowledge, this is the first study to demonstrate the improved performance of the M2014 correction scheme as a function of wavelength and across multiple aerosol sources for ambient aerosol sampling.
Biases in filter-based absorption measurements were strongly source dependent. On no occasion were the very large biases of over 200 % noted in the Lack et al. (2008) study observed. However, we note that the aerosol types measured in the Lack et al. (2008) study were very different to those studied here, and therefore this result may well be consistent with the strong source dependence observed in the current study.
The positive bias in filter-based absorption measurements resulted in a low bias in determinations of single-scattering albedos of up to 0.07. The largest biases in SSA values were for urban aerosol measurements at wavelength 652 nm. The M2014 scheme consistently led to SSA values that were closest to those derived using PAS measurements across all wavelengths and aerosol sources.
Large discrepancies were seen between AAE values derived from PAS versus TAP measurements, the latter depending strongly on the correction scheme applied. The largest discrepancies in AAE values were for TAP measurements of urban aerosols corrected using the B1999 scheme, which were biased low by a mean absolute value of 0.54. The best agreement with AAE values derived using PAS measurements was obtained when TAP measurements were corrected using the M2014 (B1999 parameterisation) correction scheme and when (i) urban aerosol measurements were corrected using the V2010 scheme, (ii) fresh BBA measurements were corrected using the M2014 scheme and (iii) aged BBA measurements were corrected using the B1999 scheme. This highlights that the AAE is strongly source and correction scheme dependent.
The strong aerosol source dependence of biases observed in this study cautions against extrapolating results more widely to other aerosol types. Further analyses exploring biases in filter-based absorption coefficient measurements may help to address this issue. However, given the empirical nature of filter-based correction schemes and strong source and wavelength dependencies, even this is unlikely to fully bound uncertainties associated with filter-based absorption measurements to the high level of confidence that can be achieved using alternative methods, such as photoacoustic spectroscopy.
For data related to this paper please contact Justin Langridge (justin.langridge@metoffice.gov.uk).
NWD, JMH and JML designed the research. All co-authors collected the data used for the research. NWD, CF, KS, JWT, JDA, PIW, JT, and JML prepared the data for analysis. NWD performed the analyses and prepared the paper with contributions from all co-authors.
The authors declare that they have no conflict of interest.
We thank the Met Office, Natural Environment Research Council (NERC), Norwegian Research Council, and the Royal Society of Chemistry for funding this work. Airborne data were obtained using the BAe-146-301 Atmospheric Research Aircraft operated by Directflight Ltd and managed by FAAM, which is jointly supported by NERC and the Met Office. The authors acknowledge the dedicated work of FAAM, Directflight and Avalon during the aircraft campaigns. We thank the MODIS Science Team for the freely available Terra and Aqua level 2 AOD MODIS data at https://earthdata.nasa.gov (last access: 17 June 2019). We also thank Brent Holben, Didier Tanre, Judith Jeffrey and Roy Grainger for their efforts in establishing and maintaining the Chilbolton, Oxford, Dakar and Ascension Island AERONET sites.
This research has been supported by the Natural Environment Research Council (grant nos. NE/L013797/1, NE/L013584/1, and NE/N015835/1), the Natural Environment Research Council/Met Office (grant no. 640052003), the Research Council of Norway (ACBC and NetBC grants), and the Royal Society of Chemistry (Analytical Chemistry Trust Fund, Tom West Fellowship).
This paper was edited by Omar Torres and reviewed by John Ogren and one anonymous referee.
Alexander, D. T. L., Crozier, P. A., and Anderson, J. R.: Brown Carbon Spheres in East Asian Outflow and Their Optical Properties, Science, 321, 833–836, https://doi.org/10.1126/science.1155296, 2008.
Andreae, M. O. and Gelencsér, A.: Black carbon or brown carbon? The nature of light-absorbing carbonaceous aerosols, Atmos. Chem. Phys., 6, 3131–3148, https://doi.org/10.5194/acp-6-3131-2006, 2006.
Arnott, W. P., Moosmüller, H., Rogers, C. F., Jin, T., and Bruch, R.: Photoacoustic spectrometer for measuring light absorption by aerosol: Instrument description, Atmos. Environ., 33, 2845–2852, https://doi.org/10.1016/S1352-2310(98)00361-6, 1999.
Backman, J., Virkkula, A., Vakkari, V., Beukes, J. P., Van Zyl, P. G., Josipovic, M., Piketh, S., Tiitta, P., Chiloane, K., Petäjä, T., Kulmala, M., and Laakso, L.: Differences in aerosol absorption Ångström exponents between correction algorithms for a particle soot absorption photometer measured on the South African Highveld, Atmos. Meas. Tech., 7, 4285–4298, https://doi.org/10.5194/amt-7-4285-2014, 2014.
Baumgardner, D., Popovicheva, O., Allan, J., Bernardoni, V., Cao, J., Cavalli, F., Cozic, J., Diapouli, E., Eleftheriadis, K., Genberg, P. J., Gonzalez, C., Gysel, M., John, A., Kirchstetter, T. W., Kuhlbusch, T. A. J., Laborde, M., Lack, D., Müller, T., Niessner, R., Petzold, A., Piazzalunga, A., Putaud, J. P., Schwarz, J., Sheridan, P., Subramanian, R., Swietlicki, E., Valli, G., Vecchi, R., and Viana, M.: Soot reference materials for instrument calibration and intercomparisons: a workshop summary with recommendations, Atmos. Meas. Tech., 5, 1869–1887, https://doi.org/10.5194/amt-5-1869-2012, 2012.
Bond, T. C. and Bergstrom, R. W.: Light Absorption by Carbonaceous Particles: An Investigative Review, Aerosol Sci. Technol., 40, 27–67, https://doi.org/10.1080/02786820500421521, 2006.
Bond, T. C., Anderson, T. L., and Campbell, D.: Calibration and Intercomparison of Filter-Based Measurements of Visible Light Absorption by Aerosols, Aerosol Sci. Technol., 30, 582–600, https://doi.org/10.1080/027868299304435, 1999.
Bond, T. C., Doherty, S. J., Fahey, D. W., Forster, P. M., Berntsen, T., DeAngelo, B. J., Flanner, M. G., Ghan, S., Kärcher, B., Koch, D., Kinne, S., Kondo, Y., Quinn, P. K., Sarofim, M. C., Schultz, M. G., Schulz, M., Venkataraman, C., Zhang, H., Zhang, S., Bellouin, N., Guttikunda, S. K., Hopke, P. K., Jacobson, M. Z., Kaiser, J. W., Klimont, Z., Lohmann, U., Schwarz, J. P., Shindell, D., Storelvmo, T., Warren, S. G., and Zender, C. S.: Bounding the role of black carbon in the climate system: A scientific assessment, J. Geophys. Res.-Atmos., 118, 5380–5552, https://doi.org/10.1002/jgrd.50171, 2013.
Cappa, C. D., Lack, D. A., Burkholder, J. B., and Ravishankara, A. R.: Bias in filter-based aerosol light absorption measurements due to organic aerosol loading: Evidence from laboratory measurements, Aerosol Sci. Technol., 42, 1022–1032, https://doi.org/10.1080/02786820802389285, 2008.
Cotterell, M. I., Orr-Ewing, A. J., Szpek, K., Haywood, J. M., and Langridge, J. M.: The impact of bath gas composition on the calibration of photoacoustic spectrometers with ozone at discrete visible wavelengths spanning the Chappuis band, Atmos. Meas. Tech., 12, 2371–2385, https://doi.org/10.5194/amt-12-2371-2019, 2019.
Davies, N. W., Cotterell, M. I., Fox, C., Szpek, K., Haywood, J. M., and Langridge, J. M.: On the accuracy of aerosol photoacoustic spectrometer calibrations using absorption by ozone, Atmos. Meas. Tech., 11, 2313–2324, https://doi.org/10.5194/amt-11-2313-2018, 2018.
Dentener, F., Derwent, R., Dlugokencky, E., Holland, E., Isaksen, I., Katima, J., Kirchhoff, V., Matson, P., Midgley, P., and Wang, M.: Atmospheric Chemistry and Greenhouse Gases, in Climate Change 2001: The Scientific Basis, Contribution of Working Group I to the Third Assessment Report of the Intergovernmental Panel on Climate Change, edited by: Houghton, J. T., Ding, Y., Griggs, D. J., Noguer, M., van der Linden, P. J., Dai, X., Maskell, K., and Johnson, C. A., 881, Cambridge University Press, Cambridge, United Kingdom and New York, NY, USA, 2001.
Drewnick, F., Hings, S. S., DeCarlo, P., Jayne, J. T., Gonin, M., Fuhrer, K., Weimer, S., Jimenez, J. L., Demerjian, K. L., Borrmann, S., and Worsnop, D. R.: A new time-of-flight aerosol mass spectrometer (TOF-AMS) – Instrument description and first field deployment, Aerosol Sci. Technol., 39, 637–658, https://doi.org/10.1080/02786820500182040, 2005.
Feng, Y., Ramanathan, V., and Kotamarthi, V. R.: Brown carbon: a significant atmospheric absorber of solar radiation?, Atmos. Chem. Phys., 13, 8607–8621, https://doi.org/10.5194/acp-13-8607-2013, 2013.
Garstang, M., Tyson, P. D., Swap, R., Edwards, M., Kallberg, P., and Lindesay, J. A.: Horizontal and vertical transport of air over southern Africa, J. Geophys. Res.-Atmos., 101, 23721–23736, https://doi.org/10.1029/95JD00844, 1996.
Haywood, J. M., Pelon, J., Formenti, P., Bharmal, N., Brooks, M., Capes, G., Chazette, P., Chou, C., Christopher, S., Coe, H., Cuesta, J., Derimian, Y., Desboeufs, K., Greed, G., Harrison, M., Heese, B., Highwood, E. J., Johnson, B., Mallet, M., Marticorena, B., Marsham, J., Milton, S., Myhre, G., Osborne, S. R., Parker, D. J., Rajot, J. L., Schulz, M., Slingo, A., Tanré, D., and Tulet, P.: Overview of the dust and biomass-burning experiment and African monsoon multidisciplinary analysis special observing period-0, J. Geophys. Res.-Atmos., 113, 1–20, https://doi.org/10.1029/2008JD010077, 2008.
Johnson, B. T., Haywood, J. M., Langridge, J. M., Darbyshire, E., Morgan, W. T., Szpek, K., Brooke, J. K., Marenco, F., Coe, H., Artaxo, P., Longo, K. M., Mulcahy, J. P., Mann, G. W., Dalvi, M., and Bellouin, N.: Evaluation of biomass burning aerosols in the HadGEM3 climate model with observations from the SAMBBA field campaign, Atmos. Chem. Phys., 16, 14657–14685, https://doi.org/10.5194/acp-16-14657-2016, 2016.
Lack, D. A., Cappa, C. D., Covert, D. S., Baynard, T., Massoli, P., Sierau, B., Bates, T. S., Quinn, P. K., Lovejoy, E. R., and Ravishankara, A. R.: Bias in Filter-Based Aerosol Light Absorption Measurements Due to Organic Aerosol Loading: Evidence from Ambient Measurements, Aerosol Sci. Technol., 42, 1033–1041, https://doi.org/10.1080/02786820802389277, 2008.
Lack, D. A., Richardson, M. S., Law, D., Langridge, J. M., Cappa, C. D., McLaughlin, R. J., and Murphy, D. M.: Aircraft Instrument for Comprehensive Characterization of Aerosol Optical Properties, Part 2: Black and Brown Carbon Absorption and Absorption Enhancement Measured with Photo Acoustic Spectroscopy, Aerosol Sci. Technol., 46, 555–568, https://doi.org/10.1080/02786826.2011.645955, 2012a.
Lack, D. A., Langridge, J. M., Bahreini, R., Cappa, C. D., Middlebrook, A. M., and Schwarz, J. P.: Brown carbon and internal mixing in biomass burning particles, P. Natl. Acad. Sci. USA, 109, 14802–14807, https://doi.org/10.1073/pnas.1206575109, 2012b.
Langridge, J. M., Richardson, M. S., Lack, D. A., Law, D., and Murphy, D. M.: Aircraft Instrument for Comprehensive Characterization of Aerosol Optical Properties, Part I: Wavelength-Dependent Optical Extinction and Its Relative Humidity Dependence Measured Using Cavity Ringdown Spectroscopy, Aerosol Sci. Technol., 45, 1305–1318, https://doi.org/10.1080/02786826.2011.592745, 2011.
Liousse, C., Cachier, H., and Jennings, S. G.: Optical and thermal measurements of black carbon aerosol content in different environments: Variation of the specific attenuation cross-section, sigma (σ), Atmos. Environ., 27, 1203–1211, https://doi.org/10.1016/0960-1686(93)90246-U, 1993.
Liu, J., Scheuer, E., Dibb, J., Ziemba, L. D., Thornhill, K. L., Anderson, B. E., Wisthaler, A., Mikoviny, T., Devi, J. J., Bergin, M., and Weber, R. J.: Brown carbon in the continental troposphere, Geophys. Res. Lett., 41, 2191–2195, https://doi.org/10.1002/2013GL058976, 2014.
Loeb, N. G. and Su, W.: Direct aerosol radiative forcing uncertainty based on a radiative perturbation analysis, J. Climate, 23, 5288–5293, https://doi.org/10.1175/2010JCLI3543.1, 2010.
Mason, B., Wagner, N. L., Adler, G., Andrews, E., Brock, C. A., Gordon, T. D., Lack, D. A., Perring, A. E., Richardson, M. S., Schwarz, J. P., Shook, M. A., Thornhill, K. L., Ziemba, L. D., and Murphy, D. M.: An intercomparison of aerosol absorption measurements conducted during the SEAC4RS campaign, Aerosol Sci. Technol., 52, 1012–1027, https://doi.org/10.1080/02786826.2018.1500012, 2018.
McComiskey, A., Schwartz, S. E., Schmid, B., Guan, H., Lewis, E. R., Ricchiazzi, P., and Ogren, J. A.: Direct aerosol forcing: Calculation from observables and sensitivities to inputs, J. Geophys. Res.-Atmos., 113, 1–16, https://doi.org/10.1029/2007JD009170, 2008.
McMeeking, G. R., Morgan, W. T., Flynn, M., Highwood, E. J., Turnbull, K., Haywood, J., and Coe, H.: Black carbon aerosol mixing state, organic aerosols and aerosol optical properties over the United Kingdom, Atmos. Chem. Phys., 11, 9037–9052, https://doi.org/10.5194/acp-11-9037-2011, 2011.
Moosmüller, H. and Ogren, J. A.: Parameterization of the Aerosol Upscatter Fraction as Function of the Backscatter Fraction and Their Relationships to the Asymmetry Parameter for Radiative Transfer Calculations, Atmosphere, 8, 1–12, https://doi.org/10.3390/atmos8080133, 2017.
Moosmüller, H., Chakrabarty, R. K., and Arnott, W. P.: Aerosol light absorption and its measurement: A review, J. Quant. Spectrosc. Ra., 110, 844–878, https://doi.org/10.1016/j.jqsrt.2009.02.035, 2009.
Moosmüller, H., Chakrabarty, R. K., Ehlers, K. M., and Arnott, W. P.: Absorption Ångström coefficient, brown carbon, and aerosols: basic concepts, bulk matter, and spherical particles, Atmos. Chem. Phys., 11, 1217–1225, https://doi.org/10.5194/acp-11-1217-2011, 2011.
Morgan, W. T., Allan, J. D., Bower, K. N., Highwood, E. J., Liu, D., McMeeking, G. R., Northway, M. J., Williams, P. I., Krejci, R., and Coe, H.: Airborne measurements of the spatial distribution of aerosol chemical composition across Europe and evolution of the organic fraction, Atmos. Chem. Phys., 10, 4065–4083, https://doi.org/10.5194/acp-10-4065-2010, 2010.
Moteki, N., Kondo, Y., Nakayama, T., Kita, K., Sahu, L. K., Ishigai, T., Kinase, T., and Matsumi, Y.: Radiative transfer modeling of filter-based measurements of light absorption by particles: Importance of particle size dependent penetration depth, J. Aerosol Sci., 41, 401–412, https://doi.org/10.1016/j.jaerosci.2010.02.002, 2010.
Müller, T., Laborde, M., Kassell, G., and Wiedensohler, A.: Design and performance of a three-wavelength LED-based total scatter and backscatter integrating nephelometer, Atmos. Meas. Tech., 4, 1291–1303, https://doi.org/10.5194/amt-4-1291-2011, 2011.
Müller, T., Virkkula, A., and Ogren, J. A.: Constrained two-stream algorithm for calculating aerosol light absorption coefficient from the Particle Soot Absorption Photometer, Atmos. Meas. Tech., 7, 4049–4070, https://doi.org/10.5194/amt-7-4049-2014, 2014.
Myhre, G., Shindell, D., Bréon, F.-M., Collins, W., Fuglestvedt, J., Huang, J., Koch, D., Lamarque, J.-F., Lee, D., Mendoza, B., Nakajima, T., Robock, A., Stephens, G., Takemura, T., and Zhang, H.: Anthropogenic and Natural Radiative Forcing, in Climate Change 2013: The Physical Science Basis, Contribution of Working Group I to the Fifth Assessment Report of the Intergovernmental Panel on Climate Change, edited by: Stocker, T. F., Dahe, Q., Plattner, G.-K. , Tignor, M., Allen, S. K., Boschung, J., Nauels, A., Xia, Y., Bex, V., and Midgley, P. M., 659–740, Cambridge University Press, Cambridge, United Kingdom and New York, NY, USA, 2013a.
Myhre, G., Samset, B. H., Schulz, M., Balkanski, Y., Bauer, S., Berntsen, T. K., Bian, H., Bellouin, N., Chin, M., Diehl, T., Easter, R. C., Feichter, J., Ghan, S. J., Hauglustaine, D., Iversen, T., Kinne, S., Kirkevåg, A., Lamarque, J.-F., Lin, G., Liu, X., Lund, M. T., Luo, G., Ma, X., van Noije, T., Penner, J. E., Rasch, P. J., Ruiz, A., Seland, Ø., Skeie, R. B., Stier, P., Takemura, T., Tsigaridis, K., Wang, P., Wang, Z., Xu, L., Yu, H., Yu, F., Yoon, J.-H., Zhang, K., Zhang, H., and Zhou, C.: Radiative forcing of the direct aerosol effect from AeroCom Phase II simulations, Atmos. Chem. Phys., 13, 1853–1877, https://doi.org/10.5194/acp-13-1853-2013, 2013b.
Nakayama, T., Kondo, Y., Moteki, N., Sahu, L. K., Kinase, T., Kita, K., and Matsumi, Y.: Size-dependent correction factors for absorption measurements using filter-based photometers?: PSAP and COSMOS, J. Aerosol Sci., 41, 333–343, https://doi.org/10.1016/j.jaerosci.2010.01.004, 2010.
Ogren, J. A.: Comment on “Calibration and Intercomparison of Filter-Based Measurements of Visible Light Absorption by Aerosols”, Aerosol Sci. Technol., 44, 589–591, https://doi.org/10.1080/02786826.2010.482111, 2010.
Ogren, J. A., Wendell, J., Andrews, E., and Sheridan, P. J.: Continuous light absorption photometer for long-term studies, Atmos. Meas. Tech., 10, 4805–4818, https://doi.org/10.5194/amt-10-4805-2017, 2017.
Pokhrel, R. P., Beamesderfer, E. R., Wagner, N. L., Langridge, J. M., Lack, D. A., Jayarathne, T., Stone, E. A., Stockwell, C. E., Yokelson, R. J., and Murphy, S. M.: Relative importance of black carbon, brown carbon, and absorption enhancement from clear coatings in biomass burning emissions, Atmos. Chem. Phys., 17, 5063–5078, https://doi.org/10.5194/acp-17-5063-2017, 2017.
Remer, L. A., Mattoo, S., Levy, R. C., and Munchak, L. A.: MODIS 3 km aerosol product: algorithm and global perspective, Atmos. Meas. Tech., 6, 1829–1844, https://doi.org/10.5194/amt-6-1829-2013, 2013.
Rolph, G., Stein, A., and Stunder, B.: Real-time Environmental Applications and Display sYstem: READY, Environ. Model. Softw., 95, 210–228, https://doi.org/10.1016/j.envsoft.2017.06.025, 2017.
Saleh, R., Robinson, E. S., Tkacik, D. S., Ahern, A. T., Liu, S., Aiken, A. C., Sullivan, R. C., Presto, A. A., Dubey, M. K., Yokelson, R. J., Donahue, N. M., and Robinson, A. L.: Brownness of organics in aerosols from biomass burning linked to their black carbon content, Nat. Geosci., 7, 647–650, https://doi.org/10.1038/ngeo2220, 2014.
Sherman, J. P. and McComiskey, A.: Measurement-based climatology of aerosol direct radiative effect, its sensitivities, and uncertainties from a background southeast US site, Atmos. Chem. Phys., 18, 4131–4152, https://doi.org/10.5194/acp-18-4131-2018, 2018.
Shindell, D. T., Lamarque, J.-F., Schulz, M., Flanner, M., Jiao, C., Chin, M., Young, P. J., Lee, Y. H., Rotstayn, L., Mahowald, N., Milly, G., Faluvegi, G., Balkanski, Y., Collins, W. J., Conley, A. J., Dalsoren, S., Easter, R., Ghan, S., Horowitz, L., Liu, X., Myhre, G., Nagashima, T., Naik, V., Rumbold, S. T., Skeie, R., Sudo, K., Szopa, S., Takemura, T., Voulgarakis, A., Yoon, J.-H., and Lo, F.: Radiative forcing in the ACCMIP historical and future climate simulations, Atmos. Chem. Phys., 13, 2939–2974, https://doi.org/10.5194/acp-13-2939-2013, 2013.
Stein, A. F., Draxler, R. R., Rolph, G. D., Stunder, B. J. B., Cohen, M. D., and Ngan, F.: Noaa's hysplit atmospheric transport and dispersion modeling system, B. Am. Meteorol. Soc., 96, 2059–2077, https://doi.org/10.1175/BAMS-D-14-00110.1, 2015.
Stier, P., Seinfeld, J. H., Kinne, S., and Boucher, O.: Aerosol absorption and radiative forcing, Atmos. Chem. Phys., 7, 5237–5261, https://doi.org/10.5194/acp-7-5237-2007, 2007.
Stocker, T. F., Qin, D., Plattner, G.-K., Alexander, L. V, Allen, S. K., Bindoff, N. L., Bréon, F.-M., Church, J. A., Cubasch, U., Emori, S., Forster, P., Friedlingstein, P., Gillett, N., Gregory, J. M., Hartmann, D. L., Jansen, E., Kirtman, B., Knutti, R., Krishna Kumar, K., Lemke, P., Marotzke, J., Masson-Delmotte, V., Meehl, G. A., Mokhov, I. I., Piao, S., Ramaswamy, V., Randall, D., Rhein, M., Rojas, M., Sabine, C., Shindell, D., Talley, L. D., Vaughan, D. G., and Xie, S.-P.: Technical Summary, in Climate Change 2013 – The Physical Science Basis. Contribution of Working Group I to the Fifth Assessment Report of the Intergovernmental Panel on Climate Change, edited by Stocker, T. F., Qin, D., Plattner, G.-K., Tignor, M., Allen, S. K., Boschung, Nauels, A., A., Xia, Y., Bex, V., and Midgley, P. M., 33–115, Cambridge University Press, Cambridge, United Kingdom and New York, NY, USA, 2013.
Subramanian, R., Roden, C. A., Boparai, P., and Bond, T. C.: Yellow Beads and Missing Particles: Trouble Ahead for Filter-Based Absorption Measurements, Aerosol Sci. Technol., 41, 630–637, https://doi.org/10.1080/02786820701344589, 2007.
Subramanian, R., Kok, G. L., Baumgardner, D., Clarke, A., Shinozuka, Y., Campos, T. L., Heizer, C. G., Stephens, B. B., de Foy, B., Voss, P. B., and Zaveri, R. A.: Black carbon over Mexico: the effect of atmospheric transport on mixing state, mass absorption cross-section, and BC/CO ratios, Atmos. Chem. Phys., 10, 219–237, https://doi.org/10.5194/acp-10-219-2010, 2010.
Szpek, K., Cotterell, M. I., Langridge, J. M., Fox, C., Davies, N. W., Wilson, A., Bowles, J., Kent, J., King, R., Smout-Day, R., Tiddeman, D., and Richardson, M. S.: EXSCALABAR: instrumentation for airborne characterisation of aerosol optical properties from the FAAM aircraft, in preparation, Atmos. Meas. Tech., 2019.
Trembath, J., Bart, M., and Brooke, J.: FAAM Technical Note: Efficiencies of Modified Rosemount Housings for sampling Aerosol on a Fast Atmospheric Research Aircraft, Cranfield, UK, available at: https://old.faam.ac.uk/index.php/faam-documents/science-instruments/1673-inlet-efficiency/file (last access: 17 June 2019), 2012.
Virkkula, A.: Correction of the Calibration of the 3-wavelength Particle Soot Absorption Photometer (3λ PSAP), Aerosol Sci. Technol., 44, 706–712, https://doi.org/10.1080/02786826.2010.482110, 2010.
Virkkula, A., Ahlquist, N. C., Covert, D. S., Arnott, W. P., Sheridan, P. J., Quinn, P. K., and Coffman, D. J.: Modification, Calibration and a Field Test of an Instrument for Measuring Light Absorption by Particles, Aerosol Sci. Technol., 39, 68–83, https://doi.org/10.1080/027868290901963, 2005.
Wang, X., Heald, C. L., Liu, J., Weber, R. J., Campuzano-Jost, P., Jimenez, J. L., Schwarz, J. P., and Perring, A. E.: Exploring the observational constraints on the simulation of brown carbon, Atmos. Chem. Phys., 18, 635–653, https://doi.org/10.5194/acp-18-635-2018, 2018.
Weingartner, E., Saathoff, H., Schnaiter, M., Streit, N., Bitnar, B., and Baltensperger, U.: Absorption of light by soot particles: Determination of the absorption coefficient by means of aethalometers, J. Aerosol Sci., 34, 1445–1463, https://doi.org/10.1016/S0021-8502(03)00359-8, 2003.
Zuidema, P., Redemann, J., Haywood, J., Wood, R., Piketh, S., Hipondoka, M., and Formenti, P.: Smoke and clouds above the southeast Atlantic: Upcoming field campaigns probe absorbing aerosol's impact on climate, B. Am. Meteorol. Soc., 97, 1131–1135, https://doi.org/10.1175/BAMS-D-15-00082.1, 2016.