the Creative Commons Attribution 4.0 License.
the Creative Commons Attribution 4.0 License.
 | 11 Jul 2019
Aerosol-type classification based on AERONET version 3 inversion products
Sung-Kyun Shin
Matthias Tesche
Youngmin Noh
Detlef Müller
This study proposes an aerosol-type classification based on the particle linear depolarization ratio (PLDR) and single-scattering albedo (SSA) provided in the AErosol RObotic NETwork (AERONET) version 3 level 2.0 inversion product. We compare our aerosol-type classification with an earlier method that uses fine-mode fraction (FMF) and SSA. Our new method allows for a refined classification of mineral dust that occurs as a mixture with other absorbing aerosols: pure dust (PD), dust-dominated mixed plume (DDM), and pollutant-dominated mixed plume (PDM). We test the aerosol classification at AERONET sites in East Asia that are frequently affected by mixtures of Asian dust and biomass-burning smoke or anthropogenic pollution. We find that East Asia is strongly affected by pollution particles with high occurrence frequencies of 50 % to 67 %. The distribution and types of pollution particles vary with location and season. The frequency of PD and dusty aerosol mixture (DDM+PDM) is slightly lower (34 % to 49 %) than pollution-dominated mixtures. Pure dust particles have been detected in only 1 % of observations. This suggests that East Asian dust plumes generally exist in a mixture with pollution aerosols rather than in pure form. In this study, we have also considered data from selected AERONET sites that are representative of anthropogenic pollution, biomass-burning smoke, and mineral dust. We find that average aerosol properties obtained for aerosol types in our PLDR–SSA-based classification agree reasonably well with those obtained at AERONET sites representative for different aerosol types.
- Article
(2555 KB) - Full-text XML
- BibTeX
- EndNote


Atmospheric aerosol particles play an essential role in the global climate system by affecting the Earth’s radiation budget (Stocker et al., 2013). Aerosol particles directly interact with solar and terrestrial radiation through absorption and scattering of radiation. Aerosols also can act as cloud condensation nuclei and ice-nucleating particles whereby they alter cloud properties (i.e. cloud albedo, cloud lifetime) and lead to a change in precipitation efficiency (Twomey, 1974). Radiative forcing is a useful parameter in quantifying the radiative effect of aerosols on climate change. Estimates of aerosol radiative forcing require information on the amount of aerosol loading as well as aerosol properties (Bellouin et al., 2013). The sign and the magnitude of the aerosol radiative forcing depends on aerosol characteristics (Stocker et al., 2013). Despite an unprecedented global coverage of atmospheric aerosol information, it is still a challenging task to assess the aerosol radiative effect accurately. Atmospheric aerosols are difficult to characterize in time and space due to their short lifetime and geographically diverse sources and production mechanisms. Moreover, atmospheric aerosol particles from different natural and anthropogenic sources also frequently mix and undergo ageing processes during transport, which influences optical and microphysical properties of the bulk aerosol. An improved discrimination of different aerosol types by observations, particularly from space, increases the accuracy of estimates of the aerosol radiative impact and is important for the assessment of aerosol dispersion modelling (Satheesh and Moorthy, 2005).
Aerosol properties inferred from remote-sensing measurements can be used to classify different aerosol types. Aerosol optical depth (AOD) and its spectral dependence, which can be characterized by the Ångström exponent, are typically used for aerosol classification from passive remote-sensing observations. These parameters, together with the fine- or coarse-mode fraction of the aerosol size distribution, allow for a quantification of aerosol loading and aerosol size (Schuster et al., 2006). Dominant aerosol types can then be inferred by using additional information on possible source regions or transport pathways (Boselli et al., 2012; Shin et al., 2019). The use of spectral absorbing characteristics of aerosols adds additional information on particle type (Giles et al., 2012). For instance, Kim et al. (2007) used the fine-mode fraction (FMF) from the Moderate Resolution Imaging Spectrometer (MODIS) to determine particle size and then used the aerosol index (AI) from the Ozone Monitoring Instrument (OMI) to determine the light-absorbing characteristics of aerosols. Other studies have proposed using properties related to particle size and absorption to determine the dominant aerosol type, based on AErosol RObotic Network (AERONET; Holben et al., 1998) observations (Lee et al., 2010; Russell et al., 2010; Giles et al., 2012). AERONET provides a global, long-term aerosol data set that includes spectral AOD, complex refractive index, particle size distribution, single-scattering albedo (SSA), and absorption aerosol optical depth. The information on particle size and light-absorbing properties enables the identification of major aerosol types such as mineral dust, anthropogenic pollution, biomass-burning smoke, and mixtures of aerosol particles. Lee et al. (2010) used SSA at 440 nm and FMF of AOD at 550 nm from AERONET to determine the absorbing properties and dominant size mode of particles (i.e. fine or coarse mode) for aerosol classification. Russell et al. (2010) classified aerosol types based on the absorption Ångström exponent. Giles et al. (2012) used SSA, absorption Ångström exponent, Ångström exponent, and FMF from AERONET to infer dominant aerosol types. More detailed and quantitative information useful for aerosol classification can be obtained from active aerosol remote sensing with lidar, particularly when we include information on the particle linear depolarization ratio (PLDR or δp), which is a very sensitive parameter with respect to particle shape (Shin et al., 2019). Values of PLDR between 0.30 and 0.35 represent nonspherical particles (pure mineral dust, volcanic ash), while values close to zero indicate the presence of spherical particles. Values in between these two extremes characterize mixtures of spherical and nonspherical particles. Measurements of PLDR can be used to estimate the contribution of these two fundamentally different particle types (Freudenthaler et al., 2009; Tesche et al., 2009; Burton et al., 2012, 2014, 2015; Shin et al., 2015, 2019).
Several studies have determined aerosol types in which lidar-derived PLDR was combined with aerosol optical and microphysical properties inferred from AERONET observations (Burton et al., 2012; Russell et al., 2014). Although the combination of polarization lidar and AERONET observations might be an ideal option for aerosol classification, there are few AERONET stations that are equipped with this additional instrumentation, i.e. well-calibrated polarization-sensitive micro-pulse lidar or aerosol polarization lidar.
Version 3 of the AERONET retrieval methodology provides us with spectral PLDR as a standard inversion product. In this study, we use the information on the shape (PLDR) and light-absorbing properties (SSA) of particles for refined aerosol typing that can be obtained from using standard AERONET measurements. We retrieve the dominant aerosol type at selected AERONET sites in East Asia and investigate their seasonal variation and optical properties.
We describe our methodology in Sect. 2. In Sect. 3, we present and discuss our results. A summary and conclusions of this work are presented in Sect. 4.
2.1 Parameters
Polarization lidar allows us to infer PLDR from measurements of the particle backscatter coefficient () in different planes of polarization compared to the plane of polarization of the emitted linearly polarized laser light:
AERONET instruments measure direct solar radiation and sky radiation. The measurements are automatically analysed using the AERONET inversion algorithm (Dubovik and King, 2000; Dubovik et al., 2000). The retrieved aerosol products are stored in the AERONET database (https://aeronet.gsfc.nasa.gov/, AERONET, 2019). In the AERONET retrieval, the elements F11(λ) and F22(λ) of the Müller scattering matrix (Bohren and Huffman, 1983) are computed from the particle size distribution and the complex refractive index that can be inferred from AERONET version 3 level 2.0 data products. The element F11(λ) is proportional to the flux of scattered light in the case of unpolarized incident light while F22(λ) strongly depends on the angular and spectral distribution of the radiative intensity (Bohren and Huffman, 1983). From the elements F11(λ) and F22(λ) at the scattering angle 180∘, δp is computed as
AERONET version 3 level 2.0 inversion products include PLDRs and lidar ratios at 440, 670, 870, and 1020 nm. The parameter sphericity, which was provided in the AERONET version 2 inversion product, has been discontinued in version 3. We hence base this study on PLDR. This approach has the additional advantage that PLDR can also be obtained from independent measurements, e.g. with aerosol lidar. Noh et al. (2017) report that PLDR from the AERONET inversion products shows high correlation with lidar-derived values. Shin et al. (2018) discuss AERONET-retrieved PLDR from different source regions. The authors find that PLDRs at 870 and 1020 nm are likely to be the two most reliable quantities. The authors based this finding on comparison to literature values obtained from lidar observations of pure dust particles which show that AERONET-derived PLDRs at lower wavelengths are systematically lower than lidar observations at 532 nm.
The SSA is the ratio of the aerosol scattering coefficient to the aerosol extinction coefficient and is generally used to define the absorbing characteristics of the scattering particles. In this study, we follow Lee et al. (2010) and use SSA to distinguish between non-dust particles that are non-absorbing (NA), weakly absorbing (WA), moderately absorbing (MA), and strongly absorbing (SA).
2.2 Data selection
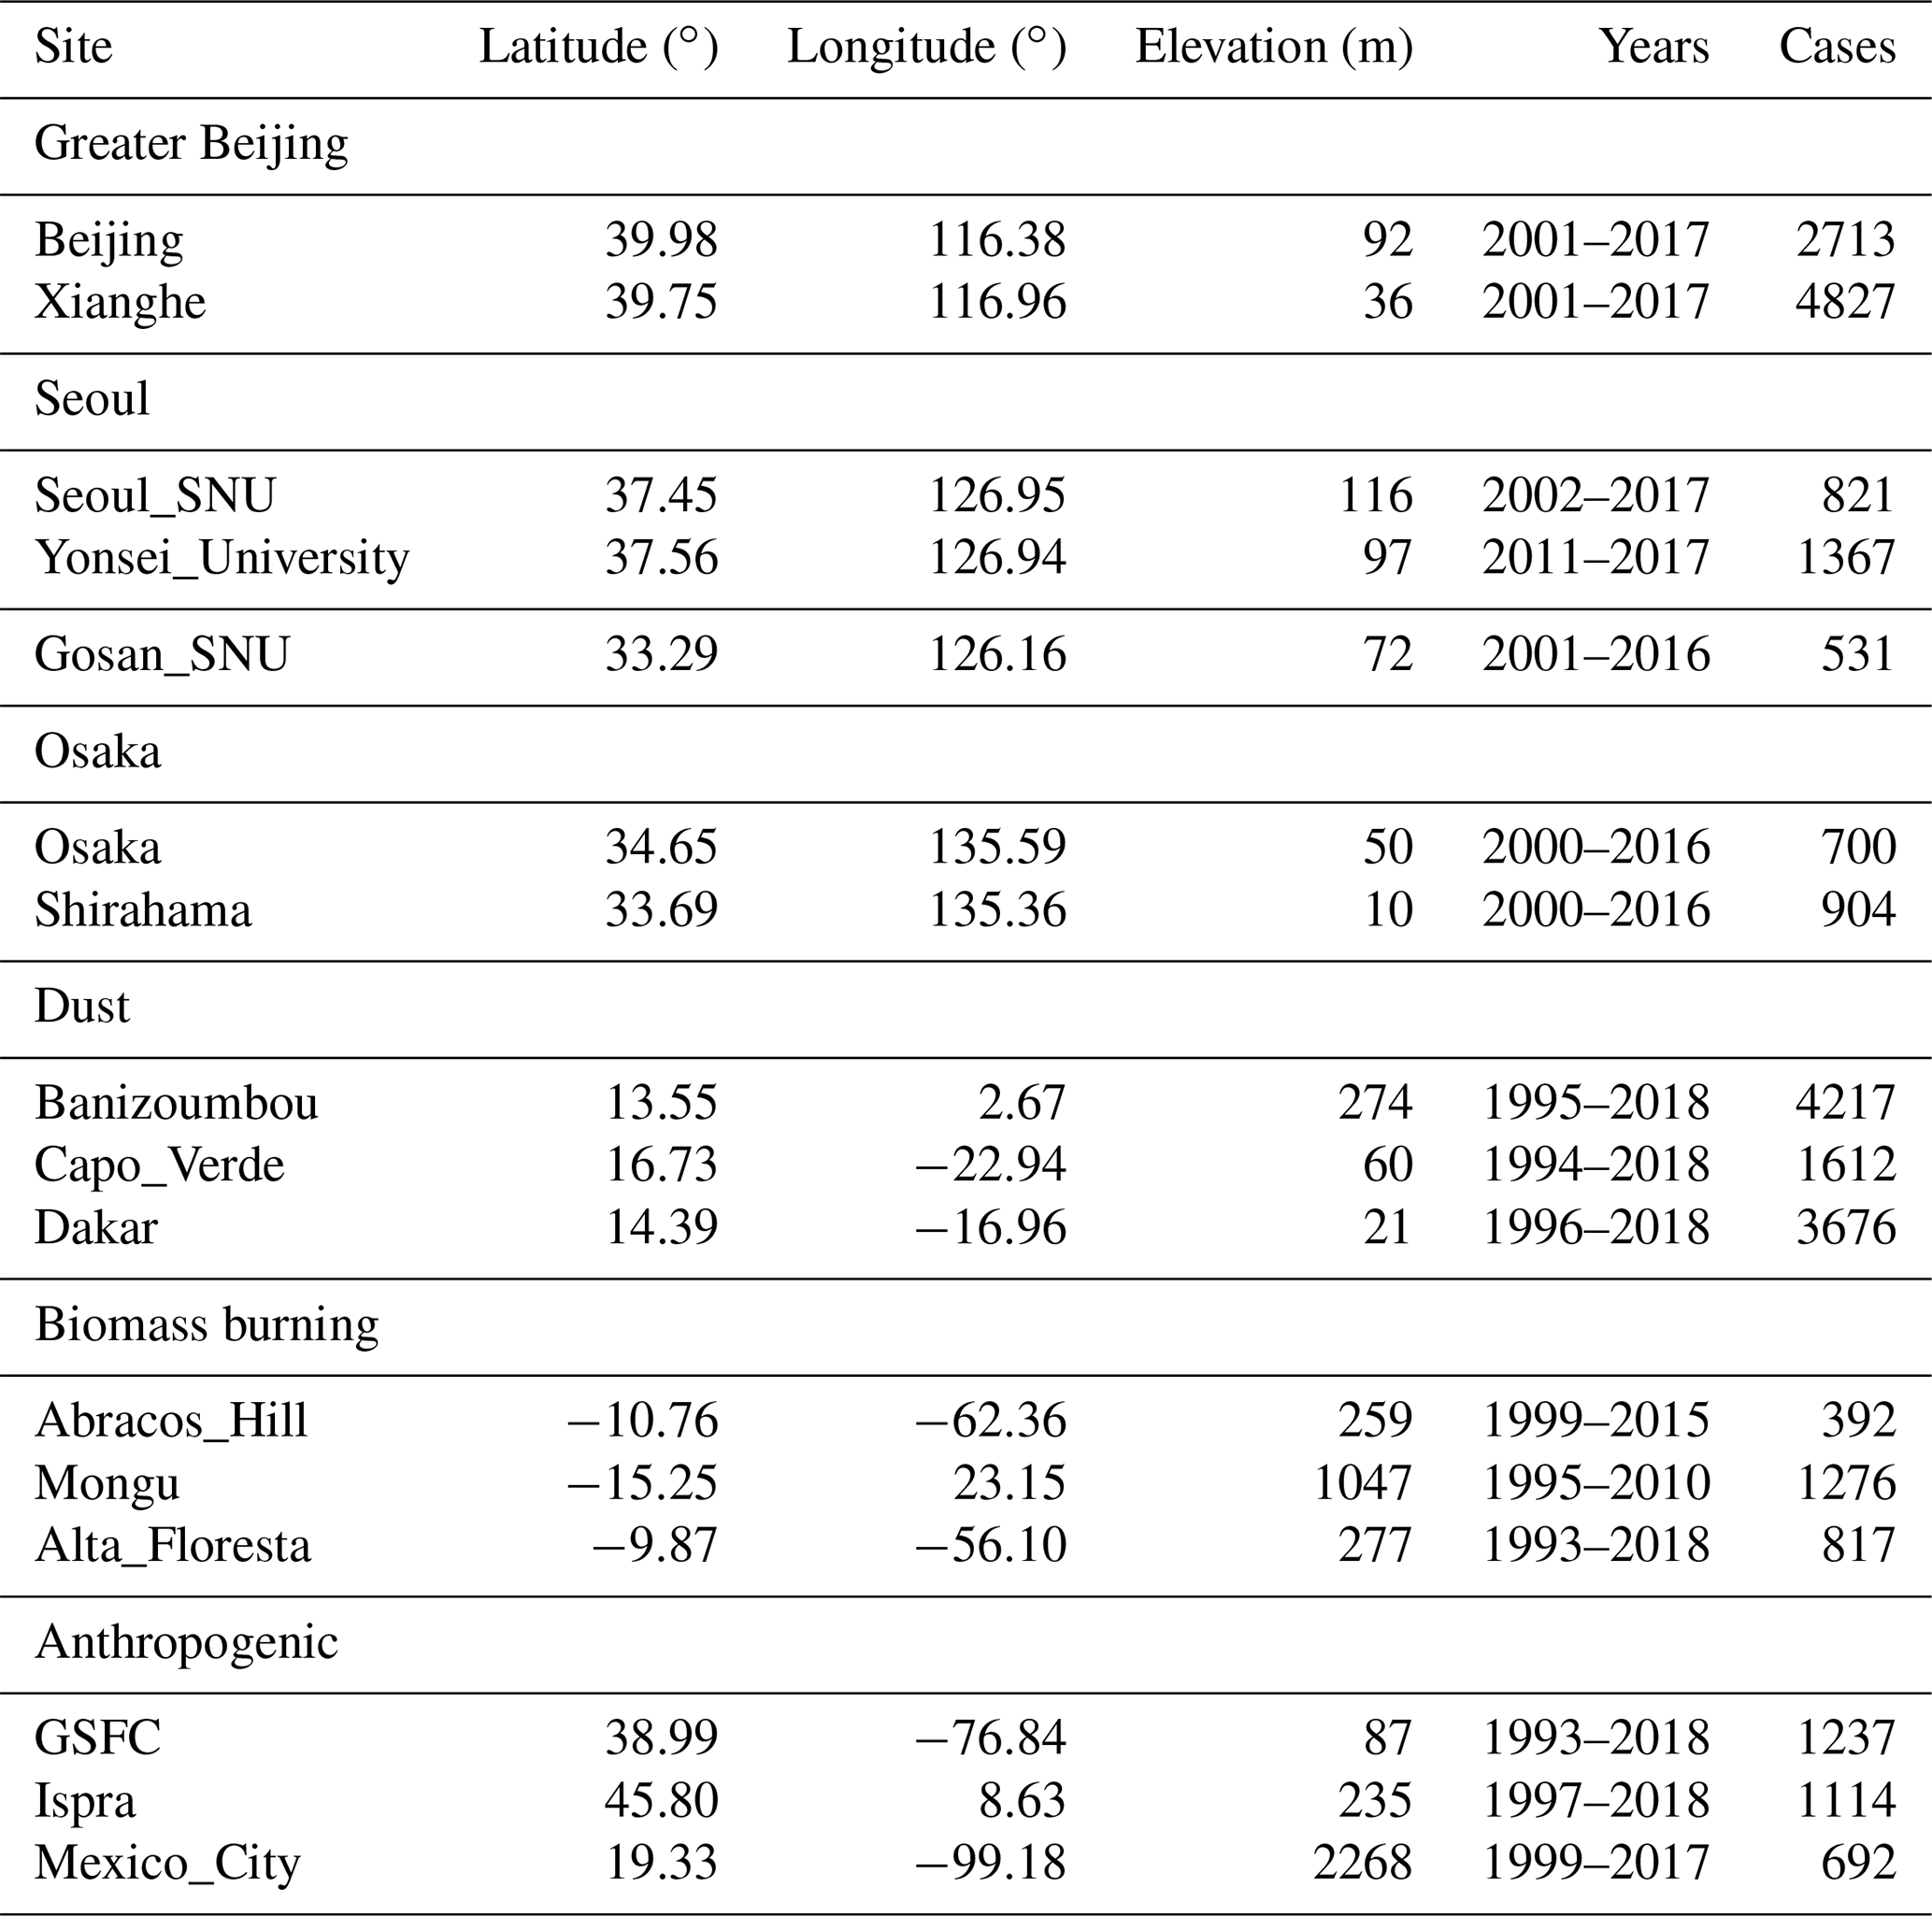
We selected AERONET sites in East Asia to develop our methodology. These sites are in a region that is influenced by both natural and anthropogenic aerosols such as anthropogenic particles from fossil fuel combustion, biomass-burning smoke, and mineral dust (Nakata et al., 2016). We combine the stations Beijing and Xianghe into what we denote as Greater Beijing. The stations Seoul and Yonsei_University are considered representative for Seoul. Osaka is represented by the stations Osaka and Shirahama. We considered Gosan_SNU to represent regional background aerosols in East Asia as there are few anthropogenic sources near this site. The AERONET inversion is only performed for measurements with a 440 nm AOD larger than 0.4 (Dubovik et al., 2006). For the aerosol-type classification we use the AERONET level 2.0 version 3 inversion products of particle size distribution, PLDR, and SSA available as of February 2018. This means that the time series considered here cover the time frame from the beginning of measurements at the respective sites up to between the end of 2016 and the middle of 2017.
We considered other AERONET stations to evaluate the results of our aerosol classification. We followed earlier AERONET studies on aerosol classification (Dubovik et al., 2001; Gobbi et al., 2007; Giles et al., 2012) to select stations that are generally considered to be representative for (1) anthropogenic particles: Goddard Space Flight Centre (GSFC, USA), Ispra (Italy), and Mexico City (Mexico); (2) biomass-burning smoke: Alta Floresta (Brazil), Mongu (Zambia), and Abracos Hill (Brazil); and (3) Saharan dust: Capo Verde (Cabo Verde), Banizoumbou (Niger), and Dakar (Senegal). Detailed information on the AERONET sites considered in this study is provided in Table 1.
Table 1Geographical and retrieval information for each AERONET site used in this study, along with some references for each aerosol type. The number of cases refers to observations for which SSA and PLDR are available in the AERONET database.
2.3 Correlation between PLDR and other properties
To investigate whether PLDR can be used as the base parameter for aerosol-type classification, we analysed how SSA and volume particle size distribution vary with respect to different intervals of PLDR. These parameters have been used for aerosol-type classification in previous studies (Kim et al., 2007; Lee et al., 2010). Figure 1 shows clearly distinguishable patterns of spectral SSA for different intervals of PLDR. The increase in SSA with increasing wavelength for PLDR >0.28 is characteristic for mineral dust (Giles et al., 2012). In contrast, the decrease in SSA with increasing wavelength for PLDR<0.10 is in line with anthropogenic pollution and biomass-burning smoke (Giles et al., 2012). In addition, SSA at 1020 nm shows the biggest range of values for different PLDR intervals. Values are in the range between 0.91 and 0.95 for PLDR <0.10 and between 0.96 and 0.99 for higher PLDRs. In comparison, these differences are very small at 440 nm. The composition of mineral dust often includes iron oxides that lead to strong light absorption at short wavelengths (Derimian et al., 2008). The main light absorber of anthropogenic pollution is black carbon or soot, which exhibits light absorption throughout the entire solar spectrum (Bergstrom et al., 2002). Cases with considerable contribution of mineral dust as identified by high PLDR values therefore show relatively low SSA at 440 nm compared to longer wavelengths.

Figure 1The mean spectra of SSA for different ranges of PLDR at the East Asian AERONET sites considered in this study.
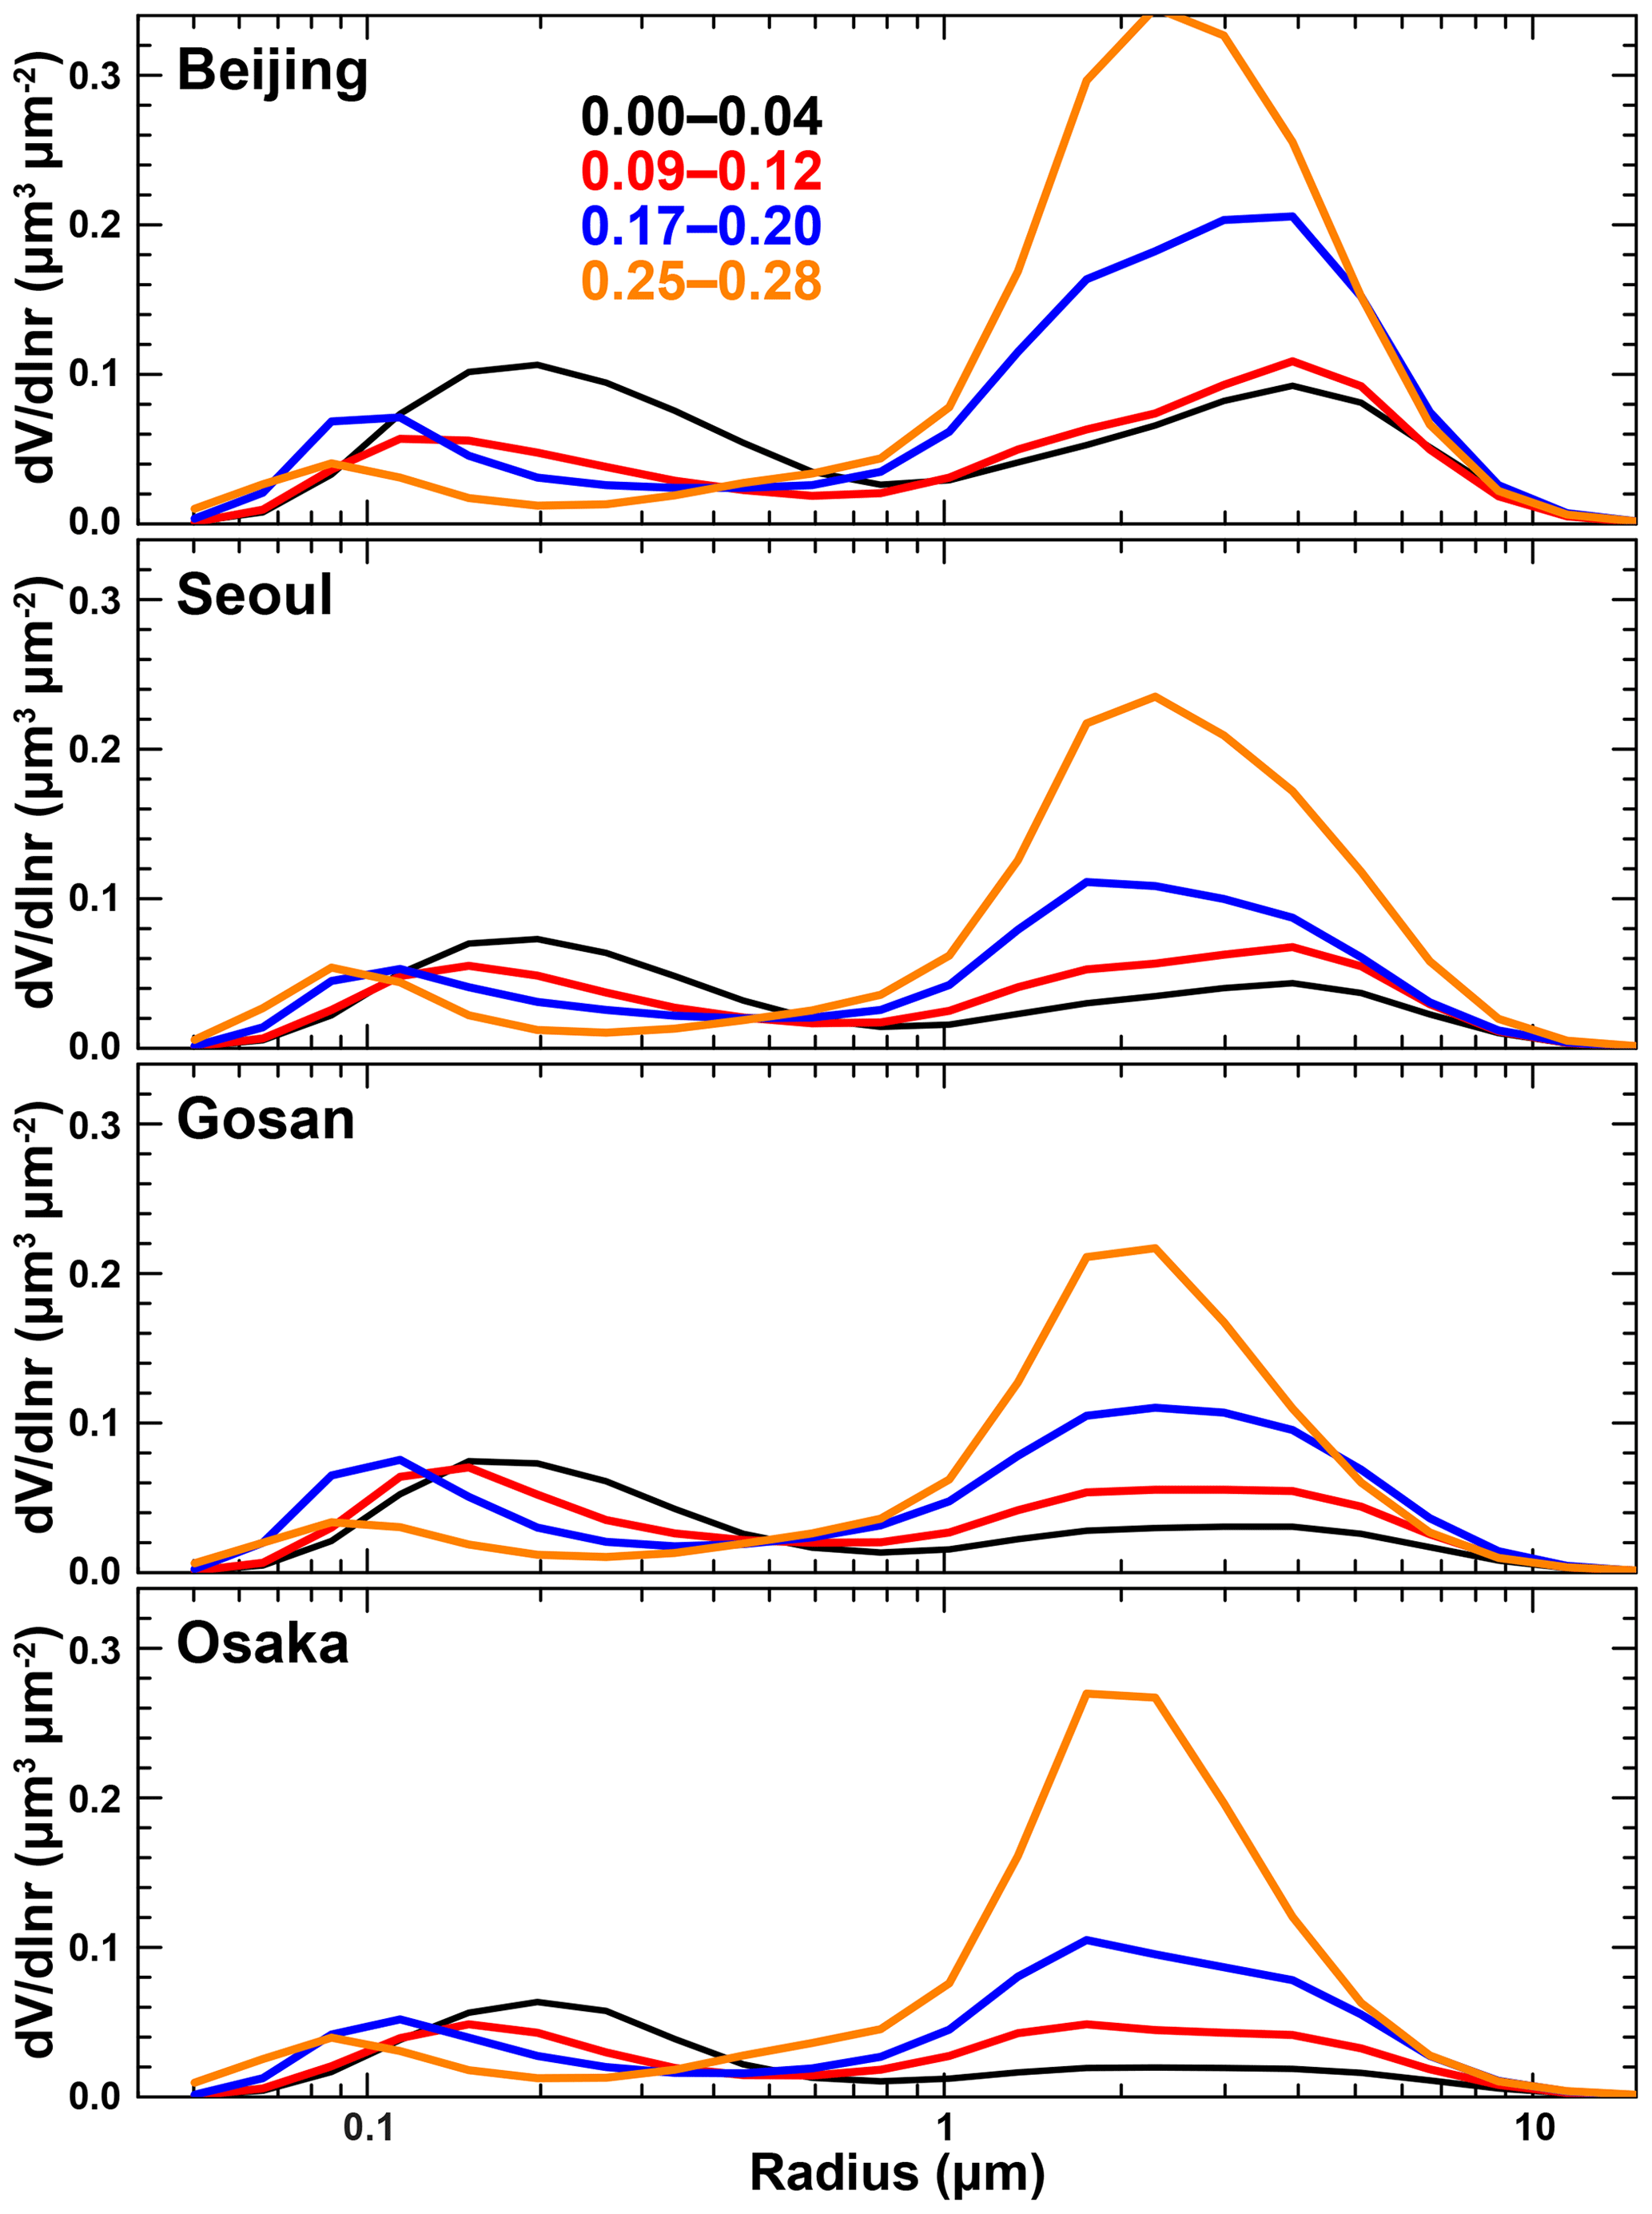
Figure 2The mean volume particle size distributions for different ranges of PLDR for the East Asian AERONET sites considered in this study.
Figure 2 shows that the variation in the fine-mode and the coarse-mode parts of the size distribution with respect to PLDR is also clearly distinguishable. The fine-mode particles dominate at lower PLDR and their contribution decreases with increasing PLDR. Conversely, the contribution of the coarse mode to the total volume concentration increases as PLDR increases. It is less than 0.5 for PLDR <0.06 and higher than 0.9 for PLDR >0.30.
We know from lidar measurements at 532 nm that values of PLDR>0.30 indicate nearly pure dust particles (Freudenthaler et al., 2009; Shin et al., 2018), whereas PLDR <0.08 is representative for marine aerosols, anthropogenic pollution, or fresh biomass-burning smoke (Burton et al., 2012). External mixtures of mineral dust and nonspherical particles reveal 532 nm PLDRs in the range from 0.08 to 0.30 (Tesche et al., 2009, 2011; Gross et al., 2011). Consequently, PLDR can be used to calculate the contribution of dust to the particle backscatter coefficient for an external aerosol mixture. Shimizu et al. (2004) and Tesche et al. (2009) used polarization lidar measurements to define the dust ratio (Rd) as
Here, and indicate the PLDR of non-dust and pure dust particles, respectively. The corresponding values can be determined from lidar or AERONET observations (Burton et al., 2014; Shin et al., 2018). We apply the Rd retrieval to AERONET measurements at 1020 nm. We use values of and for pure Asian dust (Shin et al., 2018). When PLDR is lower than or higher than , Rd is set to 0 or 1, respectively.
2.4 Aerosol classification method
Atmospheric aerosols are typically classified into four major types according to their size and light-absorbing property. For instance, Lee et al. (2010) used FMF and SSA from the AERONET version 2 level 2.0 inversion products to classify aerosols into black carbon (BC), mineral dust, non-absorbing (NA) particles, and mixed particles. In our aerosol classification method, we consider the contribution of nonspherical particles (i.e. mineral dust) to the aerosol mixture based on thresholds of the dust ratio Rd as obtained from the shape-dependent parameter PLDR and use SSA to distinguish absorbing from non-absorbing aerosols. The reason for using Rd instead of FMF, which has been used, in Schuster et al. (2006) and Lee et al. (2010), is that the former provides a clearer separation between dust and non-dust particles. The sensitivity of Rd to particle shape allows for a straightforward and size-independent identification of nonspherical dust particles in a mixture while it has to be assumed that dust is constrained to the coarse mode when using FMF for aerosol classification. However, dust might also be present in the fine mode (Mamouri and Ansmann, 2014, 2017). Lee et al. (2010) used a threshold of FMF <0.4 to identify mineral dust. Jones and Christopher (2007) reported annual mean values of MODIS FMF for mineral dust of 0.45±0.05. Shin et al. (2019) compared coarse-mode AOD provided by AERONET to dust AOD retrieved with the use of PLDR and showed that the former tends to overestimate the contribution of mineral dust to AOD. As a consequence, FMF or fine-mode AOD, when used as a proxy for identifying non-dust aerosols, would lead to a systematic underestimation of the contribution of non-dust particles to the total aerosol plume. Further benefits of using PLDR rather than FMF for aerosol-type classification are discussed later.
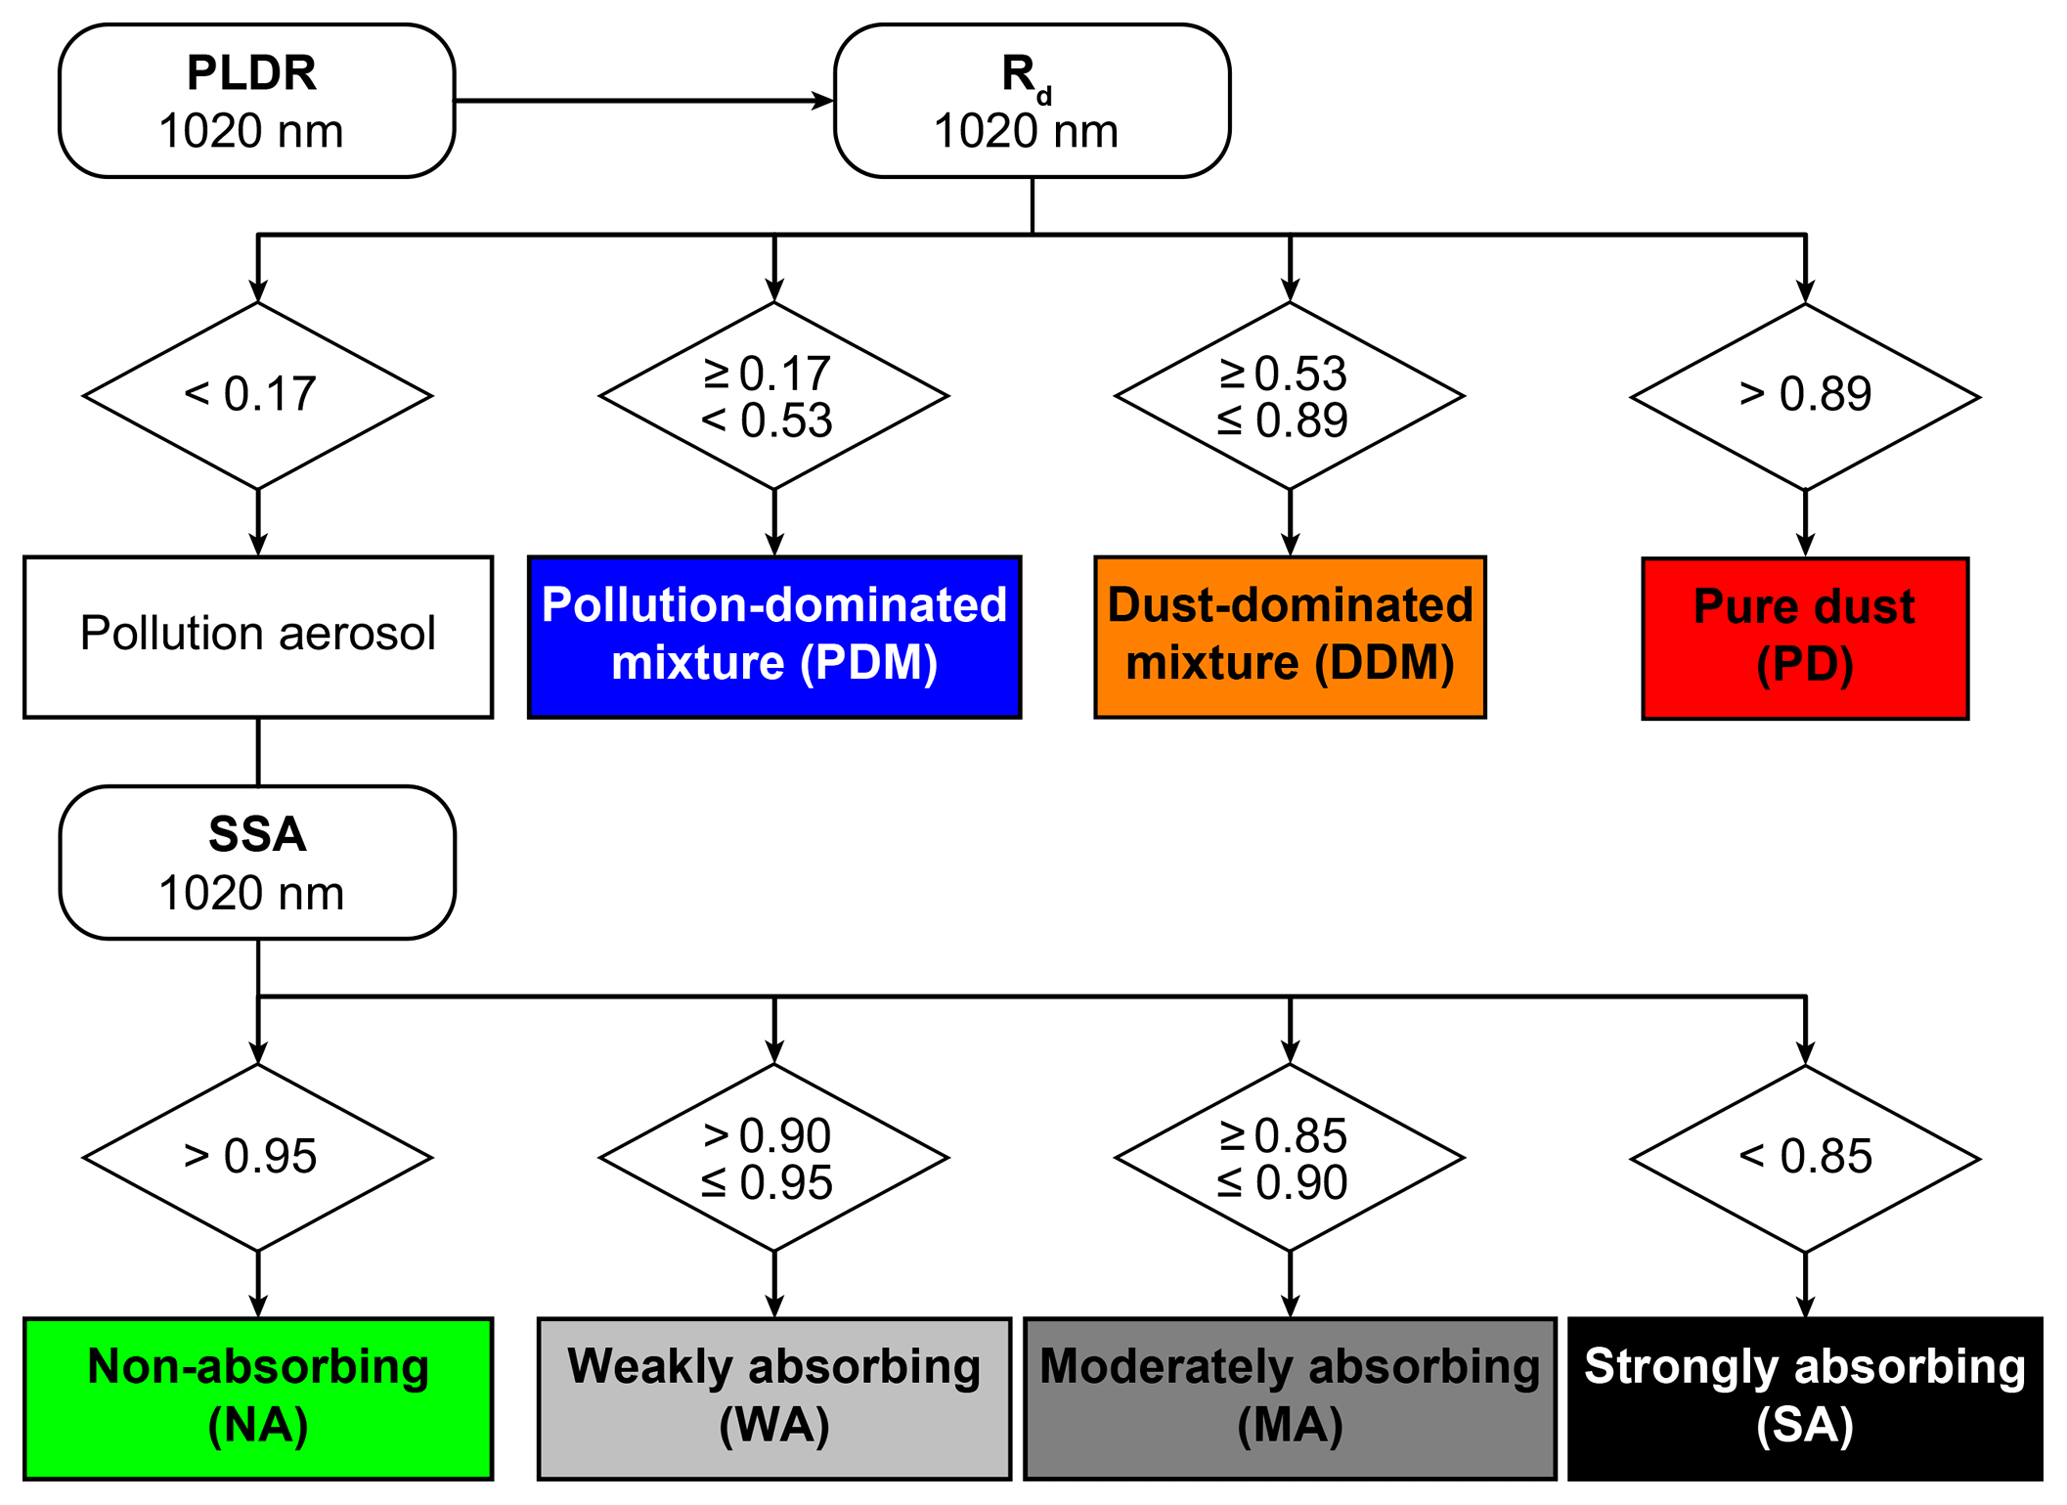
Figure 3Flow chart of the aerosol classification based on the dust ratio Rd derived using PLDR at 1020 nm and the 1020 nm SSAs that are inferred from the inversion of AERONET observations.
Figure 3 shows a flowchart of our aerosol classification method. The contribution of dust in the aerosol mixture is determined based on thresholds of Rd. Previous studies reported PLDR values for Asian dust of 0.08 to 0.35 at 532 nm (Murayama et al., 2004; Shimizu et al., 2004; Shin et al., 2015). Asian dust generally mixes with other aerosol types during long-range transport, which leads to a wide range in PLDR. Shin et al. (2015) used 0.08 at 532 nm as the threshold value to identify a contribution of mineral dust in mixed aerosol plumes. Shimizu et al. (2004) defined 0.10 at 532 nm as the threshold value for the classification of mixed mineral dust. In this study, we define pollution particles to show Rd<0.17 (equivalent to 1020 nm PLDR<0.06) and mineral dust to show Rd>0.89 (equivalent to 1020 nm PLDR >0.28). Values of Rd between 0.17 and 0.89 are considered to represent mixtures of mineral dust and pollution aerosols. We used a threshold of Rd=0.53 (equivalent to 1020 nm PLDR =0.16) to further separate between pollution-dominated mixed aerosol (PDM, Rd=0.17–0.53) and dust-dominated mixed aerosol (DDM, Rd=0.53–0.89). The light-absorbing properties and size of PDM are likely to be closer to the characteristics of pollution particles than to DDM. In the same way, the light-absorbing properties and size for DDM are more likely to resemble the characteristics of pure dust.
SSA at 440 nm is usually used to identify dust particles (Kim et al., 2007; Lee et al., 2010). Here, we use SSA at 1020 nm as we have already classified mineral dust and non-dust particles based on Rd. This means that we can make use of the better contrast that we find between black carbon and dust particles when using SSA at 1020 nm, and we can use this contrast for our threshold-based identification of different absorbing particle types and their mixtures. The SSA at 1020 nm of water-soluble aerosols, including sulfates, is close to unity (Hess et al., 1998), whereas SSA is close to zero for BC (0.07 at 1020 nm; Haywood and Ramaswamy, 1998). The SSA values for aerosol mixtures (e.g. BC with sulfate) vary, depending on the relative humidity and mixing ratio (e.g. 0.8 at 70 % RH and 0.05 BC∕sulfate mixing ratio for an internal mixture; see Fig. 3 in Wang and Martin, 2007). Dubovik et al. (2002) report SSA at 1020 nm of 0.83–0.95, 0.78–0.91, 0.97–0.99, and 0.97 for urban/industrial pollutants, biomass burning, desert dust, and marine aerosol, respectively. We note that spherical non-dust particles which were classified by Rd could contain biomass-burning aerosol, anthropogenic aerosols, or both. For simplicity and because AODs during purely marine conditions are generally too low to yield the AERONET level 2.0 inversion products used in this study, we refer to these particles as pollution. We now assume that pollution with higher SSA consists mostly of NA, whereas particles with lower SSA indicate that NA is mixed with BC. For this reason, an SSA threshold of 0.95 is used to identify NA and to mark the upper limit for pollution aerosols. Depending on 1020 nm SSA and adapting the threshold values of Lee et al. (2010), absorbing aerosols are then further divided into weakly absorbing (WA, SSA = 0.90–0.95), moderately absorbing (MA, SSA =0.85–0.9), and strongly absorbing (SA, SSA <0.85). For reference, biomass-burning aerosol generally contains a larger fraction of BC (and often brown carbon as well) compared to anthropogenic aerosol (Washenfelder et al., 2015), and thus is likely to fall into the more absorbing categories.
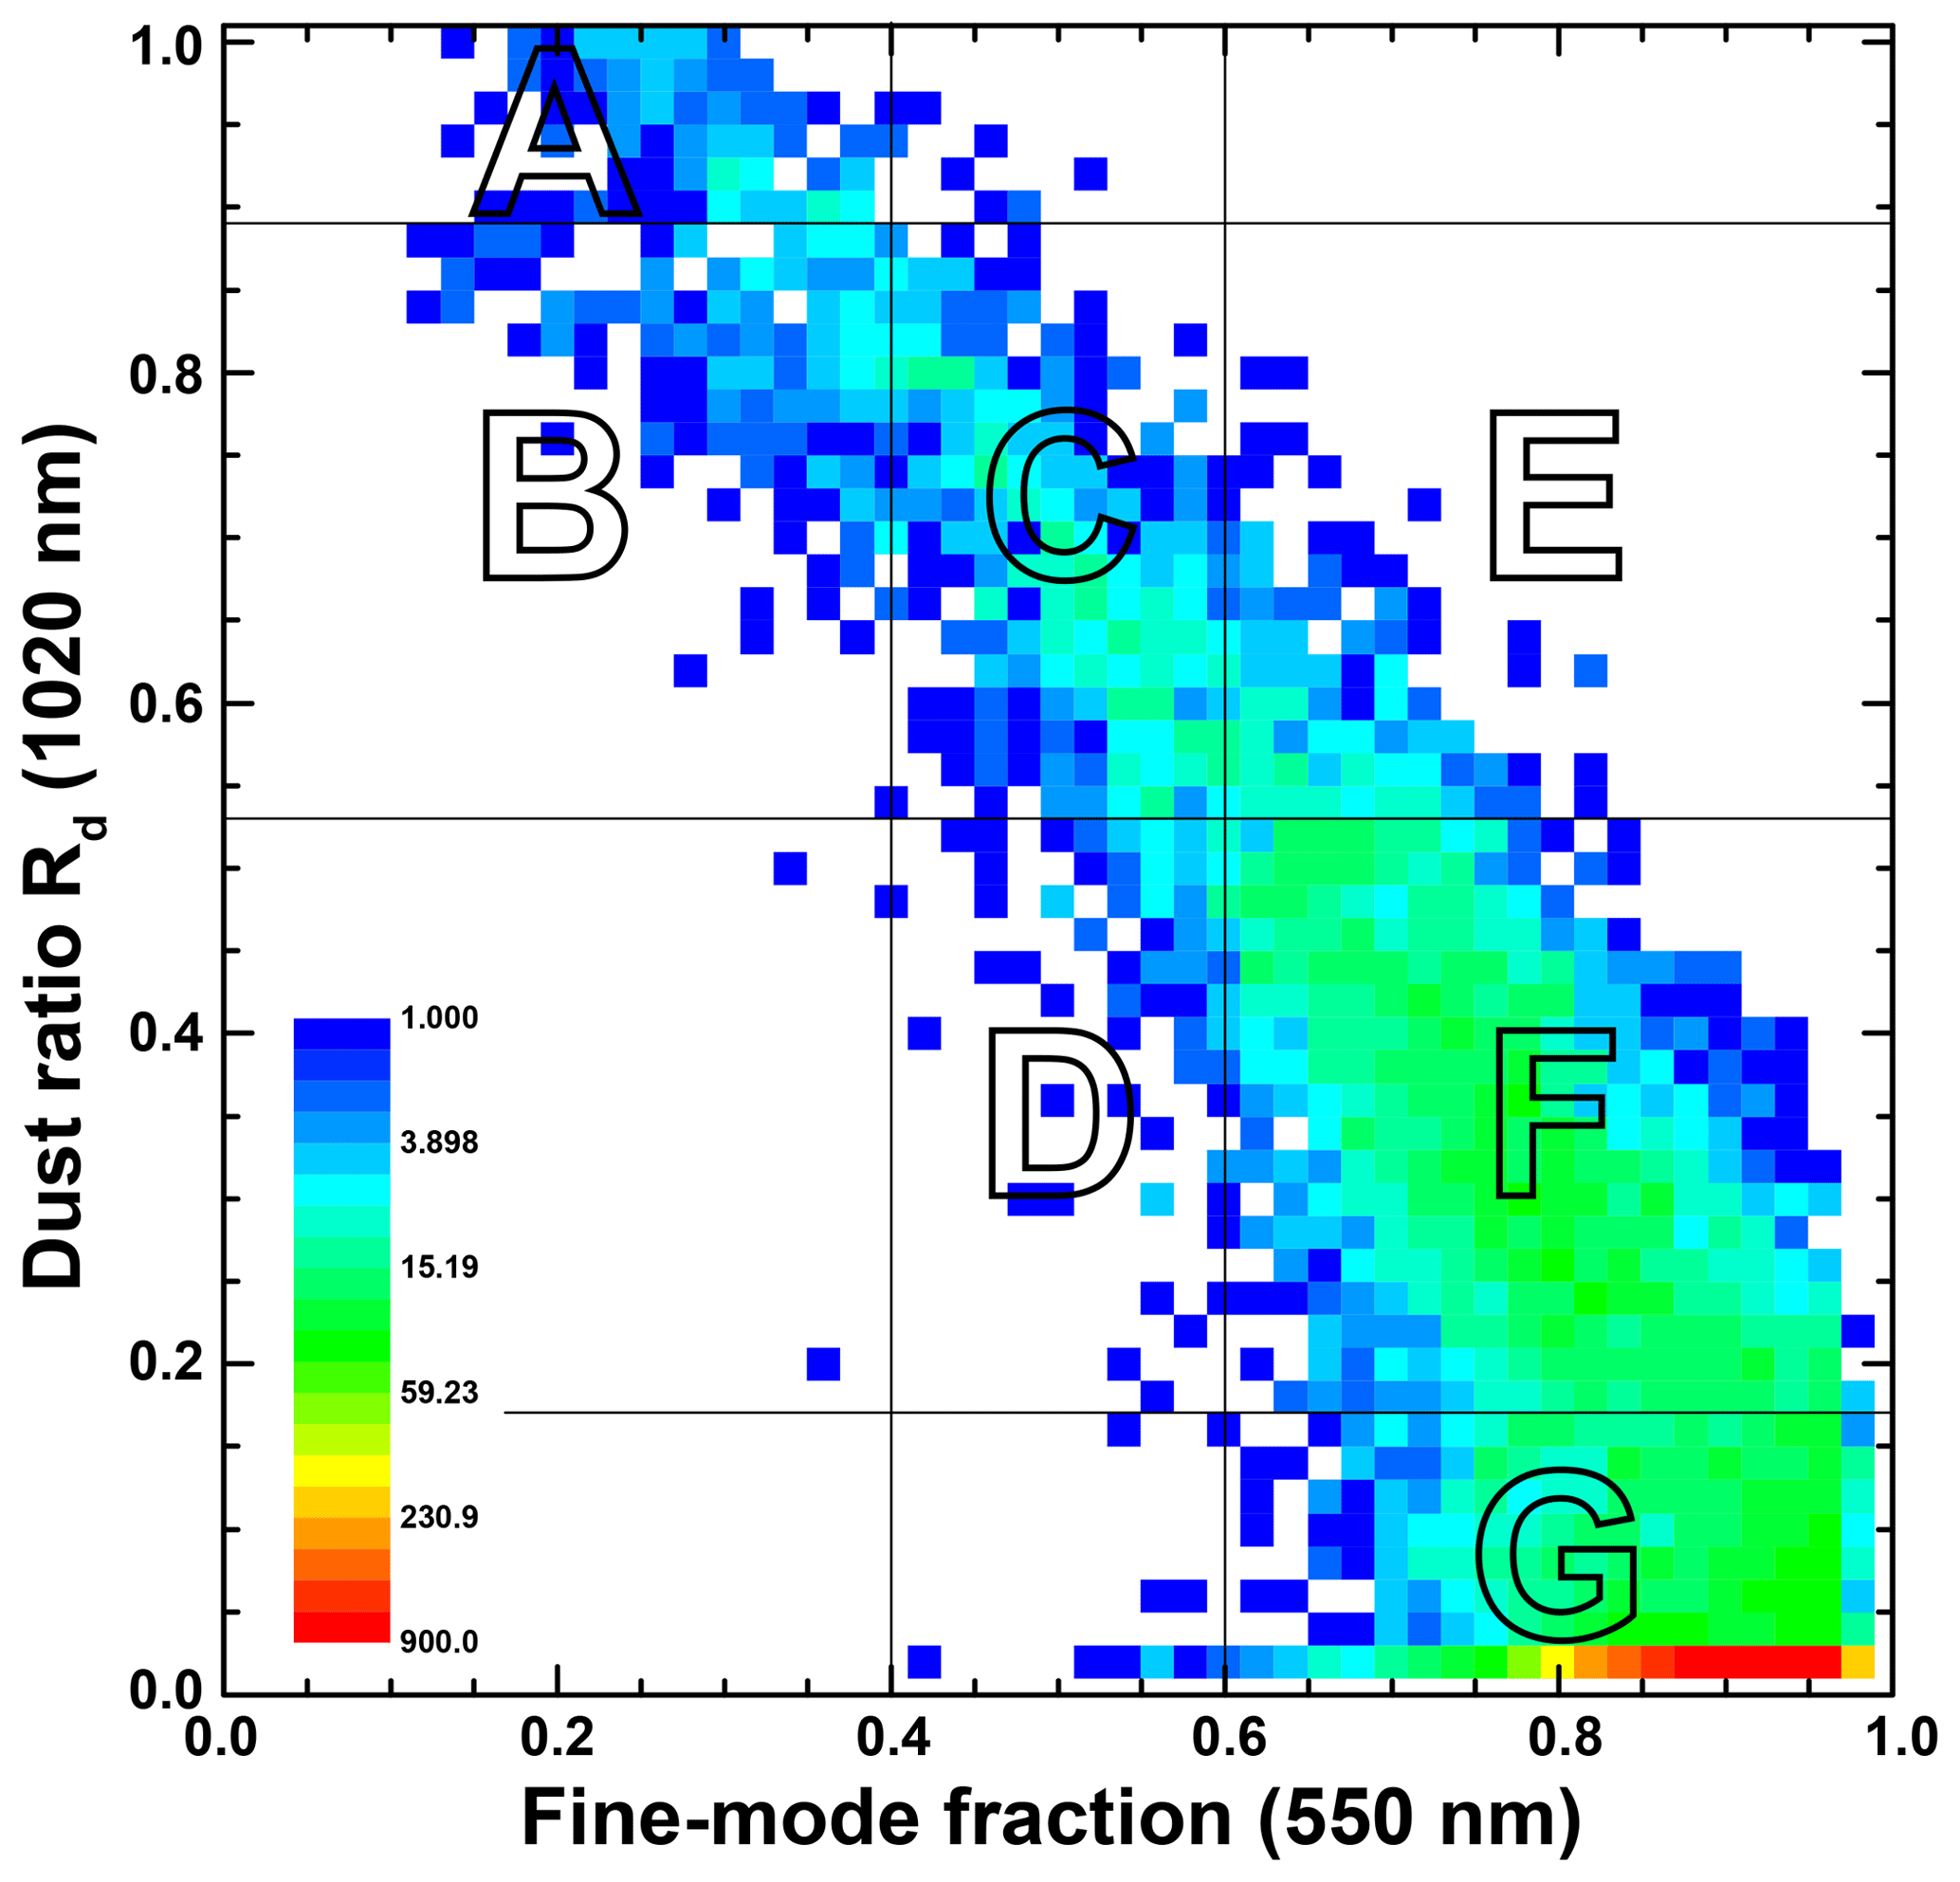
Figure 4Two-dimensional histograms of Rd derived using PLDR at 1020 nm and FMF at 550 nm for the considered AERONET stations over East Asia. Seven sectors, A to G, are defined according to the ranges of PLDR and FMF: pure dust (sector A), dust-dominated mixture (sectors B, C, and E), pollution-dominated mixture (sectors D and E), and pollution (sector G). The colour coding indicates the number of observation data in log scale.
3.1 FMF versus Rd for aerosol-type classification
Figure 4 shows a 2-D histogram of the relation between FMF and Rd. Desert dust predominately consists of coarse-mode particles, whereas combustion-produced particles are predominantly found in the FMF of particle size distributions. Nevertheless, nonspherical dust particles might also be present in the fine mode – in which case FMF would no longer be ideally suited to represent dust in the particle size distribution. Rd is close to zero for spherical particles such as anthropogenic or smoke particles and increases with increasing dust contribution. The dominant aerosol type in the aerosol mixture can be distinguished based on knowledge of FMF and Rd as the parameters refer to particle size and shape, respectively. We find a strong negative correlation of R2=0.77 for FMF versus Rd. The use of Rd and FMF allows us to separate between pure dust (PD, sector A), dust-dominated mixture (DDM, sectors B, C, and E), pollution-dominated mixture (PDM, sectors D and E), and pollution (sector G). This leads to an overall more comprehensive aerosol classification with respect to dusty mixtures.
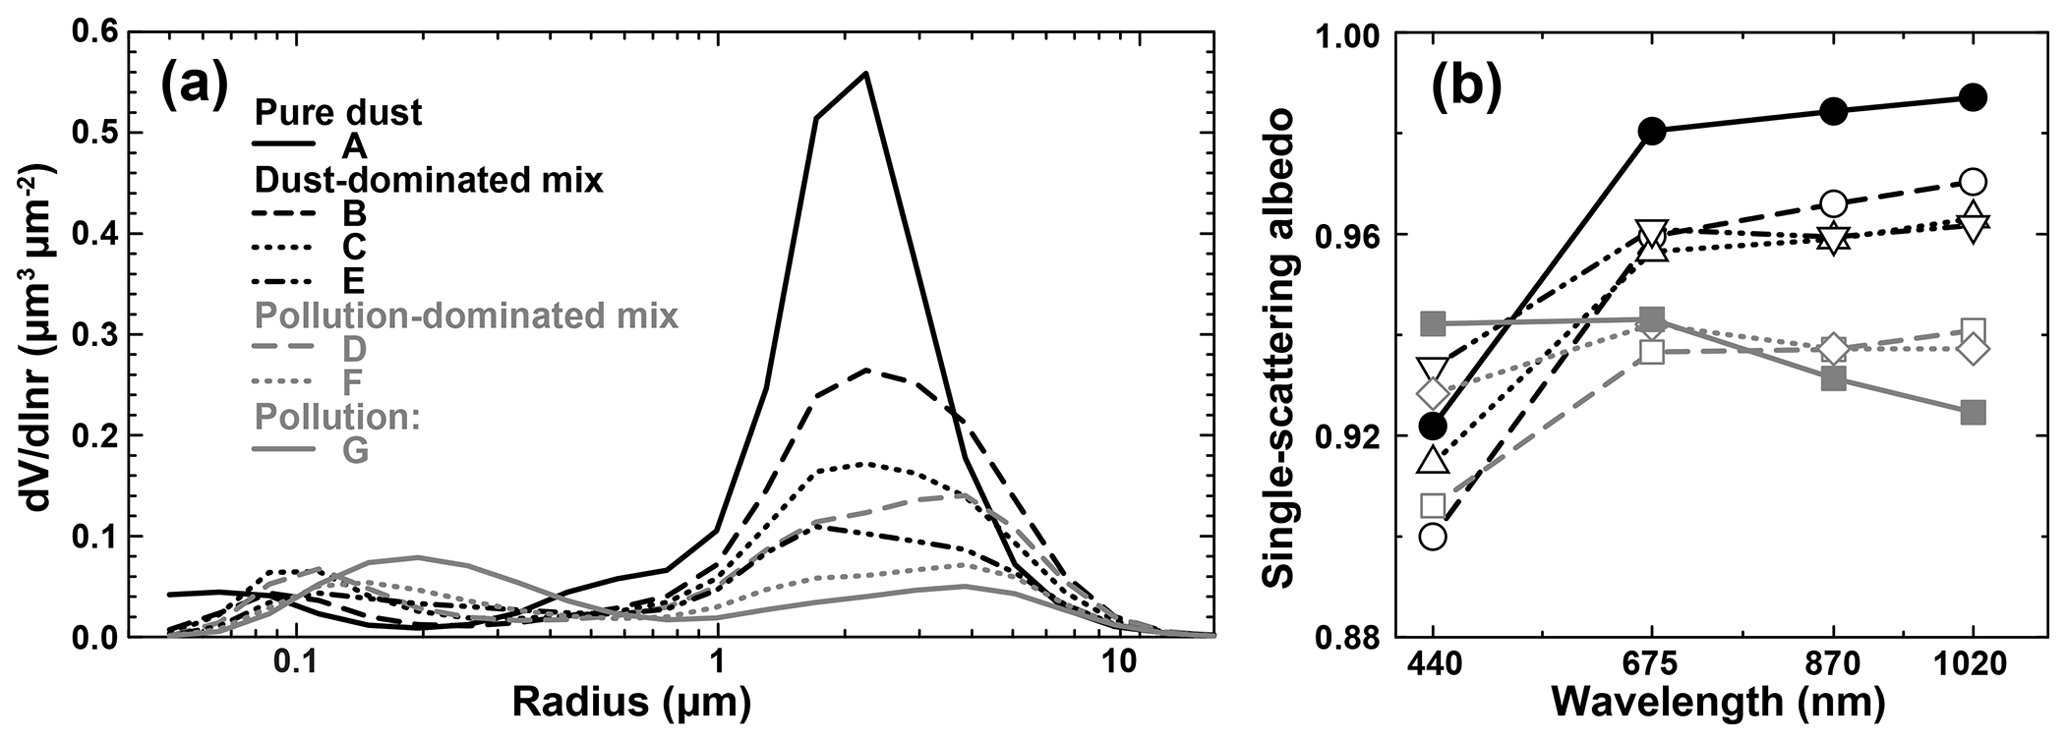
Figure 5Mean volume size distributions (a) and spectral SSA (b) for the aerosol-type sectors identified in Fig. 4. Black lines relate to pure dust (solid lines and circles) and dust-dominated mixtures (dashed lines, open circles, and triangles) while grey lines mark pollution (solid lines and squares) and pollution-dominated mixtures (dashed lines, open squares, and diamonds).
Figure 5 shows the mean volume particle size distribution and SSA of the seven sectors. The optical and microphysical properties of the aerosols in each sector are listed in Table 2. The volume particle size distribution and SSA for the two dust sectors A and B are markedly different. Sector A shows a mean FMF of 0.31±0.18 while this value increases to 0.41±0.17 in sector B. Additionally, the SSA at 1020 nm in sector A is 0.99±0.01 while SSA in sector B drop to 0.97±0.01. Although both sectors C and D are classified as mixed aerosols, particle size distribution of sector C is characterized by a more dominant coarse mode than particle size distribution in sector D.
Table 2Average values of AERONET-derived aerosol parameters for the sectors identified in Fig. 5: FMF, AOD-related Ångström exponent for the wavelength pair 440 and 870 nm (AE), PLDR at 1020 nm, SSA at 1020 nm, total volume concentration (VolC), effective radius (Reff), and the volume median radius (VMR). For comparison, Lee et al. (2010) classify categories A and B as dust, categories C and D as mixed, and categories E, F, and G as pollution.

The difference in the values of optical and microphysical properties of aerosol in sectors E, F, and G (pollution dominated) is even more pronounced. Values of FMF are 0.71±0.09, 0.80±0.08, and 0.90±0.05, respectively. SSA is 0.96±0.01, 0.94±0.01, and 0.92±0.01, respectively. The spectral dependence of SSA in sector E is also distinguishable from that of SSA in sectors F and G. SSA increases with increasing wavelength in sector E. Such a spectral behaviour is a characteristic feature of mineral dust. The SSA decreases with increasing wavelength in sector G. We find little spectral variation in SSA in sector F. Sectors F and G are more likely to represent pollution particles, whereas sector E more likely contains mixtures of pollution and mineral dust.
The volume particle size distribution and spectral SSA in sector A (pure dust based on PLDR) is clearly different from the ones in the other sectors. Sector A contains coarse-mode-dominated particle size distributions (FMF ) and shows a spectral SSA that resembles the one of mineral dust. Similarly, the spectral characteristics of SSA of aerosols in sectors B, C, and E, which are classified as dust-dominant mixtures, are characteristic for dust particles. However, SSA at 1020 nm is lower (0.96–0.97) compared to SSA at 1020 nm in sector A. SSA at 1020 nm varies around 0.94 in sectors D and F. These sectors were classified as pollution-dominated mixtures (based on PLDR). The volume size distributions for sectors D and F show that both coarse- and fine-mode particles are present in these mixtures. Sector G resembles the characteristics of pollution particles (high FMF and low SSA).
As in our earlier study (Shin et al., 2019), we conclude that FMF with its relation to particle size might be too ambiguous a parameter to distinguish aerosol types in mixed dust-pollution plumes. In contrast, PLDR and Rd are related to particle shape, and thus are likely to be better suited and physically more meaningful parameters for aerosol-type classification in which mineral dust is part of the aerosol mixture. Our method is particularly useful for observations in East Asia were mineral dust is almost always mixed with pollution. We therefore propose a refined categorization into pure dust, dust-dominated mixtures, pollution-dominated mixtures, and pollution.
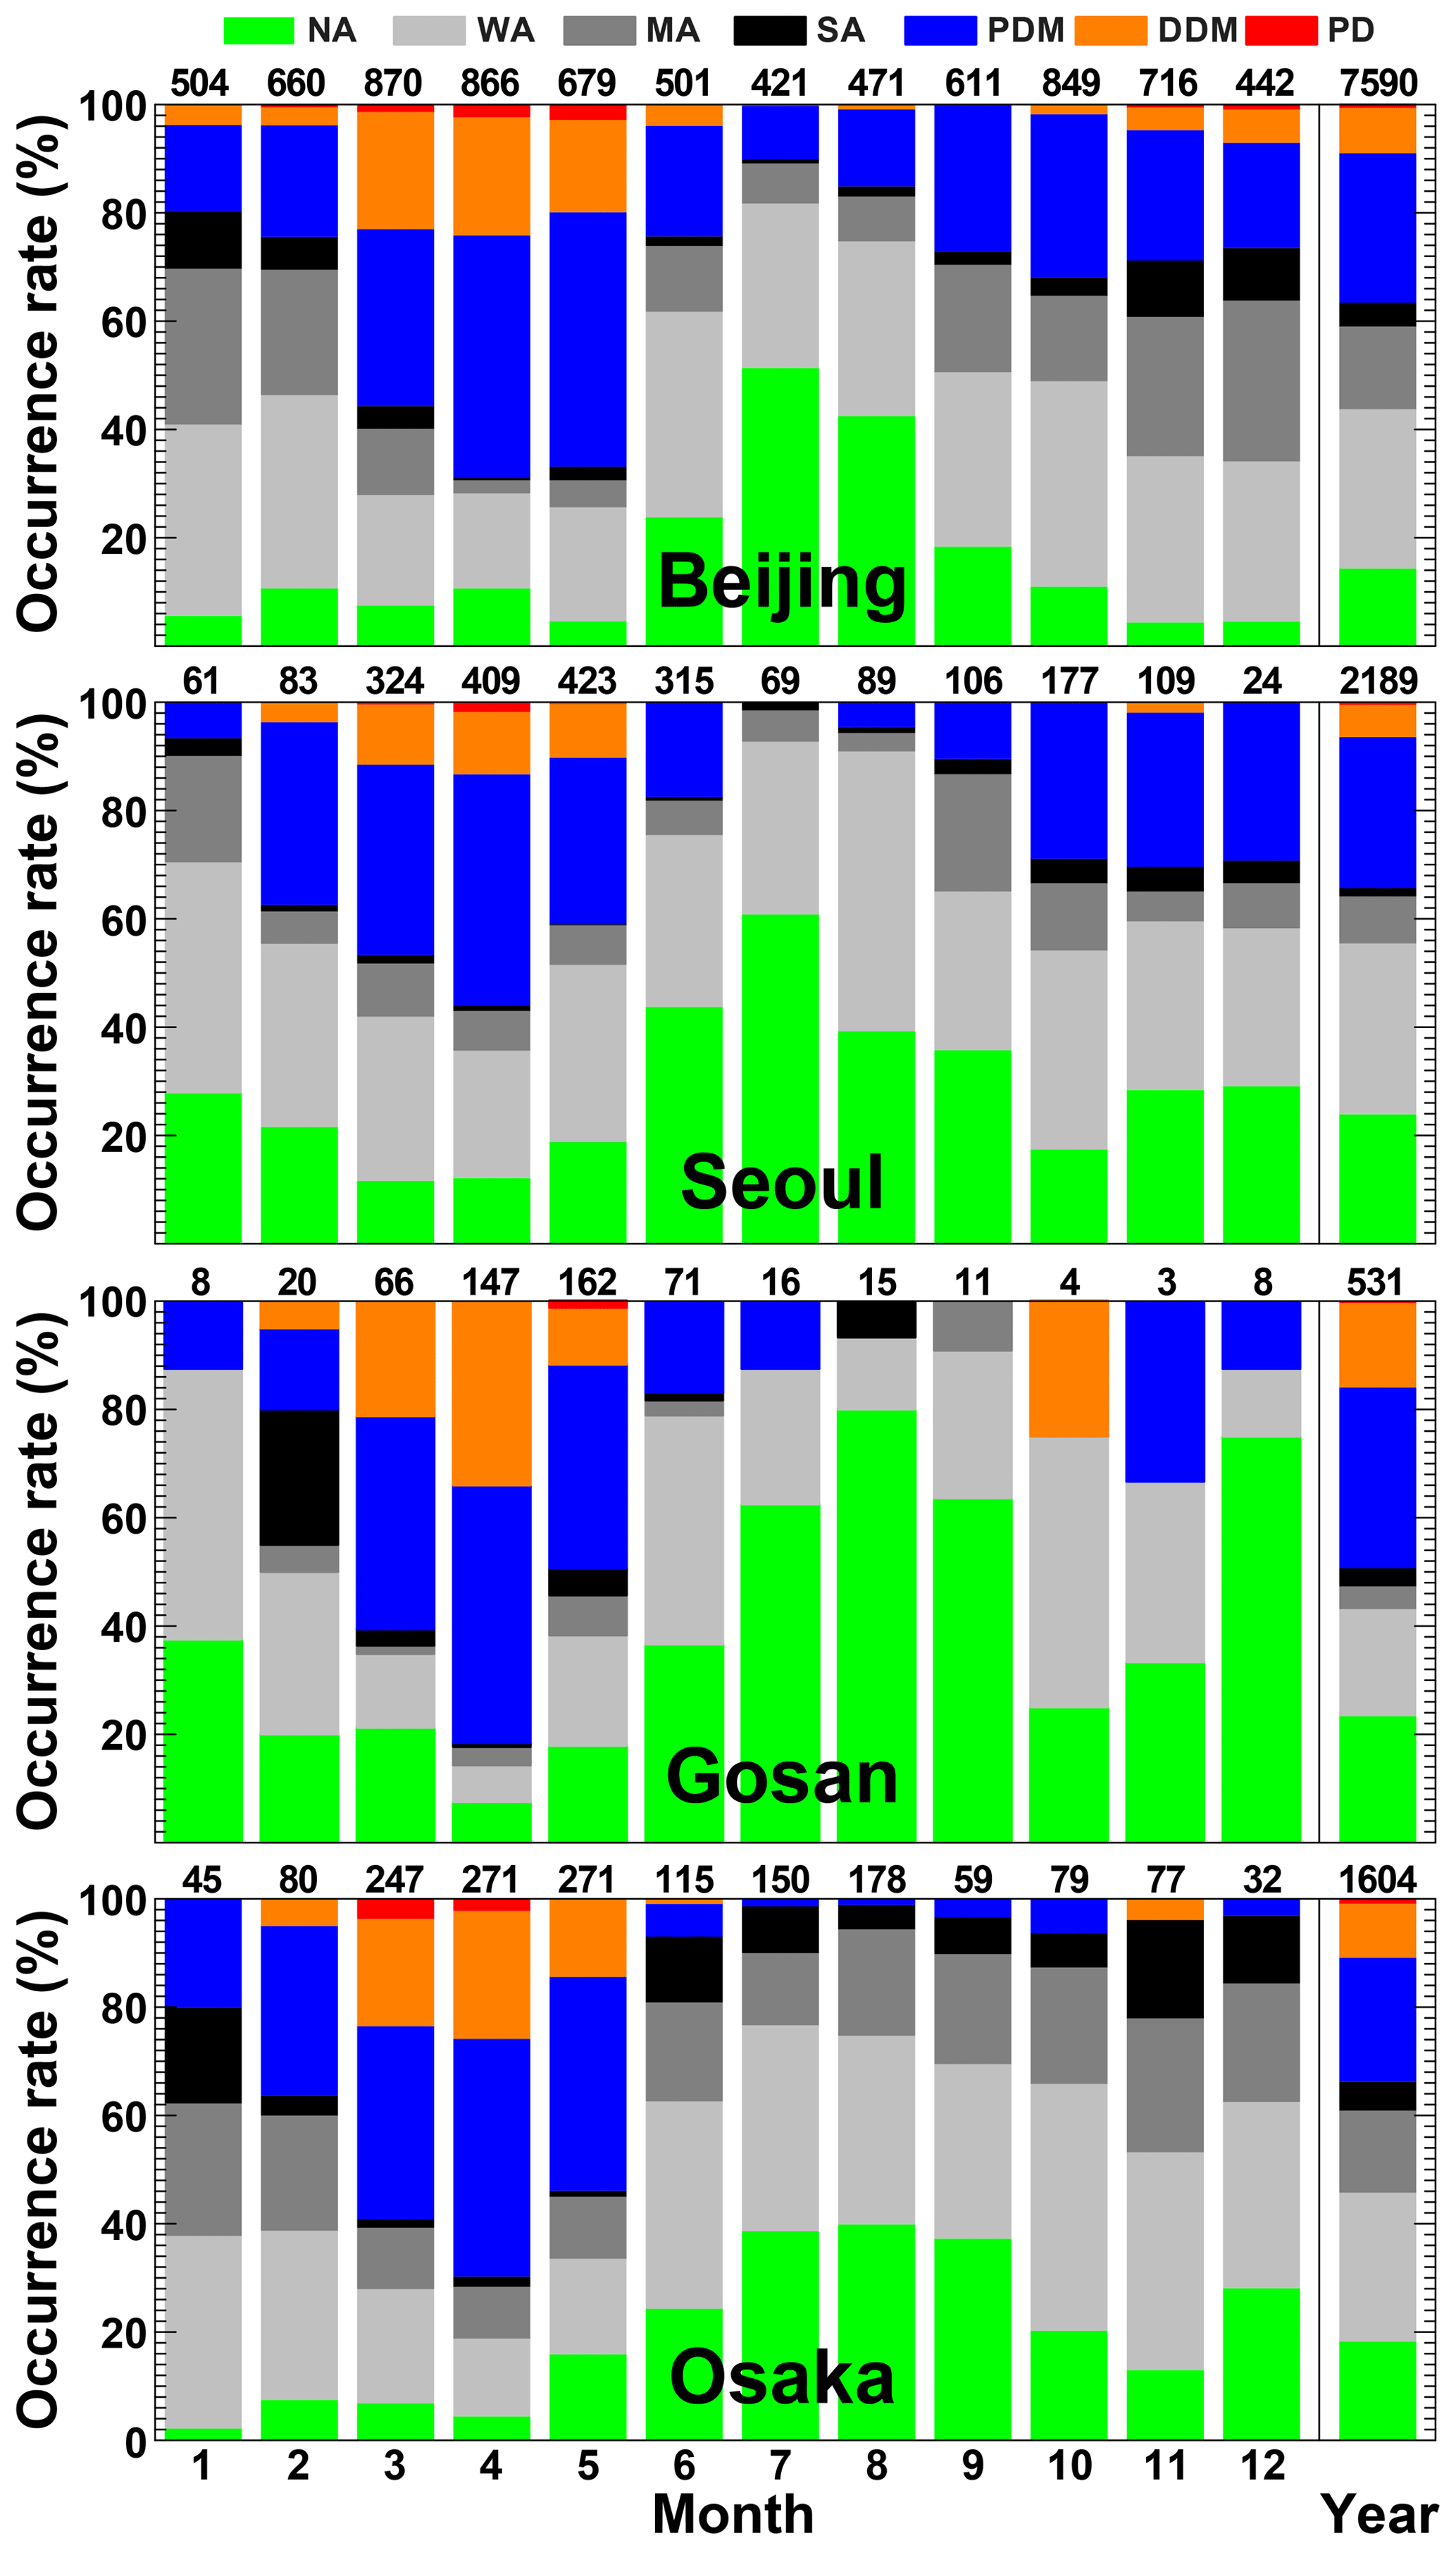
Figure 6Monthly and annual occurrence rate of the aerosol types classified according to this study for AERONET sites in East Asia. The colour coding refers to the aerosol species introduced in Fig. 3. The numbers above the plots refer to the number of observations for which SSA and PLDR are available in the AERONET database.
3.2 Characteristics of aerosol types over East Asia
We investigated the regional and seasonal characteristics of aerosol over East Asia. The rates of occurrences of aerosol types at each AERONET observation site are shown in Fig. 6. Regardless of season, pollution particles (NA+WA+MA+SA) are detected persistently over East Asia with a 51 %–66 % occurrence rate when considering the annual average. Pollution particles are detected most frequently at Seoul and Osaka (66 %). The lowest occurrence rate of pollution of 51 % was found at Gosan_SNU. The seasonal variation and specific type of pollution differ for the different sites. Aerosols classified as more light absorbing (MA+SA), are detected most frequently at Greater Beijing (SA: 4 %; MA: 15 %) and Osaka (SA: 5 %; MA: 15 %) followed by Seoul (SA: 2 %; MA: 9 %) and Gosan_SNU (SA: 3 %; MA: 4 %). The most frequently detected aerosol types over Seoul were NA (24 %), PDM (28 %), and WA (32 %). Differences in the frequency of different types of pollution particles, i.e. the BC-dominated types (MA and SA) and WA and NA, which contain little or no BC, can be explained by the sources of the aerosols. The occurrence rate of MA and SA at Greater Beijing (19 %) is larger than at Seoul (11 %). China has become a major source of BC because of fossil fuel combustion stemming from industry, domestic heating, and cooking. The contribution of BC in pollution thus has increased. In contrast, water-soluble (hygroscopic) aerosol particles such as sulfate or nitrate might be dominant in the anthropogenic pollution plumes over Seoul.
The occurrence rate of pure and polluted dust (PD, DDM, and PDM) over East Asia is slightly lower (34 %–49 %) than that of dust-free pollution. PDM is the most frequently detected aerosol type (over East Asia) of all types that include dust, i.e. PD, DDM, and PDM. The occurrence rates of PDM were 28 %, 28 %, 33 %, and 23 % for Greater Beijing, Seoul, Gosan_SNU, and Osaka, respectively. In contrast, the occurrence rate for PD was around 1 % at most sites. Central Asian dust has usually travelled over densely populated and highly industrialized areas of China before it is detected. That means, as the result of transport path and time dust has usually mixed with pollutants before being detected (Sun et al., 2005; Shin et al., 2015). The low occurrence rate for PD and relatively higher occurrence rate for PDM and DDM over East Asia corroborate this assumption, i.e. that dust particles over East Asia are typically mixed with anthropogenic pollution or that any stratification of the different aerosol types will show the optical signature of a mixture in the column-integrated AERONET measurements.
The seasonal variation in each aerosol type retrieved with our aerosol classification method corroborates the findings of Xia et al. (2007), Guo et al. (2011), and Jung et al. (2009). Overall, dust-containing aerosol types (PD, DDM, and PDM) have the highest occurrence rates during spring with as much as 82 % of cases for Gosan_SNU in April. This is in line with the Asian dust season in spring (Guo et al., 2011). PD is observed at all sites during spring but only with low occurrence rates of 1 % to 4 %. PD is also rarely observed during the other seasons. The occurrence rates of pollutant particles are consistently high except during spring. The distributions and types of pollutant particles are rather complex because of the variety of their sources with respect to location and season. Higher rates of SA and MA are detected at most observation sites during winter, which is likely the result of increased combustion of coal for domestic heating. In contrast, the Gosan_SNU site is less influenced by strong light-absorbing particles during winter compared to the other observation sites as it is located away from highly industrialized areas. The higher SA and MA occurrence rates detected during summer at Osaka might be due to regional climate effects: a high oxidant level from local emissions, high temperature, and strong thermal insulation support the conversion of volatile organic compounds into secondary organic aerosols (Sano et al., 2016). The aged secondary organic aerosols could produce brown carbon, which is significantly light absorbing (Liu et al., 2016).
Another feature to note is the occurrence rate of NA and WA, which increases during summer at all sites. Sulfate and nitrate are major contributors to the aerosol loading during summer over East Asia. Strong solar radiation, high ambient temperature, and high relative humidity during summer in East Asia enhance photochemical processes. These conditions may have been responsible for the higher summer concentrations of ammonium sulfate and nitrate (Jung et al., 2009). The Asian monsoon is another possible reason for the increased frequency of occurrence of NA and WA during summer. Increased relative humidity and associated hygroscopic particle growth during monsoon season can cause changes in aerosol scattering properties (Xia et al., 2007). Regardless of season, significant amounts of NA and WA are detected at the coastal sites Gosan_SNU and Osaka. The high values of NA and WA might be the result of large contributions of maritime aerosol, which is strongly light scattering as well as highly hygroscopic.
3.3 Dominant aerosol types at representative aerosol source regions
In order to further test our method, we used it to determine the dominant aerosol types at well-characterized AERONET sites representative for anthropogenic pollution, biomass-burning particles, and mineral dust (Dubovik et al., 2002; Giles et al., 2012; Choi et al., 2016). Details on the selected sites together with the occurrence rates of different aerosol types are given in Table 3.
Table 3Occurrence rate (in percent) of the aerosol types identified with our method at the AERONET sites given in the lower half of Table 1.
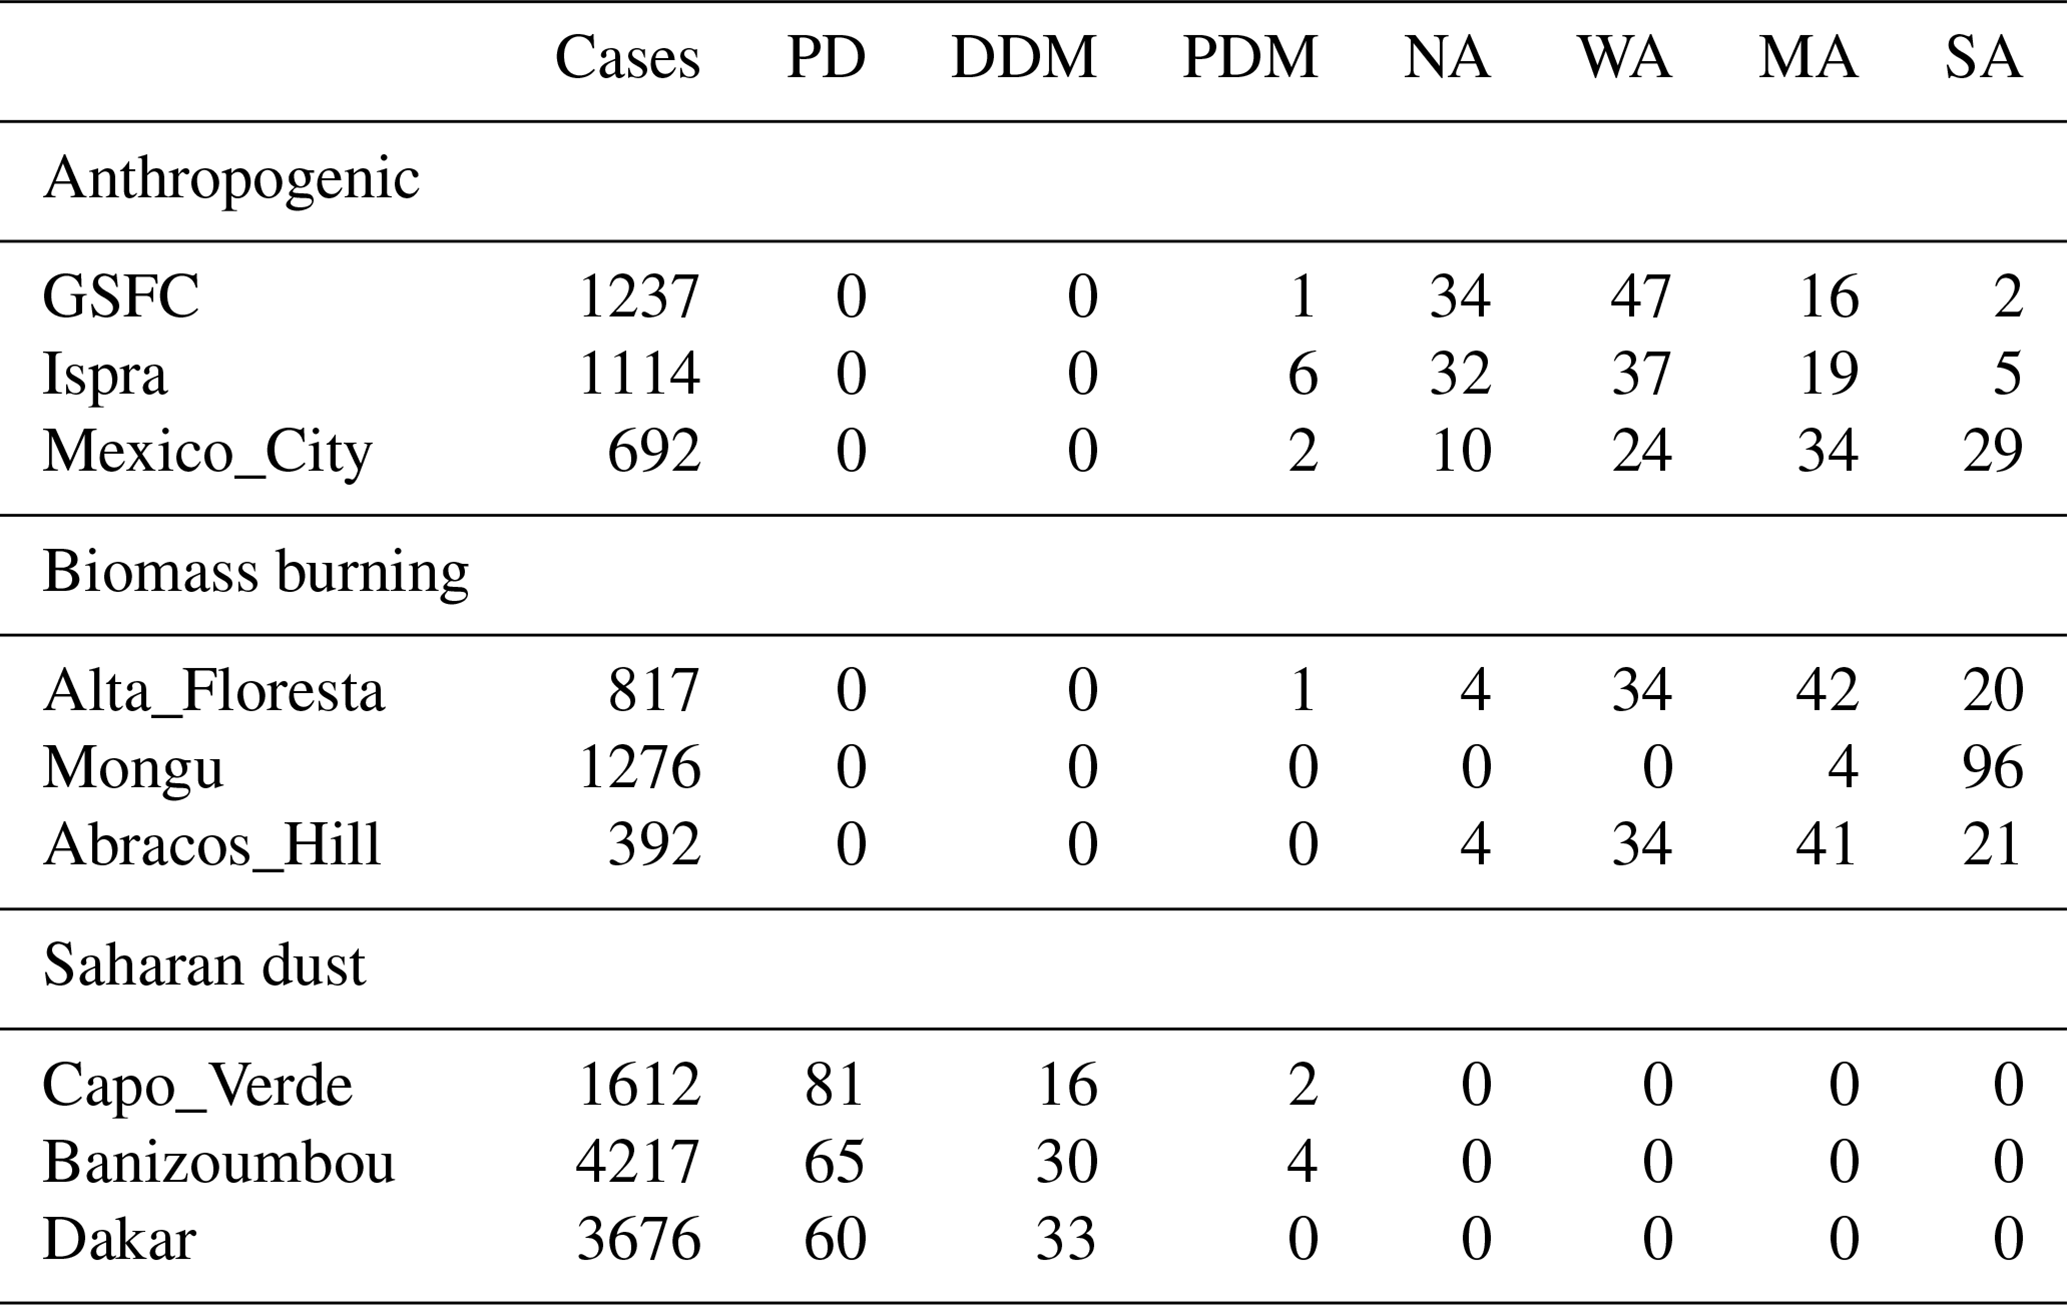
The dominant aerosol type at dust sites was PD with occurrence rates of 64 % to 81 %. PD was most frequently detected at Cabo Verde with an 81 % occurrence rate. Additionally, notable occurrence rates for DDM (16 % to 35 %) and PDM (0 % to 4 %) are also found at the dust sites. This suggests that AERONET sites in or close to source regions of mineral dust are frequently affected by local pollution or other aerosols from sources upwind. The highest occurrence rate of 35 % for mixed dust types (DDM+PDM) was found at Dakar where local pollution has a much stronger effect on aerosol composition compared to other Saharan sites (Petzold et al., 2011). We have considered the AERONET sites Dakar and Banizoumbou to investigate if our methodology can be used to resolve the seasonal cycles of dust and biomass burning over West Africa (not shown). We find that the two sites are dominated by PD, DDM, and PDM but that the ratio of the three types varies with season. PD contributes most strongly in spring (MAM, 71 % at Dakar and 88 % at Banizoumbou) and summer (JJA, 74 % and 72 %), decreases in autumn (SON, 55 % and 63 %), and has minimum contributions in winter (DJF, 37 % and 49 %). The decrease in PD comes with an increase in DDM from spring and summer to autumn and winter (Dakar: 25 % in MAM, 21 % in JJA, 40 % in SON, and 45 % in DJF; Banizoumbou: 11 % in MAM, 23 % in JJA, 36 % in SON, and 40 % in DJF). In addition, PDM has a maximum in winter (17 % at Dakar and 10 % at Banizoumbou) with values between 0 % and 5 % during the other seasons. Contributions of other aerosol types are negligible at the two sites throughout the year.
The sites for anthropogenic pollution show an extremely high occurrence rate of pollutants of 93 % to 99 %, though the occurrence rates of the individual subtypes vary from site to site. Higher occurrence rates of NA and WA were found at GSFC (34 % and 47 %) and Ispra (32 % and 37 %). Conversely, a higher occurrence rate of MA (34 %) and SA (29 %) was found at Mexico City, which is frequently affected by severe air pollution that mostly consists of fine-mode and carbonaceous aerosols (Choi et al., 2016). Choi et al. (2016) used cluster analysis in combination with AERONET data and found that secondary inorganic particles dominate at GSFC. Carbonaceous aerosol has strong light-absorption properties, whereas secondary inorganic aerosols such as sulfates predominantly scatter light (Bond and Bergstrom, 2006).
The frequency distributions of SA and MA are higher at the biomass-burning sites. Those sites are considered to be affected by mostly light-absorbing particles from combustion. A high occurrence rate of 96 % of SA was found at Mongu. MA is the most frequently detected type at Alta Floresta (42 %) and Abracos Hill (41 %). BC is produced by flaming fires, i.e. at high temperatures. This type of BC production is prevalent at Mongu, whereas production of primary organic carbon at lower temperatures (smoldering fires) is dominant at Alta Floresta (Reid et al., 2005; Choi et al., 2016). The occurrence rates of NA (4 %) and WA (34) at Alta Floresta and Abracos Hill are also distinguishable from the rates at Mongu where less than 0.5 % was detected as NA or WA. The photochemical formation of secondary inorganic aerosols due to emissions from biomass burning seems to be much more frequent at Alta Floresta and Abracos Hill compared to Mongu (Choi et al., 2016).

Figure 7Mean spectral SSA (upper row) and mean particle size distributions (lower row) for AERONET sites that are considered to be representative for different aerosol types as well as for the aerosol types defined in this study (see Fig. 3 for colour coding). Note that the size distribution for pure mineral dust (red line) has been scaled to 50 % to fit the plot.
Figure 7, analogous to Figs. 1 and 2, presents the mean spectral SSA and volume particle size distributions for the AERONET sites that are mainly affected by anthropogenic pollution, biomass-burning smoke, and Saharan dust. The spectral behaviour of SSA at these sites strongly resembles that presented by Dubovik et al. (2002), Eck et al. (2009), Giles et al. (2012), and Shin et al. (2018). Dust particles exhibit strong light absorption at short wavelengths and lower absorption in the visible and near-infrared wavelength regions (Shin et al., 2018). Fine-mode particles and hygroscopic particles such as sulfate show nearly neutral spectral dependence of SSA and overall stronger light scattering, i.e. higher SSA (Dubovik et al., 2002). BC has the strongest light-absorption properties in the near-infrared wavelength region. Organic and brown carbon exhibit stronger light-absorption properties at ultraviolet and visible wavelengths (Eck et al., 2009).
The SSA at sites that represent anthropogenic pollution likely reflects the spectral features of SSA of fine-mode particles and hygroscopic particles. The values of SSA at Mexico City are lower than at other anthropogenic sites for the entire range of wavelengths. Mexico City is frequently influenced by air pollution that likely consists of more carbonaceous aerosols, whereas GSFC and Ispra are affected by secondary inorganic particles (Choi et al., 2016). Additionally, the spectral dependence of SSA at the biomass-burning sites is similar to that of BC. We note that the values of SSA at the Mongu site are much lower than the values of SSA at the other biomass-burning sites in the entire wavelength range. Various absorbing aerosols (e.g. black, organic and brown carbon, or secondary inorganic aerosols) can be emitted from biomass burning. The lower SSA at Mongu might be the result of a higher fraction of BC compared to the other biomass-burning sites. Consequently, the spectral dependence of SSA at Alta Floresta and Abracos Hill is more neutral with higher values of SSA compared to Mongu. BC has the strongest light-absorption properties in the near-infrared wavelength region, while organic and brown carbon exhibit stronger light-absorption properties at ultraviolet and visible wavelengths (Eck et al., 2009). The spectral dependence of SSA at the dust sites is representative of mineral dust particles.
Figure 7 also compares the spectral SSA at the AERONET sites to the spectral SSA of the aerosol types defined in our classification method (see Figure 3). The SSA for NA is higher than SSA at the anthropogenic sites at all wavelengths except for the observation at GSFC at 440 nm. The SSA for WA is similar to values obtained at GSFC and Ispra. We conclude from this that NA – in view of the definition of aerosol type – consists to a largest degree of light-scattering particles. Similarly, WA represents aerosols that contain both light-scattering and light-absorbing particles with the light-scattering contribution being predominant.
Biomass-burning sites observe light-scattering particles and light-absorbing particles, which is reflected in SSA. The spectral SSA of MA is similar to the values found at Alta Floresta and Abracos Hill except at short wavelengths. Consequently, MA is an aerosol mixture in which light-absorbing particles have a stronger impact. The absorbing properties are most likely related to the contribution of organic carbon. Finally, the spectral SSA of SA is closest to the observations at Mongu and suggests that the light- absorbing properties of SA are related to a strong contribution of BC. We note that the SSA of SA and Mongu are different. SA has been defined based on observations in East Asia where absorbing particles are likely present in complex mixtures. In contrast, BC is considered to be the dominant aerosol at Mongu.
The spectral SSA of DDM and PD is similar to the one found at the dust sites. However, the SSA of DDM is slightly lower than SSA of PD and of the AERONET dust sites as a result of mixing with pollutant particles. Accordingly, the SSAs of PDM are even lower than of PD, DDM, and AERONET dust sites as they are defined to feature a larger contribution of pollutants.
The volume size distributions show a dominance of coarse-mode particles at the dust sites. Coarse-mode particles also contribute strongly to the total volume size distribution for PD and DDM, whereas a lower contribution of coarse-mode particles is found for PDM. This result is in line with an increased concentration of anthropogenic pollution or biomass-burning smoke which, in the PDM type, are typically considered to be fine-mode particles (Eck et al., 1999).
Fine-mode particles contribute most strongly to the total volume size distribution at biomass-burning sites. Additionally, the contributions of fine and coarse modes are distributed evenly in the total volume size distribution for MA and SA. Reid et al. (1998) found from studies in rainforest regions of Brazil that fresh smoke particles are significantly smaller than well-aged smoke particles. We believe that fresh smoke particles contribute significantly at the biomass-burning sites, whereas MA and SA detected over East Asia are affected not only by fine-mode particles but also a considerable amount of coarse-mode particles, in contrast to the source regions of biomass burning. The contributions of fine-mode and coarse-mode particles to the total volume size distributions are rather similar for the anthropogenic sites. However the contribution of fine-mode particles to the total volume size distributions is dominant for NA.
We present a methodology that is used for classifying the dominant types of aerosol particles in mixed aerosol plumes. Note that in the case of AERONET measurements, mixtures might also refer to a vertical stratification of different aerosol types that shows the column-integrated optical signature of a mixed plume. We used PLDR and SSA that are provided in the AERONET version 3 level 2.0 inversion products. Dusty aerosol mixtures were separated according to pure dust, dust-dominated mixtures, pollution-dominated mixtures, and pollution. The pollutants were classified as non-absorbing, weakly absorbing, moderately absorbing, and strongly absorbing particles based on using SSA at 1020 nm. The new aerosol typing method provides detailed information on aerosol mixtures that contain varying levels of mineral dust.
We tested our method at East Asian AERONET sites that are frequently affected by various aerosol type. We found that aerosols categorized as pollutant (NA+WA+MA+SA) are most frequently detected over East Asia. The detection rate was 50 %–67 %. The distribution and types of pollutant vary according to the location of sites and season. The frequency distribution for PD or dust-containing aerosol (DDM+PDM) plumes is lower than that of pollutants. Moreover, PD was detected in less than 1 % of the observations at most sites over East Asia. This suggests that dust over East Asia is almost always mixed with other types of aerosol.
We compared the results of our aerosol-type classification to the aerosol properties obtained from selected AERONET sites which are considered to be representative for different aerosol types, i.e. anthropogenic pollution, biomass-burning smoke, and mineral dust. For anthropogenic pollution, we found that MA and SA occur most frequently at Mexico City, whereas GSFC and Ispra are affected most strongly by NA and WA. The frequency distribution of SA and MA is higher at the biomass-burning sites. Those sites are affected by mostly light-absorbing particles from combustion. PD is the dominant aerosol at dust sites. From the comparison to representative AERONET sites, we conclude that the method we use to identify dominant aerosol types over East Asia also leads to reasonable results at other sites. The proposed method has the potential to provide improved information on aerosol type in regions where various types of aerosol are frequently present in the form of complex mixtures – not only over East Asia but also elsewhere on the globe. Application of our aerosol-typing method to the global AERONET database will provide useful information for the validation of chemical transport modelling as well as (active) spaceborne sensors that provide PLDR observations.
The data used in this work are freely available through the AERONET portal at https://aeronet.gsfc.nasa.gov/ (AERONET, 2019).
SKS, MT, and YN had the idea for this study. SKS and MT performed the data analysis and prepared the figures. All authors contributed to the discussion of the findings and the preparation of the paper.
The authors declare that they have no conflict of interest.
We thank the principal investigators and their staff for establishing and maintaining the AERONET sites used in this investigation.
This work was supported by a National Research Foundation of Korea (NRF) grant funded by the Korean government (grant no. NRF-2018R1D1A3B07048047).
This paper was edited by Alexander Kokhanovsky and reviewed by Patrick Hamill and one anonymous referee.
Aerosol Robotic Network (AERONET): available at: https://aeronet.gsfc.nasa.gov/, 9 July 2019. a, b
Bellouin, N., Quaas, J., Morcrette, J.-J., and Boucher, O.: Estimates of aerosol radiative forcing from the MACC re-analysis, Atmos. Chem. Phys., 13, 2045–2062, https://doi.org/10.5194/acp-13-2045-2013, 2013. a
Bergstrom, R. W., Russell, P. B., and Hignett, P.: Wavelength dependence of the absorption of black carbon particles: Predictions and results from the TARFOX experiment and implications for the aerosol single scattering albedo, J. Atmos. Sci., 59, 568–578, 2002. a
Bohren, C. and Huffman, D.: Absorbing and scattering of light by small particles, Wiley, https://doi.org/10.1002/9783527618156, 1983. a, b
Bond, T. C. and Bergstrom, R. W.: Light absorption by carbonaceous particles: An investigative review, Aerosol Sci. Tech., 40, 27–67, https://doi.org/10.1080/02786820500421521, 2006. a
Boselli, A., Caggiano, R., Cornacchia, C., Madonna, F., Mona, L., Macchiato, M., Pappalardo, G., and Trippetta, S.: Multi year sun-photometer measurements for aerosol characterization in a Central Mediterranean site, Atmos. Res., 104, 98–110, https://doi.org/10.1016/j.atmosres.2011.08.002, 2012. a
Burton, S. P., Ferrare, R. A., Hostetler, C. A., Hair, J. W., Rogers, R. R., Obland, M. D., Butler, C. F., Cook, A. L., Harper, D. B., and Froyd, K. D.: Aerosol classification using airborne High Spectral Resolution Lidar measurements – methodology and examples, Atmos. Meas. Tech., 5, 73–98, https://doi.org/10.5194/amt-5-73-2012, 2012. a, b, c
Burton, S. P., Vaughan, M. A., Ferrare, R. A., and Hostetler, C. A.: Separating mixtures of aerosol types in airborne High Spectral Resolution Lidar data, Atmos. Meas. Tech., 7, 419–436, https://doi.org/10.5194/amt-7-419-2014, 2014. a, b
Burton, S. P., Hair, J. W., Kahnert, M., Ferrare, R. A., Hostetler, C. A., Cook, A. L., Harper, D. B., Berkoff, T. A., Seaman, S. T., Collins, J. E., Fenn, M. A., and Rogers, R. R.: Observations of the spectral dependence of linear particle depolarization ratio of aerosols using NASA Langley airborne High Spectral Resolution Lidar, Atmos. Chem. Phys., 15, 13453–13473, https://doi.org/10.5194/acp-15-13453-2015, 2015. a
Choi, Y., Ghim, Y. S., and Holben, B. N.: Identification of columnar aerosol types under high aerosol optical depth conditions for a single AERONET site in Korea. J. Geophys. Res., 121, 1264–1277, https://doi.org/10.1002/2015JD024115, 2016. a, b, c, d, e, f
Derimian, Y., Karnieli, A., Kaufman, Y. J., Andreae, M. O., Andreae, T. W., Dubovik, O., Maenhaut, W., and Koren, I.: The role of iron and black carbon in aerosol light absorption, Atmos. Chem. Phys., 8, 3623–3637, https://doi.org/10.5194/acp-8-3623-2008, 2008. a
Dubovik, O. and King, M.: A flexible inversion algorithm for retrieval of aerosol optical properties from sun and sky radiance measurements, J. Geophys. Res., 105, 20673–20696, 2000. a
Dubovik, O., Smirnov, A., Holben, B., King, M., Kaufman, Y., Eck, T., and Slutsker, I.: Accuracy assessments of aerosol optical properties retrieved from Aerosol Robotic Network (AERONET) sun and sky radiance measurements, J. Geophys. Res., 105, 9791–9806, 2000. a
Dubovik, O., Holben, B., Eck, T. F., Smirnov, A., Kaufman, Y. J., King, M. D., Tanré, D., and Slutsker, I.: Variability of Absorption and Optical Properties of Key Aerosol Types Observed in Worldwide Locations, J. Atmos. Sci., 59, 590–608, https://doi.org/10.1175/1520-0469(2002)059<0590:VOAAOP>2.0.CO;2, 2002. a
Dubovik, O., Holben, B., Eck, T. F., Smirnov, A., Kaufman, Y. J., King, M. D., Tanré, D., and Slutsker, I.: Variability of absorption and optical properties of key aerosol types observed in worldwide locations, J. Atmos. Sci., 59, 590–608, https://doi.org/10.1175/1520-0469(2002)059<0590:VOAAOP>2.0.CO;2, 2002. a, b, c, d
Dubovik, O., Sinyuk, A., Lapyonok, T., Holben, B. N., Mishchenko, M., Yang, P., Eck, T. F., Volten, H., Muñoz, O., and Veihelmann, B.: Application of spheroid models to account for aerosol particle nonsphericity in remote sensing of desert dust, J. Geophys. Res.-Atmos., 111, D11208, https://doi.org/10.1029/2005JD006619, 2006. a
Eck, T., Holben, B., Reid, J., Dubovik, O., Smirnov, A., O'Neill, N., Slutsker, I., and Kinne, S.: Wavelength dependence of the optical depth of biomass burning, urban, and desert dust aerosols, J. Geophys. Res.-Atmos., 104, 31333–31349, https://doi.org/10.1029/1999JD900923, 1999. a
Eck, T. F., Holben, B. N., Reid, J. S., Sinyuk, A., Hyer, E. J., O'Neill, N. T., Shaw, G. E., Vande Castle, J. R., Chapin, F. S., Dubovik, O., Smirnov, A., Vermote, E., Schafer, J. S., Giles, D., Slutsker, I., Sorokine, M., and Newcomb, W. W.: Optical properties of boreal region biomass burning aerosols in central Alaska and seasonal variation of aerosol optical depth at an Arctic coastal site, J. Geophys. Res., 114, D11201, https://doi.org/10.1029/2008JD010870, 2009. a, b, c
Freudenthaler, V., Esselborn, M., Wiegner, M., Heese, B., Tesche, M., Ansmann, A., Müller, D., Althausen, D., Wirth, M., and Fix, A.: Depolarization ratio profiling at several wavelengths in pure Saharan dust during SAMUM 2006, Tellus B, 61, 165–179, https://doi.org/10.1111/j.1600-0889.2008.00396.x, 2009. a, b
Giles, D. M., Holben, B. N., Eck, T. F., Sinyuk, A., Smirnov, A., Slutsker, I., Dickerson, R., Thompson, A., and Schafer, J.: An analysis of AERONET aerosol absorption properties and classifications representative of aerosol source regions, J. Geophys. Res., 117, D17203, https://doi.org/10.1029/2012JD018127, 2012. a, b, c, d, e, f, g, h
Gobbi, G. P., Kaufman, Y. J., Koren, I., and Eck, T. F.: Classification of aerosol properties derived from AERONET direct sun data, Atmos. Chem. Phys., 7, 453–458, https://doi.org/10.5194/acp-7-453-2007, 2007. a
Groß, S., Tesche, M., Freudenthaler, V., Toledano, C., Wiegner, M., Ansmann, A., Althausen, D., and Seefeldner, M.: Characterization of Saharan dust, marine aerosols and mixtures of biomass-burning aerosols and dust by means of multi-wavelength depolarization and Raman lidar measurements during SAMUM 2, Tellus B, 63, 706–724, https://doi.org/10.1111/j.1600-0889.2011.00556.x, 2011. a
Guo, J.-P., Zhang, X.-Y., Wu, Y.-R., Zhaxi, Y., Che, H.-Z., La, B., Wang, W., and Li, X.-W.: Spatio-temporal variation trends of satellite-based aerosol optical depth in China during 1980–2008, Atmos. Environ., 45, 6802–6811, https://doi.org/10.1016/j.atmosenv.2011.03.068, 2011. a, b
Haywood, J. M. and Ramaswamy, V.: Global sensitivity studies of the direct radiative forcing due to anthropogenic sulfate and black carbon aerosols, J. Geophys. Res.-Atmos., 103, 6043–6058, https://doi.org/10.1029/97JD03426, 1998. a
Hess, M., Koepke, P., and Schult, I.: Optical properties of aerosols and clouds: The software package OPAC, B. Am. Meteorol. Soc., 79, 831–844, https://doi.org/10.1175/1520-0477(1998)079<0831:OPOAAC>2.0.CO;2, 1998. a
Holben, B. N., Eck, T. F., Slutsker, I., Tanré, D., Buis, J., Setzer, A., Vermote, E., Reagan, J., Kaufman, Y. J., and Nakajima, T.: AERONET – A federated instrument network and data archive for aerosol characterization, Rem. Sens. Environ., 66, 1–16, https://doi.org/10.1016/S0034-4257(98)00031-5, 1998. a
Jones, T. A. and Christopher, S. A.: MODIS derived fine mode fraction characteristics of marine, dust, and anthropogenic aerosols over the ocean, constrained by GOCART, MOPITT, and TOMS, J. Geophys. Res., 112, D22204, https://doi.org/10.1029/2007JD008974, 2007. a
Jung, J., Lee, H., Kim, Y. J., Liu, X., Zhang, Y., Hu, M., and Sugimoto, N.: Optical properties of atmospheric aerosols obtained by in situ and remote measurements during 2006 Campaign of Air Quality Research in Beijing (CAREBeijing-2006), J. Geophys. Res., 114, D00G02, https://doi.org/10.1029/2008JD010337, 2009. a, b
Kim, J., Lee, J., Lee, H. C., Higurashi, A., Takemura, T., and Song, C. H.: Consistency of the aerosol type classification from satellite remote sensing during the Atmospheric Brown Cloud–East Asia Regional Experiment campaign, J. Geophys. Res., 112, D22S33, https://doi.org/10.1029/2006JD008201, 2007. a, b, c
Lee, J., Kim, J., Song, C., Kim, S., Chun, Y., Sohn, B., and Holben, B.: Characteristics of aerosol types from AERONET sunphotometer measurements, Atmos. Environ., 44, 3110–3117, https://doi.org/10.1016/j.atmosenv.2010.05.035, 2010. a, b, c, d, e, f, g, h, i, j
Liu, J., Lin, P., Laskin, A., Laskin, J., Kathmann, S. M., Wise, M., Caylor, R., Imholt, F., Selimovic, V., and Shilling, J. E.: Optical properties and aging of light-absorbing secondary organic aerosol, Atmos. Chem. Phys., 16, 12815–12827, https://doi.org/10.5194/acp-16-12815-2016, 2016. a
Mamouri, R. E. and Ansmann, A.: Fine and coarse dust separation with polarization lidar, Atmos. Meas. Tech., 7, 3717–3735, https://doi.org/10.5194/amt-7-3717-2014, 2014. a
Mamouri, R.-E. and Ansmann, A.: Potential of polarization/Raman lidar to separate fine dust, coarse dust, maritime, and anthropogenic aerosol profiles, Atmos. Meas. Tech., 10, 3403–3427, https://doi.org/10.5194/amt-10-3403-2017, 2017. a
Murayama, T., Müller, D., Wada, K., Shimizu, A., Sekiguchi, M., and Tsukamoto, T.: Characterization of Asian dust and Siberian smoke with multi-wavelength Raman lidar over Tokyo, Japan in spring 2003, Geophys. Res. Lett., 31, L23103, https://doi.org/10.1029/2004GL021105, 2004. a
Sano, I., Mukai, S., Nakata, M., and Holben, B. N.: Regional and local variations in atmospheric aerosols using ground-based sun photometry during Distributed Regional Aerosol Gridded Observation Networks (DRAGON) in 2012, Atmos. Chem. Phys., 16, 14795–14803, https://doi.org/10.5194/acp-16-14795-2016, 2016. a
Noh, Y., Müller, D., Lee, K., Kim, K., Lee, K., Shimizu, A., Sano, I., and Park, C. B.: Depolarization ratios retrieved by AERONET sun–sky radiometer data and comparison to depolarization ratios measured with lidar, Atmos. Chem. Phys., 17, 6271–6290, https://doi.org/10.5194/acp-17-6271-2017, 2017. a
Petzold, A., Veira, A., Mund, S., Esselborn, M., Kiemle, C., Weinzierl, B., Hamburger, T., Ehret, G., Lieke, K., and Kandler, K.: Mixing of mineral dust with urban pollution aerosol over Dakar (Senegal): Impact on dust physico-chemical and radiative properties, Tellus B, 63, 619–634, https://doi.org/10.1111/j.1600-0889.2011.00547.x, 2011. a
Reid, J. S., Hobbs, P. V., Ferek, R. J., Blake, D. R., Martins, J. V., Dunlap, M. R., and Liousse, C.: Physical, chemical and optical properties of regional hazes dominated by smoke in Brazil, J. Geophys. Res., 103, 32059–32080, https://doi.org/10.1029/98JD00458, 1998. a
Reid, J. S., Koppmann, R., Eck, T. F., and Eleuterio, D. P.: A review of biomass burning emissions part II: intensive physical properties of biomass burning particles, Atmos. Chem. Phys., 5, 799–825, https://doi.org/10.5194/acp-5-799-2005, 2005. a
Russell, P. B., Bergstrom, R. W., Shinozuka, Y., Clarke, A. D., DeCarlo, P. F., Jimenez, J. L., Livingston, J. M., Redemann, J., Dubovik, O., and Strawa, A.: Absorption Angstrom Exponent in AERONET and related data as an indicator of aerosol composition, Atmos. Chem. Phys., 10, 1155–1169, https://doi.org/10.5194/acp-10-1155-2010, 2010. a, b
Russell, P. B., Kacenelenbogen, M., Livingston, J. M., Hasekamp, O. P., Burton, S. P., Schuster, G. L., Johnson, M. S., Knobelspiesse, K. D., Redemann, J., and Ramachandran, S.: A multiparameter aerosol classification method and its application to retrievals from spaceborne polarimetry, J. Geophys. Res., 119, 9838–9863, https://doi.org/10.1002/2013JD021411, 2014. a
Sano, I., Mukai, S., Nakata, M., and Holben, B. N.: Regional and local variations in atmospheric aerosols using ground-based sun photometry during Distributed Regional Aerosol Gridded Observation Networks (DRAGON) in 2012, Atmos. Chem. Phys., 16, 14795–14803, https://doi.org/10.5194/acp-16-14795-2016, 2016. a
Satheesh, S. and Moorthy, K. K.: Radiative effects of natural aerosols: A review, Atmos. Environ., 39, 2089–2110, https://doi.org/10.1016/j.atmosenv.2004.12.029, 2005. a
Schuster, G. L., Dubovik, O., and Holben, B. N.: Angstrom exponent and bimodal aerosol size distributions, J. Geophys. Res.-Atmos., 111, D07207, https://doi.org/10.1029/2005JD006328, 2006. a, b
Shimizu, A., Sugimoto, N., Matsui, I., Arao, K., Uno, I., Murayama, T., Kagawa, N., Aoki, K., Uchiyama, A., and Yamazaki, A.: Continuous observations of Asian dust and other aerosols by polarization lidars in China and Japan during ACE-Asia, J. Geophys. Res.-Atmos., 109, D19S17, https://doi.org/10.1029/2002JD003253, 2004. a, b, c
Shin, S.-K., Müller, D., Lee, C., Lee, K. H., Shin, D., Kim, Y. J., and Noh, Y. M.: Vertical variation of optical properties of mixed Asian dust/pollution plumes according to pathway of air mass transport over East Asia, Atmos. Chem. Phys., 15, 6707–6720, https://doi.org/10.5194/acp-15-6707-2015, 2015. a, b, c, d
Shin, S.-K., Tesche, M., Kim, K., Kezoudi, M., Tatarov, B., Müller, D., and Noh, Y.: On the spectral depolarisation and lidar ratio of mineral dust provided in the AERONET version 3 inversion product, Atmos. Chem. Phys., 18, 12735–12746, https://doi.org/10.5194/acp-18-12735-2018, 2018. a, b, c, d, e, f
Shin, S.-K., Tesche, M., Müller, D., and Noh, Y.: Technical note: Absorption aerosol optical depth components from AERONET observations of mixed dust plumes, Atmos. Meas. Tech., 12, 607–618, https://doi.org/10.5194/amt-12-607-2019, 2019. a, b, c, d, e
Stocker, T. F., Qin, D., Plattner, G.-K., Tignor, M., Allen, S. K., Boschung, J., Nauels, A., Xia, Y., Bex, V., and Midgley, P. M.: Climate Change 2013: The Physical Science Basis. Contribution of Working Group I to the Fifth Assessment Report of the Intergovernmental Panel on Climate Change, 1535 pp., Cambridge Univ. Press, Cambridge, UK, and New York, 2013. a, b
Sun, Y., Zhuang, G., Wang, Y., Zhao, X., Li, J., Wang, Z., and An, Z.: Chemical composition of dust storms in Beijing and implications for the mixing of mineral aerosol with pollution aerosol on the pathway, J. Geophys. Res., 110, D24209, https://doi.org/10.1029/2005JD006054, 2005. a
Tesche, M., Ansmann, A., Müller, D., Althausen, D., Engelmann, R., Freudenthaler, V., and Groß, S.: Vertically resolved separation of dust and smoke over Cape Verde using multiwavelength Raman and polarization lidars during Saharan Mineral Dust Experiment 2008, J. Geophys. Res.-Atmos., 114, D13202, https://doi.org/10.1029/2009JD011862, 2009. a, b, c
Tesche, M., Groß, S., Ansmann, A., Müller, D., Althausen, D., Freudenthaler, V., and Esselborn, M.: Profiling of Saharan dust and biomass-burning smoke with multiwavelength polarization Raman lidar at Cape Verde, Tellus B, 63, 649–676, 2011. a
Twomey, S.: Pollution and the planetary albedo, Atmos. Environ., 8, 1251–1256, https://doi.org/10.1016/0004-6981(74)90004-3, 1974. a
Wang, J. and Martin, S. T.: Satellite characterization of urban aerosols: Importance of including hygroscopicity and mixing state in the retrieval algorithms, J. Geophys. Res., 112, D17203, https://doi.org/10.1029/2006JD008078, 2007. a
Washenfelder, R. A., Attwood, A. R., Brock, C. A., Guo, H., Xu, L., Weber, R. J., Ng, N. L., Allen, H. M., Ayres, B. R., Baumann, K., Cohen, R. C., Draper, D. C., Duffey, K. C., Edgerton, E., Fry, J. L., Hu, W. W., Jimenez, J. L., Palm, B. B., Romer, P., Stone, E. A., Wooldridge, P. J., and Brown, S. S.: Biomass burning dominates brown carbon absorption in the rural southeastern United States, Geophys. Res. Lett., 42, 653–664, https://doi.org/10.1002/2014GL062444, 2015. a
Xia, X. G., Li, Z. Q., Holben, B., Wang, P. C., Eck, T., Chen, H. B., Cribb, M., and Zhao, Y. X.: Aerosol optical properties and radiative effects in the Yangtze Delta region of China, J. Geophys. Res., 112, D22S12, https://doi.org/10.1029/2007JD008859, 2007. a, b