the Creative Commons Attribution 4.0 License.
the Creative Commons Attribution 4.0 License.
Aerosol backscatter profiles from ceilometers: validation of water vapor correction in the framework of CeiLinEx2015
Matthias Wiegner
Ina Mattis
Margit Pattantyús-Ábrahám
Juan Antonio Bravo-Aranda
Yann Poltera
Alexander Haefele
Maxime Hervo
Ulrich Görsdorf
Ronny Leinweber
Josef Gasteiger
Martial Haeffelin
Frank Wagner
Jan Cermak
Katerina Komínková
Mike Brettle
Christoph Münkel
Kornelia Pönitz
With the rapidly growing number of automated single-wavelength backscatter lidars (ceilometers), their potential benefit for aerosol remote sensing received considerable scientific attention. When studying the accuracy of retrieved particle backscatter coefficients, it must be considered that most of the ceilometers are influenced by water vapor absorption in the spectral range around 910 nm. In the literature methodologies have been proposed to correct for this effect; however, a validation was not yet performed. In the framework of the ceilometer intercomparison campaign CeiLinEx2015 in Lindenberg, Germany, hosted by the German Weather Service, it was possible to tackle this open issue. Ceilometers from Lufft (CHM15k and CHM15kx, operating at 1064 nm), from Vaisala (CL51 and CL31) and from Campbell Scientific (CS135), all operating at a wavelength of approximately 910 nm, were deployed together with a multi-wavelength research lidar (RALPH) that served as a reference. In this paper the validation of the water vapor correction is performed by comparing ceilometer backscatter signals with measurements of the reference system extrapolated to the water vapor regime. One inherent problem of the validation is the spectral extrapolation of particle optical properties. For this purpose AERONET measurements and inversions of RALPH signals were used. Another issue is that the vertical range where validation is possible is limited to the upper part of the mixing layer due to incomplete overlap and the generally low signal-to-noise ratio and signal artifacts above that layer. Our intercomparisons show that the water vapor correction leads to quite a good agreement between the extrapolated reference signal and the measurements in the case of CL51 ceilometers at one or more wavelengths in the specified range of the laser diode's emission. This ambiguity is due to the similar effective water vapor transmission at several wavelengths. In the case of CL31 and CS135 ceilometers the validation was not always successful. That suggests that error sources beyond the water vapor absorption might be dominant. For future applications we recommend monitoring the emitted wavelength and providing “dark” measurements on a regular basis.
- Article
(10184 KB) - Full-text XML
- BibTeX
- EndNote
In the few last years a significant number of eye-safe single-wavelength backscatter lidars (ceilometers) have been installed for unattended operation. The primary reason to install ceilometer networks is the automation of synoptic observations, especially for the accurate determination of the cloud base height, but since approximately 2010 aerosol and ash remote sensing is considered an additional application. Though aerosols are relevant for radiative transfer, cloud physics and air quality, the main driver of this application was the need for surveillance of the airspace in the case of a volcanic eruption. The Eyjafjallajökull event in 2010 and the subsequent restrictions on civil aviation impressively demonstrated the benefit of ceilometers (e.g., Flentje et al., 2010; Wiegner et al., 2012). In parallel, efforts have been strengthened to derive not only mixing layer heights (e.g., Eresmaa et al., 2006; Münkel et al., 2007; Haeffelin et al., 2011; Lotteraner and Piringer, 2016; Kotthaus and Grimmond, 2018a) but also optical properties, primarily profiles of the particle backscatter coefficient βp in a quantitative way. Recently ceilometer data were used for the validation of transport models, e.g., to improve forecasts of the dispersion of aerosol layers (e.g., Emeis et al., 2011; Cazorla et al., 2017; Chan et al., 2018) and to support air quality studies (e.g., Schäfer et al., 2011; Geiß et al., 2017; Kotthaus and Grimmond, 2018b), whereas data assimilation in numerical weather forecast models is still limited to case studies (e.g., Geisinger, 2017; Warren et al., 2018).
Ceilometer networks can be of particular benefit for the abovementioned purposes, when the spatiotemporal distribution of optical properties of particles is assessed in near real time. This requires a fully automated procedure, e.g., of quality control, calibration, overlap correction, cloud clearing and more. Accordingly a huge research and development effort was coordinated in the framework of the COST-Action TOPROF (Towards operational ground-based profiling with ceilometers, Doppler lidars and microwave radiometers for improving weather forecasts, Illingworth et al., 2018) to make ceilometers exploitable for aerosol and ash profiling. E-PROFILE was established as part of the European Meteorological Services Network (EUMETNET) Composite Observing System (EUCOS) to integrate the ceilometers in Europe into an operational network and to provide well-calibrated and quality-controlled data in real time, hand-in-hand with TOPROF. E-PROFILE's key activity is an operational data hub, which collects, processes and redistributes ceilometer data. The scientific code run on the hub has been developed in TOPROF.
The development of such a processing chain is complicated because national operators rely on automated (low power) lidars and ceilometers (often referred to as ALC) from different manufacturers. For example, the German Weather Service has installed CHM15k ceilometers (Lufft), whereas France, Finland and Switzerland rely on CL31 (Vaisala) for cloud detection. Sweden has set up a network of CL31 ceilometers and uses CBME-80 ceilometers (Eliasson) only on airports. In the UK both Lufft and Vaisala ceilometers are in operation. Compact micro-pulse lidars (MiniMPL) are used by Météo-France for volcanic ash detection, but a limited set of advanced lidar systems are also deployed, e.g., PollyXT in Finland and Raymetrics systems in the UK. Recently, measurements of a CYY-2B ceilometer (CAMA) that was deployed in China were reported (Liu et al., 2018).
The primary goal of ceilometer measurements with respect to the quantitative retrieval of the aerosol optical properties is the provision of the particle backscatter coefficient βp(z) (Wiegner and Geiß, 2012). In this context the wavelength of the ceilometer is relevant: the abovementioned instruments operate either at 1064 nm (Lufft) or near 910 nm (Vaisala, Eliasson, Campbell, CAMA). The latter spectral range is influenced by water vapor absorption. As a consequence, it is only possible to determine aerosol optical properties with additional knowledge of the water vapor distribution and properties of the ceilometers' radiation source and with the application of a correction scheme. Only if βp is derived with the best possible accuracy might it be used for estimates of further quantities (extinction coefficient, mass concentration), keeping in mind that the resulting accuracy is (drastically) reduced according to the accuracy of the inherent assumptions.
Even though water vapor absorption in the near infrared is well known, it was often ignored. Sundström et al. (2009) evaluated CL31 measurements from 2005 in Helsinki, when they assumed that absorption of water vapor could be neglected. The same assumption was made by Jin et al. (2015) using CL51 data. Comparisons of CL51 and CYY-2B measurements in Beijing, China, were also conducted without water vapor correction (Liu et al., 2018). Madonna et al. (2015) compared ceilometers by Lufft (CHM15k), Vaisala (CT25k) and Campbell (CS135s) in the framework of INTERACT (Potenza, Italy) but did not consider water vapor absorption quantitatively. To our knowledge, Markowicz et al. (2008) were the first to apply a correction term for water vapor absorption to data from a Vaisala CT25k ceilometer before deriving aerosol optical properties. Wiegner et al. (2014) discussed the problem in a general way on the basis of simulated signals and proposed an improved approach to correct for water vapor absorption. A follow-up paper (Wiegner and Gasteiger, 2015) developed a methodology that can routinely be applied to real measurements; it is used in the following. An alternative model was used by Madonna et al. (2018) and applied to CL51 and CS135 measurements during INTERACT II.
In summer 2015 a dedicated campaign, CeiLinEx2015 (ceilometer intercomparison experiment), was set up to better understand the performance of several commercially available ceilometers. In this paper we use data from this campaign to investigate whether signals can successfully be corrected for water vapor absorption. After a brief introduction to CeiLinEx2015 (next section), we discuss several approaches for the validation of the water vapor correction (Sect. 3). In the key part of our paper we discuss the main features of the validation procedure, especially the selection of the validation range and the spectral extrapolation, and select three representative atmospheric cases to scrutinize the validation. A short summary concludes the paper.
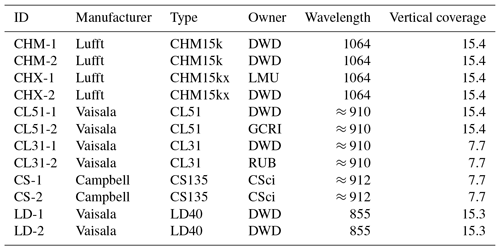
To support E-PROFILE and TOPROF, the Meteorological Observatory Hohenpeißenberg of the German Weather Service (DWD) has initiated an intercomparison campaign (CeiLinEx2015) at the Meteorological Observatory Lindenberg of the DWD in Lindenberg, Germany (52.209∘ N, 14.122∘ E, 120 m a.m.s.l., above mean sea level). It took place from 1 June to 15 September 2015. Twelve ceilometers were deployed for continuous measurements: all instruments are commercially available systems as they are used in observational networks, by service providers, or research institutes. On the one hand, instruments from different manufacturers were set up, and different types from the same manufacturer were considered. On the other hand, two instruments of each type were installed to get a rough impression on the instrument-to-instrument variability. An overview of the deployed instruments is given in Table 1. The first column lists the acronyms of the instruments as they are used in our investigation. Note that the last column gives the vertical coverage of the data sets, which is larger than the range of data exploitable in a meteorological sense. The time resolution of raw data is in the range of 15–30 s and the vertical resolution is 10–15 m.
CeiLinEx2015 was the first campaign since the WMO international ceilometer intercomparison (Jones et al., 1988) in 1986. Six different types of ceilometers from Vaisala, Lufft and Campbell Scientific were compared. According to the manufacturers, the emitted wavelength of the CL31 and CL51 is 910±10 nm. To cope with the wavelength drift (with temperature) within the operating range of −40 to 60 ∘C, the optical filter of the receiving optics have quite a large bandwidth of 36 nm (at 50 % transmissivity). As the Campbell ceilometers are temperature controlled, it is expected that the specified wavelength of 912 nm is quite stable; the spectral width of the laser diode is ±3.5 nm. Lufft's CHM15kx is a special version of the standard CHM15k ceilometer with tilted optical axes and a larger field of view that reduces the range of incomplete overlap. Note that the quite old LD40 ceilometers are not considered in this study.
Table 1List of deployed ceilometers in CeiLinEx2015: providers are DWD (German Weather Service), LMU (Ludwig Maximilian University of Munich), RUB (Ruhr-University Bochum), GCRI (Global Change Research Institute) and CSci (Campbell Scientific, manufacturer of the instruments). The emitted wavelength is given in nanometers, the vertical coverage in kilometers.
The main goals of CeiLinEx2015 were twofold: the characterization of instruments and the retrieval of optical properties of aerosols (βp). The former comprises the investigation of overlap properties, identification of measurement artifacts and studies on the instrument's sensitivity, e.g., to changes in the ambient temperature. The latter includes the calibration of the systems and the correction of the signals for water vapor absorption. Water vapor absorption is relevant for the Vaisala and Campbell ceilometers. Moreover, specific topics were covered, such as the comparison of derived cloud base heights and the derivation of the mixing layer height.
Four radiosondes per day are available in Lindenberg: at 00:00, 06:00, 12:00 and 18:00 UTC. Profiles of the air density, calculated from the measured temperature and pressure profiles, are used for the Rayleigh calibration. Measurements of the relative humidity are required for the water vapor correction. Ancillary data also include measurements from an AERONET (Holben et al., 1998) sun photometer, e.g., providing aerosol optical depths between 340 and 1640 nm. This information can be used to extrapolate optical properties between different wavelengths.
Finally, the PollyXT lidar (Baars et al., 2016; Engelmann et al., 2016) RALPH was used as a reference system; CeiLinEx2015 was the first application of this instrument. It complies with the standard configuration of the EARLINET's research lidars (Pappalardo et al., 2014). Note that depolarization measurements were not relevant in the framework of this investigation. RALPH has been moved to Hohenpeißenberg, Germany, after the campaign to become part of EARLINET.
A strict validation of an aerosol profile derived from ceilometer measurements after applying a water vapor correction is not possible because no independent profile at the same wavelength is available. Thus, it is necessary to transform profiles between a water-vapor-contaminated wavelength and another wavelength for which high-quality data not subject to absorption are available. This extrapolation requires assumptions on the wavelength dependence of the optical properties of particles. Moreover, corrections for incomplete overlap or signal distortions might be required that are different for the ceilometers under review and the reference system. These are reasons for understanding the term “validation” as sort of an intercomparison and consistency check. Having this in mind we feel that it is nevertheless acceptable to henceforward use the term “validation” to make the purpose and motivation of our investigation clearer.
There are several options for the validation of an aerosol profile. The most obvious strategies are either the comparison of signals P(z), of attenuated backscatter β∗(z) or of particle backscatter coefficients βp(z), z being the height (vertically looking systems). These alternatives are discussed in the following.
3.1 Concept based on signals
To consider signals P we determine the ratio of the signal P(λoff,z) at a wavelength that is not affected by water vapor absorption (e.g., λoff=1064 nm) and P(λon,z) that is affected (e.g., λon=910 nm). This results in a height-dependent conversion function η(z) and allows us to extrapolate from one wavelength to the other. The conversion function η(z) is defined as
assuming λon<λoff. The signal at the “water vapor wavelength” λon is
Here, Tw,eff is the effective transmission due to water vapor absorption. As the emitted spectrum of the ceilometers is much broader than the width of individual absorption lines, an effective transmission representative for λon is calculated following Wiegner and Gasteiger (2015). In this context the center wavelength of the emitted spectrum and – to a lesser extent – the full width at half maximum (assuming a Gaussian profile) Δλ of the spectrum are crucial. Tm and Tp are the transmissions due to Rayleigh scattering and particle extinction, respectively, CL is the lidar constant, and β is the backscatter coefficient.
At the offline wavelength, the signal can be described according to
For the transformation of the signal between λon and λoff the lidar constant cancels out because we consider the same instrument. This leads to
The backscatter term B(z) – the first on the right-hand side of Eq. (4) – is
The βp profiles are obtained from a reference lidar operating at the absorption-free wavelength λoff. In Eq. (5) we have introduced the ratio Lp that is based on the Angström approach: we find
with τp as the aerosol optical depth and κ the Angström exponent. Note that here we define κ in terms of the backscatter coefficient derived from lidar measurements (e.g., 532 and 1064 nm). The Angström exponent is mostly defined by means of the aerosol optical depth τp, e.g., retrieved from AERONET data. In the latter case it is implicitly considered constant with height, otherwise κ can be determined as a height-dependent function. Analogously we get from the Rayleigh theory
In case of an aerosol-free atmospheric layer (e.g., the free troposphere) and the abovementioned wavelengths (910 and 1064 nm) B(z) approaches in the case of a layer where βp≫βm is fulfilled , e.g., B(z)=0.855 if κ=1.
The second term on the right-hand side of Eq. (4) is calculated readily by
For the third term on the right-hand side of Eq. (4) we get
which is typically larger than 1. For Eq. (9) profiles of the particle extinction coefficient αp must be available from the reference lidar. Note that here we have used the common assumption that κ based on backscatter coefficients (Eq. 6) or based on extinction coefficients (Eq. 9) is the same. This implies that, due to the fundamental relationship
the lidar ratio Sp is the same at λoff and λon. The validity of this assumption can easily be checked by means of the online tool MOPSMAP (Gasteiger and Wiegner, 2018) if realistic assumptions of the aerosol type or the microphysical properties are available.
In the case of an atmosphere with height-independent Angström exponent κ, or if height independence must be assumed due to the lack of range-resolved data, Eqs. (8) and (9) can be simplified, and Eq. (4) can be written as
with the transmissions Tp and Tm at wavelength λoff. The vertical profile of η is primarily governed by the vertical profile of B(z). With Eq. (4) or Eq. (11) the measured signal at λon can be transferred to λoff by Eq. (1) or vice versa for intercomparison, i.e., calibration of the systems is not required for this type of validation.
3.2 Concept based on attenuated backscatter
From the definition of the attenuated backscatter β∗,
and Eq. (1), it is directly clear that the ratio of the attenuated backscatter at the two wavelengths is
Thus, the validation directly follows the mathematical formalism described in Sect. 3.1 because the underlying physical concept of both approaches is identical.
3.3 Concept based on particle backscatter coefficients
If the particle backscatter coefficient βp is used for validation, the signals must be inverted. As shown by Wiegner and Gasteiger (2015) the measured Vaisala signals are first corrected for water vapor absorption by being multiplied with . Subsequently a standard inversion technique (Klett, 1981; Fernald, 1984) is applied. This leads to βp(λon) and the extrapolation to βp at λoff can be performed by means of the Angström exponent with the same assumptions mentioned above. These profiles can be compared to inversions of measurements of RALPH. In contrast to the previous options, the inversion, however, requires the knowledge of the lidar ratio and calibrated signals. In the case of the ceilometers this might be an issue, as the signal-to-noise ratio in the free troposphere (under aerosol-free conditions) is low, and absolute calibration requires specific atmospheric conditions, i.e., long time series of measurements. As the same lidar ratio is used in both retrievals, a possible error of Sp, however, would not influence the validation.
It is clear that this option is more complicated and includes more error sources. Though βp(z) is a direct property of the particles in height z, whereas P(z) and β∗(z) do not only depend on aerosol properties in height z but also on properties of the atmospheric path below z, we do not select this concept in our investigation.
Based on the previous discussion we focus on the validation of signals. In principle two alternative approaches are possible: either water-vapor-affected ceilometer signals near 910 nm (λon) are extrapolated to 1064 nm (λoff) and compared to reference signals of RALPH, or one can extrapolate RALPH signals to the water vapor domain and compare them with ceilometer measurements (Vaisala, Campbell). In this paper we decided to extrapolate the signal with the higher quality, i.e., we choose the second option.
The input required for the determination of the conversion function η (Eq. 11) is available from CeiLinEx2015: to calculate B(z) we use βm from the Rayleigh theory with the air density derived from radiosondes. The transmission Tw,eff(λon) due to water vapor is calculated according to Wiegner and Gasteiger (2015) with the water vapor number density derived from the radiosondes as well, Lp is estimated using the Angström exponent κ from AERONET or RALPH data, and βp and αp are derived from the inversion of coincident RALPH measurements.
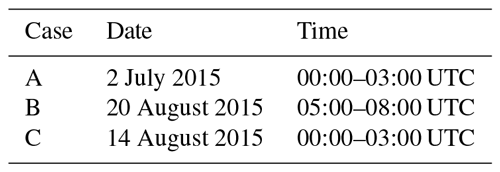
After defining our criteria for a successful validation in the following section we discuss the vertical range that is suitable for validation (Sect. 4.2) in detail, how the spectral extrapolation of aerosol optical properties is provided (Sect. 4.3) and the water vapor correction (Sect. 4.4). Three validation cases (see Table 2) that cover relevant atmospheric conditions are discussed in detail in Sect. 4.5: one case with the average water vapor amount w (Case A), a second case with dry conditions (i.e., Tw,eff is large) and low τp (Case B) and a third case with large water vapor content (i.e., Tw,eff is small) and large τp (Case C). Common to all cases is that the aerosol distribution was quite stable and no low clouds were present.
4.1 Definition of criteria
According to the previous section we use Eq. (1) to calculate a hypothetical RALPH signal at a wavelength in the water vapor regime; only integer numbers are considered.
The term Pextra(λon,z) is introduced to make clear that it is not a measurement but a signal extrapolated to λon. For a quantitative assessment of the agreement between Pextra(λon,z) and the measured ceilometer signal Pceilo(z) at an actually unknown wavelength in the water vapor regime, we define the ratio F as
The normalization factor cnorm is chosen as the average over the validation range, assuming N range bins zi, . We call the range from z1 to zN the “validation range”. The choice of the lower range z1 is influenced by the overlapping characteristics of the involved systems, the upper range by the signal-to-noise ratio and signal artifacts. These issues are discussed in detail in Sect. 4.2.
In the case of a correct treatment of the water vapor absorption, F(λon,z) should not depend on the height (dF∕dz = 0); moreover, due to the normalization, F(λon,z) should be 1. If the decrease in the measured ceilometer signal with height is stronger (stronger attenuation) than that of the lidar extrapolated to the selected wavelength λon, i.e., dF∕dz is negative, then the assumed water vapor absorption at that wavelength is too small in comparison to the actual absorption. Positive dF∕dz corresponds to an overestimation of the absorption.
Consequently, we chose the minimum of the absolute value of the slope dF∕dz as the criterion for a correct treatment of the water vapor absorption. From this criterion theoretically the central wavelength of the emitted spectrum λon can be derived and compared to the ceilometer's specification. In reality this is, however, not the case for several reasons: the exact emission spectrum of the laser is unknown, and absorption can be similar at different wavelengths. Note that λon can be different for different ceilometers and time dependent. Having this in mind, several wavelengths should typically exist where the agreement between a ceilometer and extrapolated RALPH measurements is similar.
Additionally, the mean deviation of F from unity in the validation range, ΔF, given as a percentage and defined as
can be considered as a score. Finally, to strengthen the above-described validation, an additional check has been applied; it is related to F but maybe more descriptive. The decrease in the signal is estimated by fitting a straight line to the measured P z2 (Vaisala or Campbell ceilometers) between z1 and and is described by the ratio s at these two ranges
It can be compared with values expected from the lidar equation (right-hand side of Eq. 17) with TΔ being the transmissions of the layer Δz in the absorption spectral range caused by the different atmospheric constituents (m, p and w for air molecules, particles and water vapor, respectively). Typically, we choose Δz as the validation range as defined below. In this context it is assumed that within that layer the ratio βp(z1)∕βp(z2) is wavelength independent.
4.2 The validation range
To find a suitable validation range the investigation of the range of incomplete overlap of the lidar and the ceilometers is essential. It especially determines the lowest suitable range for the validation. Figure 1 shows the range-corrected reference signal (red solid line) and the corresponding signals (dashed) from the four Lufft ceilometers from Case A: CHX-1 (blue), CHX-2 (green), CHM-1 (red) and CHM-2 (black). All measurements use the same wavelength, λ=1064 nm and are thus directly comparable. They are scaled to match at 0.7 km, and all ceilometer signals have been smoothed over ±3 range bins. In contrast to RALPH, the ceilometer data have undergone an overlap correction, determined by the manufacturer for each individual Lufft ceilometer. The corrections were introduced to make different ceilometers comparable, e.g., those deployed in the network of the German Weather Service. It should be recognized that with this information it is in principle possible to apply overlap correction functions determined from horizontal (e.g., Wiegner et al., 2014) or vertical measurements (e.g., Hervo et al., 2016) under homogeneous aerosol distributions.
It can be seen that the agreement of the signals of the CHM ceilometers (red and black lines) and RALPH is quite good above 0.5 km, even above the mixing layer up to 4 km. However, in the lowermost 500 m large discrepancies occur: the overlap correction for the CHX ceilometers (note that they are not part of the German Weather Service network) only show similar shapes, whereas the absolute values are quite different. Though the two CHM ceilometers agree well except in the lowermost range below 80 m, they do not agree with the CHX-1 and CHX-2. This underlines the difficulty of determining accurate overlap corrections. Above the mixing layer height the CHX signals are quite noisy and especially the CHX-2 (green line) shows unrealistic profiles. Investigation of cases B and C (not shown) in general confirms these conclusions. Again, a surprisingly good agreement between the CHM and RALPH measurements in the lowermost 1–2 km of the free troposphere is found.
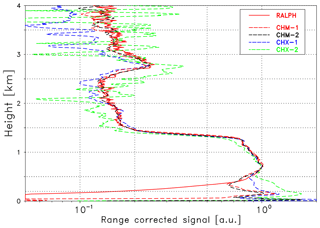
Figure 1Range-corrected reference signal (RALPH) as a red solid line; the dashed lines refer to the Lufft ceilometers as indicated, all at λ=1064 nm and scaled to match at 0.7 km. Measurements concern Case A (see Table 2).
In Fig. 2 the corresponding intercomparison in the spectral regime of the water vapor absorption is shown. Vaisala ceilometers are shown as dashed lines, Campbell ceilometers as dashed-dotted lines. The reference signal of RALPH (red solid line) has been extrapolated to (as an example) 910 nm, i.e., water vapor absorption is considered. All signals are scaled to match in 0.7 km and smoothed as above. It is immediately clear that the validation range is strongly limited. In this case it is certainly neither below 0.5 km nor above 1.3 km. Inside this range it can be seen that the agreement between the CL51 signals (pink and black dashed lines) and the extrapolated reference signal seems to be almost perfect. In the lowermost part, where the signals suffer from incomplete overlap, no agreement is found. One reason for the missing overlap correction for RALPH has already been mentioned. The two CL51 profiles, however, do not match either, especially below 0.3 km. This indicates that the generic overlap correction function provided by the manufacturer may not be applicable to all CL51 with the same accuracy. The agreement between the two CL31 profiles is quite good but does not agree with the CL51. No agreement is found between the two CS135 ceilometers, in particular the profile of the CS-1 (green dashed-dotted line) is totally different from the others. This example is in accordance of Fig. 1 and demonstrates that, due to the very large uncertainty of the overlap correction, a validation of the water vapor correction is impossible in the lowermost atmosphere, where aerosol backscattering is normally the largest.
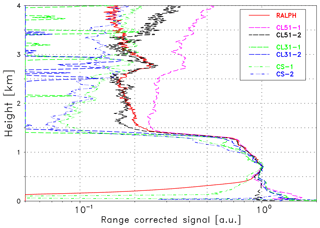
Figure 2Range-corrected signals (Case A) of the reference lidar RALPH extrapolated by means of the conversion function η to 910 nm (red solid line) and measurements of the ceilometers in the water vapor regime as indicated. All curves are in arbitrary units and scaled to match at 0.7 km altitude.
Comparison of the signals above a height of approximately 1.4 km (Fig. 2) helps to assess the upper range of the validation range. The rapid decrease in the particle backscatter at the transition from the mixing layer to the free troposphere seems to raise problems in the data acquisition of all ceilometers and leads to quite a different drop in the signals. Another issue are signal artifacts characteristic for many ceilometers as described by Kotthaus et al. (2016) for the Vaisala CL31 ceilometer. Obviously, the increase in the range-corrected signal with height in the free troposphere is in contradiction to realistic signals from an (almost) aerosol-free atmosphere (Rayleigh atmosphere). A similar increase but smaller signals are found for the CS135 ceilometers, whereas the signals of the CL31 ceilometers (green and blue dashed lines) are totally attenuated.
From measurements with the termination hood – a device that blocks backscattered laser radiation – it is known that the range from 3 to 8 km is especially affected by artifacts. These measurements are often referred to as dark measurements. In principle they can be used to correct ceilometer signals. The example of Case A shown in Fig. 3 should demonstrate its potential. The blue lines illustrate 10 different cases where different dark measurements have been subtracted from the CL51-1 signal. On the one hand, the slope of the signals in the free troposphere is much more realistic than before (pink dashed line in Fig. 2), on the other hand, most of the cases still do not show the slope as expected from Rayleigh scattering (see extrapolated RALPH measurement; red line) and the differences between the 10 profiles are considerable. Indeed dark measurements exhibit a certain temporal variability. Preliminary investigations within CeiLinEx2015 show that there is no significant correlation with temperature, and other reasons have not yet been identified. Accordingly, at the present state, this kind of correction does not provide the accuracy required to extend the validation range to altitudes above the mixing layer. Further investigations, including taking dark measurements on a regular basis, might improve the situation in future.
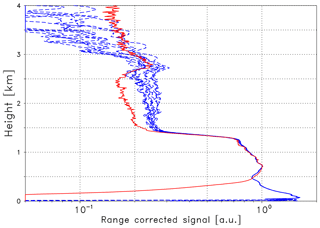
Figure 3Range-corrected signals (Case A) of the reference lidar RALPH extrapolated by means of the conversion function η to 910 nm (red line) and measurements of the CL51-1 ceilometer corrected by different dark measurements (blue lines). All curves are in arbitrary units and scaled to match at 0.7 km altitude.
We conclude that the validation range is limited to the upper part of the mixing layer and has to be individually assessed for each specific measurement period. However, for a given time period, the same validation range is used for all ceilometers if not otherwise stated.
4.3 The spectral extrapolation
For the spectral extrapolation different options based on the Angström exponent are available. The most obvious approach is the use of AERONET data. This data set is well established and it is generally accepted that the accuracy is the best available. Several wavelengths are available so that the range of extrapolation is well covered. The disadvantage of AERONET measurements is the limitation to daytime conditions and the lack of range-resolved information as it relies on the aerosol optical depth. Range-resolved κ(z) can only be derived from a reference lidar system using, however, a smaller set of wavelengths compared to a sun photometer. In case of RALPH either an Angström exponent based on backscatter coefficients βp can be determined using measurements at 532 and 1064 nm, or an Angström exponent based on extinction coefficients αp using the Raman channels at 355 and 532 nm. In the latter case it is, however, questionable whether this spectral range is representative for the wavelength interval from λon to λoff as κ often is wavelength dependent (e.g., Kaskaoutis and Kambezidis, 2006; Schuster et al., 2006).
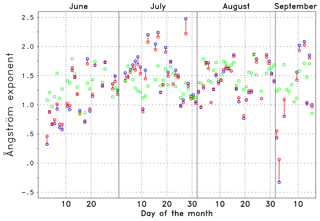
Figure 4Angström exponent (daily averages) for the spectral range 1020–1640 nm (blue, κn) and 870–1640 nm (red, κw), connected by a vertical line. For comparison the standard AERONET output for 440–870 nm (green, κa) is shown.
AERONET data are available from 27 June to 15 September 2015. As cloud-free conditions are required, the temporal sampling is quite inhomogeneous. The measurements at Lindenberg comprises aerosol optical depth (level 2.0 data) at eight wavelengths between 340 and 1640 nm. We calculate Angström exponents for three different spectral intervals: the standard AERONET output for 440–870 nm (κa) and two intervals relevant for the interpolation from λoff to λon: a narrow interval 1020–1640 nm (κn) and wide interval 870–1640 nm (κw). For the validation we may consider 1, 3 and 6 h averages as well as daily averages, depending on their availability. Note that a time lag of several hours between the AERONET data and the ceilometer data may occur if the validation period relies on ceilometer measurements during nighttime. An overview over the three Angström exponents (κa, κn, κw) based on daily averages is shown in Fig. 4. The two Angström exponents including 1640 nm (red and blue circles) are connected by a red vertical line to facilitate the discrimination from the standard Angström exponent.
The medians of daily averages of κ are κa=1.38, κn=1.42 and κw=1.37. For 1, 3 and 6 h averages similar values are found. In total, all values are in the range expected for a continental site as Lindenberg. On the basis of individual observations, κa can be larger or smaller than the near-infrared values (κn, κw), and differences larger than 0.5 can occur. This underlines that κ can be wavelength dependent. Due to the high temporal variability shown in Fig. 4 it is recommended to use the Angström exponent closest to the actual ceilometer observations instead of long-term averages.
For the validation procedure, we choose κw in Eq. (6) as only this value completely covers the extrapolation range. To facilitate the reading we omit subscript w from now on. To estimate the corresponding variability of Lp we again refer to Fig. 4: by applying the median of κ=1.37 we get Lp=1.239, whereas for the 10th percentile of κ(=0.81) we get Lp=1.135 and for the 90th percentile (κ=1.83) we get Lp=1.331. This uncertainty, together with the relative contribution of particles to the backscatter coefficient at a specific height, determines the uncertainty of B(z).
The influence of κ on the conversion function η is illustrated in Fig. 5, Case A is selected as an example. Three representative wavelengths are displayed with the colors indicating λon=905 nm (red), 910 nm (green) and 915 nm (blue). The full lines correspond to κ=1.18, the dashed to κ=1.42 – these values cover the expected range of Angström exponents for Case A (discussed in Sect. 4.5.1). The three lines being quite close to each other correspond to three different lidar ratios (45, 55, 65 sr) with Sp=45 sr marked by a circle. In general the profiles of η are governed by the height dependence of B(z): below 0.5 km it is assumed that βp(z) takes the value of βp at 0.5 km. This is a common procedure if an inversion of the lidar data is not possible due to the incomplete overlap. Until the upper part of the mixing layer η is dominated by the increasing contribution of particles, whereas above the mixing layer η(z) shows a pronounced decrease because B(z) approaches its minimum value in the virtually aerosol-free layers as discussed previously in the context of Eq. (5). It can be seen that η strongly depends on λ and to a similar or smaller extent on κ, whereas the dependence on Sp is virtually negligible. As a consequence we use Sp=55 sr for all validation of the ceilometer signals discussed below.
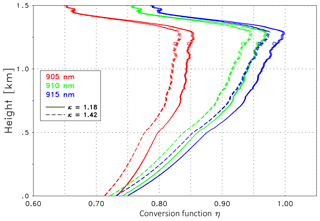
Figure 5Conversion function η at 905 nm (red), 910 nm (green) and 915 nm (blue) for Case A; κ is assumed to be constant with height. The solid lines are for κ=1.18; the dashed lines are for κ=1.42. The three lines grouping together refer to different lidar ratios, with the smallest (Sp=45 sr) marked with a circle.
If the microphysical properties of particles significantly change with height, e.g., due to different aerosol types or due to strong hygroscopic growth, κ will become height dependent, henceforward referred to as κ(z)). Then, for the assessment of κ(z), the availability of βp profiles (see Eq. 6) derived from measurements of a (at least) dual-wavelength reference lidar is mandatory. In the case of most aerosol lidars, the suitable wavelengths are 532 and 1064 nm, an interval that unfortunately is quite wide compared to the difference between λon and λoff. To estimate the relevance of the height dependence we again consider Case A and assume two cases of an idealized height dependence: an increase from 90 % to 110 % of a given Angström exponent between the surface and the upper boundary of the mixing layer (here 1.3 km) and the corresponding decrease. In Fig. 6 the conversion function η for the same wavelengths as before are shown (indicated by the colors) and two mean Angström exponents with κ=1.18 and κ=1.42 as solid and dashed lines, respectively. The cases with an increasing or decreasing κ are marked with crosses and circles, respectively. The remaining profile is based on the constant κ, already shown in Fig. 5. As mentioned above, Sp=55 sr is assumed. Figure 6 reveals that a height dependence of κ can have an influence on η larger than the influence of Sp. Though a generally valid magnitude cannot be assessed because of the variability on the atmospheric conditions (e.g., water vapor and aerosol distribution) and the spectrum of the laser source, this example demonstrates that the height dependence of κ should be considered whenever reliable data are available. The difference of η between height-dependent and height-independent Angström exponents itself is height dependent. A detailed discussion of different treatments of the spectral dependence is provided for each case in Sect. 4.5.
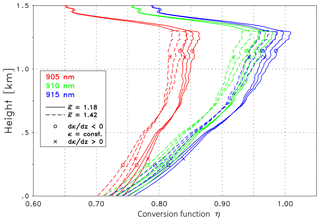
Figure 6Conversion function η at 905 nm (red), 910 nm (green) and 915 nm (blue) for Case A. Same as Fig. 5 but with idealized height-dependent κ(z). The solid lines are for a mean Angström exponent of as indicated. The three lines grouping together refer to different κ(z) profiles: κ(z) decreasing and increasing with height is marked with a circle and cross, respectively, with the remaining curve showing the constant κ (height independent); see text for details.
4.4 The water vapor profiles
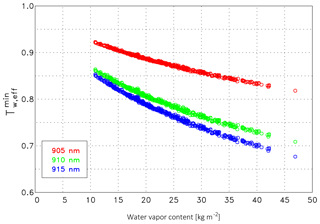
Figure 7Relation between the total water vapor content w and the water vapor transmission at 10 km, , determined from all radiosonde ascents between 27 June and 15 September 2015. The central wavelength of the laser spectrum is indicated in the legend.
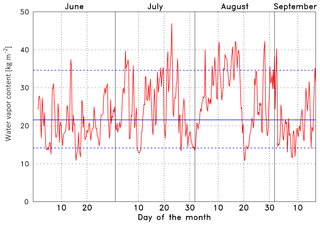
Figure 8Total water vapor content (precipitable water) w in kg m−2 for each radiosonde ascent during the CeiLinEx2015 campaign. The horizontal lines indicate the median (21.6 kg m−2, solid) and the 10th percentile (14.1 kg m−2) and 90th percentile (34.7 kg m−2, dashed).
The profile of the water vapor concentration is required to determine Tw,eff. It can be readily calculated as described in Wiegner and Gasteiger (2015). A good indication of the overall influence of the water vapor correction on the validation is the total water content per unit area w (in kg m−2, precipitable water), as it determines the minimum transmission. Typically Tw,eff is virtually constant above 5 or 6 km due to the very low water vapor content above these heights. The relation between w and Tw,eff for z=10 km, henceforward referred to as , for three wavelength λon (905, 910, 915 nm) is shown in Fig. 7. For example, at 910 nm (green dots) is approximately 0.856 and 0.730 for vapor contents of w=12 kg m−2 and w=40 kg m−2, respectively. Between w=20 kg m−2 and w=30 kg m−2, the transmission changes by m2 kg−1. At λon=905 nm (red dots), the water vapor absorption is weaker and the sensitivity is smaller (0.0029 m2 kg−1); at 915 nm (blue dots) the opposite is true (0.0049 m2 kg−1). The small scattering of the dots around a perfect line is caused by the fact that different water vapor profiles can result in the same w. The range of the actual total water vapor content between 27 June and 15 September, w, is shown in Fig. 8. This overview helps to select interesting conditions for the case studies discussed in Sect. 4.5. The median of the water vapor content is w=21.6 kg m−2 (average w=23.2 kg m−2), with the 10th percentile and the 90th percentile being w=14.1 kg m−2 and w=34.7 kg m−2, respectively (blue lines). Together with Fig. 7 we can directly estimate the magnitude of the water vapor correction. If it is compared to the transmission of the air molecules Tm at 1064 nm (not shown) it is obvious that the water vapor effect is much more relevant. If we consider the profile of the median and the percentiles (10th, 90th) of Tm of all radiosonde ascents during CeiLinEx2015, we find that Tm>0.995 throughout the troposphere and that the variability – expressed as the difference between the two percentiles – is smaller than , i.e., virtually negligible.
We conclude that in the framework of the validation we may use the same profile of the Rayleigh transmission, whereas individual measurements shall be used for the water vapor profile and the spectral dependence of the aerosol extinction.
4.5 Results: The water vapor correction
4.5.1 Case A: 2 July 2015
The first case study concerns a typical case with respect to the water vapor abundance. Measurements are taken from 2 July 2015. An overview of the aerosol distribution is shown in Fig. 9 as a time–height cross section of the range-corrected signal of the CHX-1 ceilometer (in arbitrary units, logarithmic scale). For the sake of clarity, only 12 h are shown and the maximum height is limited to 5.1 km, though the maximum range of the ceilometer is 15.4 km. It can be seen that until noon aerosol particles were mainly confined to the lowermost 1.5 km. In the free troposphere aerosol-free conditions seem to occur. Until 07:00 UTC an elevated residual layer is visible, then convection drives the build-up of the mixing layer with a maximum depth of 1.7 km. From a lidar perspective such a fair weather situation is considered to be quite stable. For the validation we select RALPH and ceilometer measurements averaged from 00:00 to 03:00 UTC to avoid daylight. Based on the criteria described in Sect. 4.2, the validation range is set to km.
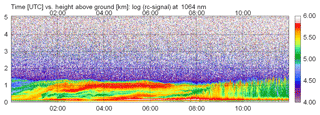
Figure 9Time–height cross section of the range-corrected signal (in arbitrary units, logarithmic scale) of CHX-1 from 2 July 2015 (including Case A) to noon. Time is given in UTC, and the height above ground in kilometers; note that the vertical range shown here is not the full measurement range of the ceilometer.
The determination of the Angström exponent κ was complicated as no level 2.0 data were available for 2 July; gaps of a few days in the AERONET record occur occasionally. If the closest daily average before (30 June, κ=1.18) and after the measurements (3 July, κ=1.42) are considered quite large, temporal differences have to be accepted, reducing the credibility of the values. For this reason we prefer to rely on level 1.0 data; here AERONET measurements from the morning of 2 July were available and a mean of 21 measurements was found with .
The scheduled 00:00 UTC radiosonde was launched at 22:50 UTC of the day before and provided the profiles required for the water vapor correction. Figure 10a shows the water vapor profile in terms of the relative humidity (black line, upper scale in percent) and the water vapor number density nw (red lines, lower scale in 1024 molecules m−3). For comparison and as an indication of the temporal variability the number density from the subsequent radiosonde ascent (6 h later) is shown as dashed line. The water content was 18.3 kg m−2; thus it was slightly lower than the median. In the validation range (yellow area) the relative humidity increases with height from 35 % to 65 %; i.e., it stays in a range where hygroscopic growth of hydrophilic aerosols (if present) is typically moderate.
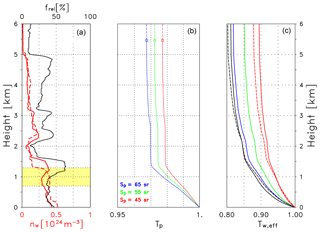
Figure 10(a) Profile of the relative humidity (black line) in percent (see labels at the top) and profiles of the water vapor number density (in 1024 molecules m−3, labels at the bottom) for the 00:00 UTC ascent (solid red line) and the 06:00 UTC ascent (dashed red line). The validation range is indicated by the yellow area. (b) Particle transmission Tp at 1064 nm derived the from Klett inversion of RALPH signals (2 July 2015, 00:00–03:00 UTC, Case A) assuming a lidar ratio as indicated. The circles indicate the reference height. (c) Effective water vapor transmission Tw,eff for different laser wavelengths λon. Solid lines: 900 nm (black), 905 nm (red), 907 nm (green), 910 nm (blue). Dashed lines: 915 nm (black), 925 nm (red).
The particle transmission Tp at 1064 nm is calculated from the RALPH measurements applying the backward Klett algorithm. We use a lidar ratio of Sp=55 sr at 1064 nm and assume an uncertainty of ±10 sr for the αp retrieval. The reference height for the Rayleigh calibration is set to 5.47 km. Because of the incomplete overlap of the lidar we assume that the particle extinction coefficient at 0.5 km does not change below. Above the reference height a constant Tp is assumed. The resulting profiles of Tp for three lidar ratios are shown in Fig. 10b: it can be seen that for Sp=55 sr (green line) the transmission is Tp>0.97 for all heights. A lidar ratio of Sp=45 sr (red) and Sp=65 sr (blue) led to quite a small change in Tp, increasing with height but never exceeding 0.5 %. The same is true for which appears in Eq. (11). The βp(z) profile from the same Klett inversion is used to calculate B(z). For reasons of consistency this implies that the backscatter coefficient βp is assumed to be constant in the lowermost 0.5 km.
Table 3Effective water vapor transmission at 10 km height, , for different central wavelengths λon (in nm) of the laser emission spectrum (water vapor profile of 2 July 2015).

The effective water vapor transmission Tw,eff is shown in Fig. 10c: the different lines refer to different wavelengths λon between 900 and 925 nm; the width of all spectra is set to 3.5 nm. For example the transmission at 5 km decreases from 905 to 925, 907, 910, 900 and 915 nm. The minimum transmission for a broader range of wavelengths is summarized in Table 3. It can be seen that the minimum transmission varies between depending on the wavelength: minimum absorption occurs between nm and nm, whereas absorption is strongest between 913 nm. As a consequence different wavelengths may result in virtually the same transmission. When compared to Fig. 7 it is obvious that – especially in the range around 907 and 918 nm – the transmission is much more sensitive to errors of the assumed wavelength λon than to errors of the water vapor content. It can reach values of about nm−1. In this context it is relevant that in the case of Vaisala ceilometers, the emitted spectrum is temperature dependent. A quantitative assessment of this dependence is, however, not yet available.
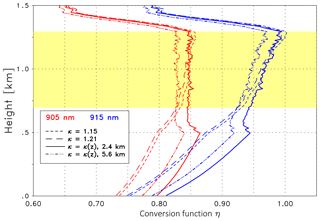
Figure 11Conversion function η at 905 nm (red) and 915 nm (blue) for Case A: the short- and long-dashed lines are for constant κ with 1.15 and 1.21, respectively. The solid and dashed-dotted lines are calculated with a height-dependent κ(z) when applying βp profiles inverted from RALPH measurements with different reference values. Sp=55 sr is assumed in all cases. The validation range between 0.7 and 1.3 km is highlighted in yellow (see text for details).
With this input the conversion function η is determined. Examples of two representative wavelengths are displayed in Fig. 11, with the colors indicating λon=905 nm (red) and 915 nm (blue). According to Fig. 10c the effective water vapor transmission is largest at 905 nm, and thus η takes the smallest values (Eq. 11). The dashed lines show the conversion function if a constant κ is assumed: the short-dashed line corresponds to the smallest value of the assumed κ range, the long-dashed to the largest value. The lidar ratio is set to Sp=55 sr. Note that only the values within the validation range are relevant (yellow background); below that range, the incomplete overlap alters the values. The full lines are derived if a height-dependent Angström exponent derived from the particle backscatter coefficients at 532 and 1064 nm is used. The Angström exponent shows an almost linear increase from κ (z=0.7 km) = 1.04 to κ (z=1.3 km) = 1.21 within the validation range (not shown). This suggests decreasing particle size; thus hygroscopic growth seems to not be dominant here. Note that the retrieved κ(z) values match very well with the mean Angström exponent from the AERONET data (κ=1.18 ; see above). Consequently the solid (red or blue) line lies between the corresponding dashed lines in Fig. 11 in the upper part of the validation range. The uncertainty of κ(z) is slightly influenced by the sensitivity of βp at 532 nm on the lidar ratio, i.e., ±0.5 % and ±3 % for the lower and upper boundaries of the validation range.
To extend the discussion we briefly consider the uncertainty that may be caused by the uncertainty of the Rayleigh reference height. The 1064 nm signal of RALPH suggests that heights around 2.4 and 5.6 km are suitable for the reference height; however, the signal at 532 nm has a small offset above 4 km. Consequently, κ(z) determined from βp retrievals calibrated at the upper reference height can be used to investigate a worst case scenario; note that in most cases retrievals based on an incorrect Rayleigh calibration are, however, recognized and thus can be avoided. The resulting Angström exponent is considerably larger (), but again a linear increase with height is found. The corresponding conversion functions η are therefore shifted to smaller values but the vertical dependence is virtually unchanged, as shown from the dashed-dotted lines in Fig. 11.
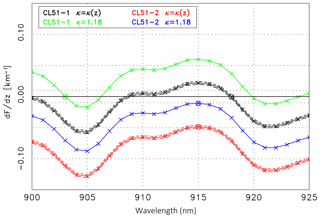
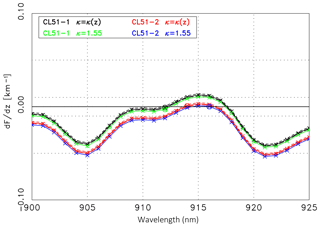
Figure 12First derivative, (see Eq. 15), of the ratio of the CL51 ceilometer signal and the extrapolated reference lidar signal as a function of λon: CL51-1 (solid black line) and CL51-2 (solid red line) assuming a height-dependent κ(z). The short-dashed and long-dashed lines are for the minimum and maximum Sp values, respectively. The integer wavelength corresponding to the minimum of the absolute values of dF∕dz is indicated by a circle. The green (CL51-1) and blue (CL51-2) lines correspond to dF∕dz assuming a constant κ derived from AERONET. All curves concern Case A.
The validation in terms of dF∕dz as a function of the wavelength is shown in Fig. 12. For an extensive discussion the two options introduced above are considered again: the assumption of a constant κ from AERONET and a height-dependent κ(z) from the RALPH–data inversion. The solid black line corresponds to the CL51-1, the red line to the CL51-2 measurements assuming a height-dependent κ(z) and the default lidar ratio of 55 sr. The short-dashed and long-dashed lines correspond to Sp=45 sr and Sp=65 sr, respectively, to demonstrate the quite small uncertainty associated with the uncertainty of the lidar ratio. For comparison, dF∕dz assuming a constant κ=1.18, is shown as green (CL51-1) and blue (CL51-2) lines.
When considering κ(z) we find the best agreement in the case of the CL51-1 measurements at λon=918 nm with a slope km−1 (marked by a circle in Fig. 12). The mean deviation ΔF=0.9 % is quite small. At the wavelength λon = 918 nm water vapor absorption is comparably weak (cf. Table 3). Accordingly, and obvious from Fig. 12, similar absolute values of the slope (and ΔF) are found when the reference signal is extrapolated to the wavelength of 900 nm or to a wavelength between nm – the quality of the agreement is virtually indistinguishable. The very small values of dF∕dz suggest a perfect water vapor correction, especially when noninteger values are considered as well. In the case of CL51-2 the best agreement is found for λon=915 nm, with km−1 (red circle in Fig. 12). Similar values are found in the range of 914–917 nm, i.e., the strong part of the water vapor absorption band. The slope of the ratio is, however, almost 2 orders of magnitude larger than in the case of CL51-1 but still suggests a reasonable water vapor correction. The mean deviation ΔF=1.2 % is somewhat larger compared to the CL51-1 evaluation.
In the case that the constant κ from AERONET is used in the water vapor correction, the conclusions are similar for the CL51-1. Inspection of the green curve (Fig. 12) shows that again wavelengths can be found where the water vapor correction is perfect, e.g., 903, 906, 920 or 924 nm. The best agreement is found for 903 nm. The fact that this is a different wavelength than in the case of κ(z) is irrelevant as long as the spectral emission of the laser is unknown. The minimum values of dF∕dz in the case of CL51-2 (blue curve) are also very small, underlining a very good water vapor correction. Somewhat surprising is that for Case A the constant κ leads to better results than the height-dependent κ. This might be an effect of the long averaging time and the actual meteorological conditions.
We want to emphasize that this procedure does not allow us to retrieve the central wavelength of the laser spectrum. The reasons for this are not only the spectral ambiguity of the effective absorption, shown in Fig. 12, but also a certain degree of freedom in the choice of the validation range and how to weight the agreement at different altitudes. Nevertheless, the intercomparison demonstrates that a wavelength in the likely range of the laser emission can be found that leads to a very good agreement of the signals, in particular in the case of CL51-1. To emphasize this statement the ratio of the measured ceilometer signal (CL51-1 or CL51-2) and the original lidar signal at 1064 nm has been calculated: they show significantly larger slopes with km−1 and −0.13 km−1, respectively. Such negative values are consistent with the fact that water vapor does not absorb at 1064 nm. This example confirms that the water vapor correction indeed improves the aerosol retrieval.
To underline the correctness of signal slopes discussed above we have calculated the decrease in the signals s (see Eq. 17), in the validation range with z1=0.7 km to z2=1.3 km. The ratio of the backscatter coefficients is 1.27±0.01. The contribution of the particles is calculated according to the Klett inversion of the RALPH signals. We assume the same aerosol type within the layer; thus the ratio βp(z1)∕βp(z2) is wavelength independent and can be used for λon≈910 nm as well. The Rayleigh contribution to β is calculated as usual from the air density derived from the radiosonde data. The transmission of the layer due to Rayleigh scattering TΔ,m is virtually 1, and due to particle extinction depending on the lidar ratio as discussed above (Fig. 10b). This is equivalent to , used in Eq. (17). The effective water vapor transmission of the layer defined by the validation range is between at λon=905 nm as the lowest effective absorption, and at λon=915 nm (strongest absorption; see Fig. 10c). So the last term on the right-hand side of Eq. (17) should be between 1.047 and 1.096. From these estimates s should be in the range . Actually, we find s=1.44 and s=1.50 for CL51-1 and CL51-2, respectively, which is reasonably close to this range and confirms the better water vapor correction for the CL51-1.
The same kind of validation is attempted for the other ceilometers. A brief overview with the values given above is summarized in Table 4.
Table 4Relevant criteria of the validation for Case A. The minimum slope dF∕dz for an integer wavelength is given, or if the corresponding curve shown in Fig. 12 crosses the zero line (for an noninteger wavelength). According to Eq. (17) the decrease in the range-corrected signal s should be . A height-dependent κ(z) is assumed.
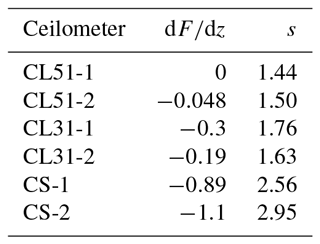
For both CL31 ceilometers the decrease in the signals in the validation range was calculated according to Eq. (17), an illustration is already available in Fig. 2. For the CL31-1 (green dashed line) and CL31-2 (blue dashed), we find s=1.76 and s=1.63, respectively, and absolute values of the slope dF∕dz that are much larger than in the case of the CL51. Such a strong decrease cannot be explained by water vapor absorption at wavelengths around 910 nm. As a consequence, we assume that the reason for the decrease in the signals is the low pulse energy of the CL31 compared to the CL51 ceilometers (1.2 µJ vs. 3 µJ). This hypothesis is supported by the fact that, immediately above the top of the mixing layer (approximately at 1.35 km), the signals of both CL31 are totally attenuated. The profiles of both CS135 ceilometers are also shown in Fig. 2 (dashed-dotted lines). It is obvious that the slope of the range-corrected signal in the upper part of the mixing layer is much larger than in the case of all Vaisala ceilometers and the reference signal: in the validation range a decrease by a factor s=2.56 (CS-1, blue line) and s=2.95 (CS-2, green line) and very large negative slopes (see Table 4) are observed that are far beyond what can be caused by water vapor absorption according to Eq. (17). So again we conclude that the shape of the signals is dominated by currently unknown issues. The wavelength of the CS135 is, however, relatively stable due to the temperature control of the laser, so a wavelength drift is unlikely to be an issue. It might be possible that a further reduction of the validation range would help; however, a vertical extent of 0.6 km is already small.
4.5.2 Case B: 20 August 2015
As a second case study we selected the period from 05:00 to 08:00 UTC of 20 August 2015, referred to as Case B, with quite low total water vapor content (Fig. 8) of w=11.0 kg m−2 according to the 06:00 UTC radiosonde. The range-corrected signals of the CHX-1 ceilometer from midnight to noon are shown in Fig. 13 to illustrate the aerosol stratification of that day. The top of the aerosol layer was slowly decreasing from 2.3 km at midnight to 1.75 km at 09:00 UTC. Then convection led to a rapid increase in the mixing layer again. Compared to Case A its vertical extent of the aerosol layer was larger. The validation range was set to km.
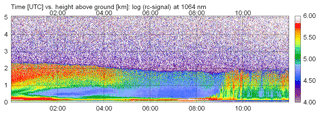
Figure 13Time–height cross section of the range-corrected signal (in arbitrary units, logarithmic scale) of the CHX-1 from 20 August 2015 from midnight to noon (including Case B). Time is given in UTC and the height above ground in kilometers; note that the maximum height shown is not the full measurement range of the ceilometer.
The water vapor number density is shown in Fig. 14a: the black line indicates the profile of the relative humidity of the 06:00 UTC radiosonde (launched at 04:47 UTC), whereas the red lines show the number density nw (06:00 and 12:00 UTC as solid and dashed lines, respectively). A very sharp decrease of nw at 2.0 km can be found, which is in perfect agreement with the top of the aerosol layer (Fig. 13 at 05:00 UTC). The transmission of the particles Tp at 1064 nm (see Fig. 14b) is derived from RALPH measurements and similar to Case A (see Fig. 10b). This is plausible from AERONET measurements of the aerosol optical depth τp: at 500 nm τp=0.11 compared to τp=0.10 for Case A. The water vapor transmission Tw,eff for different wavelengths is larger than in Case A, as the water vapor concentration was lower (see Fig. 14c).
The Angström exponent was derived from AERONET level 2.0 data between 04:56 and 11:38 UTC. From averaging 25 retrievals we found , almost identical to κn but smaller than κa=1.30. Thus, we assume a range of . The κ(z) profile determined from the RALPH signals at 532 and 1064 nm shows an increase with height within the validation range from κ=0.92 to κ=1.15, which is in good agreement with the mean AERONET value.
With this input the conversion function η is calculated according to Eq. (11). The results are shown in Fig. 15 – similar to Fig. 11 – for 905 nm (red) and 915 nm (blue). The dashed lines concern the constant κ assumption with κ=0.96 (short dashed) and κ=1.24 (long dashed) as the range of uncertainty of κ. The solid lines shows the conversion factor η in the case of the height-dependent Angström exponent. The absolute values of the conversion functions η are similar to Case A but the height dependence is quite different as expected from the radiosonde profiles (Figs. 10a and 14a). Again, the Sp dependence is negligible.
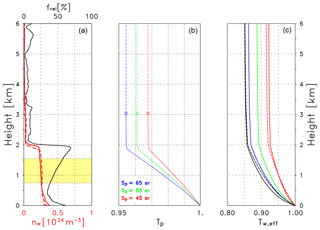
Figure 14(a) Profile of the relative humidity (black line) in percent (see labels at the top) and profiles of the water vapor number density (in 1024 molecules m−3, labels at the bottom) for the 06:00 UTC radiosonde ascent (solid red line) and the 12:00 UTC ascent (dashed red line) of 20 August 2015. The validation range is highlighted in yellow. (b) Particle transmission Tp at 1064 nm derived from the Klett inversion of averaged RALPH signals (20 August 2015, 05:00–08:00 UTC, Case B) assuming a lidar ratio as indicated. The circles indicate the reference height. (c) Effective water vapor transmission Tw,eff for different laser wavelengths λon. Solid lines: 900 nm (black), 905 nm (red), 907 nm (green), 910 nm (blue); dashed lines: 915 nm (black), 925 nm (red)), analogously to Fig. 10.
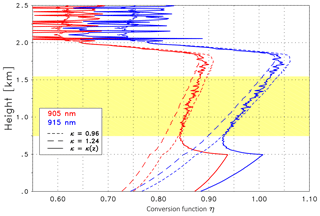
Figure 15Analogously to Fig. 11, the conversion function η is at 905 nm (red) and 915 nm (blue) for Case B. The dashed lines are for constant Angström exponents κ as indicated, whereas the solid line is for the height-dependent κ(z). The validation range (in yellow) was set to 0.75 and 1.55 km.
Having determined η, the validation is done analogously to Case A with the results summarized in Table 5. Figure 16 shows the wavelength dependence of dF∕dz for the CL51-1 (black solid line) and CL51-2 (red solid line), assuming a height-dependent κ(z) and with the range due to the uncertainty of the lidar ratio indicated by the dashed lines of the same color. The best agreement is found for λon = 915 nm ( km−1, ΔF=0.7 %) in the case of CL51-1 and for λon=915 nm ( km−1, ΔF=0.8 %) in the case of CL51-2. The dependence on Sp is negligible as was the case in Case A. The absolute values of dF∕dz are again much smaller than the corresponding values for 1064 nm ( and −0.13 km−1). The wavelength of the best agreement for CL51-2 is the same for Case A and Case B; however, this is solely a consequence of the criterion (). According to Fig. 16 any wavelength in the range of strong absorption leads to a good agreement. For the CL51-1 we find a wavelength in the same range, whereas a wavelength in the moderate part of the absorption band (918 nm) was found in Case A. One can suspect that it is an effect of the different temperature of the CL51-1: it was between 31 and 28 ∘C for Case A, whereas it was between 25 and 30 ∘C for Case B. In contrast the temperature of the CL51-2 has changed less. However, the temperature dependence of the central wavelength of 0.27 nm K−1 (as specified by the manufacturer (see Wiegner and Gasteiger, 2015) is too small to explain this difference. A deeper discussion would be speculative as, due to the ambiguity of the effective absorption, a retrieval of λon is not possible.
Table 5Relevant criteria of the validation for Case B. The minimum slope dF∕dz for an integer wavelength is given, or if the corresponding curve shown in Fig. 16 crosses the zero line (for an noninteger wavelength). According to Eq. (17) the decrease in the range-corrected signal s should be . A height-dependent κ(z) is assumed.
If a constant κ is used for the calculation of η, the slopes dF∕dz are even smaller as obvious from the green (CL51-1) and blue (CL51-2) curves. In both cases we can find wavelengths yielding a perfect agreement with .
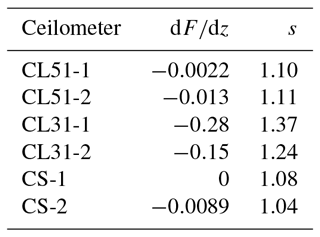
The good agreement of the range-corrected signals – ceilometer measurements vs. extrapolated reference measurements – is confirmed by their slope s: from Eq. (17) we can expect that considering the uncertainties of the different contributions, whereas from the measurements of the CL51 ceilometers we get s=1.10 and s=1.11, respectively, i.e., an even better agreement than in Case A. For the CL31 ceilometers we again find larger s values (1.37 and 1.24); they correspond to too strong a decrease in the signals to be explained by water absorption only. For Case B the slope of the range-corrected signals of both CS135 ceilometers is slightly smaller (s=1.08 and s=1.04, respectively) but quite close to the expected range, and very small slopes dF∕dz are calculated. For the CS-1 even a perfect agrement can be found at 908 and 918 nm. For the specified emission wavelength of 912 nm we find . If, however, the validation range is extended to 1.75 km, the validation is not successful, suggesting deteriorated CS135 signals in the uppermost part of the mixing layer. This is not the case for the CL51 ceilometers.
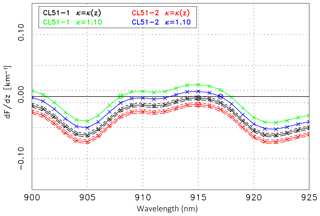
Figure 16First derivative (see Eq. 15), of the ratio of the CL51 ceilometer signal and the extrapolated reference lidar signal as a function of λon: analogously to Fig. 12, but for 20 August 2015, 05:00–08:00 UTC (Case B). The corresponding CL51 ceilometers and Angström exponent settings are indicated in the legend.
4.5.3 Case C: 14 August 2015
The third case concerns 14 August 2015 with the time period from 00:00 to 03:00 UTC (see Table 2). The total water vapor content with w=33.0 kg m−2 according to the 00:00 UTC radiosonde was quite large (see Fig. 8). The overview of the aerosol distribution from midnight to noon based on the range-corrected signal of the CHX-1 ceilometer is shown in Fig. 17. Elevated aerosol layers between approximately 0.8 and 3.0 km, persisting for several hours after midnight, are the dominant feature. The optical depth at 500 nm – averaged over 6 h in the morning – was τp=0.36, which is well above the average. The validation range (yellow area in Fig. 18) was selected as km.
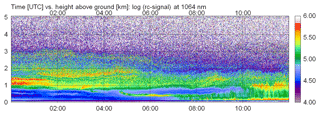
Figure 17Time–height cross section of the range-corrected signal (in arbitrary units, logarithmic scale) of the CHX-1, similar to Fig. 9 but for 14 August 2015 (Case C).
The Angström exponent was found to be when averaging 18 AERONET retrievals between 04:47 and 07:11 UTC. Compared to the previous cases κ was quite large and the variability was very small. It perfectly agrees with the Angström exponent derived from βp at 532 and 1064 nm: RALPH retrievals assuming Sp=55 sr show an almost constant κ(z) with κ=1.57 in an altitude of 1.1 km and κ=1.62 in 2.7 km. Note that the uncertainty of κ(z) due to the uncertainty of Sp is, however, comparably large in this case. With the typical assumption of ±10 sr for the uncertainty of Sp we get an uncertainty of κ(z) of ±0.1 and ±0.05 at the lower and upper boundaries of the validation range.
The conversion function η is calculated as before. The resulting profiles are shown in Fig. 18. Again, the red lines correspond to 905 nm, whereas the blue lines are for 915 nm. The solid lines are for the height-dependent κ(z); the dashed lines for the constant κ are derived from AERONET. According to the quite similar κ value, differences of η are almost negligible. Note that the η values are significantly larger than in the previous cases with less atmospheric water vapor.
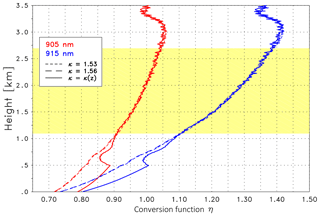
Figure 18Analogously to Fig. 11, the conversion function η is at 905 nm (red) and 915 nm (blue). The solid lines are for κ(z) derived from the RALPH measurements; the dashed lines are for a constant κ as indicated. The validation range is between 1.1 and 2.7 km (yellow area). Measurements are from 14 August 2015, 00:00–03:00 UTC (Case C).
Table 6Relevant criteria of the validation for Case C. The minimum slope dF∕dz for an integer wavelength is given, or if the corresponding curve shown in Fig. 12 crosses the zero line (for an noninteger wavelength). According to Eq. (17) the decrease in the range-corrected signal s should be .
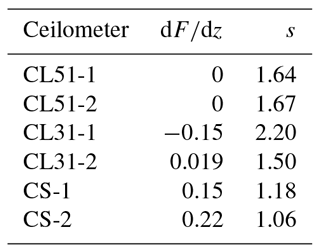
Results of the validation using extrapolated RALPH signals and CL51 ceilometer measurements are shown in Fig. 19. An overview of the relevant criteria is provided by Table 6. Assuming the height-dependent κ(z) slopes, can be found for both CL51 ceilometers. The values of are very small, and many integer wavelengths can be found that show slopes close to zero. Compared to the other examples, ΔF is slightly larger (1.4 %). If the AERONET-based κ is used (green and blue line), perfect agreement is also found as expected from the similarity of the Angström exponents. The good agreement of the measured and extrapolated signals is confirmed by their slope s: we find that considering the inherent uncertainties of the individual contributions to Eq. (17). The values derived from the measurements of the CL51 ceilometers are s=1.64 and s=1.67, respectively, and fall very well into the expected range. With respect to the other ceilometers only the water vapor validation in case of the CL31-2 is acceptable. The quite different results for the two CL31 ceilometers (see Table 6) shows that obvious differences occur even if the same type of ceilometer is evaluated. Note that, in spite of that, all ceilometers permit the determination of cloud base height and the detection of aerosol layers.
The large number of ceilometers and the fact that they can be run unattended and fully automated makes them potentially very attractive for aerosol observations. Consequently, several attempts have been made to use them for aerosol remote sensing – though this does not comply with the intended use of the manufacturers. By exploiting ceilometer data in depth one becomes aware of the role of water vapor absorption and its influence on the retrieval of particle optical properties. Approaches that correct for this effect have been proposed recently (Wiegner and Gasteiger, 2015); however, a validation was still missing.
To assess the ceilometers' potential in a quantitative way, field campaigns were set up to compare them with reference lidar systems, to investigate their long-term stability and their operability in different environments. A corresponding activity was conducted in summer 2015 in Lindenberg, Germany, in the framework of the CeiLinEx2015 campaign. One of the scientific objectives was the abovementioned validation of retrieving aerosol optical properties in the case of water vapor absorption. The multi-wavelength Raman lidar RALPH served as a reference. The focus of this paper is on two types of Vaisala ceilometers (CL51 and CL31) and the CS135 of Campbell Scientific, all operating in the spectral range around 910 nm, where water vapor absorption is significant.
Validation was performed on the basis of comparing backscatter signals. We extrapolate the reference signal from 1064 nm to the wavelengths of the ceilometers for validation and exploit the ratio of both. The validation was considered successful if a height-independent ratio could be found for any wavelength in the specified range of the emission; note that the actual wavelength is not exactly known. For this purpose the spectral dependence of particle optical properties has to be known; we use information either from coincident AERONET data or from the inversion of RALPH backscatter signals.
It turns out that the spectral extrapolation and the selection of the validation range are the most crucial points of the validation. In particular we recommend that the vertical range used for the validation should be selected very carefully; typically it is limited to the upper part of the mixing layer. The reason is that, on the one hand, the range of incomplete overlap cannot be corrected with sufficient accuracy; on the other hand, the ceilometer signals above the mixing layer are either too noisy or substantially influenced by signal artifacts. Consequently, different validation ranges might apply for each ceilometer.
It was demonstrated that the water vapor correction was successful in the case of the CL51 ceilometers. In the case of the CL31 and CS135 ceilometers the validation was not always successful: though the agreement between the measured signals and the extrapolated reference signal was better with than without correction, the agreement was in general, but not always, worse in comparison to the CL51. In particular for the CS135, no generally valid conclusions could be found. These findings, however, do not question the primary purpose of all ceilometers, the ability to determine cloud base height.
We conclude from the measurements during CeiLinEx2015 that, for the present state of the art of ceilometers, a correction for water vapor absorption that improves aerosol remote sensing seems to be reasonable for Vaisala CL51 ceilometers. For the other ceilometers participating in CeiLinEx2015, further studies are required as other error sources – not known in detail yet – seem to dominate the water vapor effect. Anyway, in all cases uncertainties remain as long as the emitted spectrum of the laser is unknown, but again, this does not affect, for example, mixing layer height retrievals or cloud height determination.
If in the future manufacturers of automated lidars and ceilometers aim at quantitative retrievals of aerosol optical properties, either the emitted wavelength should be monitored or wavelengths influenced by gaseous absorption should be avoided. In this context an investigation of the benefit of radiation at 808 nm for aerosol remote sensing applied by the Cimel CE372 lidar (Ancellet et al., 2019) would be interesting. Further steps are expected from an additional characterization of the hardware, monitoring metadata on relevant system parameters, and regular dark measurements to be able to correct for signal artifacts. All suggestions would not only help to improve future validation activities, but would also improve βp(z) retrievals. We think that it is worthwhile to go in this direction as it offers a lot of new applications, e.g., the combination of passive and active remote sensing (e.g., Román et al., 2018).
Data from the CeiLinEx2015 campaign are available from https://doi.org/10.5676/DWD/CEILINEX2015 (Pattantyús-Ábrahám et al., 2017).
MW conducted the study and prepared the paper with contributions from all authors. In particular JABA, AH and MHe provided substantial comments. IM, MPÁ, FW and YP processed the ceilometer data (setup of a uniform database, quality control and overlap correction). IM processed the reference lidar data. JG provided the water vapor absorption cross sections. MW, JC, KK and MB provided instruments. MB, CM and KP provided technical information on the ceilometers and the corresponding data sets. MHa promoted the idea of an intercomparison campaign within TOPROF including financial support. UG and RL were responsible for the setup and organization of the CeiLinEx2015 campaign.
The authors declare that they have no conflict of interest.
The CeiLinEx2015 measurement campaign received support for the organization and analysis of results from the European Cooperation in Science and Technology (COST; https://www.cost.eu/, last access: 22 January 2019) Action ES1303 “TOPROF”. Juan Antonio Bravo-Aranda received funding from the Marie Sklodowska-Curie Action Cofund 2016 EU project – Athenea3i under grant agreement no. 754446. Josef Gasteiger has received funding from the European Research Council (ERC) under the European Union's Horizon 2020 research and innovation programme (grant no. 640458, A-LIFE).
We are grateful to Marc-Antoine Drouin (LMD, France) for developing
pre-processing software for the CeiLinEx2015 data. Moreover, we want to thank
Robert Begbie (DWD, Germany) and the staff at the Meteorological Observatory
(DWD) in Lindenberg for the organization of CeiLinEx2015, technical support
and maintenance of the ceilometers.
Edited by:
Keding Lu
Reviewed by: Tianshu Zhang and Chengcai Li
Ancellet, G., Penner, I. E., Pelon, J., Mariage, V., Zabukovec, A., Raut, J. C., Kokhanenko, G., and Balin, Y. S.: Aerosol monitoring in Siberia using an 808 nm automatic compact lidar, Atmos. Meas. Tech., 12, 147–168, https://doi.org/10.5194/amt-12-147-2019, 2019. a
Baars, H., Kanitz, T., Engelmann, R., Althausen, D., Heese, B., Komppula, M., Preißler, J., Tesche, M., Ansmann, A., Wandinger, U., Lim, J.-H., Ahn, J. Y., Stachlewska, I. S., Amiridis, V., Marinou, E., Seifert, P., Hofer, J., Skupin, A., Schneider, F., Bohlmann, S., Foth, A., Bley, S., Pfüller, A., Giannakaki, E., Lihavainen, H., Viisanen, Y., Hooda, R. K., Pereira, S. N., Bortoli, D., Wagner, F., Mattis, I., Janicka, L., Markowicz, K. M., Achtert, P., Artaxo, P., Pauliquevis, T., Souza, R. A. F., Sharma, V. P., van Zyl, P. G., Beukes, J. P., Sun, J., Rohwer, E. G., Deng, R., Mamouri, R.-E., and Zamorano, F.: An overview of the first decade of PollyNET: an emerging network of automated Raman-polarization lidars for continuous aerosol profiling, Atmos. Chem. Phys., 16, 5111–5137, https://doi.org/10.5194/acp-16-5111-2016, 2016. a
Cazorla, A., Casquero-Vera, J. A., Román, R., Guerrero-Rascado, J. L., Toledano, C., Cachorro, V. E., Orza, J. A. G., Cancillo, M. L., Serrano, A., Titos, G., Pandolfi, M., Alastuey, A., Hanrieder, N., and Alados-Arboledas, L.: Near-real-time processing of a ceilometer network assisted with sun-photometer data: monitoring a dust outbreak over the Iberian Peninsula, Atmos. Chem. Phys., 17, 11861–11876, https://doi.org/10.5194/acp-17-11861-2017, 2017. a
Chan, K. L., Wiegner, M., Flentje, H., Mattis, I., Wagner, F., Gasteiger, J., and Geiß, A.: Evaluation of ECMWF-IFS (version 41R1) operational model forecasts of aerosol transport by using ceilometer network measurements, Geosci. Model Dev., 11, 3807–3831, https://doi.org/10.5194/gmd-11-3807-2018, 2018. a
Emeis, S., Forkel, R., Junkermann, W., Schäfer, K., Flentje, H., Gilge, S., Fricke, W., Wiegner, M., Freudenthaler, V., Groß, S., Ries, L., Meinhardt, F., Birmili, W., Münkel, C., Obleitner, F., and Suppan, P.: Measurement and simulation of the 16/17 April 2010 Eyjafjallajökull volcanic ash layer dispersion in the northern Alpine region, Atmos. Chem. Phys., 11, 2689–2701, https://doi.org/10.5194/acp-11-2689-2011, 2011. a
Engelmann, R., Kanitz, T., Baars, H., Heese, B., Althausen, D., Skupin, A., Wandinger, U., Komppula, M., Stachlewska, I. S., Amiridis, V., Marinou, E., Mattis, I., Linné, H., and Ansmann, A.: The automated multiwavelength Raman polarization and water-vapor lidar PollyXT: the neXT generation, Atmos. Meas. Tech., 9, 1767–1784, https://doi.org/10.5194/amt-9-1767-2016, 2016. a
Eresmaa, N., Karppinen, A., Joffre, S. M., Räsänen, J., and Talvitie, H.: Mixing height determination by ceilometer, Atmos. Chem. Phys., 6, 1485–1493, https://doi.org/10.5194/acp-6-1485-2006, 2006. a
Fernald, F. G.: Analysis of atmospheric lidar observations: some comments, Appl. Optics, 23, 652–653, 1984. a
Flentje, H., Claude, H., Elste, T., Gilge, S., Köhler, U., Plass-Dülmer, C., Steinbrecht, W., Thomas, W., Werner, A., and Fricke, W.: The Eyjafjallajökull eruption in April 2010 – detection of volcanic plume using in-situ measurements, ozone sondes and lidar-ceilometer profiles, Atmos. Chem. Phys., 10, 10085–10092, https://doi.org/10.5194/acp-10-10085-2010, 2010. a
Gasteiger, J. and Wiegner, M.: MOPSMAP v1.0: a versatile tool for the modeling of aerosol optical properties, Geosci. Model Dev., 11, 2739–2762, https://doi.org/10.5194/gmd-11-2739-2018, 2018. a
Geisinger, A., Behrendt, A., Wulfmeyer, V., Strohbach, J., Förstner, J., and Potthast, R.: Development and application of a backscatter lidar forward operator for quantitative validation of aerosol dispersion models and future data assimilation, Atmos. Meas. Tech., 10, 4705–4726, https://doi.org/10.5194/amt-10-4705-2017, 2017. a
Geiß, A., Wiegner, M., Bonn, B., Schäfer, K., Forkel, R., von Schneidemesser, E., Münkel, C., Chan, K. L., and Nothard, R.: Mixing layer height as an indicator for urban air quality?, Atmos. Meas. Tech., 10, 2969–2988, https://doi.org/10.5194/amt-10-2969-2017, 2017. a
Haeffelin, M., Angelini, F., Morille, Y., Martucci, G., Frey, S., Gobbi, G. P., Lolli, S., O'Dowd, C. D., Sauvage, L., Xueref-Rémy, I., Wastine, B., and Feis, D. G.: Evaluation of Mixing-Height Retrievals from Automatic Profiling Lidars and Ceilometers in View of Future Integrated Networks in Europe, Bound.-Lay. Meteorol., 143, 49–75, https://doi.org/10.1007/s10546-011-9643-z, 2011. a
Hervo, M., Poltera, Y., and Haefele, A.: An empirical method to correct for temperature-dependent variations in the overlap function of CHM15k ceilometers, Atmos. Meas. Tech., 9, 2947–2959, https://doi.org/10.5194/amt-9-2947-2016, 2016. a
Holben, B. N., Eck, T. I., Slutsker, I., Tanré, D., Buis, J. P., Setzer, A., Vermote, E., Reagan, J. A., Kaufman, Y. J., Nakajima, T., Lavenu, F., Jankowiak, I., and Smirnov, A.: AERONET – A Federated Instrument Network and Data Archive for Aerosol Characterization, Remote Sens. Environ., 66, 1–16, 1998. a
Illingworth, A., Cimini, D., Haefele, A., Haeffelin, M., Hervo, M., Kotthaus, S., Löhnert, U., Martinet, P., Mattis, I., O'Connor, E., and Potthast, R.: How can Existing Ground-Based Profiling Instruments Improve European Weather Forecasts?, B. Am. Meteorol. Soc., https://doi.org/10.1175/BAMS-D-17-0231.1, online first, 2018. a
Jin, Y., Kai, K., Kawai, K., Nagai, T., Sakai, T., Yamazaki, A., Uchiyama, A., Batdorj, D., Sugimoto, N., and Nishizawa, T.: Ceilometer calibration for retrieval of aerosol optical properties, J. Quant. Spectrosc. Ra., 153, 49–56, https://doi.org/10.1016/j.jqsrt.2014.10.009, 2015. a
Jones, D. W., Ouldridge, M., and Painting, D. J.: WMO International Ceilometer Intercomparison (United Kingdom, 1986), WMO, Instruments and Oberserving Methods, Report No. 32, Geneva, 1988. a
Kaskaoutis, D. G. and Kambezidis, H. D.: Investigation into the wavelength dependence of the aerosol optical depth in the Athens area, Q. J. Roy. Meteor. Soc., 132, 2217–2234, 2006. a
Klett, J. D.: Stable analytical inversion solution for processing lidar returns, Appl. Optics, 20, 211–220, 1981. a
Kotthaus, S. and Grimmond, C. S. B.: Atmospheric Boundary Layer Characteristics from Ceilometer Measurements Part 1: A new method to track mixed layer height and classify clouds, Q. J. Roy. Meteor. Soc., 144, 1525–1538, https://doi.org/10.1002/qj.3299, 2018a. a
Kotthaus, S. and Grimmond, C. S. B.: Atmospheric Boundary Layer Characteristics from Ceilometer Measurements Part 2: Application to London's Urban Boundary Layer, Q. J. Roy. Meteor. Soc., 144, 1511–1524, https://doi.org/10.1002/qj.3298, 2018b. a
Kotthaus, S., O'Connor, E., Münkel, C., Charlton-Perez, C., Haeffelin, M., Gabey, A. M., and Grimmond, C. S. B.: Recommendations for processing atmospheric attenuated backscatter profiles from Vaisala CL31 ceilometers, Atmos. Meas. Tech., 9, 3769–3791, https://doi.org/10.5194/amt-9-3769-2016, 2016. a
Liu, L., Zhang, T., Wu, Y., Wang, Q., and Gao, T.: Accuracy analysis of the aerosol backscatter coefficient profiles derived from the CYY-2B ceilometer, Adv. Meteorol., 2018, 9738197, https://doi.org/10.1155/2018/9738197, 2018. a, b
Lotteraner, C. and Piringer, M.: Mixing-Height Time Series from Operational Ceilometer Aerosol-Layer Heights, Bound.-Lay. Meteorol., 161, 265–287, https://doi.org/10.1007/s10546-016-0169-2, 2016. a
Madonna, F., Amato, F., Vande Hey, J., and Pappalardo, G.: Ceilometer aerosol profiling versus Raman lidar in the frame of the INTERACT campaign of ACTRIS, Atmos. Meas. Tech., 8, 2207–2223, https://doi.org/10.5194/amt-8-2207-2015, 2015. a
Madonna, F., Rosoldi, M., Lolli, S., Amato, F., Vande Hey, J., Dhillon, R., Zheng, Y., Brettle, M., and Pappalardo, G.: Intercomparison of aerosol measurements performed with multi-wavelength Raman lidars, automatic lidars and ceilometers in the framework of INTERACT-II campaign, Atmos. Meas. Tech., 11, 2459–2475, https://doi.org/10.5194/amt-11-2459-2018, 2018. a
Markowicz, K. M., Flatau, P. J., Kardas, A. E., Remiszewska, J., Stelmaszczyk, K., and Woeste, L.: Ceilometer Retrieval of the Boundary Layer Vertical Aerosol Extinction Structure, J. Atmos. Ocean. Tech., 25, 928–944, 2008. a
Münkel, C., Eresmaa, N., Räsänen, J., and Karppinen, A.: Retrieval of mixing height and dust concentration with lidar ceilometer, Bound.-Lay. Meteorol., 124, 117–128, 2007. a
Pappalardo, G., Amodeo, A., Apituley, A., Comeron, A., Freudenthaler, V., Linné, H., Ansmann, A., Bösenberg, J., D'Amico, G., Mattis, I., Mona, L., Wandinger, U., Amiridis, V., Alados-Arboledas, L., Nicolae, D., and Wiegner, M.: EARLINET: towards an advanced sustainable European aerosol lidar network, Atmos. Meas. Tech., 7, 2389–2409, https://doi.org/10.5194/amt-7-2389-2014, 2014. a
Pattantyús-Ábrahám, M., Mattis, I., Begbie, R., Bravo-Aranda, J. A., Brettle, M., Cermak, J., Drouin, M.-A., Geiß, A., Görsdorf, U., Haefele, A., Haeffelin, M., Hervo, M., Komínková, K., Leinweber, R., Münkel, C., Pönitz, K., Vande Hey, J., Wagner, F., and Wiegner, M.: The Dataset of the CeiLinEx2015 Ceilometer-Inter-comparison Experiment, Version v001, https://doi.org/10.5676/DWD/CEILINEX2015, 2017. a
Román, R., Benavent-Oltra, J. A., Casquero-Vera, J. A., Lopatin, A., Cazorla, A., Lyamani, H., Denjean, C., Fuertes, D., Pérez-Ramírez, D., Torres, B., Toledano, C., Dubovik, O., Cachorro, V. E., de Frutos, A. M., Olmo, F. J., and Alados-Arboledas, L.: Retrieval of aerosol profiles combining sunphotometer and ceilometer measurements in GRASP code, Atmos. Res., 204, 161–177, https://doi.org/10.1016/j.atmosres.2018.01.021, 2018. a
Schäfer, K., Thomas, W., Peters, A., Ries, L., Obleitner, F., Schnelle-Kreis, J., Birmili, W., Diemer, J., Fricke, W., Junkermann, W., Pitz, M., Emeis, S., Forkel, R., Suppan, P., Flentje, H., Gilge, S., Wichmann, H. E., Meinhardt, F., Zimmermann, R., Weinhold, K., Soentgen, J., Münkel, C., Freuer, C., and Cyrys, J.: Influences of the 2010 Eyjafjallajökull volcanic plume on air quality in the northern Alpine region, Atmos. Chem. Phys., 11, 8555–8575, https://doi.org/10.5194/acp-11-8555-2011, 2011. a
Schuster, G. L., Dubovik, O., and Holben, B. N.: Angstrom exponent and bimodal aerosol size distributions, J. Geophys. Res., 111, D07207, https://doi.org/10.1029/2005JD006328, 2006. a
Sundström, A. M., Nousiainen, T., and Petäjä, T.: On the Quantitative Low-Level Aerosol Measurements Using Ceilometer-Type Lidar, J. Atmos. Ocean. Tech., 26, 2340–2352, https://doi.org/10.1175/2009JTECHA1252.1, 2009. a
Warren, E., Charlton-Perez, C., Kotthaus, S., Lean, H., Ballard, S., Hopkin, E., and Grimmond, S.: Evaluation of forward-modelled attenuated backscatter using an urban ceilometer network in London under clear-sky conditions, Atmos. Environ., 191, 532–547, https://doi.org/10.1016/j.atmosenv.2018.04.045, 2018. a
Wiegner, M. and Gasteiger, J.: Correction of water vapor absorption for aerosol remote sensing with ceilometers, Atmos. Meas. Tech., 8, 3971–3984, https://doi.org/10.5194/amt-8-3971-2015, 2015. a, b, c, d, e, f, g
Wiegner, M. and Geiß, A.: Aerosol profiling with the Jenoptik ceilometer CHM15kx, Atmos. Meas. Tech., 5, 1953–1964, https://doi.org/10.5194/amt-5-1953-2012, 2012. a
Wiegner, M., Gasteiger, J., Groß, S., Schnell, F., Freudenthaler, V., and Forkel, R.: Characterization of the Eyjafjallajökull ash-plume: Potential of lidar remote sensing, Phys. Chem. Earth, 45–46, 79–86, https://doi.org/10.1016/j.pce.2011.01.006, 2012. a
Wiegner, M., Madonna, F., Binietoglou, I., Forkel, R., Gasteiger, J., Geiß, A., Pappalardo, G., Schäfer, K., and Thomas, W.: What is the benefit of ceilometers for aerosol remote sensing? An answer from EARLINET, Atmos. Meas. Tech., 7, 1979–1997, https://doi.org/10.5194/amt-7-1979-2014, 2014. a, b
darkmeasurements on a regular basis to be able to correct for signal artifacts.


