the Creative Commons Attribution 4.0 License.
the Creative Commons Attribution 4.0 License.
 | 02 Oct 2019
TROPOMI/S5P total ozone column data: global ground-based validation and consistency with other satellite missions
Maria-Elissavet Koukouli
Tijl Verhoelst
Christophe Lerot
Klaus-Peter Heue
Vitali Fioletov
Dimitrios Balis
Alkiviadis Bais
Ariane Bazureau
Angelika Dehn
Florence Goutail
Jose Granville
Debora Griffin
Daan Hubert
Arno Keppens
Jean-Christopher Lambert
Diego Loyola
Chris McLinden
Andrea Pazmino
Jean-Pierre Pommereau
Alberto Redondas
Fabian Romahn
Pieter Valks
Michel Van Roozendael
Claus Zehner
Christos Zerefos
Walter Zimmer
In October 2017, the Sentinel-5 Precursor (S5P) mission was launched, carrying the TROPOspheric Monitoring Instrument (TROPOMI), which provides a daily global coverage at a spatial resolution as high as 7 km × 3.5 km and is expected to extend the European atmospheric composition record initiated with GOME/ERS-2 in 1995, enhancing our scientific knowledge of atmospheric processes with its unprecedented spatial resolution. Due to the ongoing need to understand and monitor the recovery of the ozone layer, as well as the evolution of tropospheric pollution, total ozone remains one of the leading species of interest during this mission.
In this work, the TROPOMI near real time (NRTI) and offline (OFFL) total ozone column (TOC) products are presented and compared to daily ground-based quality-assured Brewer and Dobson TOC measurements deposited in the World Ozone and Ultraviolet Radiation Data Centre (WOUDC). Additional comparisons to individual Brewer measurements from the Canadian Brewer Network and the European Brewer Network (Eubrewnet) are performed. Furthermore, twilight zenith-sky measurements obtained with ZSL-DOAS (Zenith Scattered Light Differential Optical Absorption Spectroscopy) instruments, which form part of the SAOZ network (Système d'Analyse par Observation Zénitale), are used for the validation. The quality of the TROPOMI TOC data is evaluated in terms of the influence of location, solar zenith angle, viewing angle, season, effective temperature, surface albedo and clouds. For this purpose, globally distributed ground-based measurements have been utilized as the background truth. The overall statistical analysis of the global comparison shows that the mean bias and the mean standard deviation of the percentage difference between TROPOMI and ground-based TOC is within 0 –1.5 % and 2.5 %–4.5 %, respectively. The mean bias that results from the comparisons is well within the S5P product requirements, while the mean standard deviation is very close to those limits, especially considering that the statistics shown here originate both from the satellite and the ground-based measurements.
Additionally, the TROPOMI OFFL and NRTI products are evaluated against already known spaceborne sensors, namely, the Ozone Mapping Profiler Suite, on board the Suomi National Polar-orbiting Partnership (OMPS/Suomi-NPP), NASA v2 TOCs, and the Global Ozone Monitoring Experiment 2 (GOME-2), on board the Metop-A (GOME-2/Metop-A) and Metop-B (GOME-2/Metop-B) satellites. This analysis shows a very good agreement for both TROPOMI products with well-established instruments, with the absolute differences in mean bias and mean standard deviation being below +0.7 % and 1 %, respectively. These results assure the scientific community of the good quality of the TROPOMI TOC products during its first year of operation and enhance the already prevalent expectation that TROPOMI/S5P will play a very significant role in the continuity of ozone monitoring from space.
- Article
(8171 KB) - Full-text XML
-
Supplement
(768 KB) - BibTeX
- EndNote


Spaceborne observations of the total ozone content of the atmosphere began in the early 1970s with the Backscatter UltraViolet (BUV) instrument on board the National Aeronautics and Space Administration's (NASA) satellite Nimbus-4, followed by a continuous series of sensors up to the NOAA 19 SBUV/2, which has been in orbit and operational since 2009 (e.g., Bhartia et al., 2013). Similarly, the Total Ozone Mapping Spectrometer (TOMS) has flown consecutively, on Nimbus-7 in 1979, Meteor-3 in 1994 and on Earth Probe in 1996, while the Ozone Monitoring Instrument (OMI) is still active following its launch in 2004, alongside the Suomi NPP OMPS, launched in 2011. The GOME-2 suite of instruments (on EUMETSAT Metop-A in 2007, Metop-B in 2013 and Metop-C in 2018) continues to monitor the ozone layer as well as numerous other species in the UV–VIS part of the spectrum (for, e.g., Hassinen et al., 2016; Flynn et al., 2009; Levelt et al., 2018). While nearly 50 years of satellite total ozone column (TOC) observations exist, continuously observing this major atmospheric species still forms the cornerstone of all atmospheric science missions.
The TROPOspheric Monitoring Instrument (TROPOMI), is the satellite sensor on board of the Copernicus Sentinel-5 Precursor (S5P) satellite, which is the first of the atmospheric-composition Sentinels. It was successfully launched in October 2017 and has a projected nominal mission lifetime of 7 years (Veefkind et al., 2012, 2018). The Sentinel-5P mission is implemented as part of the Copernicus Programme, the European Programme for the establishment of a European capacity for Earth Observation. The Sentinel-5P mission consists of a single-payload satellite in a low Earth orbit. TROPOMI has a local equatorial overpass time of 13:30 UTC, a ground pixel size of 3.5 km × 7 km for TOCs and all major atmospheric gases retrieved from the UV–VIS, a swath of 2600 km, and daily global coverage with ∼14 orbits per day. The TROPOMI instrument and its pre-launch calibration techniques are thoroughly described by Kleipool et al. (2018).
The mission products are disseminated to both operational users, such as the Copernicus services, National Numerical Weather Prediction Centres, value-adding industry and, naturally, the scientific community. Some studies utilizing TROPOMI data have highlighted its high spatial resolution and spectral accuracy for various species, e.g., nitrogen dioxide (Griffin et al., 2019), sulfur dioxide (Theys et al., 2019), carbon monoxide (Borsdorff et al., 2018), methane (Hu et al., 2018) and solar-induced chlorophyll fluorescence (Köehler et al., 2018), to name a few. With respect to TOCs, Inness et al., 2019, show the first global maps for 1 year of TROPOMI observations, as well as the first efforts to assimilate the TOCs into the operational data assimilation system of the Copernicus Atmosphere Monitoring Service (CAMS).
The aim of this work is to fully characterize the TOC product from the TROPOspheric Monitoring Instrument (TROPOMI) on board the Sentinel-5 Precursor (S5P) satellite regarding biases, random differences and long-term stability with respect to ground-based TOC observations. In this context, the accuracy and long-term stability of TROPOMI TOC against product requirements will be verified via comparisons to both ground-based and other, already established, spaceborne missions.
2.1 TROPOMI/S5P TOC products
The TOC products validated in this work and the respective algorithms are described in the following sections. The TROPOMI dataset used here spans the time period from its launch in October 2017, until 30 November 2018, hence a full year of operation is covered, including the commissioning phase “E1” that concluded at the end of April 2018. This phase started immediately after the initial switch-on and acquisition of nominal orbit characteristics, in order to perform functional checking of the end-to-end system on board the Sentinel-5P, as well as engineering calibration and geophysical validation of the first observations.
2.1.1 The NRTI TOC product
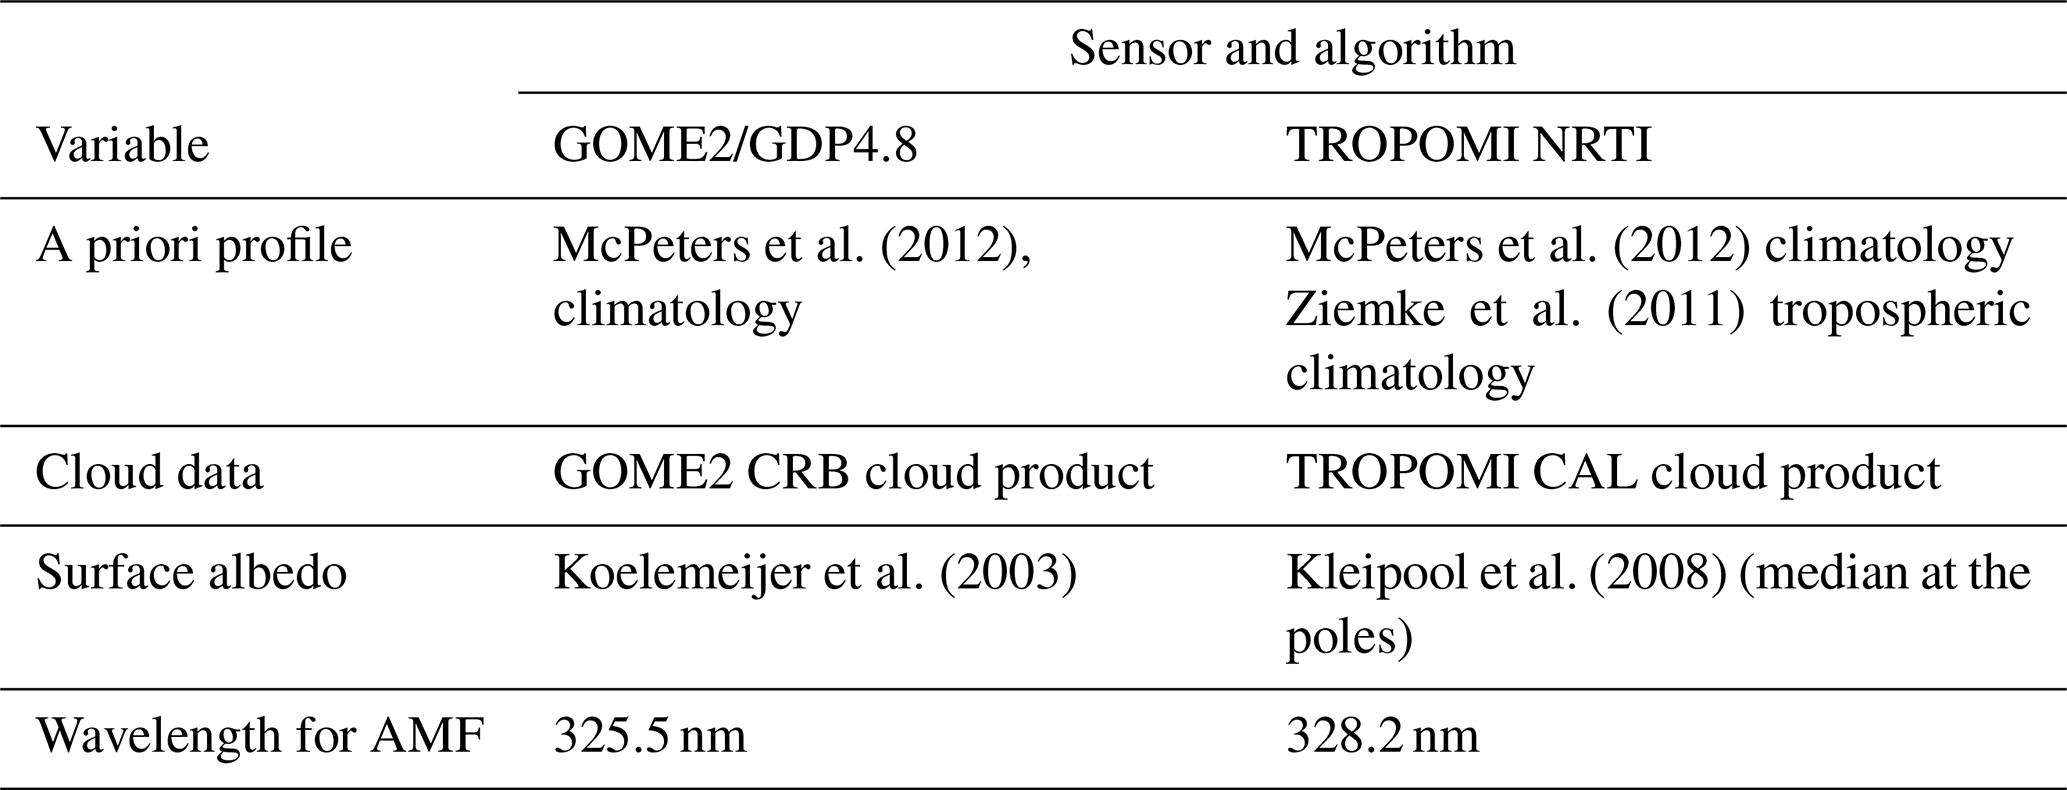
According to the TROPOMI near real time (NRTI) requirements, the NRTI data should be available within 3 h after the measurements. The Differential Optical Absorption Spectroscopy (DOAS) TOC retrieval (Loyola et al., 2019a) can face this requirement and is based on the GOME-2 data processor (GDP) version 4.x algorithm originally developed for GOME (Van Roozendael et al., 2006), adapted to SCIAMACHY (Lerot et al., 2009) and further improved for GOME-2 (Loyola et al., 2011; Hao et al., 2014). The DOAS retrieval calculates ozone slant column densities (SCDs) from the sun normalized radiances. To convert the SCDs to TOCs, an air mass factor (AMF) is calculated based on a priori ozone profiles taken from a column-based climatology (McPeters et al., 2012). Because the AMF depends on the TOC, the process is iterated until the changes in the TOC reach a predefined minimum. Compared to the aforementioned GDP 4.x algorithm, the TROPOMI algorithm was updated in several important aspects. For the AMF calculation, the clouds are treated as scattering layers (Loyola et al., 2018), which was shown to be more precise compared to the previously used reflecting boundary consideration. The AMF is calculated for 328.2 nm instead of 325.5 nm, which has been shown to lead to smaller systematic errors for a larger range of geophysical conditions and at extreme solar zenith angles (SZAs) in particular. The surface reflectivity is taken from the Kleipool et al. (2008) monthly climatology based on OMI data with a resolution of . The 328 nm minimum Lambertian-equivalent reflectivity (LER) from the climatology shows some clear artificial structures in the polar regions; therefore, we replaced it with the median and interpolated linearly between 70 and 50∘. The tropospheric ozone variability is now represented in the a priori profile by including a tropospheric climatology (Ziemke et al., 2011). During the retrieval, striping structures of the order of +1 % to +1.5 % were found in the TOC, and a correction factor is also applied. A typical striping structure was extracted by averaging the total ozone columns in the tropics (15∘ S to 15∘ N) for January to April 2018 for each row individually and normalizing by the mean of all rows. For destriping, the TOC values are hence multiplied by an array of 450 numbers (corresponding to the TROPOMI charge-coupled device, CCD rows) between 0.99 and 1.015. For the time series presented in this work, an update of the destriping factor has not been deemed necessary. More details on the destriping, including a graph of the correction array, are given in the Algorithm Theoretical Basis Document (ATBD) (Heue et al., 2019). The destriping factor is applied to the NRTI total ozone columns only.
According to the user guidelines given by the respective S5P Mission Performance Centre product readme file (PRF) (Heue et al., 2018), to assure the quality of the NRTI data, the following quality checks are used to remove any outliers of the TROPOMI TOC data. Data are only used if the following conditions are met:
-
the TOC value is positive but less than 1008.52 DU,
-
the respective ozone effective temperature variable is greater than 180 K but less than 280 K,
-
the fitted root-mean-square variable is less than 0.01.
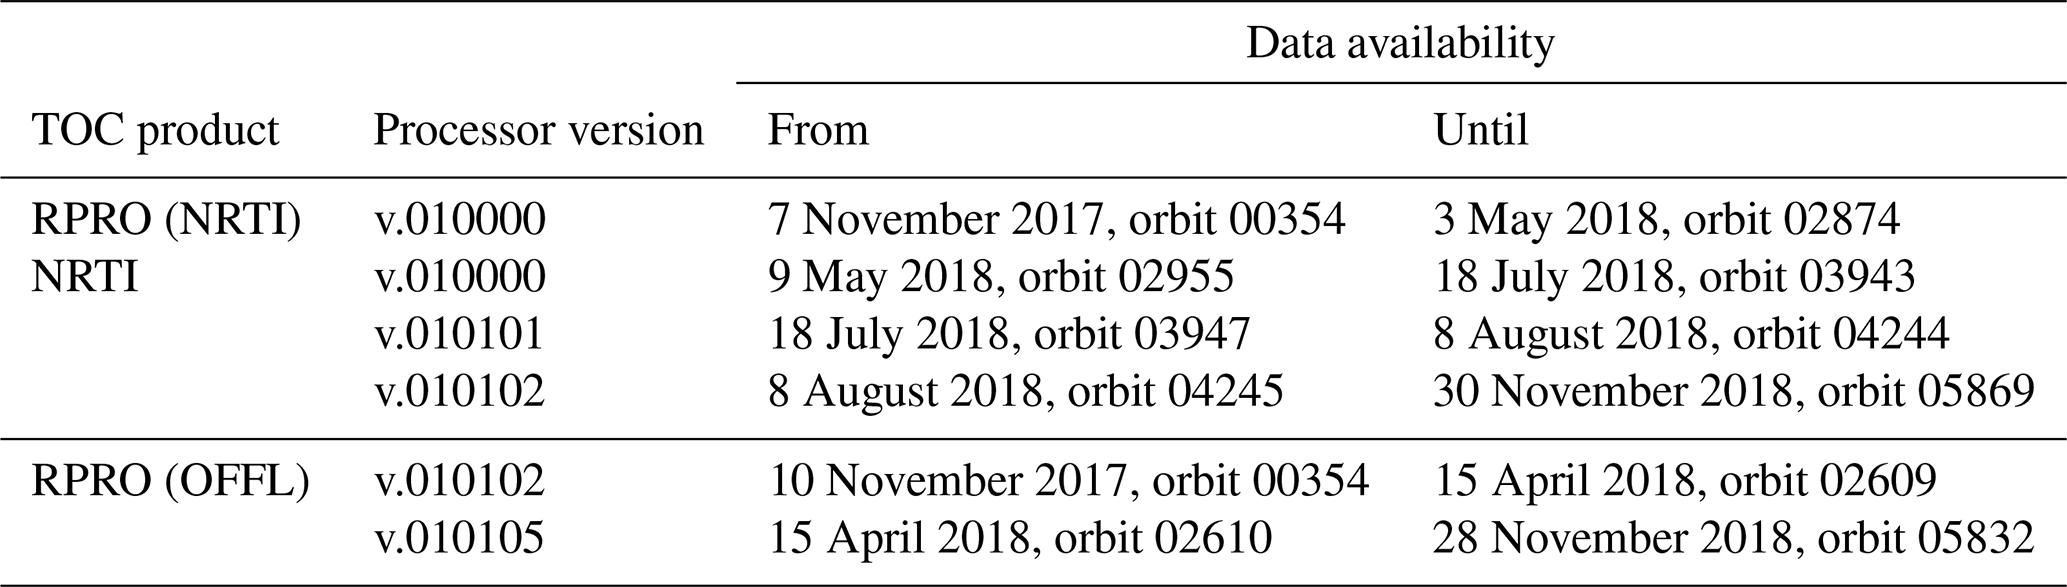
NRTI data are available through the Sentinel-5P Pre-Operations Data Hub (https://s5phub.copernicus.eu/, last access: 6 September 2019) and the time periods and processor versions used in this work are listed in Table 1.
Table 1The TROPOMI/S5P NRTI and OFFL TOC datasets used in this work.
2.1.2 The OFFL TOC product
For the offline (OFFL) TOC product other requirements were defined: the required accuracy is higher, but the time requirement is more relaxed (14 d after the measurements). To be consistent with the ECMWF C3S-ozone dataset, it was decided to use the GODFIT (GOME-type Direct FITting) algorithm for the total ozone column offline retrieval.
The TROPOMI OFFL TOC product relies on the operational implementation of the GODFIT v4 algorithm, which is a direct-fitting algorithm developed to retrieve, in one step, total ozone columns from satellite nadir-viewing instruments. Simulated radiances in the Huggins bands (fitting window: 325–335 nm) are directly adjusted to the observations by varying a number of key parameters describing the atmosphere. In particular, the state vector includes, among others, the total ozone, the effective scene albedo and the effective temperature. This approach, more physically sound than the usual DOAS technique, provides more accurate retrievals in extreme geophysical conditions (large ozone optical depths). GODFIT v4 is also the baseline to produce the Copernicus C3S and ESA CCI climate data records from the different sensors GOME, SCIAMACHY, GOME-2A and GOME-2B, OMI, and OMPS. More details on the algorithm and on the quality of the datasets can be found in Lerot et al. (2014) and Garane et al. (2018).
OFFL TOC data are available through the Sentinel-5P Expert Users Data Hub (https://s5pexp.copernicus.eu/, last access: 6 September 2019) and the Sentinel-5P Pre-Operations Data Hub (https://s5phub.copernicus.eu/, last access: 6 September 2019), and the datasets used here are listed in Table 1. The data filtering was applied following the recommendations of the S5P Mission Performance Centre readme document for the OFFL total ozone product (Lerot et al., 2018), keeping data only if all of the following criteria are met:
-
the TOC value is positive but less than 1008.52 DU,
-
the respective ozone effective temperature variable is greater than 180 K but less than 260 K,
-
the ring scale factor variable is positive but less than 0.15,
-
the effective albedo is greater than −0.5 but less than 1.5.
2.2 Ground-based measurements
The validation of the NRTI and the OFFL products was performed using both direct-sun (DS) measurements from Dobson and Brewer UV spectrophotometers, as well as zenith-sky scattered-light measurements obtained with ZSL-DOAS (Zenith Scattered Light Differential Optical Absorption Spectroscopy) instruments. It should be noted that zenith-sky measurements are also obtained from Brewers and Dobsons, but an advanced processing is required to match the quality of DS observations (e.g., Fioletov et al., 2011), which is not available at a large set of stations. Moreover, even with such processing, these measurements still show shortcomings in very cloudy conditions (low light) and at high AMF. As such, they provide little additional value in the current context. Brewer and Dobson TOC direct-sun ground-based measurements have been used for many years now as a solid means of comparison, analysis and validation of satellite data. Past publications that have used these kinds of measurements include Balis et al. (2007a, b), Fioletov et al. (2008), Antón et al. (2009), Loyola et al. (2011), Koukouli et al. (2012, 2015a), Labow et al. (2013), Bak et al. (2015), Garane et al. (2018), etc. The instrumentation and the measurement principles are thoroughly described in Koukouli et al. (2015a), Verhoelst et al. (2015), Garane et al. (2018) and in references therein.
Daily means of TOC measured by Brewer (Kerr et al., 1981, 1988, 2010) and Dobson (Basher, 1982) spectrophotometers, deposited to the WOUDC (World Ozone Ultraviolet Radiation Data Center) archive (http://www.woudc.org, last access: 6 September 2019), were used. Additionally, individual Brewer TOC measurements are used, acquired from (a) the European Brewer Network (Eubrewnet, Rimmer et al., 2018, http://rbcce.aemet.es/eubrewnet/, last access: 6 September 2019) and (b) the Canadian Brewer Network (http://exp-studies.tor.ec.gc.ca/, last access: 6 September 2019). The advantage of the two latter networks is that the Brewer measurements are processed by the same algorithm, which creates a “common ground” among the stations. The Eubrewnet network consists of 46 stations, mainly in Europe and South America but also in North America, Greenland, North Africa, Singapore and Australia. After quality control (QC) of their measurements, some Brewers were excluded from the validation datasets, while others did not have available measurements for the time period of interest, leaving the network with 25 Brewers. The Canadian Brewer Network is comprised of eight sites, plus Mauna Loa, Hawaii (MLO), and South Pole (SPO) observatories where Brewers are operated jointly with NOAA. Every site (except SPO) has at least two Brewers, including one double spectrometer, while each Arctic site has three Brewers. Due to very low stray light, double Brewers produce reliable ozone measurements when the sun is low above the horizon (air mass values up to of 7 at SPO and 5 at all other sites). All Canadian Brewers are calibrated against the World Brewer Calibration Centre (the Brewer triad), located in Toronto (Fioletov et al., 2005).
As discussed by Garane et al. (2018), Dobson TOC measurements are affected by a well-known dependency on the stratospheric effective temperature, which has already been seen numerous times in satellite TOC validation studies (for, e.g., Kerr et al., 1988; Kerr, 2002; Bernhard et al., 2005; Scarnato et al., 2009; Koukouli et al., 2016). Hence, when the assumed stratospheric temperature deviates strongly from what is assumed by the algorithms, which is a phenomenon usually occurring during winter months, the differences between ground and satellite measurements increase (see the recent work of Koukouli et al. (2016), and discussion therein, on this topic). For the case of the validation of the ESA GODFIT v4 long-term satellite record, the expected global mean difference between the two types of instruments (Brewer and Dobson) was found to be about 0.6 % (Garane et al., 2018).
TROPOMI TOC measurements were also validated against ZSL-DOAS measurements from 13 instruments that constitute part of the SAOZ network (Système d'Analyse par Observation Zénitale; Pommereau and Goutail, 1988) of the Network for the Detection of Atmospheric Composition Change (NDACC, http://www.ndaccdemo.org/, last access: 6 September 2019). For applications where processed measurements are needed as soon as possible, such as this validation of the recently launched TROPOMI instrument, the Laboratoire ATmosphères Milieu Observations Spatiales real time facility provides a first processing of the SAOZ measurements within a week of the actual observation. This data are called LATMOS_RT and are used here. In the context of satellite validation, the SAOZ measurements are complementary to the Brewer and Dobson measurements for several reasons: (a) they use spectral features of the visible Chappuis band, where the ozone differential absorption cross sections are temperature insensitive, (b) the long horizontal stratospheric optical path allows measurements of the column above cloudy scenes, and (c) measurements are always performed in the same small SZA range (86–91∘). For further details on the measurement procedures we refer to Balis et al. (2007a), Verhoelst et al. (2015), Garane et al. (2018) and references therein. Additional information on the specific collocation approach, taking into account the actual area of measurement sensitivity, is given in Sect. 2.4.
The uncertainty of the Dobson ground-based instruments is estimated by Van Roozendael et al. (1998) to be approximately 1 % for direct-sun observations under cloudless skies and 2 %–3 % for zenith-sky or cloudy observations. The respective uncertainty budget for a Brewer spectrophotometer is about 1 % (e.g., Kerr et al., 1988, 2010). Note that instrument uncertainties vary from site to site depending on the instrument state, calibration history and other factors (Fioletov et al., 2004). According to Hendrick et al. (2011), the total uncertainty of the SAOZ measurements is of the order of 6 %, which contains the systematic uncertainty of the absorption cross sections (3 %). The random uncertainty of SAOZ spectral analysis is less than 2 %, going up to 3.3 % when the random uncertainty on the air mass factor, mainly impacted by clouds, is added (Hendrick et al., 2011).
Another, possibly important, source of bias between the different datasets discussed in this paper is the use of different ozone absorption cross section coefficients; while the Dobson and Brewer TOC algorithms are based on the traditional Bass and Paur (1985; BP) ozone absorption cross sections, the TROPOMI NRTI TOCs are extracted using the so-called “Brion–Daumont–Malicet” (BDM) cross sections (Daumont et al., 1992; Malicet et al., 1995; Brion et al., 1998), whereas the TROPOMI OFFL TOCs using the more recent Serdyuchenko et al. (2014), henceforth Serdyuchenko, coefficients. It has already been shown that, for the Brewer wavelengths, the replacement of the BP with the Serdyuchenko cross sections would cause a minimal reduction of the extracted Brewer TOCs of less than 1 %, whereas a replacement with the BDM would result in a reduction of the nominal TOC by about 3 % (see Fragkos et al., 2013; Redondas et al., 2014). For the Dobson wavelengths, the calculated TOC changes by +1 %, with little variation depending on which of the aforementioned cross sections is used (see Redondas et al., 2014; Orphal et al., 2016). These findings illustrate the current uncertainty associated with the use of different ozone cross section measurements between platforms and should be considered when examining biases between the different TROPOMI TOC algorithms validated against the Brewer and Dobson observations.
The lists of the stations used in this validation work for each instrument and database category are displayed in Tables S1–S5 in the Supplement. In Fig. S1 the respective maps show the very good geographical coverage of the Earth by the ground-based measurement sites used herein. Specifically, in Fig. S1a the WOUDC Network is shown, in Fig. S1b and c the two Brewer networks (Eubrewnet and Canadian) are shown, and in Fig. S1d the SAOZ stations are displayed. It should be noted that when Brewer ground-based (GB) measurements from WOUDC are used, only the Northern Hemisphere co-locations are considered because of the limited number and poor spatial distribution of stations with Brewer instruments in the Southern Hemisphere (SH).

Figure 1The percentage difference (a) and the standard deviation (b) of the TROPOMI OFFL TOC compared to GB measurements versus the co-location search radius (in km) for nine Brewer stations of the Canadian Brewer Network (see Table S4 in the Supplement for details on these stations).
2.3 Investigation in the spatial and temporal co-location criteria for direct-sun instruments
After the generation of TROPOMI overpass files for each station including all relevant parameters for each measurement (date, time, spatial coordinates, solar zenith angle, error, cloud cover, cloud height, ghost column, etc.), a co-location methodology, similar to the one described in Garane et al. (2018), is applied using direct-sun GB measurements from Dobson and Brewers for the comparisons. One major difference compared to previous validation publications, such as Koukouli et al. (2015a) and Garane et al. (2018), is the maximum distance permitted between the direct-sun instruments' coordinates and the projection of the satellite's central pixel on the Earth's surface, which hereafter will be referred to as the “search radius of the co-location”. Due to the unique, high spatial resolution of the TROPOMI observations, it is apparent that the 150 km maximum distance co-location criterion should be significantly decreased.
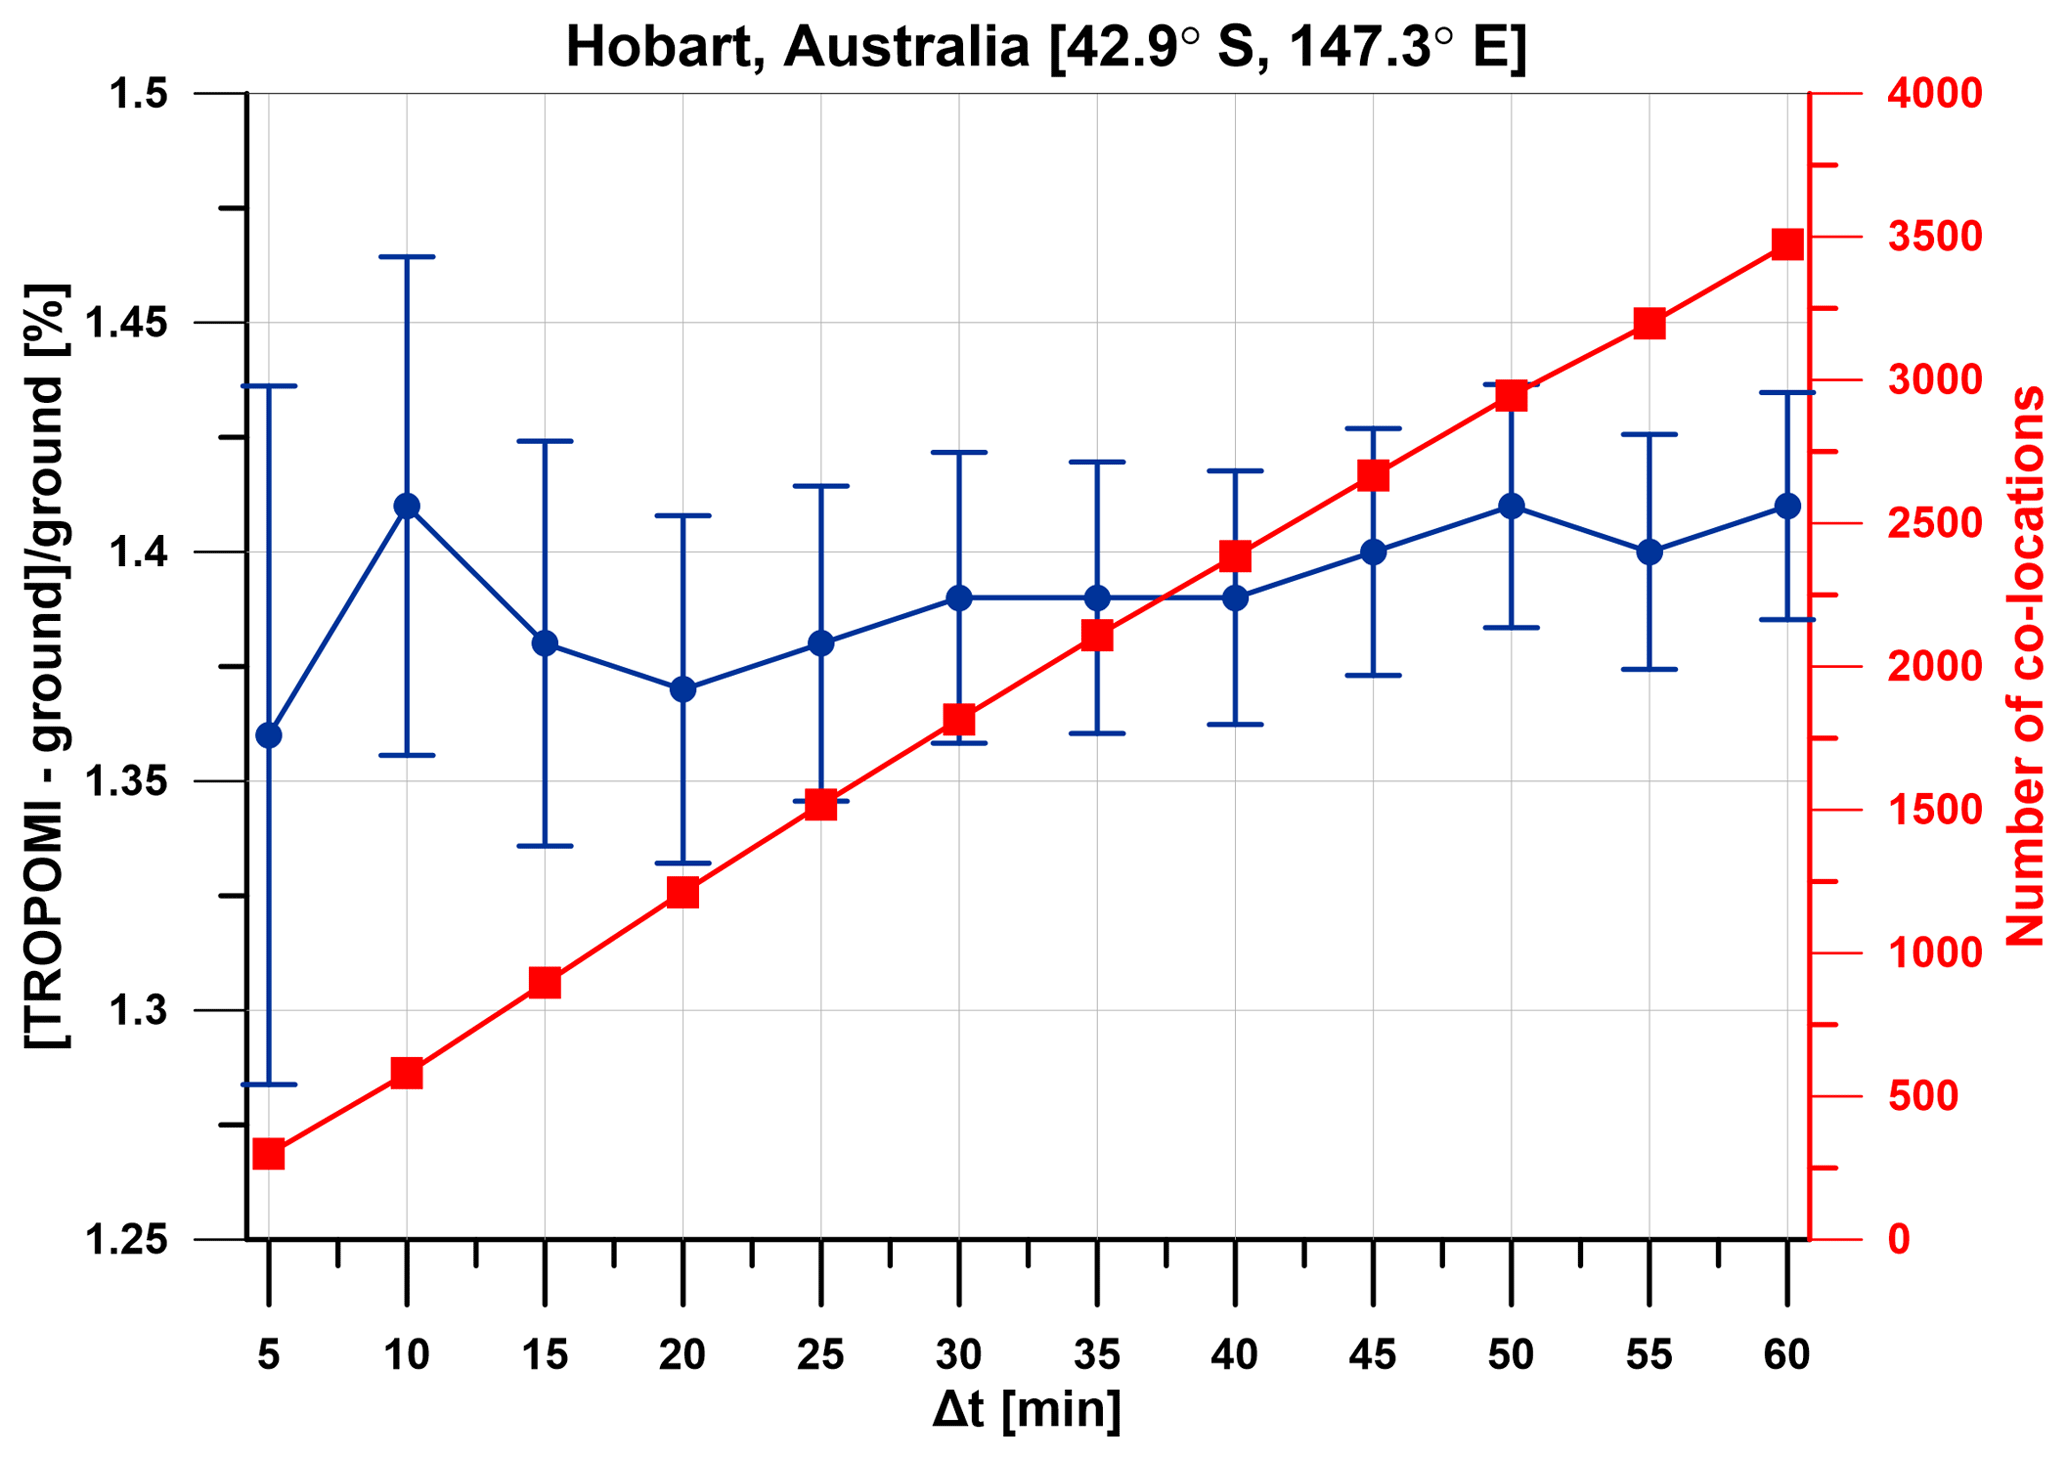
Figure 2The effect of the temporal variability of the sensing between satellite and ground-based measurements. The mean bias and the standard error (blue data points with error bars) for comparisons at Hobart station, Australia, remain almost invariable for temporal differences greater than 40 min. The red squares represent the number of co-locations in each case.
Figure 1 investigates the effect of different co-location search radii on the percentage differences between GB and satellite measurements. OFFL TOC from TROPOMI and nine Brewer GB stations from the Canadian Brewer Network are shown to demonstrate the dependency of the mean percentage difference (Fig. 1a) and its standard deviation (Fig. 1b) on the spatial criterion chosen. It can be noted that the mean difference for each site (in different colors) remains almost stable when increasing the co-location radius. However, this is not the case for the respective standard deviation, which increases with distance between the satellite pixel and ground-based station location. This testifies that the radius of co-location used in TROPOMI TOC validation exercises should be as small as possible to ensure that the same air parcels are compared, while at the same time reserving a sufficient amount of co-location points, as was already demonstrated for GOME-2 by Verhoelst et al. (2015; their Fig. 11).
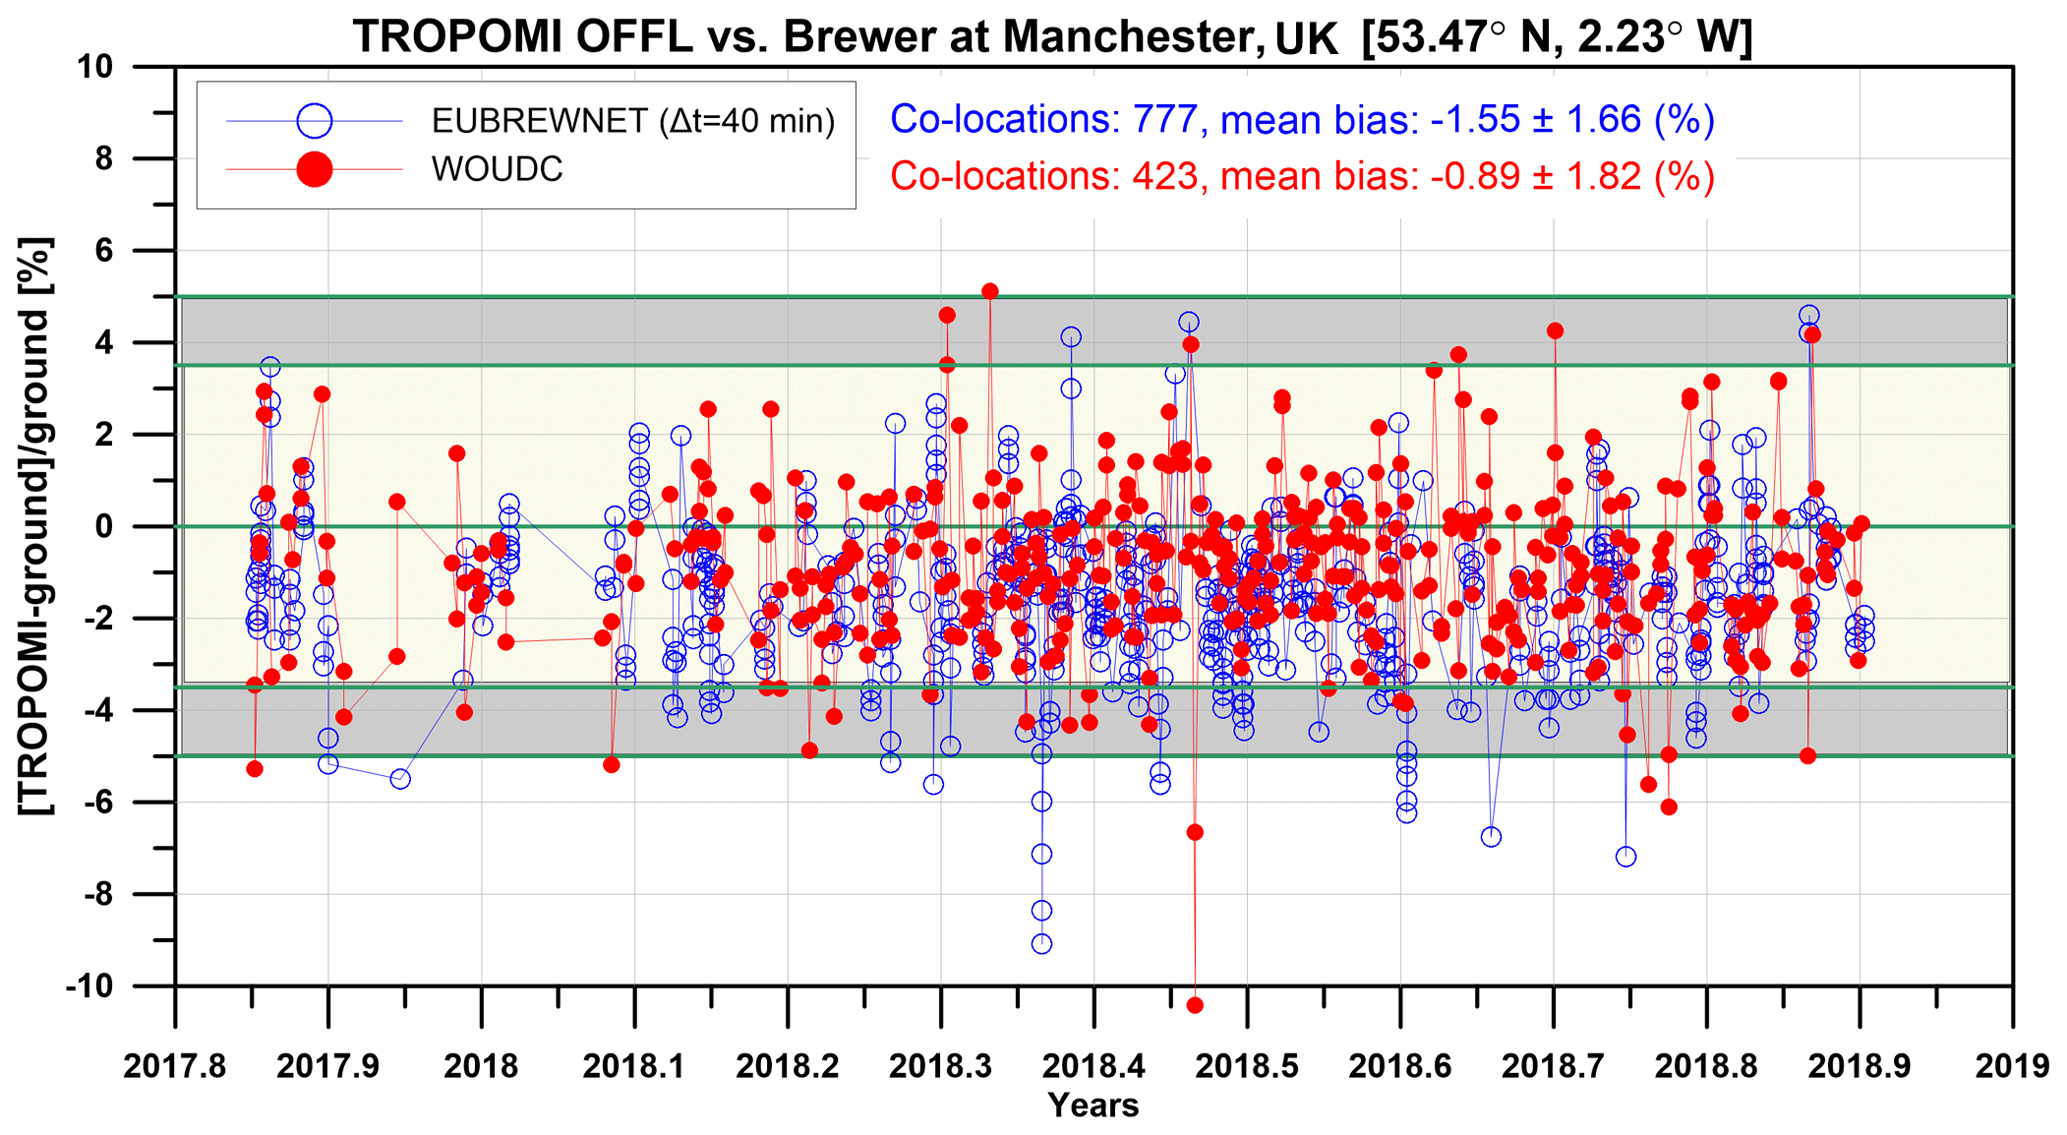
Figure 3The time series of the comparisons between TROPOMI and GB TOC measured at Manchester, UK. Blue circles: individual GB measurements with temporal maximum difference of 40 min from the TROPOMI measurements (Eubrewnet) are used. Red dots: TROPOMI compared to daily means of the GB measurements (WOUDC). Both data sets refer to the same time period.
Investigating the optimal solution for the distance criterion, the closest distance between the projection of the TROPOMI's central pixel and the station's location for all the available co-locations of each GB station were studied. The dataset for this investigation consisted only of the closest co-locations found within 50 km for each satellite orbit and its statistical analysis showed that the median of the closest distance spans between 2 and 3 km, while its 75th percentile goes up to 4 km. However, we decided to keep the co-location criterion for the validation at 10 km, since no obvious increase in variability was found for the 10 km distance (Fig. 1) but mainly to ensure that the number of co-locations is high enough to have statistically significant results.
It should be noted that when investigating the closest co-location distance it was also seen that, for each S5P CCD pixel, only 3 % of the total co-locations had a closest distance of 10–50 km. Out of those, almost 90 % were assigned to CCD pixels number 3 and 450, due to geometry reasons, i.e., the periodical capturing of some stations by the edges of the orbit's swath. As it is thoroughly explained in the OFFL and NRTI S5P Mission Performance Centre (MPC) product readme files (Heue et al., 2018; Lerot et al., 2018), no data from CCD pixels 1 and 2 are available, due to the lack of cloud information. As it is reported, this is caused by a misalignment of Band 3, used for the total ozone retrievals (450 pixels per scan line), and Band 6, used for deriving the cloud altitude information (448 pixels per scan line), which led to the application of a shift of two detector pixels between the two bands. Therefore, due to the lack of cloud information for the first two pixels, the respective data could not be analyzed.

Figure 4Estimated horizontal extension of the ozone air mass probed by the zenith-sky UV–VIS spectrometer from 70 to 92∘ SZA (calculation based on SAOZ settings in the Chappuis band at 550 nm). The shaded area shows the air mass extension during the twilight period. Reproduced from Lambert and Vandenbussche (2011).
Daily values of TOC retrieved from the WOUDC and the NDACC databases were widely used in previous studies for GOME2/Metop (Koukouli et al., 2015a), IASI/Metop (Boynard et al., 2018), OMI/Aura (Garane et al., 2018), and SBUV/NOAA (Labow et al., 2013) data validation. In addition to daily values, individual GB measurements from Eubrewnet and the Canadian Brewer Network are also used in this study. Thus, the effect of the time difference of the sensing between satellite and ground-based measurements had to be investigated. For this purpose, the mean percentage differences were computed for all co-located measurements with maximum temporal differences (Δtmax) varying between 5 and 60 min, keeping the search radius limit to 10 km. An example is presented in Fig. 2 for a middle latitude Eubrewnet station (Hobart, Australia, 42.9∘ S, 147.3∘ E), showing the mean and the standard error of the comparisons versus the Δtmax (blue data points with error bars). In this figure it was chosen to show the standard error instead of the standard deviation to take into account the effect of the number of co-locations for each case. The standard error of the mean decreases for temporal differences up to 40 min and after that the decrease is almost indistinguishable, even though the number of co-locations (displayed with the red squares) increases dramatically with Δt. The same conclusion was reached for all GB stations that were studied. Hence, it was decided that the temporal criterion applied to the individual measurements is to keep all co-locations within 40 min to ensure the reduction of the GB measurements' uncertainties and at the same time to have enough co-location points for statistically significant validation efforts.
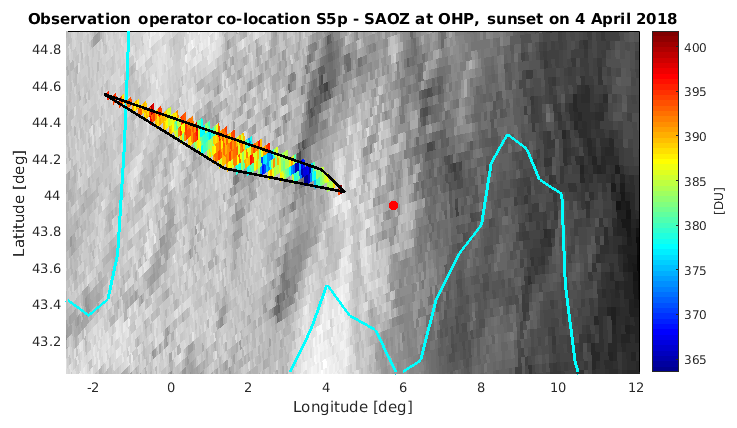
Figure 5Illustration of the co-location procedure for TROPOMI versus SAOZ measurements, in this case for a sunset SAOZ measurement at the Observatoire de Haute Provence (France) in local spring. The red disk marks the instrument location. The black polygon is the observation operator, i.e., the parameterized extent of the actual twilight measurement sensitivity. The gray background is the TOC measured in a temporally co-located TROPOMI orbit (no. 2456) and the colored pixels are those that fall within the observation operator, i.e., those that are averaged before being compared to the SAOZ measurement.
The use of the quite strict spatial criterion of 10 km might seem contradictory compared to the rather relaxed criterion of 40 min temporal difference. However, we found this was the best option, especially for the high-altitude stations, where we need a strict spatial constraint to avoid biases due to the missing column, and the only way to have enough co-locations is to keep the temporal constraint moderate. The comparison between TROPOMI OFFL TOC and the Brewer GB measurements is presented in Fig. 3 for the example of the station in Manchester, UK, utilizing these coincident criteria. The blue open circles represent the comparisons of the satellite data to the individual measurements of the particular site (downloaded from Eubrewnet) with a maximum temporal difference of 40 min, while the red dots stand for the respective GB daily data acquired through the WOUDC repository. All co-locations included in the plot have a maximum search radius of 10 km and refer to the same time period of operation. In both cases, the mean bias is negative, even though it is different by 0.7 %, but the standard deviation of the mean is only slightly different between the two data series, which proves that even when daily means are used for the TROPOMI validation, the statistical results of the comparison are equally reliable.

Figure 6The monthly mean time series of the NRTI (red line) and the OFFL (blue line) TOC products of TROPOMI compared to Dobson GB measurements for the NH (a) and the SH (b), SAOZ instruments (c: NH, d: SH), and Brewer measurements for the NH only (e). The error bars represent the 1σ standard deviations of the monthly mean percentage differences. (f) The overall statistics of percentage differences between the two TOC products to the Brewer GB measurements are shown.
2.4 The SAOZ co-location scheme
Comparing TROPOMI to twilight SAOZ measurements is complicated not only by the different measurement times (TROPOMI overpass time versus the time of sunrise or sunset) but also by the large difference in horizontal resolution. It is well known that the air mass to which a twilight SAOZ measurement is sensitive spans many hundreds of kilometers towards the rising or setting sun (e.g., Solomon et al., 1987). Our co-location scheme takes this into account by averaging all TROPOMI pixels of a temporally co-located orbit (maximum allowed time difference of 12 h) within a so-called observation operator.

Figure 7The latitudinal dependency of the mean percentage differences: (a) Dobson and (b) Brewer from WOUDC, (c) SAOZ and (d) Brewer from Eubrewnet, and their standard deviations for the two TROPOMI TOC products (blue line: OFFL; red line: NRTI).
This 2-D polygon is a parametrization of the actual extent of the air mass to which the SAOZ measurement is sensitive. Its horizontal dimensions were derived using a ray-tracing code, mapping the 90 % inter-percentile of the total vertical column to a projection on the ground (Fig. 4), and then parameterizing it as a function of the solar zenith angle and azimuth angle during the twilight measurement, where the SZA during a nominal single measurement sequence is assumed to range from 87 to 91∘ (at the location of the station). Note that the station location is not part of the area of actual measurement sensitivity.
The average TROPOMI measurement over this observation operator can then be compared to the ozone column measured by the SAOZ instrument. An illustration of one such co-location is presented in Fig. 5. Note that at polar sites, the above-mentioned SZA range may not be covered entirely, in which case the observation operator is limited to noon or midnight depending on the circumstances (sunrise or sunset, close to polar day or polar night). For more details, we refer to Lambert and Vandenbussche (2011) and Verhoelst et al. (2015).
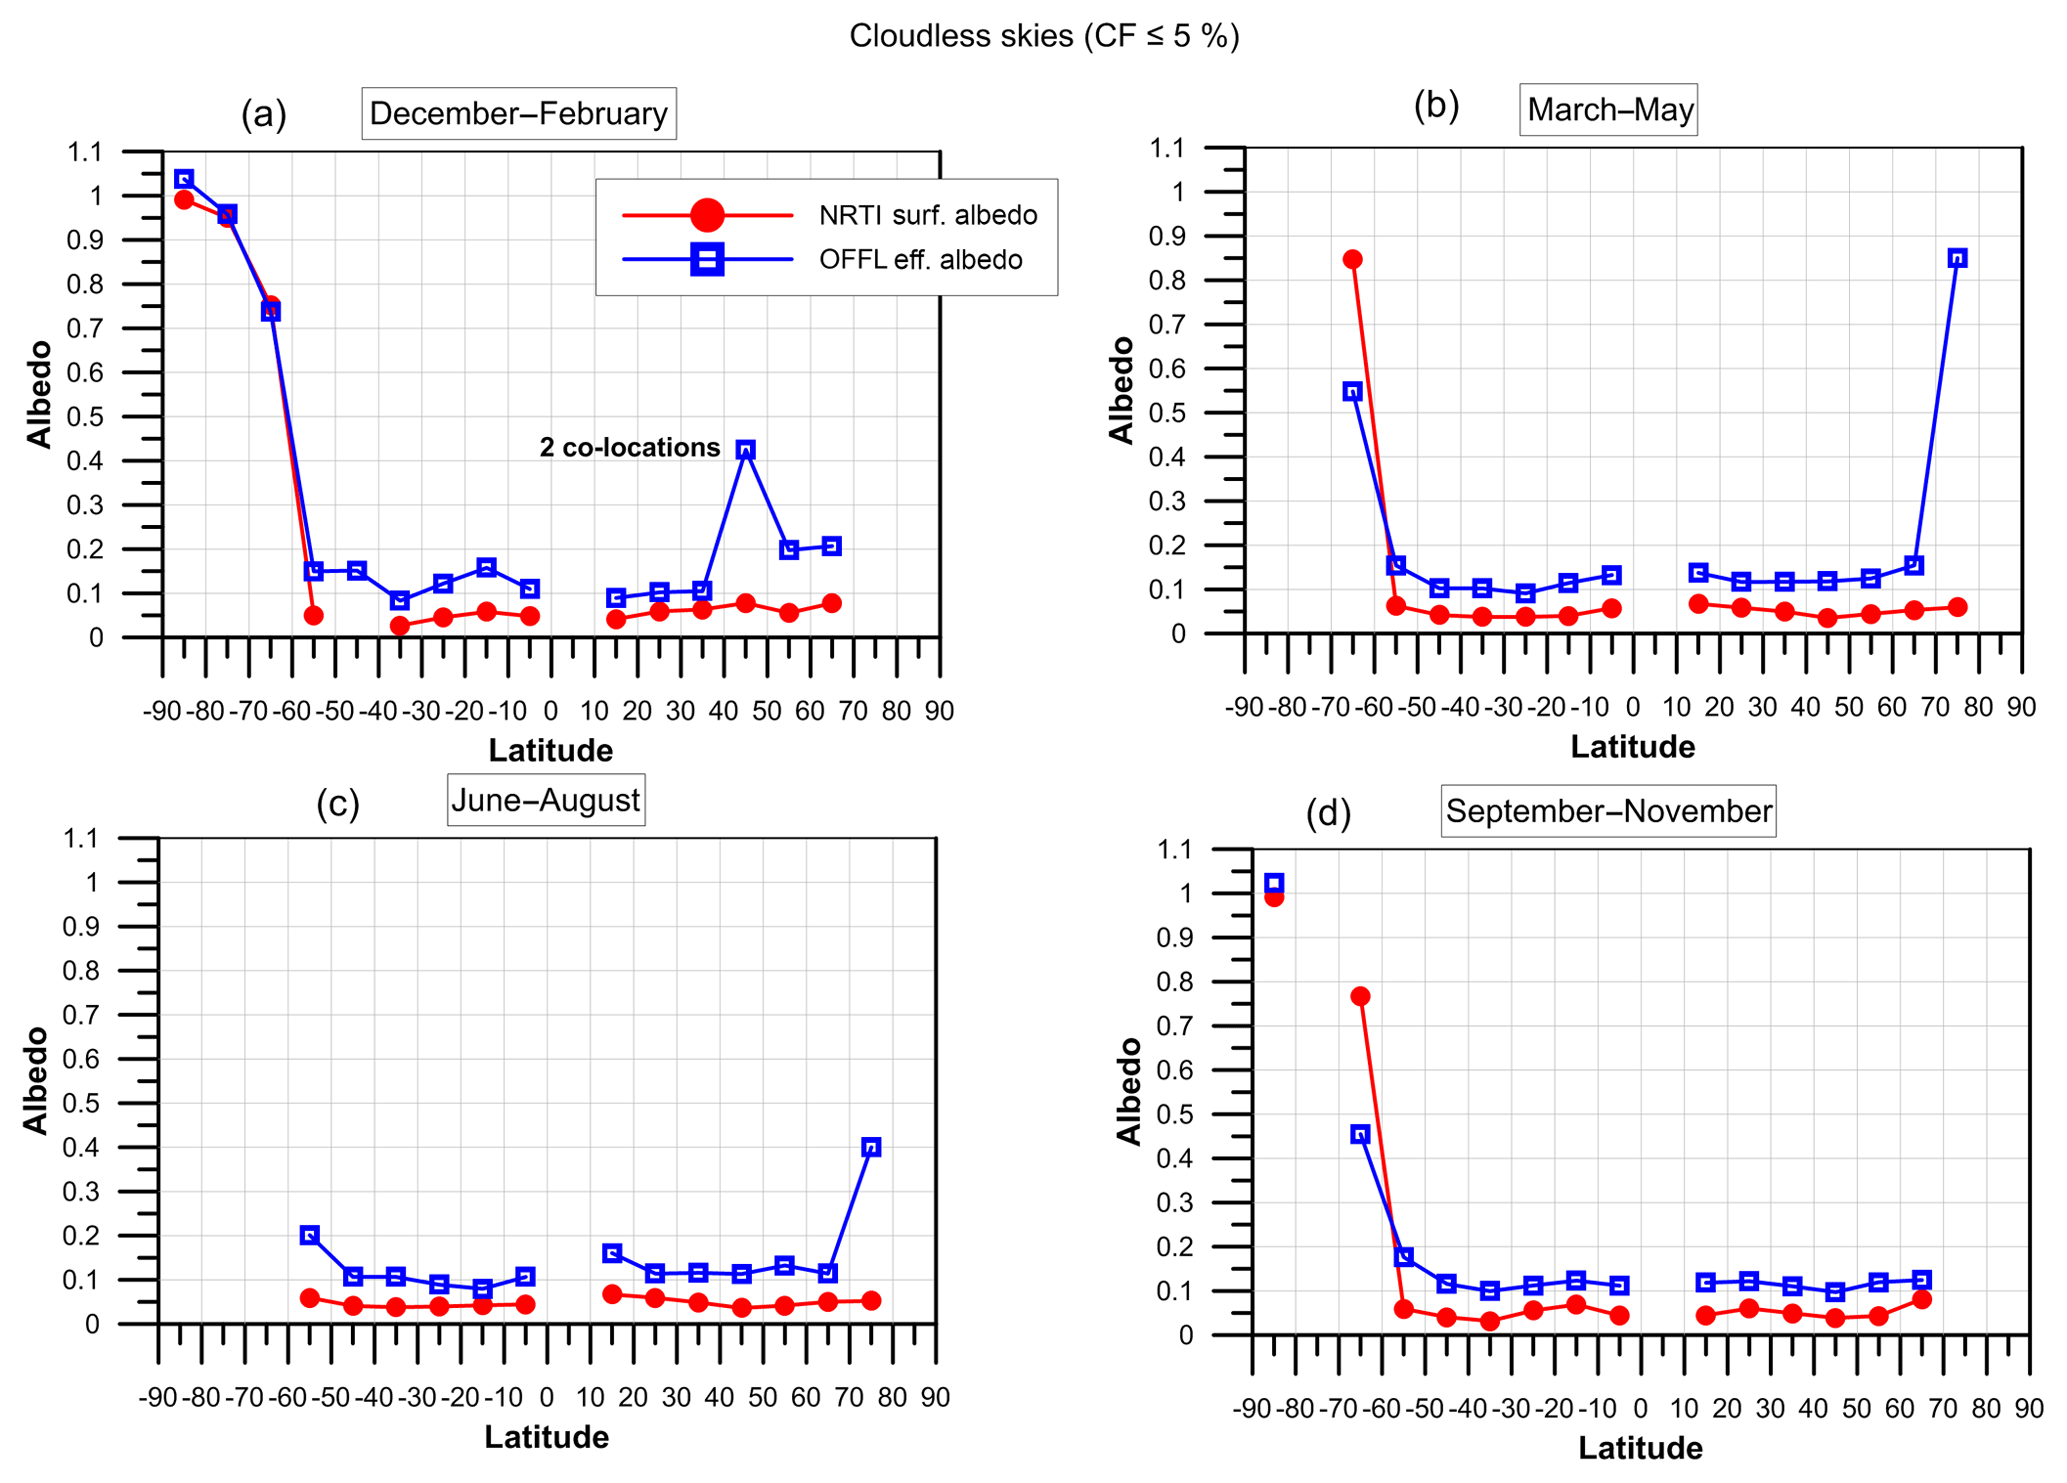
Figure 8The albedo parameter that was used in the TOC retrieval of the two TROPOMI products. The red dots and line represent the surface albedo used in the NRTI algorithm. The blue squares and line represent the effective albedo used in the OFFL algorithm. The albedo parameter is plotted versus latitude and averaged in 10∘ bins for four different seasons (a–d). Only cloudless co-locations (i.e., with cloud fraction <5 %) are considered for the plots.
After having all the necessary co-location criteria determined, the validation of 1 full year of available satellite data is discussed in this section. Specifically, the TROPOMI TOC OFFL and NRTI products are validated via the statistical analysis of their comparisons to all the aforementioned GB instruments. Emphasis will be given to the quantification of biases, seasonal and/or spatial dependences, instrument mode and/or geometry dependences (SZA, scan mode, etc.), dependences on atmospheric conditions such as cloud parameters, effective temperature, and ground albedo. Finally, the TROPOMI TOCs will also be evaluated against the product requirements.
In Fig. 6, the time series of the monthly mean percentage differences of the two TROPOMI TOC products compared to Dobson and Brewer measurements from WOUDC (Fig. 6a, b and e), as well as to SAOZ instruments (Fig. 6c and d), are shown. In this figure and in those that follow in this section (unless stated otherwise) (i) the error bars represent the 1σ standard deviation of the mean differences; (ii) the red line represents the NRTI product, while the blue line stands for the OFFL comparisons; and (iii) the off-white and gray shaded areas represent the product requirements, which, as mentioned above, are 3.5 %–5 % for the mean bias of the differences. The two hemispheres are separately depicted in Fig. 6: the Northern Hemisphere (NH) comparisons are shown in the left column, while the Southern Hemisphere (SH) is shown in the right column. The mean bias spans between +0.3 % and +1.7 % in the NH and between −0.7 and +1.6 % in the SH. Comparing the two products to each other, the bias of the NRTI TOC product is about 0.7 % higher than that of the OFFL product, but it is well within the product requirements (3.5 %–5 %). This difference in the mean bias may be partially explained by the different cross sections used for the TOC retrievals by the two algorithms. The standard deviation of the TOC products comparisons in both hemispheres spans between 2.4 % and 4.6 %, but it should be noted that this percentage also includes the GB measurements' uncertainty. The peak-to-peak seasonal variation in the NH Brewer comparisons is about 1.5 % but increases to 3.5 % for the NH Dobson co-locations. The seasonality of the time series, as expected, is enhanced in the Dobson comparisons in both hemispheres due to the well-known GB measurements' bias dependency on effective temperature.
Overall, the consistency between the two products is very good, except for the deviation in the Dobson NH comparisons (Fig. 6a) during the months March–June 2018. This discrepancy was thoroughly investigated and it was seen that it is due to the contribution of the high-latitude Barrow GB station, USA, located at 71.3∘ N, 156.6∘ W, which is strongly affected by the difference in the albedo parameter used in the two products' retrieval, especially in the northern polar area (see Fig. 8). In the OFFL algorithm the effective albedo is fitted, whereas the current NRTI retrieval uses a climatology (Sect. 2.1). This issue will be extensively discussed in the following paragraphs.
The comparisons with SAOZ measurements (Fig. 6c, d) reveal a mean bias below +1.5 % for most of the year in both hemispheres, except for some pronounced larger differences in polar spring. Due to the high SZAs, high natural variability and poor temporal co-location underlying these differences (twilight SAOZ measurement versus early afternoon satellite overpass), pinpointing the exact cause of these features requires a more elaborate analysis, outside the scope of the current paper. The results are still within the product requirements.
Figure 6f shows the overall percentage differences of the Brewer comparisons in the form of frequency histograms. The distribution is normal for both products and a similar distribution was seen for the comparison with the Dobson and SAOZ measurements (not shown here). The overall bias of the percentage differences and its standard deviation for each GB instrument category is summarized in Table 2.
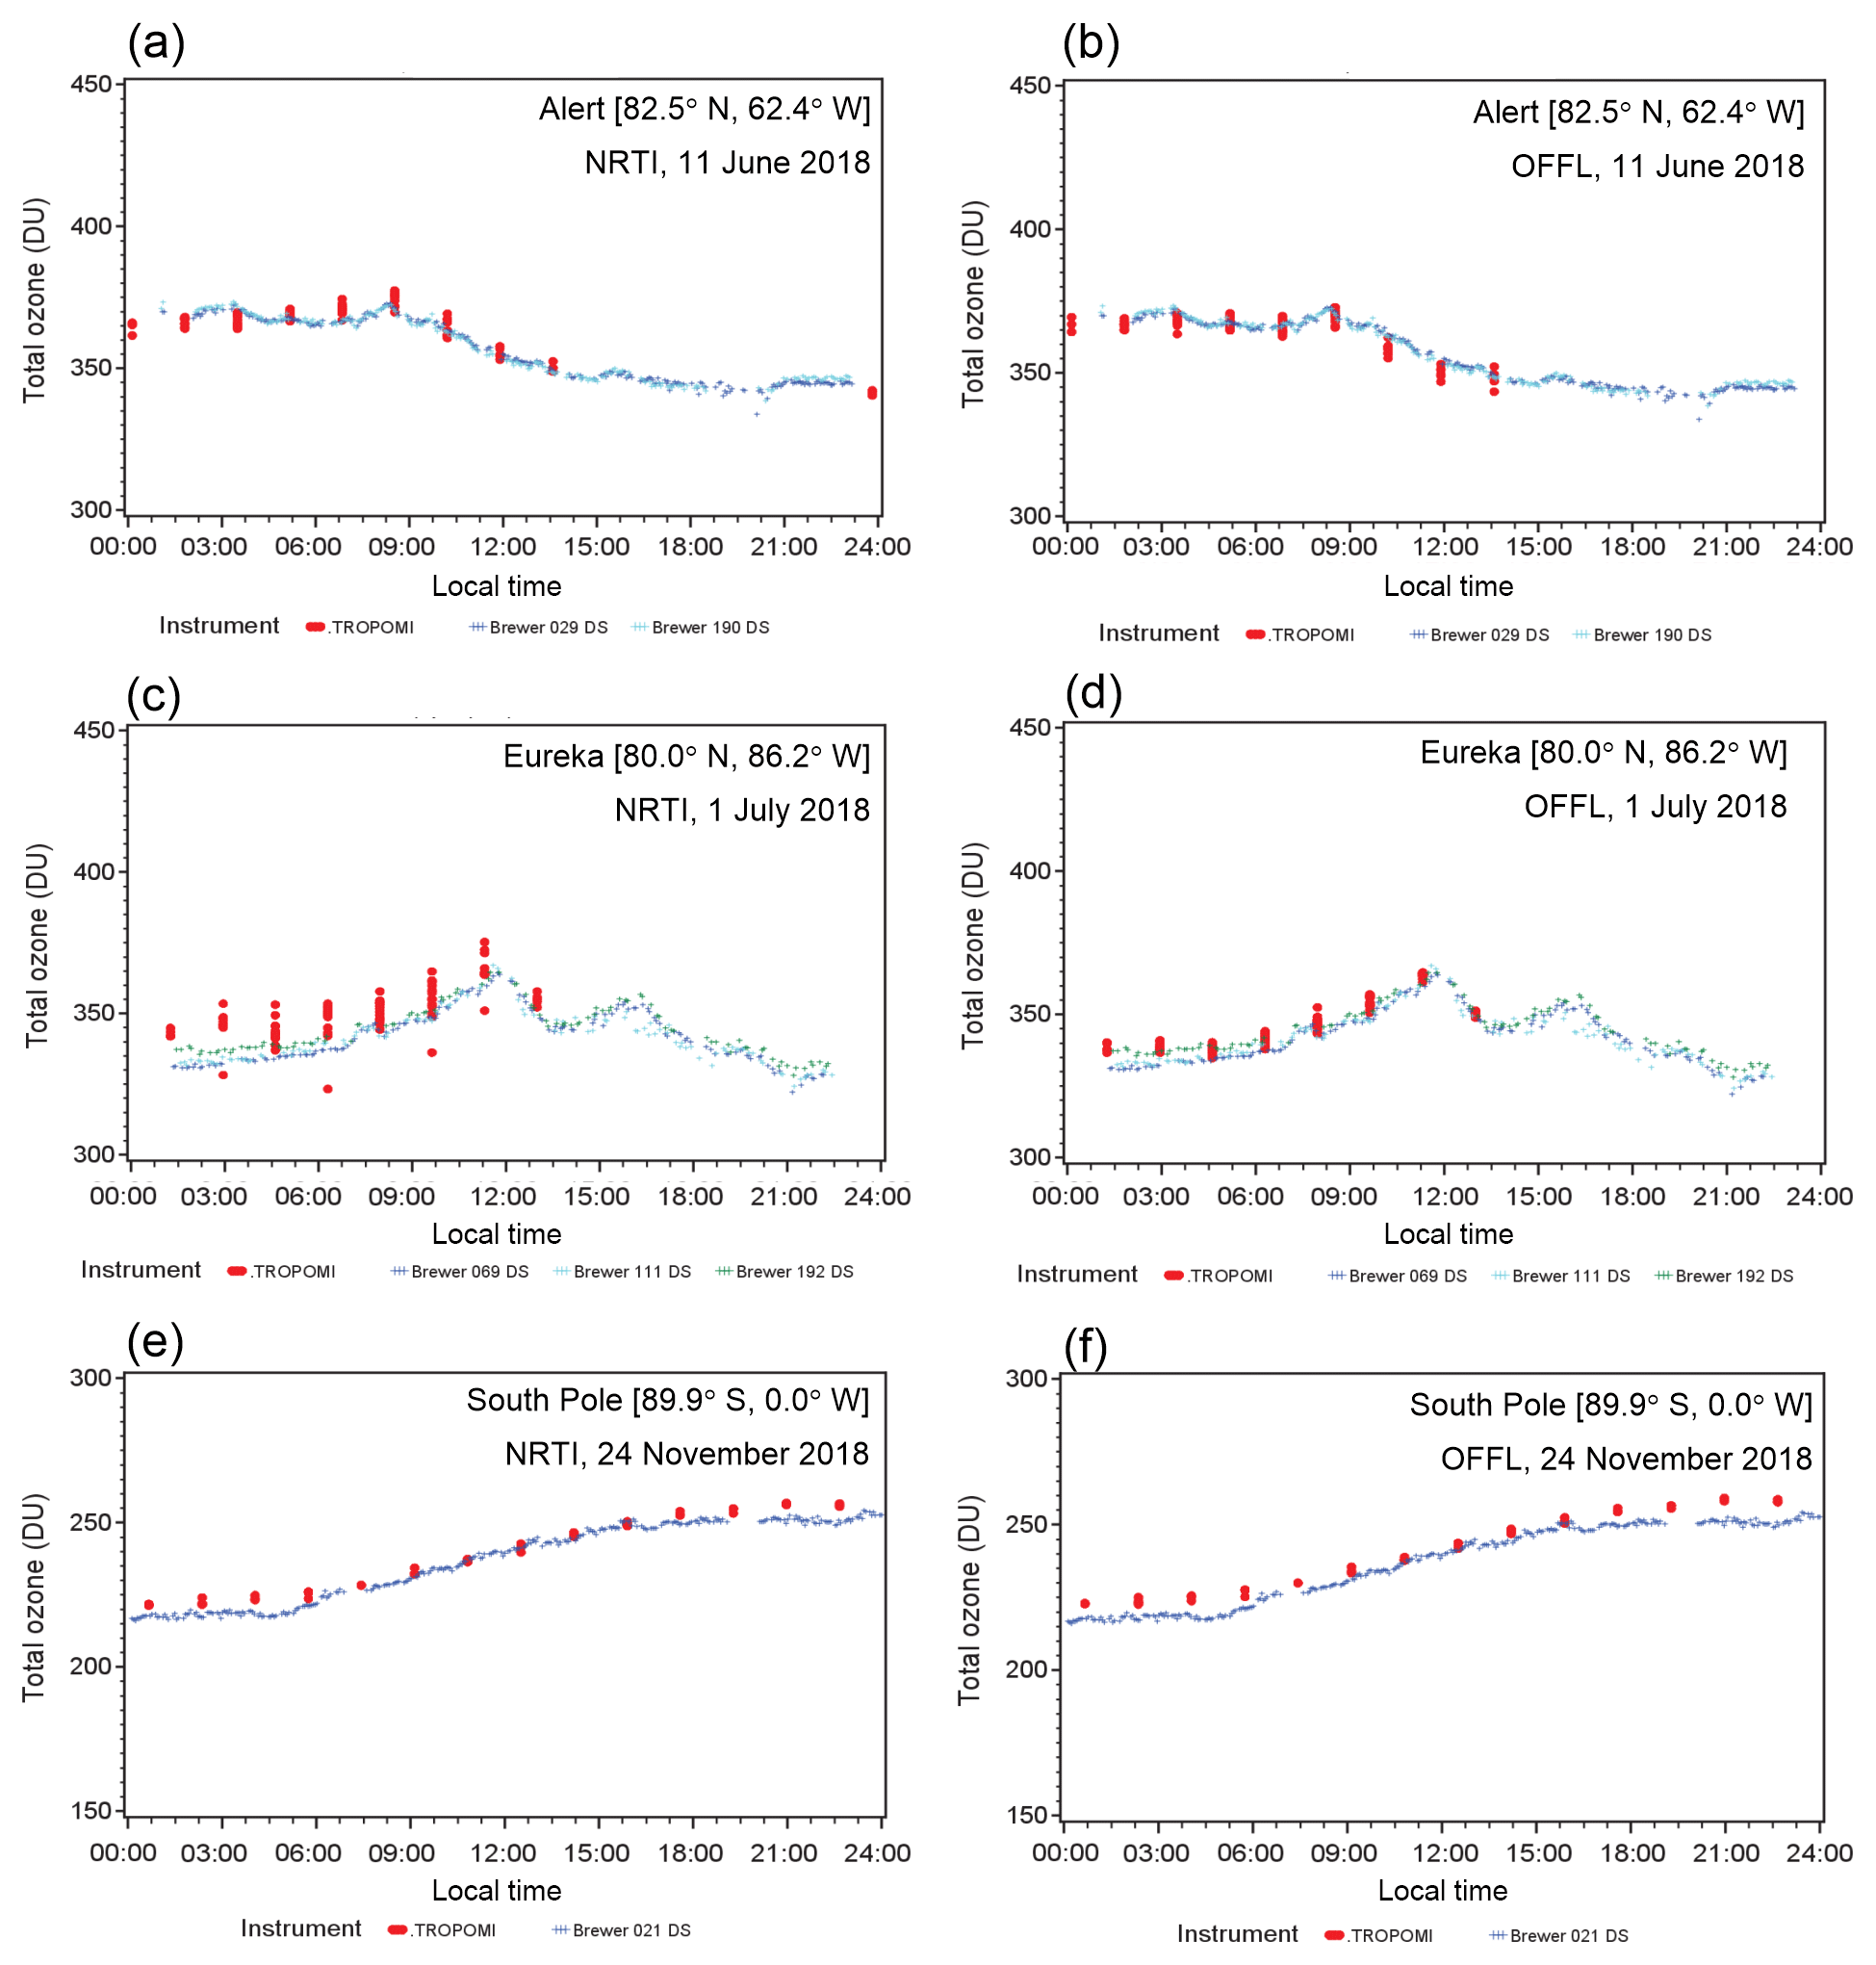
Figure 9The diurnal variation in the TOC (in DU) measured by TROPOMI (a, c, e) NRTI product and (b, d, f) OFFL product and Brewer spectrophotometers at three high-latitude northern and southern stations that are part of the Canadian Brewer Network. The maximum distance for the co-locations is 10 km.
Figure 7 shows the latitudinal dependency of the percentage differences for the two TROPOMI TOC products, binned in 10∘ latitude belts. In Fig. 7a Dobson GB measurements from WOUDC are used, while in Fig. 7b the respective Brewer comparisons are shown. Brewer GB measurements are also used in Fig. 7d, but in this case they are individual measurements from the Eubrewnet. Finally, in Fig. 7c the latitudinal statistics for the SAOZ comparisons are shown. In this figure only the temporally common co-location data series are used to ensure the comparability of the two curves. As before, the error bars represent the 1σ standard deviation of the means. The good consistency between the two operational TROPOMI TOC products is evident for all latitudes except for the Dobson comparisons in the 70–80∘ N belt, where they deviate by up to 6 %. As already mentioned, only one Dobson station provides co-locations for this latitude belt: the Barrow station, which is located in Alaska, USA, very close to the Beaufort Sea. For this particular station the mean percentage difference of the OFFL product is %, while the NRTI mean percentage difference goes up to %. It was also found (but not shown here) that taking the Barrow comparisons out of the data series results in a much better agreement between the NH time series of the two algorithms than that seen in Fig. 6a. After a detailed quality control (QC) of the GB station measurements, we concluded that the difference seen in Fig. 7a (70–80∘ N bin) is not due to the GB data. A further investigation using high-latitude Canadian Brewers showed that this deviation between the two algorithms occurs in almost all high-latitude stations in the Northern Hemisphere.
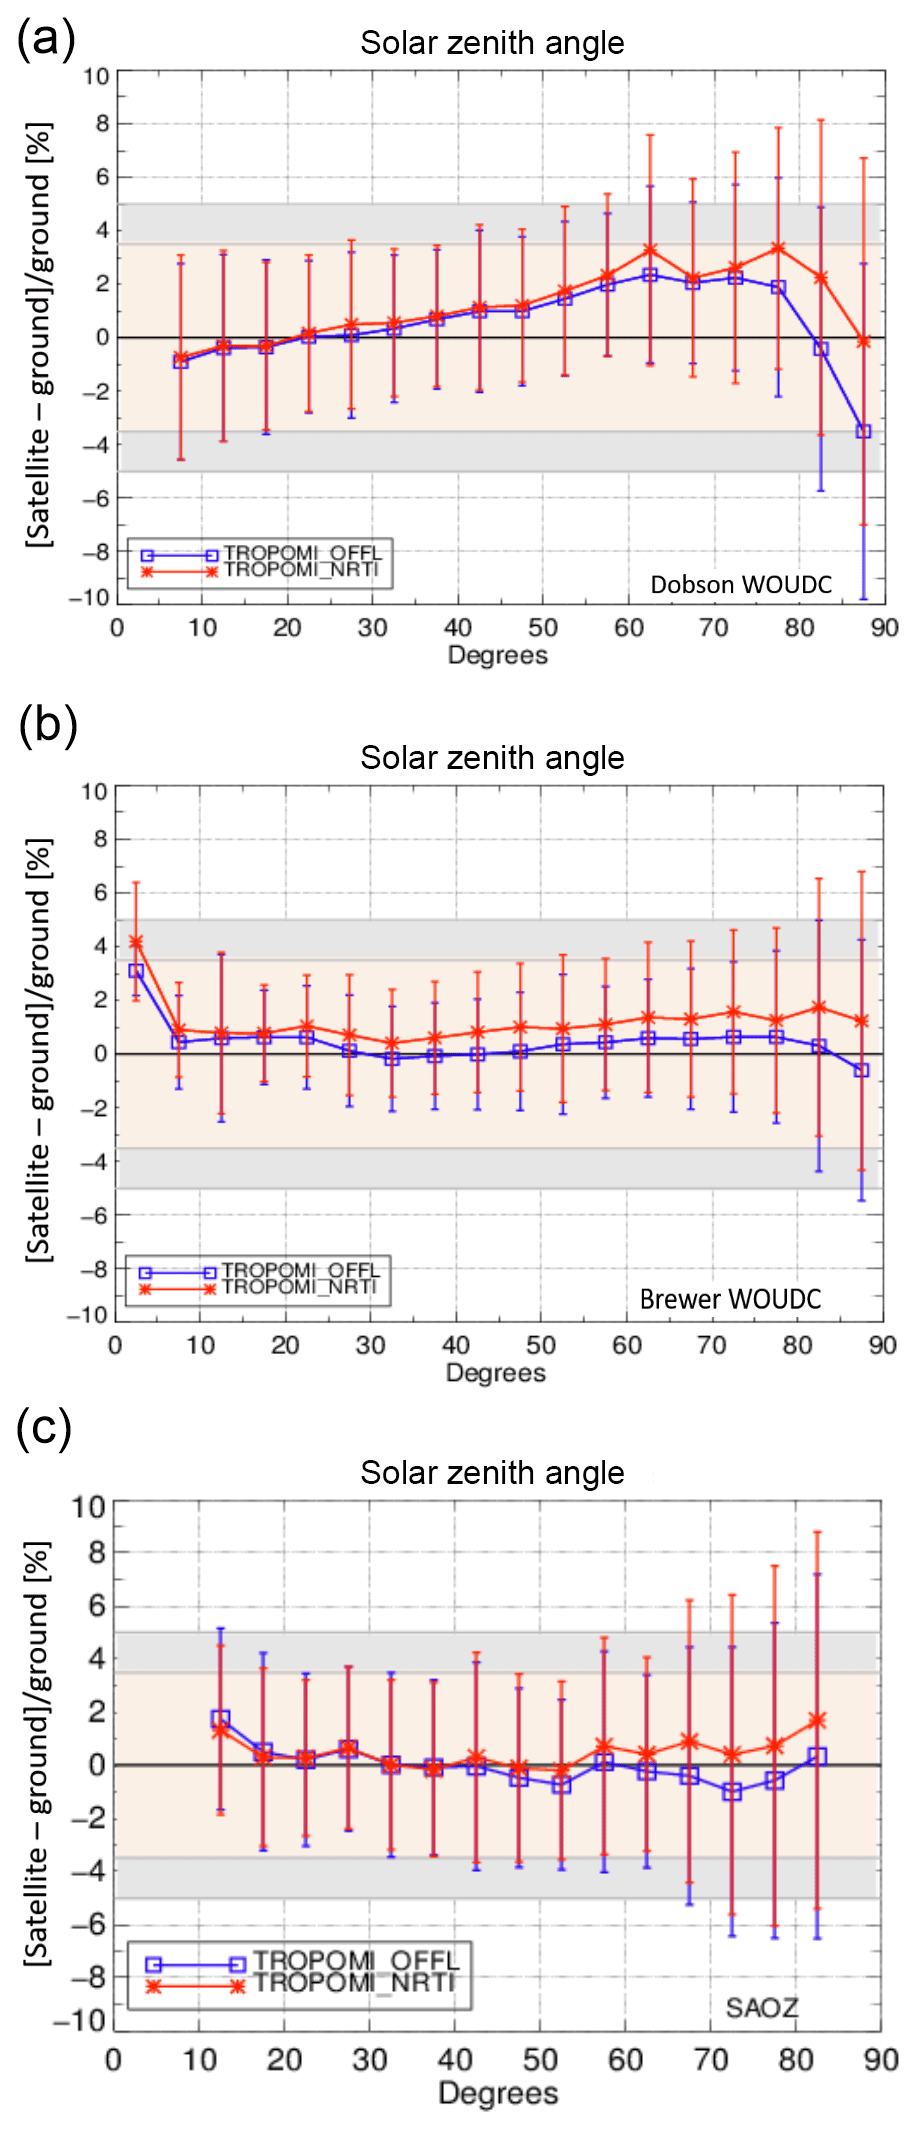
Figure 10The two TOC products of the TROPOMI sensor compared to GB Dobson (a), Brewer (b) and SAOZ (c) measurements versus the solar zenith angle of the satellite measurement (in degrees).
In Fig. 8, the albedo parameter used in each TOC product retrieval (the same color code is applied for NRTI and OFFL albedo) is plotted versus latitude, in 10∘ latitude bins, for four distinctive seasons (Fig. 8a: December–February; Fig. 8b: March–May; Fig. 8c: June–August; and Fig. 8d: September–November). It must be noted that in the NRTI algorithm a surface albedo climatology is used, while the OFFL algorithm uses a fitted effective albedo that is more realistic than a climatological one in case of a sudden or localized snow fall, for example, which is not necessarily present in the climatology. In these plots only cloudless co-locations (i.e., with cloud fraction <5 %) are considered to ensure the comparability between the surface and the effective albedo. The absolute difference between the two albedo variables is most cases stable and equal to about 0.1, indicating a very similar albedo climatology for the two products in the respective midlatitude bins. Nevertheless, there are two exceptions: (a) the SH latitude bin 60–70∘ S in the spring and autumn plots, where three Dobson stations are located near the Antarctic coast and (b) the latitude bin 70–80∘ N in the spring and summer plots. The albedo near the Antarctic coast is quite variable during spring and autumn, and the absolute difference in albedos used in the OFFL and NRTI TOC retrievals can be up to 0.3. For the high northern latitudes during spring and summer, the absolute difference in the albedos used in the two algorithms goes up to 0.8. The latter results in the strong deviation between the two products' TOCs for the respective time period and latitude belt (as seen in Figs. 6a and 7a). Therefore, it is obvious that the effective albedo used in the OFFL algorithm, which is closer to the real climatology of the time period under study, leads to a more realistic TOC product in northern high latitudes.

Figure 11The dependency of the percentage differences of the two TOC products on cloud top pressure (a) and cloud base height (b).
As for the TROPOMI NRTI algorithm, Inness et al. (2019) found a similar deviation when comparing its TOC (v1.0.0) data with the data assimilation system of the Copernicus Atmosphere Monitoring Service (CAMS). The larger bias at higher latitudes is caused by the use of the surface albedo climatology, as shown by Loyola et al. (2019b). The current operational NRTI algorithm uses a monthly surface albedo climatology from OMI (Kleipool et al., 2008), but this climatology is no longer representative of the actual snow and ice surface conditions. For example, the OMI climatology does not show snow and ice in the latitudes larger than 60∘ N during April, but in 2018 this region was covered by snow, hence wrong surface albedo causes an error that propagates into the AMF calculation and thus the TOC. The next version of the total ozone NRTI algorithm will use a novel albedo retrieval algorithm that solves this problem, as presented by Loyola et al. (2019b).
The latitudinal statistics (i.e., the statistics that come from the binning of the percentage differences of the co-locations in 10∘ latitude bins) of the comparisons seen in Fig. 7 are summarized in Table 2 and show that the mean bias, ranging between −0.3 % and +1.5 %, is well within the product requirements, with no systematic deviations between the two products, except for at northern high latitudes. The mean standard deviation of the mean differences calculated for each latitude bin is also within the product requirements in most comparisons, taking into account the GB instruments' uncertainty. Indeed, the Mexico City, Mexico, (19.33∘ N, −99.18∘ E) and Fairbanks, USA, (64.5∘ N, −147.89∘ E) stations, both equipped with Dobson spectrometers, are the main reason for the high standard deviation of the 10–20∘ N and the 60–70∘ N bins seen in Fig. 7a. In the respective plot with Brewer comparisons (Fig. 7b), the high standard deviation in the 60–70∘ N belts is caused by the Vindeln, Sweden, ground-based data (64.25∘ N, 19.77∘ E), which has a high standard deviation, associated in the comparisons to the satellite TOCs. As for the SAOZ mean percentage differences, the somewhat higher standard deviation of its comparisons is mainly due to remaining co-location mismatch (especially temporal) and the relatively large weight of high-latitude stations in the network, where large SZAs, varying ground albedo and a very variable ozone field conspire to complicate the comparisons. Therefore, the high values of the standard deviation seen in Table 2 should not be entirely attributed to the TOC products' variability.
Since individual measurements of TOC are also available for this work, the diurnal variation in the TOC (in DU) as it is recorded by TROPOMI (red dots) and six Brewer spectrophotometers (blue-green crosses) located at three Canadian Brewer Network stations, is presented in Fig. 9. In the left column (Fig. 9a, c and e) the TROPOMI NRTI product is displayed, while in the right column (Fig. 9b, d and f) the OFFL product is used. In Fig. 9a and b the GB measurements are recorded on 11 June 2018, from two Brewers located at Alert station, Canada. In Fig. 9c and d the measurements of 1 July 2018 performed by three Brewers at the station of Eureka (also in Canada) are displayed, and in Fig. 9e and f the measurements from the South Pole (Amundsen-Scott) station, which is equipped with one Brewer, recorded on 24 November 2018, are shown. The satellite data are characterized by the interesting feature of the multiple orbits per day in these high-latitude stations and the diurnal variation in the TOC is nicely depicted by both types of instruments, satellite and Brewer. The increased scatter of the TROPOMI NRTI data for each orbit near Eureka station might be explained by the less uniform terrain in this station, compared to the other two stations. This particular figure is an added value to this validation effort, since it confirms the quality, the credibility and the sensitivity of both TROPOMI TOC products.
Table 2Statistical analysis of the overall (global) and the latitudinal mean bias and mean standard deviation of the NRTI and the OFFL TOC products.
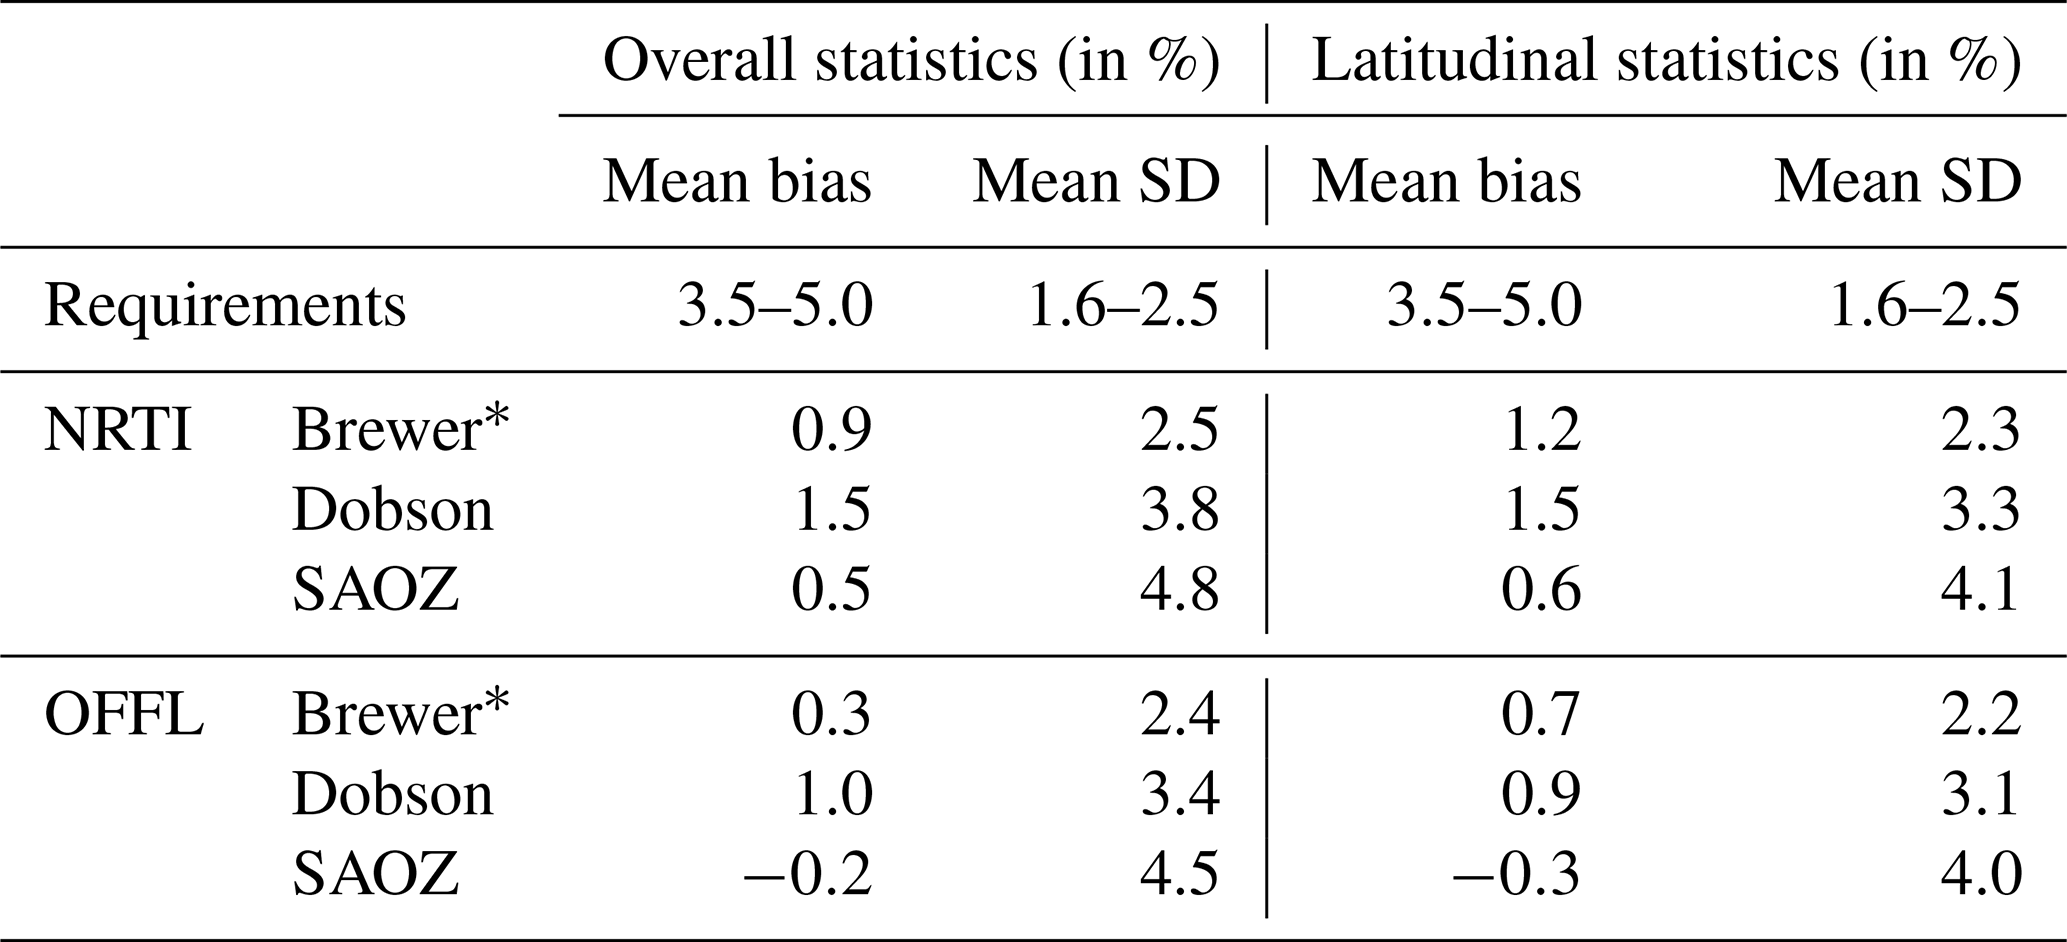
∗ NH co-locations only.
As mentioned above, the dependence of the comparisons on various influence quantities was thoroughly inspected, and some indicative features will be presented in the following figures. Figure 10 shows the dependency of the percentage differences on satellite measurement SZA. In Fig. 10a the Dobson comparisons are displayed, in Fig. 10b only the Brewer comparisons coming from the NH co-locations are used (both Dobson and Brewer from WOUDC) and in Fig. 10c SAOZ measurements are the GB truth. For these comparisons the percentage differences of the co-locations are temporally common for the two data series (NRTI and OFFL) and binned in 5∘ bins of SZA. The excellent consistency between the two different TOC products is obvious, especially for SZAs less than 70∘. The difference of the algorithms and the mean bias of each product is more evident in the Brewer comparisons in Fig. 10b, which show almost no dependency on SZA. The about +3.5 % bias seen in panel Fig. 10b for SZAs less than 5∘ is due to the very limited number of available measurements in that bin. The influence of the SZA on the differences between TROPOMI and the Dobson and SAOZ measurements can be mainly attributed to the GB measurements themselves. The stronger dependency on SZA for the Dobson measurements is extensively discussed in Garane et al. (2018) and attributed to the impact of the effective temperature variability on the GB measurements. The SAOZ measurements are unaffected by variations in SZA or effective temperature, thus Fig. 10 confirms that the satellite data bias depends little on SZA (<2 %), even up to very high angles. The standard deviation of the differences increases towards large SZAs for all types of GB measurements.
The effect of cloudiness, which is an important input parameter to the TROPOMI TOC algorithms, on the comparisons is seen in Fig. 11. It is clear that the two products are not affected by the cloud top pressure (hPa, Fig. 11a) or the cloud base height (km, Fig. 11b), especially for the bins with a high number of co-locations (cloud top pressure >200 hPa and cloud base height <12 km). No dependency on other cloud-related quantities, such as cloud fraction, cloud optical thickness (available in NRTI TOC product only), etc., was found and no unexpected effect of other input parameters (such as total air mass factor), fitting statistics or measurement constants (like the CCD pixel of the sensor) was seen. The effective temperature is the only exception in the generally very smooth picture, which when lower than 210 K or higher than 250 K causes biases of up to ±4 %, especially in the Dobson comparisons where it has a stronger effect, as described in Koukouli et al. (2016).

Figure 12The time series of the percentage differences between TROPOMI OFFL and OMPS (processed with the GODFIT v4 algorithm) TOC versus Dobson (a: NH; b: SH) and Brewer (c: NH) GB measurements from WOUDC. The blue line shows the TROPOMI OFFL TOC comparisons and the red line depicts the OMPS comparisons to co-located GB measurements. The time series of the three sensors refer to the same temporal range.
Finally, in Table 2 the overall global statistics, as well as the latitudinal statistics for the two TOC products and their comparisons to Dobson, Brewer and SAOZ GB measurements, are summarized. The mean bias of each dataset is listed in this table, along with the mean standard deviation, which is the mean of the standard deviations of the (global or latitudinal) means. In all comparisons seen here the mean bias of the two products is far below the requirements, not exceeding +1.5 %. The mean standard deviation exceeds the 2.5 % limit for the Dobson and SAOZ comparisons, which can be partially attributed to the GB measurements and their sensitivity to various quantities, such as the effective temperature for the Dobsons and their overall uncertainty budget (including co-location mismatch).
In this section, the same comparison to the WOUDC GB measurements is applied to the TOC observations from OMPS and GOME2A and GOME2B, to further assess the quality of the TROPOMI TOC products with respect to other sensors. In Sect. 4.1 the OFFL TOC product from TROPOMI is compared to the OMPS/SUOMI-NPP TOC that is processed with the ESA Ozone CCI GODFIT v4 algorithm, while in Sect. 4.2 the NRTI TOC product is compared to GOME2/Metop-A and Metop-B TOCs that were produced with the EUMETSAT ACSAF GDP 4.8 algorithm. Hence, as discussed in Sect. 2.1, the algorithms used in these sections are the same (in the OFFL to GODFIT v4 comparision) or highly comparable (in the NRTI to GDP 4.8 comparison). In Sect. 4.3 the TROPOMI TOCs are directly compared to the other sensors to overcome the geographical limitations of their comparison to GB measurements.
The aim of this part of the work is to show that the quality of the TROPOMI TOC products is comparable to other well-established spaceborne instruments.
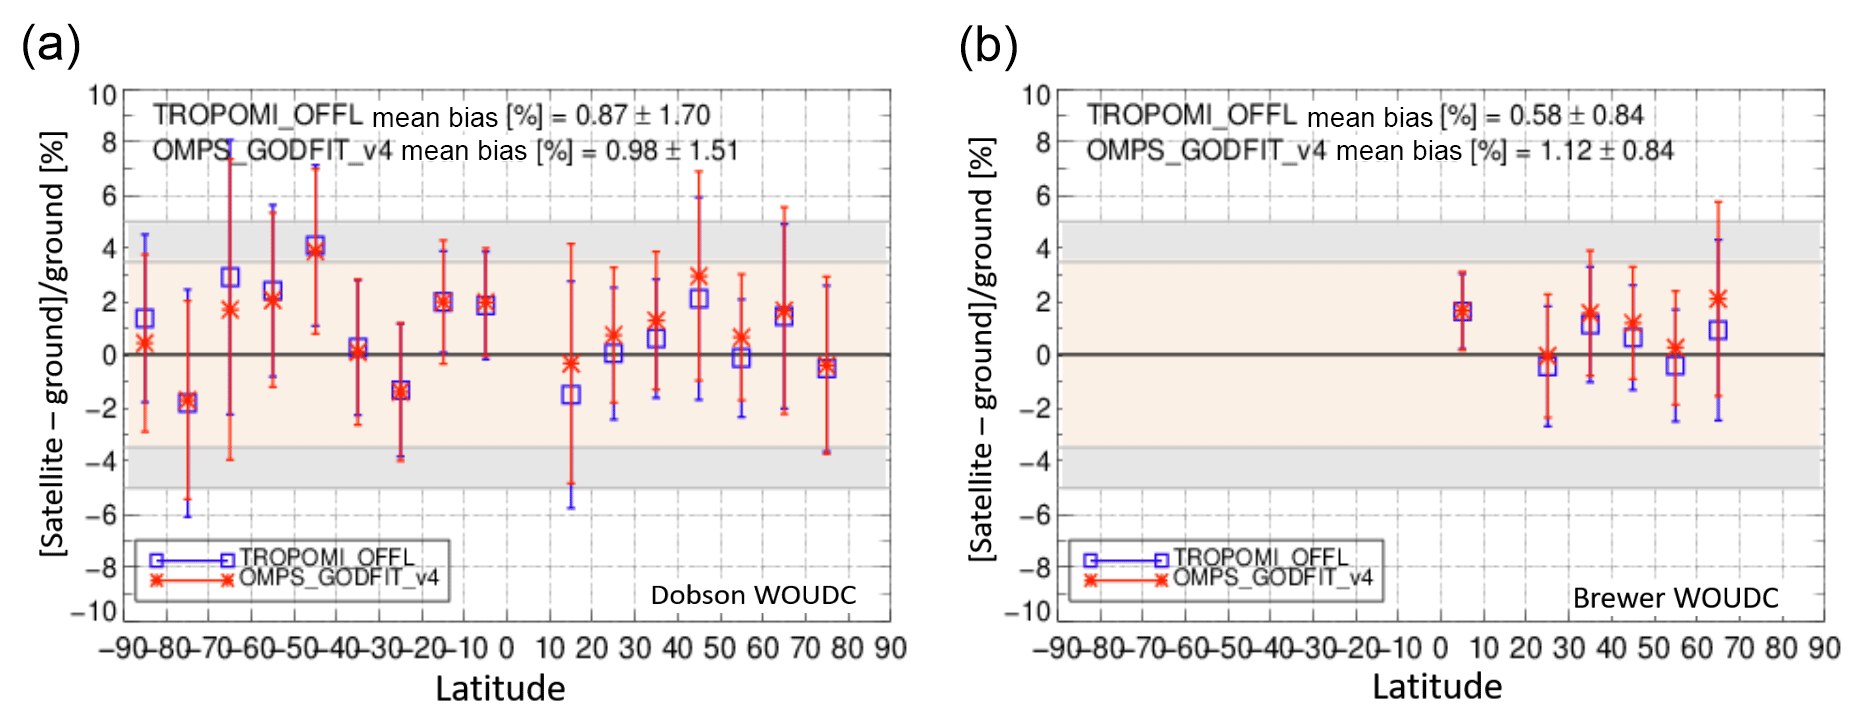
Figure 13The latitudinal dependency of the percentage differences between the two satellite sensors' TOC (TROPOMI OFFL and OMPS), processed with the GODFIT v4 algorithm, and Dobson (a) and Brewer (b) GB measurements from WOUDC. The symbol colors are the same as in Fig. 12.
4.1 The OFFL TROPOMI TOC product compared to OMPS TOC processed with GODFIT v4
In the two following figures (Figs. 12 and 13) the TROPOMI OFFL TOC is compared to temporally common OMPS/NPP TOC measurements using the Brewer and Dobson spectrophotometer co-locations as reference. The blue and red lines represent the TROPOMI OFFL and OMPS GODFIT v4 TOC comparisons to GB measurements, respectively. Figure 12 shows the monthly mean time series of the percentage differences between the two sensors and the co-located GB measurements for the same temporal range. Figure 12a and b show the Northern Hemisphere and Southern Hemisphere comparisons to WOUDC Dobson GB measurements, whereas in Fig. 12c the Northern Hemisphere WOUDC Brewer comparisons are shown. The inter-sensor consistency is highly satisfying in terms of pattern. The enhanced annual variability for the Dobson comparisons is obvious here as well as in Fig. 6. The difference in the overall mean bias between TROPOMI and OMPS is less than 0.7 % for the NH, while in the SH the two sensors are almost identical. As for the mean standard deviation, TROPOMI has, in all cases, a lower variability in comparison to OMPS, which is within the product requirements, especially in the NH. One more interesting feature seen in Fig. 12a and c, is that for the NH comparisons the deviation between TROPOMI and OMPS seems to have a seasonality depending on the GB instrument type: for the Dobson comparisons the deviation is smaller in the summer months (June–August) and for the Brewer the same is true in winter months (November–February). Nevertheless, since we have only 1 year of available data, no solid conclusions about seasonality in the differences can be drawn.
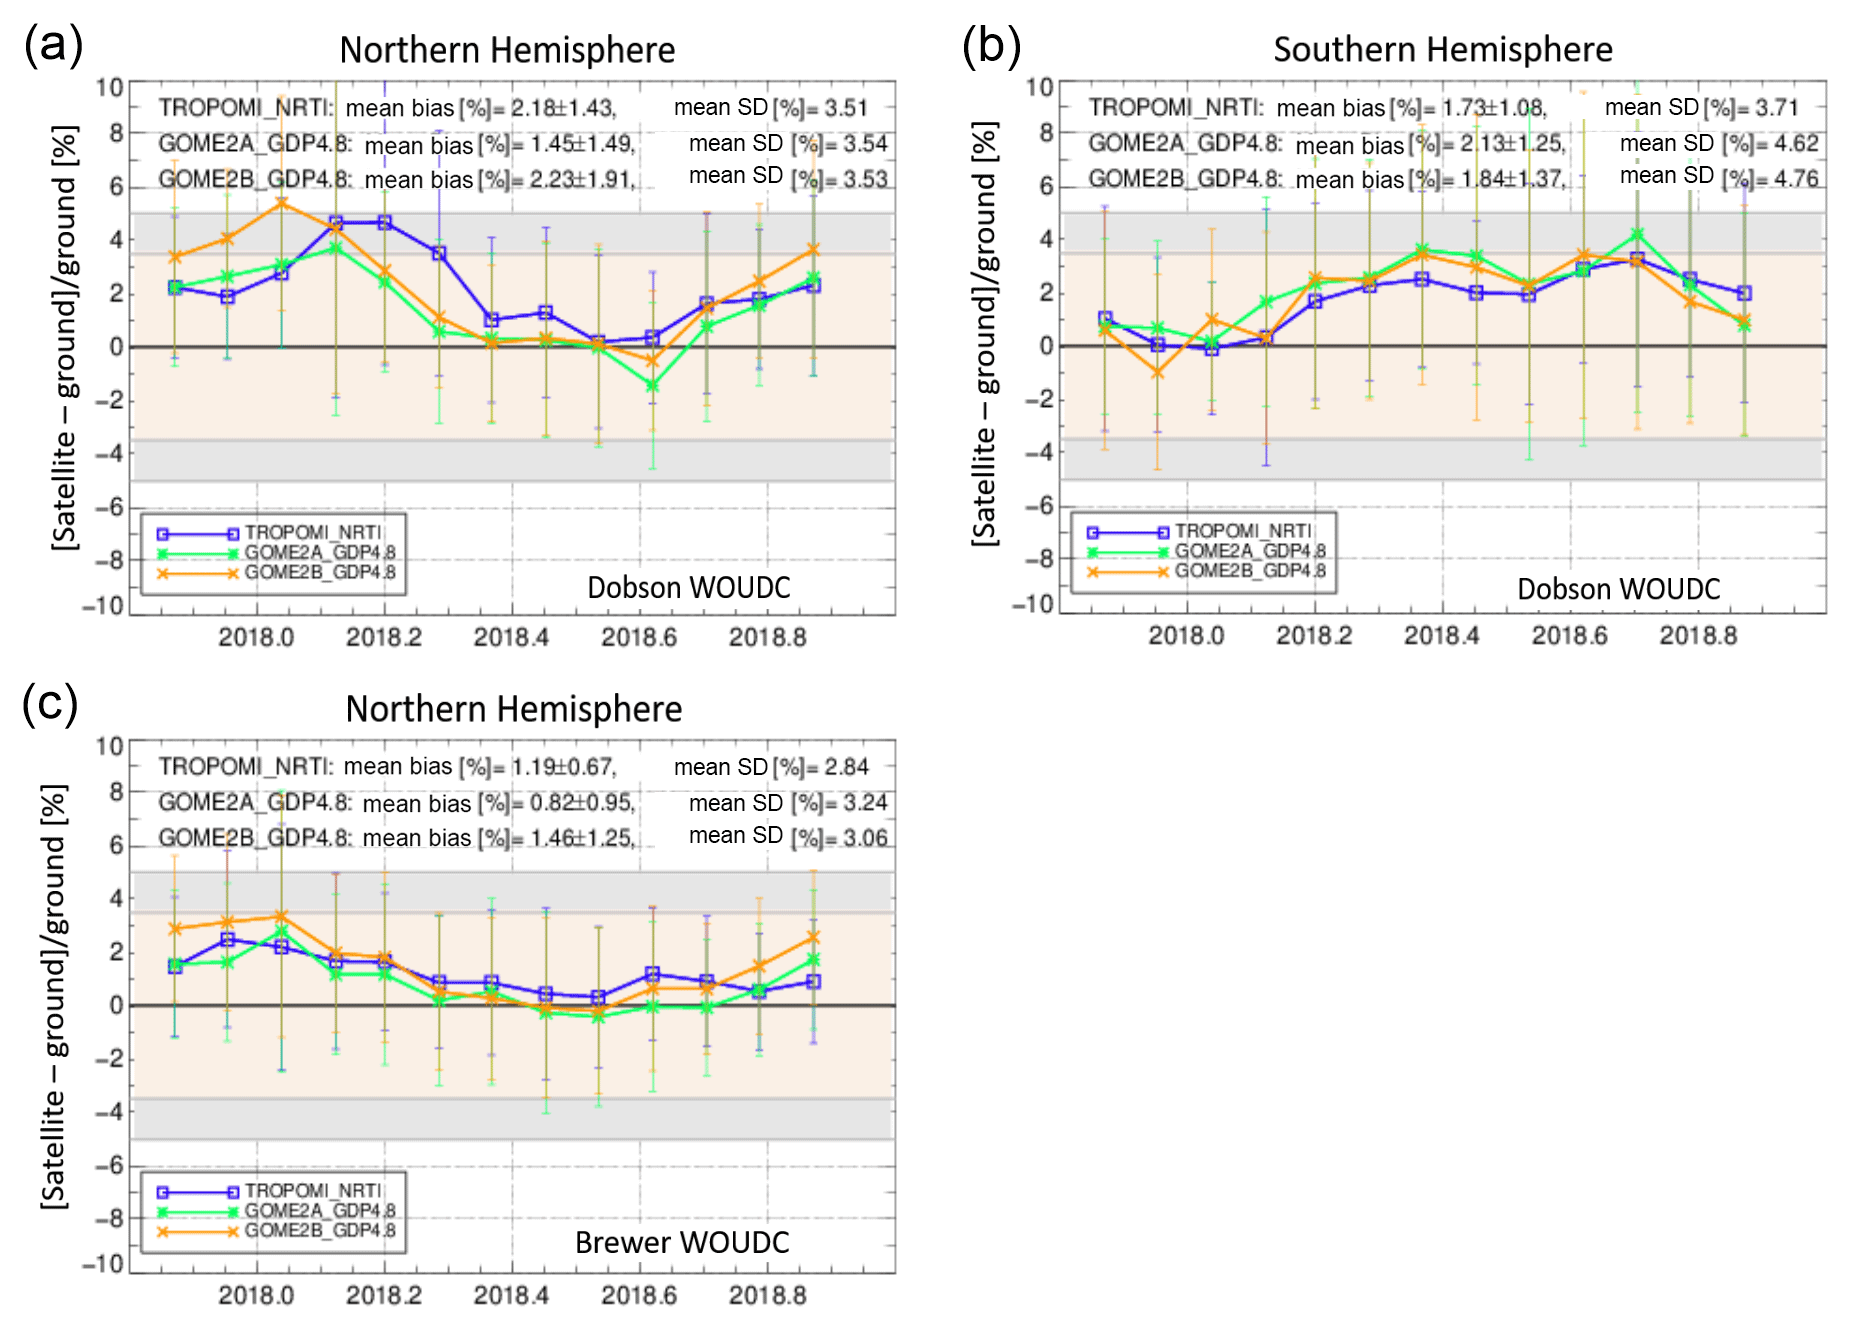
Figure 14As in Fig. 12 but for the time series of the percentage differences between TROPOMI NRTI (blue line), GOME2A (green line) and GOME2B (orange line); the latter two are processed with the GDP 4.8 algorithm.
Figure 13 shows the same temporally common co-locations for the two sensors but as a function of latitude. The comparisons to Dobson GB measurements and to Brewer GB measurements are shown in Fig. 13a and b, respectively. The latitudinal dependency is nearly the same for both sensors, which proves the good quality of the TROPOMI OFFL TOC measurements at all measurement sites, since the TOC from the OMPS instrument was repeatedly validated during its operational period. The inter-sensor consistency is very good in the midlatitudes of both hemispheres and in the NH high latitudes. This is likely because of (i) the higher number of stations (therefore co-locations) in these areas and (ii) the less variable atmospheric conditions in this part of the globe. Finally, in the NH, especially above 30∘ N, the TROPOMI OFFL TOC measurements are lower than those of the OMPS by 0.5 %–1 %, depending on the GB instrument type, which is a minor difference.
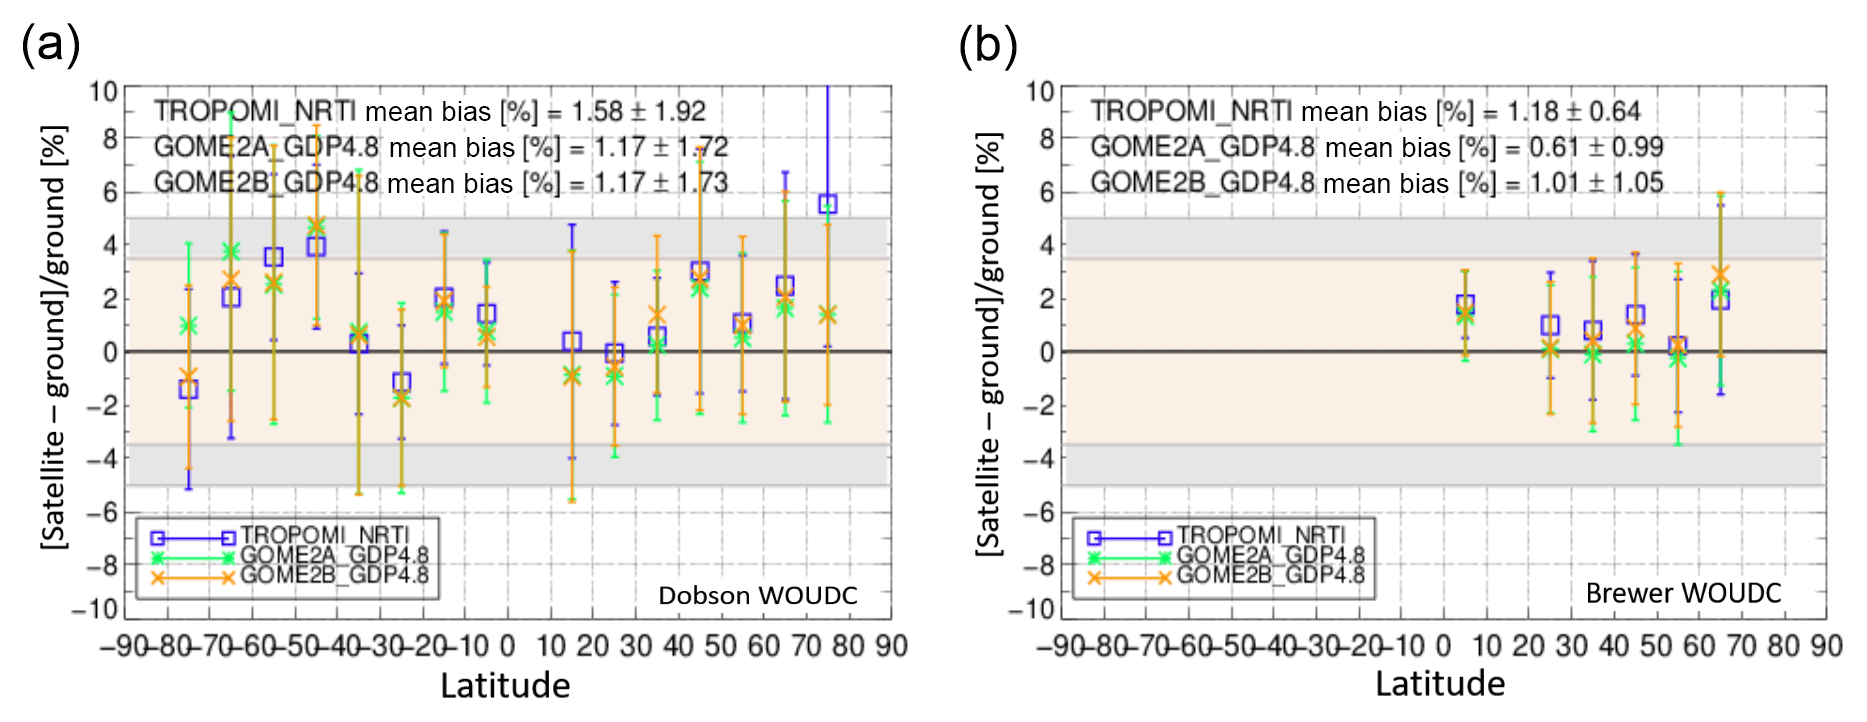
Figure 15As in Fig. 13 but for the TROPOMI NRTI (blue line), GOME2a (green line) and GOME 2b (orange line) comparisons.
4.2 The NRTI TROPOMI product compared to GOME2/Metop-A and GOME2/Metop-B TOC processed with GDP 4.8
In line with the previous section, the inter-sensor consistency between the TROPOMI NRTI TOC and the GOME2/Metop-A and Metop-B (hereafter referred to as GOME2A and GOME2B) TOCs processed with the GDP 4.8 algorithm, is examined. The latter sensors were previously successfully validated and their validation report is published in Koukouli et al. (2015b). In the following figures the comparisons of the sensors to GB data are symbolized with a blue line for TROPOMI, green line for the GOME2A and orange line for the GOME2B percentage differences. Figures 14 and 15 show the time series and the latitudinal dependency of the comparisons, for the same temporal range and for common co-locations only, in accordance with the previous section.
In Fig. 14a, a quite different behavior is seen between TROPOMI and the other two sensors when compared to Dobson measurements in the NH. This can be attributed to the high overestimation of the NRTI TOC coming from the 70–80∘ N latitude bin that was previously discussed in Sect. 3. In the latitudinal dependency of the comparisons, seen in Fig. 15, a very good agreement between the three sensors is obvious in the NH, with deviations of up to ±1 %. The only exception is the highest latitude bin of the Dobson comparisons, as also seen in Fig. 7a. One would expect that since the NRTI product calculation is based on the GDP 4.x algorithm, the differences between the three sensors should be minor. However, the two algorithms (GDP 4.8 and NRTI) are different in some aspects, such as the surface albedo climatology used for the TOC retrievals, which is the main reason for the deviations discussed above. The other important updates are briefly discussed in Sect. 2.1.1 and are summarized in Table 3. Furthermore, it was found that the deviation between the two algorithms in this particular latitude bin is almost eliminated when TROPOMI data acquired during the commissioning phase of its operation are excluded from the dataset (not shown here). This is in line with the work of Inness et al. (2019) that detected enhanced discrepancies between TROPOMI NRTI TOC and other sensors in the high northern latitudes for this particular time period, when a lot of in-flight calibration and testing took place. Unfortunately, the 6 % difference between the NRTI and OFFL products in this area (Fig. 7a) is only reduced to 5 % when the same temporal restriction is applied.
Table 3Summary of the main differences between the TROPOMI NRTI and GOME2 GDP4.8 algorithm.
The inter-sensor consistency is very good for the time series of the Brewer and the SH Dobson comparisons (Fig. 14c, b). The difference in the three sensors' mean bias is about ±0.7 % in both hemispheres and for both types of GB instruments. For the TROPOMI NRTI TOC product, the mean standard deviation of the comparisons is in all cases lower than that of the other two sensors used in this validation exercise, proving its good quality and its stability during this first year of operation. The seasonality pattern, already thoroughly discussed above, is evident here as well, mainly for the Dobson comparisons.
Table 4The statistical analysis of the differences in percent between the two TROPOMI TOC products and the respective sensors to which they were compared to, as discussed in Sect. 4.1 and 4.2.
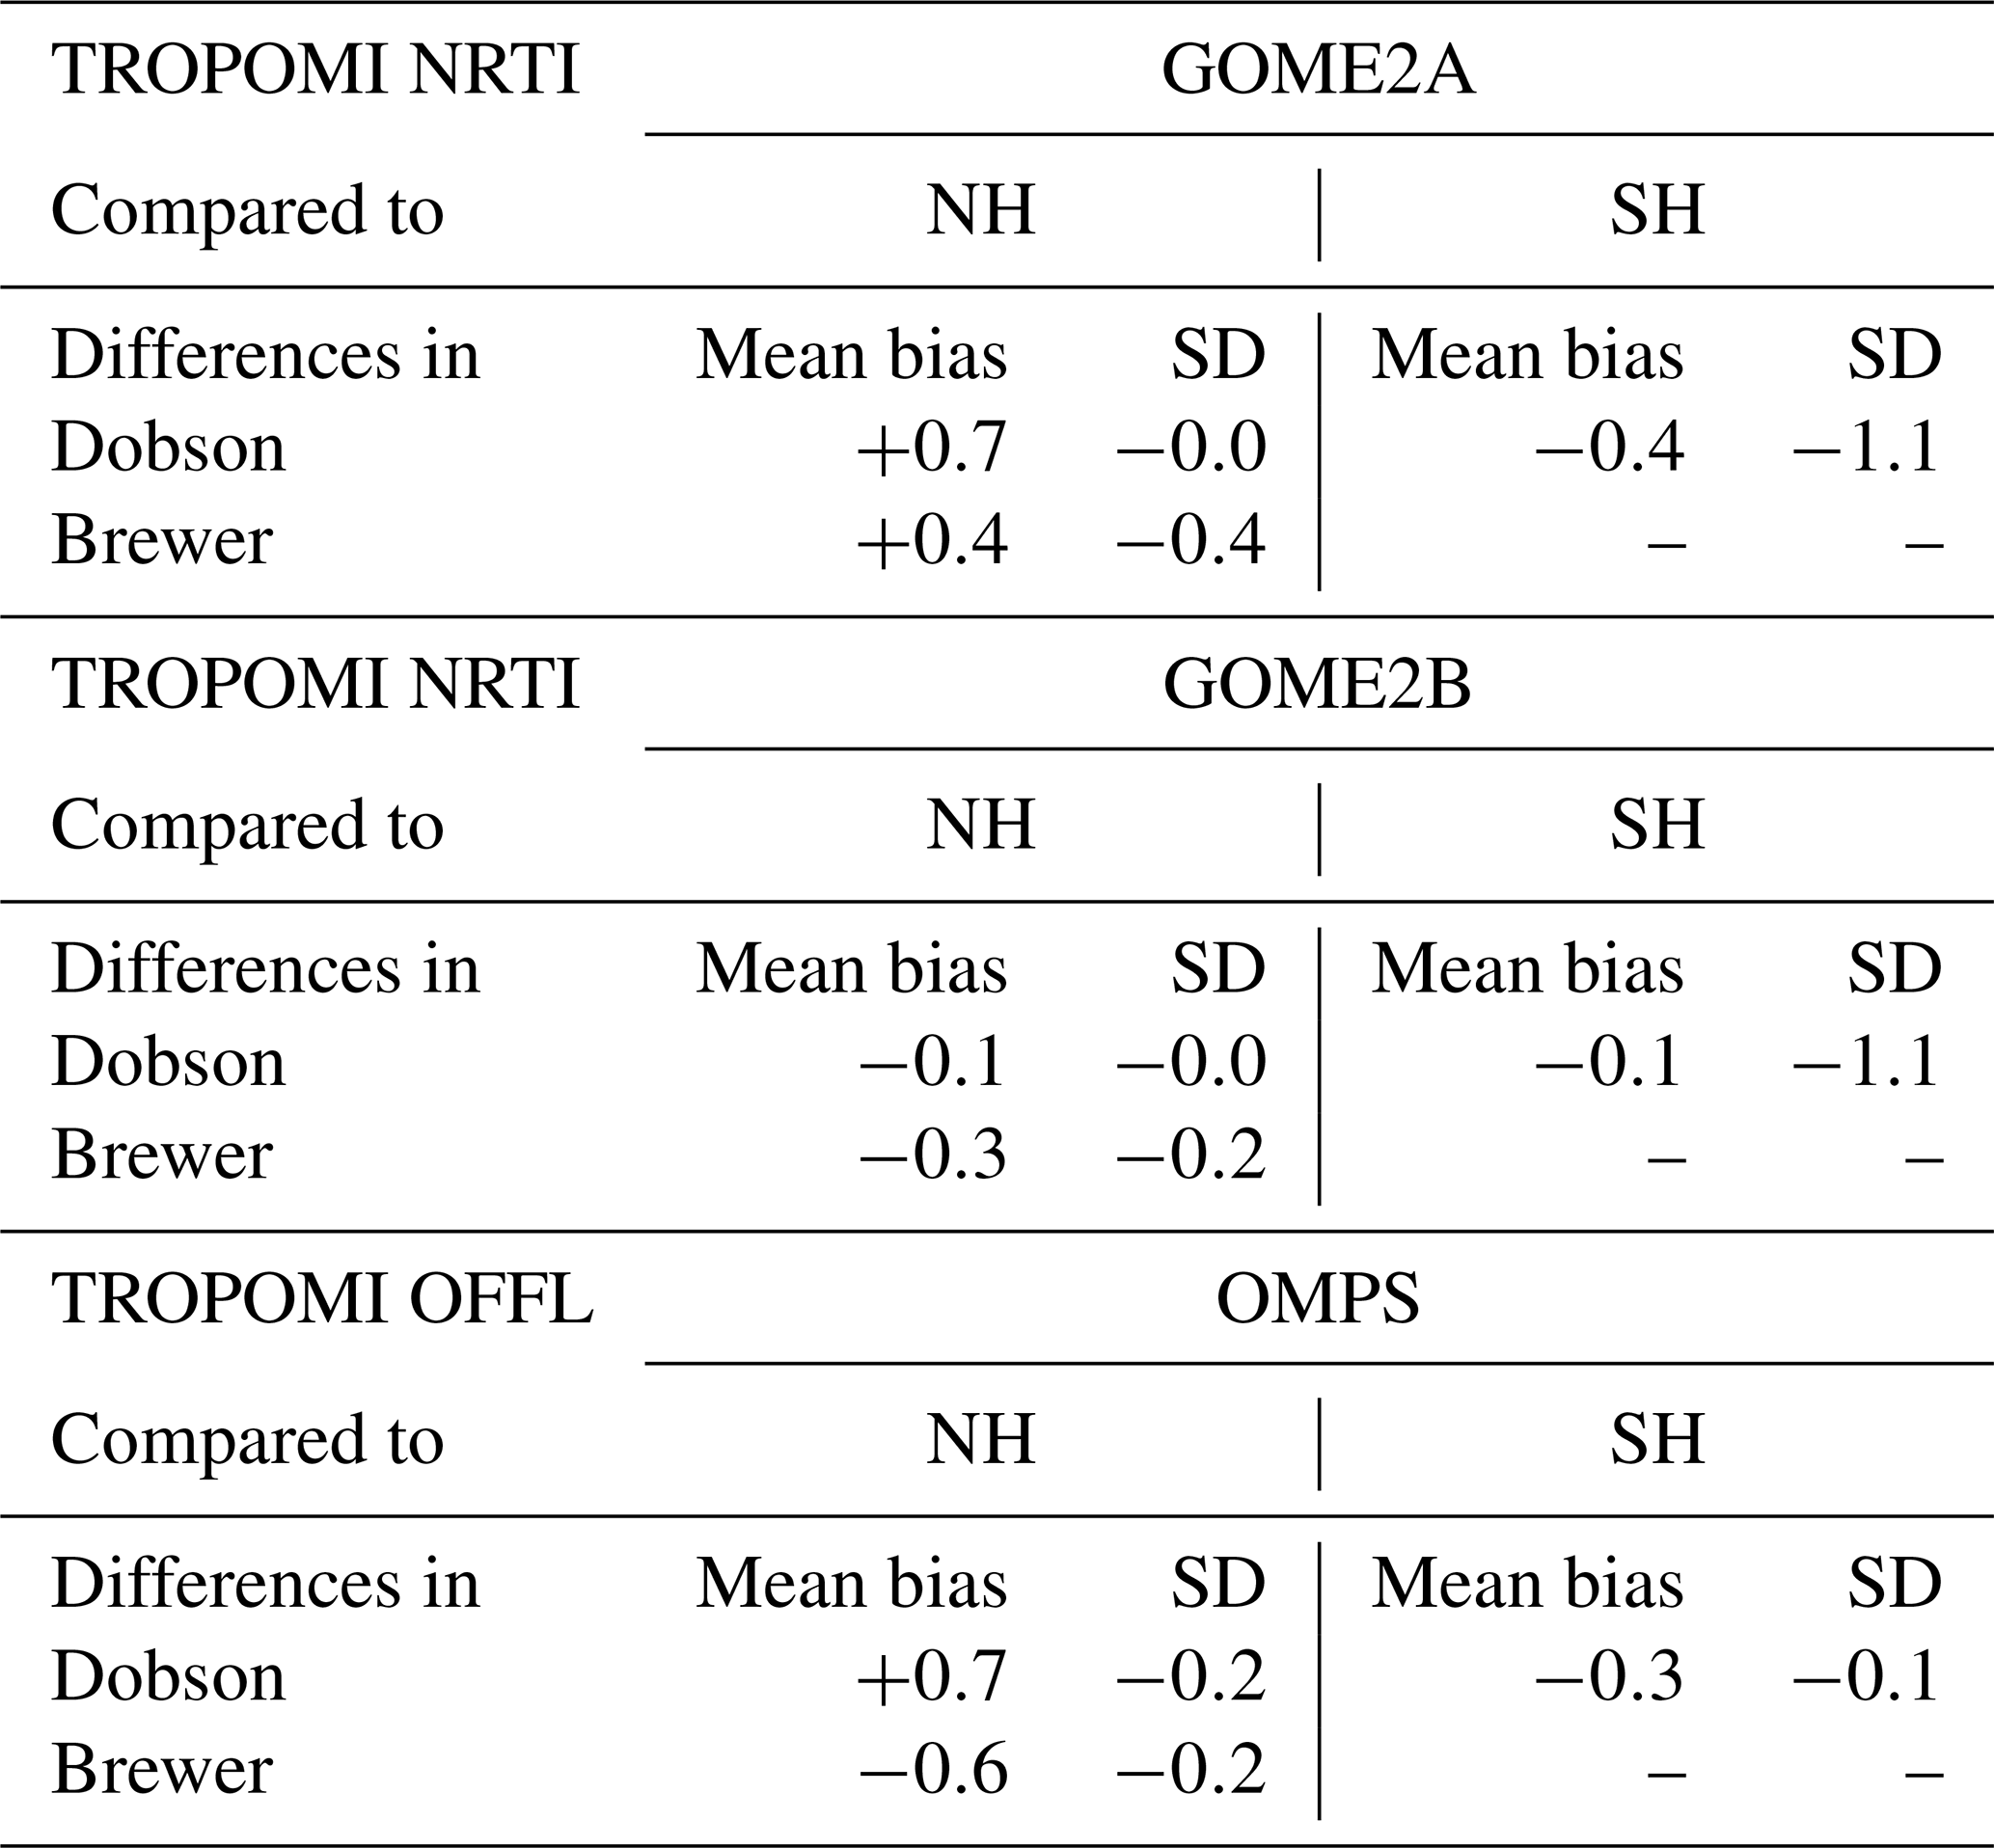
To summarize the results of Sect. 4.1 and 4.2, the statistical analysis of the comparisons between the four sensors (TROPOMI, OMPS, GOME2A and GOME2B) are shown in Table 4, where the differences of the mean bias between TROPOMI and GOME2A, GOME2B, or OMPS are shown along with the differences in mean standard deviation for each pair of sensors.
4.3 Direct satellite-to-satellite comparison
In this section we briefly present direct global TOC comparisons between TROPOMI and other UV–VIS sensors to directly exploit the global extent of the satellite-to-satellite comparisons, something not possible using only the GB measurements, due to their limited geographical coverage, especially in regions like the poles. The comparisons shown below are against the following sensors, already presented in the previous sections: (i) the NRTI TOC product will be compared to GOME2A and GOME2B processed with the GDP 4.8 algorithm and (ii) the OFFL TOC will be compared to OMPS processed with the GODFIT v4, as before. Additionally, since the GOME2A and GOME2B sensors are the European predecessors of TROPOMI, the OFFL TOC will be also compared to their measurements processed with the GODFIT v4 algorithm, as part of the C3S climate total ozone record production. The TOC datasets from the other sensors are restricted to the time period of the TROPOMI/S5P, namely from November 2017 to November 2018.
Daily NRTI observations, as well as the corresponding GOME2A/2B data records, were averaged on latitude–longitude grid, while the OFFL data, and corresponding GOME2A/2B and OMPS data records, were placed on a grid. For each pair of instruments, daily gridded relative differences were then computed for every grid cell containing measurements and all those daily difference grids were then either averaged in time to have a global representation of the spatial patterns of the differences (as shown in Fig. 16) or also averaged in space for certain latitudes bands. As such, Fig. 17 shows the gridded differences as a monthly mean time series for selected zonal belts.
In more detail, Fig. 16 shows the global distribution of the relative percentage differences between TROPOMI OFFL TOC and GOME2A (Fig. 16a), GOME2B (Fig. 16c) and OMPS (Fig. 16e) GODFIT v4 TOCs and between the TROPOMI NRTI TOC product and the GOME2A and GOME2B GDP4.8 TOCs in Fig. 16b and d, respectively. In general, total ozone columns from different satellite instruments agree quite well, especially at low and midlatitudes. The magnitude of those differences appear to be slightly smaller for the OFFL product than for the NRTI data, highlighting a better inter-sensor consistency. Differences tend to increase at higher latitudes where the more extreme geophysical conditions (large ozone optical depth, high variability in surface reflectivity, large observation angles) make the retrievals less accurate.
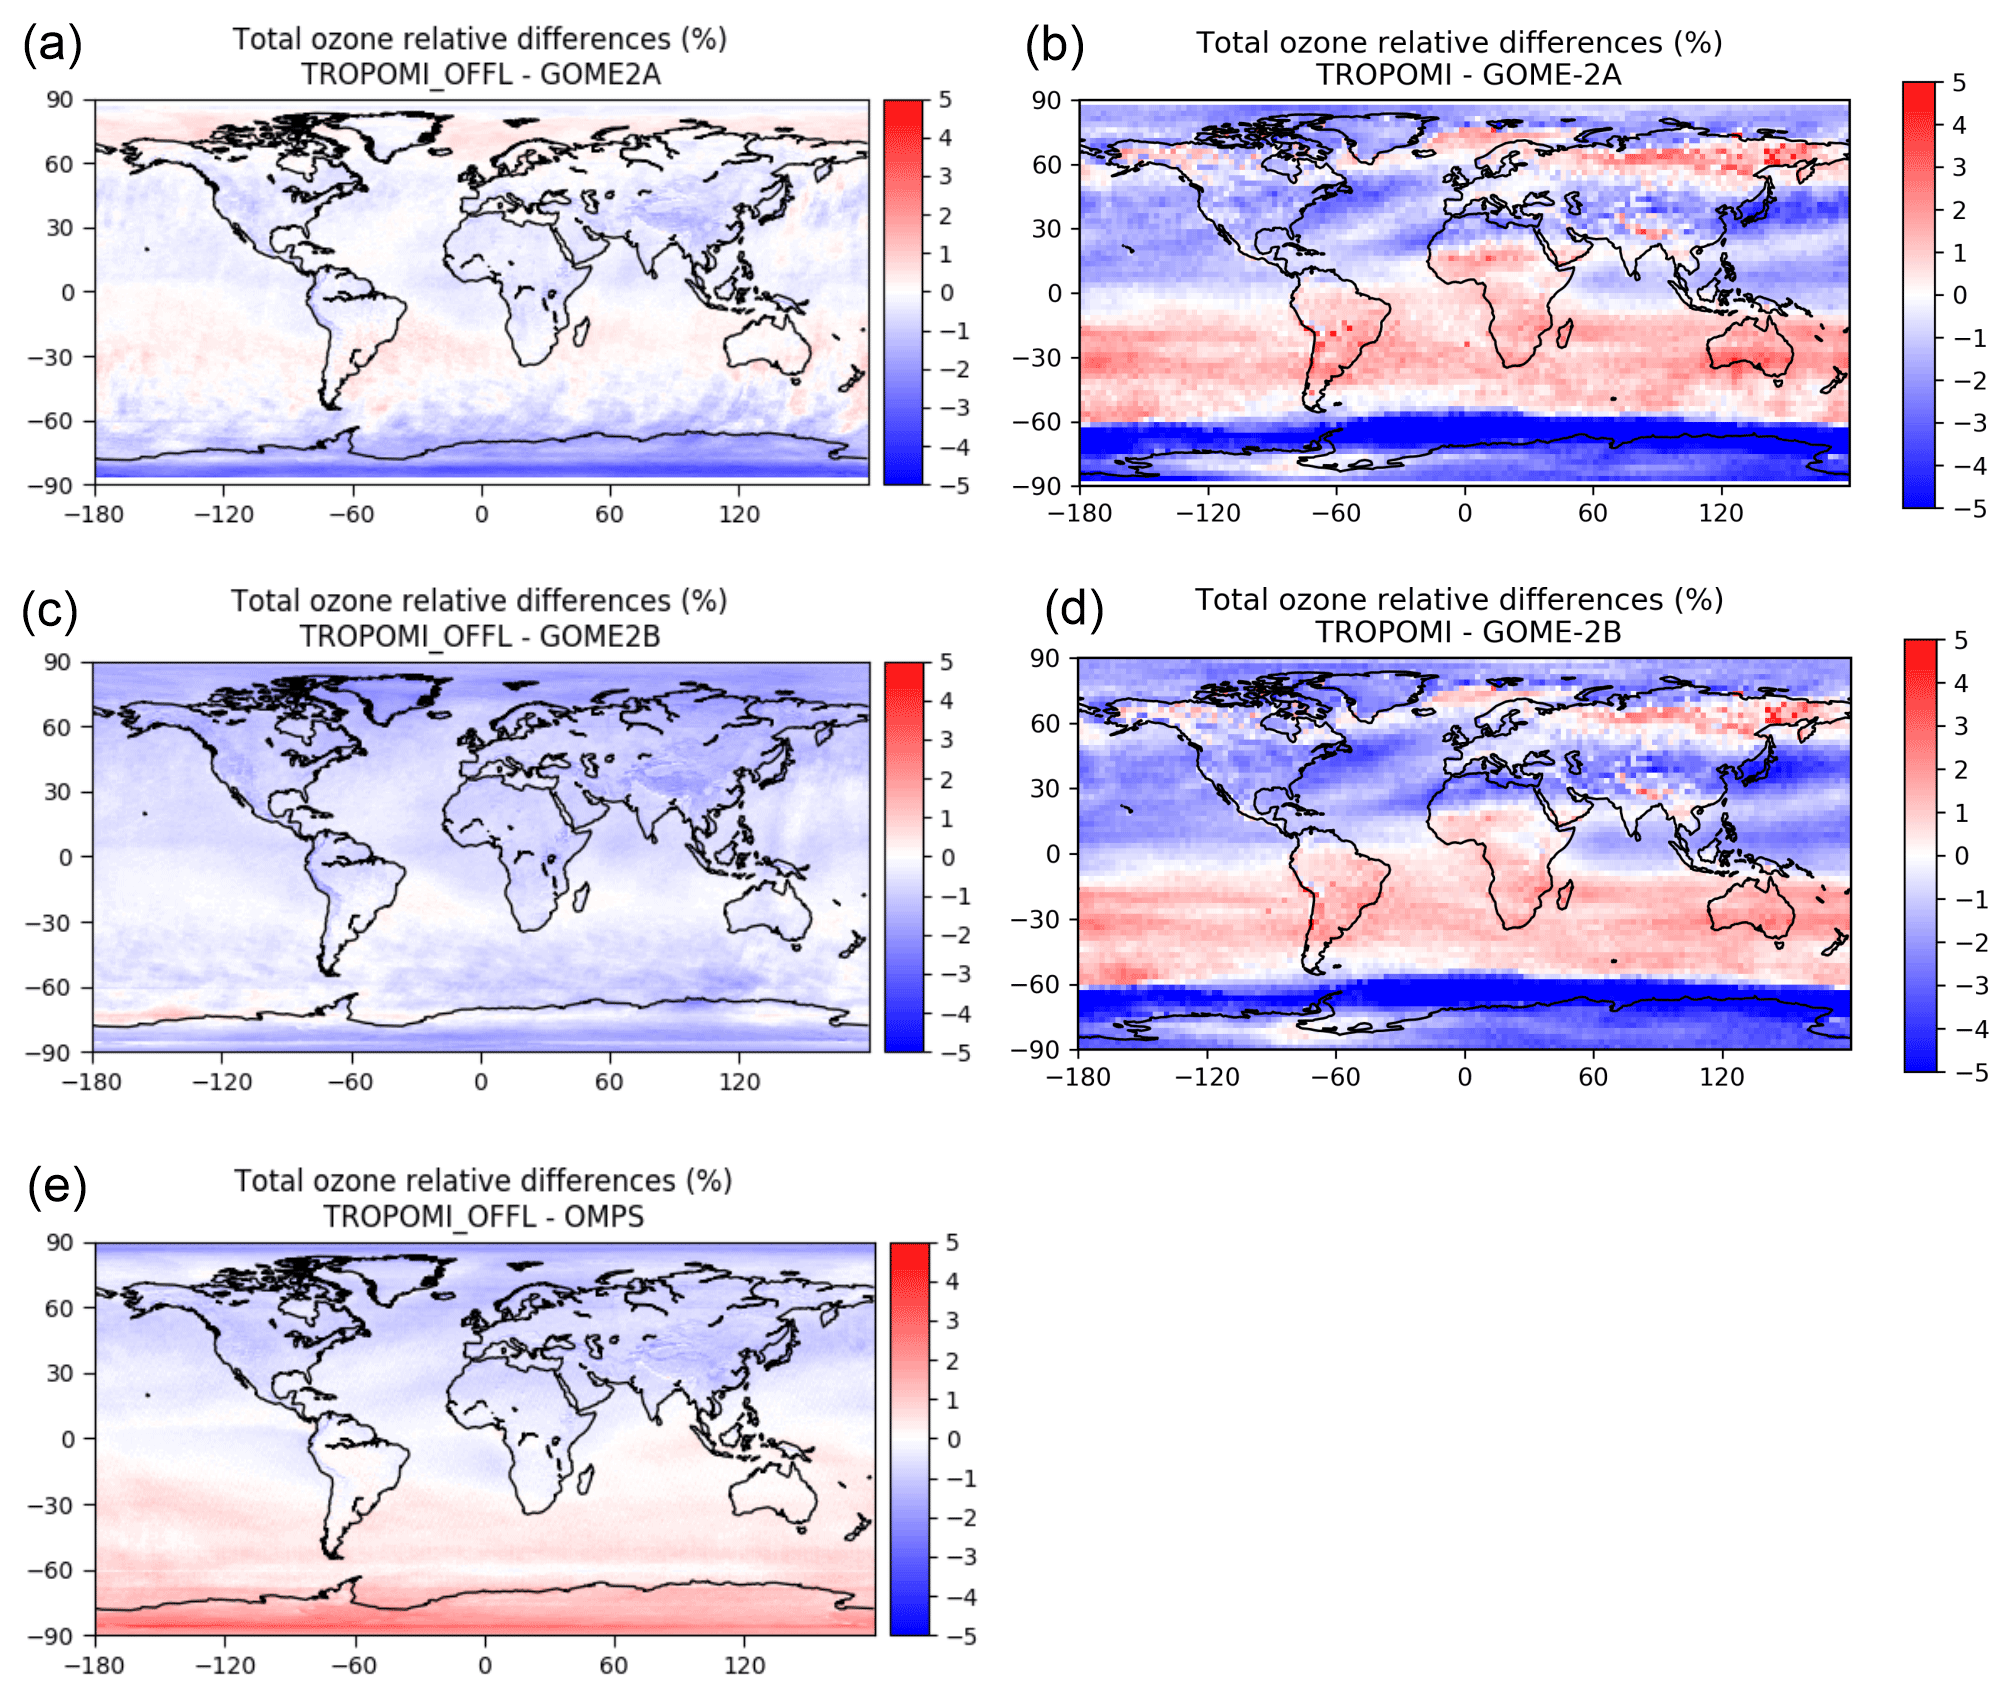
Figure 16Global maps of relative differences (in percentages) between TROPOMI OFFL TOC and GOME2A, GOME2B and OMPS processed with GODFIT v4 (a, c, e). The respective relative percentage differences of the TROPOMI NRTI TOC product compared to GOME2A and GOME2B, processed with GDP 4.8, are shown in (b, d).
The OFFL product (Fig. 16, left column) appears to have a variable correlation to the other three sensors:
- i.
Compared to GOME2A (Fig. 16a), differences are generally very small ( %). They are slightly larger only in high southern latitudes where they reach around −2 %.
- ii.
Compared to GOME2B (Fig. 16c), TROPOMI is biased slightly low with mean differences systematically negative, but generally smaller than −1 % at low latitudes and midlatitudes. Again, they slightly increase (up to −1.5 %) in polar regions.
- iii.
Compared to OMPS (Fig. 16e), differences are also reasonable with a similar order of magnitude. A clear hemispheric pattern is visible, with negative differences in the Northern Hemisphere increasing polewards up to −1 % and positive differences in the Southern Hemisphere also increasing polewards up to +2 %. This is in agreement with the comparison of the two sensors already shown in Fig. 13a. The origin of this latitudinal dependence remains unclear but can possibly be attributed to OMPS. The latter has a coarser spectral resolution than TROPOMI, which may lead to a reduced information content in the retrieval.
On the contrary, the NRTI TOC product (Fig. 16, right column) has very similar behavior compared to both GOME2A (Fig. 16b) and GOME2B (Fig. 16d):
- i.
The differences are mainly negative in the Northern Hemisphere, going up to −2.5 % above 70∘ N.
- ii.
As an exception, in the 60–75∘ N latitude belt over northern Europe, Asia and Alaska, the differences are positive and reach +3.5 %. This result is also in agreement with the differences between the TROPOMI and GOME2A and GOME2B seen at this latitude belt in Fig. 15a.
- iii.
Positive differences in the range 0 % to +2.5 % are also seen in the 0–60∘ S latitude belt.
- iv.
Finally, below 60∘ S the differences become negative again and have a maximum difference of −5 %. This is also seen in Fig. 15a but only between TROPOMI and GOME2A comparisons to GB measurements.
Figure 17 shows the time series of the monthly mean percentage differences between TROPOMI and GOME2A, GOME2B and OMPS TOCs for five latitude belts: 90–50∘ N, shown with the purple line and dots; 50–20∘ N, shown with the red line and dots; 20∘ N–20∘ S, shown with the black line and dots; 20–50∘ S, shown with the blue line and dots; and 50–90∘ S, shown with the cyan line and dots. To the left, the TROPOMI OFFL TOC is compared to GOME2A (Fig. 17a), GOME2B (Fig. 17c) and OMPS (Fig. 17e) processed with GODFIT v4. In the right column of Fig. 17, the NRTI TOC product of TROPOMI is compared to GOME2A (Fig. 17b) and GOME2B (Fig. 17d) processed with the GDP 4.8 algorithm.
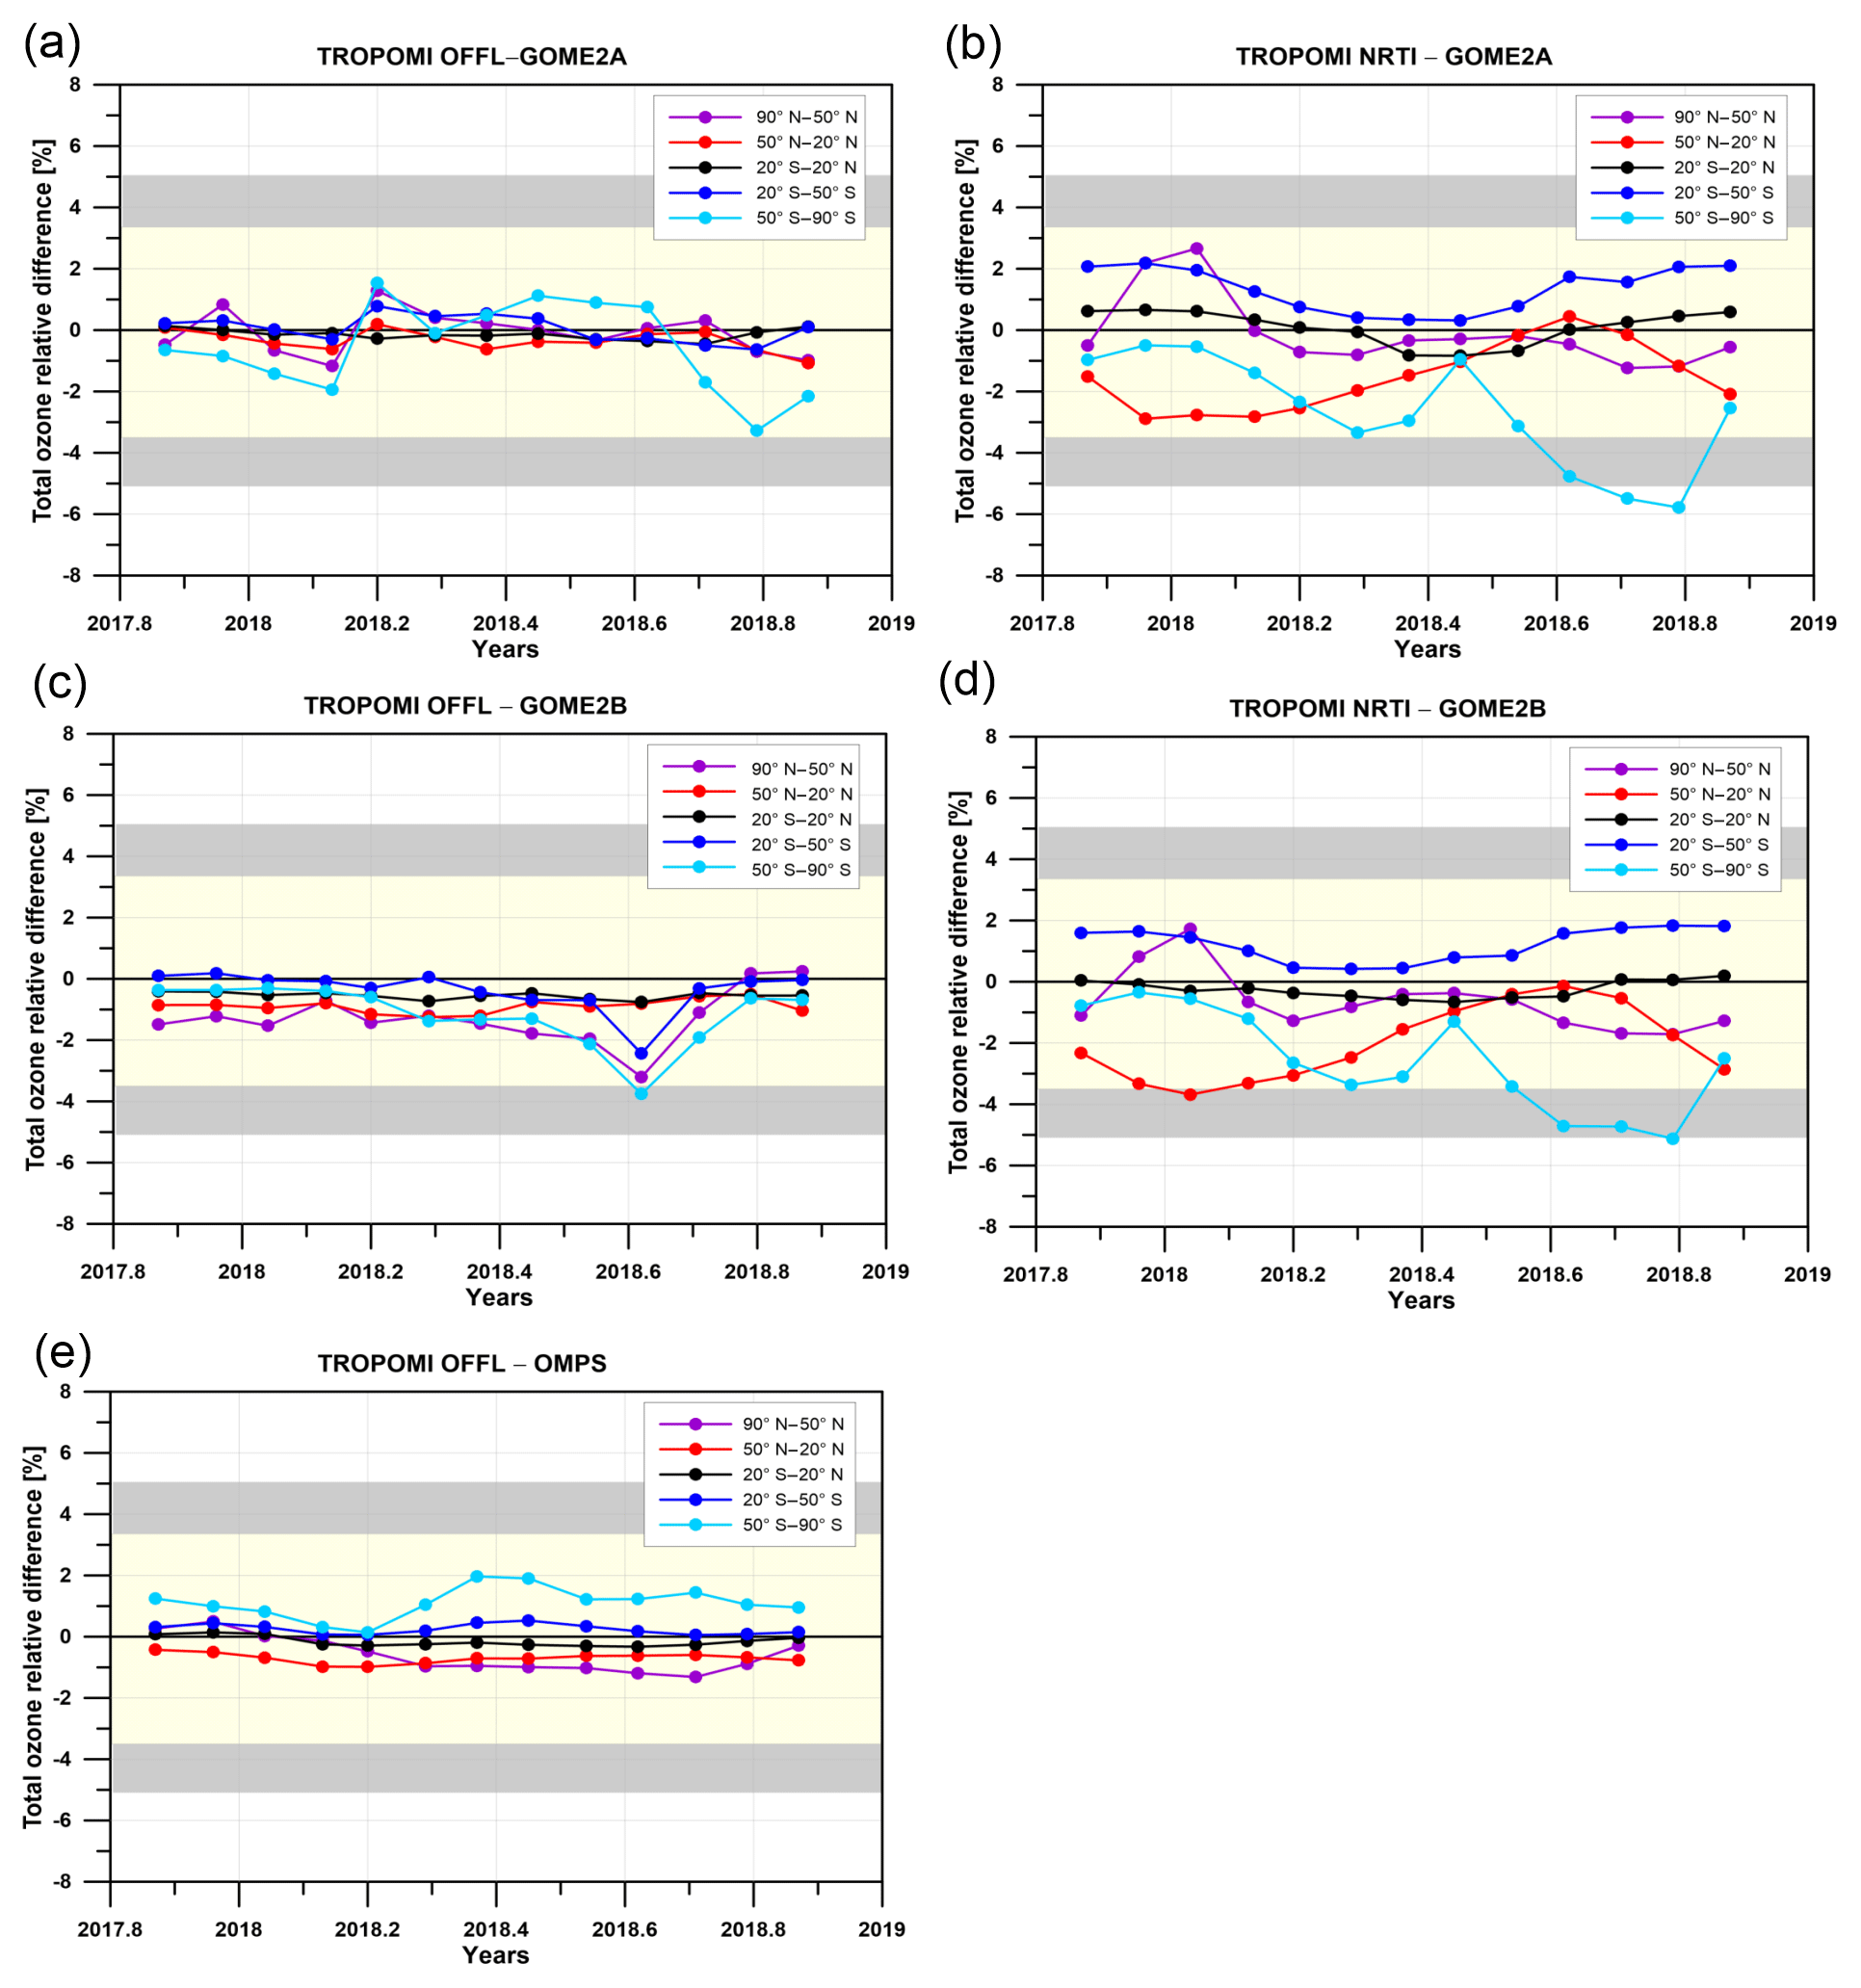
Figure 17The time series of the percentage differences between TROPOMI and GOME2A, GOME2B and OMPS TOCs, for five latitude belts: 90–50∘ N (purple line and dots), 50–20∘ N (red line and dots), 20∘ N–20∘ S (black line and dots), 20–50∘ S (blue line and dots), 50–90∘ S (cyan line and dots). In the left column, the TROPOMI OFFL TOC is compared to GOME2A (a), GOME2B (c) and OMPS (e) processed with GODFIT v4. In the right column, the NRTI TOC product of TROPOMI is compared to GOME2A (b) and GOME2B (d) processed with GDP 4.8.
The percentage differences of the OFFL TOC compared to the other three sensors demonstrate great temporal stability for every latitude belt, except for the belt south of 50∘ S (cyan line), where the variability is stronger. Those plots confirm the conclusions drawn previously, with differences generally lower than ±1 % at low latitudes and midlatitudes and slightly larger in polar regions. Recall also that the GODFIT v4 GOME2A and GOME2B datasets are produced with a Level 1b soft-calibration procedure, which introduces its own inaccuracies (Lerot et al., 2014). This might explain the slightly larger variability of the TROPOMI–GOME2A differences in the 50–90∘ S bin and the larger TROPOMI–GOME2B differences in August 2018. As shown in Fig. 16e and Fig. 17e, the OMPS TOCs are lower than the TROPOMI OFFL TOCs in the SH, where the cyan line shows differences up to +2 % during the polar winter and spring.
The TROPOMI NRTI TOC percentage differences exhibit a quite different behavior compared to the OFFL TOC product. The variability of the monthly mean time series seen in Fig. 17b and d, is more pronounced for all latitude belts except for the tropics. Each latitude belt has a different temporal dependency, which does not change when a different sensor is used for the comparison to TROPOMI.
Despite the differences between the two algorithms that emerged from this direct satellite-to-satellite comparison, it should be stressed that the mean bias of the percentage differences between TROPOMI and the other sensors is always within the product requirements, reproduced as the yellow and gray shaded areas in Fig. 17.
In this work, the first year of total ozone measurements from the TROPOMI/S5P instrument is validated against GB and other satellite-borne instruments. The TROPOMI NRTI and OFFL algorithms are described and the filtering criteria of each product are listed. The GB instruments used for the validation of the two products are (i) the WOUDC Dobson and Brewer spectrophotometers, (ii) the Canadian Brewer Network and Eubrewnet Brewer spectrophotometers, and (iii) the ZSL-DOAS instruments from the SAOZ network that were obtained from the LATMOS_RT (real time) facility. We have shown that the best co-location criteria between the satellite-borne and direct-sun GB observations are to limit (a) the spatial co-location search radius around the stations to 10 km and (b) the temporal difference between satellite and GB co-locations (in case of individual measurements) to 40 min.
The two TROPOMI TOC products, NRTI and OFFL, are validated against GB measurements, compared to the GOME2/Metop-A and GOME2/Metop-B as well as OMPS TOCs and are intercompared with one another. The most notable differences in the two algorithms may be explained by the effect of fitting an effective albedo or using a fixed surface albedo prescribed by climatology. The NRTI surface albedo climatology is currently re-evaluated and expected to be updated soon, which will most probably eliminate the deviations between the two products in northern high latitudes. Even so, the overall differences between NRTI and OFFL TOC products are within ±1 %.
Further conclusions of this validation study can be summarized as follows:
-
Many influence quantities, such as SZA, clouds, CCD pixel, etc. were investigated and no unexpected dependencies were found.
-
The diurnal variation in the TROPOMI TOC above three polar GB stations was studied and was found to be very consistent with the GB measurements.
-
The inter-sensor consistency was found to be very satisfying for both NRTI, compared to GOME2A and GOME2B, and OFFL TOC, compared to GOME2A, GOME2B, and OMPS measurements. The mean differences between the TROPOMI TOC products and the other sensors were generally less than ±1 % at moderate latitudes. As expected, they are slightly larger at higher latitudes. The use of different surface albedo climatologies in the NRTI and GDP 4.8 algorithms also occasionally leads to significant deviation between those products at high latitudes.
In conclusion, after an extended investigation of all the parameters that could possibly contribute to the validation results, it was seen that both TROPOMI/S5P TOC products, NRTI and OFFL, are of high quality, very stable and consistent with the rest of the sensors used in this study. Nevertheless, no estimation of the sensor's long-term stability can be made due to the short time span of its operation. The product requirements (up to ±3.5–5 % for the mean bias) that were established for the S5P Level 2 (L2) TOC product are met when the mean bias of the comparisons is considered, being always less than ±1 % for the OFFL product and less than ±1.5 % for the NRTI TOC product. As for the mean of the standard deviations, for most comparisons it was also within the product requirements (up to ±1.6–2.5 % for the mean standard deviation), even though for some of the Dobson and the SAOZ comparisons it was found to be above that. It should be noted here that the standard deviation of the comparisons should not be attributed totally to the satellite observations, since it also includes the GB measurement uncertainties, as well as the effect of any possible co-location mismatches. As the time series of the comparisons extends and even more GB stations contribute with QC and QA measurements, it is expected that the overall picture of the standard deviation of the comparisons will be upgraded. Furthermore, the increase in the number of co-locations that is foreseen to take place in the near future will give us the advantage of choosing from all GB stations only those that can guarantee a reliable long-term operation. As a result, the quality and the statistical significance of the validation exercises will be enhanced.
The European Space Agency (ESA) has established a dedicated S5P validation site, which is maintained by BIRA-IASB, where one can find up-to-date validation reports and comparison results: https://mpc-vdaf-server.tropomi.eu/o3-total-column (last access: 6 September 2019).
The Level 2 TROPOMI TOC datasets are available at https://s5phub.copernicus.eu/ (last access: 6 September 2019) and https://s5pexp.copernicus.eu/ (last access: 6 September 2019) (TROPOMI OFFL TOC: https://doi.org/10.5270/S5P-fqouvyz, last access: 6 September 2019). The Brewer and Dobson daily datasets used in this work can be downloaded from the WOUDC database (http://www.woudc.org, last access: 6 September 2019; WMO/GAW Ozone Monitoring Community, 2017, https://doi.org/10.14287/10000004, last access: 6 September 2019), while the individual Brewer measurements can be acquired by the Eubrewnet site (http://rbcce.aemet.es/eubrewnet/, last access: 6 September 2019; Rimmer et al., 2018) and the Canadian Brewer Network site (http://exp-studies.tor.ec.gc.ca/, last access: 6 September 2019). The SAOZ GB data are available at the NDACC database (http://www.ndaccdemo.org/, last access: 6 September 2019) and from http://saoz.obs.uvsq.fr/ (last access: 6 September 2019) (Pommereau and Goutail, 1988). Rapid delivery SAOZ data are available from the LATMOS real time (RT) facility at http://saoz.obs.uvsq.fr/SAOZ-RT.html (last access: 6 September 2019) (Andrea Pazmino, personal communication, 2018). The OMPS/NPP, GOME2/Metop-A and GOME2/Metop-B TOC data processed by the ESA’s CCI GODFIT v4 algorithm were made available by Christophe Lerot (BIRA-IASB; personal communication, 2018; OMPS GODFIT v4: https://doi.org/10.18758/71021044, last access: 6 September 2019). The GOME2/Metop-A and GOME2/Metop-B are processed by EUMETSAT's ACSAF GDP4.8 algorithm and can be downloaded from https://acsaf.org/products/oto_o3.html (last access: 6 September 2019) (http://dx.doi.org/10.15770/EUM_SAF_O3M_0009, last access: 6 September 2019).
The supplement related to this article is available online at: https://doi.org/10.5194/amt-12-5263-2019-supplement.
KG adjusted and expanded the validation chain of AUTH, analyzed the satellite and GB data from WOUDC and Eubrewnet, carried out the validation of the satellite data versus Brewer and Dobson GB instruments, and prepared the manuscript with contributions from all co-authors. MEK had an important role in the AUTH validation chain development, helped with the initial data processing and participated in the discussions of the results. TV and JCL validated the satellite data with respect to the NDACC ground-based networks and coordinated the discussion of validation results obtained in the context of the ESA's S5P Mission Performance Centre (MPC). CL and MVR developed the GODFIT algorithm implemented in the TROPOMI OFFL ozone column processor, described it in the respective paragraph and participated in the discussions of the results. CL also provided the Suomi-NPP OMPS, GOME2/Metop-A and GOME2/Metop-B data processed with the GODFIT v4 algorithm. KPH, DL, WZ, FR and JX developed the NRTI algorithm used for the TROPOMI TOC retrieval, described it in the respective paragraph and participated in the discussions of the results. CL and KPH implemented the direct satellite-to-satellite comparisons and helped with the discussion of the results. VF, CM and DG validated the satellite TOC using the Canadian Brewer measurements. DB contributed to the analysis and the writing of all the versions of the paper and provided advice throughout the process. AD was responsible for the timely distribution of the TROPOMI data from the Copernicus hubs. JG developed and operated the CORR-2 ground-based networks database used by the Multi-TASTE QA system at BIRA-IASB for the validation of long-term, multi-satellite data records. DH and AK contributed scientific advice to the validation studies and to the refinement of validation tools and ensured linkage with similar activities carried out in the context of the ESA's Climate Change Initiative (CCI) and of the Copernicus Climate Change Service (C3S) implemented by ECMWF. AB, AP, JPP and FG were responsible for the SAOZ ground-based measurements. PV provided information for the GDP4.8 algorithm and contributed to the discussion of the results. AR was responsible for the Eubrewnet database maintenance and helped with the respective data acquisition. JCL, DL, MVR, DB, AB, ChZ and ClZ elaborated and coordinated the framework of this collaborative multi-institutional work. All writers gave useful comments during the writing of the paper.
The authors declare that they have no conflict of interest.
This article is part of the special issue “TROPOMI on Sentinel-5 Precursor: first year in operation (AMT/ACPT inter-journal SI)”. It is not associated with a conference.
The authors acknowledge the financial support of the European Space Agency “Preparation and Operations of the Mission Performance Centre (MPC) for the Copernicus Sentinel-5 Precursor Satellite”. The French scientists are grateful to Centre National d'Etudes Spatiales (CNES) and Centre National de la Recherche Scientifique (CNRS) for financial support. We warmly thank the ESA Ozone Climate Change Initiative project for providing the GODFIT v4 datasets, the EUMETSAT ACSAF project for providing the GDP4.8 datasets, the Copernicus Services Data Hub for providing the TROPOMI/S5P data on a timely manner, the World Ozone and UV Data Centre for providing the Brewer and Dobson spectrophotometer observations, the European Cooperation in Science and Technology Action (COST Action ES1207) for the Eubrewnet measurements and Environment Climate Change Canada for the Canadian Brewer observations. Finally, we would like to acknowledge and warmly thank all the ground-based instrumentation investigators that provided data to these repositories on a regular manner, as well as the handlers of these databases for their upkeep and quality-guaranteed efforts.
This research has been supported by the European Space Agency “Preparation and Operations of the Mission Performance Centre (MPC) for the Copernicus Sentinel-5 Precursor Satellite” (contract no. 4000117151/16/1-LG).
This paper was edited by Ben Veihelmann and reviewed by Mark Weber and one anonymous referee.
Antón, M., Loyola, D., López, M., Vilaplana, J. M., Bañón, M., Zimmer, W., and Serrano, A.: Comparison of GOME-2/MetOp total ozone data with Brewer spectroradiometer data over the Iberian Peninsula, Ann. Geophys., 27, 1377–1386, https://doi.org/10.5194/angeo-27-1377-2009, 2009.
Bak, J., Liu, X., Kim, J. H., Chance, K., and Haffner, D. P.: Validation of OMI total ozone retrievals from the SAO ozone profile algorithm and three operational algorithms with Brewer measurements, Atmos. Chem. Phys., 15, 667–683, https://doi.org/10.5194/acp-15-667-2015, 2015.
Balis, D., Kroon, M., Koukouli, M. E., Brinksma, E. J., Labow, G., Veefkind, J. P., McPeters, R. D.: Validation of Ozone Monitoring Instrument total ozone column measurements using Brewer and Dobson spectrophotometer ground-based observations, J. Geophys. Res., 112, D24S46, https://doi.org/10.1029/2007JD008796, 2007a.
Balis, D., Lambert, J.-C., Van Roozendael, M., Spurr, R., Loyola, D., Livschitz, Y., Valks, P., Amiridis, V., Gerard, P., Granville, J., and Zehner, C.: Ten years of GOME/ERS2 total ozone data – The new GOME data processor (GDP) version 4: 2. Ground-based validation and comparisons with TOMS V7/V8, J. Geophys. Res., 112, D07307, https://doi.org/10.1029/2005JD006376, 2007b.
Basher, R. E.: Review of the Dobson spectrophotometer and its accuracy, Rep. 13, WMO Global Ozone Res. and Monit. Proj., Geneva, Dec., available at: http://www.esrl.noaa.gov/gmd/ozwv/dobson/papers/report13/report13.html (last access: 6 September 2019), 1982.
Bass, A. M. and Paur, R. J.: The Ultraviolet Cross–sections of Ozone: I. The Measurements II, Results and Temperature Dependence, in Atmospheric Ozone, Proceedings of the Quadrennial Ozone Symposium, Halkidiki, Greece, edited by: Zerefos, C. and Ghazi, A., Reidel, Dordrecht, 606–616, 1985
Bernhard, G., Evans, R. D., Labow, G. J., and Oltmans, S. J.: Bias in Dobson total ozone measurements at high latitudes due to approximations in calculations of ozone absorption coefficients and air mass, J. Geophys. Res, 110, D10305, https://doi.org/10.1029/2004JD005559, 2005.
Bhartia, P. K., McPeters, R. D., Flynn, L. E., Taylor, S., Kramarova, N. A., Frith, S., Fisher, B., and DeLand, M.: Solar Backscatter UV (SBUV) total ozone and profile algorithm, Atmos. Meas. Tech., 6, 2533–2548, https://doi.org/10.5194/amt-6-2533-2013, 2013.
Borsdorff, T., Aan de Brugh, J., Hu, H., Aben, I., Hasekamp, O., and Landgraf, J.: Measuring carbon monoxide with TROPOMI: First results and a comparison with ECMWF-IFS analysis data, Geophys. Res. Lett., 45, 2826–2832, https://doi.org/10.1002/2018GL077045, 2018.
Boynard, A., Hurtmans, D., Garane, K., Goutail, F., Hadji-Lazaro, J., Koukouli, M. E., Wespes, C., Vigouroux, C., Keppens, A., Pommereau, J.-P., Pazmino, A., Balis, D., Loyola, D., Valks, P., Sussmann, R., Smale, D., Coheur, P.-F., and Clerbaux, C.: Validation of the IASI FORLI/EUMETSAT ozone products using satellite (GOME-2), ground-based (Brewer-Dobson, SAOZ, FTIR) and ozonesonde measurements, Atmos. Meas. Tech., 11, 5125–5152, https://doi.org/10.5194/amt-11-5125-2018, 2018.
Brion, J., Chakir, A., Charbonnier, J., Daumont, D., Parisse, C., and Malicet, J.: Absorption spectra measurements for the ozone molecule in the 350–830 nm region, J. Atmos. Chem., 30, 291–299, 1998.
Daumont, D., Brion, J., Charbonnier, J., and Malicet, J.: Ozone UV spectroscopy. I. Absorption cross-sections at room temperature, J. Atmos. Chem., 15, 145–155, 1992.
Fioletov, V. E., Kimlin, M. G., Krotkov, N., McArthur, L. J. B., Kerr, J. B., Wardle, D. I., Herman, J. R., Meltzer, R., Mathews, T. W., and Kaurola, J.: UV index climatology over the United States and Canada from ground-based and satellite estimates, J. Geophys. Res., 109, D22308, https://doi.org/10.1029/2004JD004820, 2004.
Fioletov, V. E., Kerr, J. B., McElroy, C. T., Wardle, D. I., Savastiouk, V., and Grajnar, T. S.: The Brewer reference triad, Geophys. Res. Lett., 32, L20805, https://doi.org/10.1029/2005GL024244, 2005.
Fioletov, V. E., Labow, G., Evans, R., Hare, E. W., Köhler, U., McElroy, C. T., Miyagawa, K., Redondas, A., Savastiouk, V., Shalamyansky, A. M., Staehelin, J., Vanicek, K., and Weber, M.: Performance of the ground-based total ozone network assessed using satellite data, J. Geophys. Res., 113, D14313, https://doi.org/10.1029/2008JD009809, 2008.
Fioletov, V. E., McLinden, C. A., McElroy, C. T., and Savastiouk, V.: New method for deriving total ozone from Brewer zenith sky observations, J. Geophys. Res., 116, D08301, https://doi.org/10.1029/2010JD015399, 2011.
Flynn, L., McNamara, D., Beck, C. T., Petropavlovskikh, I., Beach, E., Pachepsky, Y., Li, Y. P., Deland, M., Huang, L.-K., Long, C. S., Tiruchirapalli, R., and Taylor, S.: Measurements and products from the Solar Backscatter Ultraviolet (SBUV/2) and Ozone Mapping and Profiler Suite (OMPS) instruments, Int. J. Remote Sens., 30, 4259–4272, https://doi.org/10.1080/01431160902825040, 2009.
Fragkos, K., Bais, A. F., Balis, D., Meleti, C., and Koukouli, M. E.: The Effect of Three Different Absorption Cross-Sections and their Temperature Dependence on Total Ozone Measured by a Mid-Latitude Brewer Spectrophotometer, Atmos.-Ocean, 53, 19–28, https://doi.org/10.1080/07055900.2013.847816, 2013.
Garane, K., Lerot, C., Coldewey-Egbers, M., Verhoelst, T., Koukouli, M. E., Zyrichidou, I., Balis, D. S., Danckaert, T., Goutail, F., Granville, J., Hubert, D., Keppens, A., Lambert, J.-C., Loyola, D., Pommereau, J.-P., Van Roozendael, M., and Zehner, C.: Quality assessment of the Ozone_cci Climate Research Data Package (release 2017) – Part 1: Ground-based validation of total ozone column data products, Atmos. Meas. Tech., 11, 1385–1402, https://doi.org/10.5194/amt-11-1385-2018, 2018.
Griffin, D., Zhao, X., McLinden, C. A., Boersma, F., Bourassa, A., Dammers, E., Degenstein, D., Eskes, H., Fehr, L., Fioletov, V., Hayden, K., Kharol, S. K., Li, S.-M., Makar, P., Martin, R. V., Mihele, C., Mittermeier, R. L., Krotkov, N., Sneep, M., Lamsal, L. N., ter Linden, M., van Geffen, J., Veefkind, P., Wolde, M.: High-resolution mapping of nitrogen dioxide with TROPOMI: First results and validation over the Canadian oil sands, Geophys. Res. Lett., 46, 1049–1060, https://doi.org/10.1029/2018GL081095, 2019.
Hao, N., Koukouli, M. E., Inness, A., Valks, P., Loyola, D. G., Zimmer, W., Balis, D. S., Zyrichidou, I., Van Roozendael, M., Lerot, C., and Spurr, R. J. D.: GOME-2 total ozone columns from MetOp-A/MetOp-B and assimilation in the MACC system, Atmos. Meas. Tech., 7, 2937–2951, https://doi.org/10.5194/amt-7-2937-2014, 2014.
Hassinen, S., Balis, D., Bauer, H., Begoin, M., Delcloo, A., Eleftheratos, K., Gimeno Garcia, S., Granville, J., Grossi, M., Hao, N., Hedelt, P., Hendrick, F., Hess, M., Heue, K.-P., Hovila, J., Jønch-Sørensen, H., Kalakoski, N., Kauppi, A., Kiemle, S., Kins, L., Koukouli, M. E., Kujanpää, J., Lambert, J.-C., Lang, R., Lerot, C., Loyola, D., Pedergnana, M., Pinardi, G., Romahn, F., van Roozendael, M., Lutz, R., De Smedt, I., Stammes, P., Steinbrecht, W., Tamminen, J., Theys, N., Tilstra, L. G., Tuinder, O. N. E., Valks, P., Zerefos, C., Zimmer, W., and Zyrichidou, I.: Overview of the O3M SAF GOME-2 operational atmospheric composition and UV radiation data products and data availability, Atmos. Meas. Tech., 9, 383–407, https://doi.org/10.5194/amt-9-383-2016, 2016.
Hendrick, F., Pommereau, J.-P., Goutail, F., Evans, R. D., Ionov, D., Pazmino, A., Kyrö, E., Held, G., Eriksen, P., Dorokhov, V., Gil, M., and Van Roozendael, M.: NDACC/SAOZ UV-visible total ozone measurements: improved retrieval and comparison with correlative ground-based and satellite observations, Atmos. Chem. Phys., 11, 5975–5995, https://doi.org/10.5194/acp-11-5975-2011, 2011.
Heue, K.-P., Verhoelst, T., Lambert, J.-C., Granville, G., Lerot, C., Loyola, D., Romahn, F., Valks, P., Van Roozendael, M., Xu, J., Zimmer, W., Balis, D., Bazureau, A., Fioletov, V., Garane, K., Goutail, F., Koukouli, M. L., McLinden, C., Pazmiño, A., Pommereau, J.-P., and Zerefos, C.: S5P MPC Product Readme NRTI Total Ozone V01.01.06, issue 1.2, available at: http://www.tropomi.eu/documents/prf, (last access: 15 June 2019), 2019.
Heue, K.-P., Spurr, R., Loyola, D., Van Roozendael, M., Lerot, C., and Xu, J.: ATBD for Total Ozone Column, S5P-L2-DLR-ATBD-400A, V2.0, issue 2.0, available at: http://www.tropomi.eu/documents/atbd, in preparation, 2019.
Hu, H., Landgraf, J., Detmers, R., Borsdorff, T., Aan de Brugh, J., Aben, I., Butz, A., and Hasekamp, O.: Toward global mapping of methane with TROPOMI: First results and intersatellite comparison to GOSAT, Geophys. Res. Lett., 45, 3682–3689, https://doi.org/10.1002/2018GL077259, 2018
Inness, A., Flemming, J., Heue, K.-P., Lerot, C., Loyola, D., Ribas, R., Valks, P., van Roozendael, M., Xu, J., and Zimmer, W.: Monitoring and assimilation tests with TROPOMI data in the CAMS system: near-real-time total column ozone, Atmos. Chem. Phys., 19, 3939–3962, https://doi.org/10.5194/acp-19-3939-2019, 2019.
Kerr, J. B., McElroy, C. T., and Olafson, R. A.: Measurements of ozone with the Brewer ozone spectrophotometer, in Proceedings of the Quadrennial Ozone Symposium, Boulder, Colorado, edited by: London, J. Natl. Cent. Atmos. Res., Boulder, Colorado, 74–79, 1981.
Kerr, J. B., Asbridge, I. A., and Evans, W. F. J.: Intercomparison of total ozone measured by the Brewer and Dobson spectrophotometers at Toronto, J. Geophys. Res., 93, 11129–11140, https://doi.org/10.1029/JD093iD09p11129, 1988.
Kerr, J. B.: New methodology for deriving total ozone and other atmospheric variables from Brewer spectrophotometer direct sun spectra, J. Geophys. Res., 107, 4731, https://doi.org/10.1029/2001JD001227, 2002.
Kerr, J. B.: The Brewer Spectrophotometer, in: UV Radiation in Global Climate Change, edited by: Gao, W., Slusser, J. R., and Schmoldt, D. L., Springer, Berlin, Heidelberg, https://doi.org/10.1007/978-3-642-03313-1_6, 2010.
Kleipool, Q. L., Dobber, M. R., de Haan, J. F., and Levelt, P. F.: Earth surface reflectance climatology from 3 years of OMI data, J. Geophys. Res., 113, D18308, https://doi.org/10.1029/2008JD010290, 2008.
Kleipool, Q., Ludewig, A., Babić, L., Bartstra, R., Braak, R., Dierssen, W., Dewitte, P.-J., Kenter, P., Landzaat, R., Leloux, J., Loots, E., Meijering, P., van der Plas, E., Rozemeijer, N., Schepers, D., Schiavini, D., Smeets, J., Vacanti, G., Vonk, F., Köehler, P., Frankenberg, C., Magney, T. S., Guanter, L., Joiner, J., and Landgraf, J.: Global retrievals of solar-induced chlorophyll fluorescence with TROPOMI: First results and intersensor comparison to OCO-2, Geophys. Res. Lett., 45, 10456–10463, https://doi.org/10.1029/2018GL079031, 2018.
Köehler, P., Frankenberg, C., Magney, T. S., Guanter, L., Joiner, J., and Landgraf, J.: Global retrievals of solar-induced chlorophyll fluorescence with TROPOMI: First results and intersensor comparison to OCO-2, Geophys. Res. Lett., 45, 10456–10463, https://doi.org/10.1029/2018GL079031, 2018.
Koelemeijer, R. B. A., de Haan, J. F., and Stammes, P.: A database of spectral surface reflectivity in the range 335–772 nm derived from 5.5 years of GOME observations, J. Geophys. Res., 108, 4070, https://doi.org/10.1029/2002JD0024, 2003.
Koukouli, M. E., Balis, D. S., Loyola, D., Valks, P., Zimmer, W., Hao, N., Lambert, J.-C., Van Roozendael, M., Lerot, C., and Spurr, R. J. D.: Geophysical validation and long-term consistency between GOME-2/MetOp-A total ozone column and measurements from the sensors GOME/ERS-2, SCIAMACHY/ENVISAT and OMI/Aura, Atmos. Meas. Tech., 5, 2169–2181, https://doi.org/10.5194/amt-5-2169-2012, 2012.
Koukouli, M. E., Lerot, C., Granville, J., Goutail, F., Lambert, J.-C., Pommereau, J.-P., Balis, D., Zyrichidou, I., Van Roozendael, M., Coldewey-Egbers, M., Loyola, D., Labow, G., Frith, S., Spurr, R., and Zehner, C.: Evaluating a new homogeneous total ozone climate data record from GOME/ERS-2, SCIAMACHY/Envisat, and GOME-2/MetOp-A, J. Geophys. Res., 120, 12296–12312, https://doi.org/10.1002/2015JD023699, 2015a.
Koukouli, M. E., Zyrichidou, I., Balis, D. S., Valks, P., Hao, N., and Valks, P.: GOME-2/MetopA & GOME-2/MetopB GDP 4.8 total ozone data validation for MetOp-B Operational Readiness Review, Technical Note/Validation Report SAF/O3M/AUTH/VRR/O3, O3M SAF, available at: https://acsaf.org/docs/vr/Validation_Report_NTO_OTO_DR_O3_GDP48_Dec_2015.pdf (last access: 2 April 2019), 2015b.
Koukouli, M. E., Zara, M., Lerot, C., Fragkos, K., Balis, D., van Roozendael, M., Allart, M. A. F., and van der A, R. J.: The impact of the ozone effective temperature on satellite validation using the Dobson spectrophotometer network, Atmos. Meas. Tech., 9, 2055–2065, https://doi.org/10.5194/amt-9-2055-2016, 2016.
Kleipool, Q., Ludewig, A., Babić, L., Bartstra, R., Braak, R., Dierssen, W., Dewitte, P.-J., Kenter, P., Landzaat, R., Leloux, J., Loots, E., Meijering, P., van der Plas, E., Rozemeijer, N., Schepers, D., Schiavini, D., Smeets, J., Vacanti, G., Vonk, F., and Veefkind, P.: Pre-launch calibration results of the TROPOMI payload on-board the Sentinel-5 Precursor satellite, Atmos. Meas. Tech., 11, 6439–6479, https://doi.org/10.5194/amt-11-6439-2018, 2018.
Labow, G. J., McPeters, R. D., Bhartia, P. K., and Kramarova, N.: A comparison of 40 years of SBUV measurements of column ozone with data from the Dobson/Brewer network, J. Geophys. Res.-Atmos., 118, 7370–7378, https://doi.org/10.1002/jgrd.50503, 2013.
Lambert, J.-C. and Vandenbussche, S.: EC FP6 GEOmon Technical Note D4.2.1 – Multi-dimensional characterisation of remotely sensed data – Chapter 1: Ground-based measurements, GEOmon TN-IASB-OBSOP/Chapter 1, BIRA-IASB, 2011.
Lerot, C., Van Roozendael, M., van Geffen, J., van Gent, J., Fayt, C., Spurr, R., Lichtenberg, G., and von Bargen, A.: Six years of total ozone column measurements from SCIAMACHY nadir observations, Atmos. Meas. Tech., 2, 87–98, https://doi.org/10.5194/amt-2-87-2009, 2009.
Lerot, C., Van Roozendael, M., Spurr, R., Loyola, D., Coldewey-Egbers, M., Kochenova, S., van Gent, J., Koukouli, M., Balis, D., Lambert, J.-C., Granville, J., and Zehner, C.: Homogenized total ozone data records from the European sensors GOME/ERS-2, SCIAMACHY/Envisat, and GOME-2/MetOp-A, J. Geophys. Res.-Atmos., 119, 1639–1662, https://doi.org/10.1002/2013JD020831, 2014.
Lerot, C., Heue, K.-P., Verhoelst , T., Lambert, J.-C., Balis, D., Garane, K., Granville, G., Koukouli, M.E., Loyola, D., Romahn, F., Van Roozendael, M., Xu, J., Zimmer, W., Bazureau, A., Fioletov, V., Goutail, F., McLinden, C., Pazmiño, A., Pommereau, J.-P., and Zerefos, C.: S5P MPC Product Readme OFFL Total Ozone V01.01.07, issue 1.3, available at: http://www.tropomi.eu/documents/prf, (last access: 5 July 2019), 2019.
Levelt, P. F., Joiner, J., Tamminen, J., Veefkind, J. P., Bhartia, P. K., Stein Zweers, D. C., Duncan, B. N., Streets, D. G., Eskes, H., van der A, R., McLinden, C., Fioletov, V., Carn, S., de Laat, J., DeLand, M., Marchenko, S., McPeters, R., Ziemke, J., Fu, D., Liu, X., Pickering, K., Apituley, A., González Abad, G., Arola, A., Boersma, F., Chan Miller, C., Chance, K., de Graaf, M., Hakkarainen, J., Hassinen, S., Ialongo, I., Kleipool, Q., Krotkov, N., Li, C., Lamsal, L., Newman, P., Nowlan, C., Suleiman, R., Tilstra, L. G., Torres, O., Wang, H., and Wargan, K.: The Ozone Monitoring Instrument: overview of 14 years in space, Atmos. Chem. Phys., 18, 5699–5745, https://doi.org/10.5194/acp-18-5699-2018, 2018.
Loyola, D. G., Koukouli, M., Valks, P., Balis, D., Hao, N., Van Roozendael, M., Spurr, R., Zimmer, W., Kiemle, S., Lerot, C., and Lambert, J.-C.: The GOME-2 Total Column Ozone Product: Retrieval Algorithm and Ground-Based Validation, J. Geophys. Res., 116, D07302, https://doi.org/10.1029/2010JD014675, 2011.
Loyola, D. G., Gimeno García, S., Lutz, R., Argyrouli, A., Romahn, F., Spurr, R. J. D., Pedergnana, M., Doicu, A., Molina García, V., and Schüssler, O.: The operational cloud retrieval algorithms from TROPOMI on board Sentinel-5 Precursor, Atmos. Meas. Tech., 11, 409–427, https://doi.org/10.5194/amt-11-409-2018, 2018.
Loyola, D. G., Heue, K.-P., Xu, J., Zimmer, W., and Romahn, F.: The near-real-time total ozone retrieval algorithm from TROPOMI on board Sentinel-5 Precursor, Atmos. Meas. Tech. Discuss., in preparation, 2019a.
Loyola, D. G., Xu, J., Heue, K.-P., and Zimmer, W.: Applying FP_ILM to the retrieval of geometry-dependent effective Lambertian equivalent reflectivity (GE_LER) to account for BRDF effects on UVN satellite measurements of trace gases, clouds and aerosols, Atmos. Meas. Tech. Discuss., https://doi.org/10.5194/amt-2019-37, in review, 2019b.
Malicet, J., Daumont, D., Charbonnier, J., Parisse, C., Chakir, A., and Brion, J.: Ozone UV Spectroscopy, II. Absorption Cross-Sections and Temperature Dependence, J. Atmos. Chem., 21, 263–273, 1995.
McPeters, R. D. and Labow, G. J.: An MLS and sonde derived ozone climatology for satellite retrieval algorithms, J. Geophys. Res., 117, D10303, https://doi.org/10.1029/2011JD017006, 2012.
Orphal, J., Staehelin, J., Tamminen, J., Braathen, G., De Backer, M.-R., Bais, A., Balis, D., Barbe, A., Bhartia, P. K., Birk, M., Burkholder, J. B., Chance, K., von Clarmann, T. , Cox, A., Degenstein, D., Evans, R., Flaud, J.-M., Flittner, D., Godin-Beekmann, S., Gorshelev, V., Gratien, A., Hare, E., Janssen, C., Kyrölä, E., McElroy, T., McPeters, R., Pastel, M., Petersen, M., Petropavlovskikh, I., Picquet-Varrault, B., Pitts, M., Labow, G., Rotger-Languereau, M., Leblanc, T., Lerot, C., Liu, X., Moussay, P., Redondas, A., Van Roozendael, M., Sander, S. P., Schneider, M., Serdyuchenko, A., Veefkind, P., Viallon, J., Viatte, C., Wagner, G., Weber, M., Wielgosz, R. I., and Zehner, C.: Absorption cross-sections of ozone in the ultraviolet and visible spectral regions: Status report 2015, J. Mol. Spec., 327, 105–121, https://doi.org/10.1016/j.jms.2016.07.007, 2016.
Pommereau, J. P. and Goutail, F.: O3 and NO2 ground-based measurements by visible spectrometry during Arctic winter and spring, Geophys. Res. Lett., 15, 891–894, https://doi.org/10.1029/GL015i008p00891, 1988.
Redondas, A., Evans, R., Stuebi, R., Köhler, U., and Weber, M.: Evaluation of the use of five laboratory-determined ozone absorption cross sections in Brewer and Dobson retrieval algorithms, Atmos. Chem. Phys., 14, 1635–1648, https://doi.org/10.5194/acp-14-1635-2014, 2014.
Rimmer, J. S., Redondas, A., and Karppinen, T.: EuBrewNet – A European Brewer network (COST Action ES1207), an overview, Atmos. Chem. Phys., 18, 10347–10353, https://doi.org/10.5194/acp-18-10347-2018, 2018.
Scarnato, B., Staehelin, J., Peter, T., Gröbner, J., and Stübi, R.: Temperature and slant path effects in Dobson and Brewer total ozone measurements, J. Geophys. Res., 114, D24303, https://doi.org/10.1029/2009JD012349, 2009.
Serdyuchenko, A., Gorshelev, V., Weber, M., Chehade, W., and Burrows, J. P.: High spectral resolution ozone absorption cross-sections – Part 2: Temperature dependence, Atmos. Meas. Tech., 7, 625–636, https://doi.org/10.5194/amt-7-625-2014, 2014.
Solomon, S., Schmeltekopf, A. L., and Sanders, R. W.: On the interpretation of zenith sky absorption measurements, J. Geophys. Res., 92, 8311–8319, https://doi.org/10.1029/JD092iD07p08311, 1987.
Theys, N., Hedelt, P., De Smedt, I., Lerot, C., Yu, H., Vlietinck, J., Pedergnana, M., Arellano, S., Galle, B., Fernandez, D., Carlito, C. J. M., Barrington, C., Taisne, B., Delgado-Granados, H., Loyola, D., and Van Roozendael, M.: Global monitoring of volcanic SO2 degassing with unprecedented resolution from TROPOMI onboard Sentinel-5 Precursor, Sci. Rep., 9, 2643, https://doi.org/10.1038/s41598-019-39279-y, 2019.
Van Roozendael, M., Peeters, P., Roscoe, H. K., De Backer, H., Jones, A., Bartlett, L., Vaughan, G., Goutail, F., Pommereau, J.-P., Kyro, E., Wahlstrom, C., Braathen, G., and Simon, P.: Validation of Ground-Based Visible Measurements of Total Ozone by Comparison with Dobson and Brewer Spectrophotometers, J. Atmos. Chem., 29, 55–83, 1998.
Van Roozendael, M., Loyola, D., Spurr, R., Balis, D., Lambert, J.-C., Livschitz, Y., Valks, P., Ruppert, T., Kenter, P., Fayt, C., and Zehner, C.: Ten years of GOME/ERS-2 total ozone data: the new GOME Data Processor (GDP) Version 4: I. Algorithm Description, J. Geophys Res., 111, D14311, https://doi.org/10.1029/2005JD006375, 2006.
Veefkind, J. P., Aben, I., McMullan, K., Förster, H. , de Vries, J., Otter, G., Claas, J., Eskes, H. J., de Haan, J. F., Kleipool, Q., van Weele, M., Hasekamp, O., Hoogeveen, R., Landgraf, J., Snel, R., Tol, P., Ingmann, P., Voors, R. , Kruizinga, B., Vink, R., Visser, H., and Levelt, P. F.: TROPOMI on the ESA Sentinel-5 Precursor: A GMES mission for global observations of the atmospheric composition for climate, air quality and ozone layer applications, Remote Sens. Environ., 120, 70–83, https://doi.org/10.1016/j.rse.2011.09.027, 2012.
Verhoelst, T., Granville, J., Hendrick, F., Köhler, U., Lerot, C., Pommereau, J.-P., Redondas, A., Van Roozendael, M., and Lambert, J.-C.: Metrology of ground-based satellite validation: co-location mismatch and smoothing issues of total ozone comparisons, Atmos. Meas. Tech., 8, 5039–5062, https://doi.org/10.5194/amt-8-5039-2015, 2015.
Ziemke, J. R., Chandra, S., Labow, G. J., Bhartia, P. K., Froidevaux, L., and Witte, J. C.: A global climatology of tropospheric and stratospheric ozone derived from Aura OMI and MLS measurements, Atmos. Chem. Phys., 11, 9237–9251, https://doi.org/10.5194/acp-11-9237-2011, 2011.
- Abstract
- Introduction
- Level 2 total ozone columns: data description
- Validation of the NRTI and OFFL TOC
- Inter-sensor consistency
- Summary and conclusions
- Data availability
- Author contributions
- Competing interests
- Special issue statement
- Acknowledgements
- Financial support
- Review statement
- References
- Supplement