the Creative Commons Attribution 4.0 License.
the Creative Commons Attribution 4.0 License.
 | 15 Oct 2019
Improving the TROPOMI CO data product: update of the spectroscopic database and destriping of single orbits
Joost aan de Brugh
Andreas Schneider
Alba Lorente
Manfred Birk
Georg Wagner
Rigel Kivi
Frank Hase
Dietrich G. Feist
Ralf Sussmann
Markus Rettinger
Debra Wunch
Thorsten Warneke
Jochen Landgraf
On 13 October 2017, the Tropospheric Monitoring Instrument (TROPOMI) was launched on the Copernicus Sentinel-5 Precursor satellite in a sun-synchronous orbit. One of the mission's operational data products is the total column concentration of carbon monoxide (CO), which was released to the public in July 2018. The current TROPOMI CO processing uses the HITRAN 2008 spectroscopic data with updated water vapor spectroscopy and produces a CO data product compliant with the mission requirement of 10 % precision and 15 % accuracy for single soundings. Comparison with ground-based CO observations of the Total Carbon Column Observing Network (TCCON) show systematic differences of about 6.2 ppb and single-orbit observations are superimposed by a significant striping pattern along the flight path exceeding 5 ppb. In this study, we discuss possible improvements of the CO data product. We found that the molecular spectroscopic data used in the retrieval plays a key role for the data quality where the use of the Scientific Exploitation of Operational Missions – Improved Atmospheric Spectroscopy Databases (SEOM-IAS) and the HITRAN 2012 and 2016 releases reduce the bias between TROPOMI and TCCON due to improved CH4 spectroscopy. SEOM-IAS achieves the best spectral fit quality (root-mean-square, rms, differences between the simulated and measured spectrum) of mol s−1 m−2 nm−1 sr−1 and reduces the bias between TROPOMI and TCCON to 3.4 ppb, while HITRAN 2012 and HITRAN 2016 decrease the bias even further below 1 ppb. HITRAN 2012 shows the worst fit quality (rms = mol s−1 m−2 nm−1 sr−1) of the tested cross sections and furthermore introduces an artificial bias of about molec cm−2 between TROPOMI CO and the CAMS-IFS model in the Tropics caused by the H2O spectroscopic data. Moreover, analyzing 1 year of TROPOMI CO observations, we identified increased striping patterns by about 16 % percent from November 2017 to November 2018. For that, we defined a measure γ, quantifying the relative pixel-to-pixel variation in CO in the cross-track and along-track directions. To mitigate this effect, we discuss two destriping methods applied to the CO data a posteriori. A destriping mask calculated per orbit by median filtering of the data in the cross-track direction significantly reduced the stripe pattern from γ=2.1 to γ=1.6. However, the destriping can be further improved, achieving γ=1.2 by deploying a Fourier analysis and filtering of the data, which not only corrects for stripe patterns in the cross-track direction but also accounts for the variability of stripes along the flight path.
- Article
(8969 KB) - Full-text XML
- BibTeX
- EndNote


The Tropospheric Monitoring Instrument (TROPOMI) is the single payload of the Copernicus Sentinel-5P satellite that was launched by the European Space Agency (ESA) on 13 October 2017. The instrument provides spectral measurements of the solar radiance reflected by Earth and its atmosphere in the ultraviolet-visible (UV-VIS, 270–495 nm), near-infrared (NIR, 675–775 nm) and shortwave-infrared (SWIR, 2305–2385 nm) (Veefkind et al., 2012). The novelty of the mission is the daily global coverage, the high spatial resolution of 3.5×7 or 7×7 km2 depending on spectral range, and the higher signal-to-noise ratio (SNR).
One of the primary goals of the mission is to measure the total column concentration of carbon monoxide (CO) in Earth's atmosphere. CO is a trace gas emitted by incomplete combustion (e.g., biomass burning, traffic and industrial activity) and its only sink is the reaction with the hydroxyl radical (OH) (Spivakovsky et al., 2000). Due to its relative low background concentration and its moderate lifetime (Holloway et al., 2000), it is established as a tracer for anthropogenic air pollution and the atmospheric transport of pollutants on local, regional and global scales.
The TROPOMI CO data product is retrieved from the SWIR measurements of the TROPOMI instrument (Landgraf et al., 2016a, b). Early in the mission, Borsdorff et al. (2018b) intercompared the TROPOMI CO column with the simulated CO fields of the Copernicus Atmosphere Monitoring Service – Integrated Forecasting System (CAMS-IFS), released by the European Centre for Medium‐Range Weather Forecasts (ECMWF). Furthermore, Borsdorff et al. (2018a) validated the product with ground-based Fourier transform (FTS) measurements from selected sites in the Total Carbon Column Observing Network (TCCON) network, which resulted in the release of the TROPOMI CO data product by ESA in July 2018. The analysis of Borsdorff et al. (2018a) showed a significant difference of about 6.4 ppb between the TROPOMI CO data product and the ground-based validation measurements of the TCCON network. Here, the bias between TROPOMI and the TCCON CO measurements was used to estimate the product accuracy, and the scatter in the difference between both measurements indicated an upper boundary for the precision of the TROPOMI instrument. This study also showed that stripe patterns along the flight path in the TROPOMI CO data for single orbits can exceed 5 ppb (Borsdorff et al., 2018a), which could hamper, e.g., the detection of pollution hotspots and emission estimates. Moreover, the comparison of the TROPOMI and the CAMS-IFS CO datasets indicated a latitudinal difference, which represents a problem for the assimilation of the product (Borsdorff et al., 2018b; Inness et al., 2019).
In this study, we discuss, in detail, the open issues of the TROPOMI CO data product and possible mitigation strategies. Section 2 introduces the TROPOMI CO data, the CO validation measurements of the TCCON network and the CO CAMS-IFS data. In Sect. 3.1, we discuss the use of different molecular spectroscopic databases, the induced biases between TROPOMI CO and the TCCON measurements, and the latitudinally dependent bias between TROPOMI CO and the CAMS-IFS model. Section 3.2 discusses two methods for the stripe correction of single TROPOMI CO orbits. Finally, Sect. 4 provides a summary and recommendations for future TROPOMI CO retrieval approaches.
The operational TROPOMI CO data processing deploys the shortwave-infrared CO retrieval (SICOR) algorithm that includes atmospheric light scattering by clouds to retrieve the vertical trace gas columns of CO, H2O, HDO and CH4, together with effective parameters describing the cloud contamination of the measurements (cloud altitude z and cloud optical thickness τ). The theoretical details for the algorithm are described by Vidot et al. (2012) and Landgraf et al. (2016a, b). For this study, we analyze 1 year of TROPOMI SWIR measurements from November 2017 to November 2018 using the operational SICOR as used by Borsdorff et al. (2018b, a, 2019).
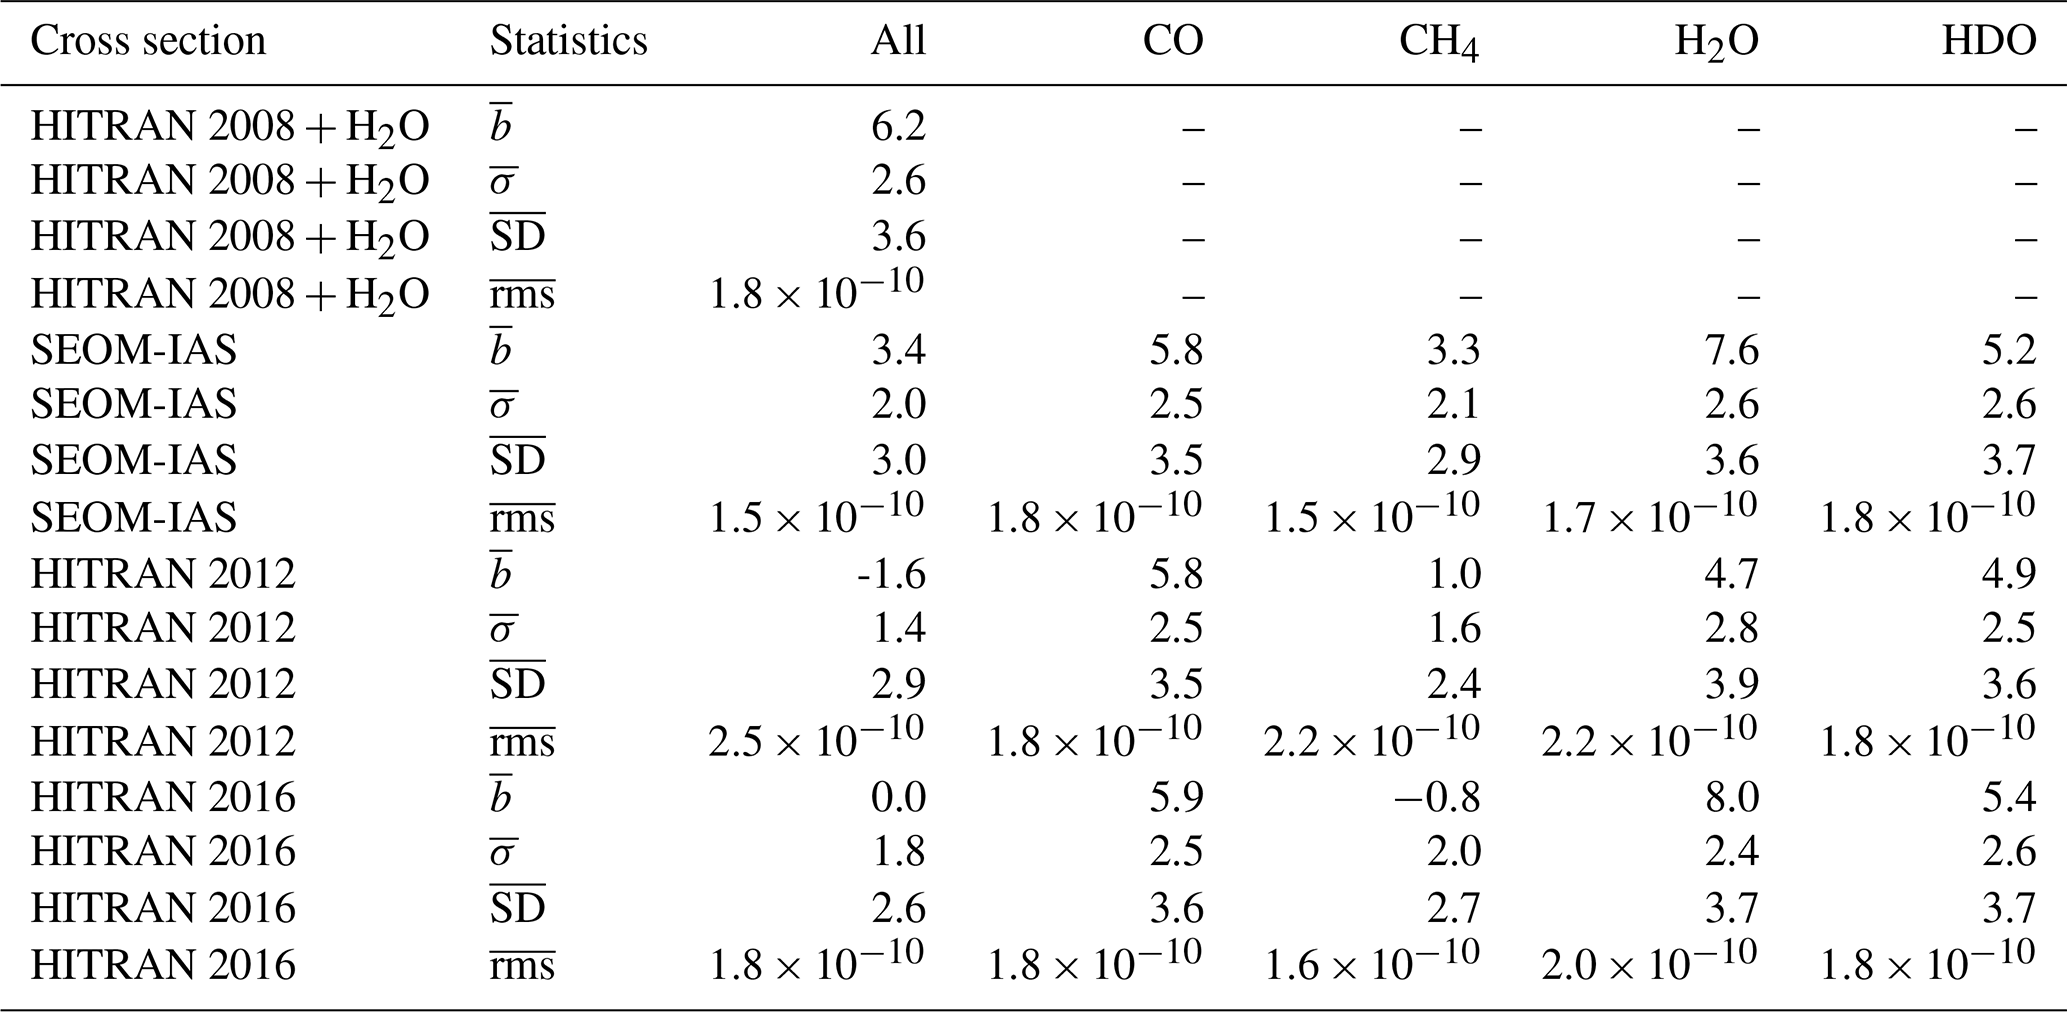
Table 1TROPOMI CO bias with respect to TCCON (, , ) and the spectral fit quality () in mol s−1 m−2 nm−1 sr−1, as is introduced in Fig. 3, for different spectroscopic databases (HITRAN 2008 + H2O, SEOM-IAS, HITRAN 2012 and HITRAN 2016). The column “all” gives the values for when the spectroscopic databases are used for all species. The other columns indicate the characteristics for when the spectroscopy of only one species is updated. Here, only TROPOMI clear-sky retrievals are considered and no destriping is applied.
The radiative transfer, and thus the data interpretation, depends on spectroscopic data to simulate the absorption lines of atmospheric trace gases. The operational TROPOMI CO processor uses the line lists of HITRAN 2008 (Rothman et al., 2009) for the trace gases CO and CH4 and the updated water vapor spectroscopy for HDO and H2O by Scheepmaker et al. (2012), who updated the line intensities, pressure shifts and pressure broadening parameters by fitting laboratory spectra of water vapor (HITRAN 2008 +H2O in Table 1). They showed that the H2O column retrieval from ground-based FTS measurements is improved by the updated line parameters. The HITRAN 2012 release (Rothman et al., 2013) also addressed deficiencies identified in the HITRAN 2008 water vapor line list. Recently, the Scientific Exploitation of Operational Missions – Improved Atmospheric Spectroscopy Database (SEOM-IAS), which is an ESA project, revised the line list parameters and absorption cross sections of O3, CO, CH4, H2O, HDO and SO2 with the objective of improving the quality of the Sentinel-5P data products (https://www.wdc.dlr.de/seom-ias/, last access: 10 October 2019). The CH4 and H2O line lists of SEOM-IAS were tested by fitting atmospheric spectra recorded by FTIR spectrometry, resulting in significantly improved residuals in spectral sections dominated by CH4 and H2O compared to HITRAN 2012 (Hase et al., 2018). Some of the updates from SEOM-IAS regarding the spectroscopy of water vapor are already integrated in the new HITRAN 2016 release (Gordon et al., 2017).
To test the effect of the different spectroscopic databases on the TROPOMI CO retrieval, we performed multiple retrievals where we substituted the spectroscopic data used for the operational TROPOMI CO retrieval based on HITRAN 2008 with H2O updated by Scheepmaker et al. (2012) with data from either SEOM-IAS, HITRAN 2012 or HITRAN 2016. Here we substituted the spectroscopic data for all retrieval species at once but also for each trace gas individually. The remaining retrieval settings are identical to the ones of the operational processing.
Kivi et al. (2014); Kivi and Heikkinen (2016)Wunch et al. (2018)Hase et al. (2015)Warneke et al. (2014)Sussmann and Rettinger (2018a)Sussmann and Rettinger (2018b)Wennberg et al. (2017)Wennberg et al. (2016)Iraci et al. (2016)Wennberg et al. (2015)Kawakami et al. (2014)Blumenstock et al. (2017)Pollard et al. (2019)Table 2Ground-based TCCON stations used for validation. The latitude and longitude values are given in degrees, and the surface elevation is given in kilometers.
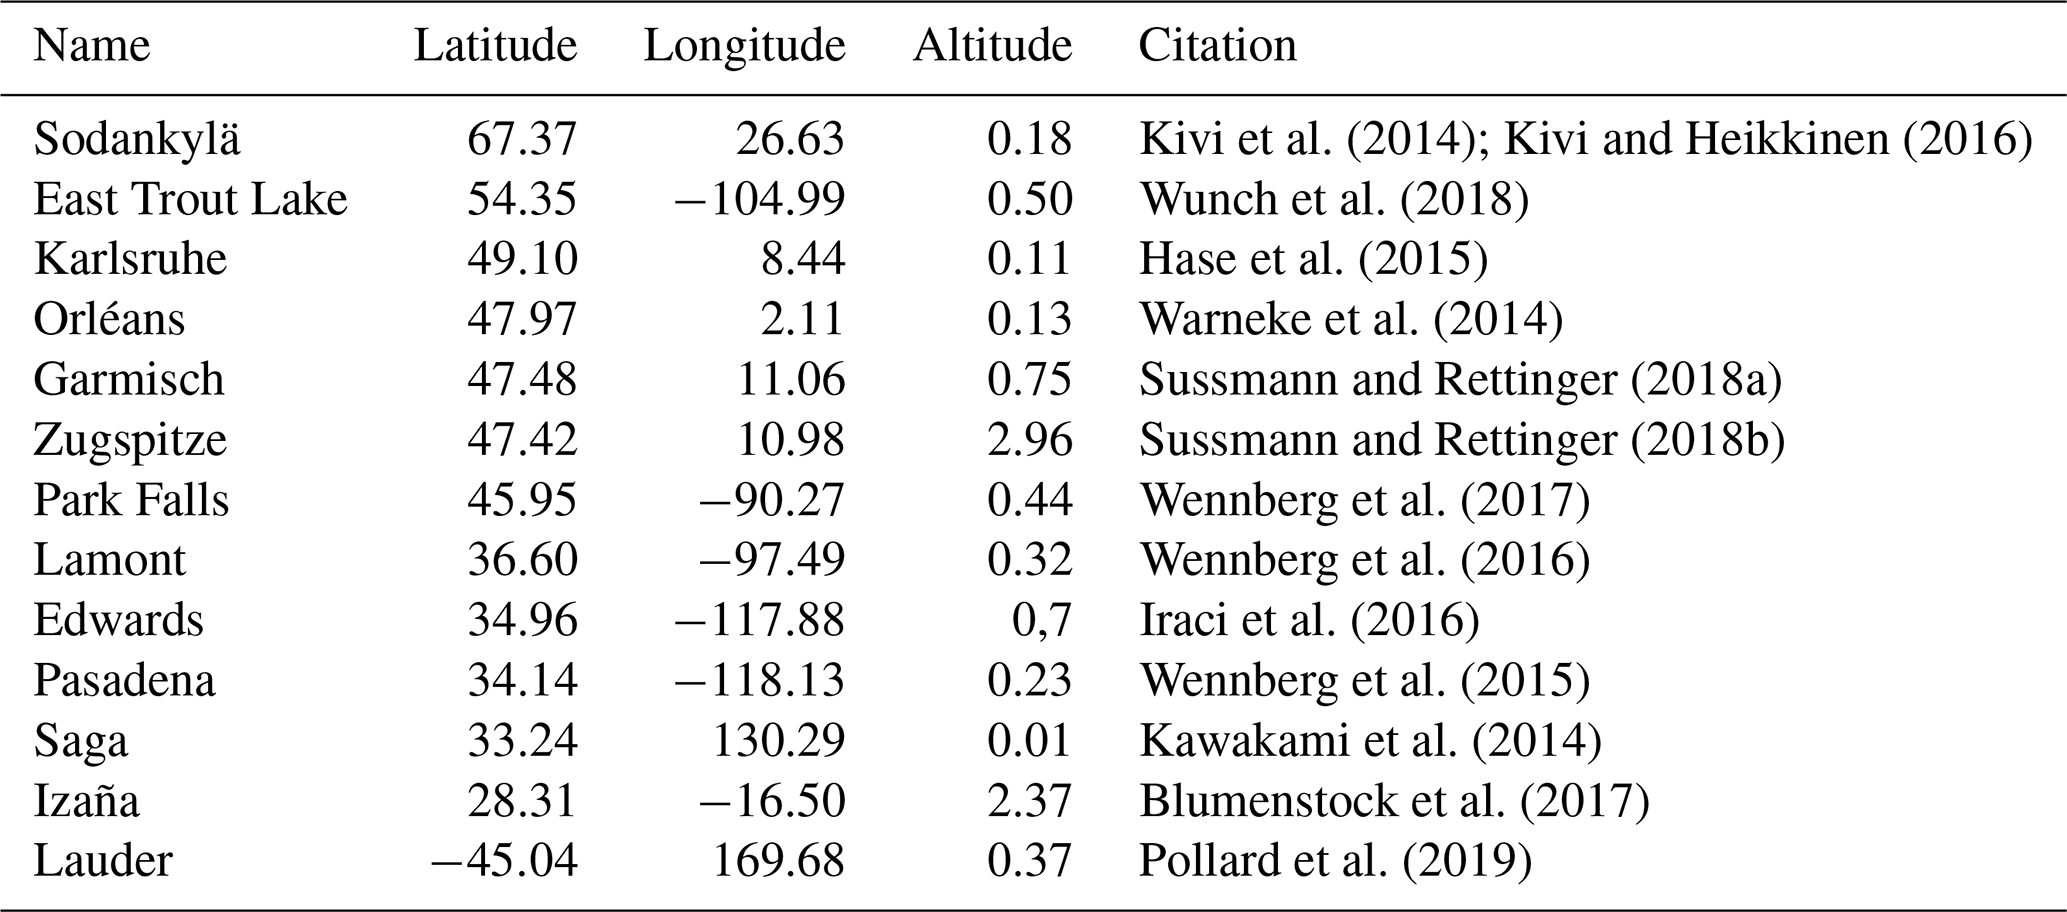
For the different spectroscopies, we validated the TROPOMI CO column densities with the TCCON CO product at several sites of the network. The TCCON CO columns have an accuracy better than 4 % (Wunch et al., 2015). The geolocation, altitude and citation information of the TCCON stations is summarized in Table 2. The validation approach is described in detail by Borsdorff et al. (2018a). First, we select TROPOMI CO data in a radius of 50 km around a TCCON site and subsequently correct it for the altitude difference between the TROPOMI ground pixel and the site. Finally, we compare daily averaged TROPOMI and TCCON CO data of the same day and estimate the scatter in the TROPOMI data.
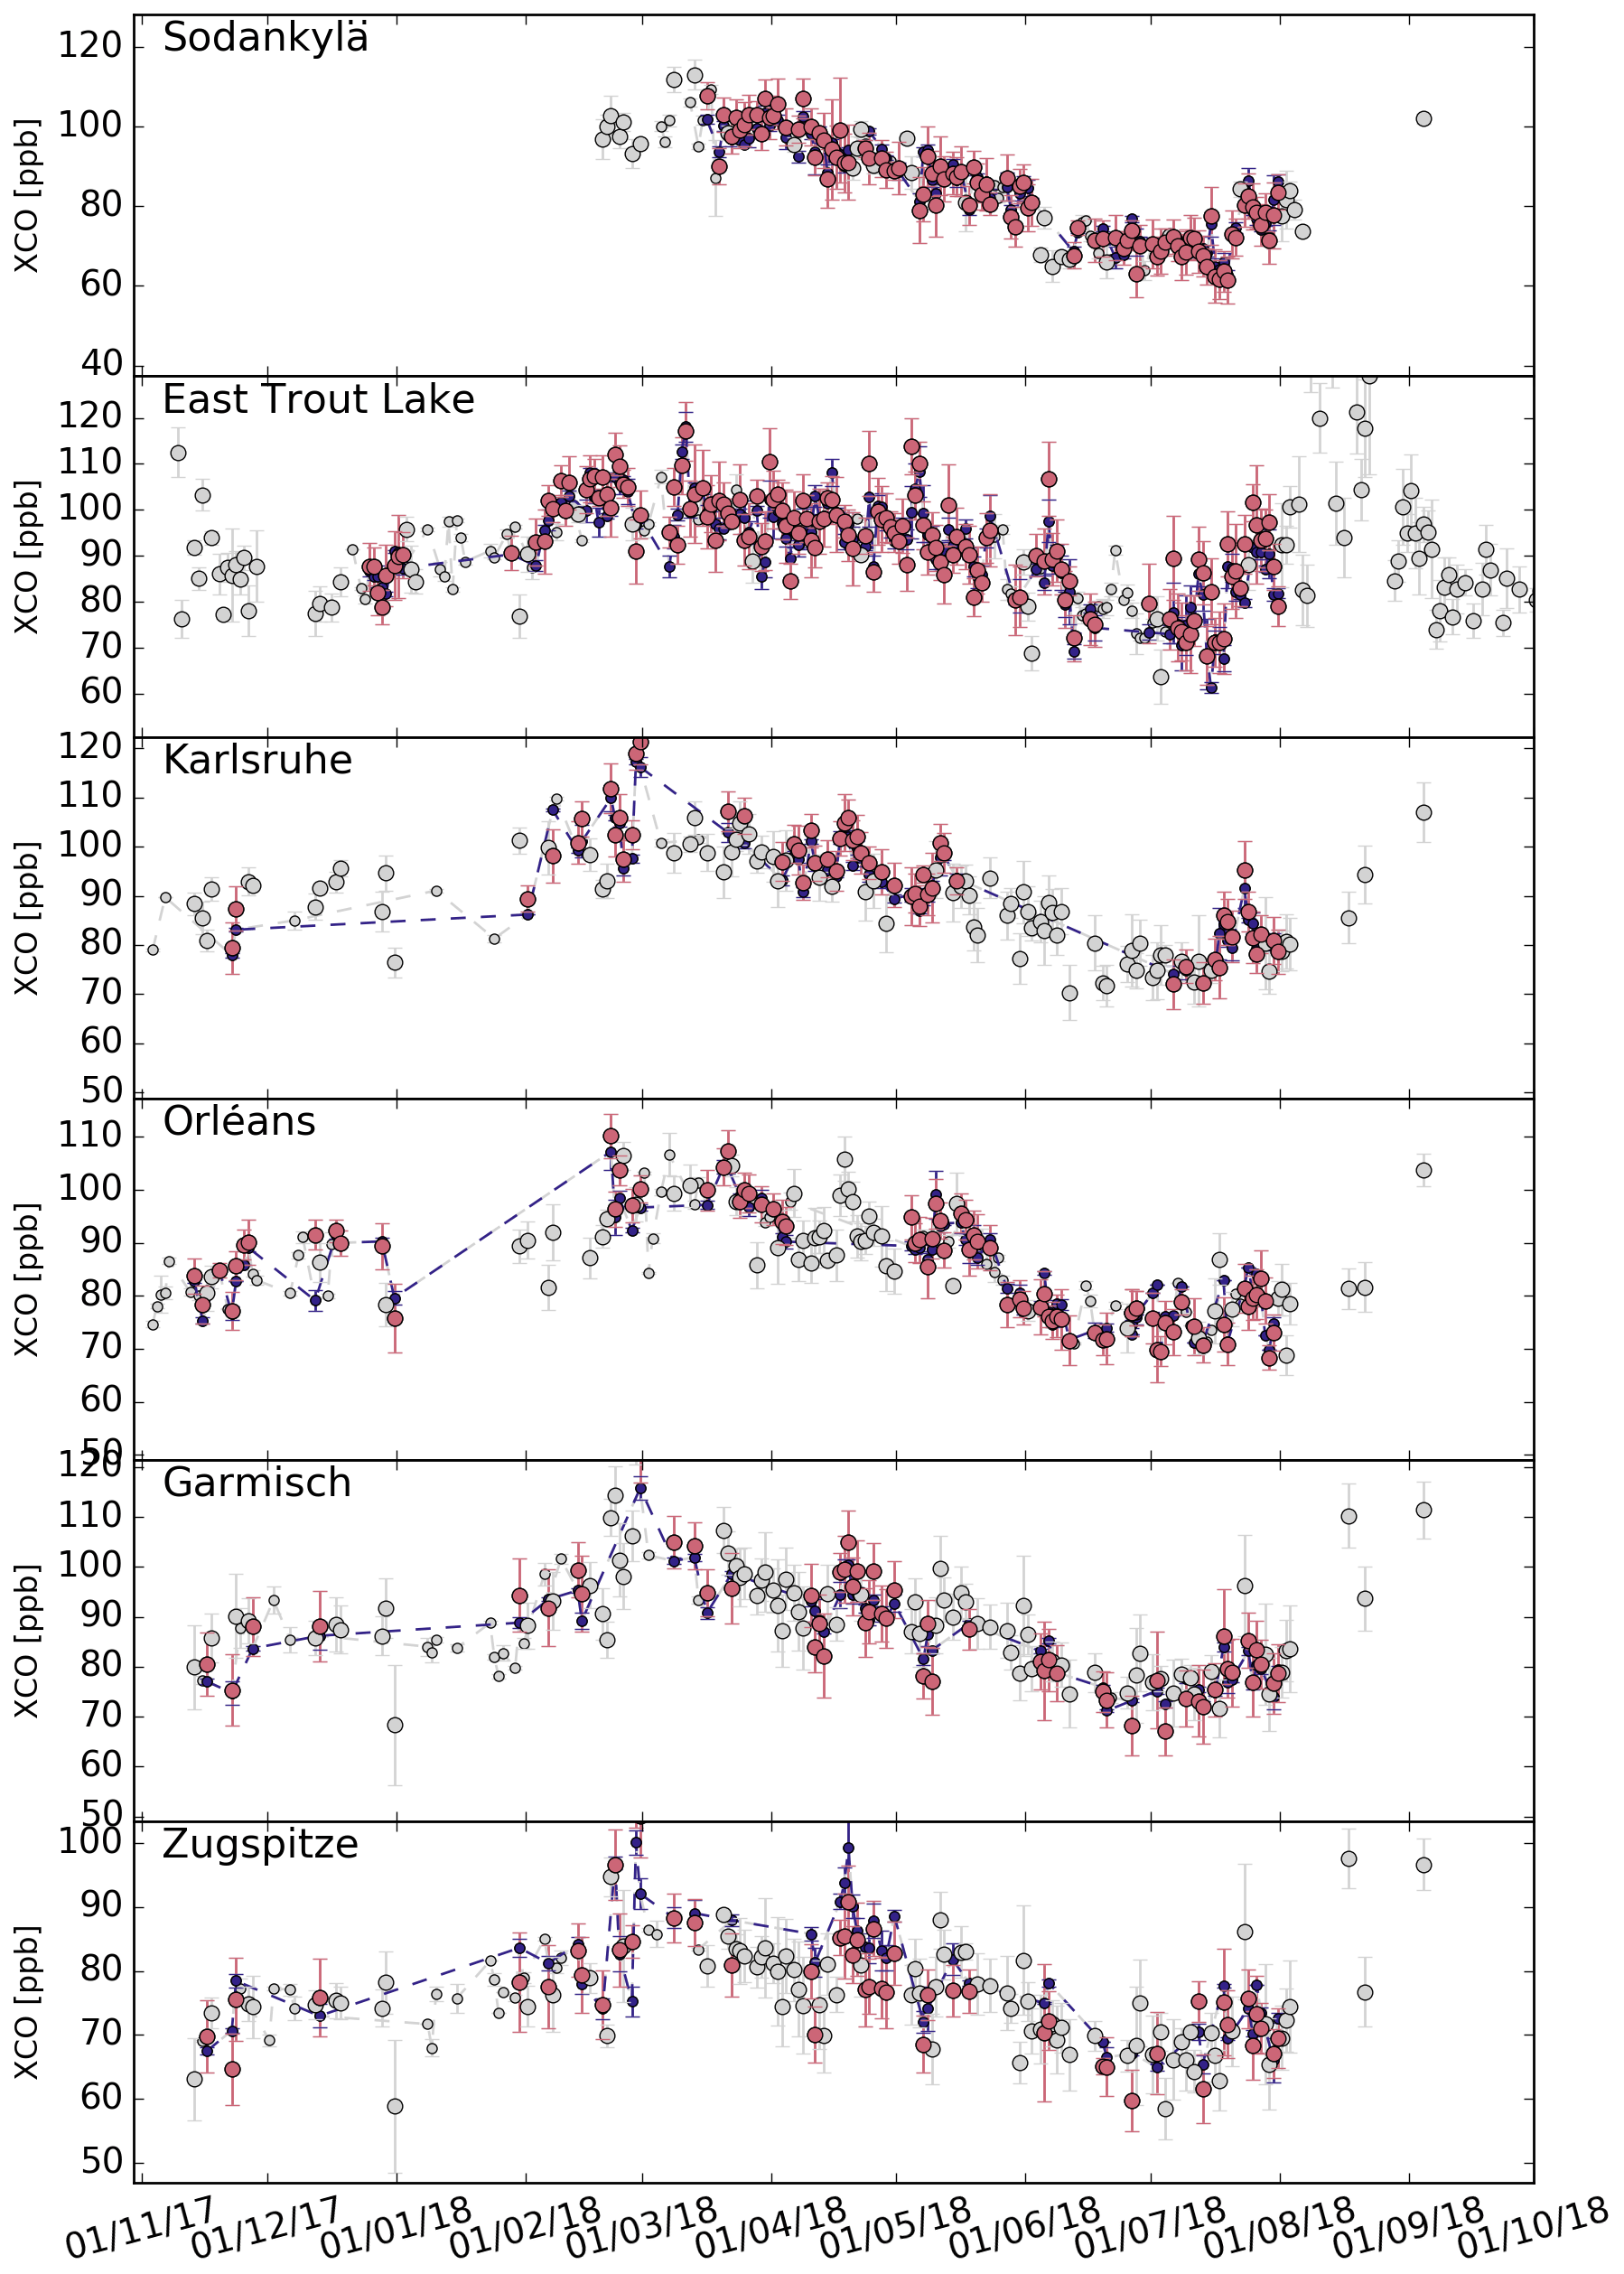
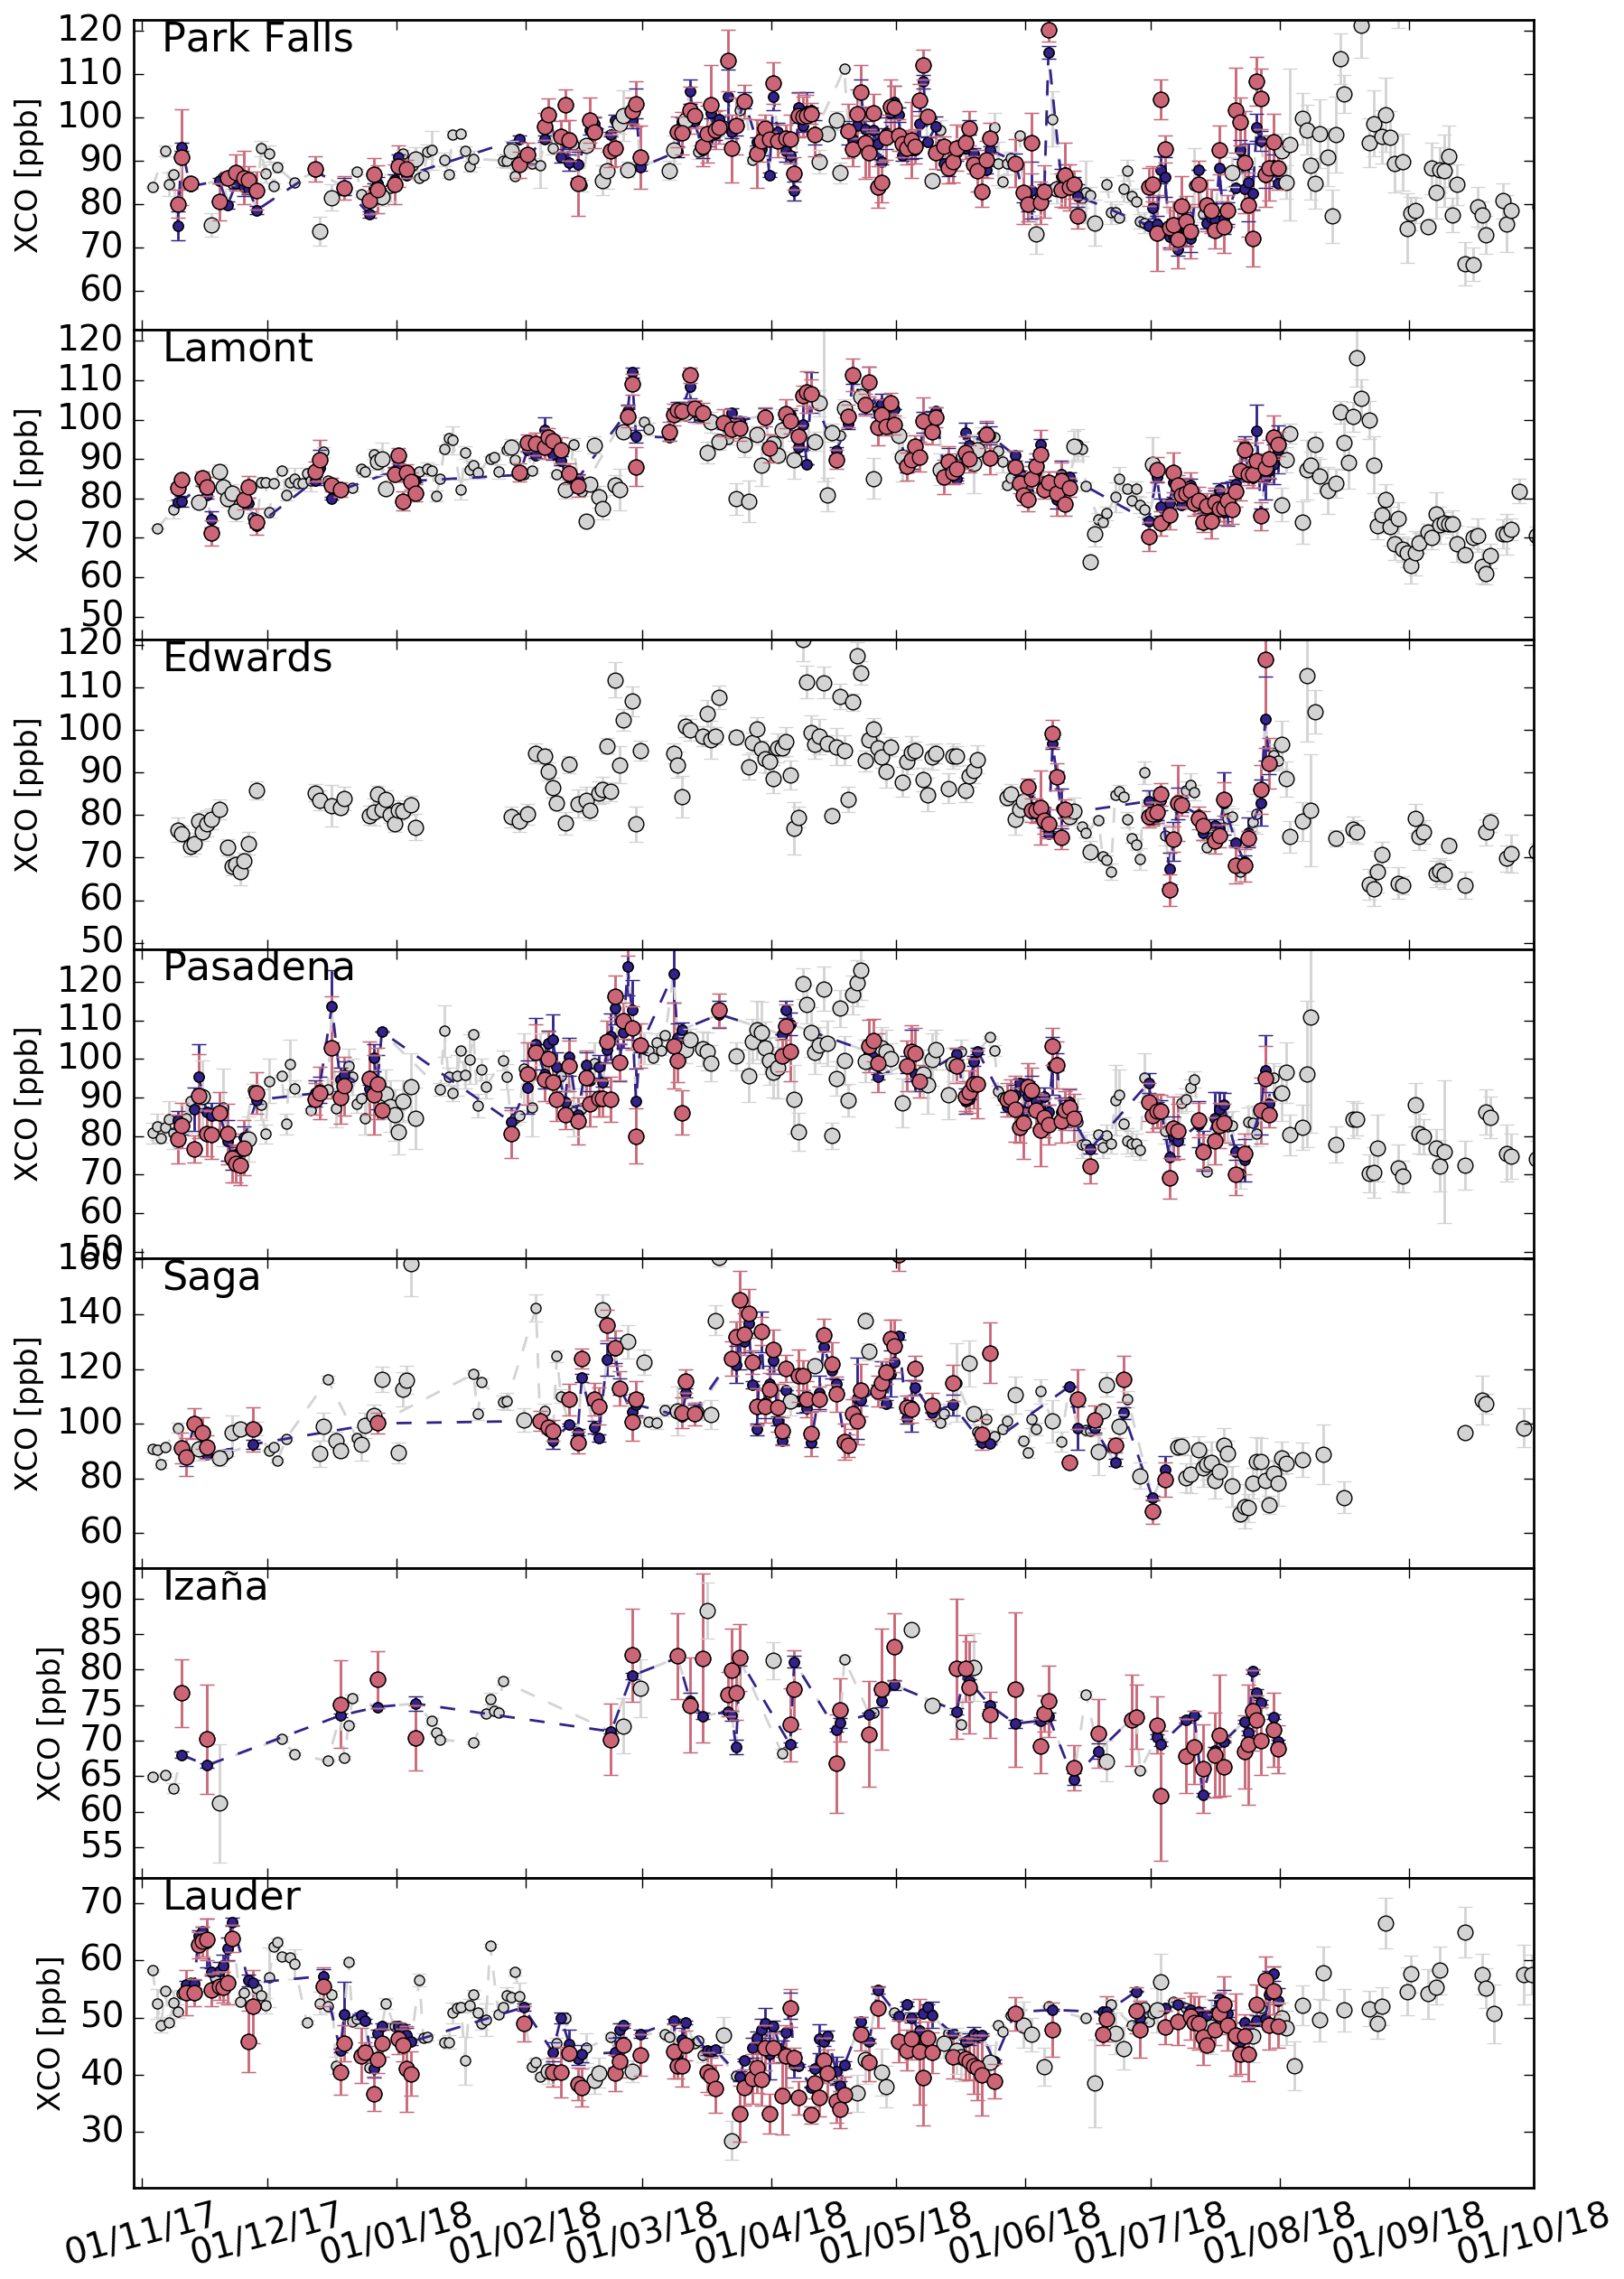
Figure 1Daily mean of dry air column mixing ratios (XCO) measured by TROPOMI (pink) and various TCCON stations (blue) under clear-sky and cloudy atmospheric conditions. A colocation radius of 50 km is used. The standard deviation of individual retrievals within a day is shown as an error bar. The retrieval deployed the spectroscopic database HITRAN 2016 for all trace gases. Measurements of both datasets that could not be paired are marked as gray dots (big = TROPOMI, small = TCCON) and are not used in this study.
For the validation of the TROPOMI data, we discriminated between clear-sky observations and those with low clouds, as described by Borsdorff et al. (2018a). Figures 1 and 2 give an example of a time series of daily mean dry air CO column mixing ratios (XCO), deploying the HITRAN 2016 spectroscopic data. The blue and pink symbols indicate colocated data pairs. These are used for further data analysis in this study, whereas all gray data points are discarded. Moreover, to evaluate the quality of the spectral fit for each retrieval, we consider the root-mean-square difference , where index l indicates the L spectral components of the measurement ymeas and its simulation ysim after convergence of the retrieval. Finally, for a colocated data pair, we determine the corresponding averaged root-mean-square difference.
For further analysis, we define a set of diagnostic quantities. For each station of our dataset, we define the median bias bj as the median of the difference between TROPOMI and TCCON XCO daily mean measurements, where index j identifies the station and i indicates the pair of colocated daily mean values. Also, the correspondent median root-mean-square difference rmsj is determined. To characterize the scatter in the difference between TROPOMI and TCCON data, we consider the percentile difference of the bias distribution,
which corresponds to the standard deviation of normal distributed parameters but is more robust against outliers. Hence, the choice of the 84.1 and 15.9 percentiles would be the ±1 1σ around the mean for a normal curve. Moreover, the global mean bias is the mean bias of all station biases,
with n the number of stations and the station-to-station bias variation is defined as the standard derivation
Figure 3 shows the statistics of the corresponding biases between TROPOMI and the TCCON measurements.

Figure 3(a) Median bias bj (TROPOMI-TCCON) for different TCCON sites between colocated daily mean XCO values of TROPOMI and TCCON (see blue and pink dots in Figs. 1 and 2) The global mean bias and the corresponding standard derivation as defined in Eqs. (2) and (3), (b) the scatter δPj of the biases as defined in Eq. (1) with its global mean , and (c) the median root-mean-square (rms) of the spectral fit residuals of the individual retrievals per station and its global mean in mol s−1 m−2 nm−1 sr−1. The figure shows TROPOMI retrievals under clear-sky conditions (yellow), cloudy-sky conditions (blue) and the combination of both (pink). No destriping is applied to the TROPOMI data. The retrieval deploys the spectroscopic database HITRAN 2016 for all absorbers.
The intercomparison of the TROPOMI CO retrievals with the CO data of the CAMS-IFS model follows the approach as described in Borsdorff et al. (2018b), where we interpolated the vertical profiles of the model spatially and temporally to the time and geolocation of the ground pixels of TROPOMI. Then we calculated the total column concentration of CO from the model profiles by multiplying them with corresponding total column averaging kernels of TROPOMI that are provided for each measurement. In this way the comparison is free of the null-space or smoothing error contribution (Rodgers, 2000).

3.1 Spectroscopic databases
The bias between TROPOMI CO and the ground-based validation measurements of the TCCON network depends significantly on the spectroscopic database used in the retrieval. Using HITRAN 2016 (see Fig. 3) instead of HITRAN 2008 with H2O updated by Scheepmaker et al. (2012) (see Fig. 4), the difference between TCCON and TROPOMI CO is reduced from 6.2 to 0 ppb for clear sky observations and the station-to-station variability of the bias decreases from 2.6 to 1.8 ppb. Also the scatter δP of the bias is reduced from 3.6 to 2.6 ppb. Retrievals from cloudy and clear sky observations agree well and show similar improvements, whereas the fit quality represented by the root-mean-square (rms) differences between the simulated spectrum and the measurement is only slightly improved. Overall, we conclude an improved agreement between the TROPOMI and TCCON observations using the most recent HITRAN data release from 2016.
Table 1 provides the TROPOMI-TCCON mean bias, the scatter, and the rms of the spectral fit residuals when using the current TROPOMI spectroscopic database and the SEOM-IAS, HITRAN 2012, or HITRAN 2016 database. We found that any of the new spectroscopic databases improve the bias and δP of the biases between TCCON and TROPOMI. For SEOM-IAS, the TROPOMI CO retrievals differ by 3.4 ppb compared to the TCCON results. Furthermore, the table also shows the diagnostics when changing the spectroscopy of only one trace gas and keeping the current TROPOMI spectroscopic database for the other species. It clearly indicates that updating the CH4 cross sections is the main reason for the improved CO product. The quality of the spectral fit is only enhanced using the SEOM-IAS spectroscopy (rms = mol s−1 m−2 nm−1 sr−1), HITRAN 2016 provides the same fit quality as our baseline spectroscopy (rms = mol s−1 m−2 nm−1 sr−1), while HITRAN 2012 worsens it (rms = mol s−1 m−2 nm−1 sr−1).
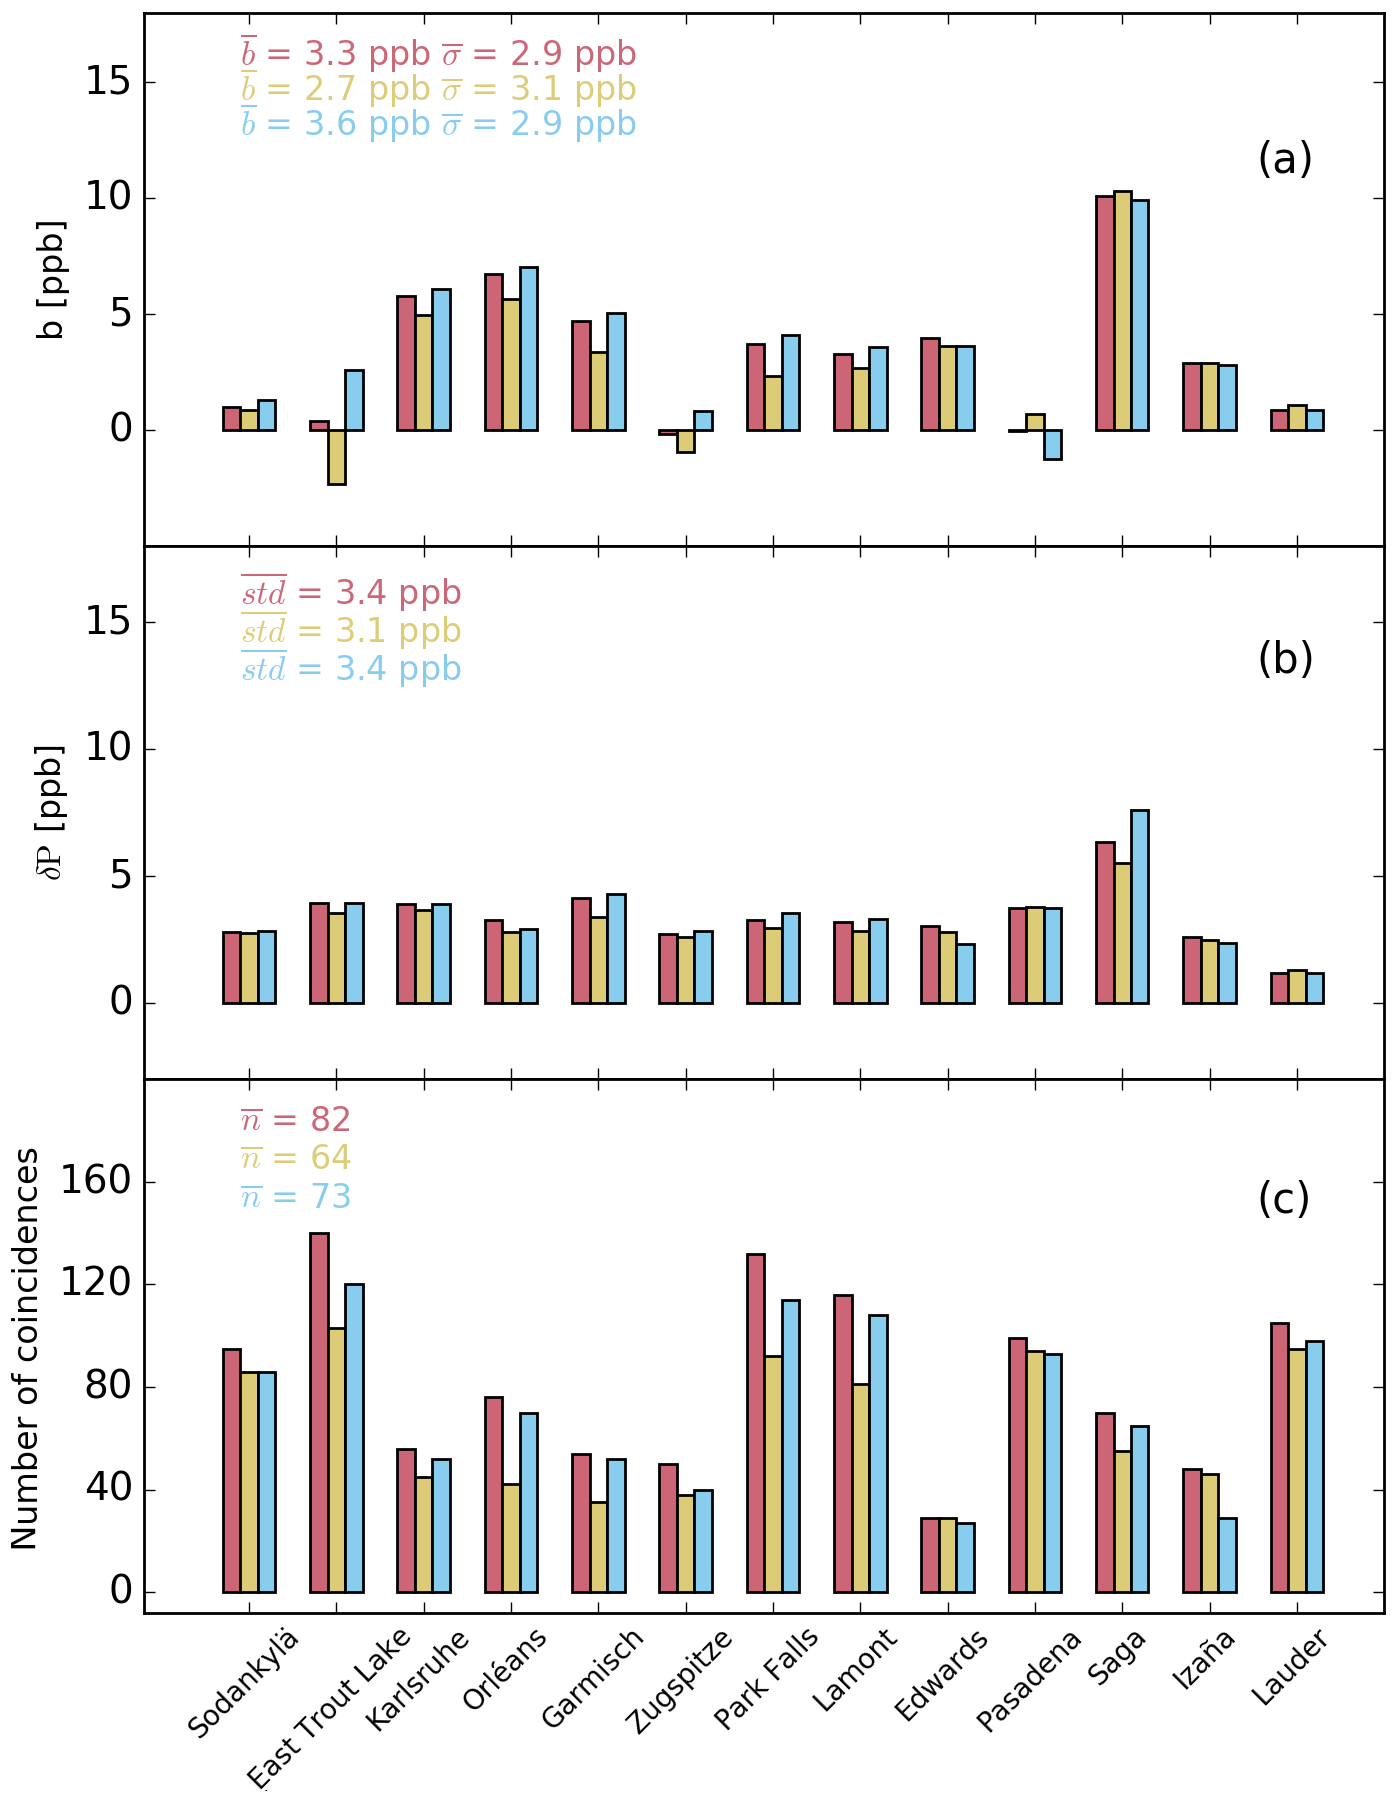
Figure 5The same as Fig. 3 but comparing TCCON measurements with CAMS-IFS CO model data, which are colocated with the TROPOMI observations of Fig. 3. To this end, we interpolated the CAMS-IFS model temporally and spatially to TROPOMI measurements and also applied the averaging kernels of TROPOMI on the vertical profiles of the model. In this model comparison a spectral fit quality (rms) plot is not needed and is therefore replaced by the number of coincidences.
One of the main applications of the TROPOMI CO data is its use in the CAMS-IFS assimilation system to improve chemical weather forecasting. Therefore, nonphysical differences between TROPOMI CO product and the CAMS-IFS model must be avoided. To evaluate this, we first aim to mimic the TROPOMI CO validation in Fig. 3 but instead using CAMS-IFS CO data instead of TROPOMI observations. Therefore, we spatiotemporally interpolated the model profiles to the corresponding TROPOMI clear-sky and cloudy measurements and applied the averaging kernels. Figure 5 shows a mean difference between CAMS-IFS and TCCON of 2.7 ppb for clear-sky conditions with a station-to-station variability of 2.7 ppb and a scatter of the bias of 4.9 ppb. We obtain very similar results when using the averaging kernels for cloudy conditions. Therefore, we can conclude that CAMS-IFS agrees well with TROPOMI CO and the retrievals from the TCCON network.
Inness et al. (2019) reported a latitudinally dependent difference between TROPOMI CO and CAMS-IFS model. From 28 January to 3 May 2018, TROPOMI CO is biased high compared to CAMS-IFS by molec cm−2 in the high Northern Hemisphere, molec cm−2 in the Tropics and molec cm−2 in the low Southern Hemisphere. The CAMS-IFS model is known to underestimate CO in the Northern Hemisphere extra-tropics, particularly in winter and spring. Hence, part of the bias between CAMS-IFS and TROPOMI could be due to the model, but a systematic error in the TROPOMI CO data cannot be excluded. Figure 6 shows the longitudinally averaged difference between TROPOMI and CAMS-IFS CO fields using the current TROPOMI spectroscopic database, the SEOM-IAS, the HITRAN 2012 and 2016 spectroscopy (color coded) for 10 October 2018. Again, we spatiotemporally interpolated the CAMS-IFS CO profiles to the TROPOMI data and applied the TROPOMI averaging kernels to calculate the CAMS-IFS total CO column concentrations. Figure 6a indicates that the differences are largest for the current baseline spectroscopy and HITRAN 2012 while for the SEOM-IAS spectroscopy CAMS-IFS agree the best with TROPOMI CO. The relative latitudinal dependence of the differences are shown in Fig. 6b, which indicates that HITRAN 2016 spectroscopy leads to the smallest latitudinal dependence of the differences, while HITRAN 2012 results in unrealistic deviations between model and TROPOMI observations of about molec cm−2 due to the involved H2O spectroscopic data of HITRAN 2012.

Figure 6(a) Longitudinally averaged difference between TROPOMI and CAMS-IFS model data for 10 October 2018 (TROPOMI-CAMS-IFS). The CAMS-IFS model are spatiotemporally interpolated to the TROPOMI measurements and averaging kernels are applied. The colors indicate the bias when using different spectroscopic databases in the TROPOMI retrieval. Panel (b) is the same as (a) but relative to the corresponding difference at 0∘ latitude to visualize the different gradients in latitude.
To conclude, the choice of a spectroscopic database used for the TROPOMI CO retrieval is crucial. When relying on the TCCON measurements as a validation source, the HITRAN 2016 spectroscopy database is the best choice for the TROPOMI CO retrieval, with no significant overall bias to the validation network and the smallest latitudinally dependent difference with the CAMS-IFS model. Overall, the SEOM-IAS spectroscopy improves the TROPOMI CO retrieval similar to HITRAN 2016 but comes with a small bias compared to the measurements of the TCCON network. It is the only spectroscopy database that improves the fit quality (rms = mol s−1 m−2 nm−1 sr−1) of the TROPOMI CO retrieval and has practically no bias with the CAMS-IFS model. It is important to note that HITRAN 2016 and SEOM-IAS are not completely independent, since some of the updates from SEOM-IAS are already included in HITRAN 2016. For the operational TROPOMI data processing, the HITRAN 2012 database is out of consideration since it worsens the fit quality (rms = mol s−1 m−2 nm−1 sr−1) quality of the TROPOMI CO retrieval and introduces an artificial bias of about molec cm−2 with CAMS-IFS caused by issues in the water spectroscopy. We could not see this by comparing with TCCON data because not so many stations are available at the Equator.
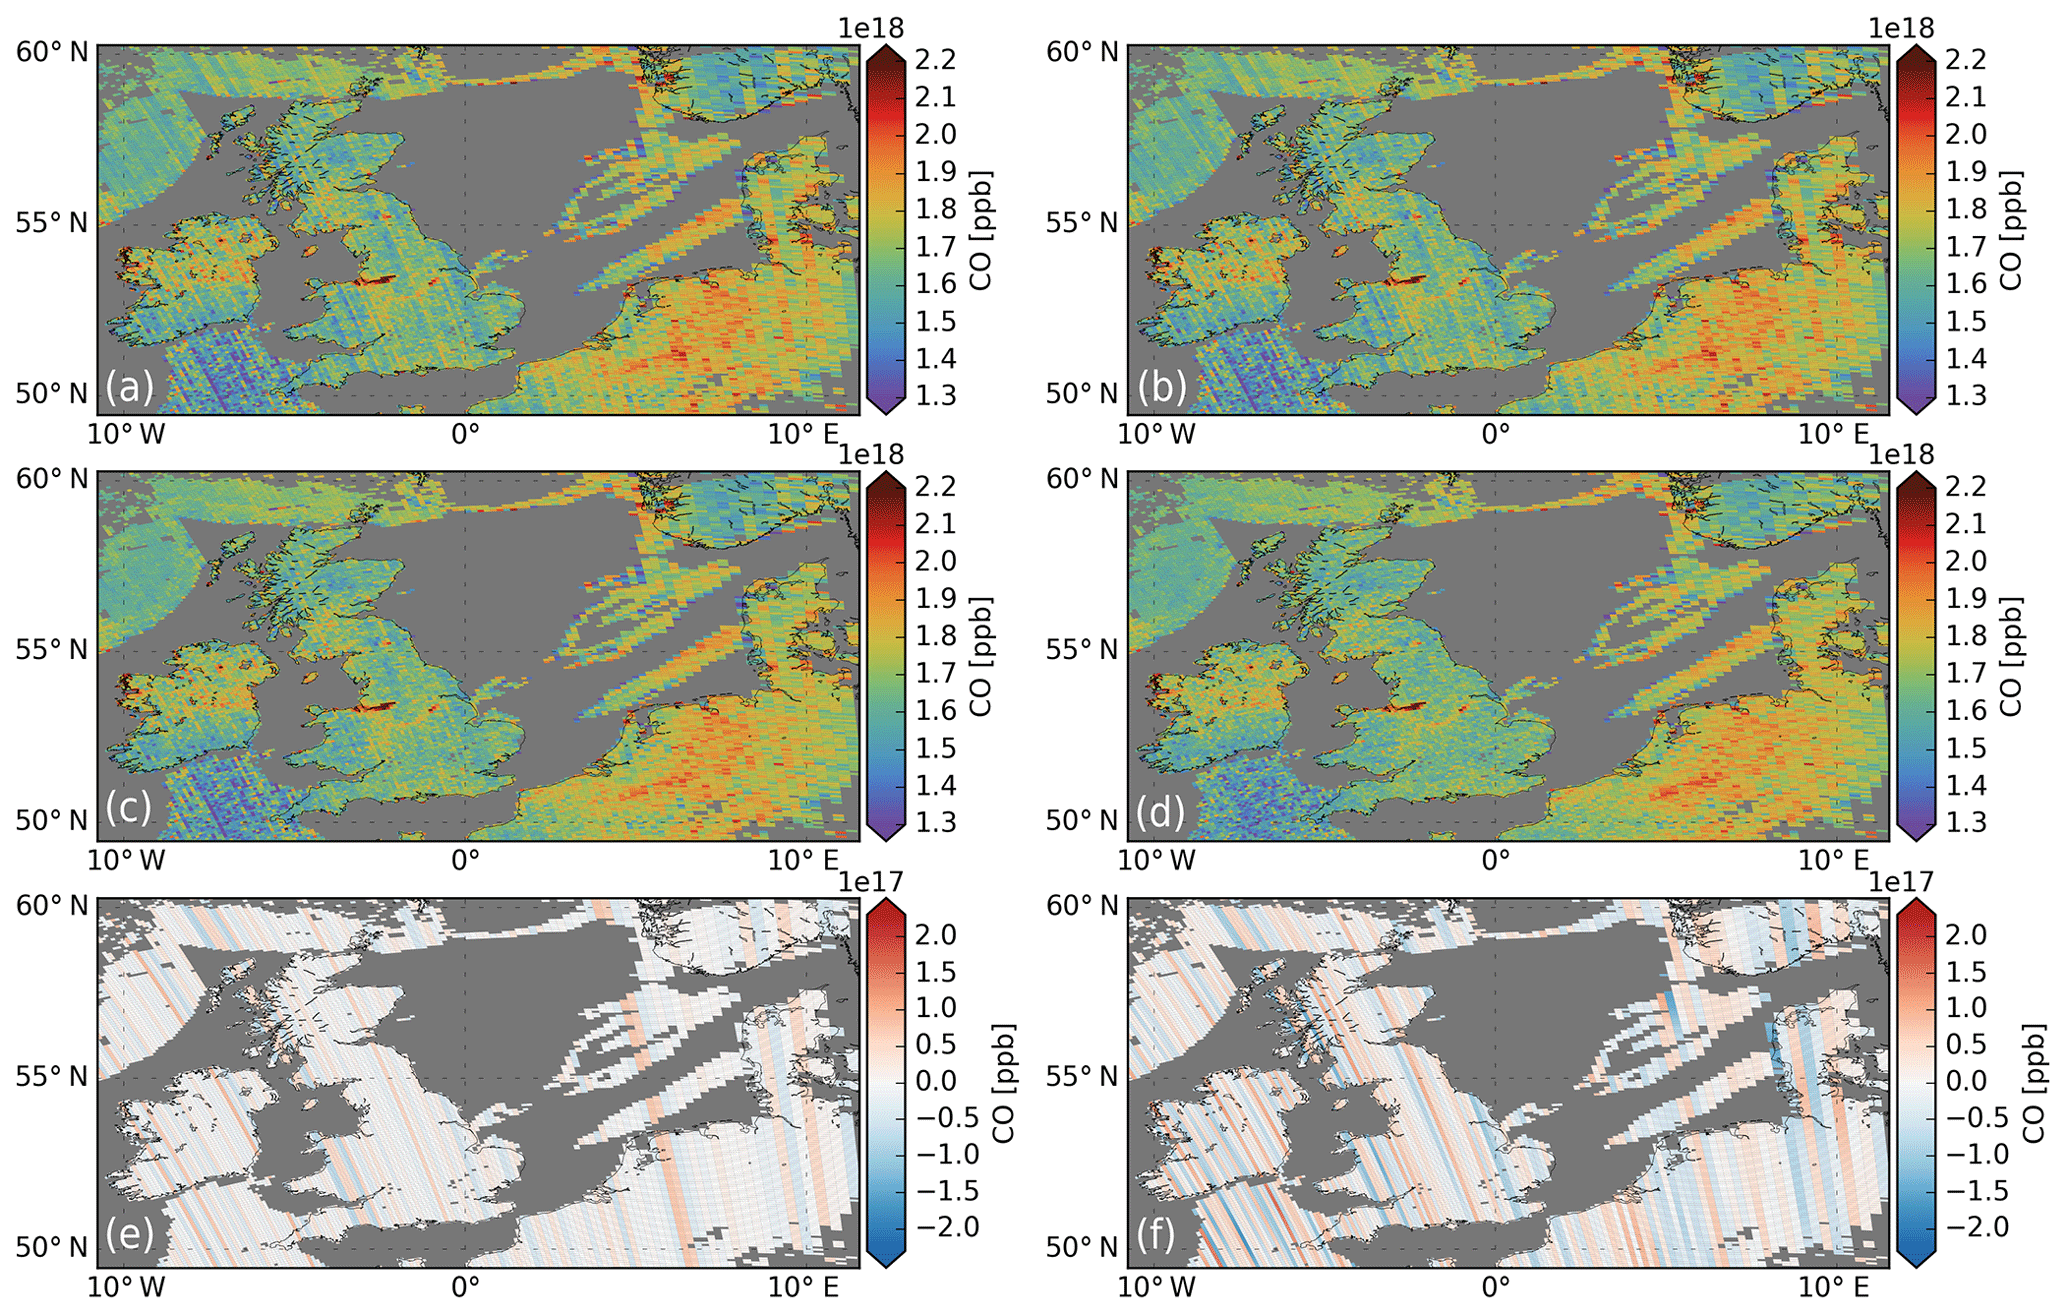
Figure 7CO retrievals of a TROPOMI orbit granule on 27 June 2018 over the UK. Panels (a, b) depict the original data, panels (c, d) show the destriped TROPOMI CO data (c FMD method, d FFD method) and panels (e, f) illustrate the destriping mask that was subtracted from the original TROPOMI data.
Concluding with the most appropriate spectroscopy database, we must also keep in mind the validity of the validation source. Wunch et al. (2015) estimated the accuracy of the TCCON CO product to be better than 4 % and Borsdorff et al. (2016) noted that TCCON is biased high compared to other validation sources, like measurements of the Network for the Detection of Atmospheric Composition Change – Infrared Working Group (NDACC-IRWG) and of the In-service Aircraft for a Global Observing System (MOZAIC-IAGOS). Kiel et al. (2016) found a similar disagreement between NDACC-IRWG and TCCON measurements. Based on the presented analysis, we favor the HITRAN 2016 and SEOM-IAS spectroscopy for the improved TROPOMI CO processing, although a final judgment would require a better harmonization between the different validation sources, in particular between the ground-based networks TCCON and NDACC-IRWG.

3.2 Destriping of single orbits
The TROPOMI CO retrievals from single orbits show a significant striping pattern along the flight path, which is a well-known feature of observations of push-broom spectrometers (e.g., the Ozone Monitoring Instrument, OMI, Boersma et al., 2011; and MODIS, Rakwatin et al., 2007). Borsdorff et al. (2018a) already reported that the CO stripes can exceed 5 ppb and can hamper, e.g., the detection of small point sources and the estimate of emissions from fire plumes. The origin of the stripy pattern is not yet understood and is changing over time from orbit to orbit. The TROPOMI level 1 team is optimizing the Calibration Key Data (CKD) to reduce the effect in future. Borsdorff et al. (2018a) suggested an empirical destriping approach that is applied on the CO data fields (see left column of Fig. 7). This method first removes the background of the CO field by a median smoothing in the cross-track direction and then determines per orbit a fixed stripe pattern for correction by a median along the flight path. This method already reduces a major part of the stripes in the CO data and is denoted in the following as fixed mask destriping (FMD). Analyzing TROPOMI CO orbit observations, we found that the stripe patterns also change to some extent along the flight path, which cannot be captured by this approach. Therefore, we investigate an alternative approach that is based on a Fourier filter destriping (FFD) (see right column of Fig. 7) in this study .
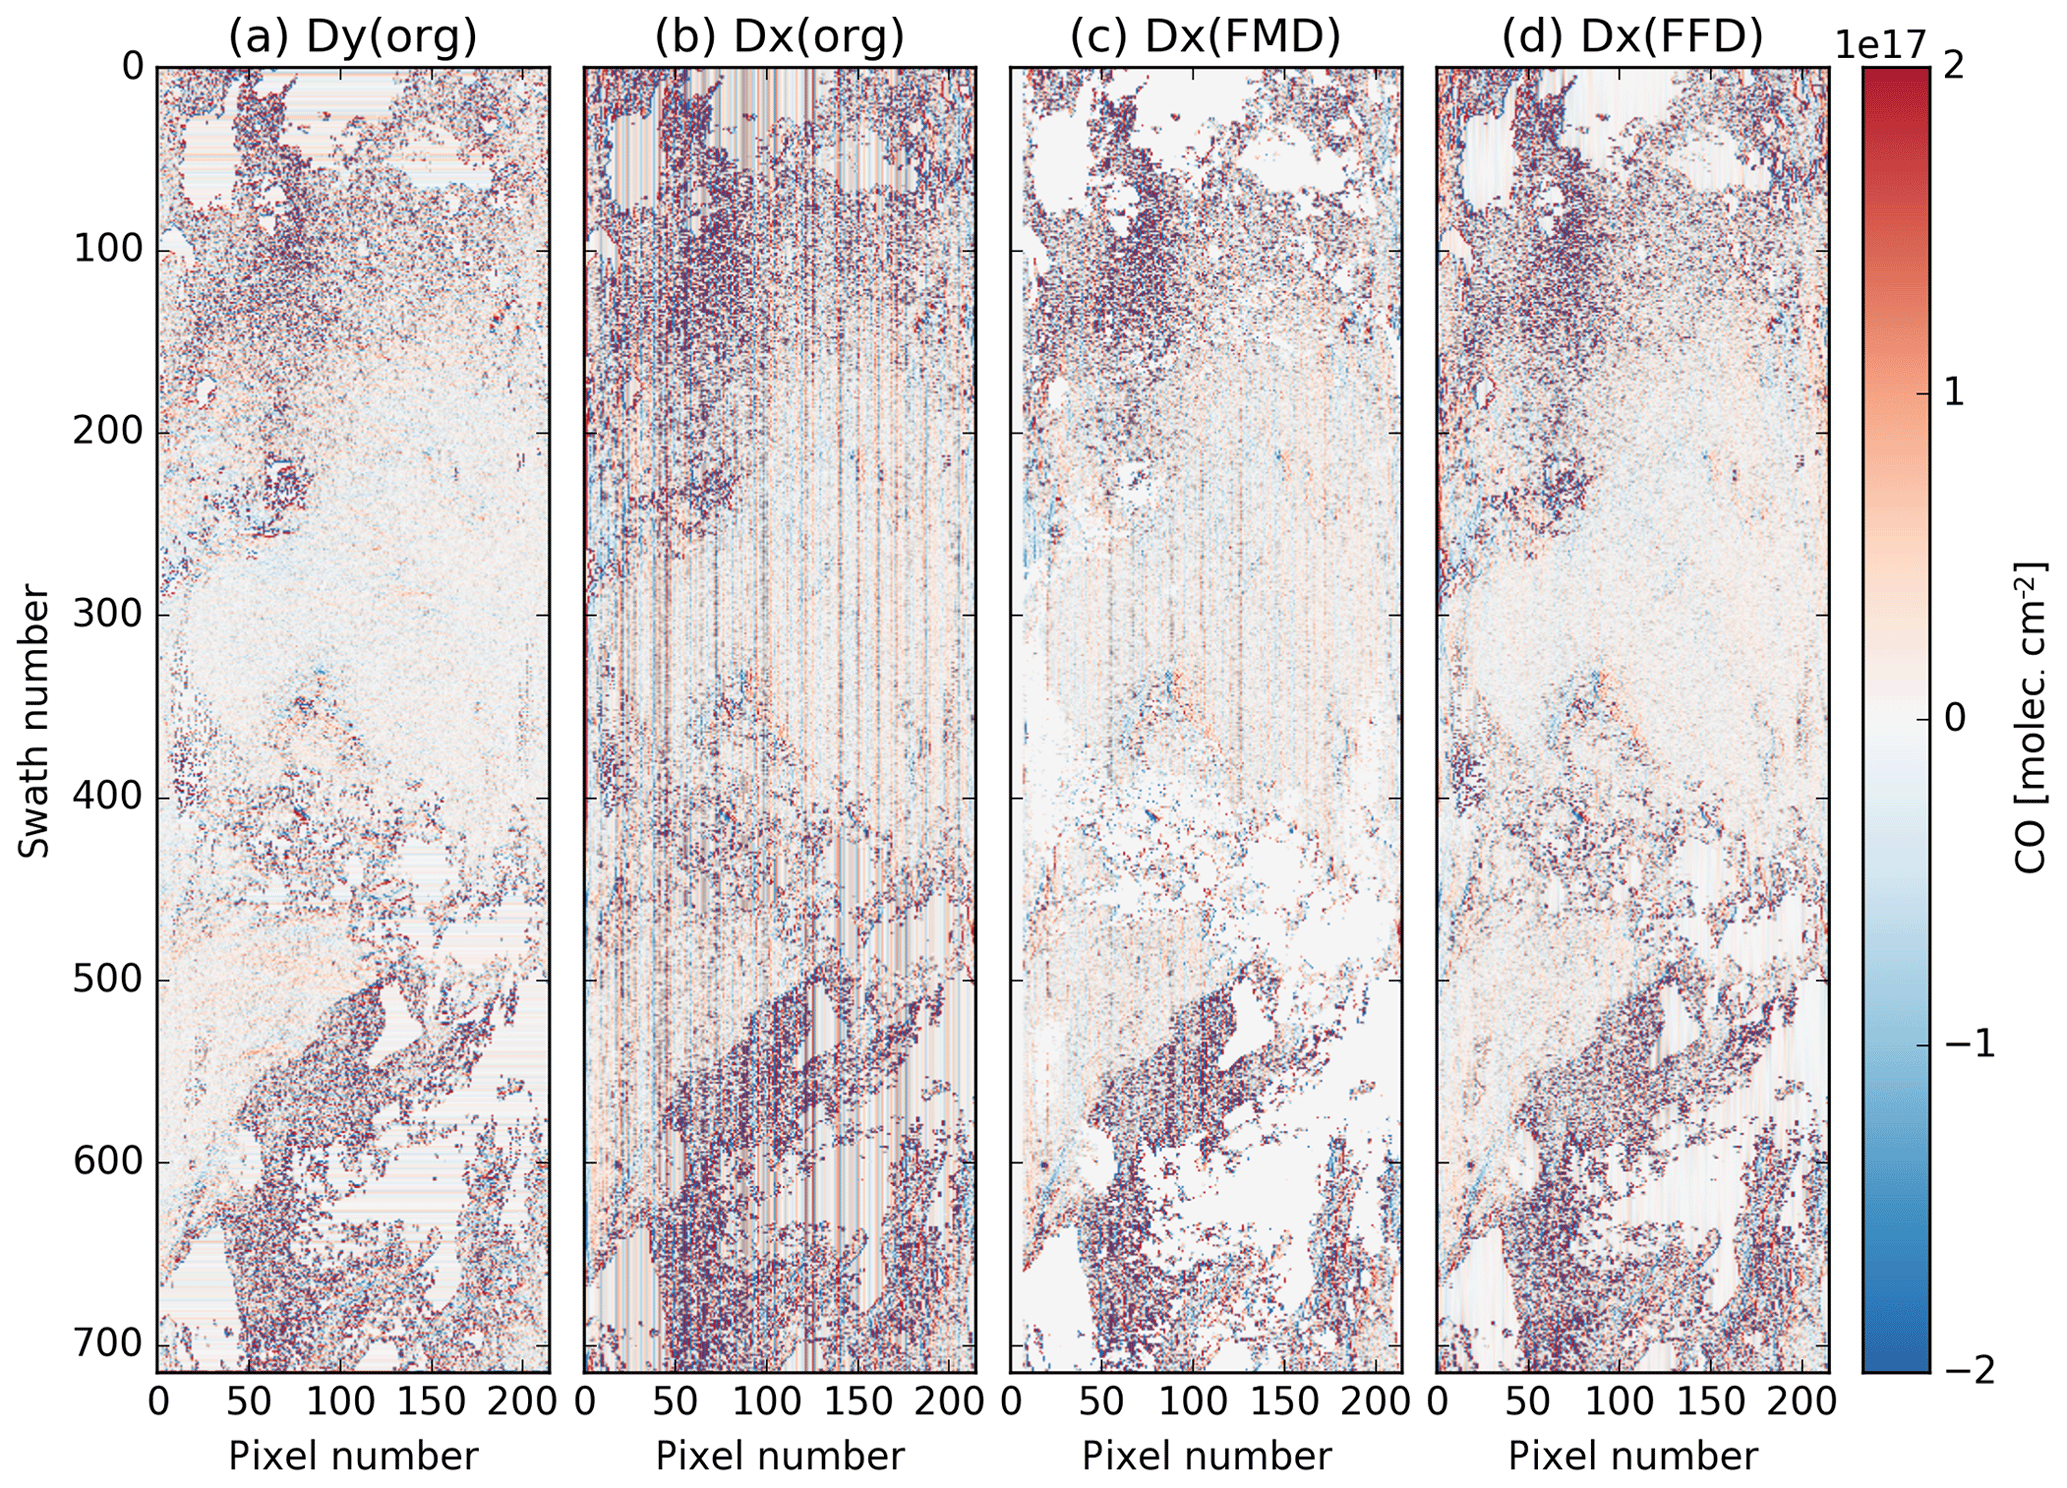
Figure 9CO retrievals of one TROPOMI orbit on 28 July 2018 (partly shown). From left to right – (a) derivative Dy(d) along-track direction of the original data, (b) Dx(d) derivative in the cross-track direction of the original data, (c) Dx(dds) after FMD destriping and (d) is the same as (c) but after FFD destriping.
Transformed domain filtering is widely used in image processing and was already applied for the destriping of MODIS data (Rakwatin et al., 2007). The idea is to transform the TROPOMI CO data, d, of one orbit into the Fourier space by the transformation
Before this transformation, the missing data in d was replaced by the median value of the corresponding swath and, additionally, a fixed strip pattern was added to the interpolated missing values, deploying the FMD method. Subsequently, the spectral representation of the data as a function of the two frequencies νx and νy is multiplied by a filter function f(νx,νy) to remove stripes and then is transformed back by
The filter function f(νx,νy) is chosen to filter on high frequencies in the cross-track direction (x dimension) and some low frequencies along the flight path (y dimension). Hence, this approach removes stripes that have a high-frequency part in the cross-track direction and some low frequency change along the flight path. The filter function is defined by
Here, is a collection of Gaussian function for each νx centered around νy=0 with a standard deviation σ(νx) that depends linearly on νx, as shown in Fig. 8, with σmin=0.3 for low frequencies and σmax=7 for high frequencies. Here, no filtering was applied for . These parameters were chosen empirically, such that the median of the destriped TROPOMI CO data from one orbit is deviating by less than 1 % from the original one. Finally, the destriping mask is calculated by .
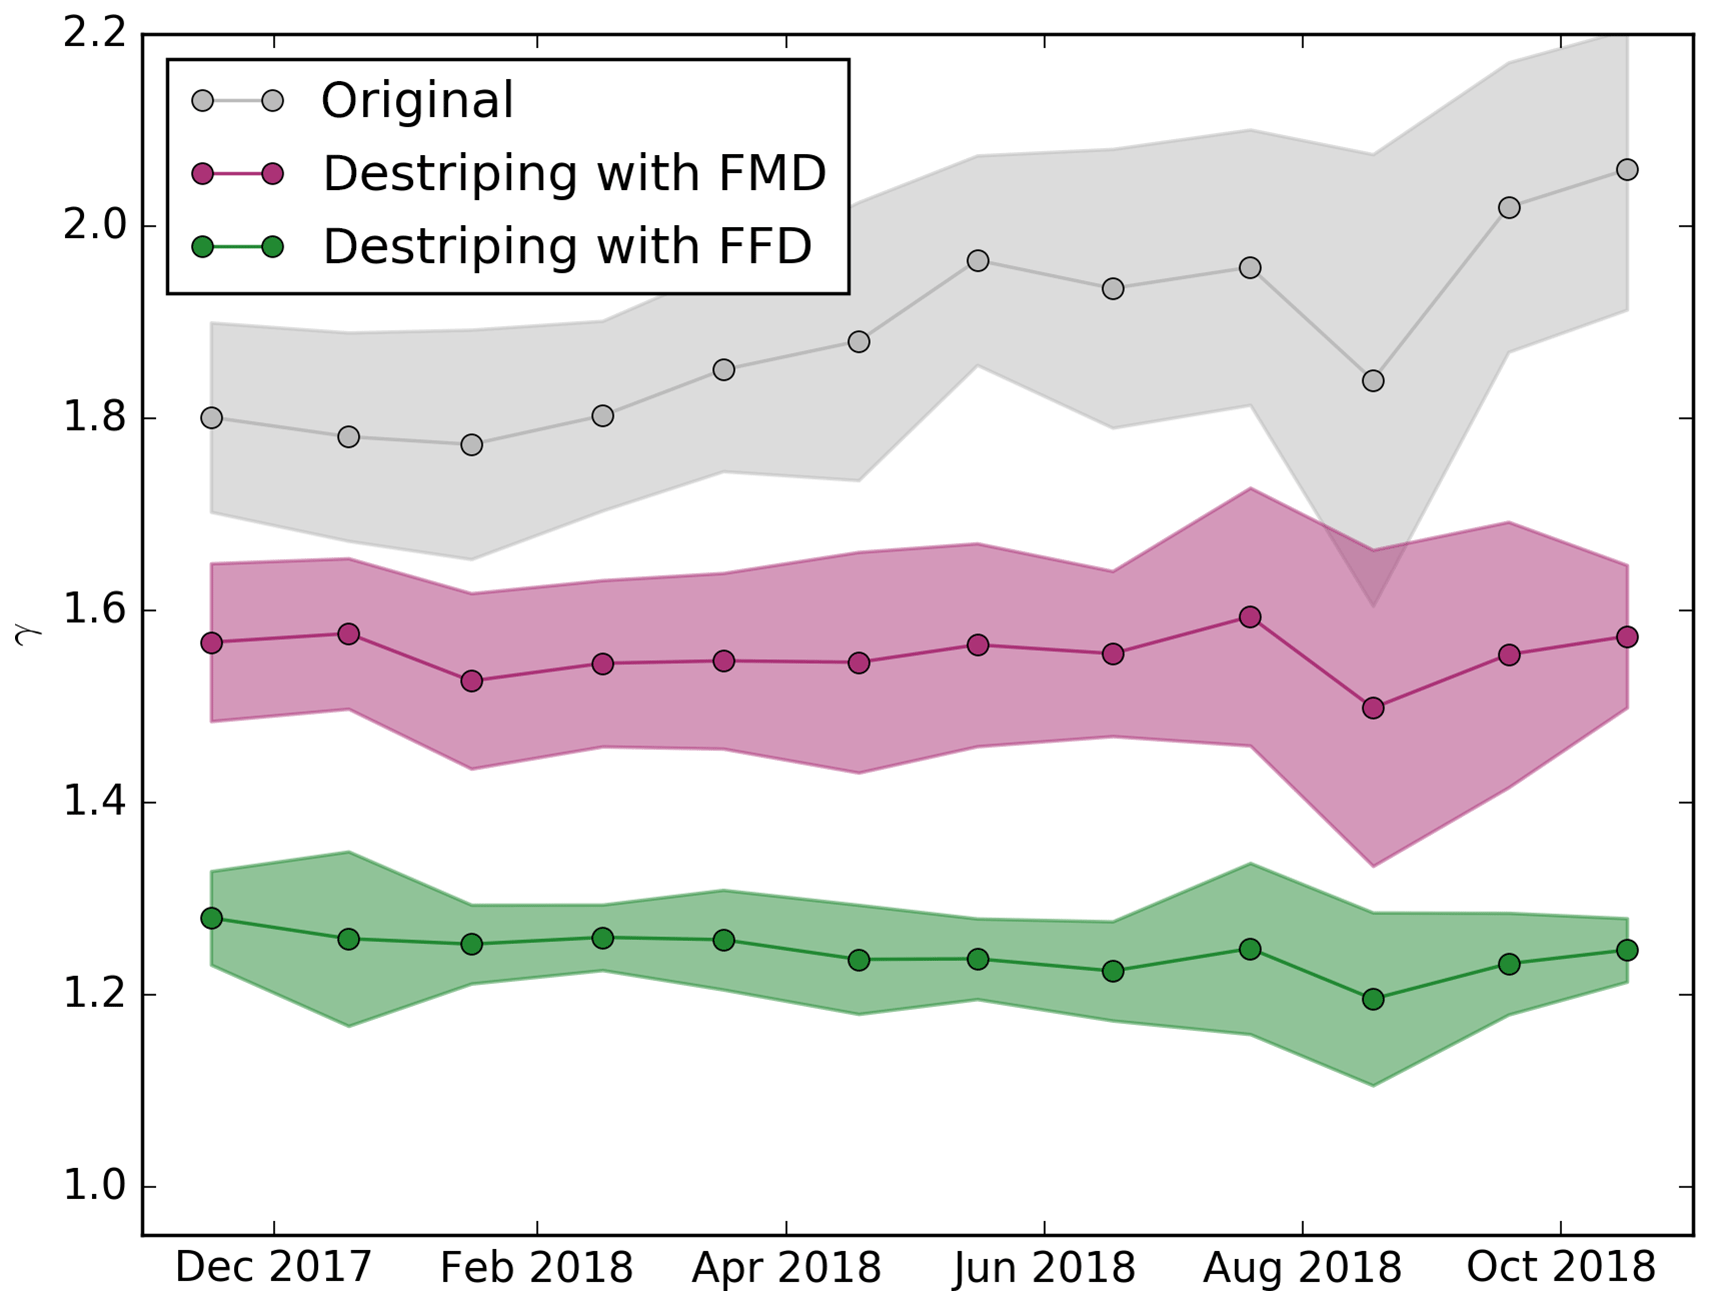
Figure 10The stripiness measure γ as defined in Eq. (7) as a function of time: (gray) original data, (pink) destriping with the FMD approach and (green) destriping with the FFD approach. Monthly medians are shown and the shaded area indicates an estimate of the noise (median ± 84th percentile).
To measure the effectiveness of the destriping approach, we defined the characteristic
where the operator is the discrete derivative operator in the cross-track direction (see Fig. 9a) and is the discrete derivate operator in the along-flight direction (see Fig. 9b) and the function SD is the operator for calculating the standard deviation. The derivative Dy(d) mostly represents the natural pixel-to-pixel variability of the measured CO field, whereas Dx(d) is sensitive to the stripe pattern along the flight path. Figure 9c shows Dx(dds) when applying the FMD method, and Fig. 9d shows Dx(dds) when applying the FFD approach. While the FMD method still leaves remaining stripes in the data the FFD approach is more efficient.
For the original data, d, γ is usually greater than 1 since the stripes enhance Dx(d) compared to Dy(d). Hence, we expect that the destriping reduces γ, with γ=1 for an isotropic pixel-to-pixel variation in the CO field. However, we cannot demand γ=1 after destriping because different synoptic variation in CO in both directions on average cannot be precluded. A tuning of the destriping algorithm to fulfill γ=1 may result in a unwanted smoothing of the CO data.
Figure 10 shows the γ value of the TROPOMI measurements from November 2017 to November 2018 without applying any destriping (gray line). Hence, we see a trend in the intensity of the striping pattern that increased by about 16 % in the first year of the mission, which may hint at a possible degradation of the instrument. The FMD approach (pink line) significantly reduces the stripe pattern by about 24 % and removes the trend of the original data. Finally the FFD approach (green line) also removes the trend and further improves γ by 20 % compared to the FMD method. Here, it is remarkable that the FFD approach also shows a lower standard deviation of the monthly averages, which points to a more consistent destriping with time.
For both destriping methods, we found that the TCCON validation (bias, station-to-station variability of the bias and scatter of the bias) does not significantly change. For the TCCON validation, daily averages in a colocation radius of 50 km were calculated. We found that, on this scale, the impact of stripes on single-orbit data can be neglected. The advantage of destriping the CO data becomes obvious, when we consider CO emission from fires like in Fig. 7. Here stripes can have a significant impact on the estimated emission and the detection limit of this type of events.
The TROPOMI instrument has been operating successfully for more than 1 year (13 October 2017) on ESA's Sentinel-5P satellite, where the SWIR measurements provide the total column concentration of CO with daily global coverage and a high spatial resolution of 7×7 km2. Early in the mission it was concluded that the TROPOMI CO dataset fulfills the mission requirements (accuracy <15 % and precision <10 %) and the TROPOMI CO data product was released by ESA in July 2018. Previous studies indicated that the TROPOMI CO product is biased high compared to the ground-based validation measurements of the TCCON network by about 6.4 ppb. Moreover, both a latitudinally dependent difference with the CAMS-IFS model and significant stripe patterns of single TROPOMI CO orbits, exceeding 5 ppb occasionally, were reported.
This study showed that the use of the SEOM-IAS, HITRAN 2012 or HITRAN 2016 spectroscopic databases significantly affects the CO bias between the TROPOMI and TCCON observations and the CO comparison with the CAMS-IFS model. Currently, the operational processing of TROPOMI CO data relies on HITRAN 2008 spectroscopy with updates to the H2O spectroscopy by Scheepmaker et al. (2012), which results in a bias of 6.2 ppb, as derived from 1 year of observations using TCCON observations as a validation reference. Any of the other investigated molecular spectroscopies improve these diagnostics due to improved CH4 absorption lines in the new databases. Here, SEOM-IAS reduces the bias to 3.4 ppb, HITRAN 2012 reduces it to −1.6 ppb and HITRAN 2016 reduces it to 0 ppb. We found similar improvements for the station-to-station variability of the biases. Only the SEOM-IAS dataset improves the spectral fit quality (rms = mol s−1 m−2 nm−1 sr−1), while HITRAN 2012 worsens it (rms = mol s−1 m−2 nm−1 sr−1). A comparison with the CO fields of the CAMS-IFS model indicates that HITRAN 2012 creates an artificial bias of about molec cm−2 around the Equator due to erroneous H2O spectroscopic data. HITRAN 2016 improves the latitudinal dependency of the bias between CAMS-IFS and TROPOMI CO. To finally conclude on the most appropriate spectroscopy database, we also must keep in mind the validity of the validation source. Borsdorff et al. (2016) noted that TCCON is biased high compared to other validation sources like measurements of the NDACC-IRWG and MOZAIC-IAGOS. Kiel et al. (2016) found a similar disagreement between NDACC-IRWG and TCCON measurements. Based on the presented analysis, we favor the HITRAN 2016 and SEOM-IAS spectroscopy for the improved TROPOMI CO processing. SEOM-IAS was the only spectroscopic database that improved the fit quality (rms = mol s−1 m−2 nm−1 sr−1) of the TROPOMI CO retrieval. However, a final judgment requires a better harmonization between the different validation sources, in particular between the ground-based networks TCCON and NDACC-IRWG.
Another important shortcoming of the current operational TROPOMI CO product is the CO striping of single-orbit data. Analyzing 1 year of TROPOMI data, we found that the intensity of the striping increased from November 2017 to November 2018 by about 16 %, which degrades the quality of the data. Stripes can occasionally exceed 5 ppb and thus hamper the detection of CO hotspots and the CO emission estimations from point sources. We discussed two approaches of destriping the TROPOMI CO level 2 data. Applying a destriping approach that is constant over an orbit improved the data significantly. The best results were achieved by a destriping approach filtering in the spectral domain of the orbit data. This approach can account for a variation in stripes along the orbit. Both approaches can cope with the time-dependent increase in stripiness but the FFD approach achieves a more homogeneous pixel-to-pixel variability of the destriped CO field with time. For both destriping methods, we found that the TCCON validation (bias, station-to-station variability of the bias and standard deviation of the bias) does not significantly change. For the TCCON validation, monthly averages in a colocation radius of 50 km were calculated. We found that, on this scale, stripes on single-orbit data can be neglected and thus we can conclude that the destriping is not introducing additional overall biases when applied on the data.
The TROPOMI CO dataset of this study is available for download at ftp://ftp.sron.nl/open-access-data-2/TROPOMI/tropomi/co/ (last access: 10 October 2019). TCCON data are available from the TCCON Data Archive, hosted by CaltechDATA, California Institute of Technology, CA (US), https://tccondata.org/ (TCCON, 2019).
TB, JadB, AS, ALD and JL provided the TROPOMI CO retrieval and data analysis. DLR was providing the SEOM-IAS spectroscopy and the TCCON partners provided the validation datasets. All authors discussed the results and commented on the manuscript.
The authors declare that they have no conflict of interest.
The presented work has been performed in the frame of the Sentinel-5 Precursor Validation Team (S5PVT) or Level 1/Level 2 Product Working Group activities. Results are based on preliminary (not fully calibrated or validated) Sentinel-5 Precursor data that will still change. The results are based on S5P L1B version 1 data. Images and data contain modified Copernicus Sentinel data, processed by SRON
This article is part of the special issue “TROPOMI on Sentinel-5 Precursor: first year in operation (AMT/ACPT inter-journal SI)”. It is not associated with a conference.
The presented material contains modified Copernicus data (2017, 2018) The TROPOMI data processing was carried out on the Dutch national E-infrastructure with the support of the SURF Cooperative. The work contains modified Copernicus Atmosphere Monitoring Service Information (2017, 2018). Neither the European Commission nor ECMWF is responsible for any use that may be made of the information it contains. TCCON observations from ETL are supported by the CSA, CFI, ORF, NSERC and ECCC.
The TCCON stations Garmisch, Izaña and Karlsruhe have been supported by the German Bundesministerium für Wirtschaft und Energie (BMWi) via DLR under grants 50EE1711A and 50EE1711D.
This paper was edited by Hartmut Boesch and reviewed by three anonymous referees.
Blumenstock, T., Hase, F., Schneider, M., García, O. E., and Sepúlveda, E.: TCCON data from Izana (ES), Release GGG2014.R1, https://doi.org/10.14291/tccon.ggg2014.izana01.r1, 2017. a
Boersma, K. F., Eskes, H. J., Dirksen, R. J., van der A, R. J., Veefkind, J. P., Stammes, P., Huijnen, V., Kleipool, Q. L., Sneep, M., Claas, J., Leitão, J., Richter, A., Zhou, Y., and Brunner, D.: An improved tropospheric NO2 column retrieval algorithm for the Ozone Monitoring Instrument, Atmos. Meas. Tech., 4, 1905–1928, https://doi.org/10.5194/amt-4-1905-2011, 2011. a
Borsdorff, T., Tol, P., Williams, J. E., de Laat, J., aan de Brugh, J., Nédélec, P., Aben, I., and Landgraf, J.: Carbon monoxide total columns from SCIAMACHY 2.3 µm atmospheric reflectance measurements: towards a full-mission data product (2003–2012), Atmos. Meas. Tech., 9, 227–248, https://doi.org/10.5194/amt-9-227-2016, 2016. a, b
Borsdorff, T., aan de Brugh, J., Hu, H., Hasekamp, O., Sussmann, R., Rettinger, M., Hase, F., Gross, J., Schneider, M., Garcia, O., Stremme, W., Grutter, M., Feist, D. G., Arnold, S. G., De Mazière, M., Kumar Sha, M., Pollard, D. F., Kiel, M., Roehl, C., Wennberg, P. O., Toon, G. C., and Landgraf, J.: Mapping carbon monoxide pollution from space down to city scales with daily global coverage, Atmos. Meas. Tech., 11, 5507–5518, https://doi.org/10.5194/amt-11-5507-2018, 2018a. a, b, c, d, e, f, g, h
Borsdorff, T., de Brugh, J. A., Hu, H., Aben, I., Hasekamp, O., and Landgraf, J.: Measuring Carbon Monoxide With TROPOMI: First Results and a Comparison With ECMWF-IFS Analysis Data, Geophys. Res. Lett., 45, 2826–2832, https://doi.org/10.1002/2018GL077045, 2018b. a, b, c, d
Borsdorff, T., aan de Brugh, J., Pandey, S., Hasekamp, O., Aben, I., Houweling, S., and Landgraf, J.: Carbon monoxide air pollution on sub-city scales and along arterial roads detected by the Tropospheric Monitoring Instrument, Atmos. Chem. Phys., 19, 3579–3588, https://doi.org/10.5194/acp-19-3579-2019, 2019. a
Gordon, I., Rothman, L., Hill, C., Kochanov, R., Tan, Y., Bernath, P., Birk, M., Boudon, V., Campargue, A., Chance, K., Drouin, B., Flaud, J.-M., Gamache, R., Hodges, J., Jacquemart, D., Perevalov, V., Perrin, A., Shine, K., Smith, M.-A., Tennyson, J., Toon, G., Tran, H., Tyuterev, V., Barbe, A., Császár, A., Devi, V., Furtenbacher, T., Harrison, J., Hartmann, J.-M., Jolly, A., Johnson, T., Karman, T., Kleiner, I., Kyuberis, A., Loos, J., Lyulin, O., Massie, S., Mikhailenko, S., Moazzen-Ahmadi, N., Müller, H., Naumenko, O., Nikitin, A., Polyansky, O., Rey, M., Rotger, M., Sharpe, S., Sung, K., Starikova, E., Tashkun, S., Auwera, J. V., Wagner, G., Wilzewski, J., Wcisło, P., Yu, S., and Zak, E.: The HITRAN2016 molecular spectroscopic database, J. Quant. Spectrosc. Ra., 203, 3–69, https://doi.org/10.1016/j.jqsrt.2017.06.038, 2017. a
Hase, F., Blumenstock, T., Dohe, S., Gross, J., and Kiel, M.: TCCON data from Karlsruhe (DE), Release GGG2014.R1, TCCON Data Archive, hosted by CaltechDATA, https://doi.org/10.14291/tccon.ggg2014.karlsruhe01.R1/1182416, 2015. a
Hase, F., Cuesta, J., and Birk, M.: SEOM-IAS validation report, 4 IAS-D09-PRJ-066, DLR, Oberpfaffenhofen, Germany, 2018. a
Holloway, T., Levy, H., and Kasibhatla, P.: Global distribution of carbon monoxide, J. Geophys. Res.-Atmos., 105, 12123–12147, https://doi.org/10.1029/1999jd901173, 2000. a
Inness, A., Alben, I., Agusti-Panareda, A., Borsdoff, T., Flemming, J., Landgraf, J., and Ribas, R.: Monitoring and assimilation of early TROPOMI total column carbon monoxide data in the CAMS system, ECMWF Technical Memoranda, https://doi.org/10.21957/r528zfho, 2019. a, b
Iraci, L. T., Podolske, J., Hillyard, P. W., Roehl, C., Wennberg, P. O., Blavier, J.-F., Allen, N., Wunch, D., Osterman, G., and Albertson, R.: TCCON data from Edwards (US), Release GGG2014.R1, TCCON Data Archive, hosted by CaltechDATA, https://doi.org/10.14291/tccon.ggg2014.edwards01.R1/1255068, 2016. a
Kawakami, S., Ohyama, H., Arai, K., Okumura, H., Taura, C., Fukamachi, T., and Sakashita, M.: TCCON data from Saga (JP), Release GGG2014R0, TCCON data archive, hosted by CaltechDATA, https://doi.org/10.14291/tccon.ggg2014.saga01.R0/1149283, 2014. a
Kiel, M., Hase, F., Blumenstock, T., and Kirner, O.: Comparison of XCO abundances from the Total Carbon Column Observing Network and the Network for the Detection of Atmospheric Composition Change measured in Karlsruhe, Atmos. Meas. Tech., 9, 2223–2239, https://doi.org/10.5194/amt-9-2223-2016, 2016. a, b
Kivi, R. and Heikkinen, P.: Fourier transform spectrometer measurements of column CO2 at Sodankylä, Finland, Geosci. Instrum. Meth., 5, 271–279, https://doi.org/10.5194/gi-5-271-2016, 2016. a
Kivi, R., Heikkinen, P., and Kyrö, E.: TCCON data from Sodankylä (FI), Release GGG2014.R0, https://doi.org/10.14291/tccon.ggg2014.sodankyla01.r0/1149280, 2014. a
Landgraf, J., aan de Brugh, J., Borsdorff, T., Houweling, S., and O., H.: Algorithm Theoretical Baseline Document for Sentinel-5 Precursor: Carbon Monoxide Total Column Retrieval, Atbd, SRON, Sorbonnelaan 2, 3584 CA Utrecht, The Netherlands, 2016a. a, b
Landgraf, J., aan de Brugh, J., Scheepmaker, R., Borsdorff, T., Hu, H., Houweling, S., Butz, A., Aben, I., and Hasekamp, O.: Carbon monoxide total column retrievals from TROPOMI shortwave infrared measurements, Atmos. Meas. Tech., 9, 4955–4975, https://doi.org/10.5194/amt-9-4955-2016, 2016b. a, b
Pollard, D. F., Robinson, J., and Shiona, H.: TCCON data from Lauder (NZ), Release GGG2014.R0, https://doi.org/10.14291/tccon.ggg2014.lauder03.r0, 2019. a
Rakwatin, P., Takeuchi, W., and Yasuoka, Y.: Stripe Noise Reduction in MODIS Data by Combining Histogram Matching With Facet Filter, IEEE T. Geosci. Remote, 45, 1844–1856, https://doi.org/10.1109/TGRS.2007.895841, 2007. a, b
Rodgers, C. D.: Inverse methods for atmospheric sounding: theory and practice, Vol. 2 of Series on atmospheric, oceanic and planetary physics, World Scientific, Singapore, River Edge, N.J., reprinted: 2004, 2008, 2000. a
Rothman, L., Gordon, I., Babikov, Y., Barbe, A., Benner, D. C., Bernath, P., Birk, M., Bizzocchi, L., Boudon, V., Brown, L., Campargue, A., Chance, K., Cohen, E., Coudert, L., Devi, V., Drouin, B., Fayt, A., Flaud, J.-M., Gamache, R., Harrison, J., Hartmann, J.-M., Hill, C., Hodges, J., Jacquemart, D., Jolly, A., Lamouroux, J., Roy, R. L., Li, G., Long, D., Lyulin, O., Mackie, C., Massie, S., Mikhailenko, S., Müller, H., Naumenko, O., Nikitin, A., Orphal, J., Perevalov, V., Perrin, A., Polovtseva, E., Richard, C., Smith, M., Starikova, E., Sung, K., Tashkun, S., Tennyson, J., Toon, G., Tyuterev, V., and Wagner, G.: The HITRAN2012 molecular spectroscopic database, J. Quant. Spectrosc. Ra., 130, 4–50, https://doi.org/10.1016/j.jqsrt.2013.07.002, 2013. a
Rothman, L. S., Gordon, I. E., Barbe, A., Benner, D. C., Bernath, P. F., Birk, M., Boudon, V., Brown, L. R., Campargue, A., Champion, J.-P., Chance, K., Coudert, L. H., Dana, V., Devi, V. M., Fally, S., Flaud, J.-M., Gamache, R. R., Goldman, A., Jacquemart, D., Kleiner, I., Lacome, N., Lafferty, W. J., Mandin, J.-Y., Massie, S. T., Mikhailenko, S. N., Miller, C. E., Moazzen-Ahmadi, N., Naumenko, O. V., Nikitin, A. V., Orphal, J., Perevalov, V. I., Perrin, A., Predoi-Cross, A., Rinsland, C. P., Rotger, M., Šimečková, M., Smith, M. A. H., Sung, K., Tashkun, S. A., Tennyson, J., Toth, R. A., Vandaele, A. C., and Vander Auwera, J.: The HITRAN 2008 molecular spectroscopic database, J. Quant. Spectrosc. Ra., 110, 533–572, https://doi.org/10.1016/j.jqsrt.2009.02.013, 2009. a
Scheepmaker, R. A., Frankenberg, C., Galli, A., Butz, A., Schrijver, H., Deutscher, N. M., Wunch, D., Warneke, T., Fally, S., and Aben, I.: Improved water vapour spectroscopy in the 4174–4300 cm−1 region and its impact on SCIAMACHY HDO/H2O measurements, Atmos. Meas. Tech., 6, 879–894, https://doi.org/10.5194/amt-6-879-2013, 2013. a, b, c, d
Spivakovsky, C. M., Logan, J. A., Montzka, S. A., Balkanski, Y. J., Foreman-Fowler, M., Jones, D. B. A., Horowitz, L. W., Fusco, A. C., Brenninkmeijer, C. A. M., Prather, M. J., Wofsy, S. C., and McElroy, M. B.: Three-dimensional climatological distribution of tropospheric OH: Update and evaluation, J. Geophys. Res.-Atmos., 105, 8931–8980, https://doi.org/10.1029/1999jd901006, 2000. a
Sussmann, R. and Rettinger, M.: TCCON data from Garmisch (DE), Release GGG2014.R2, https://doi.org/10.14291/tccon.ggg2014.garmisch01.r2, 2018a. a
Sussmann, R. and Rettinger, M.: TCCON data from Zugspitze (DE), Release GGG2014R1, TCCON data archive, hosted by CaltechDATA, https://doi.org/10.14291/tccon.ggg2014.zugspitze01.R1, 2018b. a
TCCON: TCCON retrieval products, available at: https://tccondata.org/, last access: 10 August 2019. a
Veefkind, J., Aben, I., McMullan, K., Förster, H., de Vries, J., Otter, G., Claas, J., Eskes, H., de Haan, J., Kleipool, Q., van Weele, M., Hasekamp, O., Hoogeveen, R., Landgraf, J., Snel, R., Tol, P., Ingmann, P., Voors, R., Kruizinga, B., Vink, R., Visser, H., and Levelt, P.: TROPOMI on the ESA Sentinel-5 Precursor: A GMES mission for global observations of the atmospheric composition for climate, air quality and ozone layer applications, Remote Sens. Environ., 120, 70–83, https://doi.org/10.1016/j.rse.2011.09.027, 2012. a
Vidot, J., Landgraf, J., Hasekamp, O., Butz, A., Galli, A., Tol, P., and Aben, I.: Carbon monoxide from shortwave infrared reflectance measurements: A new retrieval approach for clear sky and partially cloudy atmospheres, Remote Sens. Environ., 120, 255–266, https://doi.org/10.1016/j.rse.2011.09.032, 2012. a
Warneke, T., Messerschmidt, J., Notholt, J., Weinzierl, C., Deutscher, N. M., Petri, C., Grupe, P., Vuillemin, C., Truong, F., Schmidt, M., Ramonet, M., and Parmentier, E.: TCCON data from Orléans (FR), Release GGG2014.R0, TCCON Data Archive, hosted by CaltechDATA, https://doi.org/10.14291/tccon.ggg2014.orleans01.R0/1149276, 2014. a
Wennberg, P. O., Wunch, D., Roehl, C., Blavier, J.-F., Toon, G. C., and Allen, N.: TCCON data from Caltech (US), Release GGG2014.R1, TCCON Data Archive, hosted by CaltechDATA, https://doi.org/10.14291/tccon.ggg2014.pasadena01.R1/1182415, 2015. a
Wennberg, P. O., Wunch, D., Roehl, C., Blavier, J.-F., Toon, G. C., and Allen, N.: TCCON data from Lamont (US), Release GGG2014.R1, TCCON Data Archive, hosted by CaltechDATA, https://doi.org/10.14291/tccon.ggg2014.lamont01.R1/1255070, 2016. a
Wennberg, P. O., Roehl, C. M., Wunch, D., Toon, G. C., Blavier, J.-F., Washenfelder, R., Keppel-Aleks, G., Allen, N. T., and Ayers, J.: TCCON data from Park Falls (US), Release GGG2014.R1, https://doi.org/10.14291/tccon.ggg2014.parkfalls01.r1, 2017. a
Wunch, D., Toon, G. C., Sherlock, V., Deutscher, N. M., Liu, C., Feist, D. G., and Wennberg, P. O.: The Total Carbon Column Observing Network's GGG2014 Data Version, Tech. Rep., California Institute of Technology, Pasadena, CA, https://doi.org/10.14291/tccon.ggg2014.documentation.R0/1221662, 2015. a, b
Wunch, D., Mendonca, J., Colebatch, O., Allen, N. T., Blavier, J.-F., Roche, S., Hedelius, J., Neufeld, G., Springett, S., Worthy, D., Kessler, R., and Strong, K.: TCCON data from East Trout Lake, SK (CA), Release GGG2014.R1, https://doi.org/10.14291/tccon.ggg2014.easttroutlake01.r1, 2018. a