the Creative Commons Attribution 4.0 License.
the Creative Commons Attribution 4.0 License.
 | 18 Nov 2019
TCCON and NDACC XCO measurements: difference, discussion and application
Bavo Langerock
Corinne Vigouroux
Mahesh Kumar Sha
Christian Hermans
Jean-Marc Metzger
Huilin Chen
Michel Ramonet
Rigel Kivi
Pauli Heikkinen
Dan Smale
David F. Pollard
Nicholas Jones
Voltaire A. Velazco
Omaira E. García
Matthias Schneider
Mathias Palm
Thorsten Warneke
Martine De Mazière
Column-averaged dry-air mole fraction of CO (XCO) measurements are obtained from two ground-based Fourier transform infrared (FTIR) spectrometer networks: the Total Carbon Column Observing Network (TCCON) and the Network for the Detection of Atmospheric Composition Change (NDACC). In this study, the differences between the TCCON and NDACC XCO measurements are investigated and discussed based on six NDACC–TCCON sites using data over the period 2007–2017. A direct comparison shows that the NDACC XCO measurements are about 5.5 % larger than the TCCON data at Ny-Ålesund, Bremen, and Izaña (Northern Hemisphere), and the absolute bias between the NDACC and TCCON data is within 2 % at Saint-Denis, Wollongong and Lauder (Southern Hemisphere). The hemispheric dependence of the bias is mainly attributed to their smoothing errors. The systematic smoothing error of the TCCON XCO data varies in the range between 0.2 % (Bremen) and 7.9 % (Lauder), and the random smoothing error varies in the range between 2.0 % and 3.6 %. The systematic smoothing error of NDACC data is between 0.1 % and 0.8 %, and the random smoothing error of NDACC data is about 0.3 %. For TCCON data, the smoothing error is significant because it is higher than the reported uncertainty, particularly at Southern Hemisphere sites. To reduce the influence from the a priori profiles and different vertical sensitivities, the scaled NDACC a priori profiles are used as the common a priori profiles for comparing TCCON and NDACC retrievals. As a result, the biases between TCCON and NDACC XCO measurements become more consistent (5.6 %–8.5 %) with a mean value of 6.8 % at these sites. To determine the sources of the remaining bias, regular AirCore measurements at Orléans and Sodankylä are compared to co-located TCCON measurements. It is found that TCCON XCO measurements are 6.1 ± 1.6 % and 8.0 ± 3.2 % smaller than the AirCore measurements at Orléans and Sodankylä, respectively, indicating that the scaling factor of TCCON XCO data should be around 1.0000 instead of 1.0672. Further investigations should be carried out in the TCCON community to determine the correct scaling factor to be applied to the TCCON XCO data. This paper also demonstrates that the smoothing error must be taken into account when comparing FTIR XCO data, and especially TCCON XCO data, with model or satellite data.
- Article
(3903 KB) - Full-text XML
- BibTeX
- EndNote


Carbon monoxide (CO) is a trace gas in the Earth's atmosphere, with a typical mole fraction of 50–80 ppb (parts per billion) at clean-air sites. Atmospheric CO is released by incomplete combustion, mainly coming from anthropogenic emissions (Granier et al., 2011) and biomass burning (van der Werf et al., 2010). There are also small qualities of CO in the mesosphere generated by the photolysis of carbon dioxide (Garcia et al., 2014). The lifetime of CO is about 2 months in the troposphere (Pfister et al., 2004) and on the order of several months in the stratosphere (Hoor et al., 2004). CO is often used as a tracer to study the long-distance transport of biomass burning (Duflot et al., 2010), wildfires (Turquety et al., 2009) and anthropogenic emissions (Ojha et al., 2016). The major sink of CO in the atmosphere is the reaction with hydroxyl radicals (OH) (Spivakovsky et al., 2000). Therefore, CO plays an important role in atmospheric chemistry and thus affects the atmospheric oxidizing capacity. CO concentration is associated with many tropospheric polluting gases, e.g., tropospheric ozone and urban smog (Aschi and Largo, 2003), and it also has a strong impact on the carbon and methane cycles (Rasmussen and Khalil, 1981).
Global CO total columns are measured by space-based satellite instruments, e.g., the Measurement of Pollution in the Troposphere (MOPITT), the scanning imaging absorption spectrometer for atmospheric cartography (SCIAMACHY), the Infrared Atmospheric Sounding Interferometer (IASI) and the more recent Tropospheric Monitoring Instrument (TROPOMI) (Deeter et al., 2017; Borsdorff et al., 2016, 2018; George et al., 2009). Satellite measurements are applied to study the long-term trend of CO (Worden et al., 2013) and to understand the regional pollution (Dekker et al., 2019) and are assimilated into the atmospheric chemistry model to improve air quality forecasts (Klonecki et al., 2012; Mizzi et al., 2016). To better understand the uncertainties of the satellite CO observations and the model simulations, they need to be validated by other measurements. Ground-based Fourier transform infrared (FTIR) spectrometers record the direct solar radiation and observe the total column of CO with high accuracy and precision. In addition, the ground-based FTIR CO measurements are stable over a long-time period, so that they can be used to validate the satellite CO observations (Dils et al., 2006; Borsdorff et al., 2016, 2018) and model simulations (Eskes et al., 2015). Today, there are two well-known global ground-based FTIR networks providing total column-averaged dry-air mole fraction of CO (XCO) measurements: the Total Carbon Column Observing Network (TCCON) (Wunch et al., 2011) and the Network for the Detection of Atmospheric Composition Change (NDACC) (De Mazière et al., 2018).
TCCON and NDACC XCO measurements are sometimes combined together to validate satellite observations or model simulations, and it is noticed that the smoothing error of TCCON and NDACC XCO measurements is not always taken into account when comparing with satellite observations, e.g., SCIAMACHY (Borsdorff et al., 2016; Hochstaffl et al., 2018) and TROPOMI (Borsdorff et al., 2018), because it is considered to have a negligible impact. By using both TCCON and NDACC XCO data to validate the SCIAMACHY observations, Borsdorff et al. (2016) found that NDACC XCO data are 3.8 ppb larger than TCCON measurements. Despite the similar measurement techniques, there are differences between TCCON and NDACC XCO products because the observed spectra, retrieval algorithms, and data corrections are different. To understand why there is a systematic bias between the TCCON and NDACC XCO measurements, a case study was carried out by Kiel et al. (2016) using TCCON and NDACC measurements at Karlsruhe during 2010–2014. They found that NDACC XCO is 4.47 ± 0.17 (1σ) ppb larger than the TCCON data, and the difference between the TCCON and NDACC XCO measurements mainly comes from the air-mass-independent (scaling) correction of the TCCON data and partly from the air-mass-dependent correction, spectroscopic parameters and a priori profiles.
Table 1The coordinates, responsible institute and time coverage of measurements at six sites used in this study.

In this study, the comparison between the TCCON and NDACC XCO measurements is extended to six sites (Ny-Ålesund, Bremen, Izaña, Saint-Denis, Wollongong and Lauder) during the time period of 2007–2017. This work aims at understanding (1) whether the bias between TCCON and NDACC XCO measurements is consistent at these sites, (2) whether the smoothing uncertainties of TCCON and NDACC XCO measurements can be ignored when comparing with each other or other datasets, and (3) whether the scaling factor of TCCON XCO data is correct. This paper is organized as follows. Section 2 lists the FTIR sites used in this study and describes the main characteristics of the TCCON and NDACC XCO measurements. Direct comparisons between TCCON and NDACC XCO measurements are carried out in Sect. 3. In Sect. 4, the differences between TCCON and NDACC XCO measurements are investigated in relation to their a priori profiles and averaging kernels. The smoothing errors of TCCON and NDACC XCO measurements are estimated. The TCCON XCO measurements are compared with AirCore measurements at Sodankylä and Orléans. Section 5 shows an example of using TCCON and NDACC XCO measurements together in a comparison with a model simulation. Conclusions are drawn in Sect. 6.
The ground-based FTIR measurement system is composed of an automatic weather station, a sun tracker and a FTIR instrument. The locations of the FTIR sites used in this study and time coverages of the TCCON and NDACC XCO measurements are listed in Table 1. All these sites use a Bruker IFS 120/125HR instrument to record near-infrared (NIR) spectra for TCCON measurements and mid-infrared (MIR) spectra for NDACC measurements. The main characteristics of TCCON and NDACC XCO measurements are described below.
2.1 TCCON
TCCON uses the GGG2014 code that applies a profile scaling to retrieve CO and O2 total columns simultaneously (Wunch et al., 2015). The spectral resolution of the NIR spectrum is 0.02 cm−1. The retrieval windows of CO are 4208.7–4257.3 and 4262.0–4318.8 cm−1. The interfering species are CH4, H2O and the water isotopologue (HDO). The retrieval window of O2 is 7765.0–8005.0 cm−1, with interfering absorptions from H2O, hydrogen fluoride (HF), CO2 and solar lines. The spectroscopy is the atmospheric line list (ATM) maintained at the Jet Propulsion Laboratory, NASA (Toon, 2014). Since the O2 volume mixing ratio (VMR) of 0.2095 is constant in the atmosphere, TCCON uses the O2 total column (TC) to calculate the total column of the dry air (TC) and then to calculate the XCO as the ratio between the retrieved CO total column (TCCO) and the total column of the dry air (). Furthermore, TCCON XCO data have been indirectly validated by several aircraft and AirCore measurements, and the publicly available TCCON XCO data have been corrected with a scaling factor (α) and an air-mass-dependent factor (β) (Wunch et al., 2015):
where α=1.0672 and , θ is the solar zenith angle (SZA), and the SBF(θ) depends on the probed air mass through the SZA (SBF).
According to Fig. 10 in Wunch et al. (2015), the random uncertainty of TCCON XCO data is below 3.5 % and decreases with increasing SZA. The largest source is the uncertainty of the observer-sun Doppler stretch (osds) due to a solar tracker pointing uncertainty. The shear misalignment, continuum curvature and a priori profile shape are the other leading sources of uncertainty, and they are all about 1.0 %. In this study, it is assumed that the mean random uncertainty of TCCON XCO measurement is 3.5 % as an upper limitation. Since TCCON data have been scaled to the WMO standard, the systematic uncertainty of TCCON XCO data is eliminated and it is assumed to be zero. Note that the systematic smoothing error has not been removed in public TCCON data because the Aircraft or AirCore profiles which are used to calibrate the TCCON XCO measurements have been first smoothed with TCCON data (Wunch et al., 2010).
2.2 NDACC
NDACC uses either the SFIT4 (Pougatchev et al., 1995) or the PROFFIT9 code (Hase et al., 2004) to retrieve CO vertical profiles. The retrieval windows for CO are 2057.70–2058.00, 2069.56–2069.76 and 2157.50–2159.15 cm−1. The spectral resolution of the MIR spectrum is about 0.0035–0.0070 cm−1. The interfering species are O3, CO2, carbonyl sulfide (OCS), N2O and H2O. The reference spectroscopy database is HITRAN2008 (Rothman et al., 2009). Since the O2 total column is not available from the NDACC spectrum and the weak N2 (a potential alternative) signal in the NDACC region leads to a large scatter, the total column of the dry air is computed from the surface pressure (Ps) recorded at a local automatic weather station and the National Centers for Environmental Prediction (NCEP) reanalysis H2O total column (TC):
where g is the column-averaged gravity acceleration, and and are the molecular masses of H2O and dry air respectively. Unlike TCCON XCO data, there are no scaling or air-mass-dependent corrections for NDACC data.
The NDACC XCO data are calculated by the ratio between the total column of CO and the total column of the dry air. Zhou et al. (2018) pointed out that the uncertainty of the total column of the dry air is within 0.1 % by using the surface pressure and NCEP water vapor. Therefore, the uncertainty of the NDACC XCO data is dominated by the uncertainty of the retrieved total column of CO. To understand the error budget for NDACC CO data, the different contributions to the total uncertainty budget at Saint-Denis are listed in Table 2. The systematic uncertainty mainly comes from the spectroscopic parameters and temperature profile, while the random uncertainty mainly comes from the SZA and temperature. Note that the systematic and random smoothing errors are not included in the reported NDACC data. The uncertainty of NDACC CO total column data can be variable, depending on site-specific conditions, e.g., humidity, instrument, location and retrieval software (see Table 3).
Table 2The systematic and random uncertainties for NDACC retrieved XCO at Saint-Denis. “–” means that the uncertainty is less than 0.1 and then can be ignored. The total uncertainties are calculated by adding the sub-types in quadrature.

Figure 1 shows the direct comparisons between TCCON and NDACC XCO co-located hourly means at the six sites. The TCCON and NDACC measurements observe the same seasonal cycles of XCO. At Northern Hemisphere stations (Ny-Ålesund, Bremen and Izaña), the seasonal variation in XCO is dominated by the OH variation (Té et al., 2016), with a low value of XCO in the summer (June–August) and a high value in the winter (December–February). At Southern Hemisphere stations (Saint-Denis, Wollongong and Lauder), the seasonal variation in XCO is dominated by biomass burning, with a peak in September–November (Duflot et al., 2010). The correlation coefficients (R) at the six sites are between 0.96 and 0.99, indicating good agreement between TCCON and NDACC XCO measurements.
Table 3The systematic and random uncertainties of NDACC retrieved CO total column.
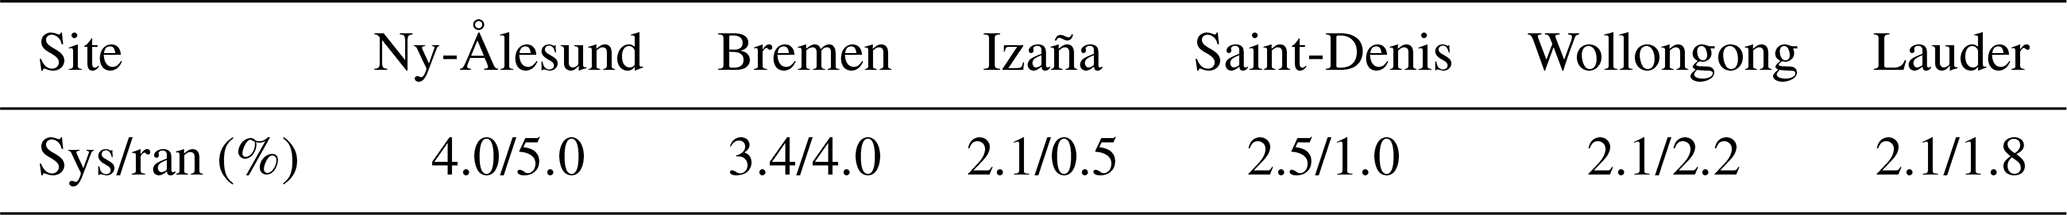
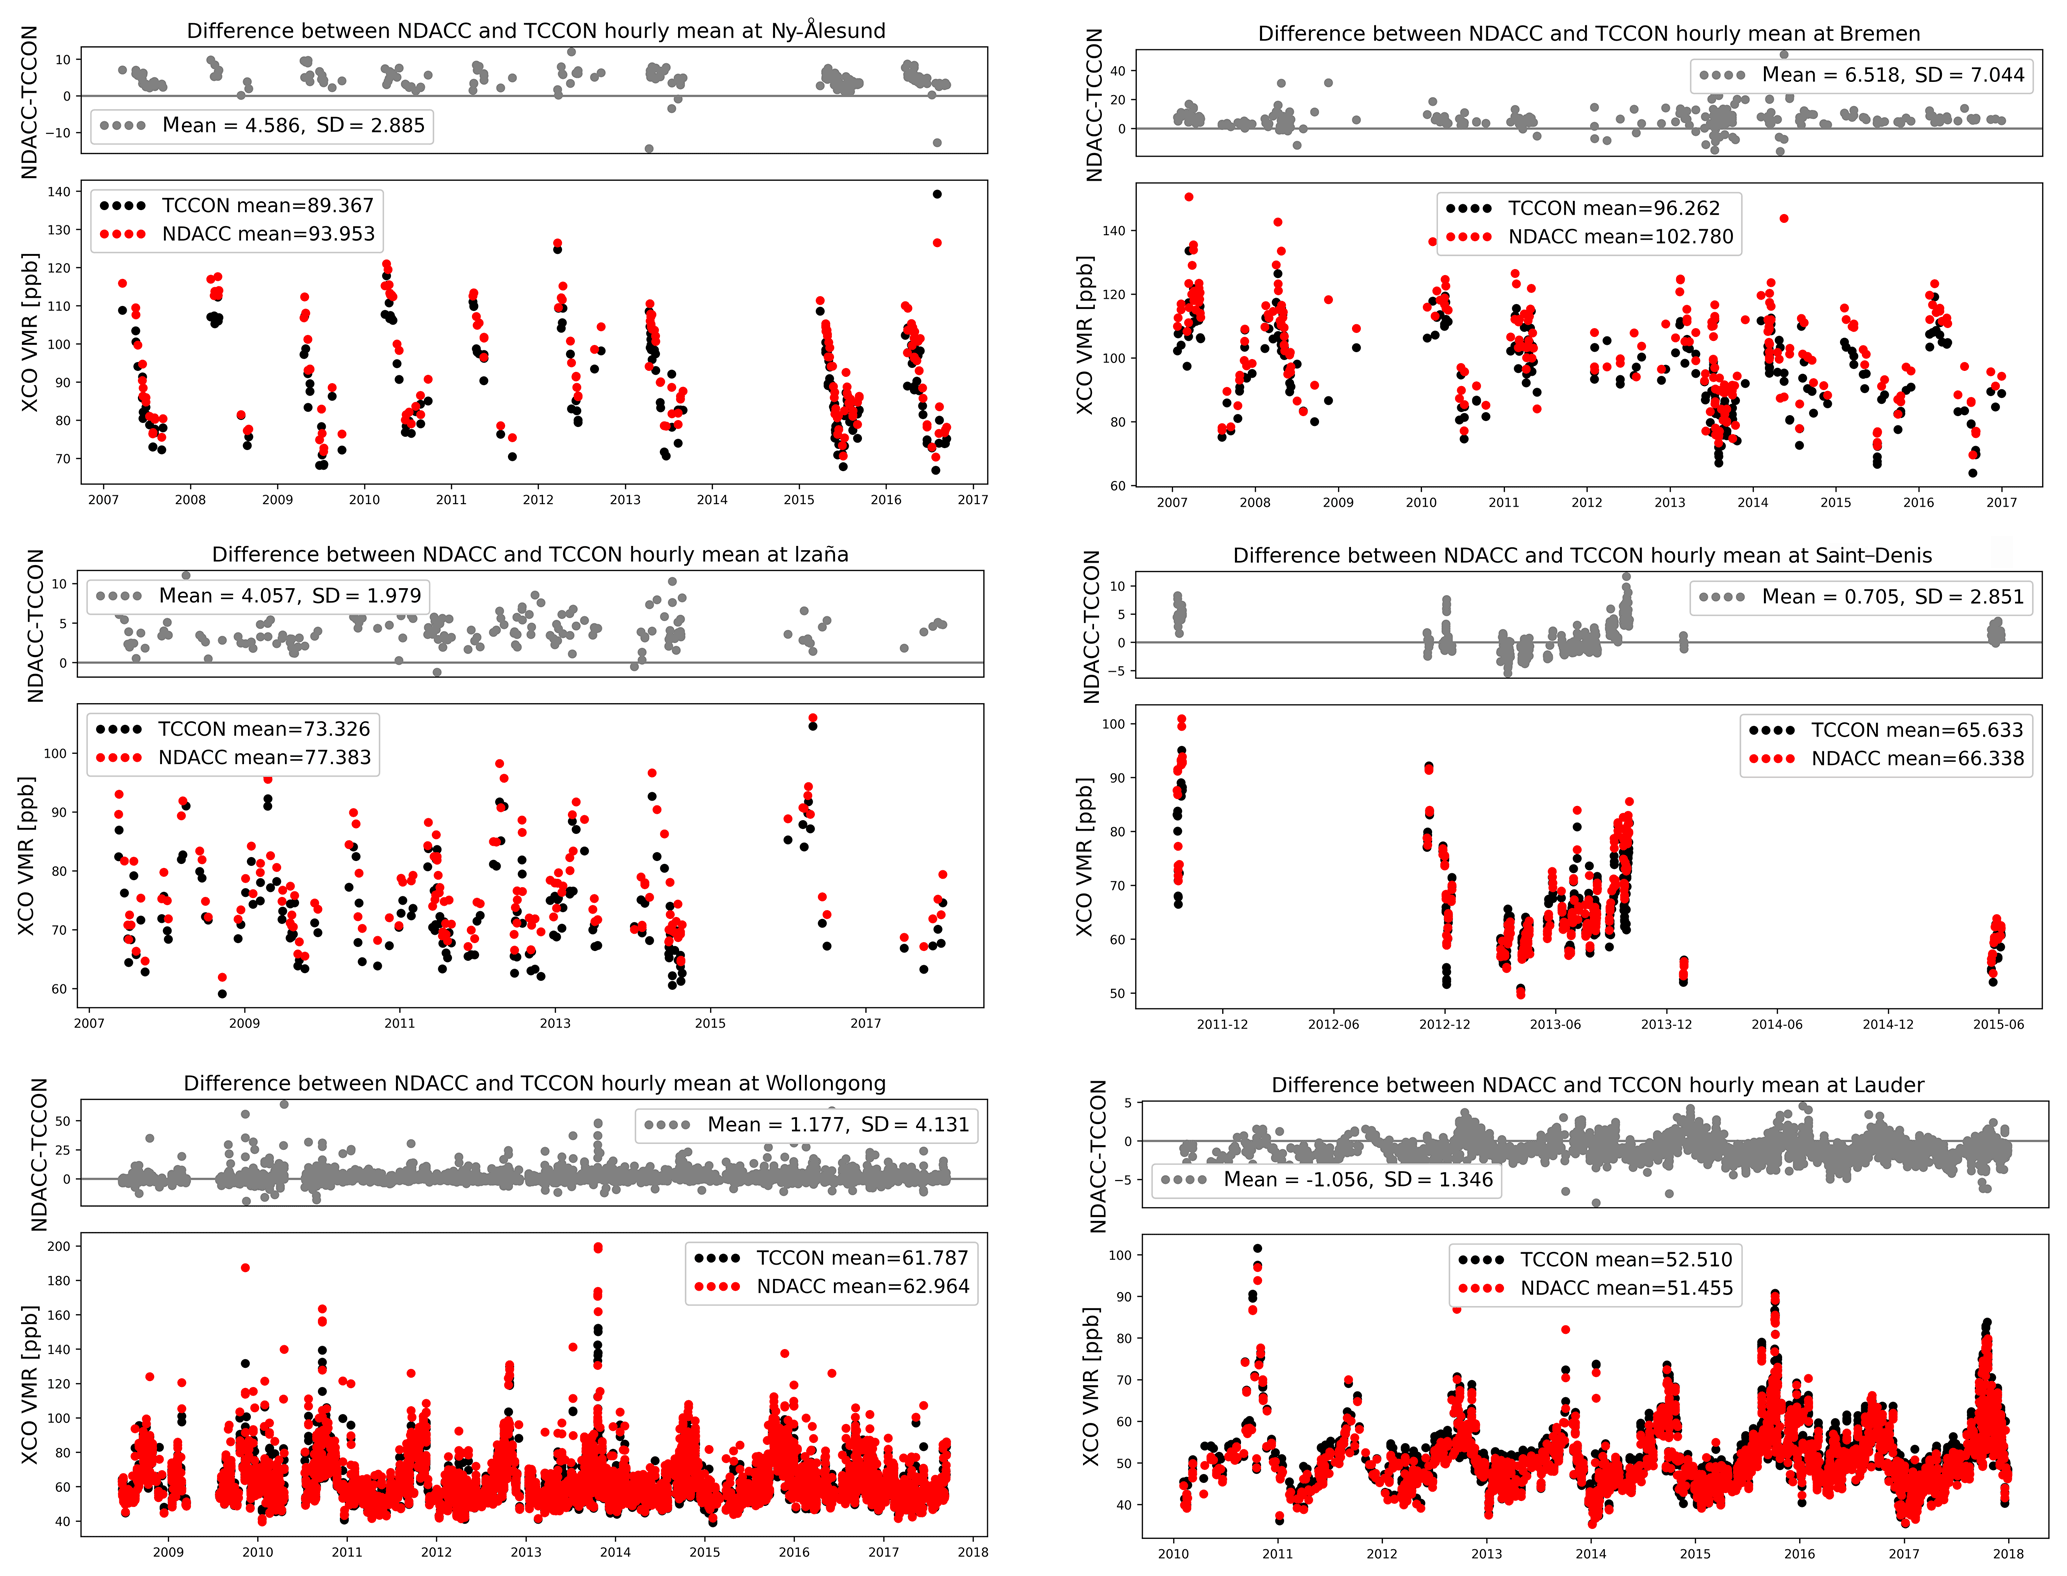
Figure 1The time series of the TCCON and NDACC XCO measurements, together with their differences in parts per billion. Note that the range of the y axes is different at each site due to a large variation in CO in the atmosphere.
Table 4 shows the relative mean and standard deviation (SD) between the TCCON and NDACC XCO measurements at these sites. The mean relative biases are about 5.5 % at Ny-Ålesund, Bremen and Izaña (Northern Hemisphere), and the absolute bias between the NDACC and TCCON data is within 2 % at Saint-Denis, Wollongong and Lauder (Southern Hemisphere). The difference in the mean bias between the two hemispheres is up to 5.2 %. Apart from the large SDs of 6.9 % and 6.6 % at Bremen and Wollongong, respectively, the SDs are quite similar among other sites with a range from 2.6 % to 4.3 %. According to Rodgers (2003), if we ignore the smoothing error of two datasets, the systematic and random uncertainties of the differences between standard TCCON and NDACC measurements are calculated as
where εsys,N is the systematic uncertainty of NDACC XCO measurements, and εran,T, εran,N are the random uncertainties of TCCON and NDACC XCO measurements, respectively. Table 4 shows that the mean bias is higher than the systematic uncertainty at Ny-Ålesund, Bremen and Izaña, while the SD is higher than the random uncertainty at Saint-Denis and Wollongong.
The ground-based FTIR records the direct solar radiation, and the light path is related to the SZA. Because of the uncertainty from the spectroscopy, the TCCON XCO data have been corrected with an air-mass-dependent factor (see Eq. 1). No correction is applied to the NDACC data. To check if there is a SZA dependence in the difference between TCCON and NDACC XCO measurements, the differences varying with SZA are shown in Fig. 2. Because of the different mean biases, the data are plotted separately in the Northern Hemisphere and in the Southern Hemisphere. In summary, the differences resulting from SZA are very small in both hemispheres, compared to the large scatter.
Table 4The relative mean and SD between the TCCON and NDACC XCO measurements ((NDACC-TCCON)/NDACC×100 %) at six sites, together with the systematic and random uncertainties of the differences between public TCCON and NDACC measurements. The relative mean and SD between the TCCON and NDACC (with and without correction) XCO measurements using the common optimal a priori profile.
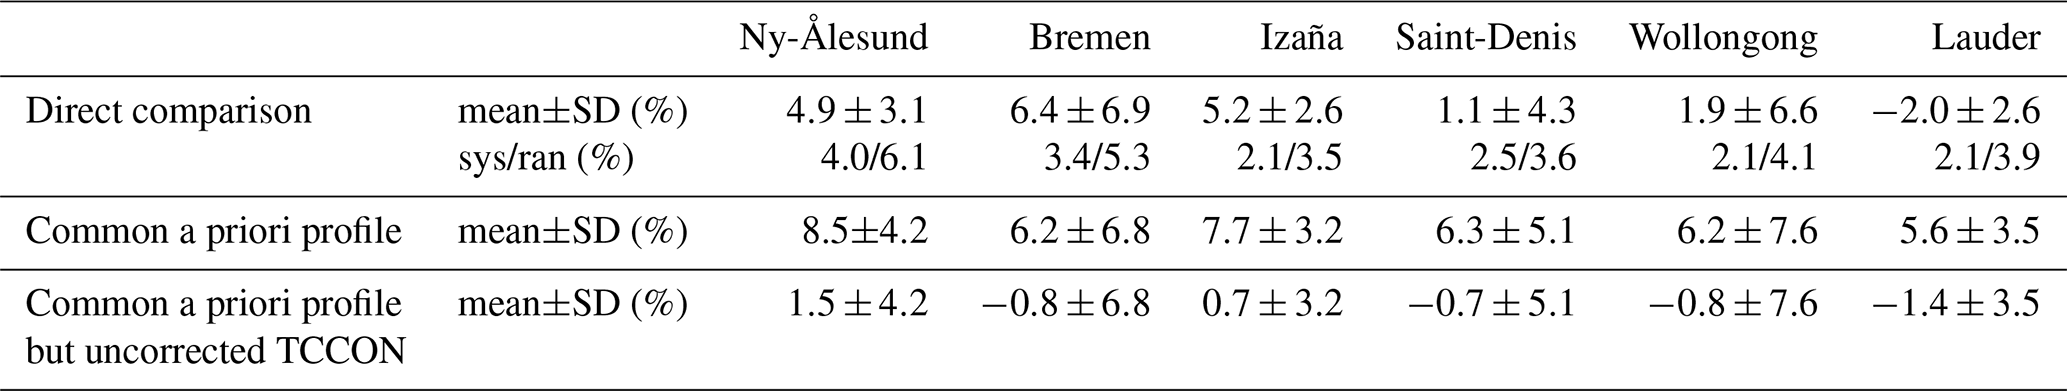
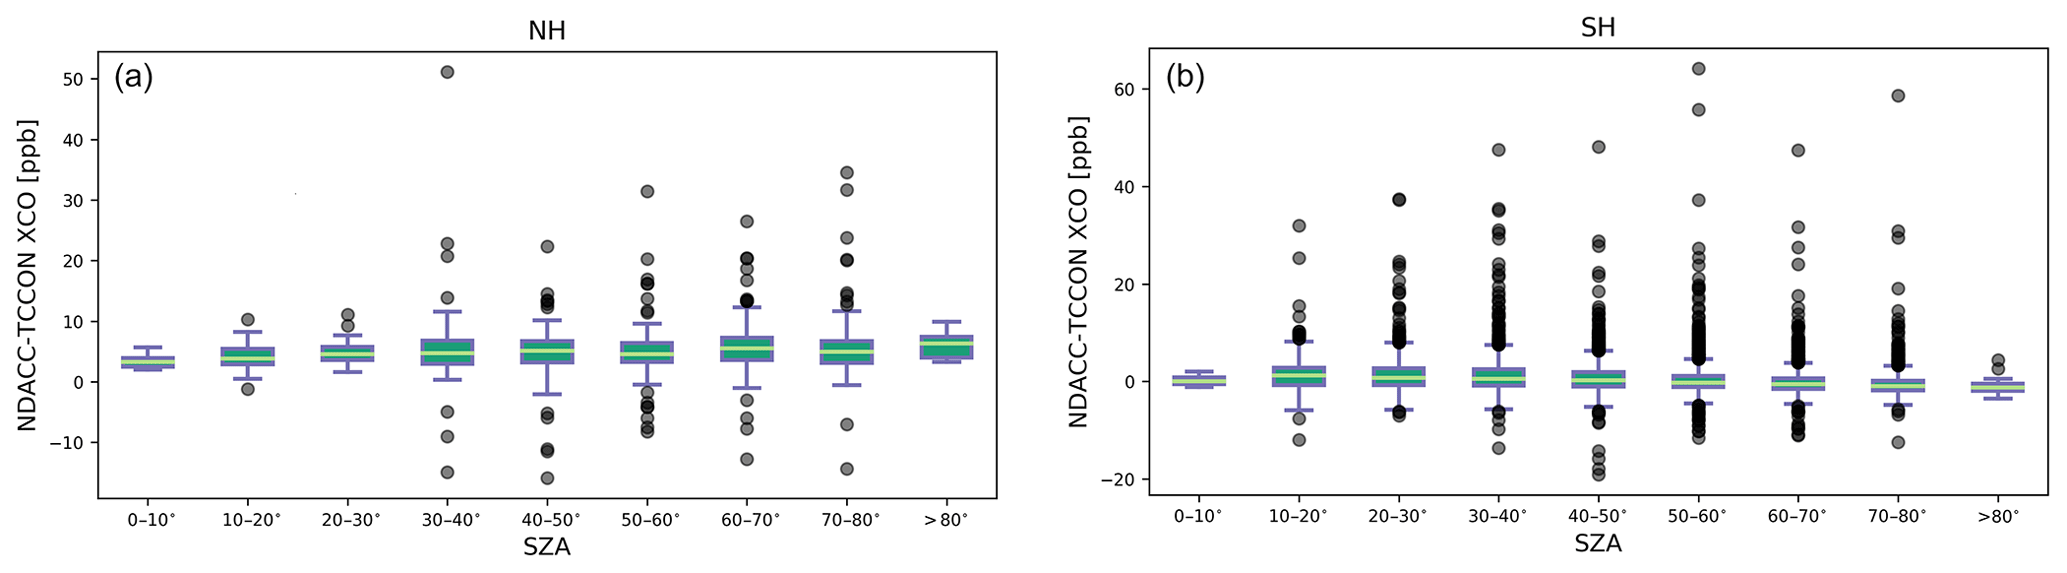
Figure 2The box plot of the differences between the TCCON and NDACC XCO measurements as a function of SZA for Northern Hemisphere (a) and Southern Hemisphere sites (b). The bottom and upper boundaries of the box represent the 25th and 75th percentiles of the data points around their median value (green line), and the error bars indicate the 5th and 95th percentiles of the data points.
In this section, we investigate the causes of the difference between the TCCON and NDACC XCO data. Based on the optimal estimation method (Rodgers, 2000), the TCCON and NDACC retrieved XCO can be written as
where the subscripts T and N point to TCCON and NDACC, respectively, Xr is the retrieved XCO, TCa is the a priori total column of CO, A is the column average kernel, PCt and PCa are the true and the a priori partial column profiles, respectively, and ε is the uncertainty. Note that εsys,T and εran,T are the systematic and random uncertainties of the uncorrected TCCON data (without scaling correction, air-mass-dependent correction and using surface pressure to calculate the dry-air column). α′ represents the calculation of the dry-air column and air-mass-independent and air-mass-dependent corrections in the TCCON procedure. The systematic uncertainty of the corrected TCCON data (standard product) is eliminated by its processing (). It is assumed that the random uncertainty is not affected by the α′, as α′ is close to 1.0 and the 1st order of the random uncertainty is unchanged. α′ is calculated as
where is the scaling factor in the GGG2014 code, is the difference in the dry-air total column between the O2 column and surface pressure, and is the air-mass-dependent correction. We calculate and based on the TCCON measurements at these six sites.
The difference between the standard TCCON and NDACC XCO measurements can then be written as
Apart from the retrieval uncertainties, the difference between the TCCON and NDACC XCO data also includes the impact from the different a priori profiles and averaging kernels of TCCON and NDACC measurements. The a priori profile of TCCON is generated on a daily basis by the GGG2014 code (Toon and Wunch, 2014), based on Mark IV Balloon Interferometer (MkIV) and Atmospheric Chemistry Experiment – Fourier Transform Spectrometer (ACE-FTS) profiles measured in the 30–40∘ N latitude range from 2003 to 2007 and taking into account the tropopause height variation and the secular trend. The mean of the monthly means during 1980–2020 from the Whole Atmosphere Community Climate Model (WACCM) version 6 is used as the a priori profile for the NDACC retrievals (constant in time) at Ny-Ålesund, Bremen, Izaña, Saint-Denis and Wollongong. The a priori profile for NDACC retrievals at Lauder is constructed from several Atmospheric Trace Molecule Spectroscopy (ATMOS) and aircraft observations. The CO a priori profiles of TCCON and NDACC measurements at these six sites are shown in Fig. 3. The TCCON and NDACC a priori profiles are very different. The TCCON a priori profiles at the six sites are close to each other in the stratosphere, which is due to the fact that the stratospheric part of the TCCON a priori profile is mainly generated based on the MkIV and ACE-FTS profiles measured in the 30–40∘ N latitude range. The TCCON a priori profiles in the troposphere at Ny-Ålesund, Bremen and Izaña are close to each other and are very different than those at Saint-Denis, Wollongong and Lauder. The NDACC CO a priori profiles are much more variable than TCCON a priori profiles both in the troposphere and in the stratosphere. Based on previous studies and emission inventories, the a priori profile shapes from NDACC seem to be more realistic. For example, at Saint-Denis, the CO VMR in the middle and upper troposphere is much larger than that in the lower troposphere because the air in the lower altitude is relatively clean, coming mainly from the Indian Ocean, while the air mass in the middle and upper troposphere is more polluted coming mainly from Africa and South America (Duflot et al., 2010; Zhou et al., 2018). At Bremen, the CO VMR in the boundary layer is much larger than the CO VMR in the free troposphere because there are strong local anthropogenic emissions (European Commission, 2013).
The column averaging kernels (AVKs) of TCCON and NDACC retrievals are different due to their different retrieval windows, spectral resolution and retrieval settings. The AVKs of TCCON and NDACC retrievals at Saint-Denis are shown in Fig. 4. In general, the TCCON column AVK increases with altitude, which implies that the TCCON retrieved CO total column tends to underestimate a deviation from the a priori profile in the troposphere and to overestimate a deviation from the a priori profile in the stratosphere. NDACC exhibits uniform sensitivity in the troposphere and varies in the stratosphere with SZA. As a result, NDACC retrieved CO total columns correctly capture a deviation from the a priori partial column in the troposphere and generally underestimate a deviation from the a priori partial column in the stratosphere.

Figure 3The CO a priori VMR profiles for TCCON (a) and NDACC (b) at six sites (ny: Ny-Ålesund; br: Bremen; iz: Izaña; st: Saint-Denis; wo: Wollongong; la: Lauder). As TCCON a priori profiles change every day, the mean profiles in 2013 are shown here.
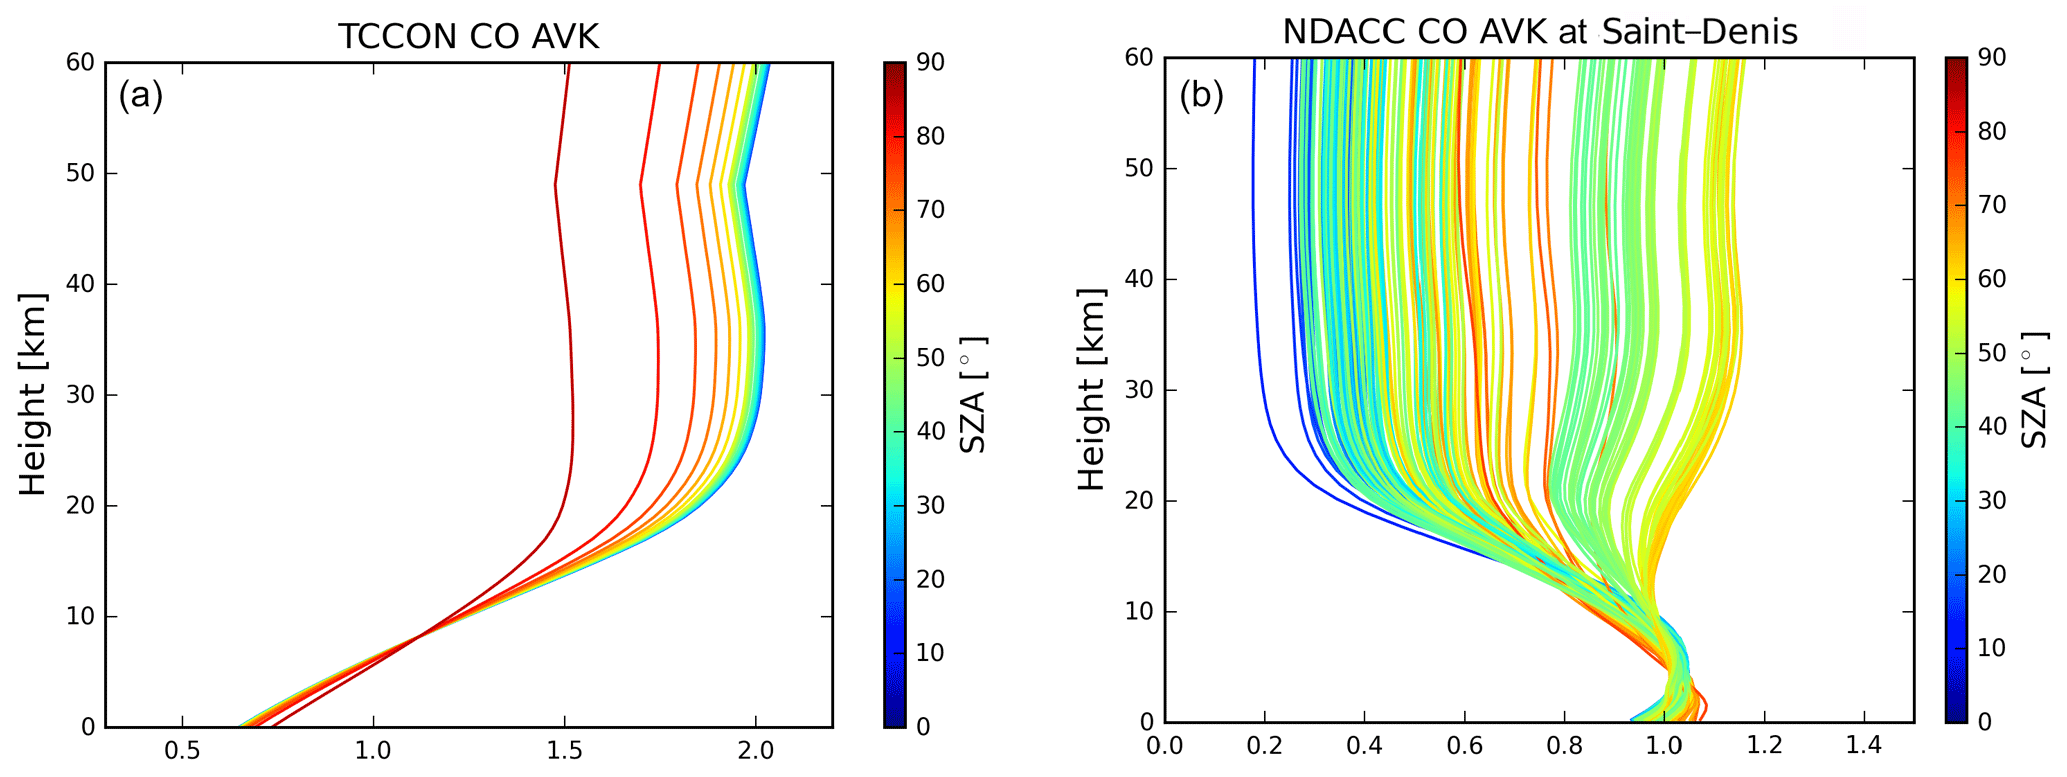
Figure 4The column averaging kernels of TCCON (a) and NDACC (b) CO retrievals at Saint-Denis.
4.1 Using common a priori profile
To better compare the TCCON and NDACC retrievals, a common optimal a priori profile (subscript op) is applied to both TCCON and NDACC retrievals (Rodgers, 2003). The TCCON and NDACC retrieved XCO values are
where PCop is the common a priori partial column profile, TCop is the a priori total column and is the uncorrected retrieved TCCON CO total column with the optimal a priori profile. The difference between the TCCON and NDACC XCO becomes
We keep the systematic uncertainty here, in case the correction of the TCCON data does not get rid of the systematic uncertainty completely. If the optimal common a priori profile is close to the true status, then the first item in the right-band side of the Eq. (11) can be neglected and the difference between the TCCON and NDACC XCO data becomes
where and . There is a systematic (constant) difference between the TCCON and NDACC XCO products of about 7.0 % because of the air mass correction, air-mass-independent correction and the method of calculating dry-air column of TCCON data.
Figure 5 shows the TCCON a priori and retrieved TCCON profiles, together with NDACC a priori and scaled NDACC a priori profiles along with HIPPO CO measurements at Wollongong and Lauder. For the scaled NDACC a priori profile, the scaling factor is calculated as the ratio between each retrieved NDACC CO total column and a priori CO total column (). By comparing against HIPPO measurements, it is found that the vertical variability in the TCCON a priori profile is too small and both the TCCON and NDACC a priori profiles have systematic biases. In summary, the scaled NDACC a priori profile is the most reasonable a priori profile among them. Instead of using another model profile, which is not always available to the TCCON and NDACC data users, we chose scaled NDACC a priori profiles as the common a priori profiles for TCCON and NDACC measurements.
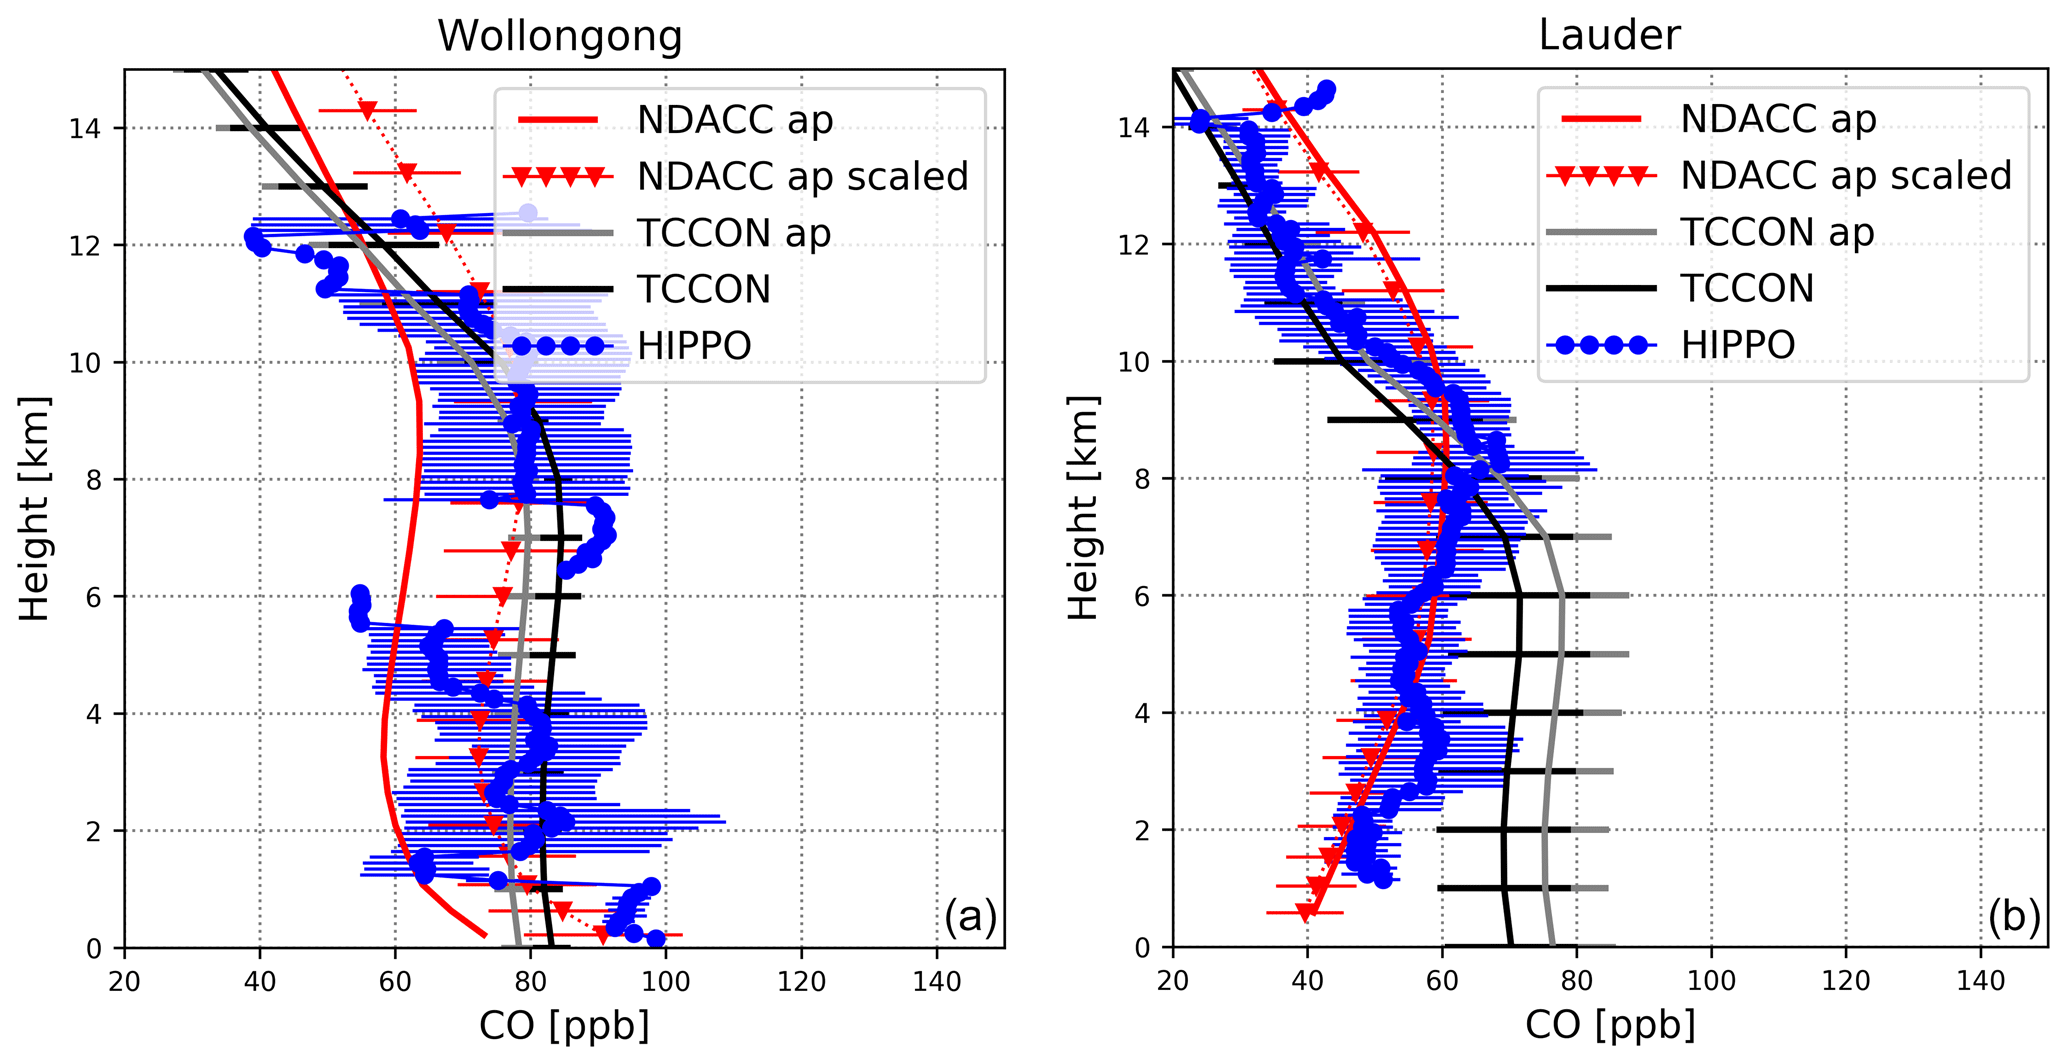
Figure 5The vertical distribution of the NDACC a priori profile (NDACC ap), scaled NDACC a priori profiles (NDACC ap scaled), TCCON a priori profiles (TCCON ap), TCCON retrieved profiles (TCCON) and HIPPO aircraft measurements (HIPPO) in the range from surface to 15 km at Wollongong (a) and Lauder (b). The error bar is the SD for each dataset.
The systematic smoothing error is reduced by using the updated a priori profile. The differences between the TCCON and NDACC XCO measurements by using the scaled NDACC a priori profile as the common a priori profile are also listed in Table 4. The biases become 5.6 % to 8.5 % with a mean value of 6.8 %, and there is almost no interhemispheric dependence. However, the bias is beyond the systematic uncertainty at all sites. If we use the uncorrected TCCON data (scaling TCCON data by +7 % according to Eq. 12; see Table 4), then the differences between the TCCON and NDACC XCO measurements at these sites become −1.4 %–1.5 %. It seems that the processing and correction of the TCCON data, especially the scaling factor, leads to the bias, which is consistent with the results of Kiel et al. (2016).

Figure 6The systematic (a) and random (b) covariance matrices of the common optimal a priori profile (scaled NDACC a priori profiles) at Bremen.
4.2 Smoothing error estimation
Although the scaled NDACC a priori profile seems to be a good candidate to represent the atmospheric CO profile, it is not the true status. According to Rodgers (2003), the smoothing error should be taken into account when comparing two remote sensing retrievals:
where is the partial column profile of the dry air and Sx is the a priori covariance estimation of the CO VMR profile in parts per billion squared, including systematic and random parts. Since the scaling factor of the NDACC a priori profile is based on the NDACC retrieved total column, and the systematic uncertainty of NDACC XCO data at Izaña, Saint-Denis, Wollongong and Lauder are about 2.0 % (see Table 3), it is assumed that the systematic bias for the diagonal values is 2.0 %. For Bremen and Ny-Ålesund, the systematic uncertainty might be underestimated. The non-diagonal elements are calculated from the diagonal values Sij=σiσj (von Clarmann, 2014). The random part is set as the covariance matrix of the scaled NDACC a priori profiles after smoothing with a correction width of 2.0 km. As an example, the covariance matrix at Bremen is shown in Fig. 6. The random covariance is about 10 times larger than the systematic covariance. Table 5 lists the smoothing error when comparing TCCON with NDACC data by using the scaled NDACC a priori profile as the common a priori profile. The systematic smoothing error is within 0.2 %, which is relatively small compared to the mean difference between the TCCON and NDACC XCO data (5.6 %–8.5 %). The random smoothing error is between 2.0 % and 4.2 %, which can help to explain the large SD values in the TCCON and NDACC differences. Note that the smoothing error might be underestimated because the CO profile in the real atmosphere does not always follow the vertical shape of the NDACC a priori profile so that the variability of CO can be larger than what we estimated.
The smoothing errors of the standard TCCON and NDACC CO total column are estimated as
where the systematic and random covariance matrices Sx,T(N) are calculated from the differences between the scaled NDACC a priori profiles and TCCON (NDACC) original a priori profiles. Table 5 shows that the systematic smoothing error of the TCCON XCO data can reach up to 7.9 % (Lauder), which is quite large compared to the difference between TCCON and NDACC XCO measurements. The systematic smoothing error of TCCON data at Southern Hemisphere sites is larger than that at Northern Hemisphere sites. The random smoothing error of TCCON data is in the range between 2.0 % and 3.6 %, which is larger than the 1.0 % estimated in Wunch et al. (2015) by shifting the TCCON a priori CO profile down by 1 km. The systematic smoothing error of NDACC data is in the range between 0.1 % and 0.8 % and the random smoothing error of NDACC data is about 0.3 %. The smoothing error of the TCCON data is much larger than that of the NDACC data because (1) the TCCON AVK deviates more from 1.0 than the NDACC AVK, and (2) the deviation between the TCCON a priori profile and the true atmosphere seems to be larger than that for NDACC, especially in the Southern Hemisphere.
Table 5The systematic and random smoothing errors of the difference between TCCON and NDACC XCO data (using scaled NDACC a priori profiles as the common a priori profile), standard TCCON XCO data and NDACC XCO data.

4.3 Comparison between AirCore and TCCON data
It is found that the difference between the TCCON and NDACC measurements with the common optimal a priori profile is higher than their uncertainties, even after taking the smoothing error into account. To investigate the scaling factor (1.0672) of the TCCON XCO data, the AirCore measurements at Sodankylä and Orléans are compared with the TCCON XCO measurements. The AirCore measurements have been performed regularly by the Finnish Meteorological Institute (FMI) and the University of Groningen (RUG) at Sodankylä (Finland) since September 2013 and by the Laboratoire des Sciences du Climat et de l'Environnement (LSCE) at Orléans (France) since October 2016. Orléans and Sodankylä are operational TCCON sites but there are no NDACC XCO measurements available at these two sites. The AirCore measurement technique uses a balloon to bring a long coiled tube up to the lower or middle stratosphere and samples a vertical profile of air inside the tube during its descent. After its landing, the tube is recovered and the air inside the tube is transferred to a gas analyzer to measure the CO mole fraction vertical profile (Karion et al., 2010). As the vertical resolution of the AirCore measurement depends on the molecular diffusion inside the tube, the tube's diameter is kept sufficiently thin (<1.0 cm) to have a laminar flow at the sampling flow rates (Paul et al., 2016; Membrive et al., 2017). In addition, the AirCore samples were typically analyzed within 4 h after landing to minimize the influence of molecular diffusion on the vertical resolution of the AirCore profiles. The AirCore measurements cover the vertical range from several hundred meters above the surface to about 20–25 km, and the total uncertainty of the CO measurement is about 2–3 ppb (∼3.0 %).
To compare the AirCore profiles with the TCCON XCO data, the AirCore profile first needs to be extended to the whole atmosphere. We use the surface in situ measurements (Schmidt et al., 2014; Kilkki et al., 2015) to fill the gap between the surface and the lowest AirCore altitude (several hundred meters above the ground), and we use the scaled ACE-FTS profile to fill the CO profile above the AirCore altitude to the top of the atmosphere. The ACE-FTS profile is the mean of the all measurements located within the latitude band of the FTIR site during 2007–2017. The uncertainties are set as 3.0 % for the surface in situ and AirCore measurements and as 25.0 % for the altitude above the AirCore maximum measurement height according to the ACE-FTS data uncertainty (Clerbaux et al., 2008). Second, the “extended” AirCore VMR profile is re-gridded on the TCCON retrieval levels and the partial column profile is calculated based on the surface pressure and NCEP pressure, temperature and water vapor profiles. As an example, Fig. 7 shows the extended AirCore profile together with the TCCON a priori profile, original AirCore and surface in situ measurements on 15 July 2014 at Sodankylä. Finally, the extended AirCore partial column profile is smoothed with TCCON AVK, and the XCO is derived from the smoothed AirCore total column
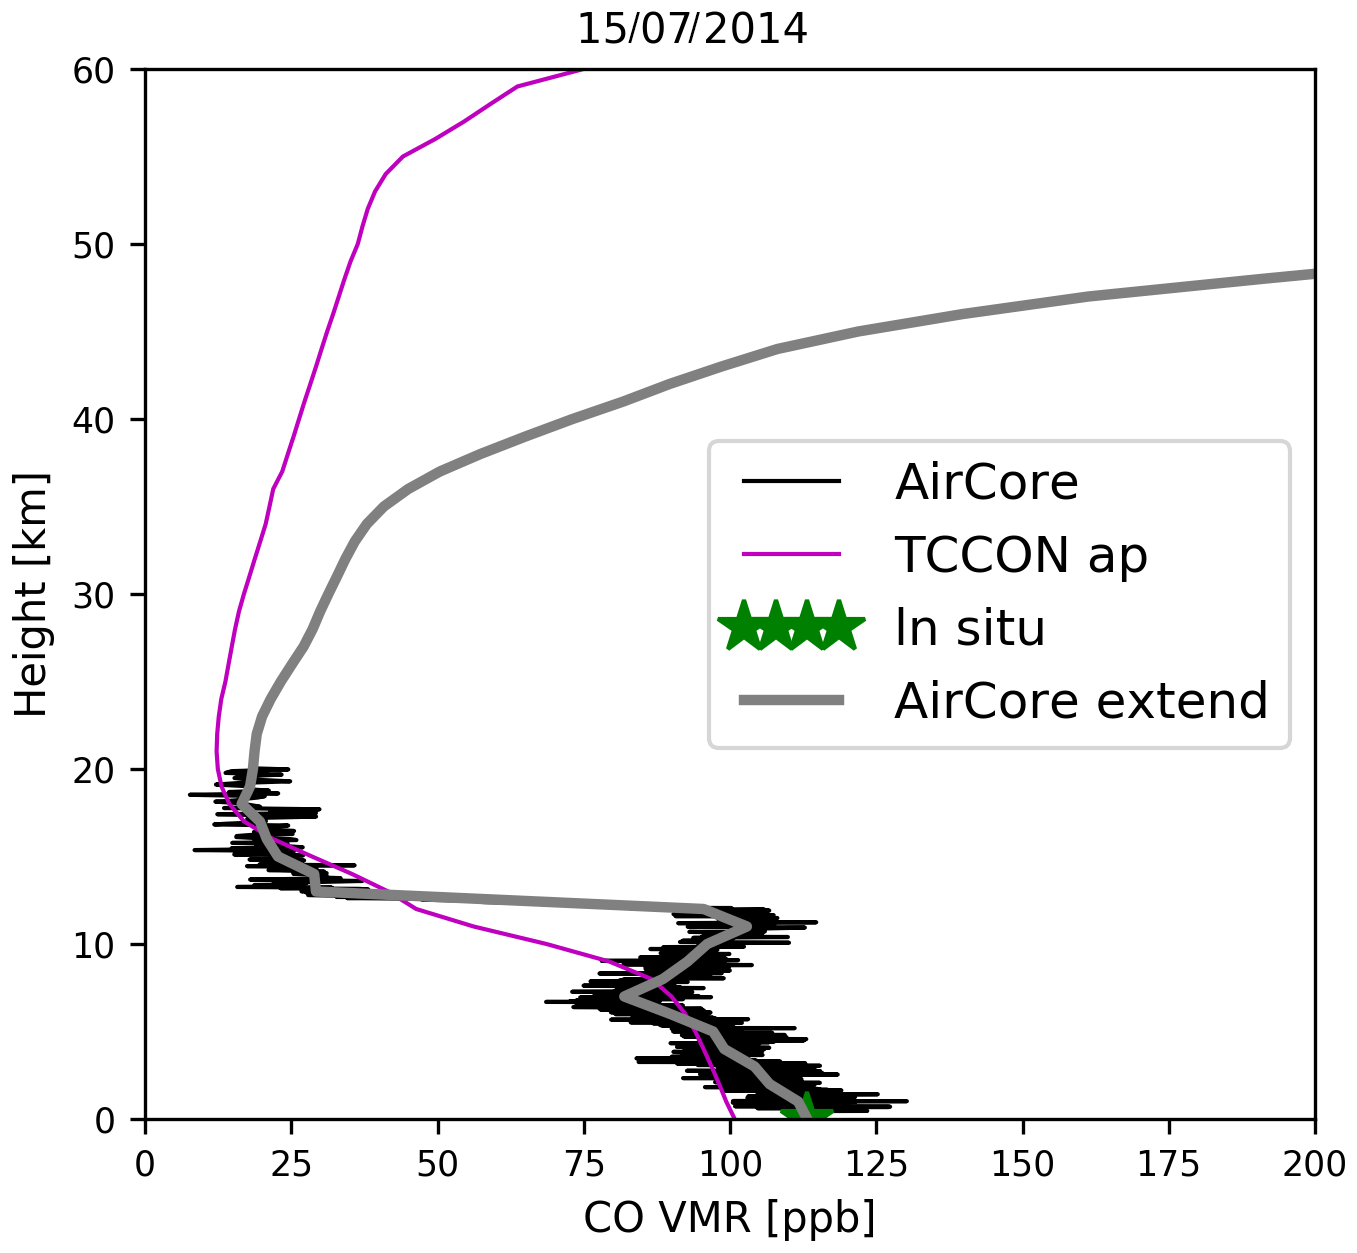
Figure 7The “extended” AirCore CO profile together with the TCCON a priori profile, original AirCore and surface in situ measurements on 15 July 2014 at Sodankylä.
The co-located daily mean of the TCCON XCO retrievals is compared with each AirCore measurement. Instead of using 3.0 % as the random uncertainty of the TCCON data, the daily SD of the TCCON data is used to represent the random uncertainty of the TCCON data. The scatter plots between the TCCON and AirCore measurements at Orléans and Sodankylä are shown in Fig. 8. The TCCON XCO measurements are 6.1 ± 1.6 % and 8.0 ± 3.2 % less than the AirCore measurements at Orléans and Sodankylä, respectively. The relative differences between the TCCON and AirCore measurements have no obvious seasonal dependence. This result is consistent with Table 4 showing that the mean NDACC data are 6.8 % larger than the TCCON data by using the common optimal a priori profile. Without the scaling factor (or α=1.0000 instead of 1.0672), the mean differences between TCCON and AirCore are and 1.3±3.2 % at Orléans and Sodankylä, respectively. Further investigations are needed to understand whether the TCCON XCO data are incorrectly scaled at other TCCON sites.
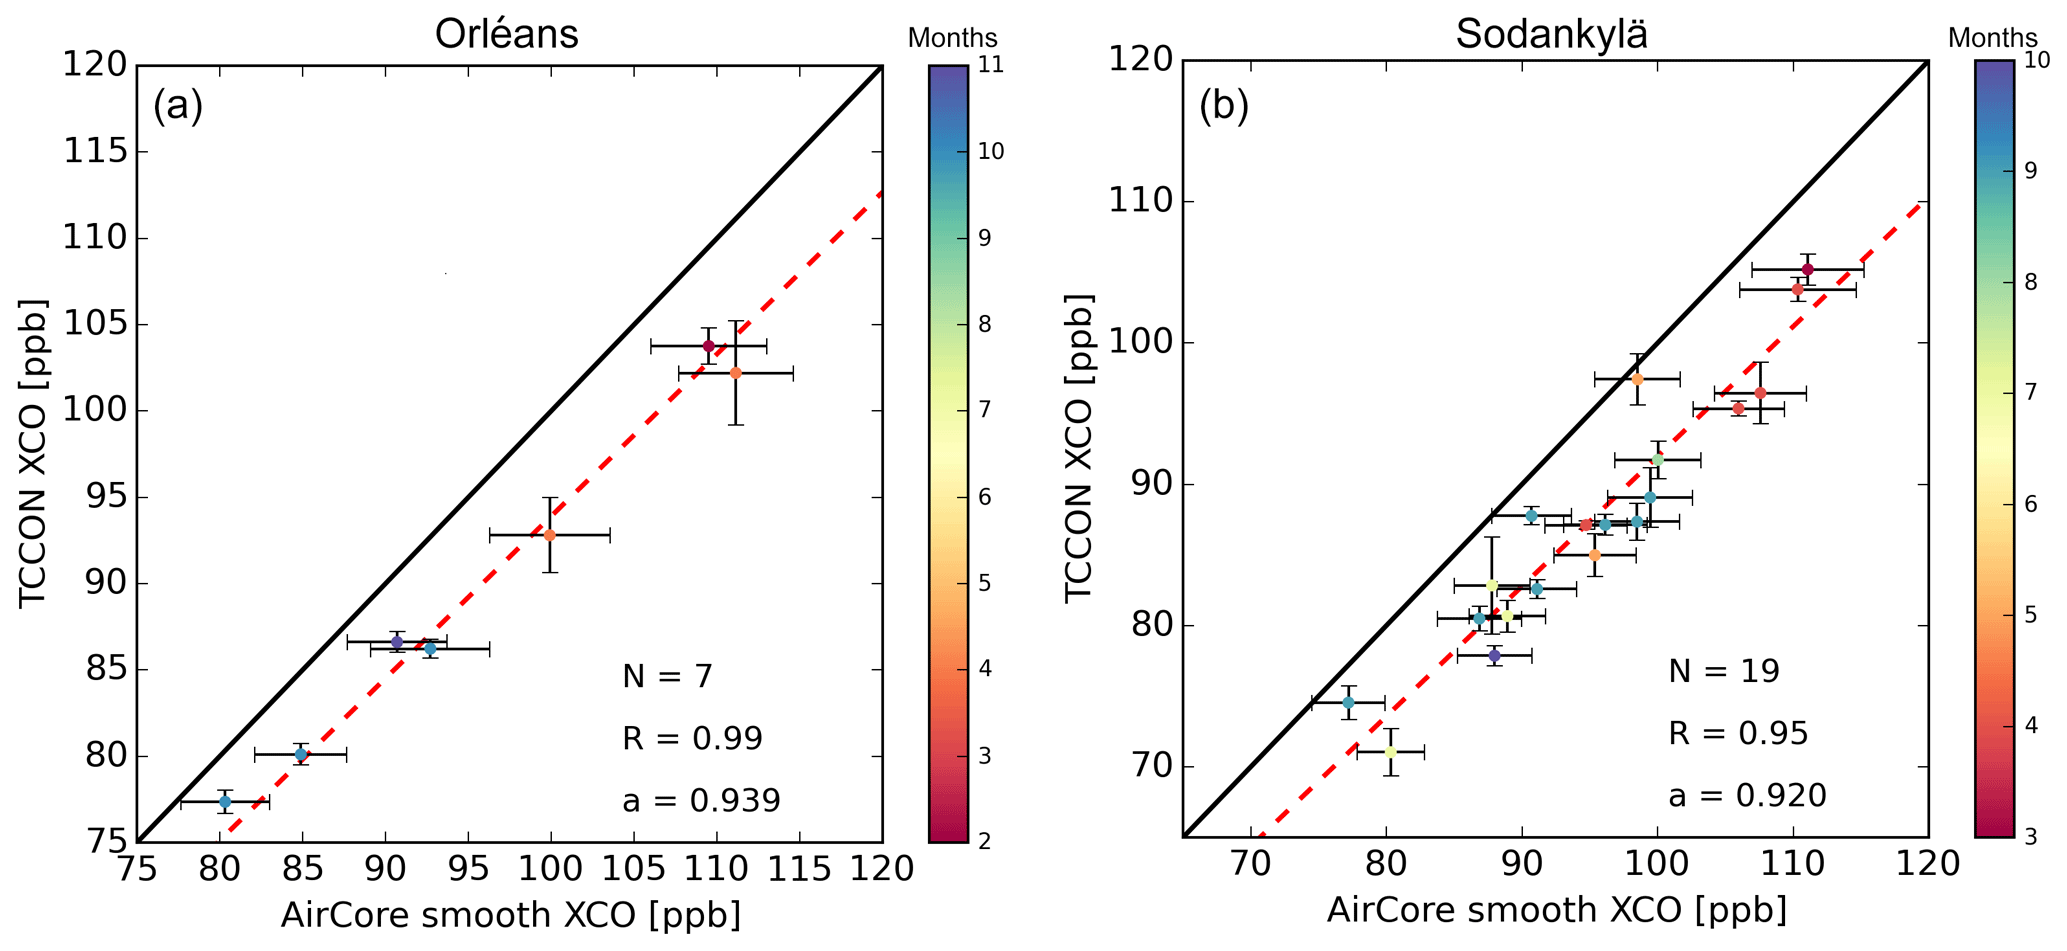
Figure 8The scatter plots between the TCCON XCO retrievals and the smoothed AirCore XCO measurements at Orléans (a) and Sodankylä (b). The black line is the one-to-one line, and the red dashed line is the linear fitting (forced to cross the zero). The data are colored their measurement times in each month. The error bar of the TCCON XCO retrieval is the daily SD, representing the random uncertainty of the TCCON data, while the error bar of the AirCore data is the total uncertainty for each measurement. N is the number of co-located measurements, R is the correlation coefficient and a is the slope of the fitting line.
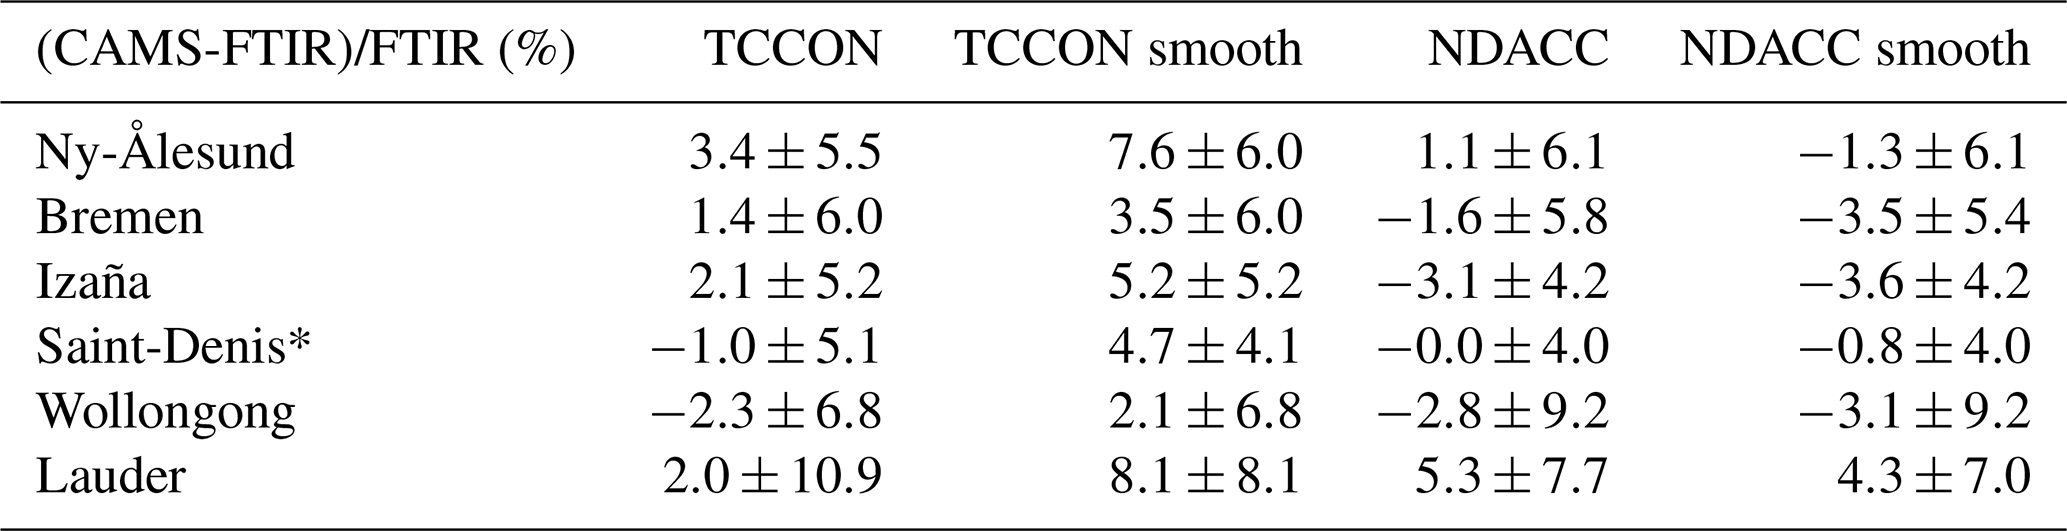
Table 6The mean and SD of the relative difference between the CAMS and FTIR (TCCON and NDACC) XCO data, with and without smoothing. Saint-Denis *: TCCON data are from the Saint-Denis site, while NDACC data are from the Maïdo site.
In this section, we give an example of using the TCCON and NDACC XCO data together to compare with an atmospheric model simulation. The TCCON and NDACC measurements from the six sites are used to compare with the Copernicus Atmosphere Monitoring Service (CAMS) operational (o-suite) reactive gas model reanalysis simulations from March 2015 to December 2018. Because there are no NDACC measurements at Saint-Denis after June 2015, the measurements at Maïdo are used here, which is about 20 km away from Saint-Denis (Zhou et al., 2016). The model uses the chemistry-coupled integrated forecasting system (CIFS) model run with a truncation of T511, which has an approximate resolution of 40 km by 40 km and 60 vertical layers (surface to 0.1 hPa). The CAMS o-suite reanalysis CO data have been assimilated with IASI-A, IASI-B and MOPITT satellite measurements (Inness et al., 2015). The model output has a 6 h temporal resolution. Note that the CAMS o-suite model mainly focuses on the troposphere, and the CO VMR in the stratosphere is underestimated. More information can be found in the CAMS near-real-time system description (https://confluence.ecmwf.int/display/COPSRV/Global+production+log+files, last access: 26 April 2019) and the validation report (Wagner et al., 2019).
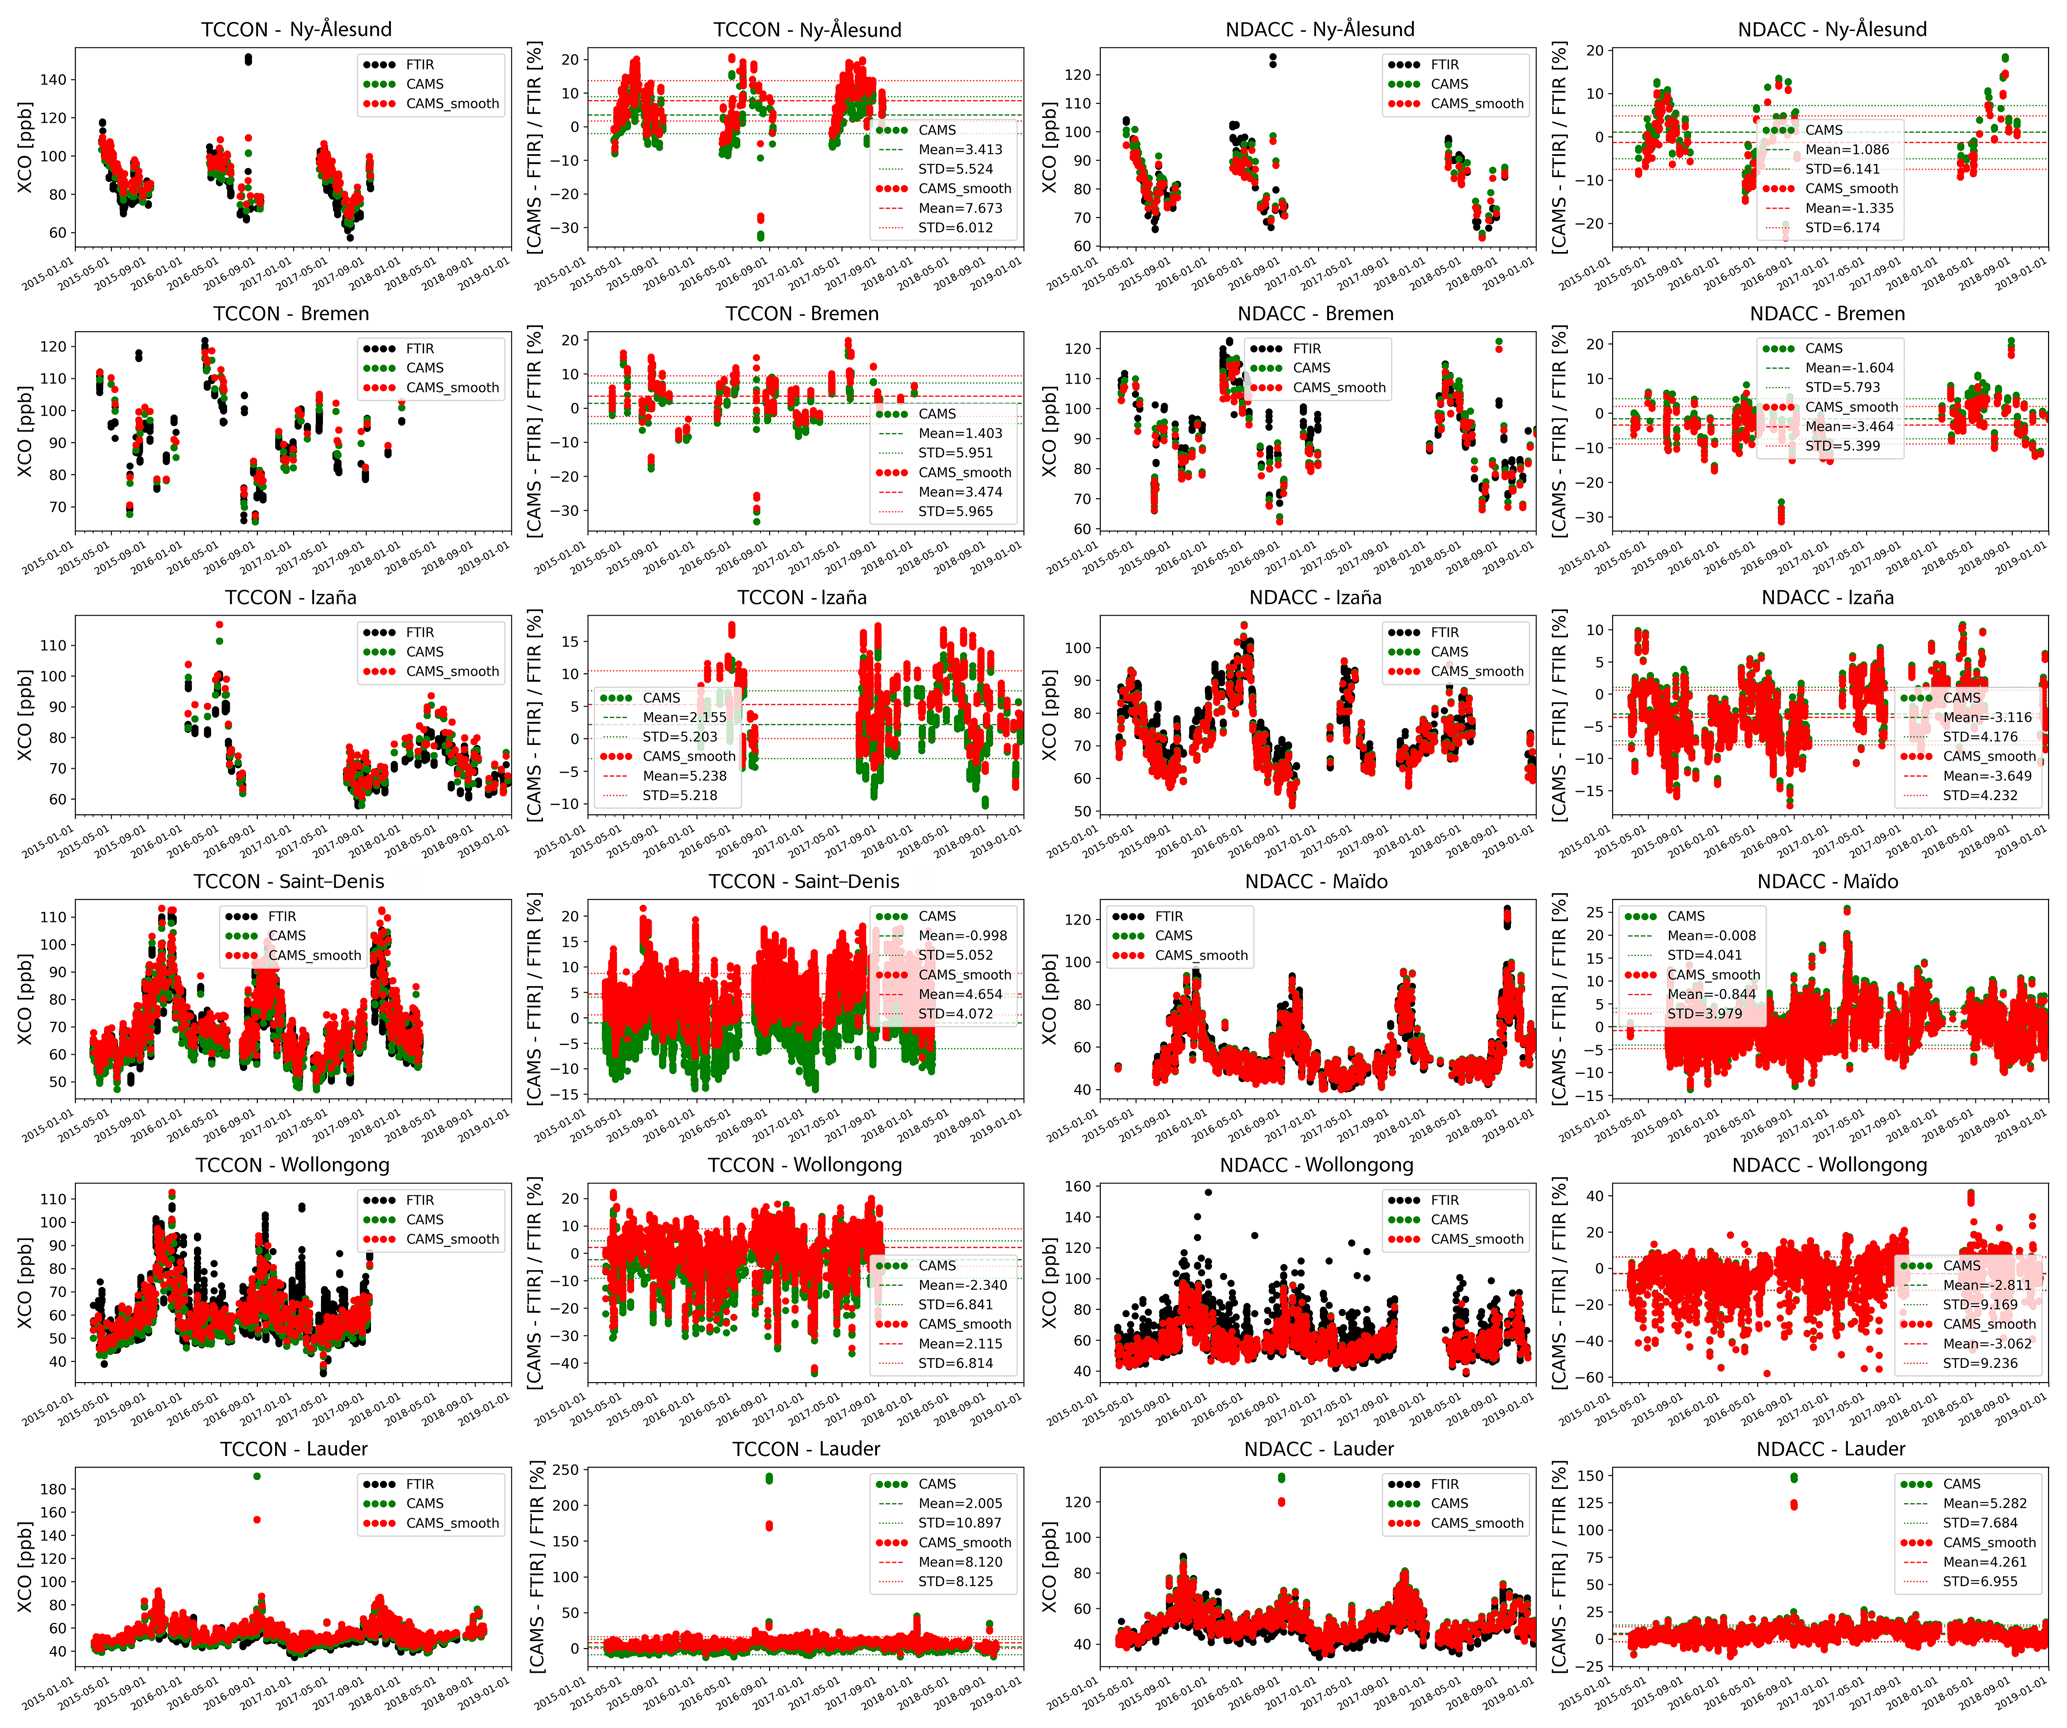
Figure 9The time series of XCO from the TCCON measurements, the CAMS model and the CAMS model smoothed with TCCON data at six sites (first column) and their relative differences (second column). The time series of XCO from the NDACC measurements, the CAMS model and the CAMS model smoothed with NDACC data at six sites (third column) and their relative differences (last column).
For each FTIR measurement, the closed CAMS model output in time with space interpolated is selected as one data pair, and an altitude correction is applied to the model output to make the model surface altitude the same level as the FTIR site (Langerock et al., 2015). The time series of XCO from the FTIR measurements and the CAMS model with and without being smoothed with the FTIR data, together with their differences, are shown in Fig. 9. In general, the model simulates the seasonal variation in XCO very well. However, the model simulation is larger than the FTIR measurements in local winter and smaller than the FTIR measurements in summer at Ny-Ålesund, indicating an underestimation in the amplitude of the seasonal variation in XCO for the CAMS model at this site. Several high XCO FTIR measurements are not well captured by the CAMS model at Ny-Ålesund and Bremen. Fewer satellite observations improve the CAMS model at higher latitudes due to measurement difficulties, which may cause the poorer performance at these sites. Both TCCON and NDACC measurements show many high XCO values at Wollongong, which are not well simulated in the CAMS model. There is an extremely high value in the CAMS model simulations at Lauder, which is not observed in TCCON and NDACC measurements. High locally impacted values are not expected to be captured by the model due to dilution: both temporally (6 h compared to minutes) and spatially (40 km2 compared to site location).
Table 6 lists the mean and SD of the relative difference between the CAMS model (with and without smoothing) and FTIR measurements. The averaged bias between the TCCON and CAMS smoothed data is 5.2 %, while the averaged bias between the NDACC and CAMS smoothed data is −1.2 %. The latter bias is due to the underestimation of the stratospheric CO in the CAMS model. The difference between the averaged biases of the CAMS model with TCCON and NDACC data is 6.4 %, which is consistent with the result obtained when comparing TCCON and NDACC XCO data using the scaled NDACC a priori profile as the common a priori profile (see Table 4). According to the AirCore measurements in Sect. 4.3, the bias of 5.2 % between the TCCON and CAMS smoothed data is mainly due to the scaling factor of the TCCON XCO measurements. In addition, Table 6 shows that the changing of the model XCO data after smoothing with TCCON data ranges from 2.1 % (Bremen) to 6.1 % (Lauder), which is much larger than that after smoothing with NDACC data of 0.3 %–2.4 %. It is confirmed that the smoothing error of TCCON XCO data is much larger than that of NDACC XCO data, and the smoothing error must be taken into account when using FTIR XCO data.
In this study, the difference between the TCCON and NDACC XCO data products during the period 2007–2017 has been studied at six sites (Ny-Ålesund, Bremen, Izaña, Saint-Denis, Wollongong and Lauder) where co-located NDACC and TCCON FTIR observations are carried out.
When doing a straightforward comparison between both XCO data products, it is found that for the Northern Hemisphere sites the TCCON XCO values are about 5.5 % smaller than the NDACC XCO values, and the absolute bias between the NDACC and TCCON data is within 2 % at the Southern Hemisphere sites. To understand these interhemispheric differences in the biases, we have looked in more detail into the characteristics of both products, in particular their averaging kernels and dependence on the a priori profiles used in the retrievals. Taking into account these differences in the comparisons, by adjusting the products towards a common optimal a priori profile, it is found that the biases between the adjusted TCCON and NDACC XCO data products are almost constant (5.6 %–8.6 %) with a mean value of 6.8 %; for the common optimal a priori profile we have chosen the NDACC a priori profiles scaled with the ratios of the retrieved columns to the a priori columns.
The first conclusion therefore is that the apparent interhemispheric difference in the bias disappears when accounting correctly for the smoothing errors. To confirm this first finding we have estimated the systematic and random smoothing errors of the TCCON and NDACC XCO data according to the optimal estimation method (Rodgers, 2000): the TCCON XCO systematic smoothing errors vary in the range between 0.2 % (Bremen) and 7.9 % (Lauder), and their random smoothing errors lie in the range between 2.0 % and 3.6 %, which is larger than the random uncertainty of 1.0 % estimated in Wunch et al. (2015). Also, the TCCON XCO systematic and random smoothing errors are larger than the NDACC XCO systematic and random smoothing errors that are in the range between 0.1 % and 0.8 % for the systematic ones and of the order of 0.3 % for the random ones, and they are larger in the Southern Hemisphere than in the Northern Hemisphere. This is because (1) the TCCON AVK deviates more from 1.0 than the NDACC AVK, and (2) the deviation between the TCCON a priori profile and the true profile seems to be larger than that for NDACC, especially in the Southern Hemisphere. This finding also demonstrates the importance of accounting for the smoothing errors when comparing FTIR XCO data, and particularly TCCON XCO data, with satellite measurements or model simulations. This has not always been done in recent satellite validation studies (Borsdorff et al., 2016, 2018; Hochstaffl et al., 2018). As a consequence, the biases reported in these papers are not relevant because they fall in the systematic uncertainty, especially in the Southern Hemisphere.
Our second conclusion is that the remaining 6.8 % bias between the TCCON and NDACC XCO data (when using the common optimal a priori profile) originates in the scaling correction that has been applied to the standard TCCON data. To demonstrate this second finding we have compared AirCore in situ profile measurements with the standard TCCON XCO data. It is found that the TCCON XCO measurements are 6.1±1.6 % and 8.0±3.2 % smaller than the AirCore measurements at Orléans and Sodankylä, respectively, which is consistent with the bias found between the TCCON and NDACC XCO measurements. Eliminating the scaling correction (setting α=1.0000 instead of 1.0672), the differences between the TCCON and AirCore measurements become % and 1.3±3.2 % at Orléans and Sodankylä, respectively. A similar confirmation is found when comparing the TCCON XCO data to CAMS assimilation analyses. Further investigations should therefore be carried out in the TCCON community to study the CO scaling factor based on comparisons with in situ CO profile observations (e.g., calibrated aircraft or AirCore measurements) at additional TCCON sites.
The TCCON GGG2014 data are publicly available through the TCCON database (https://tccondata.org/, last access: 12 July 2019). For the details of the TCCON data for each site, please refer to Notholt et al. (2014) (https://doi.org/10.14291/tccon.ggg2014.bremen01.R0/1149275); Notholt et al. (2017) (https://doi.org.10.14291/tccon.ggg2014.ny); Blumenstock et al. (2014) (https://doi.org.10.14291/tccon.ggg2014); De Mazière et al. (2014) (https://doi.org.10.14291/tccon.ggg2014.reun); Griffith et al. (2014) (https://doi.org.10.14291/tccon.ggg2014.wollo); Sherlock et al. (2014) (https://doi.org.10.14291/tccon.ggg2014.lau); Warneke et al. (2014) (https://doi.org.10.14291/tccon.ggg2014.orle); Kivi et al. (2014) (https://doi.org.10.14291/tccon.ggg2014.sod); and Kivi and Heikkinen (2016) (https://doi.org/10.5194/gi-5-271-2016). The NDACC data are publicly available from the NDACC website (http://www.ndacc.org, InfraRed working Group, 2019).
MZ, CV and MDM designed the study. MZ wrote the paper and produced the main analysis and results with significant input from BL. HC, MR and RK provided the AirCore measurements. MKS, CH, JMM, PH, DS, DFP, NJ, VAV, OEG, MS, MP and TW provided and analyzed the TCCON and NDACC measurements. All authors read and provided comments on the paper.
The authors declare that they have no conflict of interest.
The TCCON site at Réunion is operated by the Royal Belgian Institute for Space Aeronomy with financial support in 2014, 2015, 2016 and 2017 under the EU project ICOS-Inwire and the ministerial decree for ICOS (FR/35/IC2) and local activities supported by LACy/UMR8105 – Université de La Réunion. The NDACC and TCCON stations Ny-Ålesund, Bremen and Izaña have been supported by the German Bundesministerium für Wirtschaft und Energie (BMWi) via DLR under grants 50EE1711A-B. The Lauder FTIR measurements are core funded by NIWA from New Zealand's Ministry of Business, Innovation and Employment through the Strategic Science Investment Fund. We thank the HIPPO team for making the aircraft measurements available at http://hippo.ucar.edu/ (last access: 12 July 2019).
This research has been supported by the Copernicus Climate Change Service C3S_311a_Lot3 project and by the ESA and PRODEX support for S5P validation (S5P-MPC and PRODEX TROVA).
This paper was edited by Hartwig Harder and reviewed by two anonymous referees.
Aschi, M. and Largo, A.: Reactivity of gaseous protonated ozone: A computational investigation on the carbon monoxide oxidation reaction, Int. J. Mass Spectrom., 228, 613–627, https://doi.org/10.1016/S1387-3806(03)00134-9, 2003. a
Blumenstock, T., Hase, F., Schneider, M., Garcia, O. E., and Sepulveda, E.: TCCON data from Izana (ES), Release GGG2014R0, TCCON data archive, hosted by CaltechDATA, https://doi.org/10.14291/tccon.ggg2014.izana01.R0/1149295, 2014. a
Borsdorff, T., Tol, P., Williams, J. E., de Laat, J., aan de Brugh, J., Nédélec, P., Aben, I., and Landgraf, J.: Carbon monoxide total columns from SCIAMACHY 2.3 µm atmospheric reflectance measurements: towards a full-mission data product (2003–2012), Atmos. Meas. Tech., 9, 227–248, https://doi.org/10.5194/amt-9-227-2016, 2016. a, b, c, d, e
Borsdorff, T., aan de Brugh, J., Hu, H., Hasekamp, O., Sussmann, R., Rettinger, M., Hase, F., Gross, J., Schneider, M., Garcia, O., Stremme, W., Grutter, M., Feist, D. G., Arnold, S. G., De Mazière, M., Kumar Sha, M., Pollard, D. F., Kiel, M., Roehl, C., Wennberg, P. O., Toon, G. C., and Landgraf, J.: Mapping carbon monoxide pollution from space down to city scales with daily global coverage, Atmos. Meas. Tech., 11, 5507–5518, https://doi.org/10.5194/amt-11-5507-2018, 2018. a, b, c, d
Clerbaux, C., George, M., Turquety, S., Walker, K. A., Barret, B., Bernath, P., Boone, C., Borsdorff, T., Cammas, J. P., Catoire, V., Coffey, M., Coheur, P.-F., Deeter, M., De Mazière, M., Drummond, J., Duchatelet, P., Dupuy, E., de Zafra, R., Eddounia, F., Edwards, D. P., Emmons, L., Funke, B., Gille, J., Griffith, D. W. T., Hannigan, J., Hase, F., Höpfner, M., Jones, N., Kagawa, A., Kasai, Y., Kramer, I., Le Flochmoën, E., Livesey, N. J., López-Puertas, M., Luo, M., Mahieu, E., Murtagh, D., Nédélec, P., Pazmino, A., Pumphrey, H., Ricaud, P., Rinsland, C. P., Robert, C., Schneider, M., Senten, C., Stiller, G., Strandberg, A., Strong, K., Sussmann, R., Thouret, V., Urban, J., and Wiacek, A.: CO measurements from the ACE-FTS satellite instrument: data analysis and validation using ground-based, airborne and spaceborne observations, Atmos. Chem. Phys., 8, 2569–2594, https://doi.org/10.5194/acp-8-2569-2008, 2008. a
De Mazière, M., Sha, M. K., Desmet, F., Hermans, C., Scolas, F., Kumps, N., Metzger, J.-M., Duflot, V., and Cammas, J.-P.: TCCON data from Reunion Island (RE), Release GGG2014R0, TCCON data archive, hosted by CaltechDATA, https://doi.org/10.14291/tccon.ggg2014.reunion01.R0/1149288, 2014. a
De Mazière, M., Thompson, A. M., Kurylo, M. J., Wild, J. D., Bernhard, G., Blumenstock, T., Braathen, G. O., Hannigan, J. W., Lambert, J.-C., Leblanc, T., McGee, T. J., Nedoluha, G., Petropavlovskikh, I., Seckmeyer, G., Simon, P. C., Steinbrecht, W., and Strahan, S. E.: The Network for the Detection of Atmospheric Composition Change (NDACC): history, status and perspectives, Atmos. Chem. Phys., 18, 4935–4964, https://doi.org/10.5194/acp-18-4935-2018, 2018. a
Deeter, M. N., Edwards, D. P., Francis, G. L., Gille, J. C., Martínez-Alonso, S., Worden, H. M., and Sweeney, C.: A climate-scale satellite record for carbon monoxide: the MOPITT Version 7 product, Atmos. Meas. Tech., 10, 2533–2555, https://doi.org/10.5194/amt-10-2533-2017, 2017. a
Dekker, I. N., Houweling, S., Pandey, S., Krol, M., Röckmann, T., Borsdorff, T., Landgraf, J., and Aben, I.: What caused the extreme CO concentrations during the 2017 high-pollution episode in India?, Atmos. Chem. Phys., 19, 3433–3445, https://doi.org/10.5194/acp-19-3433-2019, 2019. a
Dils, B., De Mazière, M., Müller, J. F., Blumenstock, T., Buchwitz, M., de Beek, R., Demoulin, P., Duchatelet, P., Fast, H., Frankenberg, C., Gloudemans, A., Griffith, D., Jones, N., Kerzenmacher, T., Kramer, I., Mahieu, E., Mellqvist, J., Mittermeier, R. L., Notholt, J., Rinsland, C. P., Schrijver, H., Smale, D., Strandberg, A., Straume, A. G., Stremme, W., Strong, K., Sussmann, R., Taylor, J., van den Broek, M., Velazco, V., Wagner, T., Warneke, T., Wiacek, A., and Wood, S.: Comparisons between SCIAMACHY and ground-based FTIR data for total columns of CO, CH4, CO2 and N2O, Atmos. Chem. Phys., 6, 1953–1976, https://doi.org/10.5194/acp-6-1953-2006, 2006. a
Duflot, V., Dils, B., Baray, J. L., De Mazière, M., Attié, J. L., Vanhaelewyn, G., Senten, C., Vigouroux, C., Clain, G., and Delmas, R.: Analysis of the origin of the distribution of CO in the subtropical southern Indian Ocean in 2007, J. Geophys. Res.-Atmos., 115, 1–16, https://doi.org/10.1029/2010JD013994, 2010. a, b, c
Eskes, H., Huijnen, V., Arola, A., Benedictow, A., Blechschmidt, A.-M., Botek, E., Boucher, O., Bouarar, I., Chabrillat, S., Cuevas, E., Engelen, R., Flentje, H., Gaudel, A., Griesfeller, J., Jones, L., Kapsomenakis, J., Katragkou, E., Kinne, S., Langerock, B., Razinger, M., Richter, A., Schultz, M., Schulz, M., Sudarchikova, N., Thouret, V., Vrekoussis, M., Wagner, A., and Zerefos, C.: Validation of reactive gases and aerosols in the MACC global analysis and forecast system, Geosci. Model Dev., 8, 3523–3543, https://doi.org/10.5194/gmd-8-3523-2015, 2015. a
European Commission: Emission Database for Global Atmospheric Research (EDGAR), release EDGARv4.2 FT2010, Tech. rep., Joint Research Centre (JRC)/Netherlands Environmental Assessment Agency (PBL), available at: http://edgar.jrc.ec.europa.eu (last access: 12 April 2018), 2013. a
Garcia, R. R., López-Puertas, M., Funke, B., Marsh, D. R., Kinnison, D. E., Smith, A. K., and González-Galindo, F.: On the distribution of CO2 and CO in the mesosphere and lower thermosphere, J. Geophys. Res., 119, 5700–5718, https://doi.org/10.1002/2013JD021208, 2014. a
George, M., Clerbaux, C., Hurtmans, D., Turquety, S., Coheur, P.-F., Pommier, M., Hadji-Lazaro, J., Edwards, D. P., Worden, H., Luo, M., Rinsland, C., and McMillan, W.: Carbon monoxide distributions from the IASI/METOP mission: evaluation with other space-borne remote sensors, Atmos. Chem. Phys., 9, 8317–8330, https://doi.org/10.5194/acp-9-8317-2009, 2009. a
Granier, C., Bessagnet, B., Bond, T., D'Angiola, A., van der Gon, H. D., Frost, G. J., Heil, A., Kaiser, J. W., Kinne, S., Klimont, Z., Kloster, S., Lamarque, J. F., Liousse, C., Masui, T., Meleux, F., Mieville, A., Ohara, T., Raut, J. C., Riahi, K., Schultz, M. G., Smith, S. J., Thompson, A., van Aardenne, J., van der Werf, G. R., and van Vuuren, D. P.: Evolution of anthropogenic and biomass burning emissions of air pollutants at global and regional scales during the 1980–2010 period, Clim. Change, 109, 163–190, https://doi.org/10.1007/s10584-011-0154-1, 2011. a
Griffith, D. W., Velazco, V. A., Deutscher, N. M., Murphy, C., Jones, N., Wilson, S., Macatangay, R., Kettlewell, G., Buchholz, R. R., and Riggenbach, M.: TCCON data from Wollongong (AU), Release GGG2014R0, TCCON data archive, hosted by CaltechDATA, https://doi.org/10.14291/tccon.ggg2014.wollongong01.R0, 2014. a
Hase, F., Hannigan, J., Coffey, M., Goldman, A., Höpfner, M., Jones, N., Rinsland, C., and Wood, S.: Intercomparison of retrieval codes used for the analysis of high-resolution, ground-based FTIR measurements, J. Quant. Spectrosc. Ra., 87, 25–52, https://doi.org/10.1016/j.jqsrt.2003.12.008, 2004. a
Hochstaffl, P., Schreier, F., Lichtenberg, G., Gimeno García, S., Hochstaffl, P., Schreier, F., Lichtenberg, G., and Gimeno García, S.: Validation of Carbon Monoxide Total Column Retrievals from SCIAMACHY Observations with NDACC/TCCON Ground-Based Measurements, Remote Sens., 10, 223, https://doi.org/10.3390/rs10020223, 2018. a, b
Hoor, P., Gurk, C., Brunner, D., Hegglin, M. I., Wernli, H., and Fischer, H.: Seasonality and extent of extratropical TST derived from in-situ CO measurements during SPURT, Atmos. Chem. Phys., 4, 1427–1442, https://doi.org/10.5194/acp-4-1427-2004, 2004. a
InfraRed working Group: NDACC datasets, available at: http://www.ndacc.org, last access: 1 July 2019. a
Inness, A., Blechschmidt, A.-M., Bouarar, I., Chabrillat, S., Crepulja, M., Engelen, R. J., Eskes, H., Flemming, J., Gaudel, A., Hendrick, F., Huijnen, V., Jones, L., Kapsomenakis, J., Katragkou, E., Keppens, A., Langerock, B., de Mazière, M., Melas, D., Parrington, M., Peuch, V. H., Razinger, M., Richter, A., Schultz, M. G., Suttie, M., Thouret, V., Vrekoussis, M., Wagner, A., and Zerefos, C.: Data assimilation of satellite-retrieved ozone, carbon monoxide and nitrogen dioxide with ECMWF's Composition-IFS, Atmos. Chem. Phys., 15, 5275–5303, https://doi.org/10.5194/acp-15-5275-2015, 2015. a
Karion, A., Sweeney, C., Tans, P., and Newberger, T.: AirCore: An innovative atmospheric sampling system, J. Atmos. Ocean. Tech., 27, 1839–1853, https://doi.org/10.1175/2010JTECHA1448.1, 2010. a
Kiel, M., Hase, F., Blumenstock, T., and Kirner, O.: Comparison of XCO abundances from the Total Carbon Column Observing Network and the Network for the Detection of Atmospheric Composition Change measured in Karlsruhe, Atmos. Meas. Tech., 9, 2223–2239, https://doi.org/10.5194/amt-9-2223-2016, 2016. a, b
Kilkki, J., Aalto, T., Hatakka, J., Portin, H., and Laurila, T.: Atmospheric CO2 observations at Finnish urban and rural sites, Boreal Environ. Res., 20, 227–242, 2015. a
Kivi, R. and Heikkinen, P.: Fourier transform spectrometer measurements of column CO2 at Sodankylä, Finland, Geosci. Instrum. Method. Data Syst., 5, 271–279, https://doi.org/10.5194/gi-5-271-2016, 2016. a
Kivi, R., Heikkinen, P., and Kyrö, E.: TCCON data from Sodankyla (FI), Release GGG2014R0, TCCON data archive, hosted by CaltechDATA, https://doi.org/10.14291/tccon.ggg2014.sodankyla01.R0, 2014. a
Klonecki, A., Pommier, M., Clerbaux, C., Ancellet, G., Cammas, J.-P., Coheur, P.-F., Cozic, A., Diskin, G. S., Hadji-Lazaro, J., Hauglustaine, D. A., Hurtmans, D., Khattatov, B., Lamarque, J.-F., Law, K. S., Nedelec, P., Paris, J.-D., Podolske, J. R., Prunet, P., Schlager, H., Szopa, S., and Turquety, S.: Assimilation of IASI satellite CO fields into a global chemistry transport model for validation against aircraft measurements, Atmos. Chem. Phys., 12, 4493–4512, https://doi.org/10.5194/acp-12-4493-2012, 2012. a
Langerock, B., De Mazière, M., Hendrick, F., Vigouroux, C., Desmet, F., Dils, B., and Niemeijer, S.: Description of algorithms for co-locating and comparing gridded model data with remote-sensing observations, Geosci. Model Dev., 8, 911–921, https://doi.org/10.5194/gmd-8-911-2015, 2015. a
Membrive, O., Crevoisier, C., Sweeney, C., Danis, F., Hertzog, A., Engel, A., Bönisch, H., and Picon, L.: AirCore-HR: a high-resolution column sampling to enhance the vertical description of CH4 and CO2, Atmos. Meas. Tech., 10, 2163–2181, https://doi.org/10.5194/amt-10-2163-2017, 2017. a
Mizzi, A. P., Arellano Jr., A. F., Edwards, D. P., Anderson, J. L., and Pfister, G. G.: Assimilating compact phase space retrievals of atmospheric composition with WRF-Chem/DART: a regional chemical transport/ensemble Kalman filter data assimilation system, Geosci. Model Dev., 9, 965–978, https://doi.org/10.5194/gmd-9-965-2016, 2016. a
Notholt, J., Petri, C., Warneke, T., Deutscher, N. M., Buschmann, M., Weinzierl, C., Macatangay, R., and Grupe, P.: TCCON data from Bremen (DE), Release GGG2014R0, TCCON data archive, hosted by CaltechDATA, https://doi.org/10.14291/tccon.ggg2014.bremen01.R0/1149275, 2014. a
Notholt, J., Warneke, T., Petri, C., Deutscher, N. M., Weinzierl, C., Palm, M., and Buschmann, M.: TCCON data from Ny Ålesund, Spitsbergen (NO), Release GGG2014.R0, TCCON data archive, hosted by CaltechDATA, https://doi.org/10.14291/tccon.ggg2014.nyalesund01.R0/1149278, 2017. a
Ojha, N., Pozzer, A., Rauthe-Schöch, A., Baker, A. K., Yoon, J., Brenninkmeijer, C. A. M., and Lelieveld, J.: Ozone and carbon monoxide over India during the summer monsoon: regional emissions and transport, Atmos. Chem. Phys., 16, 3013–3032, https://doi.org/10.5194/acp-16-3013-2016, 2016. a
Paul, D., Chen, H., Been, H. A., Kivi, R., and Meijer, H. A. J.: Radiocarbon analysis of stratospheric CO2 retrieved from AirCore sampling, Atmos. Meas. Tech., 9, 4997–5006, https://doi.org/10.5194/amt-9-4997-2016, 2016. a
Pfister, G., Pétron, G., Emmons, L. K., Gille, J. C., Edwards, D. P., Lamarque, J. F., Attie, J. L., Granier, C., and Novelli, P. C.: Evaluation of CO simulations and the analysis of the CO budget for Europe, J. Geophys. Res.-Atmos., 109, D19, https://doi.org/10.1029/2004JD004691, 2004. a
Pougatchev, N. S., Connor, B. J., and Rinsland, C. P.: Infrared measurements of the ozone vertical distribution above Kitt Peak, J. Geophys. Res., 100, 16689, https://doi.org/10.1029/95JD01296, 1995. a
Rasmussen, R. A. and Khalil, M. A. K.: Atmospheric methane (CH4): Trends and seasonal cycles, J. Geophys. Res.-Oceans, 86, 9826–9832, https://doi.org/10.1029/JC086iC10p09826, 1981. a
Rodgers, C. D.: Inverse Methods for Atmospheric Sounding – Theory and Practice, Series on Atmospheric Oceanic and Planetary Physics, vol. 2, World Scientific Publishing Co. Pte. Ltd, Singapore, https://doi.org/10.1142/9789812813718, 2000. a, b
Rodgers, C. D.: Intercomparison of remote sounding instruments, J. Geophys. Res., 108, 46–48, https://doi.org/10.1029/2002JD002299, 2003. a, b, c
Rothman, L. S., Gordon, I. E., Barbe, A., Benner, D. C., Bernath, P. F., Birk, M., Boudon, V., Brown, L. R., Campargue, A., Champion, J. P., Chance, K., Coudert, L. H., Dana, V., Devi, V. M., Fally, S., Flaud, J. M., Gamache, R. R., Goldman, A., Jacquemart, D., Kleiner, I., Lacome, N., Lafferty, W. J., Mandin, J. Y., Massie, S. T., Mikhailenko, S. N., Miller, C. E., Moazzen-Ahmadi, N., Naumenko, O. V., Nikitin, A. V., Orphal, J., Perevalov, V. I., Perrin, A., Predoi-Cross, A., Rinsland, C. P., Rotger, M., Šimečková, M., Smith, M. A., Sung, K., Tashkun, S. A., Tennyson, J., Toth, R. A., Vandaele, A. C., and Vander Auwera, J.: The HITRAN 2008 molecular spectroscopic database, J. Quant. Spectrosc. Ra., 110, 533–572, https://doi.org/10.1016/j.jqsrt.2009.02.013, 2009. a
Schmidt, M., Lopez, M., Yver Kwok, C., Messager, C., Ramonet, M., Wastine, B., Vuillemin, C., Truong, F., Gal, B., Parmentier, E., Cloué, O., and Ciais, P.: High-precision quasi-continuous atmospheric greenhouse gas measurements at Trainou tower (Orléans forest, France), Atmos. Meas. Tech., 7, 2283–2296, https://doi.org/10.5194/amt-7-2283-2014, 2014. a
Sherlock, V., Connor, B. J., Robinson, J., Shiona, H., Smale, D., and Pollard, D.: TCCON data from Lauder (NZ), 125HR, Release GGG2014R0, TCCON data archive, hosted by CaltechDATA, https://doi.org/10.14291/tccon.ggg2014.lauder02.R0/1149298, 2014. a
Spivakovsky, C. M., Logan, J. A., Montzka, S. A., Balkanski, Y. J., Foreman-Fowler, M., Jones, D. B., Horowitz, L. W., Fusco, A. C., Brenninkmeijer, C. A., Prather, M. J., Wofsy, S. C., and McElroy, M. B.: Three-dimensional climatological distribution of tropospheric OH: Update and evaluation, J. Geophys. Res.-Atmos., 105, 8931–8980, https://doi.org/10.1029/1999JD901006, 2000. a
Té, Y., Jeseck, P., Franco, B., Mahieu, E., Jones, N., Paton-Walsh, C., Griffith, D. W. T., Buchholz, R. R., Hadji-Lazaro, J., Hurtmans, D., and Janssen, C.: Seasonal variability of surface and column carbon monoxide over the megacity Paris, high-altitude Jungfraujoch and Southern Hemispheric Wollongong stations, Atmos. Chem. Phys., 16, 10911–10925, https://doi.org/10.5194/acp-16-10911-2016, 2016. a
Toon, G. C.: Telluric line list for GGG2014, TCCON data archive, hosted by the Carbon Dioxide Information Analysis Center, Oak Ridge National Laboratory, Oak Ridge, Tennessee, USA, https://doi.org/10.14291/tccon.ggg2014.atm.R0/1221656, 2014. a
Toon, G. C. and Wunch, D.: A stand-alone a priori profile generation tool for GGG2014 release, TCCON data archive, hosted by the Carbon Dioxide Information Analysis Center, Oak Ridge National Laboratory, Oak Ridge, Tennessee, USA, https://doi.org/10.14291/TCCON.GGG2014.PRIORS.R0/122, 2014. a
Turquety, S., Hurtmans, D., Hadji-Lazaro, J., Coheur, P.-F., Clerbaux, C., Josset, D., and Tsamalis, C.: Tracking the emission and transport of pollution from wildfires using the IASI CO retrievals: analysis of the summer 2007 Greek fires, Atmos. Chem. Phys., 9, 4897–4913, https://doi.org/10.5194/acp-9-4897-2009, 2009. a
van der Werf, G. R., Randerson, J. T., Giglio, L., Collatz, G. J., Mu, M., Kasibhatla, P. S., Morton, D. C., DeFries, R. S., Jin, Y., and van Leeuwen, T. T.: Global fire emissions and the contribution of deforestation, savanna, forest, agricultural, and peat fires (1997–2009), Atmos. Chem. Phys., 10, 11707–11735, https://doi.org/10.5194/acp-10-11707-2010, 2010. a
von Clarmann, T.: Smoothing error pitfalls, Atmos. Meas. Tech., 7, 3023–3034, https://doi.org/10.5194/amt-7-3023-2014, 2014. a
Wagner, A., Schulz, M., Christophe, Y., Ramonet, M., Eskes, H., Basart, S., Benedictow, A., Bennouna, Y., Blechschmidt, A.-M., Chabrillat, S., Clark, H., Cuevas, E., Flentje, H., Hansen, K., Im, U., Kapsomenakis, J., Langerock, B., Richter, A., Sudarchikova, N., Thouret, V., Warneke, T., and Zerefos, C.: Validation report of the CAMS near-real-time global atmospheric composition service: Period SeptemberNovember 2018, Copernicus Atmosphere Monitoring Service (CAMS) report, https://doi.org/10.24380/dg9c-pm41, 2019. a
Warneke, T., Messerschmidt, J., Notholt, J., Weinzierl, C., Deutscher, N. M., Petri, C., Grupe, P., Vuillemin, C., Truong, F., Schmidt, M., Ramonet, M., and Parmentier, E.: TCCON data from Orléans (FR), Release GGG2014R0, TCCON data archive, hosted by CaltechDATA, https://doi.org/10.14291/tccon.ggg2014.orleans01.R0/1149276, 2014. a
Worden, H. M., Deeter, M. N., Frankenberg, C., George, M., Nichitiu, F., Worden, J., Aben, I., Bowman, K. W., Clerbaux, C., Coheur, P. F., de Laat, A. T. J., Detweiler, R., Drummond, J. R., Edwards, D. P., Gille, J. C., Hurtmans, D., Luo, M., Martínez-Alonso, S., Massie, S., Pfister, G., and Warner, J. X.: Decadal record of satellite carbon monoxide observations, Atmos. Chem. Phys., 13, 837–850, https://doi.org/10.5194/acp-13-837-2013, 2013. a
Wunch, D., Toon, G. C., Wennberg, P. O., Wofsy, S. C., Stephens, B. B., Fischer, M. L., Uchino, O., Abshire, J. B., Bernath, P., Biraud, S. C., Blavier, J.-F. L., Boone, C., Bowman, K. P., Browell, E. V., Campos, T., Connor, B. J., Daube, B. C., Deutscher, N. M., Diao, M., Elkins, J. W., Gerbig, C., Gottlieb, E., Griffith, D. W. T., Hurst, D. F., Jiménez, R., Keppel-Aleks, G., Kort, E. A., Macatangay, R., Machida, T., Matsueda, H., Moore, F., Morino, I., Park, S., Robinson, J., Roehl, C. M., Sawa, Y., Sherlock, V., Sweeney, C., Tanaka, T., and Zondlo, M. A.: Calibration of the Total Carbon Column Observing Network using aircraft profile data, Atmos. Meas. Tech., 3, 1351–1362, https://doi.org/10.5194/amt-3-1351-2010, 2010. a
Wunch, D., Toon, G. C., Blavier, J.-F. L., Washenfelder, R. A., Notholt, J., Connor, B. J., Griffith, D. W. T., Sherlock, V., and Wennberg, P. O.: The Total Carbon Column Observing Network, Philos. T. R. Soc. A, 369, 2087–2112, https://doi.org/10.1098/rsta.2010.0240, 2011. a
Wunch, D., Toon, G. C., Sherlock, V., Deutscher, N. M., Liu, C., Feist, D. G., and Wennberg, P. O.: The Total Carbon Column Observing Network's GGG2014 Data Version, p. 43, https://doi.org/10.14291/tccon.ggg2014.documentation.R0/122, 2015. a, b, c, d, e
Zhou, M., Vigouroux, C., Langerock, B., Wang, P., Dutton, G., Hermans, C., Kumps, N., Metzger, J.-M., Toon, G., and De Mazière, M.: CFC-11, CFC-12 and HCFC-22 ground-based remote sensing FTIR measurements at Réunion Island and comparisons with MIPAS/ENVISAT data, Atmos. Meas. Tech., 9, 5621–5636, https://doi.org/10.5194/amt-9-5621-2016, 2016. a
Zhou, M., Langerock, B., Vigouroux, C., Sha, M. K., Ramonet, M., Delmotte, M., Mahieu, E., Bader, W., Hermans, C., Kumps, N., Metzger, J.-M., Duflot, V., Wang, Z., Palm, M., and De Mazière, M.: Atmospheric CO and CH4 time series and seasonal variations on Reunion Island from ground-based in situ and FTIR (NDACC and TCCON) measurements, Atmos. Chem. Phys., 18, 13881–13901, https://doi.org/10.5194/acp-18-13881-2018, 2018. a, b