the Creative Commons Attribution 4.0 License.
the Creative Commons Attribution 4.0 License.
 | 25 Nov 2019
Optimization of a gas chromatographic unit for measuring biogenic volatile organic compounds in ambient air
Kenneth Mermet
Stéphane Sauvage
Sébastien Dusanter
Thérèse Salameh
Thierry Léonardis
Pierre-M. Flaud
Émilie Perraudin
Éric Villenave
Nadine Locoge
A new online gas chromatographic method dedicated to biogenic volatile organic compound (BVOC) analysis was developed for the measurement of a 20 BVOC gaseous mixture (isoprene; β-pinene; α-pinene; limonene; ocimene; myrcene; sabinene; Δ3-carene; camphene; 1,8 cineole; terpinolene; linalool; α-phellandrene; nopinone; citral; α-terpinene; β-caryophyllene; p-cymene; γ-terpinene; and 2-carene) at a time resolution of 90 min. The optimized method includes an online Peltier-cooled thermodesorption system sample trap made of Carbopack B coupled to a gas chromatographic system equipped with a 60 m, 0.25 mm internal diameter (i.d.) BPX5 column. Eluent was analysed using flame ionization detection (FID). Potassium iodide was identified as the best ozone scrubber for the 20 BVOC mixture. In order to obtain an accurate quantification of BVOC concentrations, the development of a reliable standard mixture was also required. Quantification of BVOCs was reported with a detection limit ranging from 4 ppt for α-pinene to 19 ppt for sabinene. The main source of uncertainty was the calibration step, stressing the need for certified gaseous standards for a wider panel of BVOCs. This new method was applied for the first time to measure BVOCs in a pine forest during the LANDEX episode 1 field campaign (summer 2017). All target BVOCs were detected at least once during the campaign. The two major monoterpenes observed were β-pinene and α-pinene, representing 60 % of the measured terpenoid concentration on average, while isoprene represented only 17 %. The uncertainties determined were always below 13 % for the six major terpenes.
- Article
(3645 KB) - Full-text XML
-
Supplement
(595 KB) - BibTeX
- EndNote


Emissions of volatile organic compounds (VOCs) can impact both (i) the atmospheric oxidation capacity (Houweling et al., 1998; Lelieveld et al., 2008; Taraborrelli et al., 2012), due to the reactivity of VOCs with atmospheric oxidants such as ozone (O3), hydroxyl (OH), and nitrate (NO3) radicals (Atkinson and Arey, 2003), and (ii) the Earth's radiative balance (Gauss et al., 2006; GIEC, 2013; Hoffmann et al., 1997; Kazil et al., 2010) through the formation of ozone and secondary organic aerosols (SOAs).
Biogenic VOCs (BVOCs) represent the largest fraction of non-methane VOCs emitted in the troposphere, contributing to 75 %–90 % of the total global emissions (Guenther et al., 1995; Lamarque et al., 2010; Sindelarova et al., 2014). Global BVOC emissions are composed of 87 % terpenes (Messina et al., 2016) that cover a wide range of volatilities, including isoprene (C5H8), monoterpenes (C10H16), sesquiterpenes (C15H24), and some oxygenated terpenoids (Kesselmeier and Staudt, 1999). Each of these groups of compounds exhibits a large number of structural isomers, with a large density of reactivity.
The impact of BVOC emissions on the carbon cycle and the atmospheric oxidant budget at both local and global scales is currently not well understood. Indeed, reported measurements of total OH reactivity performed in ambient air have highlighted some gaps in our knowledge regarding OH sinks, especially in forested regions, where the measured OH reactivity is frequently higher than that calculated from concomitant VOC observations (Carslaw et al., 2001; Di Carlo et al., 2004; Dusanter and Stevens, 2017; Edwards et al., 2013; Griffith et al., 2013; Hansen et al., 2014; Hens et al., 2014; Stavrakou et al., 2010; Tan et al., 2001; Wolfe et al., 2014; Zannoni et al., 2017). This difference reveals the presence of unmeasured OH sinks within the forest boundary layer, which may either be attributed to unidentified primary BVOC emissions (Di Carlo et al., 2004; Sinha et al., 2010), oxidation products of BVOCs (Edwards et al., 2013; Hansen et al., 2014; Lou et al., 2010; Mao et al., 2012; Zannoni et al., 2017), or both (Nölscher et al., 2012). Furthermore, in those studies, a potential underestimation of the concentration, the high uncertainties on BVOC concentrations, and ozone reactivity (when no scrubber was used) could explain this missing reactivity. Thus, speciated measurements of these compounds are important to improve our understanding of the atmospheric composition and reactivity.
During intensive field campaigns, isoprene and terpene concentrations are usually investigated using proton transfer reaction mass spectrometry, a very efficient and fast technique (with a time resolution better than 1 s); however, this method only provides information on the sum of monoterpenes (Bouvier-Brown et al., 2009; de Gouw and Warneke, 2007; Park et al., 2014; Zhou et al., 2017; Kammer et al., 2018) and sesquiterpenes (Bouvier-Brown et al., 2007, 2009; Kim et al., 2009; Park et al., 2014; Zhou et al., 2017), as it cannot distinguish individual structural isomers. This type of instrument has recently been coupled to a fast gas chromatography (GC) instrument to separate monoterpenes (Materić et al., 2015), although the feasibility for ambient measurements has yet to be demonstrated.
Detailed information regarding chemical composition may be obtained by conventional gas chromatographic methods (GC-FID or GC-MS), which can quantify individual terpene isomers (Jones et al., 2014; Hopkins et al., 2011; Pankow et al., 2012).
Table 1Comparison of the operation conditions (sampling method, detector, and column used) and the limit of detection (DL). For the compounds, the DL is given and the number of species follows in parentheses.
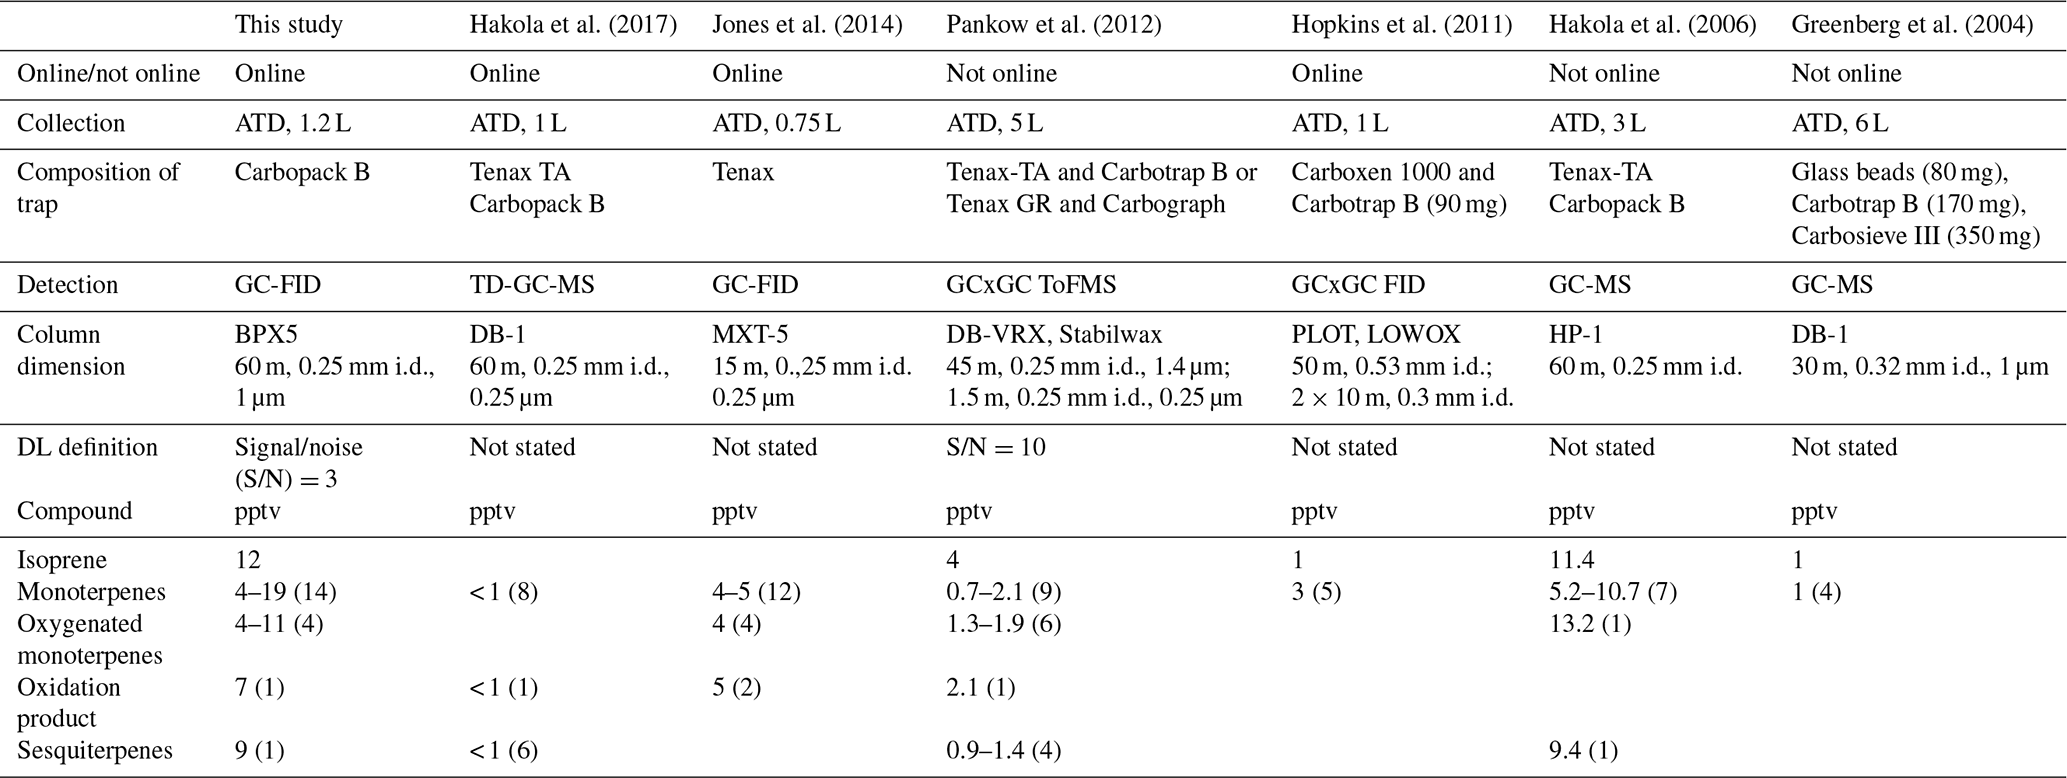
Ambient measurements taking advantage of gas chromatographic techniques usually report isoprene, α-pinene, β-pinene, and limonene (Apel et al., 1999; Bouvier-Brown et al., 2009; Greenberg et al., 2004, 1999; Hopkins et al., 2011; Mallet et al., 2016; Misztal et al., 2010; Saxton et al., 2007) as the major BVOCs. Only a few GC instruments have been optimized to provide a larger speciation of monoterpenes (Pankow et al., 2012; Jones et al., 2014; Hakola et al., 2006, 2017) and even fewer can provide a large speciation of both monoterpenes and oxygenated monoterpenes (Jones et al., 2014; Pankow et al., 2012) (Table 1).
Due to their high reactivity, monoterpenes and sesquiterpenes are delicate to quantify. Amongst potential artefacts, ozonolysis of monoterpenes and sesquiterpenes within the sampling line may occur and the use of ozone scrubbers is recommended (Koppmann, 2007). Some scrubbers have already been used for BVOC measurement, such as heated stainless steel tubes (Hellen et al., 2012), copper tubes coated by potassium iodide (KI) (Saxton et al., 2007), and thiosulfate scrubbers (Bouvier-Brown et al., 2007; Jones et al., 2014; Plass-Dülmer et al., 2002).
Conservation of air samples (in pressured gas canisters or adsorbed on cartridges) for offline analysis of monoterpenes and sesquiterpenes needs to be carefully considered (Apel et al., 1999; Greenberg et al., 2004; Misztal et al., 2010; Pankow et al., 2012). Due to their reactivity or poor stability, certified gas standard mixtures containing multiple terpenes are not readily available; hence, calibration of these gases is generally less straightforward compared with that of other non-methane hydrocarbons (HCNM). Rhoderick and Lin (2013) demonstrated that 20 L aluminium canisters with proprietary internal coatings are capable of containing gaseous monoterpenes in nitrogen without significant degradation for periods of > 250 d; however, further investigations are necessary to ensure consistency between canisters, and to test whether this level of stability may be achieved for gaseous mixtures containing both α- and β-pinene. With the exception of isoprene, α- and β-pinene, Δ3-carene, myrcene, limonene, and eucalyptol, certified gas cylinders containing other terpenes are not available. To quantify other terpenes, two approaches may be used. As flame ionization detector response is a very stable and linear method, over several orders of magnitude, structure activities relationships (SAR) and the effective carbon number (ECN) can be used with a reference compound, such as toluene (Hopkins et al., 2011). Otherwise, a liquid solution of pure (≥95 %) compounds can be vaporized in a gaseous flow or deposited on a clean cartridge (Bouvier-Brown et al., 2009, 2007; Hakola et al., 2017, 2006; Pankow et al., 2012).
This study reports the optimization of a fully automated online GC-FID instrument for ambient measurements of a series of 20 primary BVOCs and some of their oxidation products, including isoprene, 17 monoterpenes (w∕3 oxygenated species), nopinone, and β-caryophyllene. The choice of sampling (ozone scrubber, sampling flow rate, sampling duration) and analytical (thermodesorption temperature, GC column) parameters is discussed below. A calibration method is also proposed for BVOCs that are not available in commercial standards. The first deployment of this instrument in a pine forest during the LANDEX episode 1 campaign in summer 2017 is presented along with an evaluation of the analytical performance for every target species.
The online TD-GC-FID system used in this study was composed of a 6890N gas chromatograph (Agilent) and a UNITY 1 air sampler (Markes). Ambient air was sampled through an ozone scrubber and passed into a trap held at 20 ∘C and filled with Carbopack B (Supelco) for 60 min. After this pre-concentration step, VOCs were thermo-desorbed and injected into a BPX5 column (SGE Analytical Science) where the compounds were separated over 67 min. The measurement method was optimized to provide a time resolution of 90 min. Details regarding the material used and the optimization of operating conditions are given below.
2.1 Target species and gas standards
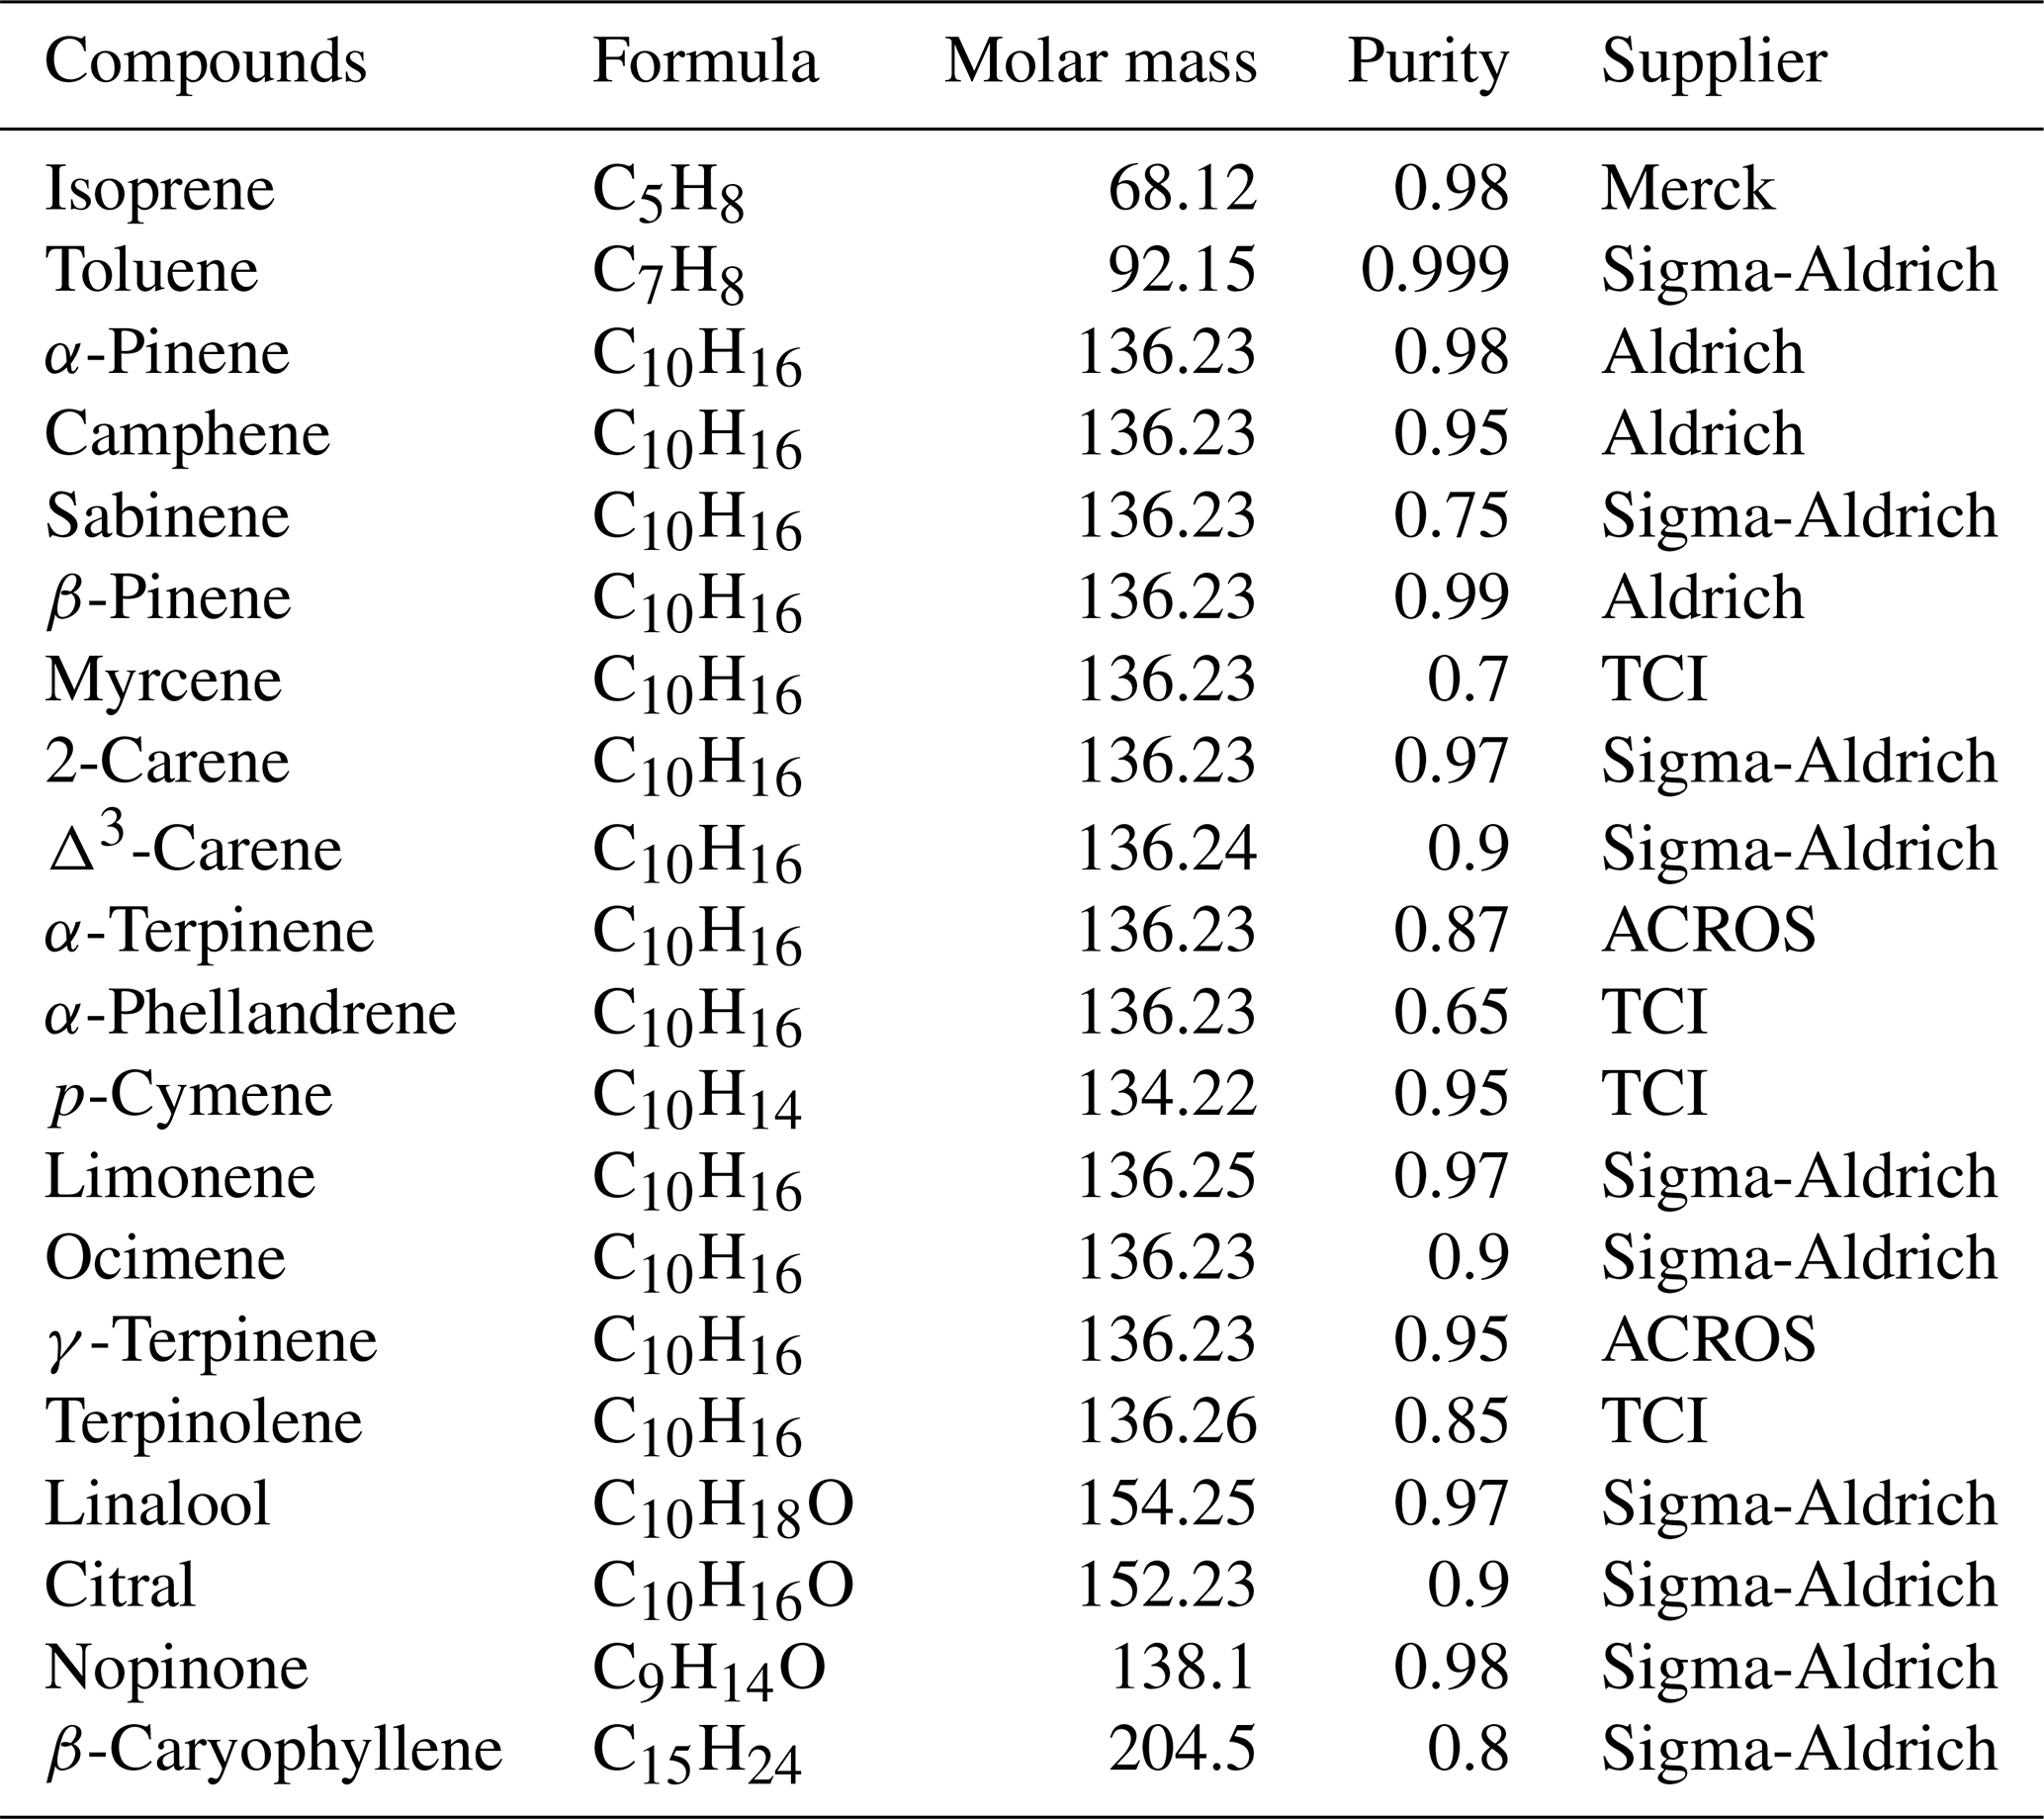
A list of 20 target species was selected for various reasons: some are observed to be the most abundant species at the global scale (isoprene, β-pinene, α-pinene, limonene, ocimene, myrcene, sabinene, Δ3-carene, and camphene) (Guenther et al., 1995; Sindelarova et al., 2014); others are emitted by pine trees (1.8 cineole) (Simon et al., 1994); some are present in pine needles (terpinolene, linalool, α-phellandrene) (Ait Mimoune et al., 2013; Arrabal et al., 2012; Blanch et al., 2012; Kleinhentz et al., 1999; Ormeño et al., 2009; Simon et al., 1994); others are oxidation products, commercially available in pure solution (≥95 %) of monoterpenes (nopinone, citral); and some are highly reactive (α-terpinene, β-caryophyllene) (Atkinson et al, 2006) or usually monitored along with other BVOCs (p-cymene, γ-terpinene, 2-carene) (Hakola et al., 2017; Jones et al., 2014; Pankow et al., 2012). As only some of the target compounds were commercially available in certified gas mixtures (isoprene; β-pinene; α-pinene; limonene; p-cymene; myrcene; Δ3-carene; ocimene; 1,8-cineole; camphor), a gas mixture containing all of the compounds reported previously was consequently generated via the vaporization of pure liquid standards inside an electropolished stainless steel canister. Toluene was used as an internal standard to monitor the overall effectiveness of the standard generation.
Table 2List of target species for ambient measurements and chemical properties for gas standard generation.
The BVOC gas mixture was prepared following a three-step procedure:
-
A liquid solution of the 20 target species was prepared by mixing 100 µL of each individual compound using commercial solutions (see Table 2).
-
A set-up composed of a heated glass injector connected to an electropolished stainless steel canister (6 L, SilcoCan, Restek) was used to vaporize and dilute the solution. First, a clean canister was brought under vacuum at 10−4 bar. A volume of 2 µL of the solution was transferred into the canister through the injector held at atmospheric pressure and ambient temperature. The valve on the canister was opened and the injector was heated at 210 ∘C for 20 min. A flow of dry zero air, adjusted at 1 L min−1, was then provided to the injector for 18 min. Calculated concentrations in the canister ranged from 650 to 750 ppbv for each compound.
-
A dilution system composed of three mass flow controllers (MFCs) was used to generate a flow of humid zero air containing 3–4 ppb of each target species. Two MFCs were used to generate a flow of zero air (1 L min−1) at a relative humidity (RH) of 50 % (22 ∘C), with the first MFC generating 500 mL min−1 of dry air and the second MFC connected to a water bubbler generating 500 mL min−1 of zero air at 100 % RH (22 ∘C). The third MFC was used to regulate a flow rate of 5 mL min−1 for the calibration gas that was mixed with the humid air flow, leading to a dilution factor of 200.
The stability of the standard mixture in the canister was checked for 2 weeks. The accuracy of the generated concentrations was evaluated by comparing the response coefficients of three VOCs (toluene, α-pinene, and β-pinene) present in the canister to a certified calibration standard of gas mixture (cylinder D09 0523, June 2014, NPL, Table S1 in the Supplement).
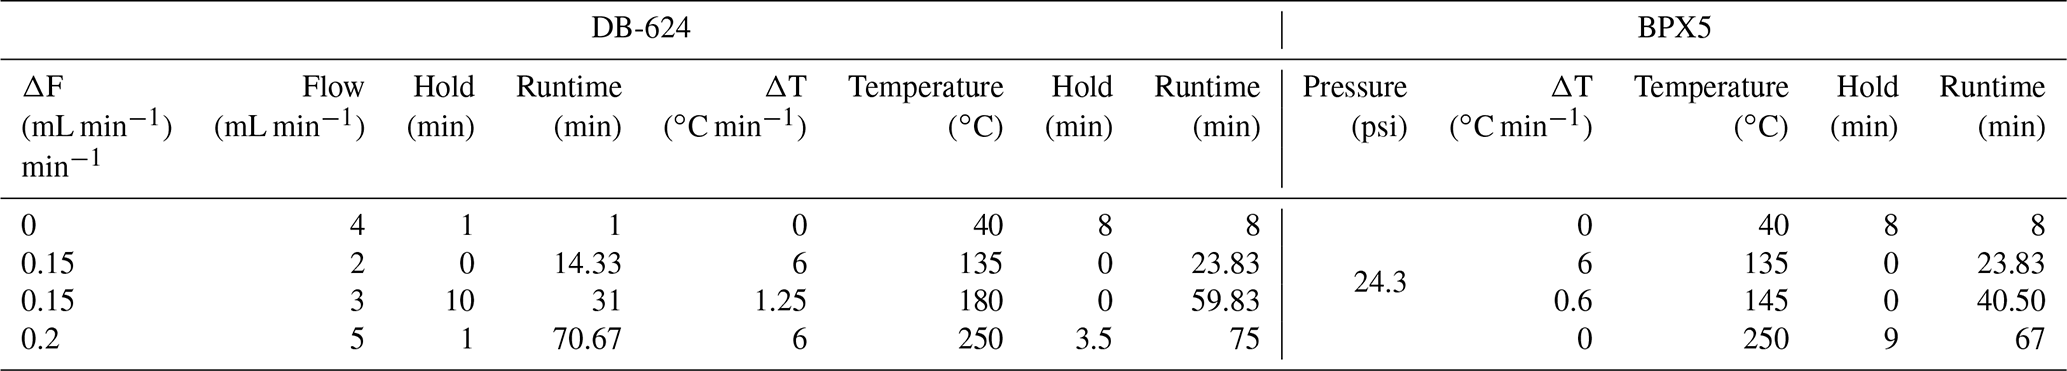
Table 3Chromatographic details for the BPX5 and DB-624 columns.
2.2 Chromatographic separation and FID detection
Two chromatographic columns recommended by the Aerosol, Clouds and Trace Gases Research Infrastructure (ACTRIS), 2014, were tested for separation: BPX5 (60 m × 0.25 mm i.d., 1 µm thickness; SGE Analytical Science) and DB-624 (60 m × 0.32 mm i.d., 1.80 µm thickness; Agilent J&W). The DB-624 is recommended for the terpenes and oxygenated compounds targeted in this study. The BPX5, which is equivalent to the DB-5 used by Saxton et al. (2007), is recommended for monoterpenes and is more selective than the DB-1, which is often used for BVOC separation (Table 1), with oxygenated compounds. For both columns, the temperature programme, the carrier gas flow rate, and the pressure were optimized, and the final parameters leading to the best separation are shown in Table 3. The detection of each species was made using a flame ionization detector fed by flow rates of 40, 450, and 45 mL min−1 of H2 (alpha 2, N60), zero air (alpha 1, N50), and N2 (alpha 1, N50) respectively.
2.3 Pre-concentration and thermodesorption
As mentioned above, the pre-concentration trap was filled with Carbopack B (100 mg, Supelco) and was held at 20 ∘C during the sampling step. The sampling flow rate was maintained at 20 mL min−1 for 60 min under field operating conditions, which led to a sampling volume of 1200 mL. In order to test the volume breakthrough, the sampling duration was varied six times from 10 min up to 90 min, leading to sampling volumes ranging from 200 to 1800 mL. This test was carried out by sampling a gas mixture of approximately 12 ppb of each VOC at 80 % RH (22 ∘C) using the generation system described in Sect. 2.1. Before desorption, a trap purge was performed with 20 mL of helium (alpha 1, N50).
The desorption temperature was tested at 275, 300, 325, and 350 ∘C. For each experiment, a mixture of approximately 3–5 ppb of each VOC was generated at 50 % RH (22 ∘C) and sampled by the instrument. The desorption was performed twice at the same temperature without additional sampling between the two desorptions, leading to two chromatograms. Two replicates were performed at each temperature. The desorption efficiency was evaluated at each temperature from Eq. (1), using both chromatograms:
where ED is the desorption efficiency, is the peak area (a.u.) of the compound i from the first chromatogram, and is the peak area (a.u.) of the same compound i from the second chromatogram.
2.4 Ozone removal
During the pre-concentration step of VOCs on a solid sorbent, unsaturated BVOCs may react with ambient ozone, leading to their loss and the formation of more oxygenated compounds (Lee et al., 2006; McGlenny et al., 1991). These unwanted reactions can be reduced if ozone is selectively removed from the sampled flow before the pre-concentration stage. Three ozone scrubbers were tested. The scrubbers were chosen based on ACTRIS recommendations for BVOC sampling (ACTRIS, 2014): copper tubes coated with potassium iodide (KI) (Helmig, 1997), glass filters impregnated with sodium thiosulfate (Na2S2O3) (Plass-Dülmer et al., 2002), and copper screens coated with manganese dioxide (MnO2) (Environnement SA).
Three different tests were performed for each scrubber to quantify (i) the ozone removal efficiency, (ii) losses of BVOCs in the absence of ozone, and (iii) potential ozone-induced losses of BVOCs in the scrubber. The sampling flow rate through the scrubber was adjusted at 1 L min−1, leading to residence times of 1, 2, and 0.5 s in the KI, MnO2, and Na2S2O3 scrubbers respectively. The three tests were performed as follows:
- i.
The scrubbing efficiency was calculated from the ratio of ozone concentrations measured after and before the scrubber. The experimental set-up used in the previous experiment was also used here, with the addition of an ozone generator made of a photo-reactor equipped with a mercury lamp; a flow of 2000 mL min−1 of zero air (alpha 2, N50) was passed through the above-mentioned photo-reactor. An ozone mixing ratio of approximately 1 ppm was generated in the photo-reactor. Two critical orifices were used to inject a small flow rate of 10–15 mL min−1 of the ozone mixture into the main flow of zero air (1 L min−1) at 50 % RH (22 ∘C). The ozone removal efficiency was quantified at 93 ppb for the KI and MnO2 scrubbers and 68 ppb for the thiosulfate scrubber.
- ii.
Losses of BVOCs in the absence of ozone were quantified for each scrubber. A mixture of 2–4 ppb of each VOC (Table 2) was generated using the system described in Sect. 2.1. Three chromatograms were acquired without scrubber. The scrubber was then inserted on the gas generation line (1 L min−1) before the sampling point of the GC instrument. First, the generation system was connected and its stability was checked by recording four chromatograms. Second, the scrubber was connected and four new chromatograms were monitored. Finally, the scrubber was disconnected to check the stability of the generation system by recording four additional chromatograms.
- iii.
Losses of BVOCs in the presence of ozone were also quantified for each scrubber to check for ozone-induced losses inside the scrubbers. Ozone was generated using the set-up presented in Sect. 2.2. (i) and mixed within the main flow of 2–4 pbb of BVOCs (1 L min−1) at 50 % RH (22 ∘C), generated as described in Sect. 2.1. A mixing ratio of 50–100 ppb of O3 was measured in the mixture during these experiments. The chromatograms were acquired using the same sequence as in the previous experiment.
2.5 Evaluation of analytical performances
Concentration determination – for each compound i the concentration was calculated as follows:
where Ai is the peak area and Ki is the response coefficient of the compound icalibrated at a concentration of 3–5 ppb.
Repeatability – the measurement repeatability was evaluated from seven replicates using a mixture of 3–5 ppb of the target compounds (Table 2) at 50 % RH under laboratory conditions and from three replicates using the same mixture under field conditions.
Memory effect – the memory effect was also evaluated by recording a chromatogram of zero air right after a chromatogram of the above-mentioned mixture. The memory effect was calculated from Eq. (3):
where is the peak area of a compound i in the VOC mixture, and Ai is the peak area of the same compound i present in zero air.
Linearity – the linearity was tested from 7.5 to 100 µg m−3 (0.5 to 19.5 ppb for monoterpenes) according to ISO 14662-3 (European Standards, 2015) using a VOC mixture generated at 80 % RH. For each compound, the linearity was evaluated using linear regression square coefficient R2 and the maximum relative residuals, as follows:
where Creg,i is the concentration of the compound i calculated from the linear regression at a level i, and Cexp,i is the concentration measured at this level i.
Expanded uncertainty – the measurement uncertainty was calculated for each compound based on a methodology proposed by Hoerger et al. (2015). Some uncertainty terms were added or modified to fit our application.
The combined expanded uncertainty shown in Eq. (5), i.e. uχunc, includes random errors uχprec described by the precision, and systematic errors uχystematic:
The precision, uχprec, was calculated as follows:
where DL is the detection limit, χ is the mole fraction of the compound of interest, and is the relative standard deviation of replicated measurements of the standard.
Five components were considered as systematic errors: the uncertainty associated with the calibration standard (uχcal), the systematic error due to the integration (peak overlay or poor baseline separation) (uχint), the potential artefact due to the scrubber (uχscrub), the memory effect (uχmem), and the linearity (uχlin) for concentrations above the calibration concentration.
The systematic error due to the calibration gas uncertainty was calculated as follows:
where Asample is the peak area of sample measurement, Acal is the peak area of the calibration standard measurement, Vsample is the sample volume, Vcal is the sample volume of calibration standard, and δχcal is the uncertainty of the concentration in the standard.
δχcal depends on the calibration type used for the compound – either (i) the certified standard National Physical Laboratory (NPL) or (ii) the standard generated as described in Sect. 2.1. In the case of (i), δχcal is the certified uncertainties given with the certified concentration. In the case of (ii), δχcal combines an uncertainty fixed by the worst recovery obtained between the NPL standard and the canister test presented in Sect. 4.1 and the reproducibility of the generated standard mixture.
The systematic integration error is defined as
where δAcal is the integration error of the calibration standard measurement, and δAsample is the integration error of the sample measurement. These integration uncertainties were determined using representative chromatograms.
The systematic error linked to the influence of the scrubber was evaluated as follows:
where is the relative deviation between measurements of the same mixture with and without a scrubber and ozone, and χfree the mole fraction measurement without a scrubber and ozone.
The systematic error linked to the memory effect is defined as
where Mi is the memory effect determined following Eq. (3), and χn−1 is the mole fraction of the previous measurement.
The systematic error due to the linearity was calculated as follows:
where ∂max is the maximum relative residuals defined by Eq. (4).
The expanded uncertainty is then estimated as the total uncertainty calculated multiplied by the coverage factor k=2.
2.6 Field measurements: deployment during the LANDEX field campaign
The online TD-GC-FID instrument was deployed for the first time in the summer of 2017 during the LANDEX field campaign. This campaign, the main objective of which was to study the formation of secondary organic aerosols (SOAs) in the Landes forest (France), was conducted from 29 June to 19 July 2017. The measurement site was located at Bilos in the Landes forest (44∘29′39.69′′ N, 0∘57′21.75′′ W, 37 m above sea level).
A description of the site, which is also part of the European ICOS (Integrated Carbon Observation System) ecosystem infrastructure, can be found in Moreaux et al. (2011). Briefly, the site consisted of a large 30.2 ha (570 m × 530 m) area, mainly composed of maritime pines (Pinus pinaster), with a dense understory of gorse (Ulex europaeus L.), grass (Molinia caerulea (L.) Moench) and heather (Calluna vulgaris (L.) Hull). It is part of the Landes of Gascony forest which has an area of around 1×10⁶ ha. The climate is temperate with a maritime influence due to the proximity of the North Atlantic Ocean (25 km). The nearest urban area is the metropolitan area of Bordeaux, 50 km northeast of the site.
The “OMEGA“ mobile laboratory from IMT Lille Douai was deployed and located between two ranks of trees. Ambient air was sampled through a heated (55 ∘C) 10 m long sampling line (Sulfinert, o.d.) at a flow rate of 1 L min−1 using an external pump for continuous flushing. The tree height was approximately 10 m and the measurement height was adjusted to 6 m, below the forest canopy. The TD-GC-FID pulled 20 mL min−1 of air from the sampling line during the pre-concentration steps.
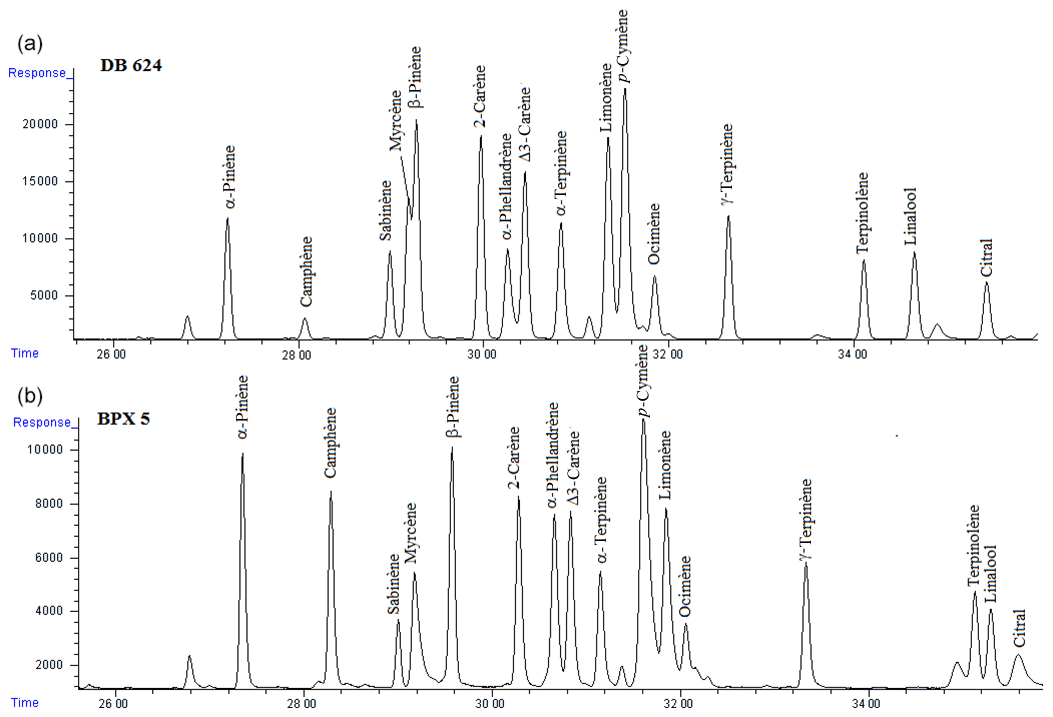
Figure 1Separation of the 20 BVOCs from Table 2 using the DB-624 column (a) and the BPX5 column (b). VOC mixing ratios were approximately 1 ppb.
3.1 Chromatographic separation
As mentioned in Sect. 2.2, two chromatographic columns were tested and the operating conditions were optimized (as shown in Table 3) to obtain the best separation of the 20 target BVOCs. Figure 1 illustrates the most difficult compounds to separate. Using the DB-624 column, myrcene and β-pinene, two of the main observed monoterpenes, were co-eluted, unlike with the BPX5 column. Thus, the latter column was finally selected for this measurement method.
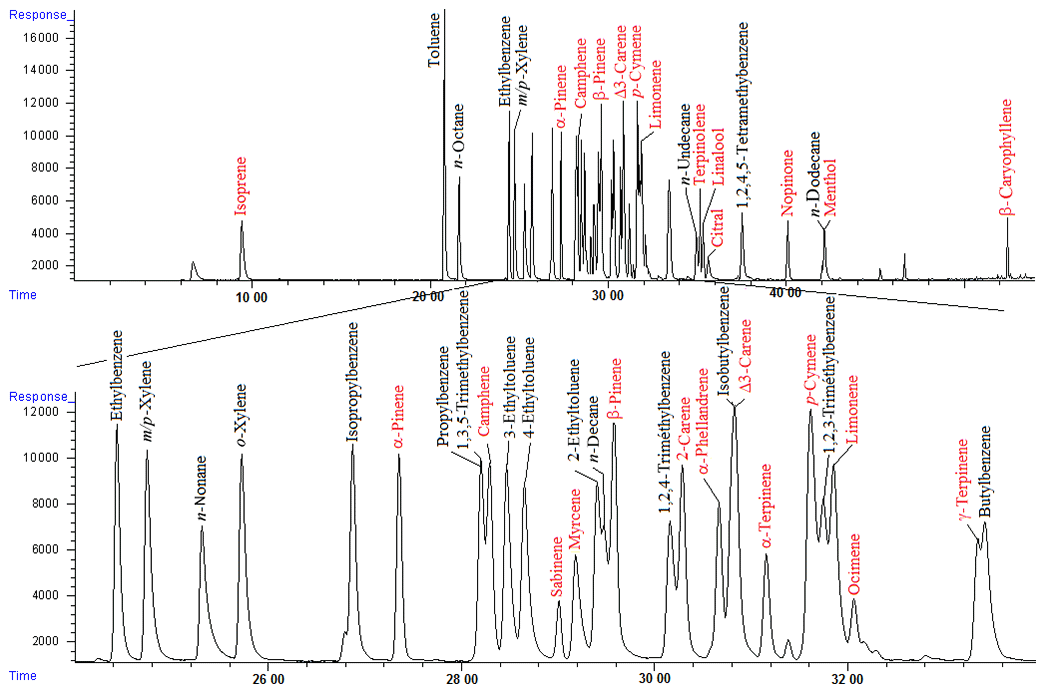
Figure 2Separation of 20 BVOCs and 20 anthropogenic compounds. VOC mixing ratios were approximately 4 ppb. Compounds in red are the target BVOCs.
The resolution for every compound was at least equal to 1.2, yielding chromatographic separation that was considered satisfactory for the 20 target BVOCs. Nevertheless, it was also important to consider potential co-elution with other non-target VOCs, such as compounds from potential anthropogenic sources. A total of 20 selected compounds usually measured in urban areas were added to the test mixture. The separation remained acceptable for most of the compounds except for isobutylbenzene (which co-eluted with Δ3-carene), 1,2,3-trimethylbenzene (which co-eluted with p-cymene and limonene), butylbenzene (which co-eluted with γ-terpinene), and n-dodecane (which co-eluted with menthol) (Fig. 2). It should be noted that other compounds that have not been targeted here could also co-elute with target compounds and maybe other monoterpenes.

Figure 3Investigation of the optimal desorption temperature for BVOC measurements. Two replicates performed at each temperature: (a) peak areas observed after the first desorption analysis and (b) the desorption efficiency.
3.2 Thermodesorption
As mentioned in Sect. 2.3, different desorption temperatures were tested to optimize the quantitative transmission of VOCs inside the GC column. Results reported in Fig. 3a show peak areas observed for each compound after the first thermodesorption, for the four different tested temperatures. First, sabinene presented a lower response than theoretically expected from a monoterpene. The most probable reason for this is the potential degradation of the sabinene in p-cymene and/or limonene during the thermodesorption, as demonstrated for Tenax and Carboxen by Coeur et al. (1997). For most compounds, the desorption temperature only has a small influence on the response, with changes lower than 5 % between the maximum and minimum peak areas (e.g. toluene, α-pinene, myrcene, camphene, carenes, nopinone). For some compounds, the peak area decreased between 275 and 350 ∘C, indicating a potential thermal degradation (e.g. −20 % for sabinene or −10 % for β-pinene and isoprene), which is consistent with observations made by Hopkins et al. (2011). For other compounds, an increase of the desorption temperature led to an increase in the response, indicating that these compounds may be desorbed more efficiently on Carbopack B (e.g. +20 % for β-caryophyllene or α-terpinene).
The desorption efficiency is presented in Fig. 3b for each compound at each temperature. The efficiency was higher than 95 % for all compounds except for citral and β-caryophyllene, with an efficiency increase of 22 % for both compounds when the temperature was raised from 275 to 350 ∘C. The gain between 325 and 350 ∘C was of 1 %–2 %. From these results, a temperature of 325 ∘C was considered to be a good compromise between the loss of thermally sensitive compounds and desorption efficiency for less volatile compounds.
3.3 Safe sampling volume
The term breakthrough is defined as the volume of gas that causes a compound migration through 1 g of the adsorbent bed at a specific temperature. The breakthrough volume enables the estimation of the maximum sampling volume that ensures a quantitative sampling of a compound using a certain adsorbent mass at a specific temperature (Dettmer and Engewald, 2002). The most volatile compound will be the first to breakthrough from the trap. Several experiments were performed to evaluate the safe sampling volume of the trap. The VOC mixture was generated as presented in Sect. 2.1 at a concentration of 8–21.7 ppb at 80 %RH (22 ∘C). Six volumes were tested: 200, 600, 1000, 1200, 1440, and 1800 mL. The peak area observed on the chromatograms for each compound was plotted versus the sampled volume as shown in Fig. 4 for the four most volatile species (isoprene, toluene, α-pinene, and camphene). A linear increase of the peak area with the sampling volume is observed in Fig. 4, indicating that the compounds were quantitatively retained on the sorbent and that the breakthrough was not reached up to a sampling volume of 1800 mL. To be conservative, the sampling volume was set at 1200 mL for this GC instrument.
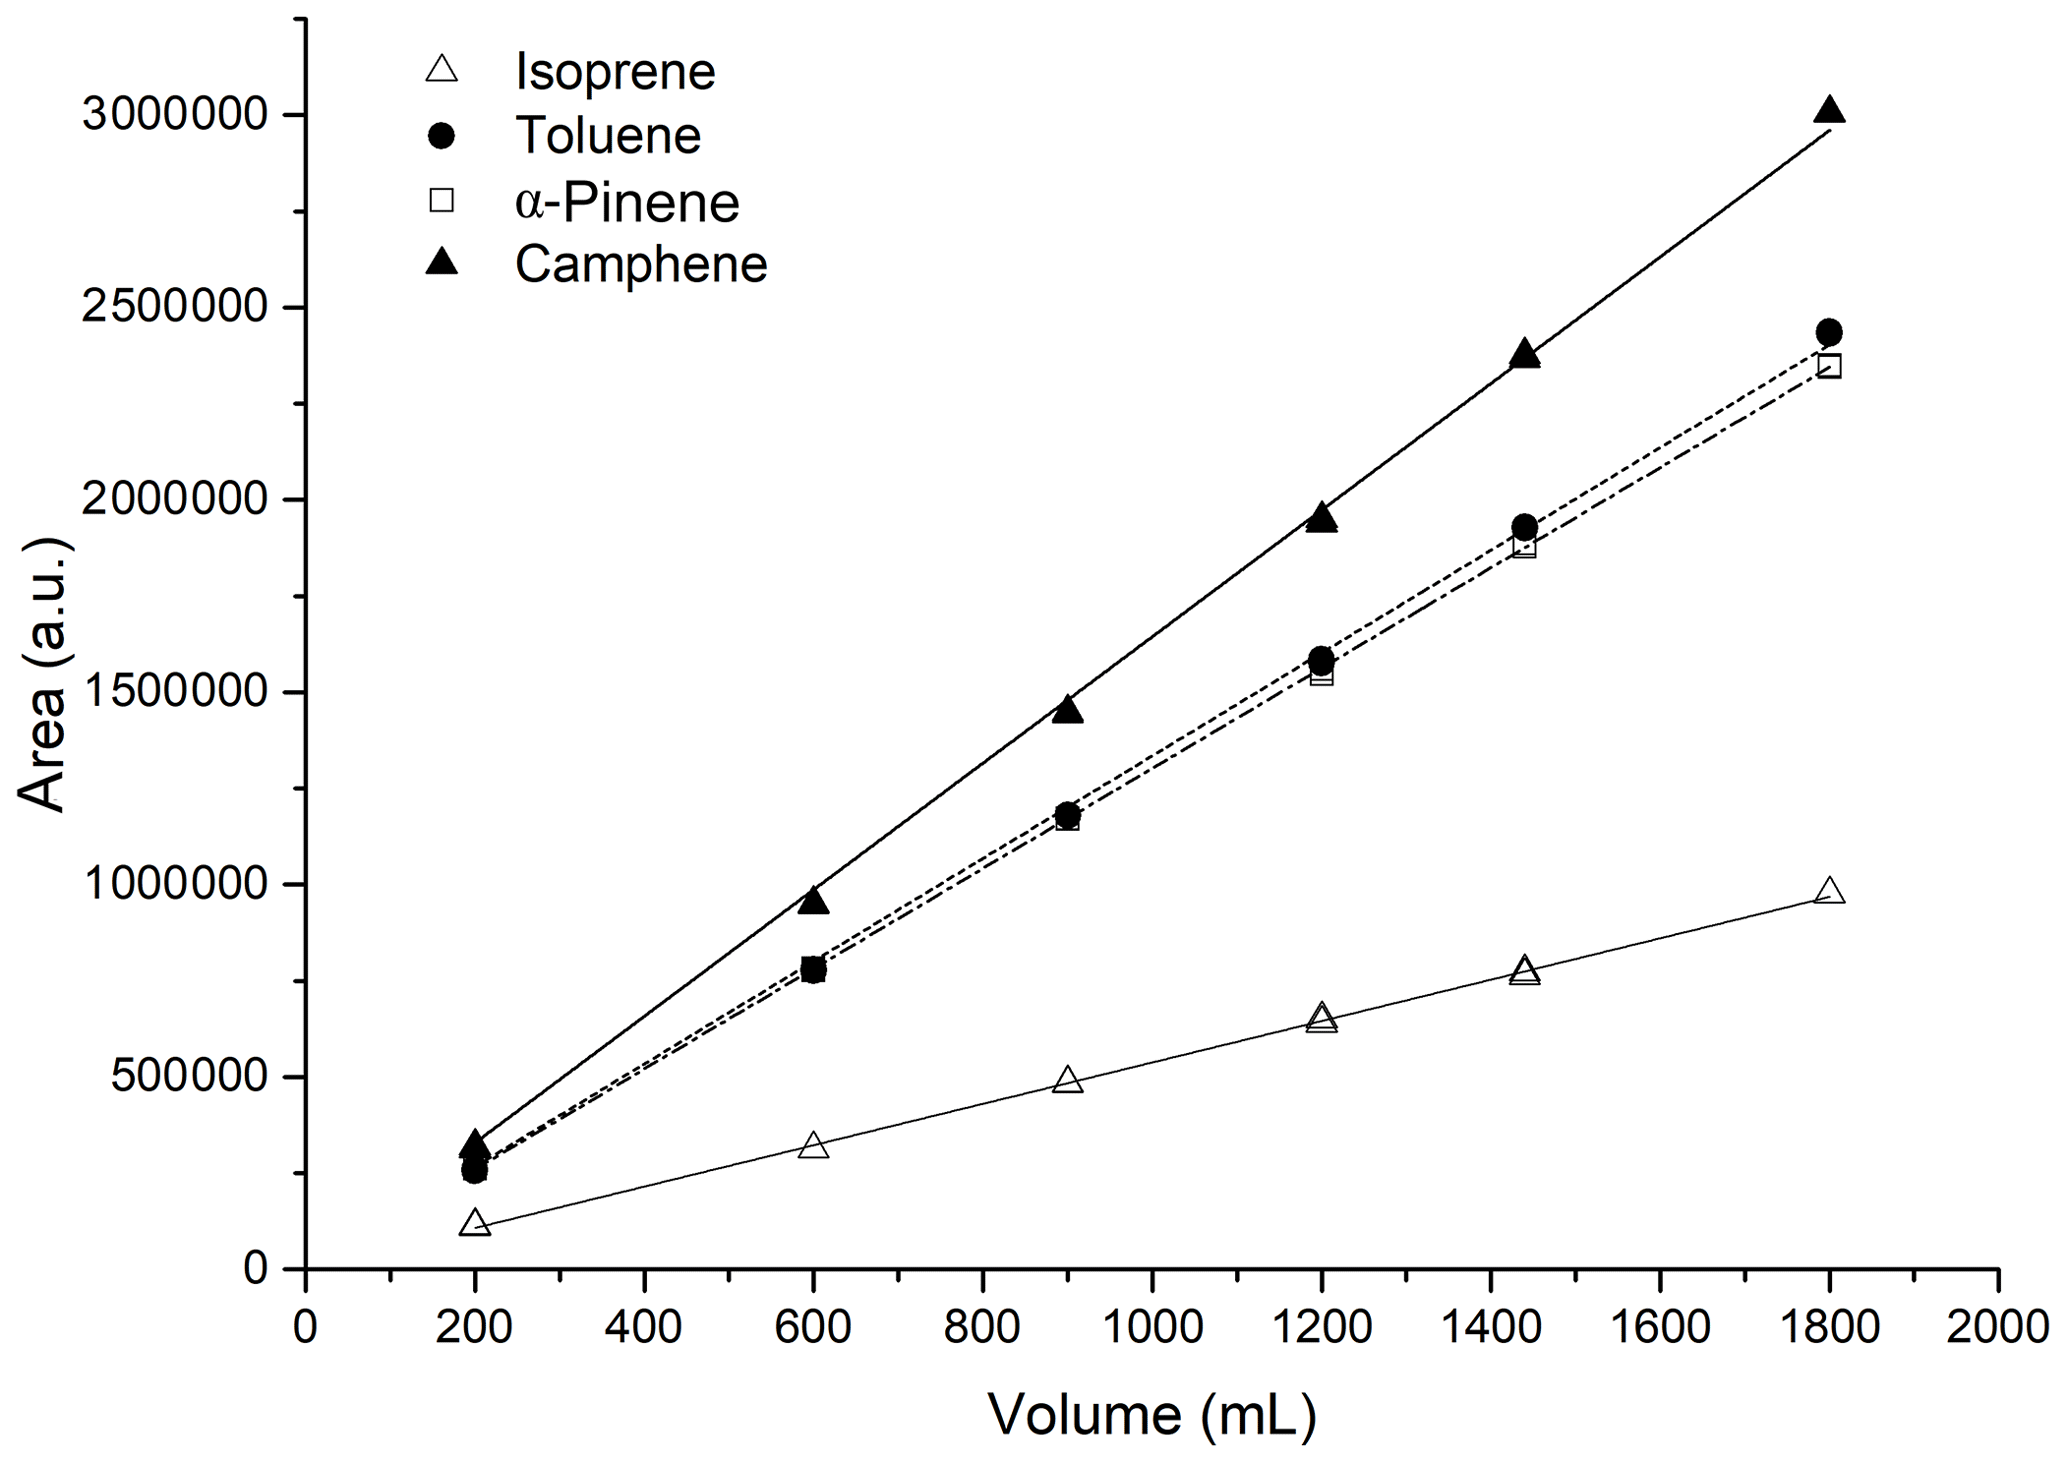
Figure 4Investigation of the safe sampling volume at 80 % RH for the four most volatile compounds in the mixture.
Table 4Canister reproducibility (n=7). RSD refers to the relative standard deviation.

3.4 Comparison of ozone scrubbers
Several experiments were performed to test the impact of ozone on the measurements. The results reported in Fig. 5 indicate a significant loss for a large number of reactive compounds in the absence of an ozone scrubber, including myrcene (−15 %), sabinene (−27 %), γ-terpinene (−38 %), ocimene (−32 %), linalool (−46 %), α-phellandrene (−48 %), terpinolene (−55 %), α-terpinene (−82 %), and β-caryophyllene (−99.5 %). In addition, it is clear that oxidation products generated inside the trap also impacted the measurements of citral, p-cymene, and α-pinene, likely due to co-elutions. These results stress the need for an ozone scrubber in order to reduce any measurement bias involving the reaction of O3 with adsorbed BVOCs in the trap when a pre-concentration technique is used.

Figure 5Relative deviation of BVOC measurements performed (i) with a scrubber and without O3, (ii) when O3 (50 ppb) is added to the standard mixture without scrubber, and (iii) when a scrubber is used with O3. (a) KI scrubber and (b) thiosulfate scrubber. VOCs are classified from the less reactive (left) to the most reactive (right) with ozone. Errors bars correspond to 3 standard deviations.
The measured output-to-input ozone ratio indicated a removal efficiency better than 99.4 % for each scrubber. The MnO2 scrubber is a commercialized version used in the ozone monitor, with a recommended lifetime of 1 year. The KI scrubber is efficient for at least 1 month. However, it has to be replaced more frequently when sampling under high humidity conditions (EPA, 1999). The thiosulfate scrubber is efficient for approximately 16 h (Plass-Dülmer et al., 2002).
Losses of BVOCs in each scrubber were evaluated using the procedure described in Sect. 2.4 and are reported in Fig. 5. During these tests, the MnO2 scrubber exhibited losses of oxygenated compounds ranging from 40 % to 80 % (see Fig. S1 in the Supplement), whereas the two other scrubbers did not exhibit losses larger than 5 %–10 %. This observation is consistent with cautionary remarks reported for MnO2 scrubbers by ACTRIS (2014). Therefore, this scrubber was rejected for our application. The thiosulfate and KI scrubbers exhibited losses lower than 5 % for most of the non-oxygenated BVOCs.
The thiosulfate and KI scrubbers were tested in the presence of ozone to check for ozone-induced losses inside the scrubber. Results presented in Fig. 5 indicate that significant losses were only observed for the two most reactive compounds, i.e. α-terpinene and β-caryophyllene, with losses of approximately 20 % and 40 % respectively. For other compounds, this loss was always lower than 15 %, which is reasonable for ambient measurements. As both scrubbers exhibited similar results, the KI scrubber was selected based on its longer lifetime, limiting the number of measurement interruptions during the field campaign.
In order to propose an exhaustive overview of ozone scrubber choice for BVOC measurements, a comparison of our results with a KI scrubber compared to those obtained by Hellen et al. (2012) – using a heated 3 m (SS 3 m) stainless steel tube at a flow rate of 1 L min−1 and with or without 50 ppb of ozone – was realized. Without ozone, the recovery results with both types of scrubbers are comparable for toluene, nopinone, and monoterpenes (94 %–97 %), except for terpinolene and camphene. β-Caryophyllene and terpinolene recoveries are slightly better with the SS 3 m (103 % and 104 % respectively) than with the KI scrubber (98 % and 95 % respectively). Linalool and camphene recoveries are slightly better using the KI scrubber (93 % and 96 % respectively) than with the SS 3 m (87 % and 91 % respectively). With ozone, the monoterpene, β-caryophyllene, and nopinone recoveries are comparable or slightly better with SS 3 m than with the KI scrubber (97 %–110 %). Linalool presents a bad recovery with the SS 3 m of 54 % compared with 89 % with the KI scrubber. Here, we compared our results to the results of a SS 3 m; however, we used a longer tube during the campaign, which was more similar to the SS 5 m length presented by Hellen et al. (2012). The recoveries of β-pinene, linalool, and β-caryophyllene with a SS 5 m and no ozone are lower than with a SS 3 m with no ozone. As stated by Hellen et al. (2012), the compound isomerization might be the reason for this. β-Pinene is known to isomerize easily in myrcene and limonene during the heating step. For all of these reasons, we finally preferred the use of a KI scrubber in our study.
3.5 Optimized method
Resulting from the tests performed, the optimized method for BVOC measurement is as follows:
Sampling: the online thermodesorption (TD) system sampled on a trap made of Carbopack B at a temperature of 20 ∘C and a flow rate of 20 mL min−1 over a 60 min period. For the desorption, the trap was quickly heated from 20 to 325 ∘C and maintained at 325 ∘C for 15 min with a helium flow rate of 20 mL min−1. The transfer line between the TD and GC was maintained at 140 ∘C.
Analysis: the GC system was equipped with a chromatographic BPX5 column (60 m × 0.25 mm i.d. and 1 µm film thickness; SGE Analytical Science). Pressure was maintained at 24 psi. The temperature settings were as follows: Toven (initial) was 40 ∘C for 8 min, Toven (first ramping) was 6 ∘C min−1 until 135 ∘C, Toven (second ramping) was 0.6 ∘C min−1 until 145 ∘C, Toven (third ramping) was 6 ∘C min−1, and Toven (final) was 250 ∘C for 5 min. The FID detector was fed by pure H2 at 40 mL min−1, pure air at 450 mL min−1, and pure N2 at 45 mL min−1 (TFID=250 ∘C).
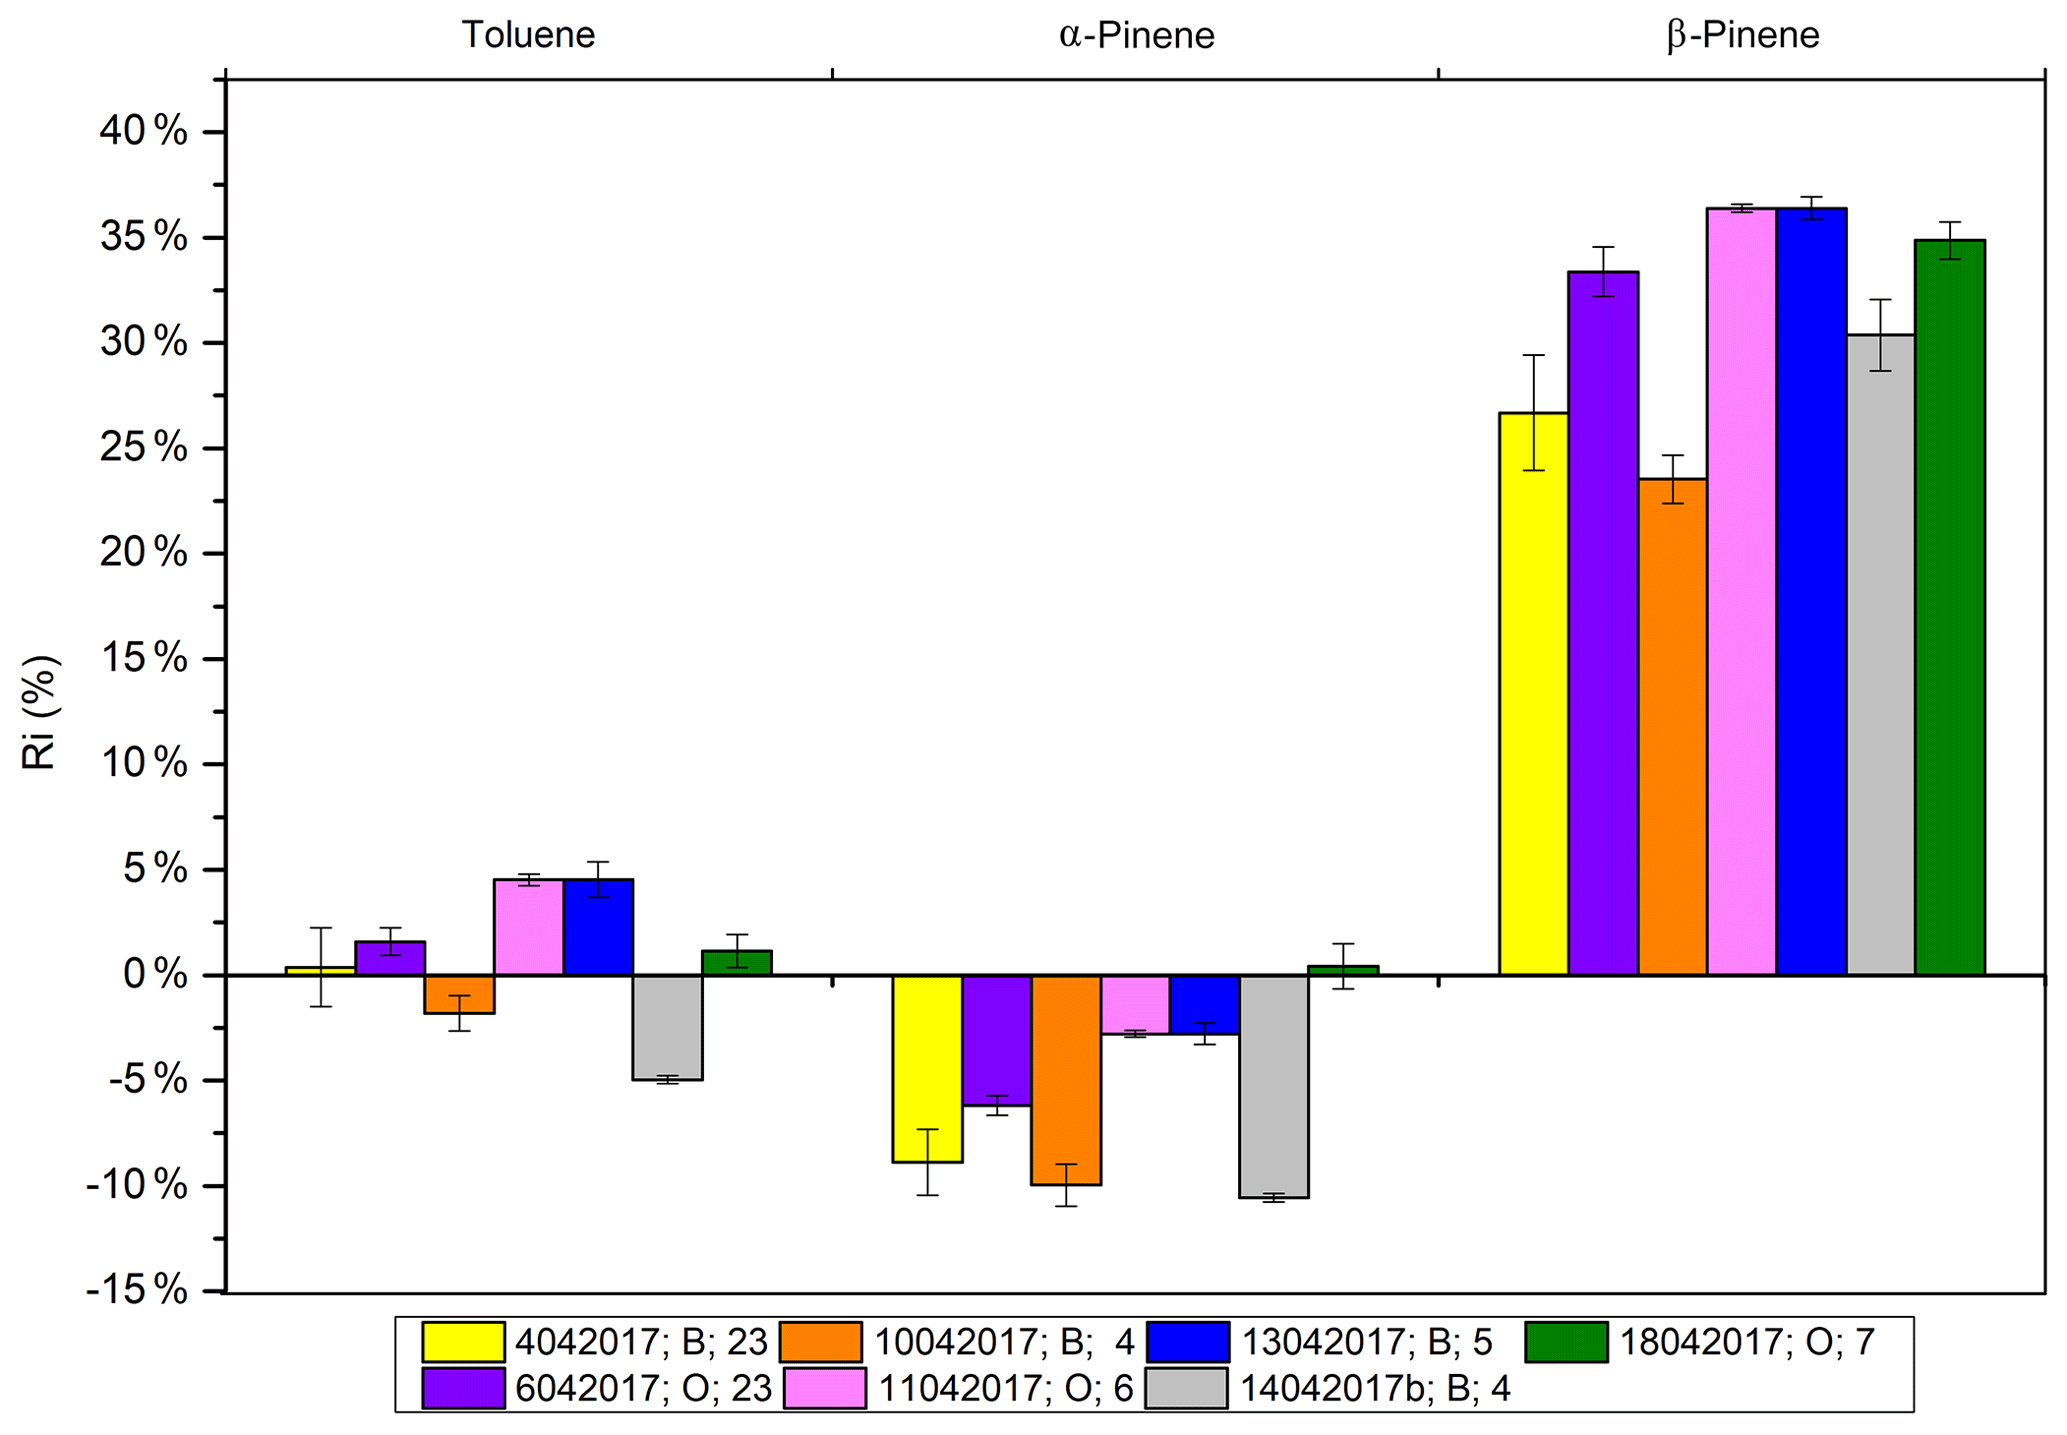
Figure 6The canisters' response coefficient relative deviation from the NPL response coefficient. The legend displays the following information: the canister creation date (ddmmyyyy), the canister used (B denotes S053 and O denotes S052), and the number of replicates (n). Error bars show 1 standard deviation (1σ).
4.1 BVOC calibration
Figure 6 presents the relative deviation (RD) between response coefficients determined from the mixture generated from a canister, as described in Sect. 2.1, and the response coefficients determined from the NPL standard for toluene, α-pinene, and β-pinene. The RD was lower than 5 % for toluene, whereas a systematic value of −10 % was obtained for α-pinene, indicating higher values measured with the NPL standard than with the generated mixture. The RD reached +32 % for β-pinene, and this factor was then used for the calculation of δχcal for the uncertainty evaluation. Note that some instability of conservation has been previously demonstrated for β-pinene in a high-pressure cylinder by Rhoderick and Lin (2013). Therefore, there is some doubt regarding the NPL certified standard value for β-pinene in this study. The concentration of all compounds was stable for 2 weeks. Relative standard deviations (RSDs) are reported in Table 4 for each compound and for seven canisters filled with the generated standard mixture. For monoterpenes, reproducibility ranged from 3.5 % to 9.8 %, with most of them being below 5 %. For oxygenated monoterpenes and nopinone, reproducibility was between 9 % and 11 % and rose to 22 % for β-caryophyllene. Although significant bias was observed with the NPL standard for β-pinene, the reproducibility of the mixture generation was considered to be satisfactory.
4.2 Linearity, repeatability, limit of detection, and memory effect
The R2 values from the scatter plot of the instrument response versus the compound concentration were higher than 0.99 for all of the compounds, except for menthol (0.954) (Table 5). The maximum relative residuals were less than 30 % for all compounds except isoprene (44.2 %) and menthol (95.6 %). For all compounds, measurements were linear between the detection limit (DL) and 100 µg m−3 (19.5 pbb for monoterpenes). For menthol, the measurement was linear between the DL and 73.8 µg m−3 (11.5 ppb) ( %; slope =109 203 and R2=0.9903).
Table 5Concentrations, relative standard deviations (RSD), memory effect, detection limits (DL), and concentrations of the maximal relative residual, ∂max (in %), measurement at 80 % RH (22 ∘C) for the target compounds.
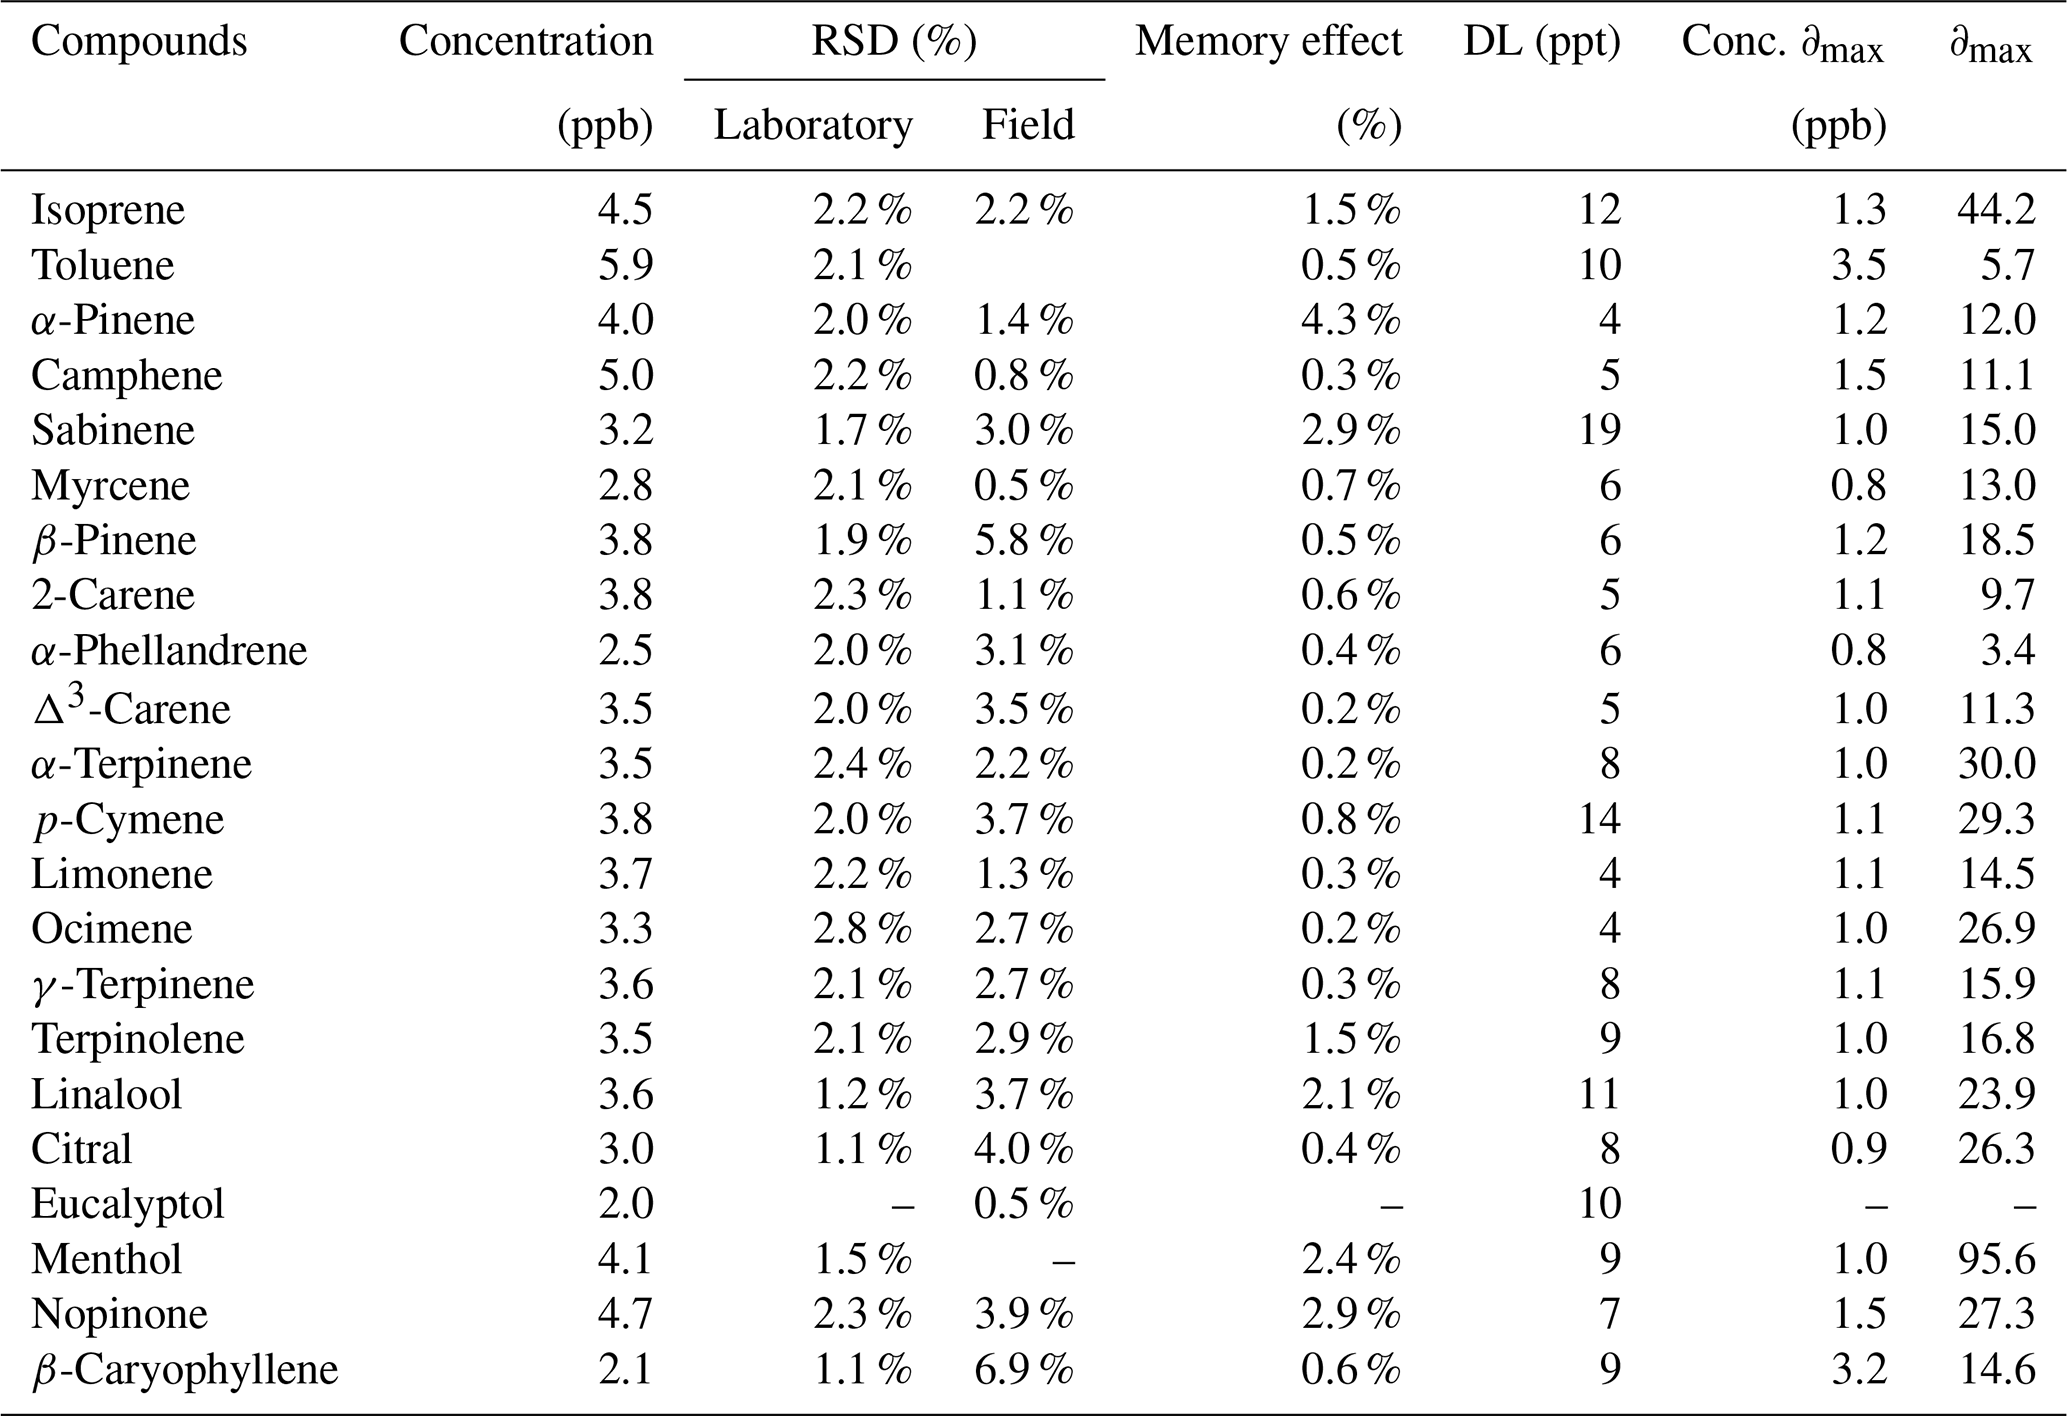
The relative standard deviation (RSD) has been evaluated for each compound's peak. RSD results are reported in Table 5. RSD were lower than 3 % for all compounds under laboratory conditions. Repeatability was slightly degraded for some compounds under field conditions. This was logically expected due to environmental changes impacting working conditions. Nevertheless, RSD values were lower than 4 % except for β-caryophyllene (6.9 %) and β-pinene (5.8 %). Detections limits were determined for each compound as 3 times the signal-to-noise ratio value. As presented in Table 5, the DL values ranged from 5 to 19 ppt and are comparable to those reported in previous studies (Hopkins et al., 2011; Jones et al., 2014; Pankow et al., 2012). The memory effect is reported in Table 5 and was always lower than 5 % for all compounds, which corresponds to the criteria given in the ISO 14662-3 (European Standards, 2015).
4.3 Measurement uncertainties
The uncertainties compile the analytical performances presented above. Results presented in Fig. 7 were determined at two different mixing ratios: 2 ppb (Fig. 7a) and 100 ppt (Fig. 7b). The relative part of each uncertainty component was reported as a percentage of the expanded uncertainty at mean value for all compounds. For α-pinene and isoprene, the major component of uncertainty was the precision (e.g. the repeatability and DL) representing more than 66 % of the variance. For β-pinene, the uncertainties due to the calibration and the scrubber were the most significant. For limonene, the integration was the major one. For the four compounds presented in the NPL standard (i.e. isoprene, α-pinene, β-pinene, and limonene) the uncertainties ranged from 5 % to 10 % at 2 ppb and from 7 to 15 ppt at 100 ppt. For the above-mentioned compounds, the results indicated that the method almost complied with the very strict ACTRIS data quality objectives (DQOs), which are 10 % above 100 ppt and less than 10 ppt below, and met the Global Atmosphere Watch (GAW) criteria, which are 20 % above 100 ppt and less than 20 ppt. For the 16 other compounds calibrated with the generated mixture, the major uncertainty component was the calibration factor, and their uncertainties ranged from 47 % to 99 %. In accordance with results presented in the Sect. 3.1, the uncertainties related to α-terpinene, β-caryophyllene, α-phellandrene, γ-terpinene, and terpinolene were due to the scrubber. The integration component was significant for p-cymene, limonene, citral, and linalool, as expected considering the separation presented in Fig. 2. For sabinene, p-cymene, and isoprene, the weight of the precision factor was important due to their elevated DLs.
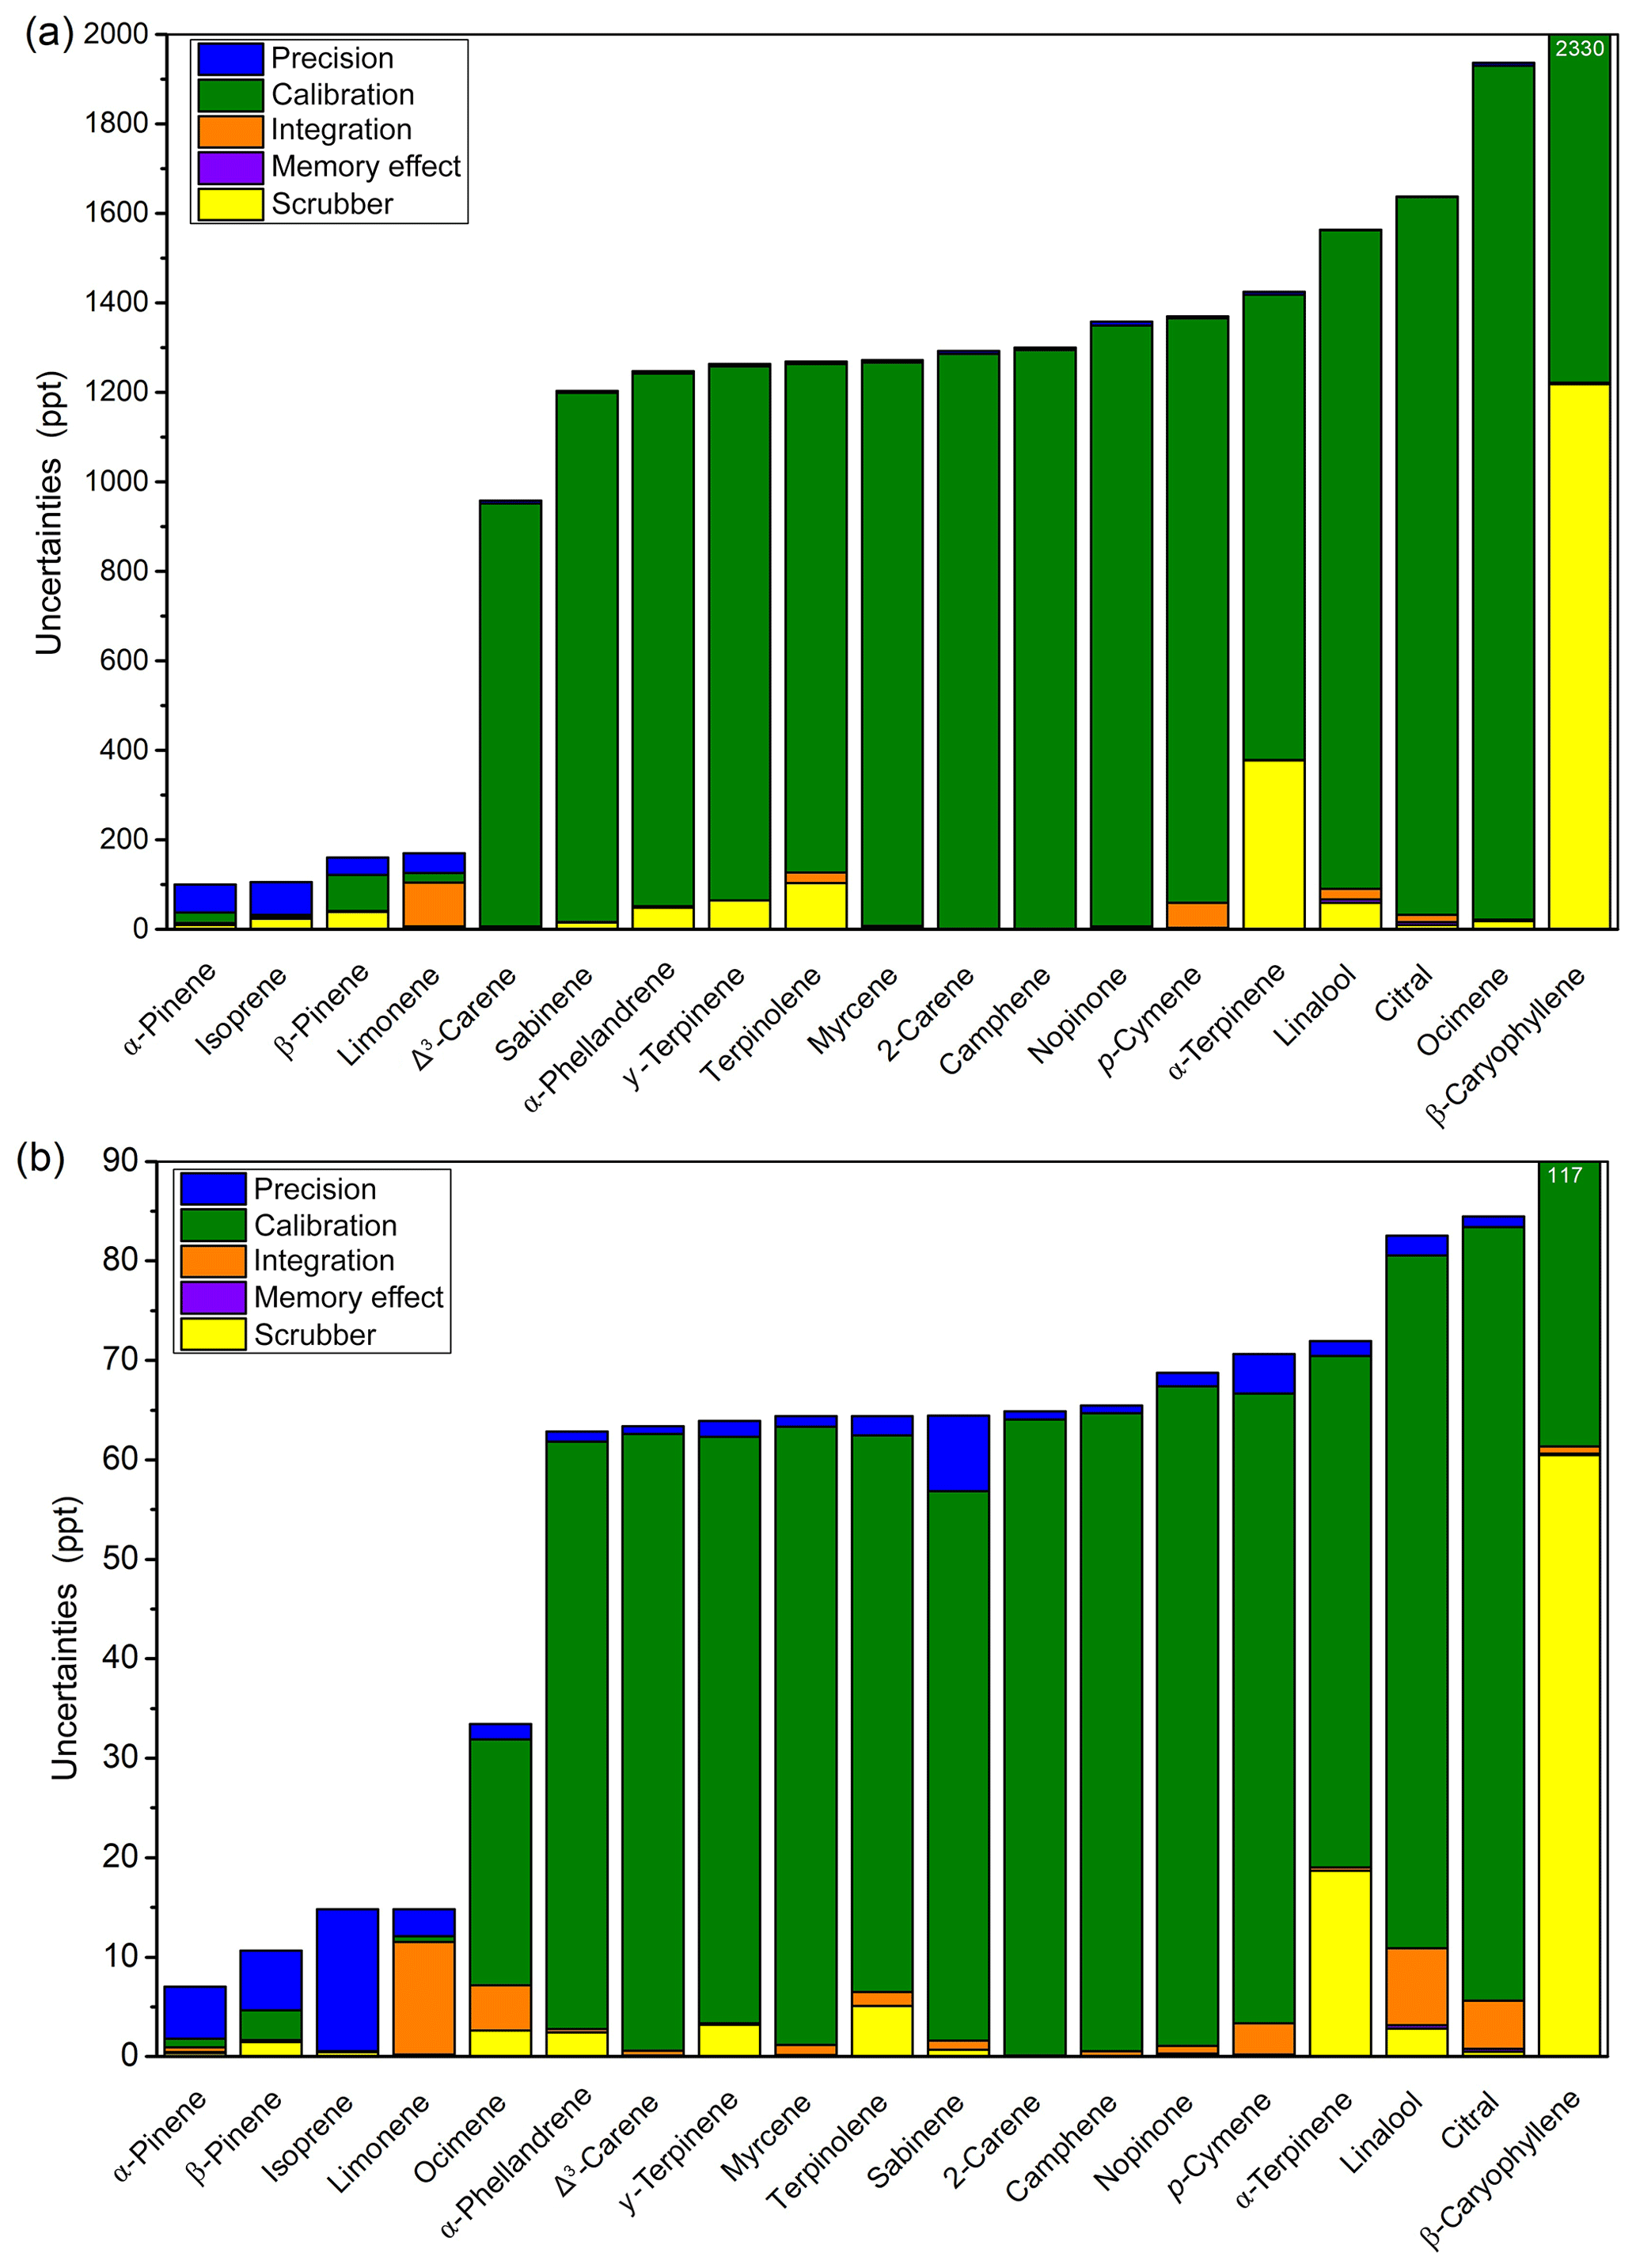
Figure 7Repartitioning of uncertainties for the five terms considered (precision, calibration, integration, memory effect, and scrubber) at (a) 2 ppb and (b) 100 ppt with laboratory analytical parameters.
During the campaign, another NPL certified calibration standard containing additional monoterpenes such as Δ3-carene, myrcene with certified uncertainties less than ±5 %, and p-cymene and ocimene at ±20 % was used. Consequently, uncertainties of Δ3-carene and myrcene decreased to comparable level (±10 %) with those of limonene (Fig. S2). For p-cymene and ocimene at 2 ppb, for which the calibration component is major, the uncertainties decreased drastically from 68 % and 96 % to 25 % and 23 % respectively. Integration became the most important source of uncertainty for p-cymene and ocimene. These results emphasize the need for a certified gaseous standard for the measured monoterpenes to reach the most demanding data quality objectives.
Table 6Statistics and uncertainties calculated at the mean value for BVOCs measured during the LANDEX field campaign in July 2017. The calibration technique used depended on the compounds and are defined as (A) for the certified NPL gas standard and (B) for the generated mixture.
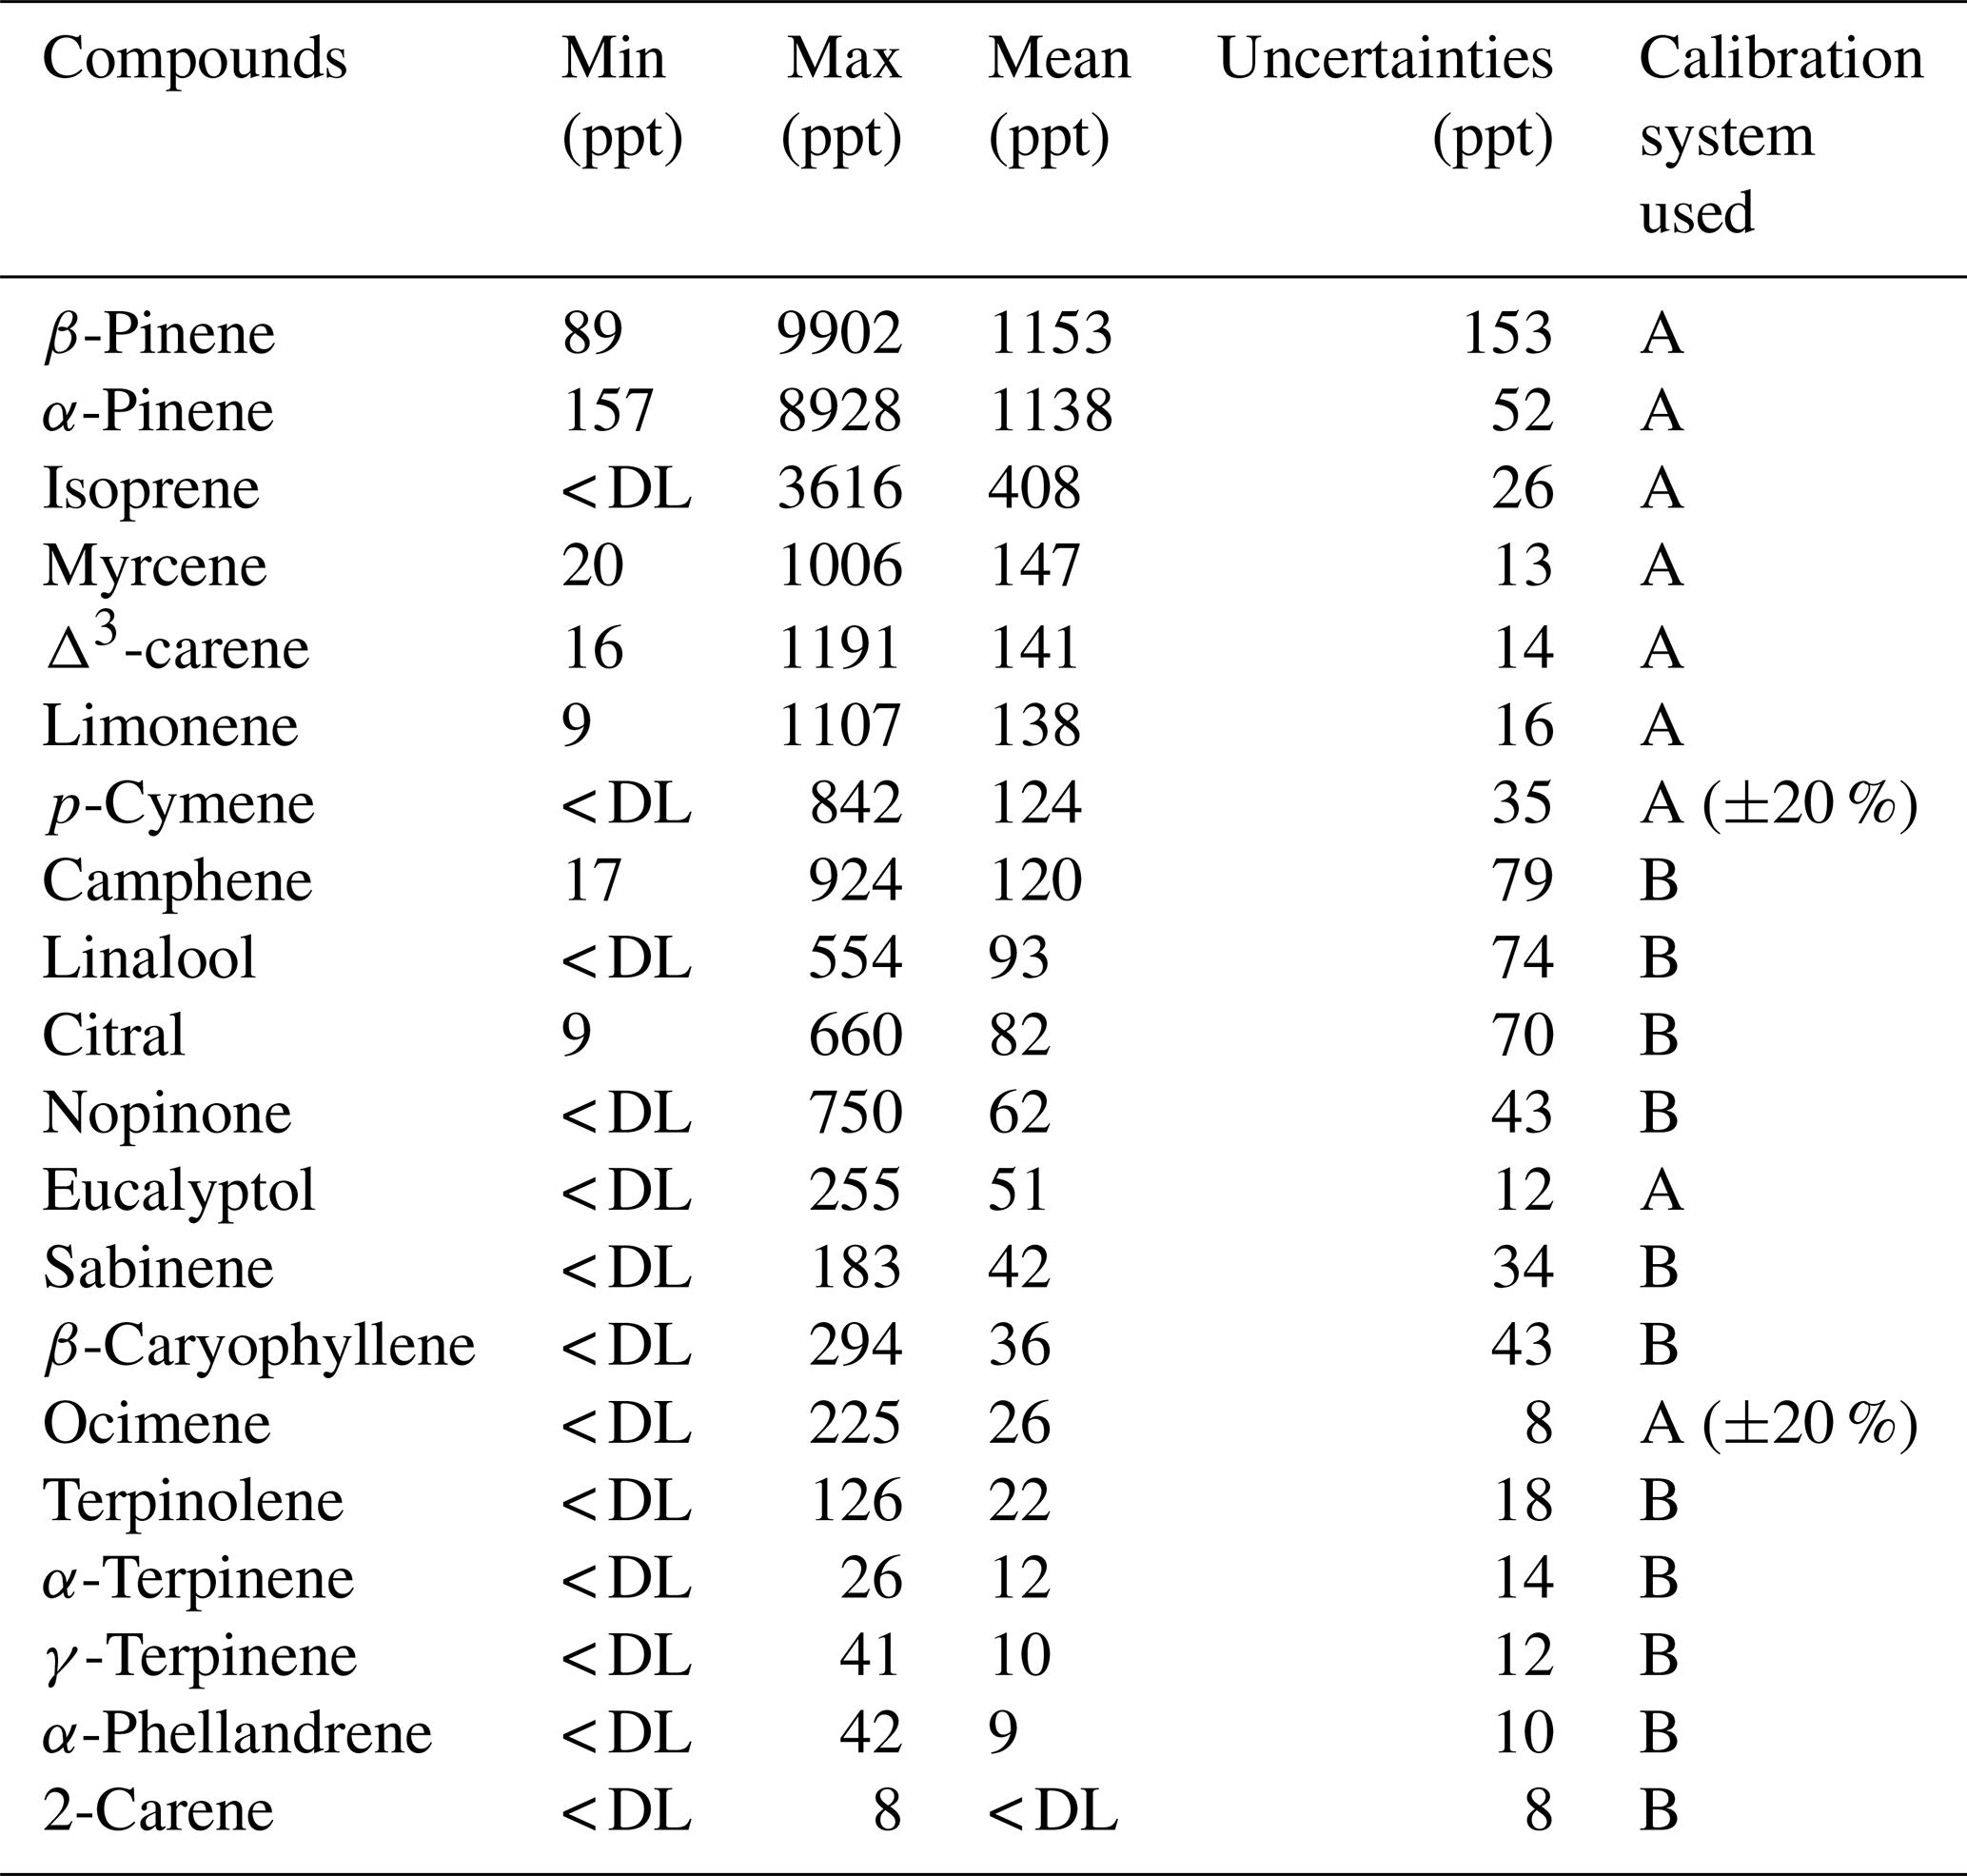
The Table 6 presents an overview of the whole dataset acquired specifically during the LANDEX field campaign. The data validation rate was greater than 72 % over the 27 d of the campaign. The two major monoterpenes observed were β-pinene and α-pinene, representing 60 % of the terpenoids measured on average, where isoprene represented about 17 %.
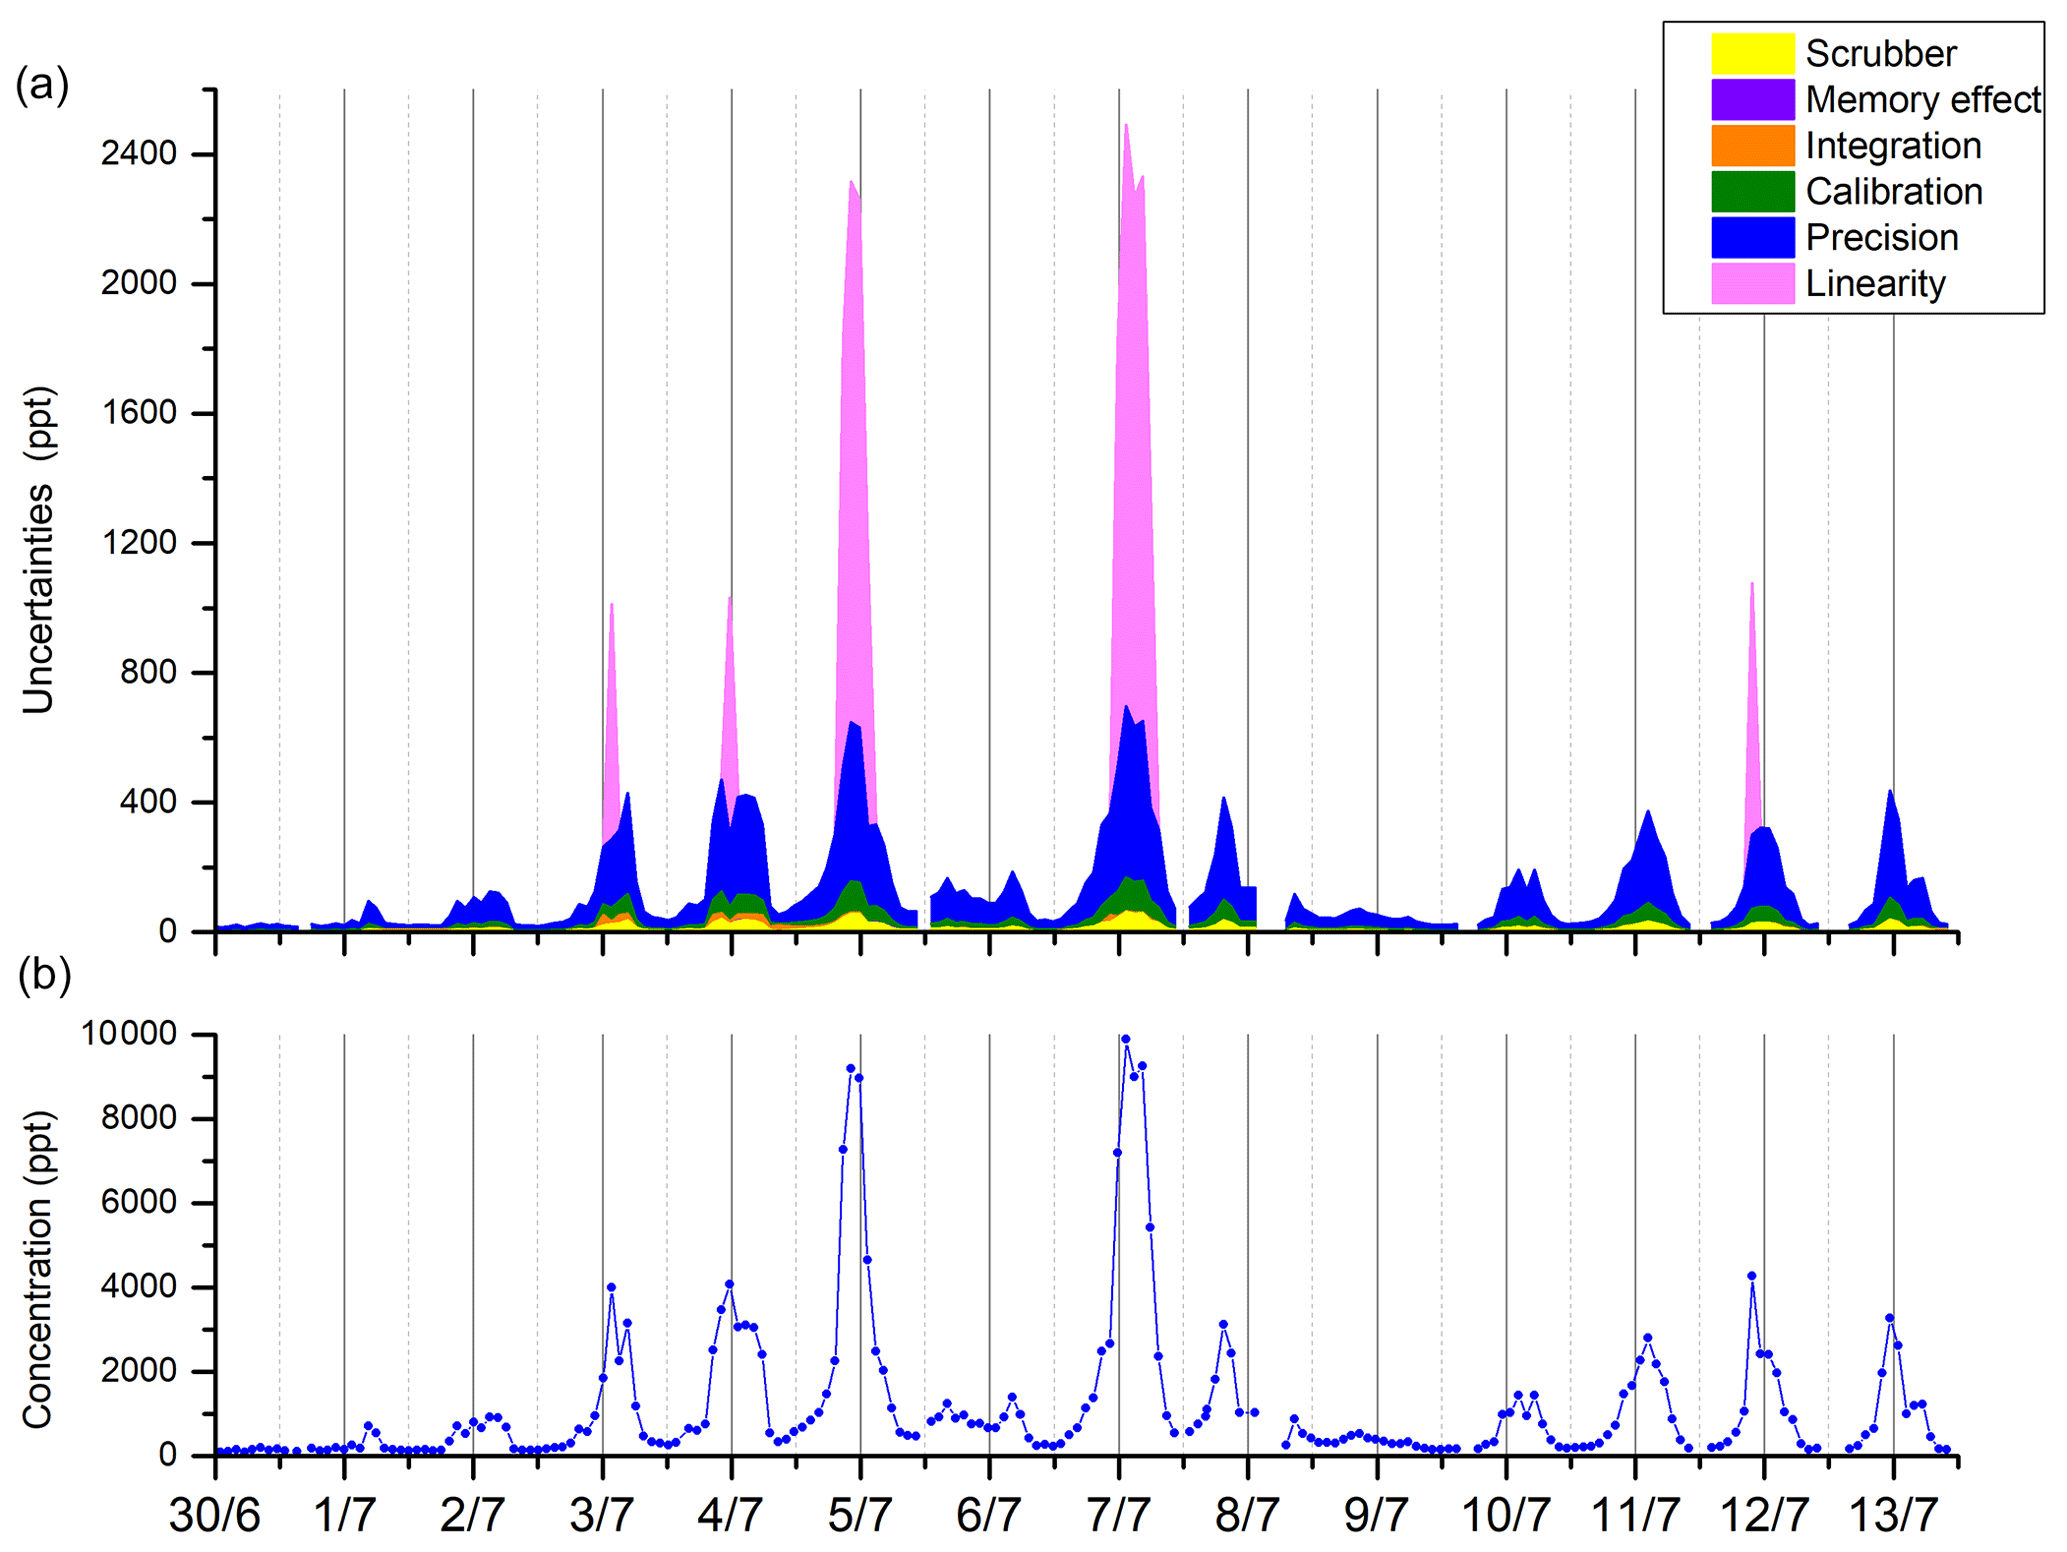
Figure 8Repartitioning of uncertainties (k=2) for the six terms considered (precision, calibration, integration, memory effect, scrubber, and linearity) (a) and the concentration of β-pinene during the LANDEX episode 1 field campaign (b).
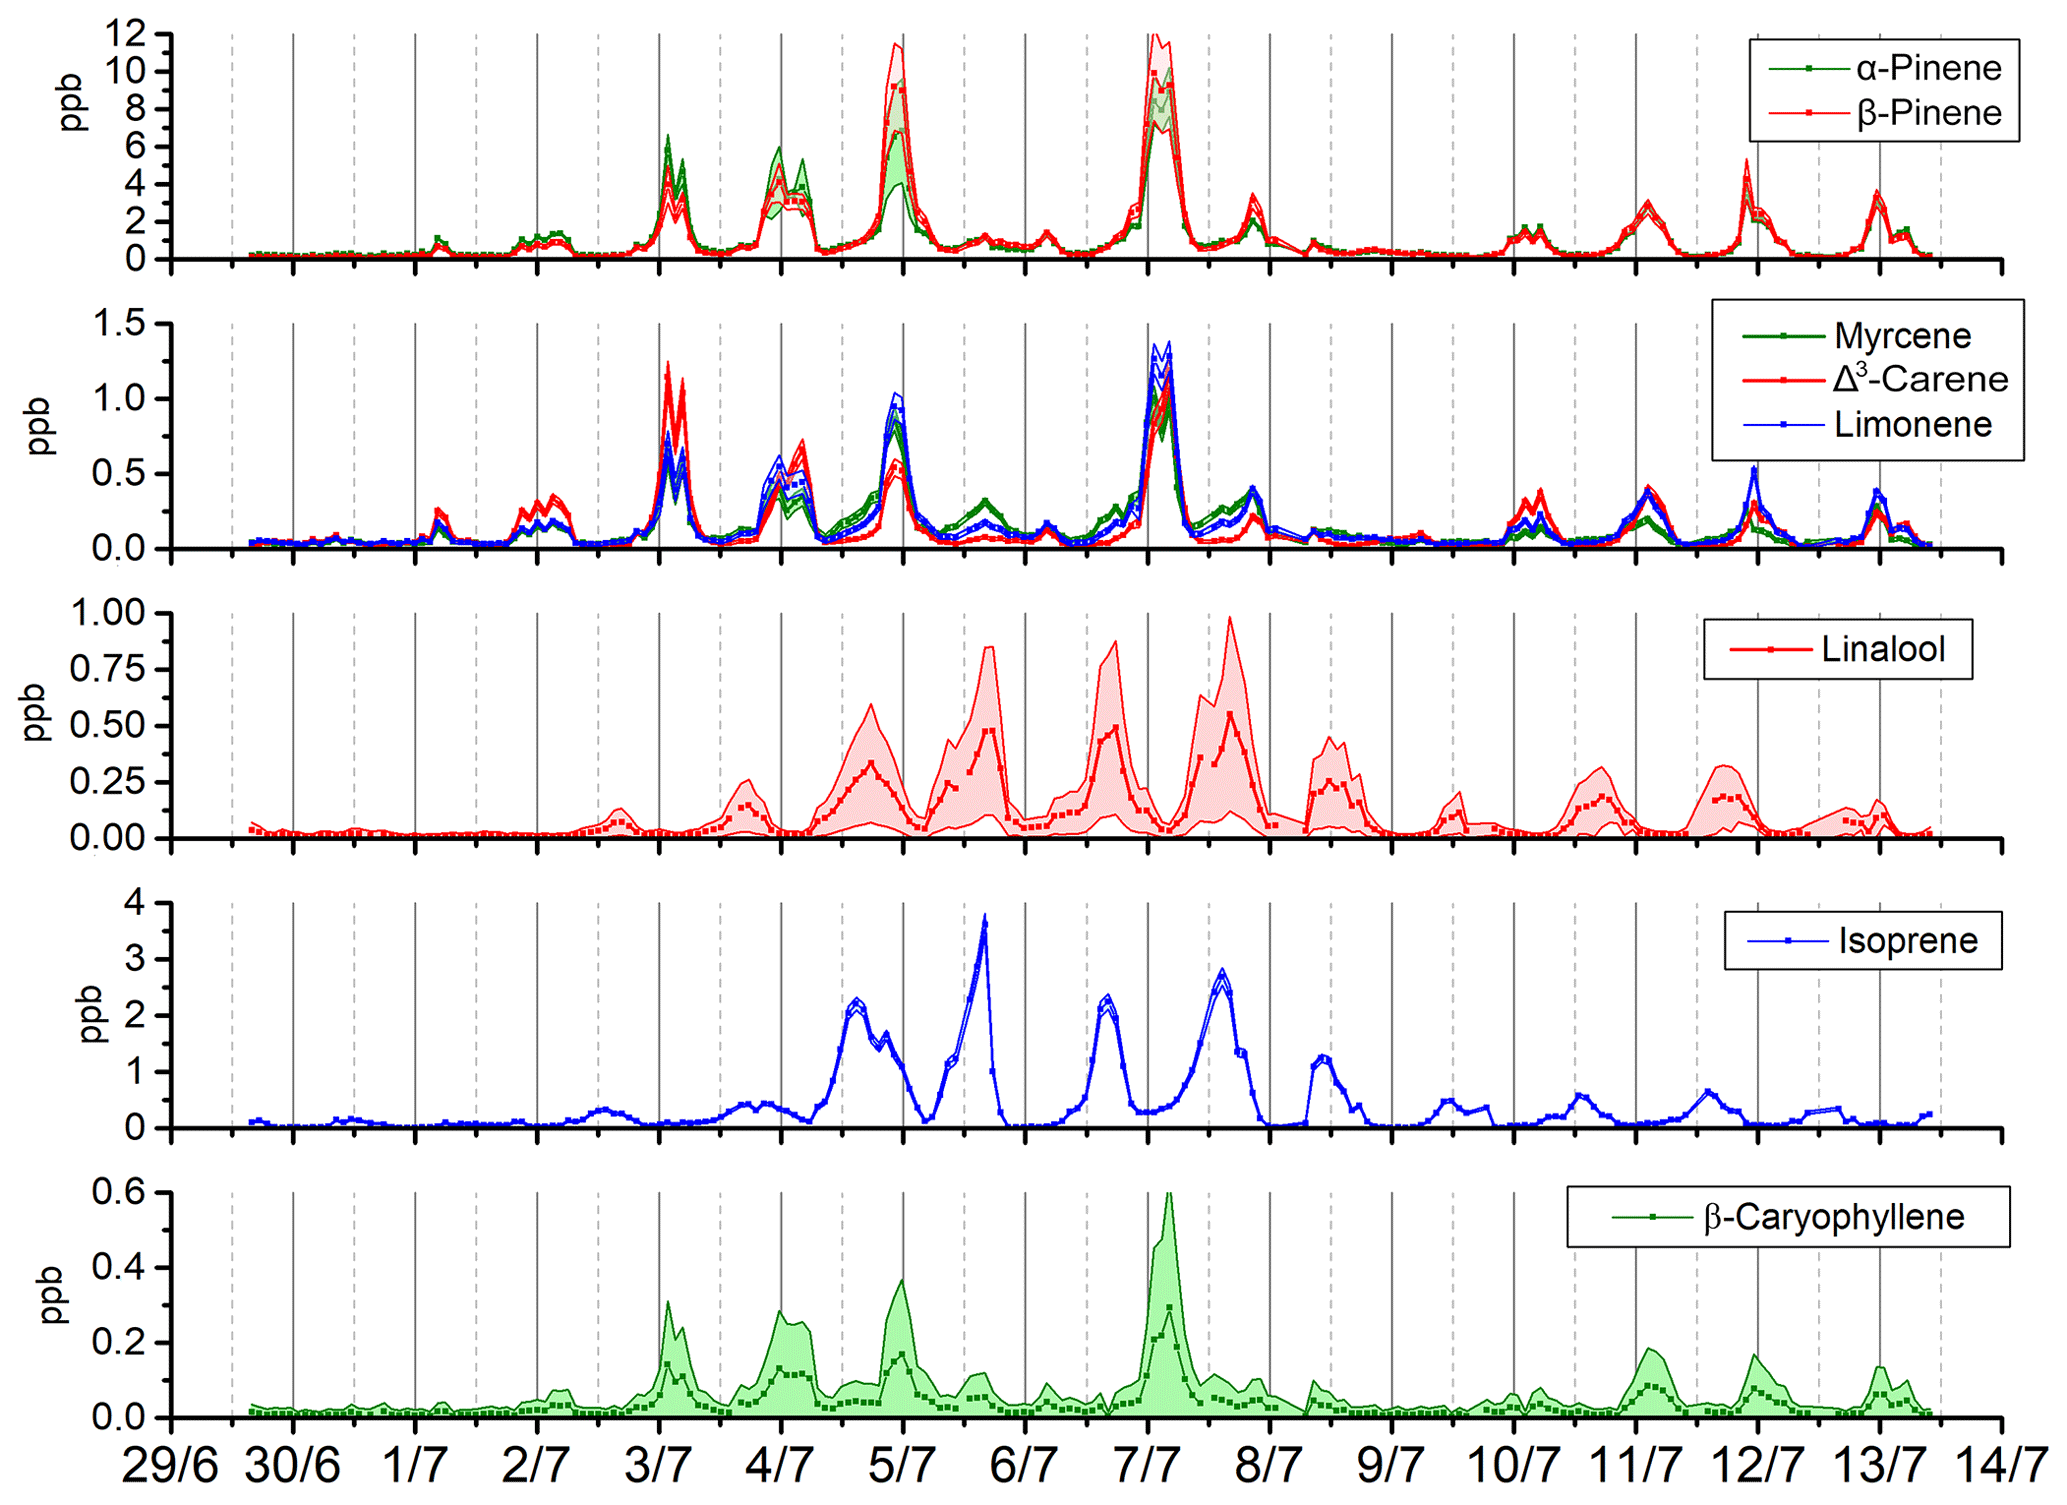
Figure 9Times series of concentrations showing their associated uncertainties (k=2) for a selection of BVOCs observed during the LANDEX campaign (β-pinene, α-pinene, limonene, myrcene, Δ3-carene, linalool, isoprene, and β-caryophyllene).
In order to give insight into the performance of the method, the time series of the uncertainty apportionment is shown for β-pinene for the whole campaign (see Fig. 8). As reported in Sect. 3.3, β-pinene uncertainty was driven by the precision term, but, depending on the period, the integration term became significant due to asymmetric peaks. The linearity term also had an important influence for mixing ratios higher than the calibration values.
To further evidence the high quality of the measurements performed during the campaign, expanded uncertainties were determined at the mean values for each BVOC. They were below 13 % for the six most abundant terpenes, with an excellent value of 4.6 % for α-pinene. For the six less abundant BVOCs, uncertainties ranged between 31 % and 160 %, due to concentration levels near the DL. The seven other BVOCs measured presented uncertainties between 23.5 % and 60 %, which still allowed for the observation of significant concentration variations during the campaign (Figs. 9 and S3).
Strong variations in the concentrations were observed for most compounds. α-Pinene, β-pinene, myrcene, Δ3-carene, limonene, p-cymene, camphene, citral, eucalyptol, ocimene, terpinolene, γ-terpinene, α-phellandrene, and β-caryophyllene showed the same pattern with a nocturnal maximum between 22:00 and 06:00 UTC. For linalool and isoprene, the daily profile presents a maximum between 10:00 and 20:00 UTC These results are consistent with previous observations of the most abundant monoterpenes at this site (Kammer, 2016; Kammer et al., 2018) in terms of concentrations and daily variations. Although this work allowed us to monitor (for the first time at this site) 20 selected BVOCs with a time resolution of 90 min and, thus, to provide a list of highly speciated BVOCs, their composition and time variations will be investigated in details in a following study in order to assess their contribution to SOA formation in the Landes forest.
An automated method based on thermal desorption coupled to a GC-FID for the online ambient measurement of 20 BVOCs with a 90 min time resolution was successfully developed and optimized. The analytical performances were satisfying for ambient measurements. Detection limits ranging from 4 ppt for α-pinene to 19 ppt for sabinene were obtained for a sampling volume of 1200 mL. Good repeatability was found, with a relative standard deviation below 5 % and a memory effect of less than 2 % for all compounds. Uncertainties were calculated and were found to be below 15 % for the six major terpenes. The other compounds presented relative uncertainties between 23.5 % and 110 % except for 2-carene (> 160 %). The major source of uncertainty was the calibration, which stresses the need for certified gaseous standards for a wider panel of BVOCs.
The first measurements using the developed method were carried out during the LANDEX episode 1 field campaign in summer 2017 at the Bilos site. The 3-week field measurements demonstrated the excellent performance of the methodology with respect to providing speciated BVOC concentration measurements to further investigate atmospheric BVOC reactivity. β-Pinene and α-pinene were the most abundant monoterpenes present, with concentrations ranging between 89 ppt and 9.9 ppb and between 157 ppt and 8.9 ppb respectively.
Data will be available in the atmospheric section of the AERIS website: https://www.aeris-data.fr/ (last acess: 21 November 2019).
The supplement related to this article is available online at: https://doi.org/10.5194/amt-12-6153-2019-supplement.
KM carried all of the experiments out with support from TL. SS and TS validated the uncertainty calculations and supported KM in carrying them out. PMF provided logistical support during the LANDEX campaign. SD, NL, EP, and EV supervised the study. KM prepared the paper with contributions from all co-authors.
The authors declare that they have no conflict of interest.
This study was supported by the French Environment and Energy Management Agency (ADEME), the CNRS-INSU LEFE-CHAT, and the LabEx COTE.
This paper was edited by Pierre Herckes and reviewed by three anonymous referees.
ACTRIS: WP4- NA4: Trace gases networking: Volatile organic carbon and nitrogen oxides Deliverable D4.9: Final SOPs for VOCs measurements, available at: http://fp7.actris.eu/Portals/97/deliverables/PU/WP4_D4.9_M42_ v2.pdf (last access: 11 November 2018), 2014.
Ait Mimoune, N., Ait Mimoune, D., and Yataghene, A.: Chemical composition and antimicrobial activity of the essential oils of Pinus pinaster, J. Coast. Life Med., 1, 55–59, https://doi.org/10.12980/JCLM.1.20133D322, 2013.
Apel, E. C., Calvert, J. G., Gilpin, T. M., Fehsenfeld, F. C., Parrish, D. D., and Lonneman, W. A.: The Nonmethane Hydrocarbon Intercomparison Experiment (NOMHICE): Task 3, J. Geophys. Res., 104, 26069–26086, https://doi.org/10.1029/1999JD900793, 1999.
Arrabal, C., García-Vallejo, M. C., Cadahia, E., Cortijo, M., and de Simón, B. F.: Characterization of two chemotypes of Pinus pinaster by their terpene and acid patterns in needles, Plant Syst. Evol., 298, 511–522, https://doi.org/10.1007/s00606-011-0562-8, 2012.
Atkinson, R. and Arey, J.: Gas-phase tropospheric chemistry of biogenic volatile organic compounds: a review, Atmos. Environ., 37, 197–219, https://doi.org/10.1016/S1352-2310(03)00391-1, 2003.
Atkinson, R., Baulch, D. L., Cox, R. A., Crowley, J. N., Hampson, R. F., Hynes, R. G., Jenkin, M. E., Rossi, M. J., Troe, J., and IUPAC Subcommittee: Evaluated kinetic and photochemical data for atmospheric chemistry: Volume II – gas phase reactions of organic species, Atmos. Chem. Phys., 6, 3625–4055, https://doi.org/10.5194/acp-6-3625-2006, 2006.
Blanch, J.-S., Sampedro, L., Llusià, J., Moreira, X., Zas, R., and Peñuelas, J.: Effects of phosphorus availability and genetic variation of leaf terpene content and emission rate in Pinus pinaster seedlings susceptible and resistant to the pine weevil, Hylobius abietis, Plant Biol., 14, 66–72, https://doi.org/10.1111/j.1438-8677.2011.00492.x, 2012.
Bouvier-Brown, N. C., Holzinger, R., Palitzsch, K., and Goldstein, A. H.: Quantifying sesquiterpene and oxygenated terpene emissions from live vegetation using solid-phase microextraction fibers, J. Chromatogr. A, 1161, 113–120, https://doi.org/10.1016/j.chroma.2007.05.094, 2007.
Bouvier-Brown, N. C., Goldstein, A. H., Gilman, J. B., Kuster, W. C., and de Gouw, J. A.: In-situ ambient quantification of monoterpenes, sesquiterpenes, and related oxygenated compounds during BEARPEX 2007: implications for gas- and particle-phase chemistry, Atmos. Chem. Phys., 9, 5505–5518, https://doi.org/10.5194/acp-9-5505-2009, 2009.
Carslaw, N., Creasey, D. J., Harrison, D., Heard, D. E., Hunter, M. C., Jacobs, P. J., Jenkin, M. E., Lee, J. D., Lewis, A. C., Pilling, M. J., Saunders, S. M., and Seakins, P. W.: OH and HO2 radical chemistry in a forested region of north-western Greece, Atmos. Environ., 35, 4725–4737, https://doi.org/10.1016/S1352-2310(01)00089-9, 2001.
Coeur, C., Jacob, V., Denis, I., and Foster, P.: Decomposition of α-pinene and sabinene on solid sorbents, tenax TA and carboxen, J. Chromatogr. A, 786, 185–187, https://doi.org/10.1016/S0021-9673(97)00562-1, 1997.
de Gouw, J. and Warneke, C.: Measurements of volatile organic compounds in the earth's atmosphere using proton-transfer-reaction mass spectrometry, Mass Spectrom. Rev., 26, 223–257, https://doi.org/10.1002/mas.20119, 2007.
Dettmer, K. and Engewald, W.: Adsorbent materials commonly used in air analysis for adsorptive enrichment and thermal desorption of volatile organic compounds, Anal. Bioanal. Chem., 373, 490–500, https://doi.org/10.1007/s00216-002-1352-5, 2002.
Di Carlo, P., Brune, W. H., Martinez, M., Harder, H., Lesher, R., Ren, X., Thornberry, T., Carroll, M. A., Young, V., Shepson, P. B., Riemer, D., Apel, E., and Campbell, C.: Missing OH Reactivity in a Forest: Evidence for Unknown Reactive Biogenic VOCs, Science, 304, 722–725, https://doi.org/10.1126/science.1094392, 2004.
Dusanter, S. and Stevens, P. S. : Recent Advances in the Chemistry of OH and HO2 Radicals in the Atmosphere: Field and Laboratory Measurements, in: Advances in Atmospheric Chemistry, World Scientific, 493–579, https://doi.org/10.1142/9789813147355_0007, 2017.
Edwards, P. M., Evans, M. J., Furneaux, K. L., Hopkins, J., Ingham, T., Jones, C., Lee, J. D., Lewis, A. C., Moller, S. J., Stone, D., Whalley, L. K., and Heard, D. E.: OH reactivity in a South East Asian tropical rainforest during the Oxidant and Particle Photochemical Processes (OP3) project, Atmos. Chem. Phys., 13, 9497–9514, https://doi.org/10.5194/acp-13-9497-2013, 2013.
EPA: Compendium Method TO-11A, Determination of Formaldehyde in Ambient Air Using Adsorbent Cartridge Followed by High Performance Liquid Chromatography (HPLC) [Active Sampling Methodology], 1–55, available at: https://www3.epa.gov/ttnamti1/files/ambient/airtox/to-11ar.pdf (last access: 11 November 2018), 1999.
European Standards: CSN EN 14662-3 – Ambient air – Standard method for the measurement of benzene concentrations – Part 3: Automated pumped sampling with in situ gas chromatography, 2015.
Gauss, M., Myhre, G., Isaksen, I. S. A., Grewe, V., Pitari, G., Wild, O., Collins, W. J., Dentener, F. J., Ellingsen, K., Gohar, L. K., Hauglustaine, D. A., Iachetti, D., Lamarque, F., Mancini, E., Mickley, L. J., Prather, M. J., Pyle, J. A., Sanderson, M. G., Shine, K. P., Stevenson, D. S., Sudo, K., Szopa, S., and Zeng, G.: Radiative forcing since preindustrial times due to ozone change in the troposphere and the lower stratosphere, Atmos. Chem. Phys., 6, 575–599, https://doi.org/10.5194/acp-6-575-2006, 2006.
GIEC: Fifth Assessment Report – Climate Change 2013, available at: http://ipcc.ch/report/ar5/wg1/, last access: 11 November 2018.
Greenberg, J. P., Guenther, A., Zimmerman, P., Baugh, W., Geron, C., Davis, K., Helmig, D., and Klinger, L. F.: Tethered balloon measurements of biogenic VOCs in the atmospheric boundary layer, Atmos. Environ., 33, 855–867, https://doi.org/10.1016/S1352-2310(98)00302-1, 1999.
Greenberg, J. P., Guenther, A. B., Pétron, G., Wiedinmyer, C., Vega, O., Gatti, L. V., Tota, J., and Fisch, G.: Biogenic VOC emissions from forested Amazonian landscapes, Glob. Change Biol., 10, 651–662, https://doi.org/10.1111/j.1365-2486.2004.00758.x, 2004.
Griffith, S. M., Hansen, R. F., Dusanter, S., Stevens, P. S., Alaghmand, M., Bertman, S. B., Carroll, M. A., Erickson, M., Galloway, M., Grossberg, N., Hottle, J., Hou, J., Jobson, B. T., Kammrath, A., Keutsch, F. N., Lefer, B. L., Mielke, L. H., O'Brien, A., Shepson, P. B., Thurlow, M., Wallace, W., Zhang, N., and Zhou, X. L.: OH and HO2 radical chemistry during PROPHET 2008 and CABINEX 2009 – Part 1: Measurements and model comparison, Atmos. Chem. Phys., 13, 5403–5423, https://doi.org/10.5194/acp-13-5403-2013, 2013.
Guenther, A., Hewitt, C.N., Erickson, D., Fall, R., Geron, C., Graedel, T., Harley, P., Klinger, L., Lerdau, M., Mckay, W. A., Pierce, T., Scholes, B., Steinbrecher, R., Tallamraju, R., Taylor, J., and Zimmerman, P.: A global model of natural volatile organic compound emissions, J. Geophys. Res., 100, 8873–8892, https://doi.org/10.1029/94JD02950, 1995.
Hakola, H., Tarvainen, V., Bäck, J., Ranta, H., Bonn, B., Rinne, J., and Kulmala, M.: Seasonal variation of mono- and sesquiterpene emission rates of Scots pine, Biogeosciences, 3, 93–101, https://doi.org/10.5194/bg-3-93-2006, 2006.
Hakola, H., Tarvainen, V., Praplan, A. P., Jaars, K., Hemmilä, M., Kulmala, M., Bäck, J., and Hellén, H.: Terpenoid and carbonyl emissions from Norway spruce in Finland during the growing season, Atmos. Chem. Phys., 17, 3357–3370, https://doi.org/10.5194/acp-17-3357-2017, 2017.
Hansen, R. F., Griffith, S. M., Dusanter, S., Rickly, P. S., Stevens, P. S., Bertman, S. B., Carroll, M. A., Erickson, M. H., Flynn, J. H., Grossberg, N., Jobson, B. T., Lefer, B. L., and Wallace, H. W.: Measurements of total hydroxyl radical reactivity during CABINEX 2009 – Part 1: field measurements, Atmos. Chem. Phys., 14, 2923–2937, https://doi.org/10.5194/acp-14-2923-2014, 2014.
Hellén, H., Kuronen, P., and Hakola, H.: Heated stainless steel tube for ozone removal in the ambient air measurements of mono- and sesquiterpenes, Atmos. Environ., 57, 35–40, https://doi.org/10.1016/j.atmosenv.2012.04.019, 2012.
Helmig, D.: Ozone removal techniques in the sampling of atmospheric volatile organic trace gases, Atmos. Environ., 31, 3635–3651, https://doi.org/10.1016/S1352-2310(97)00144-1, 1997.
Hens, K., Novelli, A., Martinez, M., Auld, J., Axinte, R., Bohn, B., Fischer, H., Keronen, P., Kubistin, D., Nölscher, A. C., Oswald, R., Paasonen, P., Petäjä, T., Regelin, E., Sander, R., Sinha, V., Sipilä, M., Taraborrelli, D., Tatum Ernest, C., Williams, J., Lelieveld, J., and Harder, H.: Observation and modelling of HOx radicals in a boreal forest, Atmos. Chem. Phys., 14, 8723–8747, https://doi.org/10.5194/acp-14-8723-2014, 2014.
Hoerger, C. C., Claude, A., Plass-Duelmer, C., Reimann, S., Eckart, E., Steinbrecher, R., Aalto, J., Arduini, J., Bonnaire, N., Cape, J. N., Colomb, A., Connolly, R., Diskova, J., Dumitrean, P., Ehlers, C., Gros, V., Hakola, H., Hill, M., Hopkins, J. R., Jäger, J., Junek, R., Kajos, M. K., Klemp, D., Leuchner, M., Lewis, A. C., Locoge, N., Maione, M., Martin, D., Michl, K., Nemitz, E., O'Doherty, S., Pérez Ballesta, P., Ruuskanen, T. M., Sauvage, S., Schmidbauer, N., Spain, T. G., Straube, E., Vana, M., Vollmer, M. K., Wegener, R., and Wenger, A.: ACTRIS non-methane hydrocarbon intercomparison experiment in Europe to support WMO GAW and EMEP observation networks, Atmos. Meas. Tech., 8, 2715–2736, https://doi.org/10.5194/amt-8-2715-2015, 2015.
Hoffmann, T., Odum, J. R., Bowman, F., Collins, D., Klockow, D., Flagan, R. C., and Seinfeld, J. H.: Formation of Organic Aerosols from the Oxidation of Biogenic Hydrocarbons, J. Atmos. Chem., 26, 189–222, https://doi.org/10.1023/A:1005734301837, 1997.
Hopkins, J. R., Jones, C. E., and Lewis, A. C.: A dual channel gas chromatograph for atmospheric analysis of volatile organic compounds including oxygenated and monoterpene compounds, J. Environ. Monitor., 13, 2268–2276, https://doi.org/10.1039/C1EM10050E, 2011.
Houweling, S., Dentener, F., and Lelieveld, J.: The impact of nonmethane hydrocarbon compounds on tropospheric photochemistry, J. Geophys. Res.-Atmos., 103, 10673–10696, https://doi.org/10.1029/97JD03582, 1998.
Jones, C. E., Kato, S., Nakashima, Y., and Kajii, Y.: A novel fast gas chromatography method for higher time resolution measurements of speciated monoterpenes in air, Atmos. Meas. Tech., 7, 1259–1275, https://doi.org/10.5194/amt-7-1259-2014, 2014.
Kammer, J.: LANDEX : study of Secondary Organic Aerosols (SOAs) generated by the Landes forest, PhD Thesis, Université de Bordeaux, France, 258 pp., 2016.
Kammer, J., Perraudin, E., Flaud, P.-M., Lamaud, E., Bonnefond, J. M., and Villenave, E.: Observation of nighttime new particle formation over the French Landes forest, Sci. Total Environ., 621, 1084–1092, https://doi.org/10.1016/j.scitotenv.2017.10.118, 2018.
Kazil, J., Stier, P., Zhang, K., Quaas, J., Kinne, S., O'Donnell, D., Rast, S., Esch, M., Ferrachat, S., Lohmann, U., and Feichter, J.: Aerosol nucleation and its role for clouds and Earth's radiative forcing in the aerosol-climate model ECHAM5-HAM, Atmos. Chem. Phys., 10, 10733–10752, https://doi.org/10.5194/acp-10-10733-2010, 2010.
Kesselmeier, J. and Staudt, M.: Biogenic Volatile Organic Compounds (VOC): An Overview on Emission, Physiology and Ecology, J. Atmos. Chem., 33, 23–88, https://doi.org/10.1023/A:1006127516791, 1999.
Kim, S., Karl, T., Helmig, D., Daly, R., Rasmussen, R., and Guenther, A.: Measurement of atmospheric sesquiterpenes by proton transfer reaction-mass spectrometry (PTR-MS), Atmos. Meas. Tech., 2, 99–112, https://doi.org/10.5194/amt-2-99-2009, 2009.
Kleinhentz, M., Jactel, H., and Menassieu, P.: Terpene Attractant Candidates of Dioryctria sylvestrella in Maritime Pine (Pinus pinaster) Oleoresin, Needles, Liber, and Headspace Samples, J. Chem. Ecol., 25, 2741–2756, https://doi.org/10.1023/A:1020803608406, 1999.
Koppmann, R.: Volatile Organic Compounds in the Atmosphere, Blackwell Publishing Ltd. ed., John Wiley & Sons, 2007.
Lamarque, J.-F., Bond, T. C., Eyring, V., Granier, C., Heil, A., Klimont, Z., Lee, D., Liousse, C., Mieville, A., Owen, B., Schultz, M. G., Shindell, D., Smith, S. J., Stehfest, E., Van Aardenne, J., Cooper, O. R., Kainuma, M., Mahowald, N., McConnell, J. R., Naik, V., Riahi, K., and van Vuuren, D. P.: Historical (1850–2000) gridded anthropogenic and biomass burning emissions of reactive gases and aerosols: methodology and application, Atmos. Chem. Phys., 10, 7017–7039, https://doi.org/10.5194/acp-10-7017-2010, 2010.
Lee, J. H., Batterman, S. A., Jia, C., and Chernyak, S.: Ozone Artifacts and Carbonyl Measurements Using Tenax GR, Tenax TA, Carbopack B, and Carbopack X Adsorbents, J. Air Waste Manage., 56, 1503–1517, https://doi.org/10.1080/10473289.2006.10464560, 2006.
Lelieveld, J., Butler, T. M., Crowley, J. N., Dillon, T. J., Fischer, H., Ganzeveld, L., Harder, H., Lawrence, M. G., Martinez, M., Taraborrelli, D., and Williams, J.: Atmospheric oxidation capacity sustained by a tropical forest, Nature, 452, 737–740, https://doi.org/10.1038/nature06870, 2008.
Lou, S., Holland, F., Rohrer, F., Lu, K., Bohn, B., Brauers, T., Chang, C. C., Fuchs, H., Häseler, R., Kita, K., Kondo, Y., Li, X., Shao, M., Zeng, L., Wahner, A., Zhang, Y., Wang, W., and Hofzumahaus, A.: Atmospheric OH reactivities in the Pearl River Delta – China in summer 2006: measurement and model results, Atmos. Chem. Phys., 10, 11243–11260, https://doi.org/10.5194/acp-10-11243-2010, 2010.
Mallet, M., Dulac, F., Formenti, P., Nabat, P., Sciare, J., Roberts, G., Pelon, J., Ancellet, G., Tanré, D., Parol, F., Denjean, C., Brogniez, G., di Sarra, A., Alados-Arboledas, L., Arndt, J., Auriol, F., Blarel, L., Bourrianne, T., Chazette, P., Chevaillier, S., Claeys, M., D'Anna, B., Derimian, Y., Desboeufs, K., Di Iorio, T., Doussin, J.-F., Durand, P., Féron, A., Freney, E., Gaimoz, C., Goloub, P., Gómez-Amo, J. L., Granados-Muñoz, M. J., Grand, N., Hamonou, E., Jankowiak, I., Jeannot, M., Léon, J.-F., Maillé, M., Mailler, S., Meloni, D., Menut, L., Momboisse, G., Nicolas, J., Podvin, T., Pont, V., Rea, G., Renard, J.-B., Roblou, L., Schepanski, K., Schwarzenboeck, A., Sellegri, K., Sicard, M., Solmon, F., Somot, S., Torres, B., Totems, J., Triquet, S., Verdier, N., Verwaerde, C., Waquet, F., Wenger, J., and Zapf, P.: Overview of the Chemistry-Aerosol Mediterranean Experiment/Aerosol Direct Radiative Forcing on the Mediterranean Climate (ChArMEx/ADRIMED) summer 2013 campaign, Atmos. Chem. Phys., 16, 455–504, https://doi.org/10.5194/acp-16-455-2016, 2016.
Mao, J., Ren, X., Zhang, L., Van Duin, D. M., Cohen, R. C., Park, J.-H., Goldstein, A. H., Paulot, F., Beaver, M. R., Crounse, J. D., Wennberg, P. O., DiGangi, J. P., Henry, S. B., Keutsch, F. N., Park, C., Schade, G. W., Wolfe, G. M., Thornton, J. A., and Brune, W. H.: Insights into hydroxyl measurements and atmospheric oxidation in a California forest, Atmos. Chem. Phys., 12, 8009–8020, https://doi.org/10.5194/acp-12-8009-2012, 2012.
Materić, D., Lanza, M., Sulzer, P., Herbig, J., Bruhn, D., Turner, C., Mason, N., and Gauci, V.: Monoterpene separation by coupling proton transfer reaction time-of-flight mass spectrometry with fastGC, Anal. Bioanal. Chem., 407, 7757–7763, https://doi.org/10.1007/s00216-015-8942-5, 2015.
McGlenny, W. A., Pleil, J. D., Evans, G. F., Oliver, K. D., Holdren, M. W., and Winberry, W. T.: Canister-Based Method for Monitoring Toxic VOCs in Ambient Air, J. Air Waste Manag. Assoc., 41, 1308–1318, https://doi.org/10.1080/10473289.1991.10466924, 1991.
Messina, P., Lathière, J., Sindelarova, K., Vuichard, N., Granier, C., Ghattas, J., Cozic, A., and Hauglustaine, D. A.: Global biogenic volatile organic compound emissions in the ORCHIDEE and MEGAN models and sensitivity to key parameters, Atmos. Chem. Phys., 16, 14169–14202, https://doi.org/10.5194/acp-16-14169-2016, 2016.
Misztal, P. K., Owen, S. M., Guenther, A. B., Rasmussen, R., Geron, C., Harley, P., Phillips, G. J., Ryan, A., Edwards, D. P., Hewitt, C. N., Nemitz, E., Siong, J., Heal, M. R., and Cape, J. N.: Large estragole fluxes from oil palms in Borneo, Atmos. Chem. Phys., 10, 4343–4358, https://doi.org/10.5194/acp-10-4343-2010, 2010.
Moreaux, V., Lamaud, É., Bosc, A., Bonnefond, J.-M., Medlyn, B. E., and Loustau, D.: Paired comparison of water, energy and carbon exchanges over two young maritime pine stands (Pinus pinaster Ait.): effects of thinning and weeding in the early stage of tree growth, Tree Physiol., 31, 903–921, https://doi.org/10.1093/treephys/tpr048, 2011.
Nölscher, A. C., Williams, J., Sinha, V., Custer, T., Song, W., Johnson, A. M., Axinte, R., Bozem, H., Fischer, H., Pouvesle, N., Phillips, G., Crowley, J. N., Rantala, P., Rinne, J., Kulmala, M., Gonzales, D., Valverde-Canossa, J., Vogel, A., Hoffmann, T., Ouwersloot, H. G., Vilà-Guerau de Arellano, J., and Lelieveld, J.: Summertime total OH reactivity measurements from boreal forest during HUMPPA-COPEC 2010, Atmos. Chem. Phys., 12, 8257–8270, https://doi.org/10.5194/acp-12-8257-2012, 2012.
Ormeño, E., Céspedes, B., Sánchez, I. A., Velasco-García, A., Moreno, J. M., Fernandez, C., and Baldy, V.: The relationship between terpenes and flammability of leaf litter, Forest Ecol. Manag., 257, 471–482, https://doi.org/10.1016/j.foreco.2008.09.019, 2009.
Pankow, J. F., Luo, W., Melnychenko, A. N., Barsanti, K. C., Isabelle, L. M., Chen, C., Guenther, A. B., and Rosenstiel, T. N.: Volatilizable Biogenic Organic Compounds (VBOCs) with two dimensional Gas Chromatography-Time of Flight Mass Spectrometry (GC × GC-TOFMS): sampling methods, VBOC complexity, and chromatographic retention data, Atmos. Meas. Tech., 5, 345–361, https://doi.org/10.5194/amt-5-345-2012, 2012.
Park, J.-H., Fares, S., Weber, R., and Goldstein, A. H.: Biogenic volatile organic compound emissions during BEARPEX 2009 measured by eddy covariance and flux–gradient similarity methods, Atmos. Chem. Phys., 14, 231–244, https://doi.org/10.5194/acp-14-231-2014, 2014.
Plass-Dülmer, C., Michl, K., Ruf, R., and Berresheim, H.: C2–C8 Hydrocarbon measurement and quality control procedures at the Global Atmosphere Watch Observatory Hohenpeissenberg, J. Chromatogr. A, 953, 175–197, https://doi.org/10.1016/S0021-9673(02)00128-0, 2002.
Rhoderick, G. C. and Lin, J.: Stability Assessment of Gas Mixtures Containing Monoterpenes in Varying Cylinder Materials and Treatments, Anal. Chem., 85, 4675–4685, https://doi.org/10.1021/ac400324v, 2013.
Saxton, J. E., Lewis, A. C., Kettlewell, J. H., Ozel, M. Z., Gogus, F., Boni, Y., Korogone, S. O. U., and Serça, D.: Isoprene and monoterpene measurements in a secondary forest in northern Benin, Atmos. Chem. Phys., 7, 4095–4106, https://doi.org/10.5194/acp-7-4095-2007, 2007.
Simon, V., Clement, B., Riba, M.-L., and Torres, L.: The Landes experiment: Monoterpenes emitted from the maritime pine, J. Geophys. Res., 99, 16501–16510, https://doi.org/10.1029/94JD00785, 1994.
Sindelarova, K., Granier, C., Bouarar, I., Guenther, A., Tilmes, S., Stavrakou, T., Müller, J.-F., Kuhn, U., Stefani, P., and Knorr, W.: Global data set of biogenic VOC emissions calculated by the MEGAN model over the last 30 years, Atmos. Chem. Phys., 14, 9317–9341, https://doi.org/10.5194/acp-14-9317-2014, 2014.
Sinha, V., Williams, J., Lelieveld, J., Ruuskanen, T.M., Kajos, M.K., Patokoski, J., Hellen, H., Hakola, H., Mogensen, D., Boy, M., Rinne, J., and Kulmala, M.: OH Reactivity Measurements within a Boreal Forest: Evidence for Unknown Reactive Emissions, Environ. Sci. Technol., 44, 6614–6620, https://doi.org/10.1021/es101780b, 2010.
Stavrakou, T., Peeters, J., and Müller, J.-F.: Improved global modelling of HOx recycling in isoprene oxidation: evaluation against the GABRIEL and INTEX-A aircraft campaign measurements, Atmos. Chem. Phys., 10, 9863–9878, https://doi.org/10.5194/acp-10-9863-2010, 2010.
Tan, D., Faloona, I., Simpas, J. B., Brune, W., Shepson, P. B., Couch, T. L., Sumner, A. L., Carroll, M. A., Thornberry, T., Apel, E., Riemer, D., and Stockwell, W.: HOx budgets in a deciduous forest: Results from the PROPHET summer 1998 campaign, J. Geophys. Res., 106, 24407–24427, https://doi.org/10.1029/2001JD900016, 2001.
Taraborrelli, D., Lawrence, M. G., Crowley, J. N., Dillon, T. J., Gromov, S., Groß, C. B. M., Vereecken, L., and Lelieveld, J.: Hydroxyl radical buffered by isoprene oxidation over tropical forests, Nat. Geosci., 5, 190–193, https://doi.org/10.1038/ngeo1405, 2012.
Wolfe, G. M., Cantrell, C., Kim, S., Mauldin III, R. L., Karl, T., Harley, P., Turnipseed, A., Zheng, W., Flocke, F., Apel, E. C., Hornbrook, R. S., Hall, S. R., Ullmann, K., Henry, S. B., DiGangi, J. P., Boyle, E. S., Kaser, L., Schnitzhofer, R., Hansel, A., Graus, M., Nakashima, Y., Kajii, Y., Guenther, A., and Keutsch, F. N.: Missing peroxy radical sources within a summertime ponderosa pine forest, Atmos. Chem. Phys., 14, 4715–4732, https://doi.org/10.5194/acp-14-4715-2014, 2014.
Zannoni, N., Gros, V., Sarda Esteve, R., Kalogridis, C., Michoud, V., Dusanter, S., Sauvage, S., Locoge, N., Colomb, A., and Bonsang, B.: Summertime OH reactivity from a receptor coastal site in the Mediterranean Basin, Atmos. Chem. Phys., 17, 12645–12658, https://doi.org/10.5194/acp-17-12645-2017, 2017.
Zhou, P., Ganzeveld, L., Taipale, D., Rannik, Ü., Rantala, P., Rissanen, M. P., Chen, D., and Boy, M.: Boreal forest BVOC exchange: emissions versus in-canopy sinks, Atmos. Chem. Phys., 17, 14309–14332, https://doi.org/10.5194/acp-17-14309-2017, 2017.