the Creative Commons Attribution 4.0 License.
the Creative Commons Attribution 4.0 License.
 | 03 Mar 2020
Portable calibrator for NO based on the photolysis of N2O and a combined NO2∕NO∕O3 source for field calibrations of air pollution monitors
John W. Birks
Andrew A. Turnipseed
Peter C. Andersen
Craig J. Williford
Stanley Strunk
Brian Carpenter
Christine A. Ennis
A highly portable calibration source of nitric oxide (NO) based on the photolysis of nitrous oxide (N2O) supplied by 8 or 16 g disposable cartridges is demonstrated to serve as an accurate and reliable transfer standard for the calibration of NO monitors in the field. The instrument provides output mixing ratios in the range 0–1000 ppb with a precision and accuracy better than the greater of 3 ppb or 3 % of the target NO mixing ratio over a wide range of environmental conditions of ambient temperature (8.5–35.0 ∘C), pressure (745–1015 mbar corresponding to 2.7–0.0 km of elevation), and relative humidity (0 %–100 % RH). The combination of the NO calibration source with a previously described ozone calibration source based on the photolysis of oxygen in air provides a new instrument capable of outputting calibrated mixing ratios of NO, ozone (O3), and nitrogen dioxide (NO2), where the NO2 is produced by the stoichiometric gas-phase reaction of NO with O3. The portable calibration source requires no external gas cylinders and can be used for calibrations of NO, NO2, and O3 instruments for mixing ratios up to 1000, 500, and 1000 ppb, respectively. This portable calibrator may serve as a convenient transfer standard for field calibrations of ozone and NOx air pollution monitors.
- Article
(4014 KB) - Full-text XML
- BibTeX
- EndNote


Measurements of gaseous nitric oxide (NO), nitrogen dioxide (NO2), and ozone (O3) are critical in numerous fields. NO is a direct combustion product that is readily oxidized in air to form NO2. Ground-level ozone is produced by the photochemical interactions between NOx (NO+NO2) and organic compounds in sunlight (Haagen-Smit, 1957). Both NO2 and O3 are known to produce several cardiac and respiratory ailments (both acute and chronic) and are classified as “criteria pollutants”; their atmospheric levels are regulated by the U.S. Environmental Protection Agency (U.S. EPA) and corresponding regulatory agencies around the world. Verification of compliance with these regulations requires a comprehensive and continuous monitoring system of both ambient atmospheric levels and NOx emissions from industrial combustion sources (often referred to as CEMS – continuous emissions monitoring). Routine NOx monitoring is also required for safety reasons in settings where diesel engines and machinery are used in confined areas, such as in the mining industry. Nitric oxide is used in the medical field where it is approved by the U.S. Food and Drug Administration for the treatment of adult pulmonary arterial hypertension (Abman, 2013) and for persistent pulmonary hypertension in hypoxic-term and near-term newborns (“blue babies”) (Clark et al., 2000). During this inhalation therapy, the concentration of NO (typically 20 ppm) must be continuously monitored during administration, and, very importantly, the concentration of its toxic impurity NO2 must also be continuously monitored and kept below 3 ppm (preferably much lower due to the acute NO2 toxicity).
In all these applications, accurate monitoring of NO, NO2, and O3 not only requires stable, robust chemical analyzers, but also a way to test the validity of the analyzer response periodically using a standardized calibration method. Ideally, this is done by introducing gaseous standards with well-known concentrations of the analyte of interest. The frequency of calibration depends upon the species being measured and the instrumental approach. A detailed discussion of ozone detection methods and calibration protocols is given in a previous publication describing a portable ozone calibrator (Birks et al., 2018b) and will not be repeated here. In the past, NOx calibration methods were developed primarily for use with analyzers based on the chemiluminescence (CL) reaction of NO with an excess of ozone, which is the most widely used method for quantifying NO and, following its conversion to NO, NO2 (Fontijn et al., 1970; Ridley and Howlett, 1974; Kley and McFarland, 1980; Steffenson and Stedman, 1974; Demerjian, 2000). These analyzers require relatively frequent calibrations to assess both the basic instrumental sensitivity drift for NO and the NO2 conversion efficiency.
The calibration of monitors for NO is typically achieved by the use of gas standards. A well-known problem with NO gas standards is that NO is unstable in gas cylinders at low concentrations; when NO standards are prepared at low parts per billion (ppb) levels, there is a strong tendency for the concentration of NO in the cylinder to decline with time even though the NO is diluted into an unreactive gas such as nitrogen (e.g., Robertson et al., 1977). This is because NO is thermodynamically unstable with respect to disproportionation to form N2O and NO2 according to the equilibrium (Burkholder et al., 2015):
Although extremely slow in the gas phase, this reaction may be catalyzed on the interior walls of compressed gas cylinders. The walls may be treated to slow the reaction, but the treatment is not always effective, and one cannot be certain that the concentration of NO in a gas cylinder is what it was when the cylinder was last analyzed. Furthermore, even trace amounts of oxygen (O2) in the diluent gas can react to oxidize NO to NO2 according to the reaction (Atkinson et al., 2004)
Because of Reaction (R2), compressed gas standards for NO cannot be made with air as the diluent. This is a disadvantage since it is desirable to calibrate NO instruments using the same diluent gas as the gas being analyzed, which most commonly is air. Nitric oxide standards are much more stable at high concentrations; thus, it is common to prepare gas standards at a high parts per million level in an unreactive diluent gas such as N2 and then dynamically dilute that standard with air prior to entering the analytical instrument being calibrated. Even at high parts per million levels, NIST-certified NO gas standards are typically only certified for 1–2 years. Although the dynamic dilution method works quite well, it is difficult to use as a portable transfer standard due to the need for a cylinder of certified NO gas mixture and the need for accurately calibrated flowmeters, whose response can vary with temperature.
Nitrogen dioxide gas standards in standard passivated aluminum cylinders are known to degrade over a relatively short period of time regardless of concentration (U.S. EPA, 2019). The development of an NO2 primary reference standard and subsequent calibration traceability protocols is an ongoing project (U.S. EPA, 2019). Historically, the U.S. EPA has recommended two methods for the dynamic multipoint calibration of NO2 analyzers based on chemiluminescence (Ellis, 1975; U.S. EPA, 1983): one based on a permeation tube source of NO2 and another based on the gas-phase titration (GPT) technique. Although the permeation tube source has found acceptance in certain areas (e.g., mine safety; Chilton et al., 2005), the difficulty of producing stable and reproducible NO2 outputs from permeation tubes has precluded them from widespread use. The GPT technique is almost exclusively used for calibrating analyzers for compliance with the U.S. Clean Air Act. In the GPT method, the instrument is first calibrated for NO by the dynamic dilution of a high-concentration NO∕N2 gas standard traceable to a NIST Standard Reference Material (SRM) with NOx-free air. The instrument is then calibrated for NO2 by the addition of varying concentrations of ozone to an excess of NO. The 1:1 stoichiometric conversion of NO to NO2 via the reaction of NO with O3 (Burkholder et al., 2015),
forms the basis of the calibration. Ozone concentrations are generated by the photolysis of O2 (typically from air) and added to an excess of NO while allowing for sufficient mixing time so that Reaction (R3) goes to completion. Nitrogen dioxide is calibrated based on the increase in NO2 signal (NOx – NO in CL analyzers) relative to the decrease in the NO signal (U.S. EPA, 2002). The NO2 formed should equal the NO consumed if the NO2 conversion efficiency to NO of the analyzer to be calibrated is unity. Incomplete conversion yields [NO2]formed < [NO]consumed such that using the GPT reaction as a calibration incorporates a measure of the conversion efficiency in analyzers for which NO is monitored (i.e., CL analyzers). However, as with the case above concerning NO, a portable means of NO2 calibration via the GPT method requires a NIST SRM NO gas mixture, a source of purified air, some type of ozone generator, and accurate mass flow controllers.
More recently, several new techniques that directly measure NO2 based on variations of UV absorption (e.g., cavity ring-down and cavity-attenuated phase-shift spectroscopy) have become available (Paldus and Kachanov, 2006; Kebabian et al., 2005, 2008). However, many of these do not measure NO. Therefore, for NO2-only analyzers the GPT calibration method requires either (1) a second instrument that can measure the loss of NO or (2) a NIST-traceable ozone source such that the loss of ozone can be correlated with the formation of NO2. Note that the standard GPT calibration procedures can still be applied to methods that directly measure NO2 and then indirectly measure NO (the opposite of the chemiluminescence technique) – such as in the long-path folded tubular photometer (FTP) developed in our group that measures direct NO2 absorbance at 405 nm (Birks et al., 2018a).
In this paper we will initially describe and evaluate a portable calibration source for nitric oxide based on the photolysis of N2O (the 2B Technologies Model 408 Nitric Oxide Calibration Source™; Andersen et al., 2019) and show that it is suitable to be used as a field transfer calibration standard. An advantage of this approach to NO calibration is that the nitrous oxide can be supplied by an 8 or 16 g cartridge (e.g., whipped-cream chargers), thereby eliminating the need for a compressed gas cylinder. The result is a highly portable NO calibrator. Recently, we have combined this Model 408 NO Calibration Source with a Model 306 O3 Calibration Source™ (described in Birks et al., 2018b) to produce a GPT NO2 calibrator (the Model 714 Calibration Source™). Here we evaluate the feasibility of using this instrument as a portable transfer standard for NO2 without the requirements of having a certified gas standard and accurately calibrated mass flow controllers, thus increasing the portability of the transfer standard. Finally, we show that combining the O3 calibrator and the NO calibrator into one instrument enables the user to perform robust calibrations for all three gases (NO2, NO, and O3) using just one highly portable instrument suitable for laboratory or field applications.
2.1 Nitric oxide (NO) calibration
The Model 408 Nitric Oxide Calibration Source™ (2B Technologies, Boulder, Colorado) makes use of a low-pressure mercury (Hg) lamp to photolyze pure nitrous oxide (N2O) to produce NO. The vacuum UV emission lines of mercury near 184.9 nm are absorbed by N2O to produce electronically excited oxygen atoms, O(1D),
where hν symbolizes a photon of light. These highly energetic oxygen atoms react with N2O with a near-collisional reaction rate coefficient ( cm3 molec−1 s−1) to form three different sets of products:
with the branching ratios (ϕ) shown (Burkholder et al., 2015). Since Reaction (R5a) produces two NO molecules, the overall quantum yield for NO production is approximately 1.22. The NO calibration source is similar in design to our ozone calibrator (Birks et al., 2018b), as both make use of the 184.9 nm line of a low-pressure mercury lamp. An important fundamental difference is that the 184.9 nm absorption cross section for N2O is approximately 14 times larger than that of O2. The absorption cross section, σ, of N2O at the 184.9 nm mercury emission line is cm2 molec−1 (Creasey et al., 2000; Cantrell et al., 1997) compared to cm2 molec−1 for O2 (Yoshino et al., 1992, Creasey et al., 2000). Also, O2 is only 21 % of the air that passes through the photolysis chamber in the ozone calibrator, while N2O is supplied to the photolysis chamber by a source that is >99 % N2O. The result is that the N2O gas absorbs the 185 nm light ∼70 times stronger than does O2 in air. At 298 K and 1 atm, the molecular concentration, c, is 2.46×10¹⁹ molec cm−3; thus, the absorption of 184.9 nm light from the low-pressure mercury lamp becomes optically thick (1∕e attenuation) at a path length, 1∕(σc), of 0.3 cm, and 99 % of the light is absorbed for a path length of 1.35 cm. Under such conditions, the rate of production of NO (molec cm−3 s−1) depends almost entirely on the lamp intensity and is independent of flow rate (i.e., residence time in the photolysis cell). The NO∕N2O stream exiting the photolysis chamber is diluted into NOx-scrubbed air to produce the desired output concentration of NO in air. At constant flow rates of N2O and the dilution air, the concentration of NO in the calibrator's output is varied by merely changing the lamp intensity.
We typically observe a small amount of NO2 produced from the NO photolytic generator (≤3 % of the NO produced). This is likely due to the formation of O(3P) atoms in the photolysis cell, which combine with NO via the reaction
where M is a third body, most likely N2O in this case. O(3P) atoms can arise from several possible sources. Nishida et al. (2004) report a quantum yield for O(3P) from N2O photolysis of 0.005±0.002 (i.e., %). Quenching of O(1D) to O(3P) by N2O (Reaction R5c) likely contributes up to another 0.8 % (Vranckx et al., 2008, report a limit of ϕ5c<0.01 at 298 K). Oxygen (O2), which is a typical N2O impurity, can also photolyze to produce two O(3P) atoms. Even NO itself could be photolyzed at 184.9 nm cm2 molec−1, thermodynamic dissociation threshold of 189.7 nm; Iida et al., 1986 and Burkholder et al., 2015) to produce O(3P) atoms; however, this would be expected to be of lesser importance due to the relatively lower NO concentrations (ppm) within the photolysis cell. In all of these cases, the amount of NO2 formed relative to NO should be small and approximately constant over time.
A final issue pertains specifically to CL NO analyzers for which the presence of N2O can lead to collisional quenching of the chemiluminescence signal. Clyne et al. (1964) report that N2O quenches the NO∕O3 chemiluminescence 2.6 and 2.9 times more efficiently than O2 and N2, respectively. Therefore, a mixture of 1.5 % N2O in air (typical conditions – see Sect. 3) would be expected to reduce the observed chemiluminescent signal by ∼2.7 % relative to pure air. In practice, this is typically slightly less (2.2 %–2.4 %) as the sample flow in a CL analyzer is diluted by the addition of a reagent O3∕air flow (10 %–25 % of the total flow). This correction term can be explicitly calculated from the measured flows in the photolytic NO calibration source and the flow rates in the CL analyzers (as in the example given here) or it can be eliminated depending upon the analyzer used during the initial calibration of the relationship between lamp intensity and NO output (see Sect. 3.1). If a CL analyzer is used to determine this relationship, then quenching by N2O is intrinsically included in the calibration of the photolytic source.
2.2 Ozone calibration
The photolytic ozone calibration source has been described in detail previously (Birks et al., 2018b) and the following is only meant to briefly highlight the important points of this calibrator since it plays a key role in the NO2 calibration device described in the following section. In the photolytic ozone calibration source that is used in the Model 306 Ozone Calibration Source™ (2B Technologies, Boulder, Colorado), a low-pressure mercury lamp produces calibrated concentrations of ozone by the photolysis of oxygen in air.
A key difference compared to the NO photolytic source described above (Sect. 2.1) is that for a 1 cm path length (and at 1 atm and 25 ∘C), the O2 absorption in air is nearly optically thin (∼5 % light absorbed). For an optically thin system, the mixing ratio of ozone produced depends linearly on the residence time within the photolysis chamber; thus, it varies with volumetric flow rate. In the Model 306 Ozone Calibration Source, the mass flow rate, temperature, and pressure are continuously measured to compute the volumetric flow rate (and therefore the residence time), and the lamp intensity is adjusted in a feedback loop to maintain a constant ozone output mixing ratio. A further key point in the ozone calibration source is that the photolysis cell must be maintained at a constant (slightly heated) temperature to ensure constant overlap between the Hg lamp emission lines and the O2 absorption lines and to maintain a constant ratio of lamp intensities between the 184.9 nm Hg line and the 253.7 nm Hg line that is monitored in the feedback loop to maintain a constant photolysis rate (Birks et al., 2018b). The main difference between the previously described Model 306 Ozone Calibration Source and the one used for the NO2 calibrator described below (Sect. 2.3) is that the flow rate through the photolysis cell is much lower (∼50 cm3 min−1 as opposed to 3000 cm3 min−1). This increases the cell residence time from 0.06 to ∼3.6 s and consequently results in the production of much higher ozone mixing ratios (up to 15 ppm) exiting the photolysis cell in the Model 714. However, control of the lamp intensity and volumetric flow rate (as described in Birks et al., 2018b) still allows for precise control of the output ozone mixing ratio that is independent of pressure and temperature. The longer residence time and higher mixing ratios in the O3 photolysis cell do lead to complications due to water vapor that were not found in the individual O3 calibration source (the Model 306). A solution to this potential problem will be discussed in Sect. 4.2.
2.3 NO2 calibration in a combined calibrator
Combining the above two calibrators into a single unit (the Model 714 Calibration Source™, 2B Technologies, Boulder, Colorado) makes it possible to calibrate not only for NO and O3, but also a third gas, NO2. The calibrated concentrations of NO and O3 are produced as described above. Calibration of NO2 is accomplished via the gas-phase titration (GPT) technique (Reaction R3), making use of the NO and O3 produced in the combined calibration source. Here, O3 is reacted with an excess of NO to produce known concentrations of NO2 under conditions such that [NO]consumed=[NO2]produced. A key difference in the Model 714 from the two individual calibrators is that Reaction (R3) must be carried out at high concentrations (parts per million level) to drive Reaction (R3) to completion; therefore, the NO and O3 reagents are mixed before subsequent dilution. Modeling the second-order kinetics of Reaction (R3) (see Fig. 1) shows that with [NO] = 2×[O3] (i.e., NO a factor of 2 in excess of O3), ∼5 ppm of NO is required to consume 99.6 % of the ozone for a reaction time of 4 s. Increasing the reaction time allows for lower [NO] to be used to obtain the same completeness of reaction. It should be noted that for NOx analyzers that measure both NO and NO2, it is not necessary for Reaction (R3) to go to completion because one measures the consumption of NO relative to the production of NO2. However, residual ozone complicates the calibration protocol as Reaction (R3) continues to alter the NO∕NO2 ratio (at a reduced rate after dilution) as the gas mixture is transported to the analyzer to be calibrated. Thus, the NO∕NO2 ratio would depend on the residence time of the connection tubing. For NO2-only analyzers, it is critical to have >99 % conversion as the NO2 signal produced may be correlated with the loss of ozone (which is assumed to be at the calibrated target concentration and typically not explicitly measured). The calculations described in Fig. 1 can be used as a guide to the required concentrations and residence times of a GPT reactor.
One more point concerning the GPT chemistry is that NO must be maintained in excess over ozone (Ellis, 1975; U.S. EPA, 2002). If ozone is used in excess, NO2 can react with the excess ozone to produce NO3,
and NO3 can subsequently form N2O5 rapidly via (Bertram et al., 2012)
Reaction (R9) is ∼600 times slower than Reaction (R3) ( cm3 molec−1 s−1 at 298 K; Burkholder et al., 2015) but can proceed to a small extent at parts per million levels of NO2 and O3. At room temperature and NO2 concentrations greater than about 25 ppb, Reaction (R10) favors N2O5 formation and proceeds relatively rapidly ( cm3 molec−2 s−1; Burkholder et al., 2015), thus resulting in a net loss of two NO2 molecules. In typical CL analyzers that use heated molybdenum to convert NO2 to NO, N2O5 production is not observable, since the heated catalyst will thermally decompose N2O5 rapidly (Reaction R10r), followed by the reduction of both NO2 and NO3 to NO, thus not affecting the observed [NO]consumed=[NO2]produced. However, in the case of photolytic NO2 converters and the long-path FTP method mentioned in the previous section, the formation of N2O5 would cause an underestimate in the calibration (i.e., [NO]consumed>[NO2]produced). For photolytic converters, there would be no way to elucidate the error as the lower observed NO2 would likely be incorporated into an incorrect conversion efficiency.
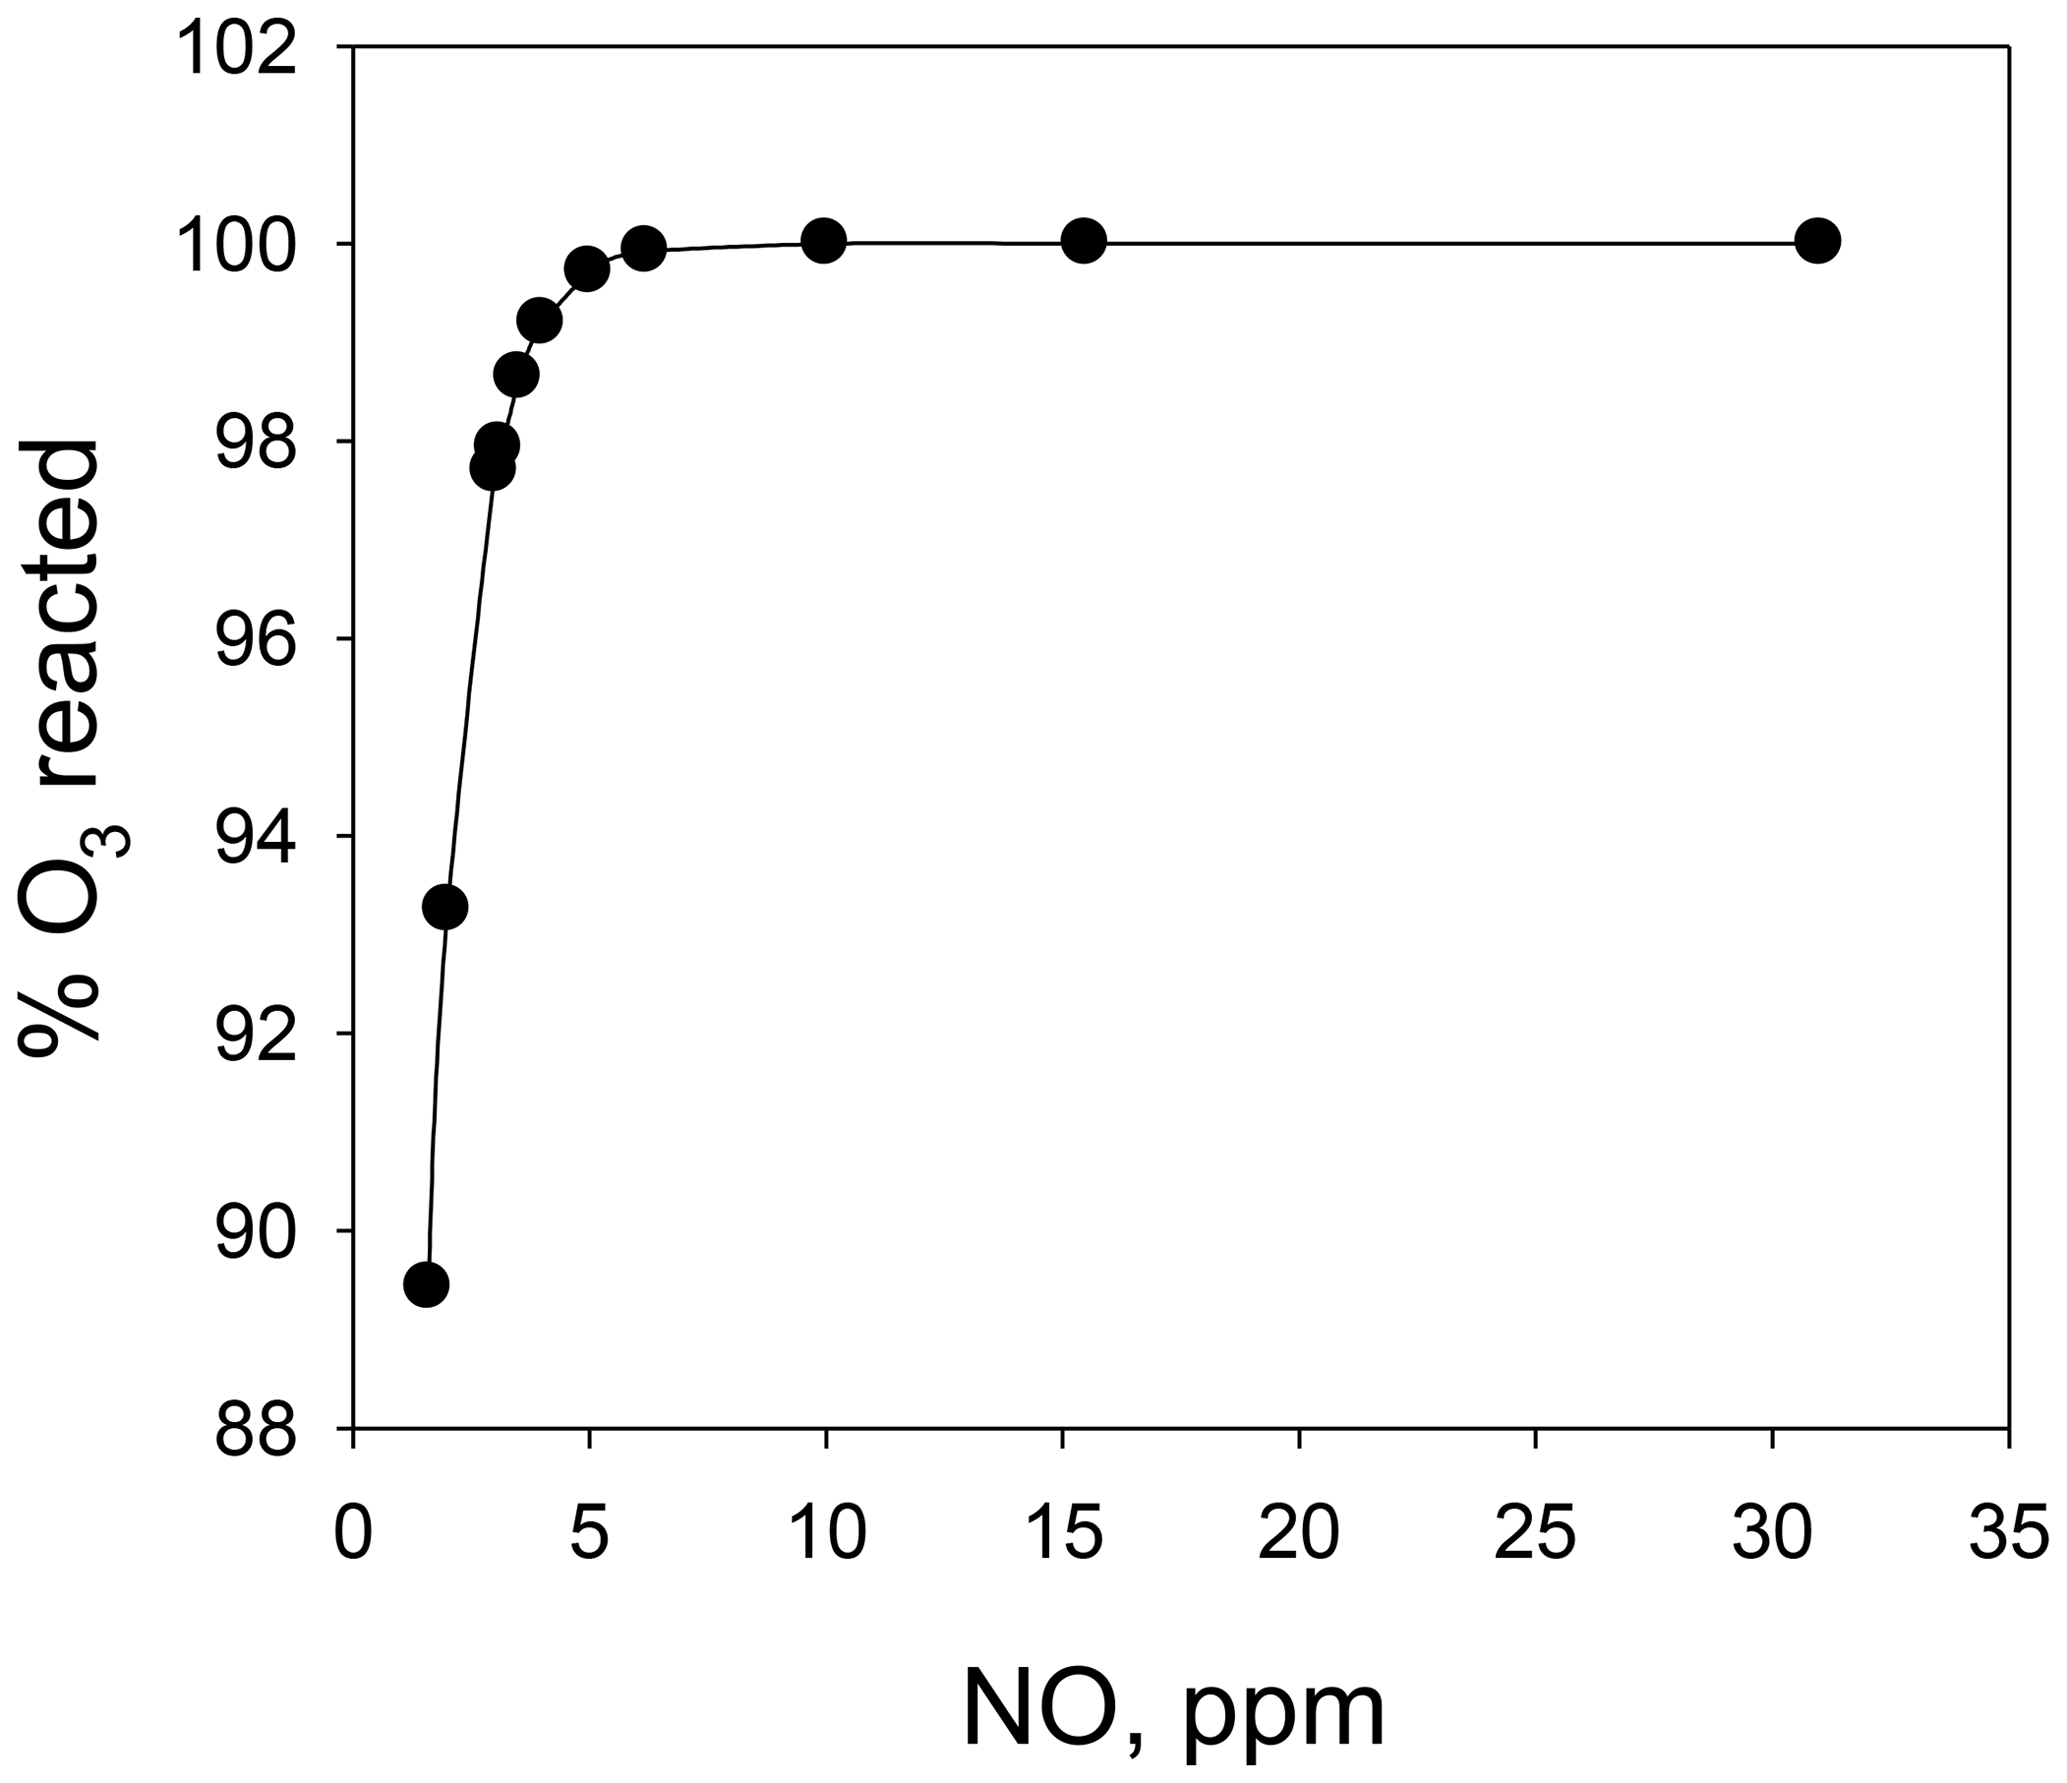
Figure 1A plot of the percent of O3 consumed vs. the initial NO concentration for the conditions of and a total reaction time of 4 s.
3.1 Portable nitric oxide calibration source
Figure 2 is a schematic diagram of the NO calibration source. An air pump draws ambient air into the instrument through NOx and ozone scrubbers (a mixture of Carulite® and activated carbon) to produce the diluent air stream. The airflow rate is measured by a mass flowmeter and is controlled by the use of restrictors (not shown) and a needle valve that vents part of the flow. The needle valve is adjusted to produce diluent air at a total output volumetric flow rate of ∼3 L min−1. In the most portable configuration of the instrument, nitrous oxide is supplied by a cartridge containing either 8 or 16 g of liquid N2O with a headspace pressure of ∼50 atm at 20 ∘C. A combined cracker–regulator punctures the cartridge as it is tightened and also drops the outlet delivery pressure to below 25 psig. A 25 psig pressure-relief valve is installed inside the instrument housing to prevent overpressurization. The valve on the cracker–regulator provides a coarse adjustment of the N2O flow rate. A voltage-sensitive orifice (VSO) valve is then used to provide fine control of the N2O flow rate to 60±1 cm3 min−1 in a feedback loop. Pressure within the gas stream is measured but not controlled. The N2O then passes through an aluminum photolysis cell (volume ∼6 cm3) where a small fraction of the N2O is converted to NO (and N2 + O2) by a low-pressure mercury discharge lamp. As discussed above, because the system is optically thick (essentially every photon is absorbed), the NO production rate (molec s−1) is independent of photolysis cell pressure and N2O flow rate, the production rate depending only on the lamp intensity. NO output is varied by changing the pulse-width-modulated duty cycle to the Hg lamp while monitoring its intensity with a photodiode. Since nearly all of the 184.9 nm light is absorbed by the N2O in the cell, the lamp intensity at the 253.7 nm mercury line is monitored by the photodiode and controlled by the microprocessor. As the monitoring wavelength (253.7 nm) and the photolysis wavelength (184.9 nm) are different, it is important to maintain a constant ratio of lamp emission at these two wavelengths. This is accomplished by regulating the photolysis cell (which houses the lamp) at a constant temperature of 40 ∘C. Even as the lamp duty cycle is varied, the temperature regulation maintains a constant lamp temperature, thus ensuring a stable 184.9∕253.7 nm output. The NO∕N2O stream exiting the photolysis chamber is diluted into the ∼3 L min−1 flow of NOx-scrubbed air to produce the desired output concentration of NO in air.
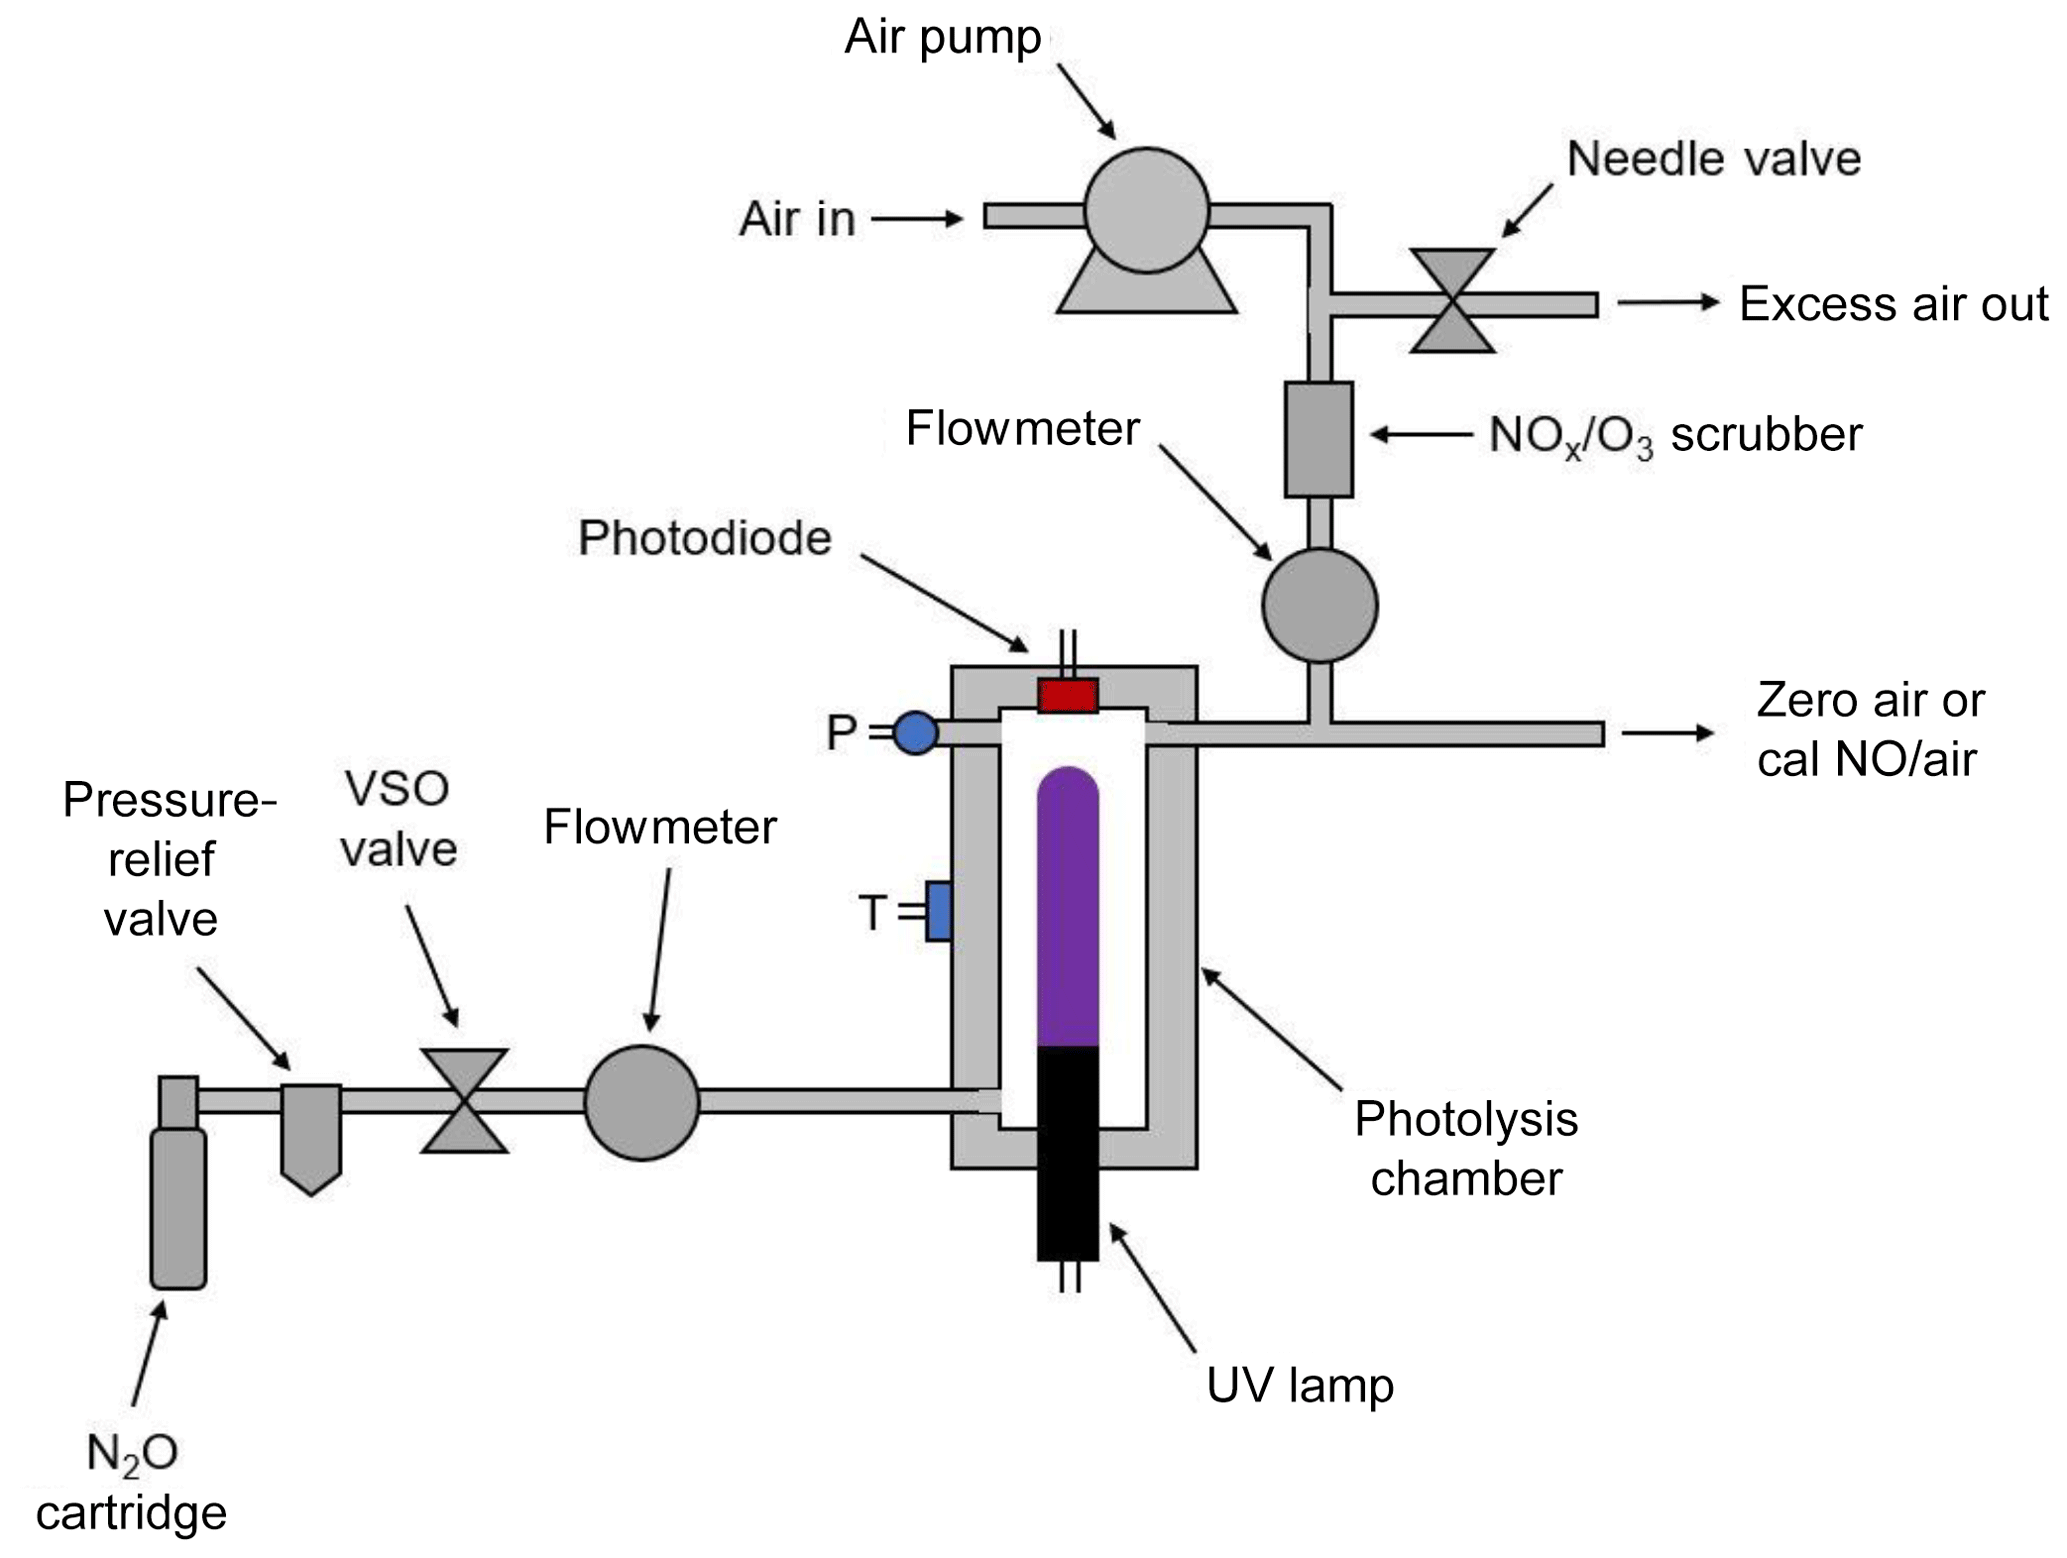
For the NO calibration source to be a valid transfer standard, the photolytic NO source must be validated against a NIST-traceable NO standard to provide a lamp intensity vs. NO output concentration working curve. Therefore, the photodiode voltage (i.e., a measurement of lamp intensity) must be calibrated against the output NO concentration as measured by an NO analyzer that has been recently calibrated using a NIST SRM NO gas standard dilution system.
Nitrous oxide can be supplied to the instrument either by means of N2O cartridges (commercially available and often used as whipped-cream chargers) as shown in Fig. 2 or by connection to a lecture bottle or gas cylinder containing N2O. The cartridge holder and cracker allow the use of either 8 or 16 g cartridges containing liquid N2O and will supply a gas flow of N2O of 60 cm3 min−1 for approximately 1.2 or 2.5 h, respectively. Alternatively, a lecture bottle or tank of N2O may be used, allowing for continuous operation of 1.5 d for a lecture bottle containing 227 g or 174 d for a typical containing 27 kg of N2O.
3.2 Combined NO2, NO, and O3 calibration source
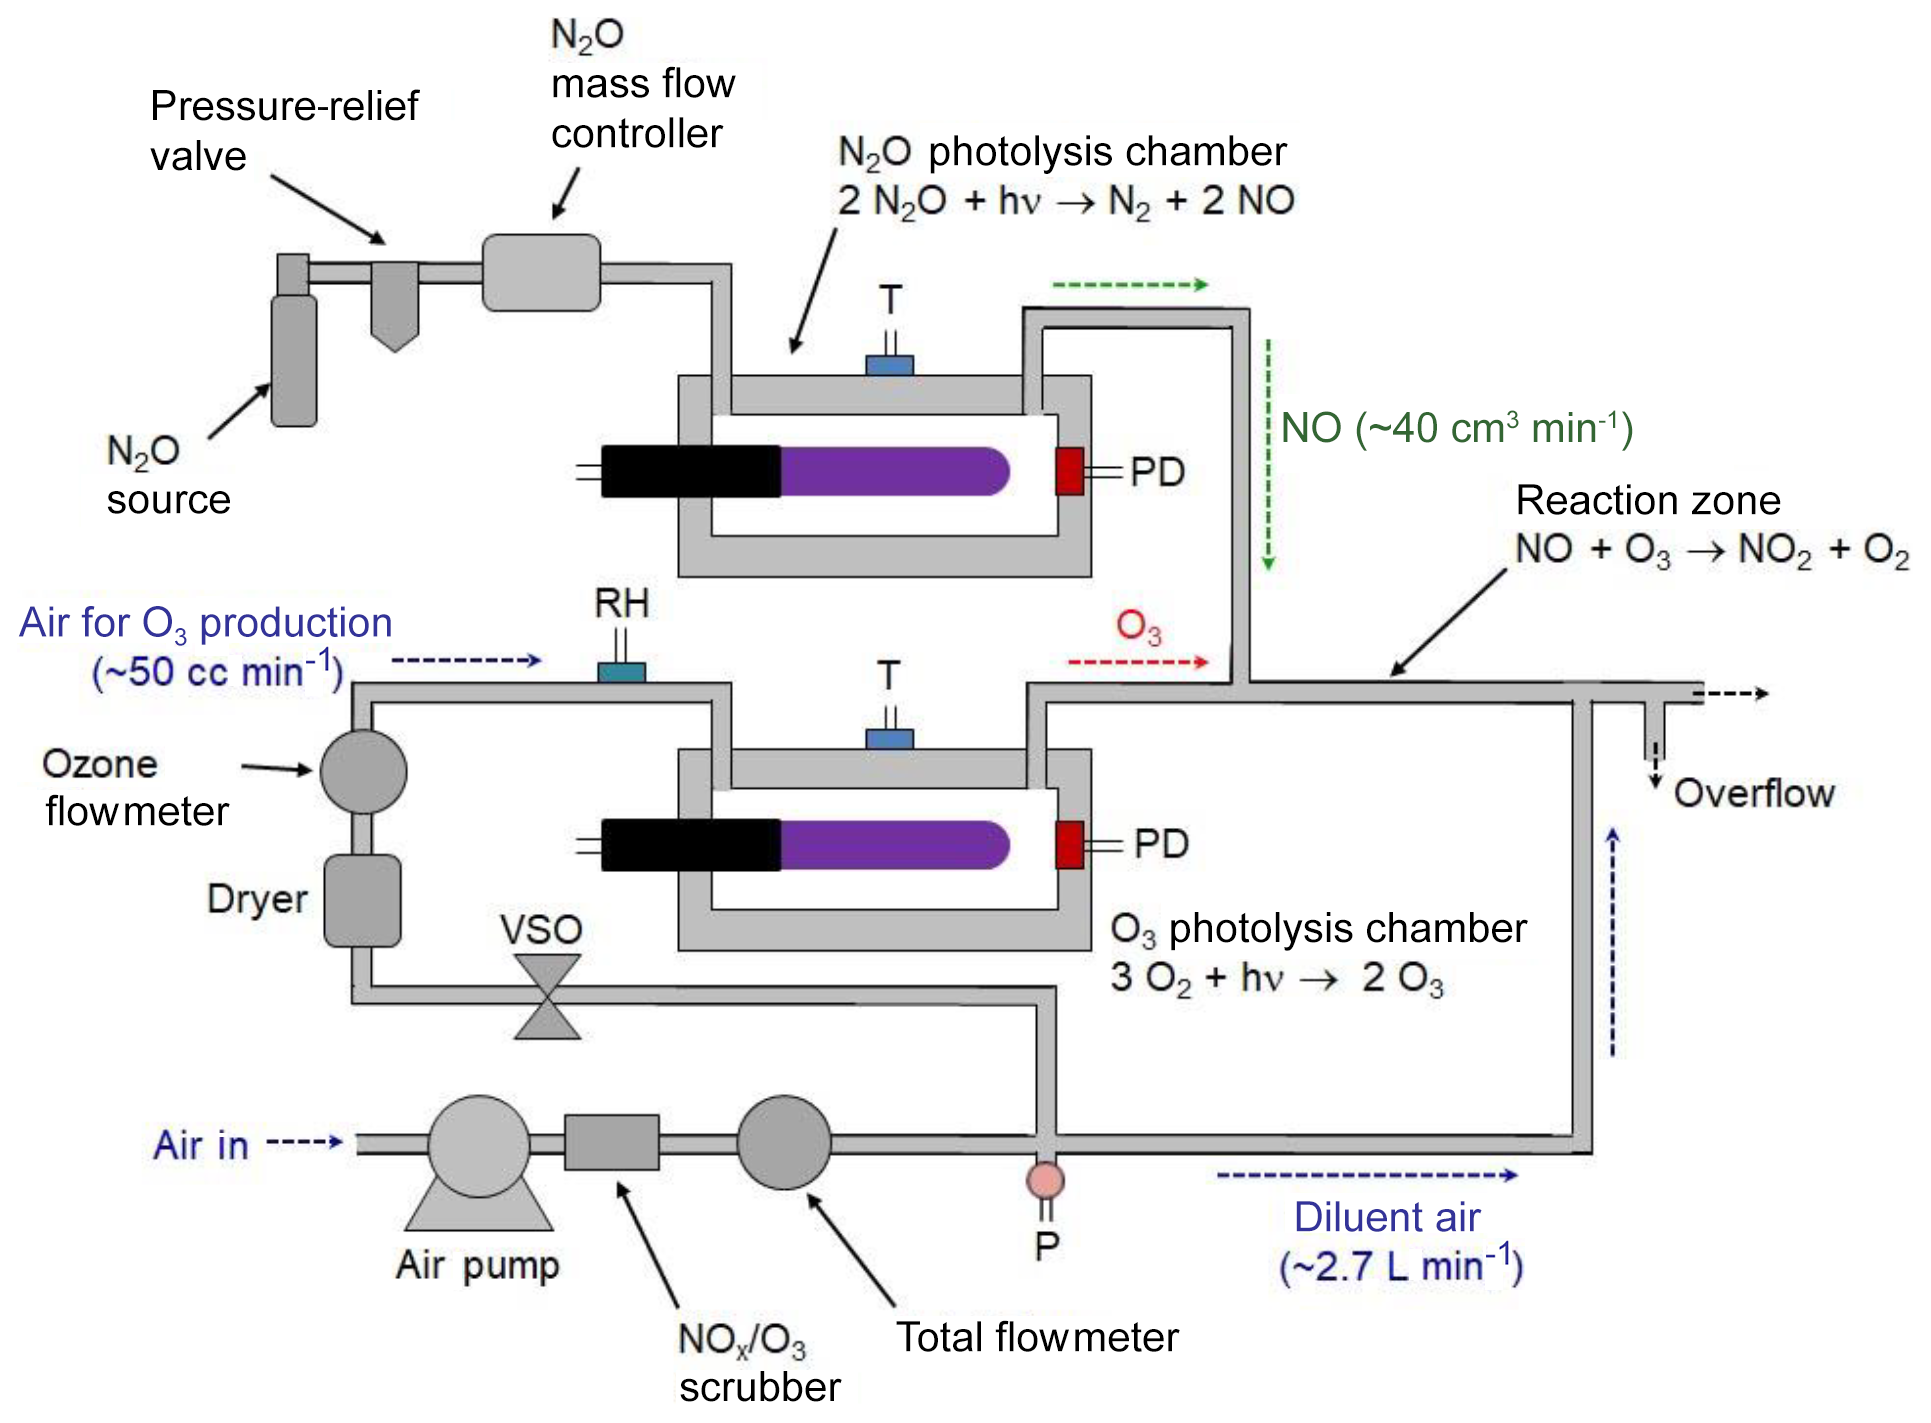
A portable calibrated source of NO2 can be achieved by combining the NO photolytic calibration source (described in Sects. 2.1 and 3.1) with the photolytic ozone calibration source (described in Sect. 2.2 and in Birks et al., 2018b). This is commercially available as the 2B Technologies Model 714 Calibration Source™, which is capable of providing calibrated mixing ratios of NO2, NO, or O3. A schematic diagram of the Model 714 Calibration Source is shown in Fig. 3. The instrument produces O3 by the photolysis of oxygen in air, NO by the photolysis of N2O, and NO2 by the gas-phase titration (GPT) of known concentrations of O3 in an excess of NO.
An air pump pushes ambient air through an O3∕NOx scrubber; thereafter the flow is split using a restrictor to send a volumetric flow of ∼50 cm3 min−1 through an ozone photolysis chamber, with the bulk of the flow, ∼2.7 L min−1, serving as a diluent gas. This main flow combines with the effluent of the photolysis cells just prior to the outlet. A voltage-sensitive orifice (VSO) valve controls the flow, as measured by a mass flowmeter, through the photolysis chamber. For the production of NO, a pressurized source of N2O passes through a mass flow controller and into an NO photolysis chamber at a volumetric flow rate of ∼40 cm3 min−1. Flows through the O3 and NO photolysis chambers join at a tee prior to entering a reaction zone having a volume of 6.5 cm3 consisting of 20.3 cm of 6.4 mm i.d. Teflon tubing. For the generation of NO2, the outputs of the NO and O3 photolysis cells are mixed and allowed to react in the Teflon reaction volume. The total flow rate passing through this reactor is 90 cm3 min−1 (40 cm3 min−1 of NO∕N2O and 50 cm3 min−1 of O3∕air), giving a reaction time of 4.3 s. The O3 is quantitatively converted to NO2 during this time. The high-concentration O3, NO, or NO∕NO2 mixture is diluted by a factor of ∼30–54 (the larger being in the absence of the N2O flow for outputting only O3) with O3∕NO2-scrubbed ambient air at a tee just prior to the instrument outlet. Ozone or NO is produced at calibrated concentrations by turning the corresponding lamps on and adjusting their intensities as measured by photodiode measurements in the respective chambers. Typically, the N2O flow is turned off when only ozone is being output to conserve N2O usage. To produce known mixing ratios of NO2, calibrated amounts of O3 (corrected for the slight dilution by N2O) are produced in the range 0–500 ppb with the NO output set at least twice the output ozone (e.g., 1000 ppb of NO is required for 500 ppb of O3 to be converted to NO2). Note that these are the concentrations exiting the calibrator as opposed to the much higher concentrations found within the reaction zone. For example, a final output concentration of 200 ppb of NO would give a concentration of 6 ppm of NO within the reaction zone.
3.3 Validation as a suitable transfer standard
As described in Sect. 1, the U.S. EPA sets out procedural guidelines for the calibration of monitors used for the regulatory monitoring of ambient O3 and NO2 (U.S. EPA, 2002; U.S. EPA, 2013). Since most NO2 monitors actually monitor NO (CL analyzers), their guidelines also describe the calibration of NO as a matter of necessity even though NO is not a criteria pollutant. For NOx, the basis of these procedures ties NO and NO2 calibrations to a NIST-traceable SRM gas mixture of NO. However, the U.S. EPA does not provide guidance for transfer standards that do not include the direct use of a either a NIST SRM gas mixture or a gas mixture that is somehow traceable to a NIST SRM (as with the photolytic NO2 calibrator described here). In contrast, specific statistical requirements are established for the use of either photolytic generators or analyzers based on photometry for use as transfer standards in the calibration of ozone monitors (U.S. EPA, 2013; Birks et al., 2018b). In lieu of direct statistical requirements for a photolytic NO and NO2 transfer standard, we have applied the same requirements that are established for a Level 4 ozone transfer standard (U.S. EPA, 2013). Level 4 ozone transfer standards must undergo a “6×6” verification in which six calibration curves, each consisting of six approximately equally spaced concentrations in a range including 0 % and 90 % (±5 %) of the upper range of the reference standard, are obtained on six different days (U.S. EPA, 2013). The relative standard deviations of the six slopes of the calibration plots must not exceed 3.7 %, and the standard deviation of the six intercepts cannot exceed 1.5 ppb.
The 6×6 verification requires an analyzer whose calibration is traceable to a NIST standard. For the measurements presented here, a 2B Technologies Model 205 or 202 ozone monitor was used as a reference photometer for O3, and a 2B Technologies Model 400 (for NO only) or a Model 405 (NO and NO2) was used as a reference analyzer for NOx. The ozone monitors (Model 202 or 205) are each certified as an ozone Federal Equivalent Method (FEM) by the U.S. EPA (EQOA-0410-190) and are NIST-traceable through comparison with a currently accredited ozone calibrator (Thermo Scientific model 49i-PS). The Model 405 also is designated as an FEM for NO2 (EQNA-0217-243), and it and the Model 400 were calibrated using a Teledyne-API model 700 Dynamic Dilution NO∕NO2 calibrator using a NIST-traceable NO gas mixture (Scott Specialty or Airgas). Furthermore, the ozone photometer (used to measure the ozone for the GPT reaction) within the model 700 was also calibrated against the NIST-traceable Thermo Scientific ozone standard.
Because a goal of the calibration sources is their use in the field calibrations of analyzers, one also needs to consider the effect of environmental factors such as temperature, pressure, and humidity on the output mixing ratios of the photolytically generated analytes. The factors of optical opacity and the photochemistry discussed above in Section 2 imply that environmental variables such as temperature, pressure, and relative humidity should have minimal effects on the performance of the ozone and NO calibrators. However, this assumes that the N2O is completely optically thick and that the sensors for temperature, pressure, and mass flow rate are perfectly linear and independent of one another. For example, as pointed out below, mass flowmeters depend on molecular composition and will not be perfectly accurate when the water vapor mixing ratio changes. Similar tests of the ozone calibrator have been described previously (Birks et al., 2018b), and here we carry out additional environmental tests of the NO calibration source. Furthermore, temperature certainly affects the GPT chemistry (Reaction R3) and can place limitations on the usable concentration ranges – typically at low concentrations for which Reaction (R3) may not go to full completion. The methods for varying the temperature, pressure, and humidity will be described as the results are presented in the following section.
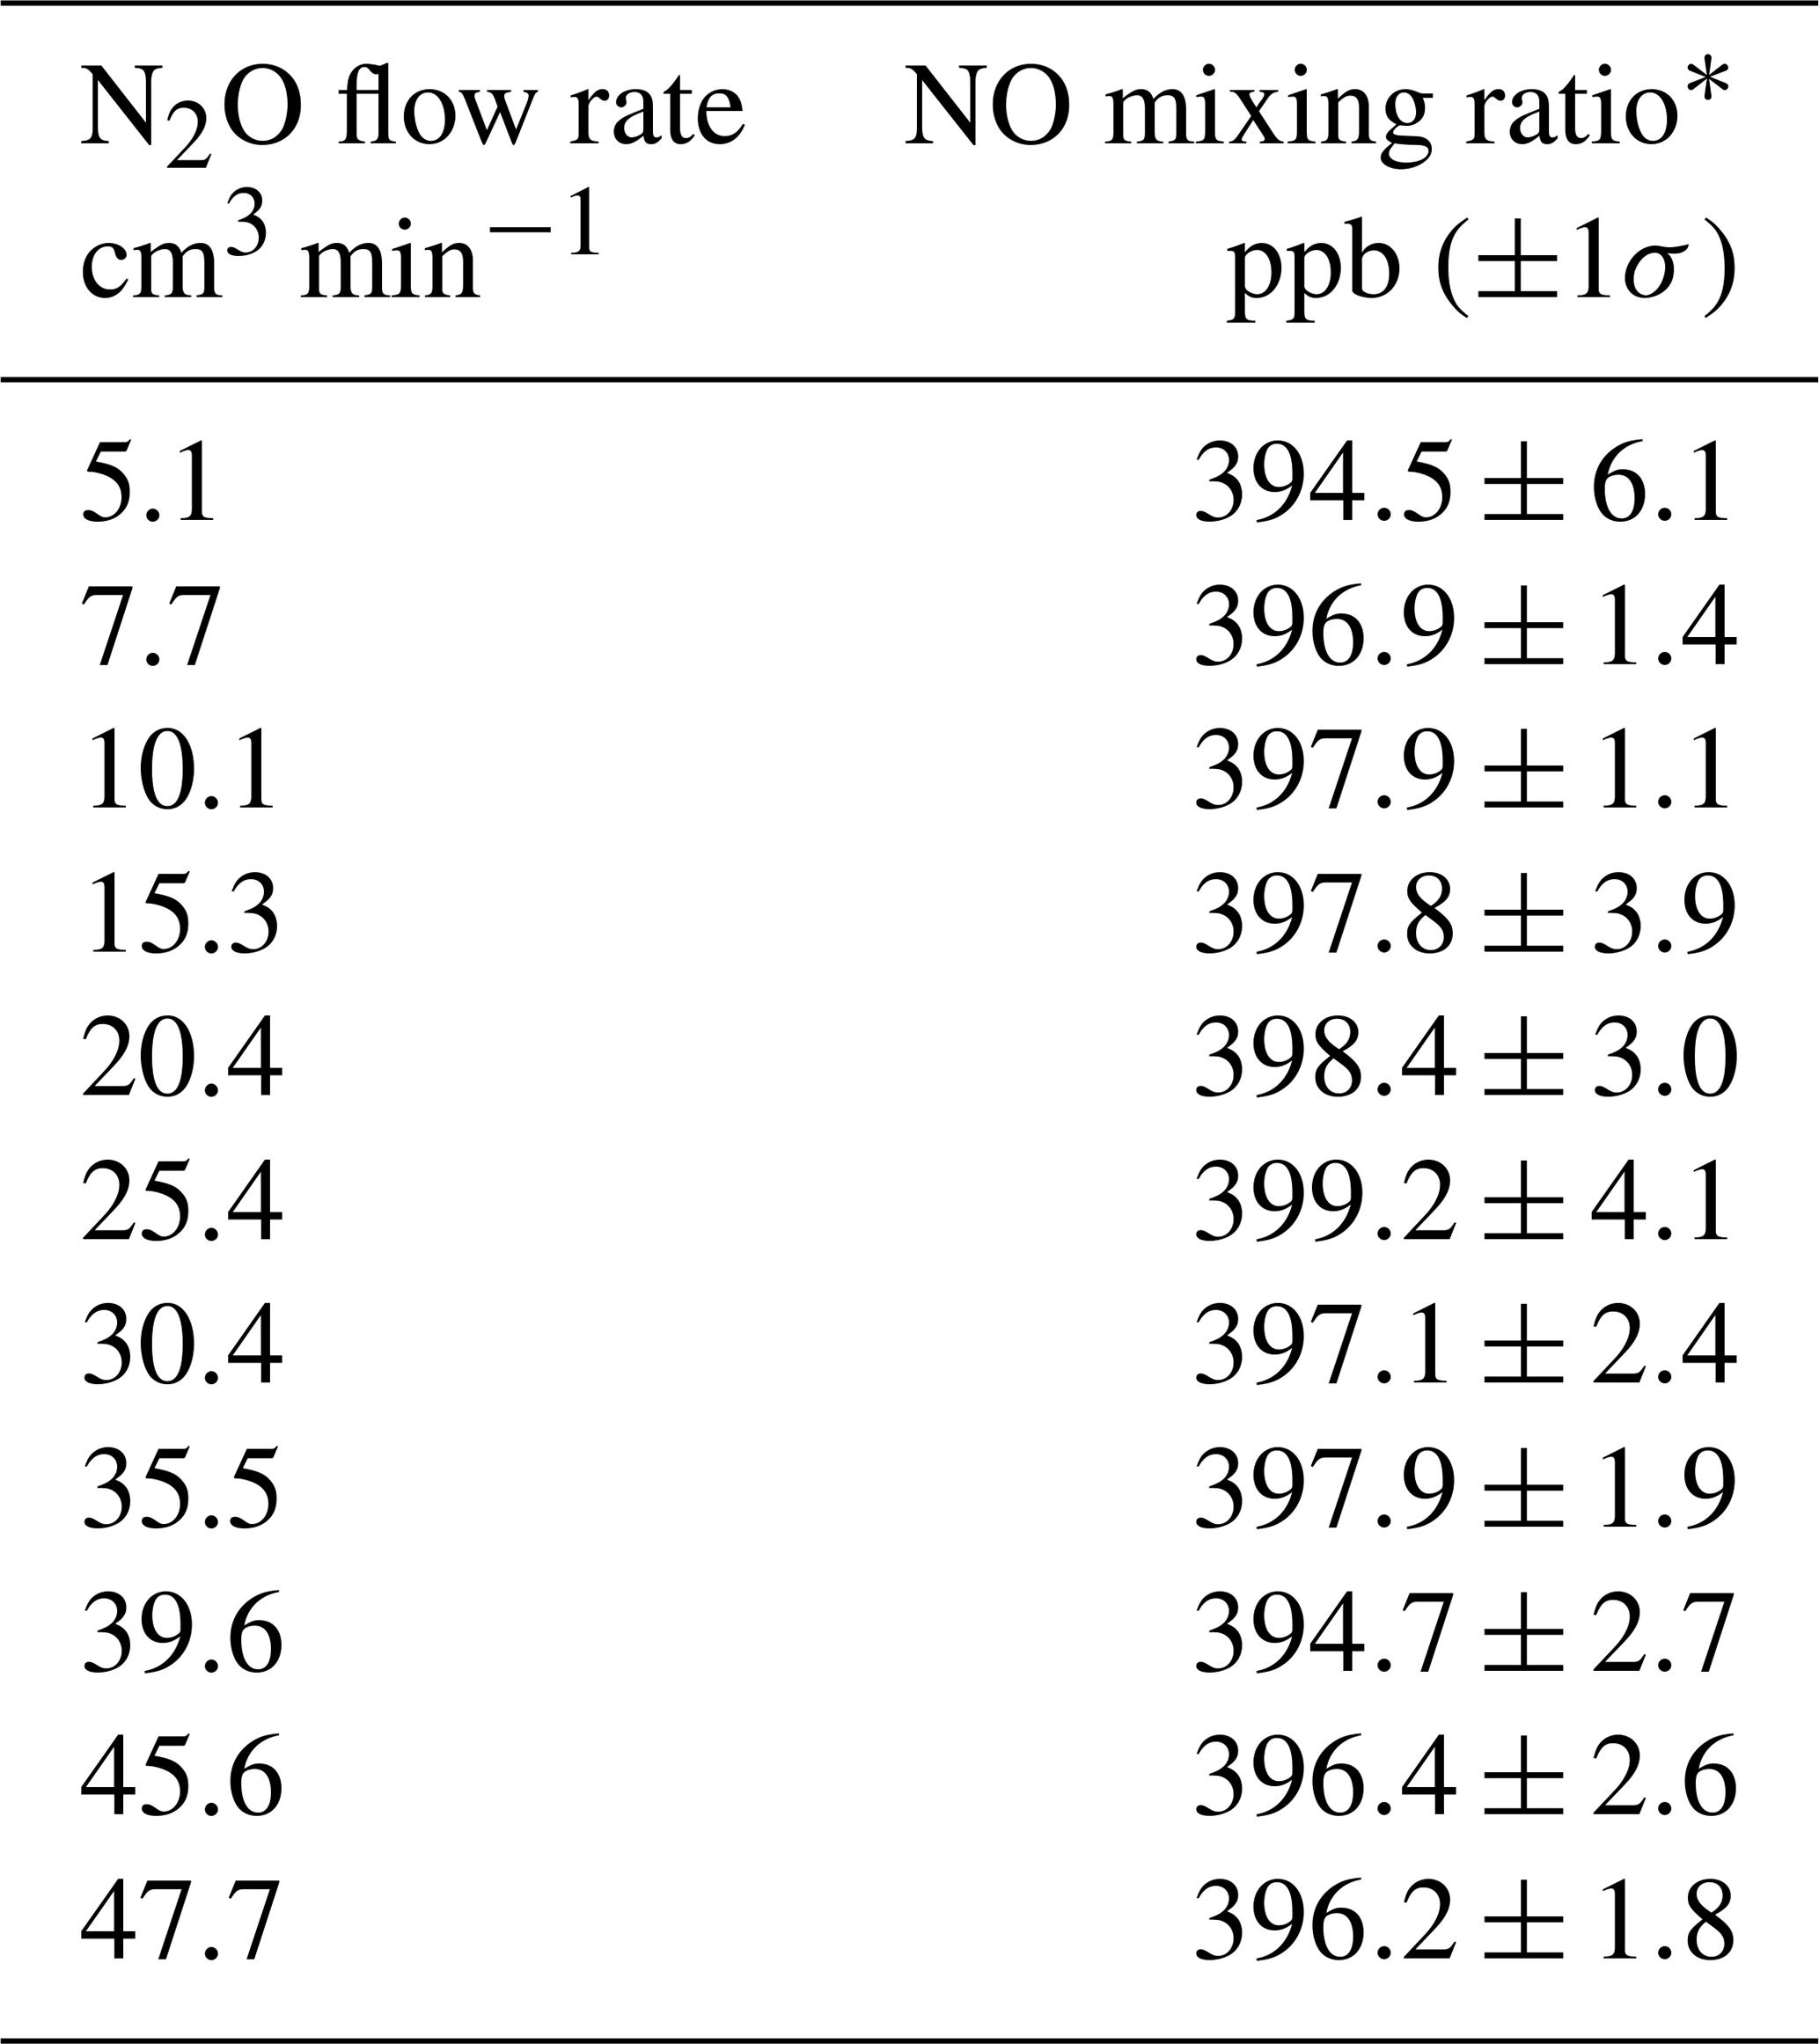
Table 1NO mixing ratios measured from a Model 714 Calibration Source as a function of the N2O flow rate.
∗ NO measured using a Model 405 monitor.
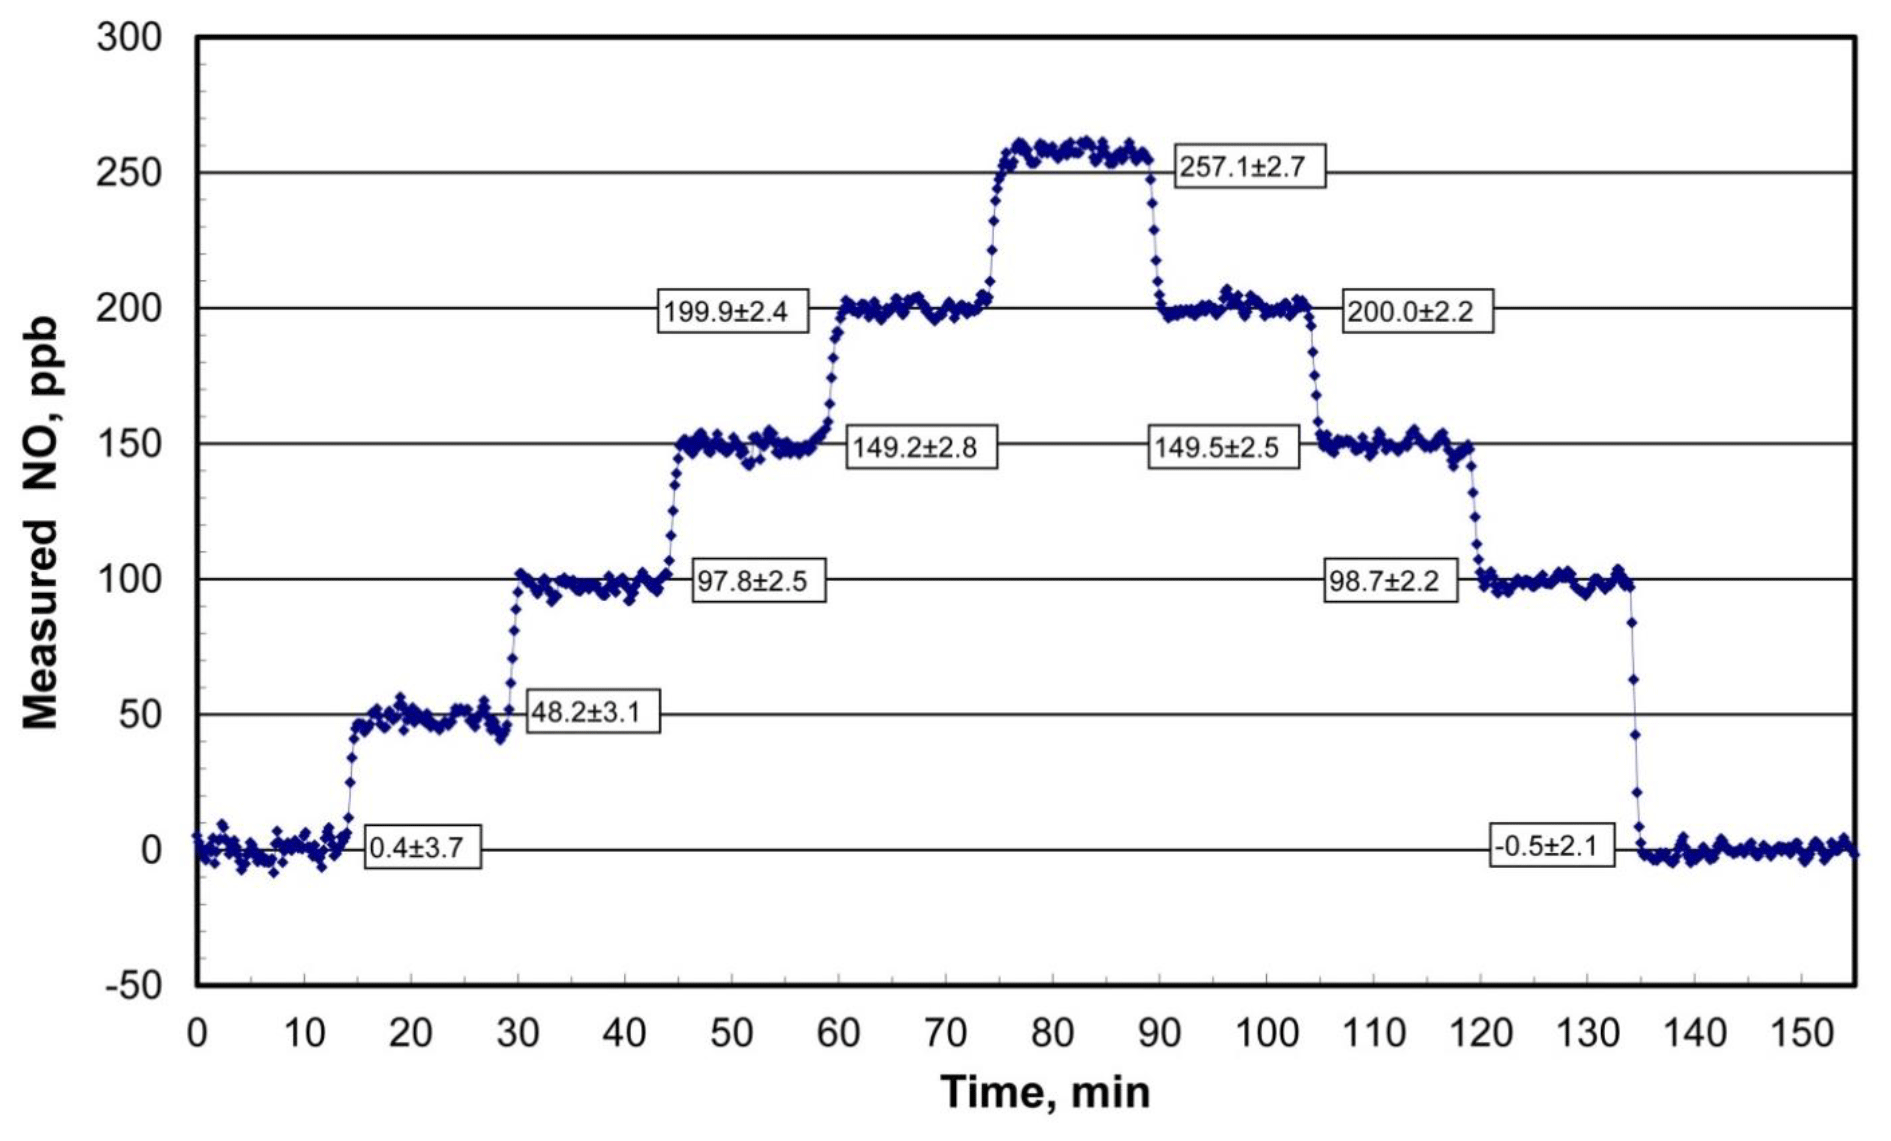
Figure 4Measured output from the Model 408 NO Calibration Source for programmed NO mixing ratios of 0, 50, 100, 150, 200, 250, 200, 150, 100, and 0 ppb and time steps of 15 min. Average concentrations after the 1 min step changes are shown along with standard deviations.
4.1 NO calibration source
The Model 408 Nitric Oxide Calibration Source was first introduced as a product by 2B Technologies in 2007 but has not been described in the scientific literature. Applications of this highly portable NO calibrator have been limited primarily because users need an instrument that also calibrates for NO2 measurements. The photolytic NO generator described here has since been used in the 2B Technologies Model 211 Scrubberless Ozone Monitor, wherein NO serves as a gas-phase scrubber, and more recently the Model 714 Calibration Source. The NO generator is identical in all three instruments – the only differences being the N2O flow rates used and the degree of dilution. Since, as discussed in Sect. 2.1, 1 atm of N2O is optically thick at 184.9 nm, the flow rate of N2O through the chamber is not critical. Because essentially every photon is absorbed, the production rate of NO is determined only by the lamp intensity – a low flow rate of N2O through the chamber produces the same number of molecules of NO per second as a high flow rate. The effect of changing the N2O flow rate is only to change the total flow into which the NO produced is diluted, which is small since the N2O flow rate is only 1 %–2 % of the total flow. Optical opacity was verified experimentally by using the NO calibration source in a Model 714, varying the N2O flow rate through the photolysis chamber from 5 to 50 cm3 min−1, and setting the lamp intensity to output a constant 400 ppb of NO. The resulting NO mixing ratios measured are given in Table 1. As is readily apparent, there is no observable dependence of the NO concentration produced on the flow rate of N2O within the measured uncertainties. Due to this invariance with N2O flow, this flow rate is often set based on the balance between N2O usage and the response time to a change in NO concentration. Faster flow rates result in a quicker flush time of the photolysis cell and lead to more rapid changes in NO concentration. For example, in the 2B Technologies Model 211 Scrubberless Ozone Monitor, only a constant amount of excess NO is required, and thus a small flow rate (10–15 cm3 min−1) serves to conserve N2O usage. However, in both the NO calibrators (the Model 408 and 714), higher flow rates (40–60 cm3 min−1) are used to allow for more rapid concentration changes (<1 min).
The NO calibration source is typically configured to deliver a calibration gas at a volumetric flow rate of 2.5 to 3.0 L min−1. A change in the flow rate of diluent air would be expected to change the concentration of NO produced. However, the instrument continuously measures the total mass flow rate and adjusts the lamp intensity to compensate for changes in dilution so as to produce a constant output mixing ratio of NO. In typical operation, these intensity adjustments are small as the total flow rate is usually rather constant (within ±5 %). However, the intensity vs. total flow rate feedback loop was tested by measuring the NO output (at 200 ppb) as the total flow rate was varied between 2.2 and 4.5 L min−1. There was no measurable difference in the NO mixing ratios ( % or 4 ppb; data not shown).
4.1.1 Precision, accuracy, stability, and reproducibility of the photolytic NO calibration source
An example of the NO output concentration of a Model 408 NO Calibration Source as measured with a recently calibrated 2B Technologies Model 400 Nitric Oxide Monitor™ (2B Technologies, Boulder, Colorado; Birks and Bollinger, 2006) over 2.5 h is shown in Fig. 4. The NO calibrator was programmed to run through a series of 10 target concentration steps of 0, 50, 100, 150, 200, 250, 200, 150, 100, and 0 ppb with a hold time of 15 min at each concentration. As can be seen the rise (or fall) time between steps is on the order of 1 to 1.5 min (samples are every 10 s) before stable NO outputs are established. Precisions (1σ) averaged 2.6 ppb at nonzero target concentrations and were not significantly different from the 2.9 ppb average of precisions of the first and last steps with the lamp off. This implies that the observed variability was almost entirely due to the NO monitor used – thus, NO output concentrations from the photolytic calibrator are stable to considerably better than ±2.6 ppb. All output concentrations agreed with the target concentrations within 1 standard deviation, with the exception of the 250 ppb level at which the measured output concentration was higher by 7.1±2.7 ppb or 2.8 %.
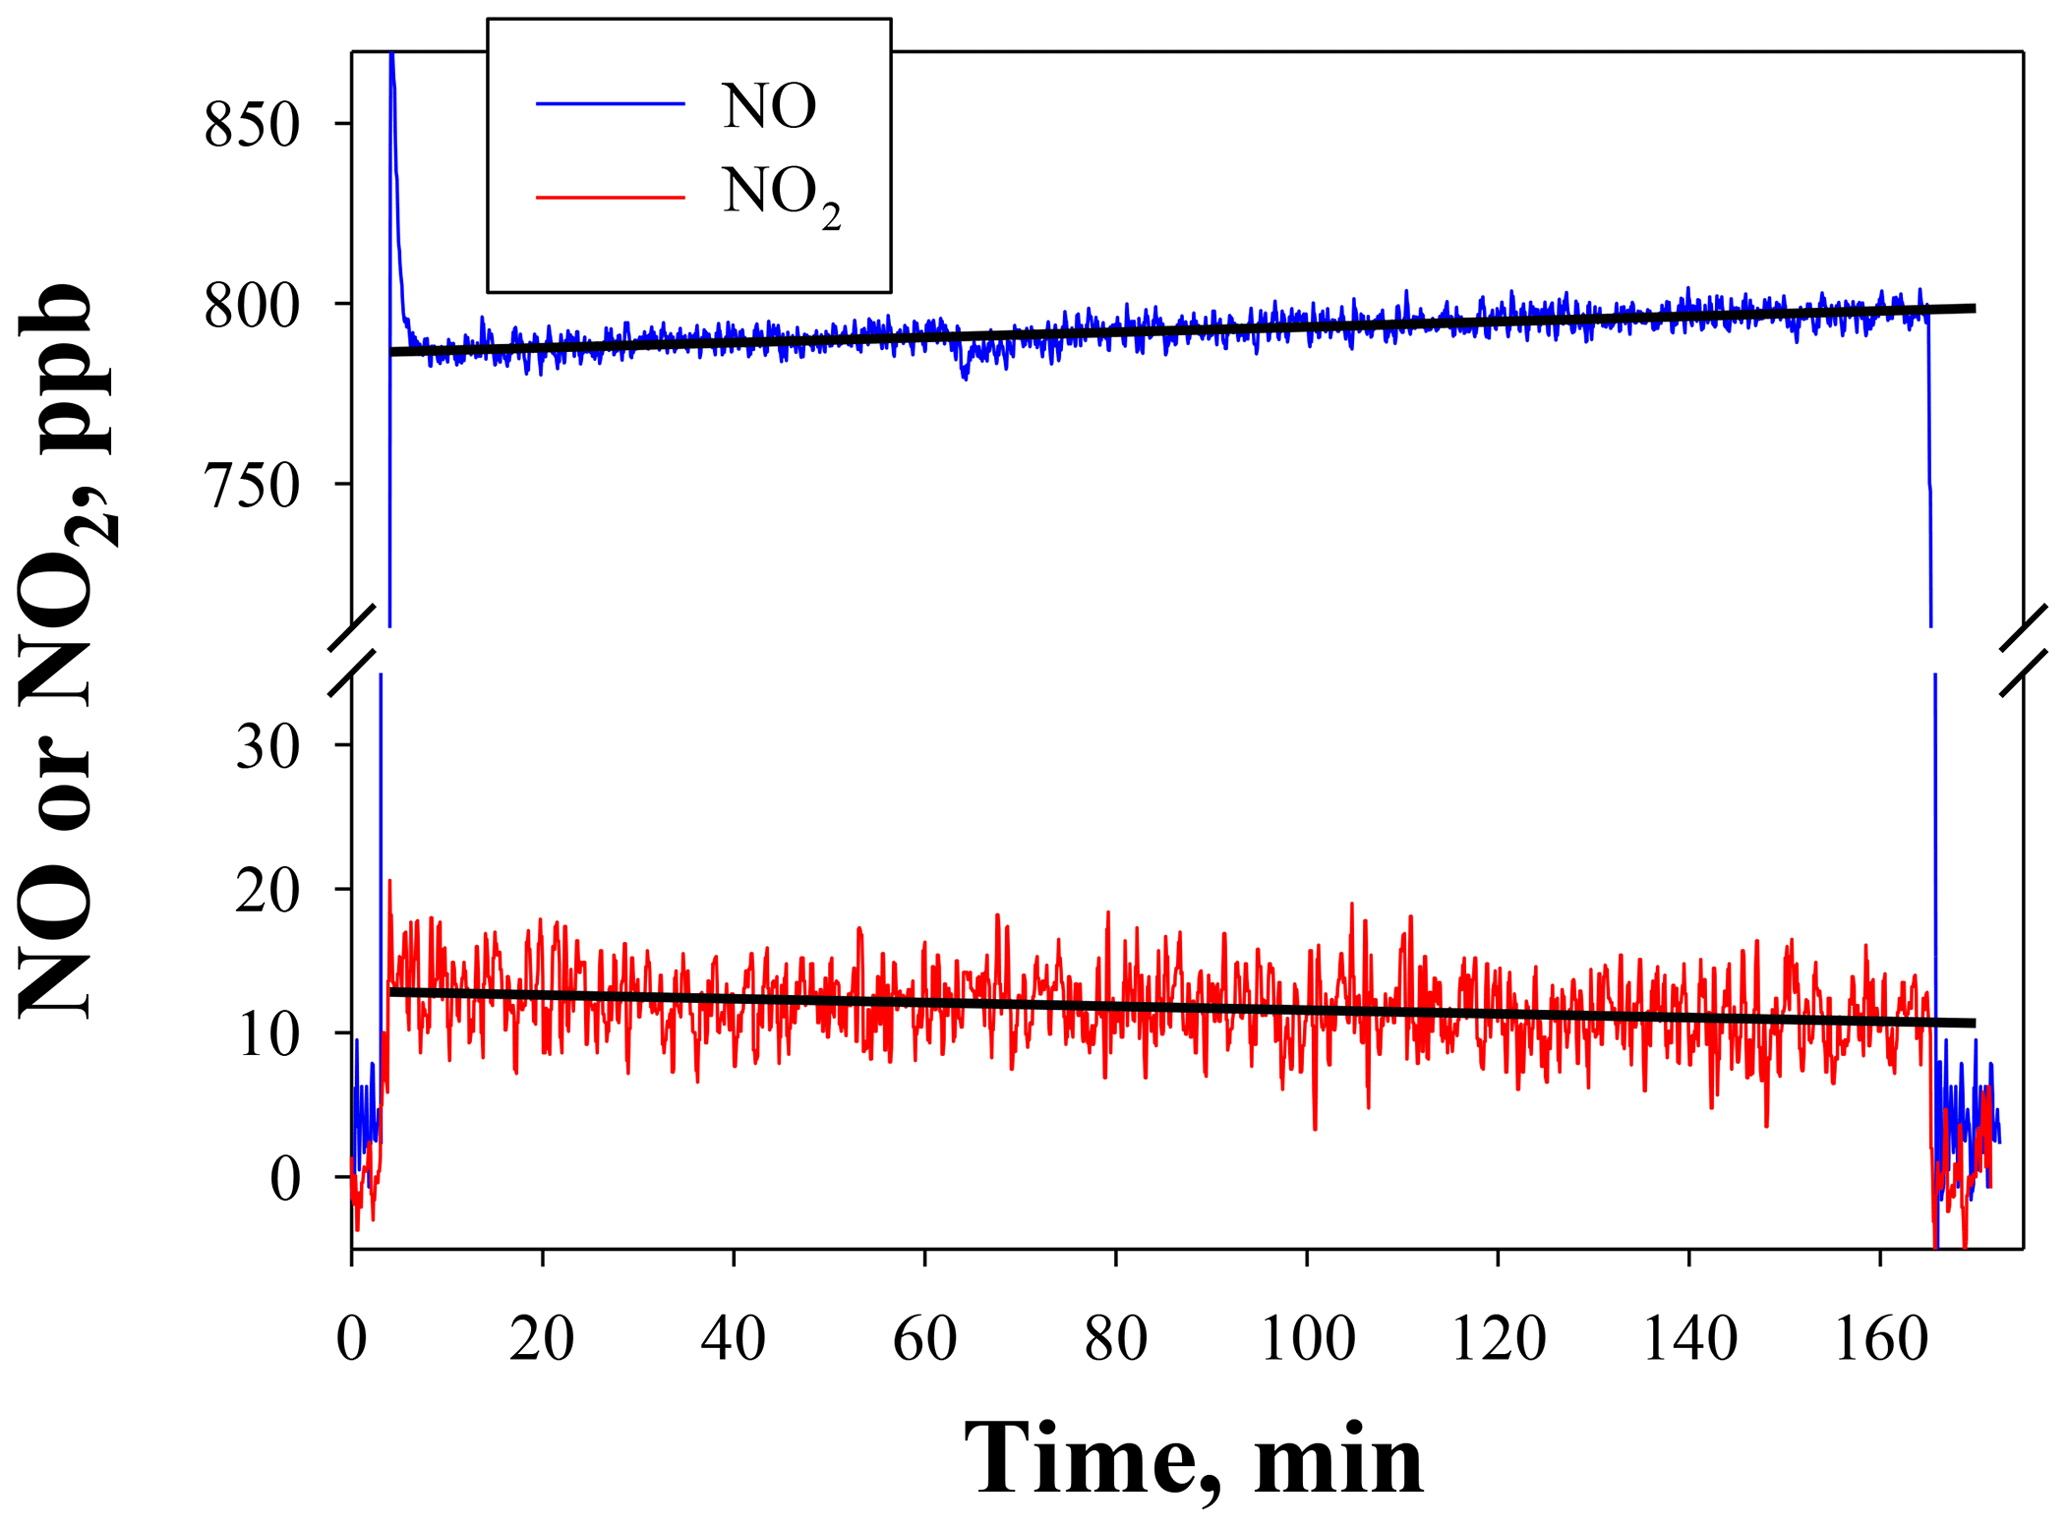
Figure 5NO and NO2 output by the NO calibration source over the time to use an entire 8 g N2O cartridge. The NO set point was 800 ppb. Lines drawn are linear fits to data between 15 and 165 min.
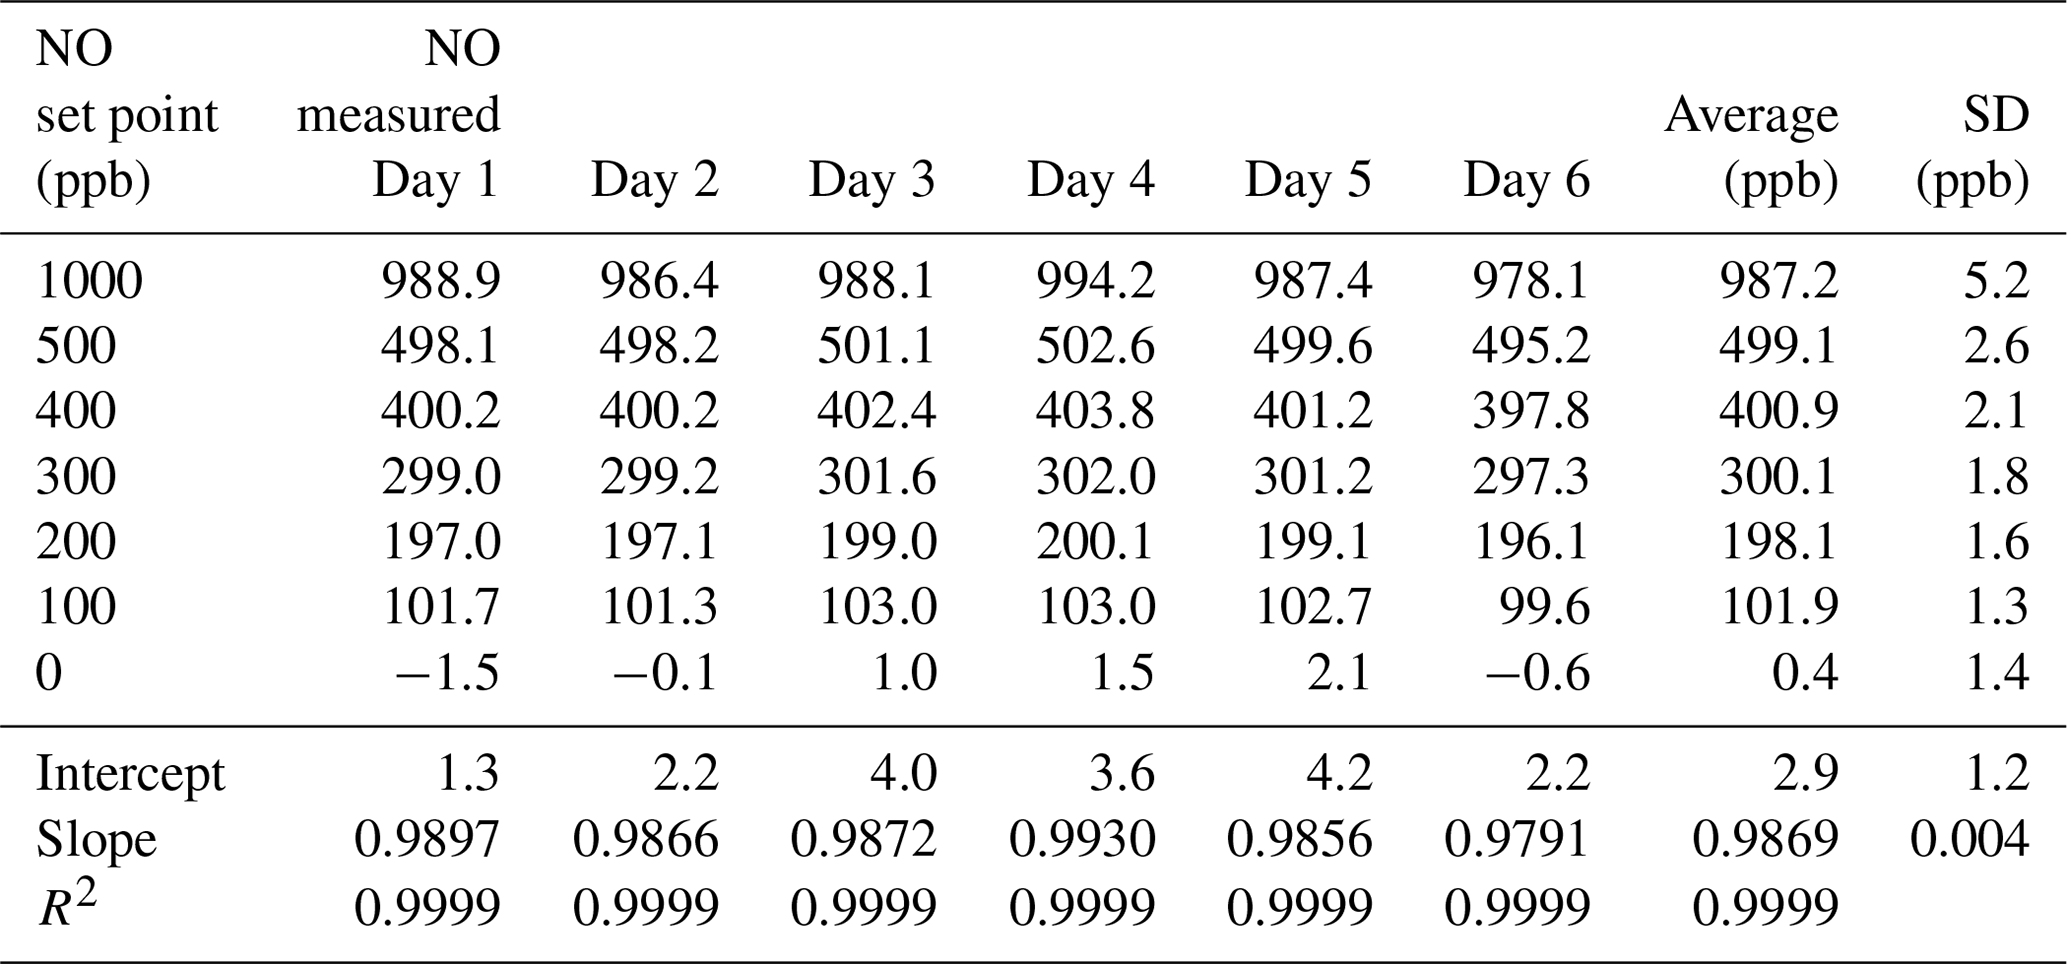
Table 2Results from the 6×6 validation over six consecutive days for the NO photolysis source in the 2B Technologies Model 714 Calibration Source.
SD = standard deviation.
Figure 5 shows the temporal behavior and stability of NO produced from the NO calibration source over the entire usable time period of an 8 g N2O cartridge (∼160 min) for a set point of 800 ppb. The small amount of NO2 produced (NO2∕NO of 1.6 %) is also shown (note the break in the y axis). Both NO and NO2 were measured using a 2B Technologies Model 405 monitor. There is a slight increase in the measured NO (4.4 ppb h−1) with a total NO increase of ∼12 ppb (1.5 % of the 800 ppb set point) over the lifetime of the N2O cartridge. A similar experiment at a set point of 200 ppb (data not shown) gave a similar percentage increase (3.8 ppb or +1.9 %). However, when using a 27 kg N2O cylinder with similar stated purity (99.5 %), no increase in NO was measured (<0.3 % at a set point of 800 ppb) over the same 2.7 h time frame. This suggests that the small 1 %–2 % increase in the NO signal may arise from preferential volatilization of the small amount of impurities in the N2O (likely N2 and O2), leading to a slightly more purified N2O over the lifetime of the 8 g cartridge. This would be expected to be very slow and unobservable when using a larger cylinder. Overall this suggests that the NO calibration source is stable to about 2 % over the 2 to 3 h time span needed for conducting calibrations regardless of the N2O source.
NO2 showed a corresponding decrease of −0.8 ppb h−1 (total of 2.2 ppb) over the course of depleting the 8 g N2O cartridge (see Fig. 5). This small decrease is within the measurement precision of the NO2 analyzer. No decrease in NO2 could be detected at lower NO set points (e.g., 200 ppb) or when using a larger cylinder. Therefore, the NO2 produced at a given NO set point is essentially constant over several hours and would have a minimal effect (<1 %) on the NO2 calibrations described in Sect. 4.2.
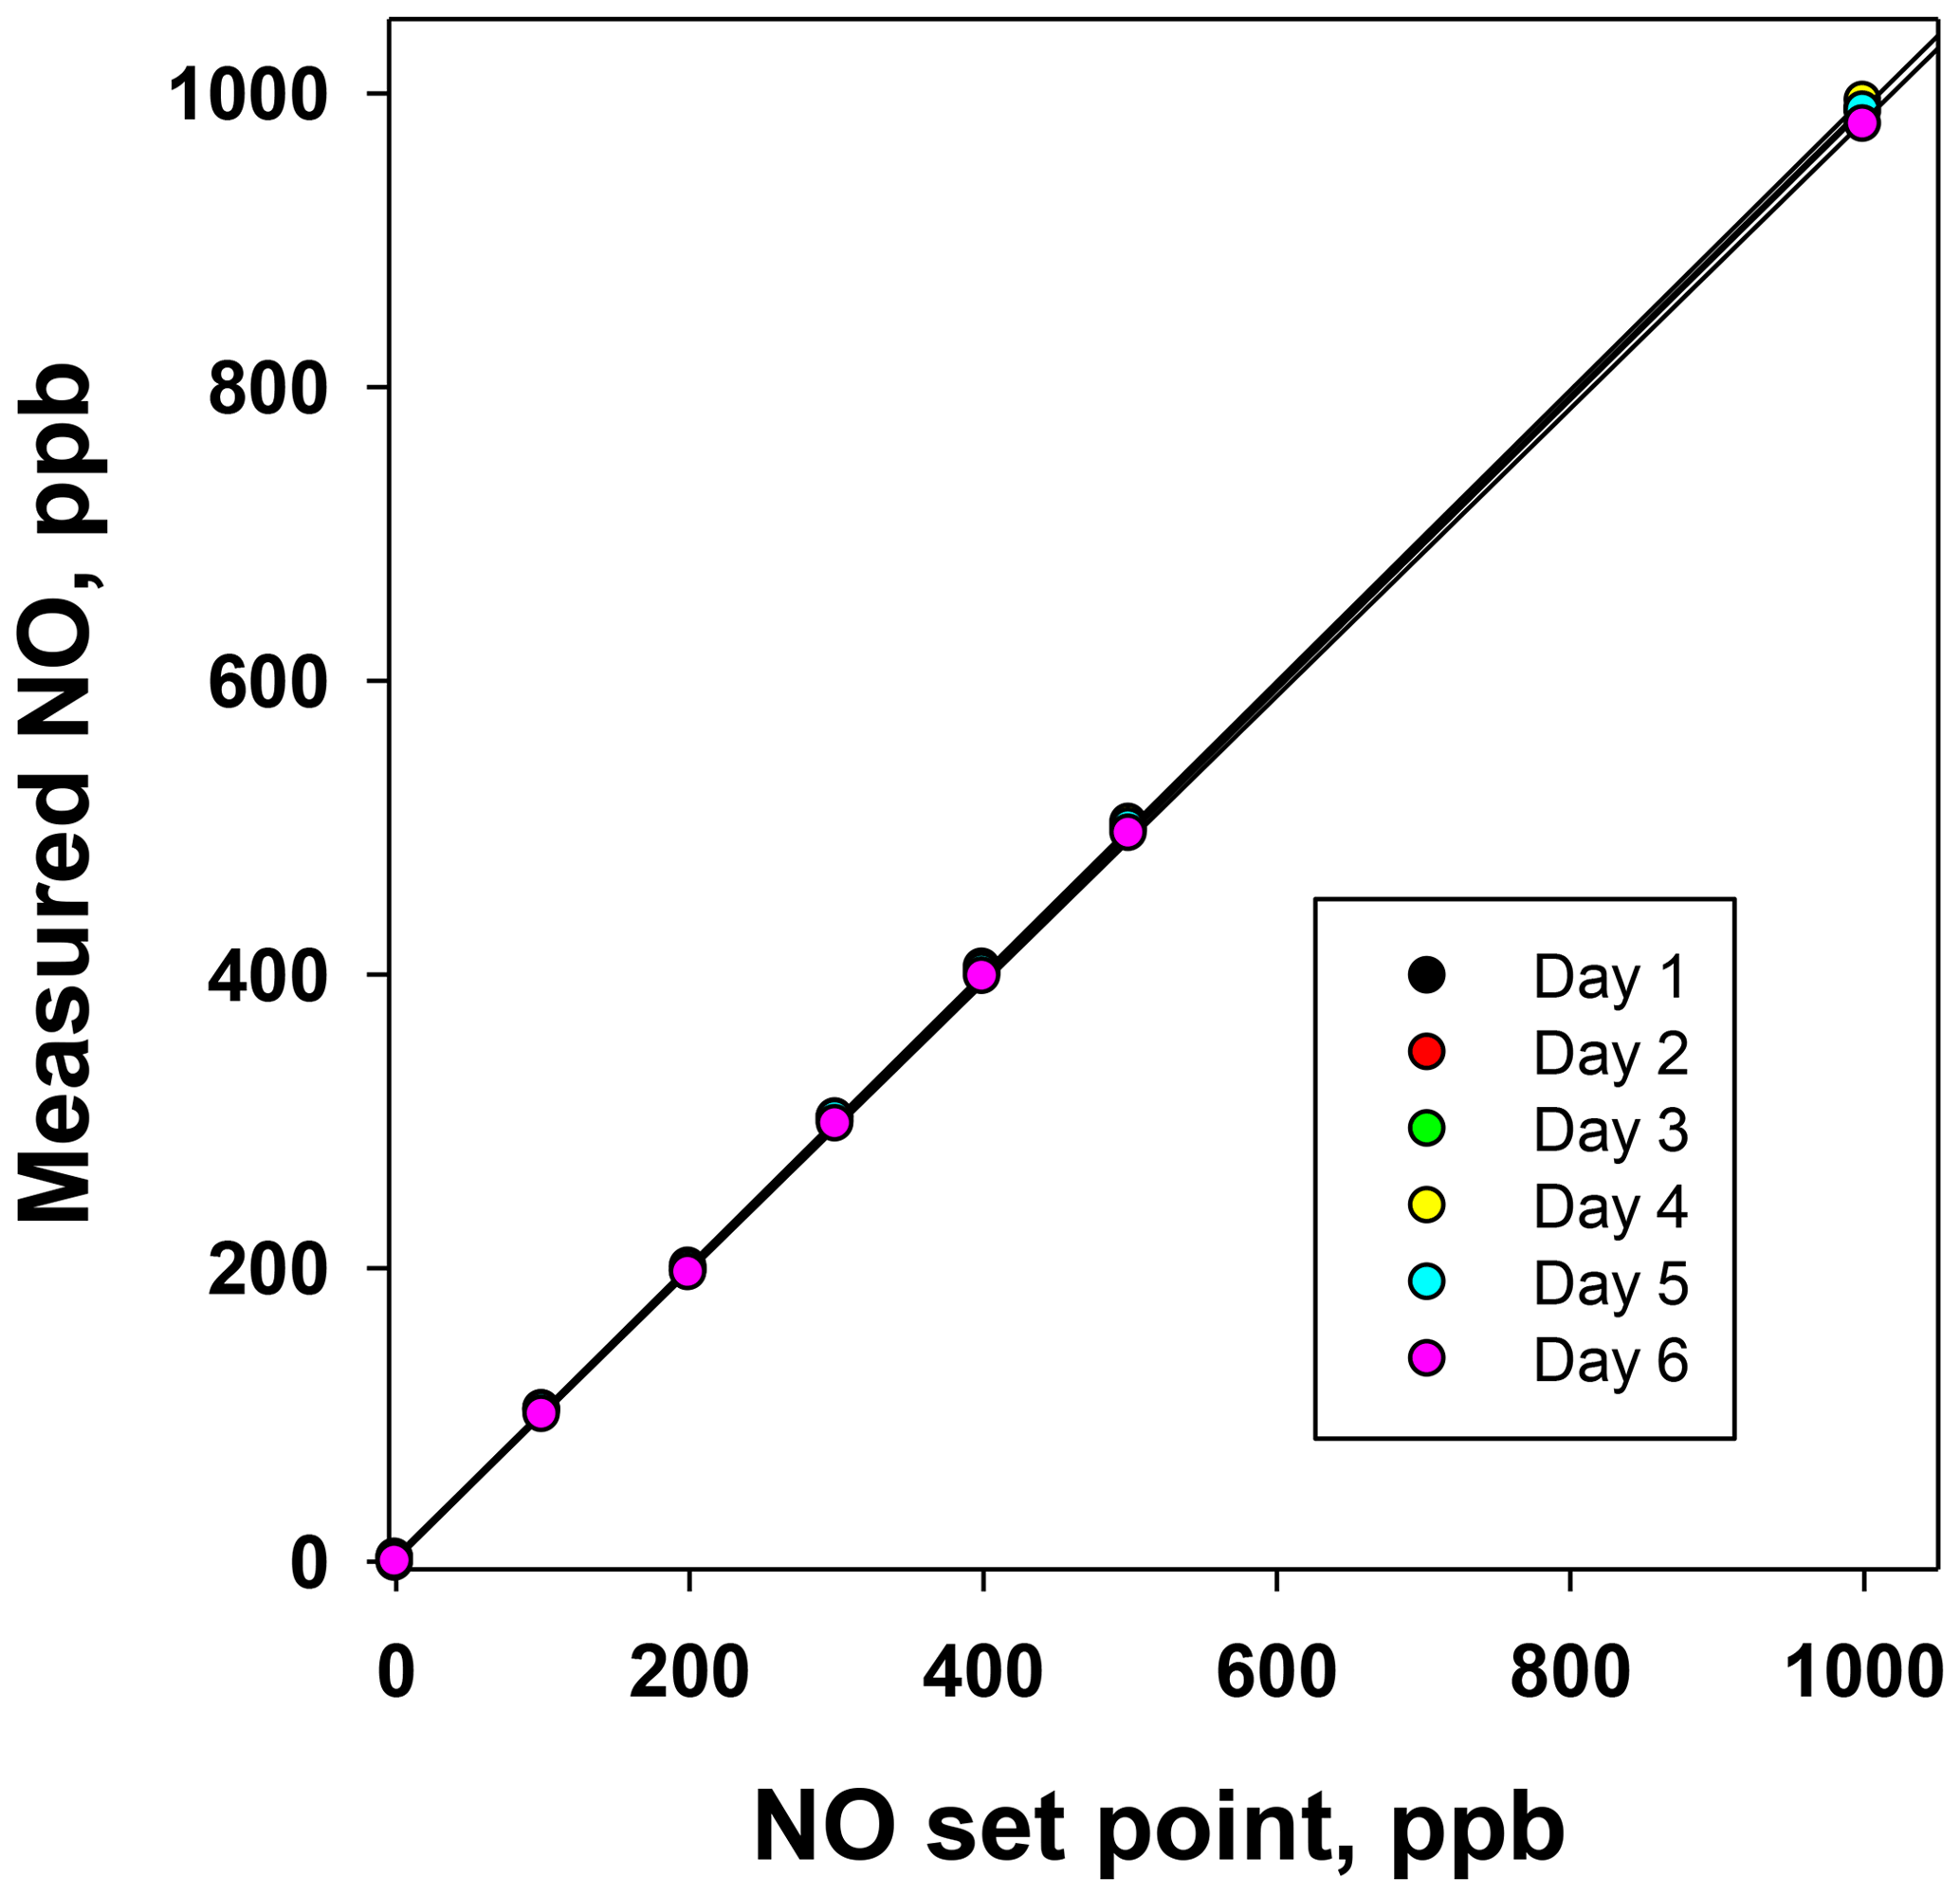
Figure 6Plots of the NO measured (ppb) from the NO photolysis source of a 2B Technologies Model 714 Calibration Source vs. the NO set point on six consecutive days.
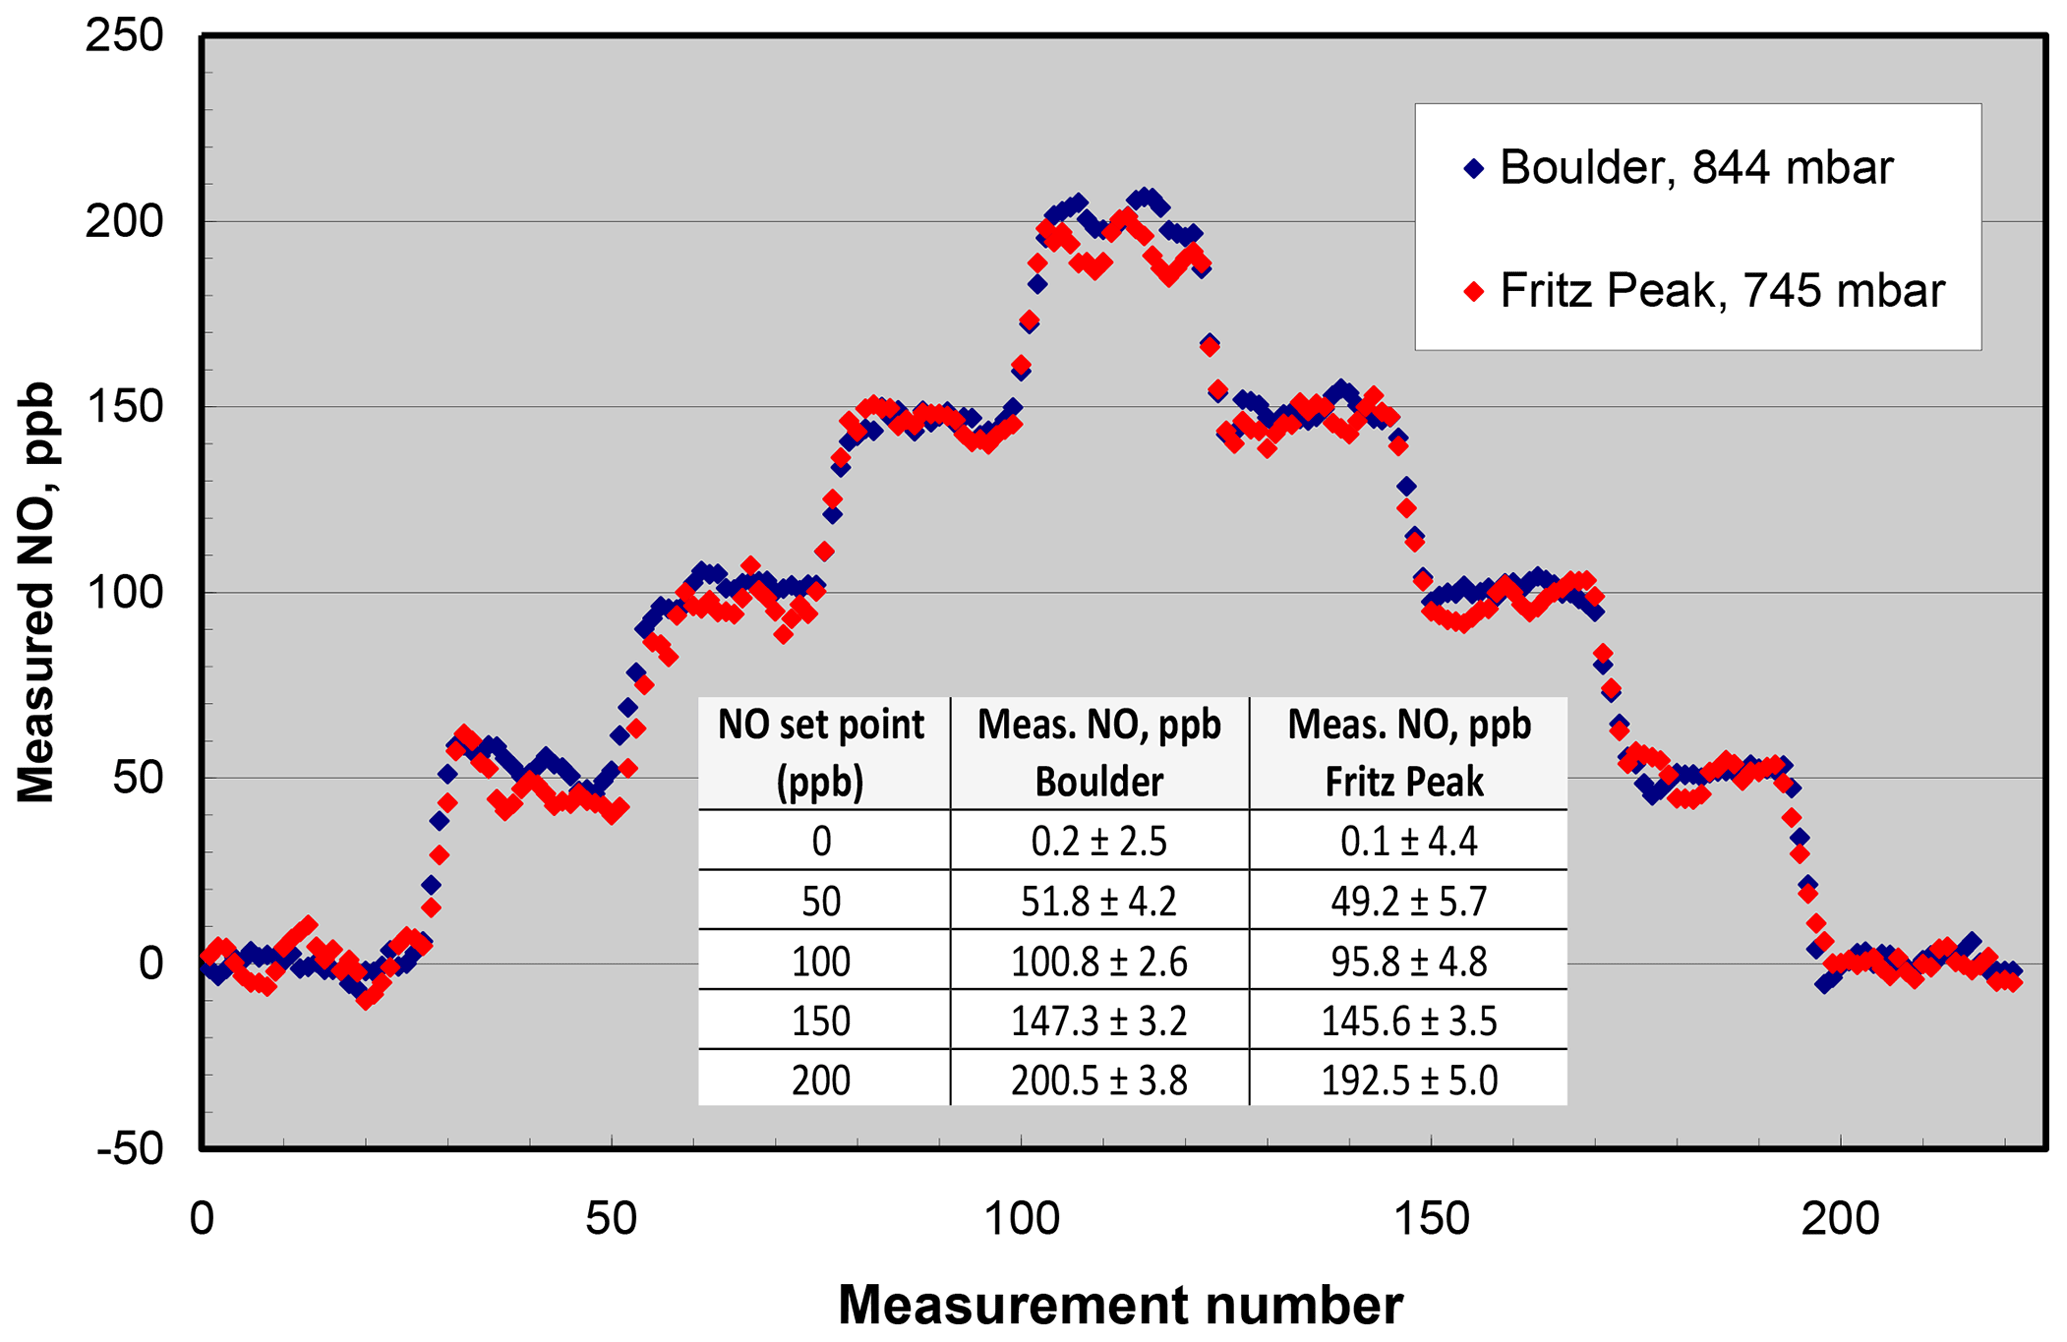
Figure 7NO measured from the output of a Model 408 NO Calibration Source in Boulder, CO (elevation 1.6 km), and Fritz Peak, CO (elevation 2.7 km). The inset panel gives the averages and standard deviations (1σ) at the different NO set points of the calibrator. Measurements were made every 10 s.
Using the NO calibration source from a Model 714 calibrator (), a 6×6 verification was undertaken to ascertain whether it could be used as a traceable transfer standard for NO. Figure 6 shows the calibration plots obtained over 6 d using a recently calibrated 2B Technologies Model 405 monitor to detect the generated NO. Due to the high reproducibility, the results are also given in tabular form (Table 2), including the measured slopes, intercepts, and correlation coefficients from a linear regression. As can be seen, day-to-day variations are not statistically different from the precision of the measuring analyzer ( ppb) with the exception of the highest (1000 ppb) point, which has a slightly higher standard deviation (±5.2 ppb). However, this is still a precision that is <1 % of the measured value. From the linear regressions it can be seen that the standard deviation in the intercepts is 1.2 ppb, below the 1.5 ppb required of Level 4 ozone transfer standards. Also, the standard deviation in the slopes is only ±0.004 or 0.4 %, which is substantially below the required level of 3.7 %. Therefore, it is obvious that the photolytic NO calibrator is highly stable and reproducible, and it successfully meets the same criteria set forth for the establishment of an ozone transfer standard.
4.1.2 Effects of temperature, pressure, and humidity on the photolytic NO calibration source
In order to test for the effect of temperature on the NO concentrations produced, the output mixing ratio of a Model 408 NO Calibration Source was measured using a program consisting of steps of 0, 50, 100, 150, and 200 ppb at ambient temperatures of 23.5 and at 8.5 ∘C . Mixing ratios were measured using a 2B Technologies Model 400 NO monitor. The low temperature was achieved by placing the calibrator in an ice chest, allowing it to cool, and then powering the instrument on. The output was directed out of the ice chest and sampled by the NO monitor at room temperature. At start-up, the instrument showed that the photolysis chamber was at 8.5 ∘C. Results of measurements at the two temperatures are summarized in Table 3. Data at the two temperatures agree very well within the standard deviation of the measurements.
Table 3Summary of the effect of temperature on the NO output concentration from a 2B Technologies Model 408 NO Calibration Source.
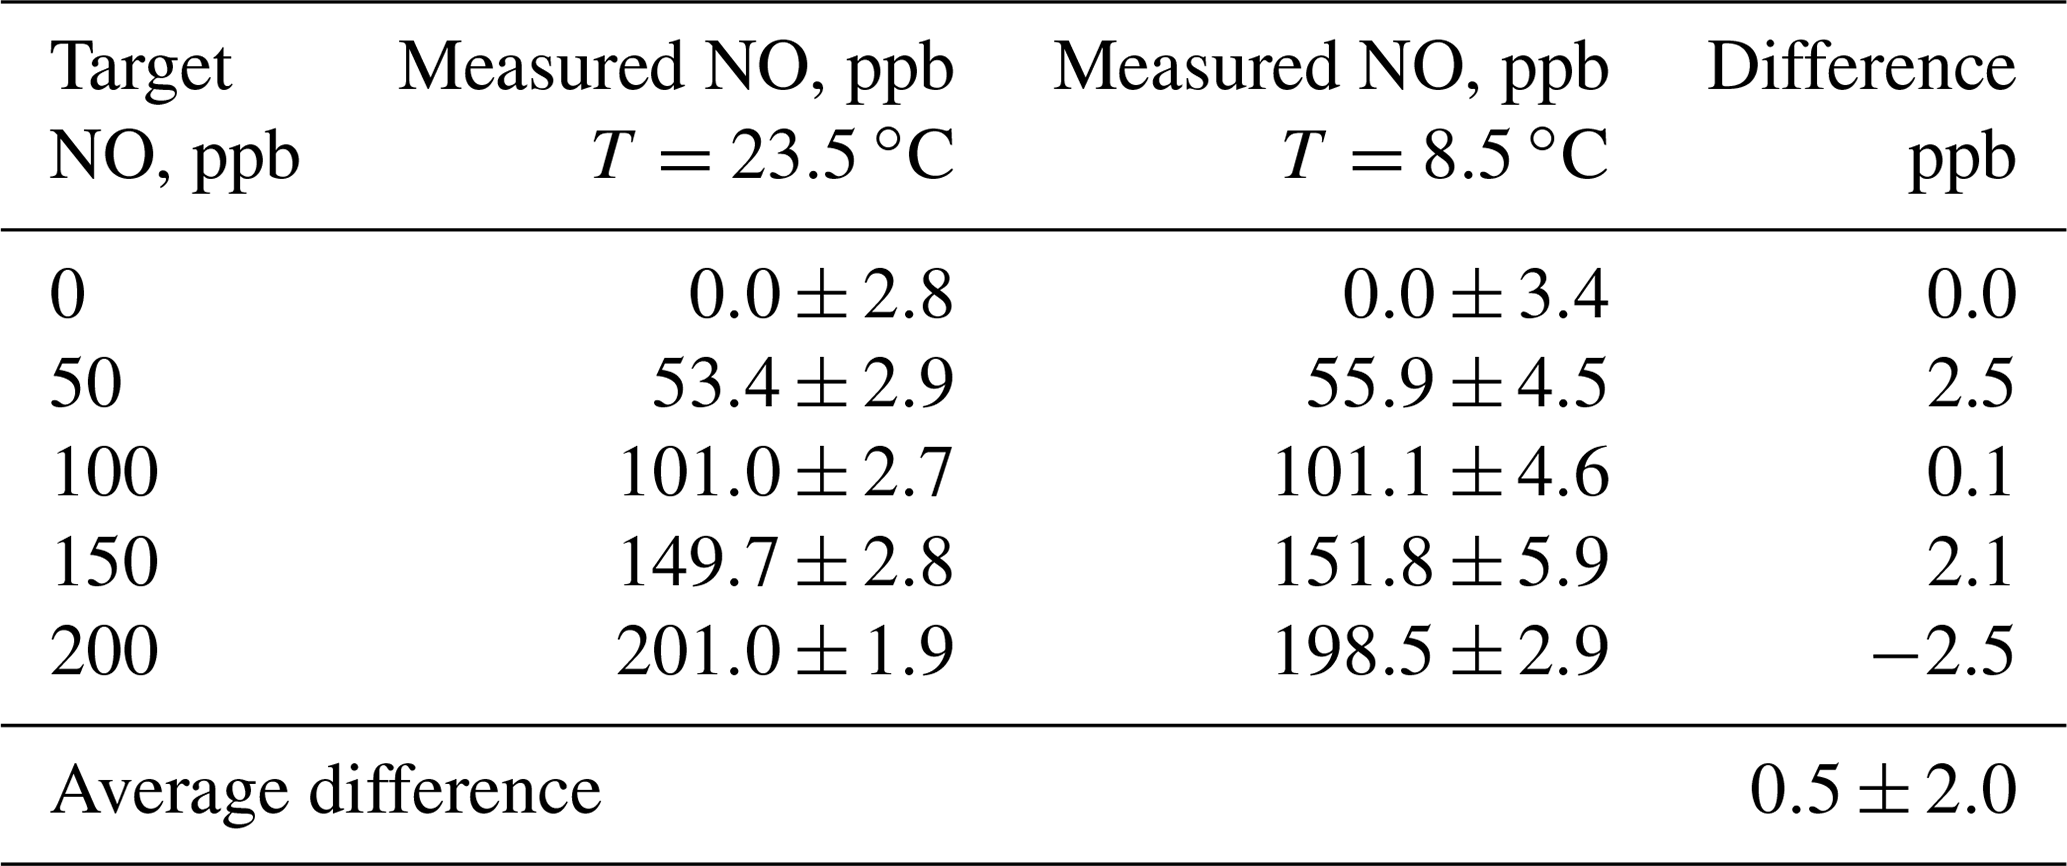
The average difference between measurements at the two temperatures is 0.5±2.0 ppb, i.e., well within the noise of the measurements. The average precision at 8.5 ∘C was ±4.3 ppb compared to ±2.6 ppb at 23.5 ∘C. Although a large fraction of this imprecision can be attributed to the 2B Technologies Model 400 Nitric Oxide monitor, it does appear that there is an increase in the measured standard deviations at the lower temperature from the output of the calibrator. The increased power draw from heating the photolysis chamber may affect the Hg lamp stability, causing this decrease in precision at lower temperatures. Thus, it appears that there is no significant dependence of the output concentration of the NO calibrator on temperature in the range 8.5 to 23.5 ∘C; however, there is small loss of precision at lower temperatures.
Lack of significant dependence of the NO calibrator on ambient pressure has been confirmed many times by measuring the output NO mixing ratio of instruments calibrated in Boulder, Colorado (1.6 km elevation, 844 mbar pressure), and shipped to other locations, typically at much lower elevations. In order to extend the range of pressure testing to lower pressures, the NO output was measured in Boulder and at Fritz Peak (2.7 km elevation, 745 mbar) near Rollinsville, Colorado. The NO calibrator and Model 400 NO monitor were battery-powered at the Fritz Peak location. Again, concentrations from 0 to 200 ppb were measured at the two locations (see Fig. 7). As can be seen in the figure, within the precision of the measurements, there is no discernible difference between the measurements at the two different altitudes. Linear regressions of the measured NO values vs. NO set point (given in the inset panel in Fig. 7) indicate a slightly lower slope (∼3 %) at the higher-elevation site. If there is a slight falloff in output concentration at high altitudes, it could be explained by the lack of optical thickness within the N2O photolysis chamber due to the reduced pressure. The pressure and therefore molecular concentration are only slightly higher in the photolysis chamber than that of ambient air, so the fraction of 185 nm light absorbed decreases slightly as ambient pressure decreases.
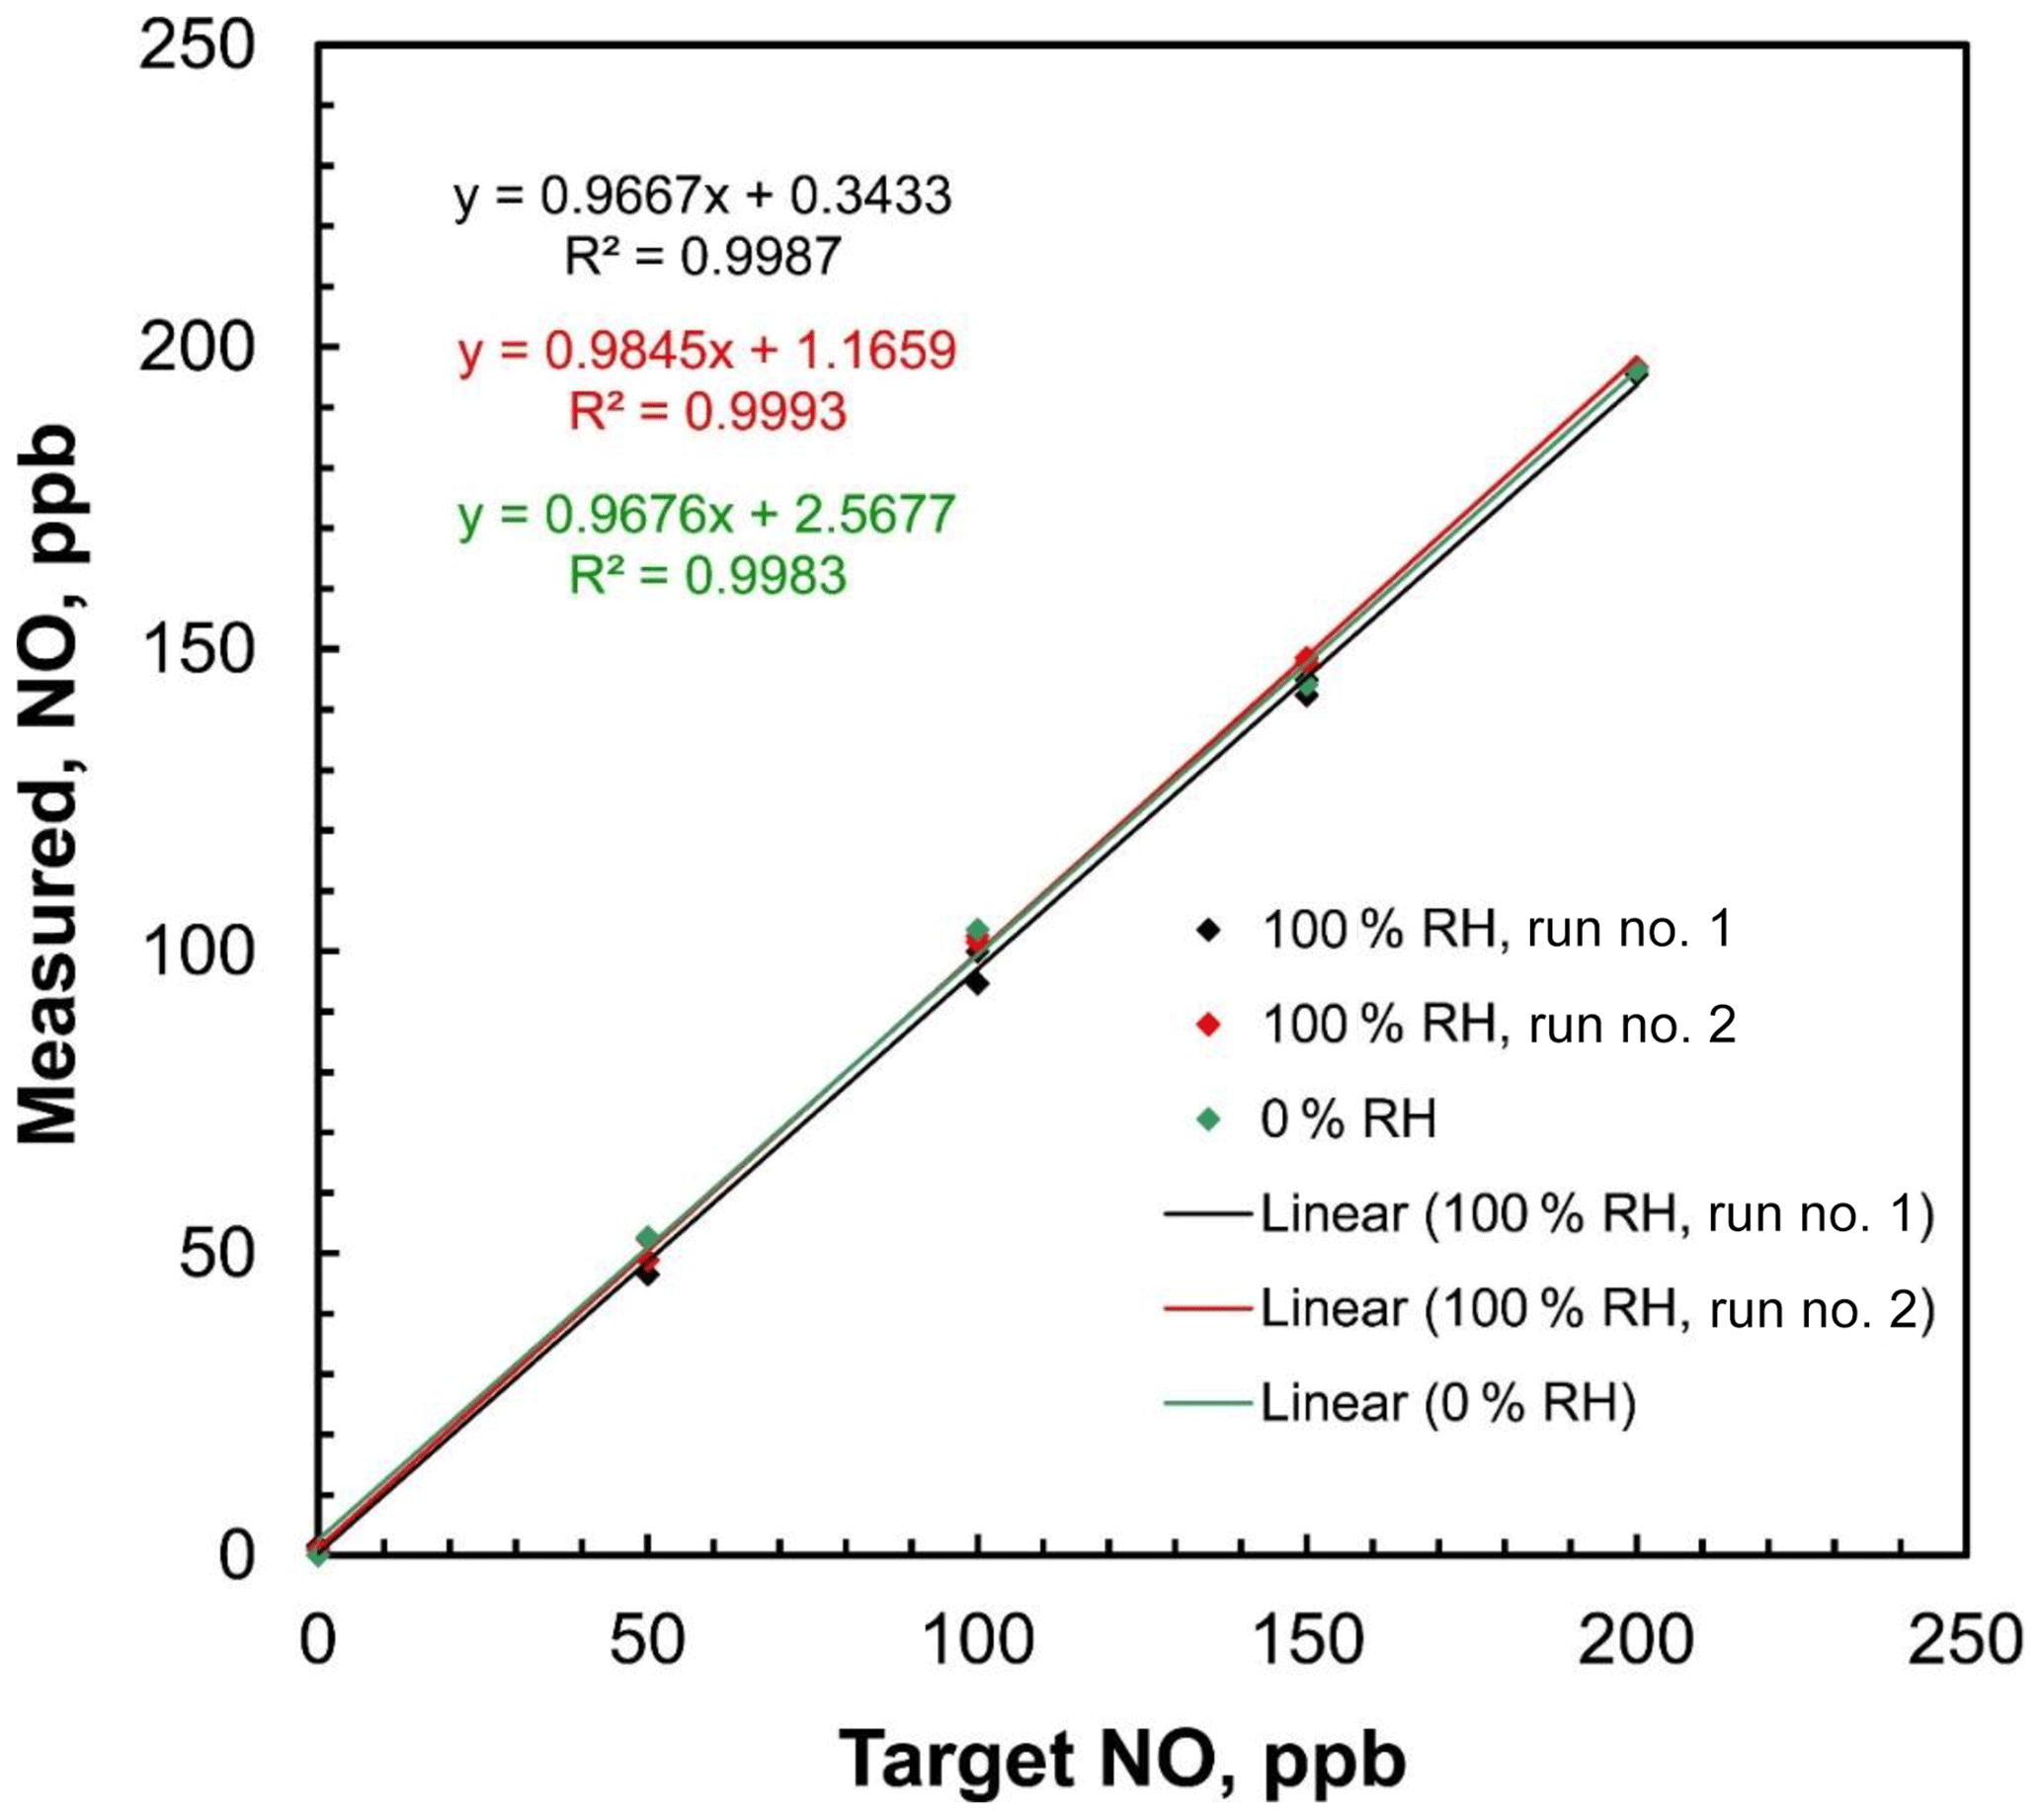
Figure 8Linear regressions of measured NO concentrations vs. target concentrations of the 2B Technologies Model 408 NO Calibration Source with dilution air containing both 0 % and 100 % relative humidity at 23.5∘ C.
Since pure N2O is the only gas passing through the photolysis chamber, ambient humidity should have no effect on the NO output rate. Humidity can only affect the overall NO output by affecting the output of the airflow mass flowmeter, causing small errors in the calculated dilution. Because water has a different heat capacity than air (∼30 % larger), an airflow saturated with water vapor at 1 atm and 25 ∘C (saturation vapor pressure 31.7 mbar, H2O mole fraction 3.1 %) has a heat capacity that is about 0.9 % higher than that of dry air. Since the mass flow rate measurement is proportional to heat capacity and the NO calibration source adjusts the lamp intensity to produce NO in proportion to the measured total mass flow rate, one could expect a small (∼1 %) error in the output mixing ratio. This would likely be within the uncertainties of most analytical NO monitors. The effect of humidity on the NO calibration source output was tested by using a 2B Technologies Model 400 Nitric Oxide Monitor to measure step profiles of 0, 50, 100, 150, and 200 ppb at both 0 % and 100 % relative humidity (RH). The target humidities were generated by supplying the air inlet of the NO calibration source with zero air from a compressed gas cylinder (0 % RH) and then humidifying that flow to ∼100 % RH by passing it through a Nafion tube submerged in warm water. The 100 % RH experiment was run twice. Ambient temperature was 23.5 ∘C. For all experiments, the relative humidity was measured using a Cole–Parmer model 37951-00 thermohygrometer inserted in line with the supply airflow. Plots of measured NO concentration vs. target concentration are shown in Fig. 8. The slopes of the regression lines were 0.968 at 0 % RH and 0.967 and 0.985 for two sequential calibrations made at 100 % RH. Within measurement error, there was no statistical difference between dry air and 100 % RH air, confirming the expectations that any humidity effect is within the statistical uncertainty of the analyzer.

Figure 9Plots of the O3 measured vs. the O3 set point in a Model 714 calibrator on six consecutive days. Regression slopes and intercepts are given in the panel on the right.
4.2 calibration source
The 2B Technologies Model 714 Calibration Source is a combination of a Model 306 Ozone Calibration Source and a Model 408 NO Calibration Source (Sect. 4.1) that allows for the generation of calibrated mixing ratios of either O3, NO, or NO2 (the latter via the GPT Reaction R3). The NO source is identical to the one described in Sects. 3.1 and 4.1, except the N2O flow rate is typically lowered to around 40 cm3 min−1 compared to the earlier Model 408 NO Calibration Source. As noted in Sect. 3.1, the NO output is not affected by the choice of N2O flow rate due to the optical opacity of the N2O. The ozone calibration source in the Model 714 differs from that described previously for the Model 306 (Birks et al., 2018b) in that only a small fraction of the airflow passes through the photolysis cell (described in Sect. 2.2). For the generation of NO2, the outputs of the NO and O3 photolysis cells are mixed and allowed to react within a Teflon reaction volume (described in Sect. 3.3) to quantitatively convert O3 (which is lower in concentration) to NO2 before final dilution to the prescribed set point concentration.
4.2.1 Water vapor effects and verification of the modified photolytic O3 calibration source
Section 4.1.2 showed that the effects of water vapor are very small (<0.5 %) on the NO output from dry air up to air saturated with water vapor. Since the NO photolytic generator is unchanged in the calibrator, it also shows minimal effects due to changing humidity. However, the stand-alone ozone calibrator (Model 306) operates using rather different flow rates (and therefore residence times) than the ozone photolysis cell in the calibrator described here. Birks et al. (2018a) found that the chemical loss of ozone due to OH and HO2 radicals (generated either by water photolysis at 184.9 nm or by ozone photolysis and subsequent reaction of O(1D) with H2O) was a negligible effect on the ozone output in the stand-alone ozone calibrator (the Model 306). The only effect of water vapor was the small dilution of the O2 precursor by water vapor in the photolysis cell that results in a small of reduction of the ozone generated (up to ∼2 %). But the flow rate through the ozone photolysis cell in the calibrator is ∼60 times slower than in the stand-alone Model 306 (50 cm3 min−1 compared to 3 L min−1). Therefore, the longer residence time generates considerably higher concentrations of ozone, resulting in higher concentrations of HOx (OH and HOx) radicals when water vapor is present, which, in turn, can catalyze ozone depletion.
Modeling of the photolysis chemistry using the reaction kinetics model described in Birks et al. (2018b) suggested that at a relative humidity of 25 % (at 298 K), the ozone output in the calibrator would be reduced by 3.4 % when attempting to output 500 ppb (a loss of 17 ppb). The ozone loss was also nonlinear – a smaller percent loss at lower O3 set points. This is due to the nonlinear nature of the HOx catalytic ozone destruction cycle that is driven by the high concentrations of ozone in the photolysis chamber.
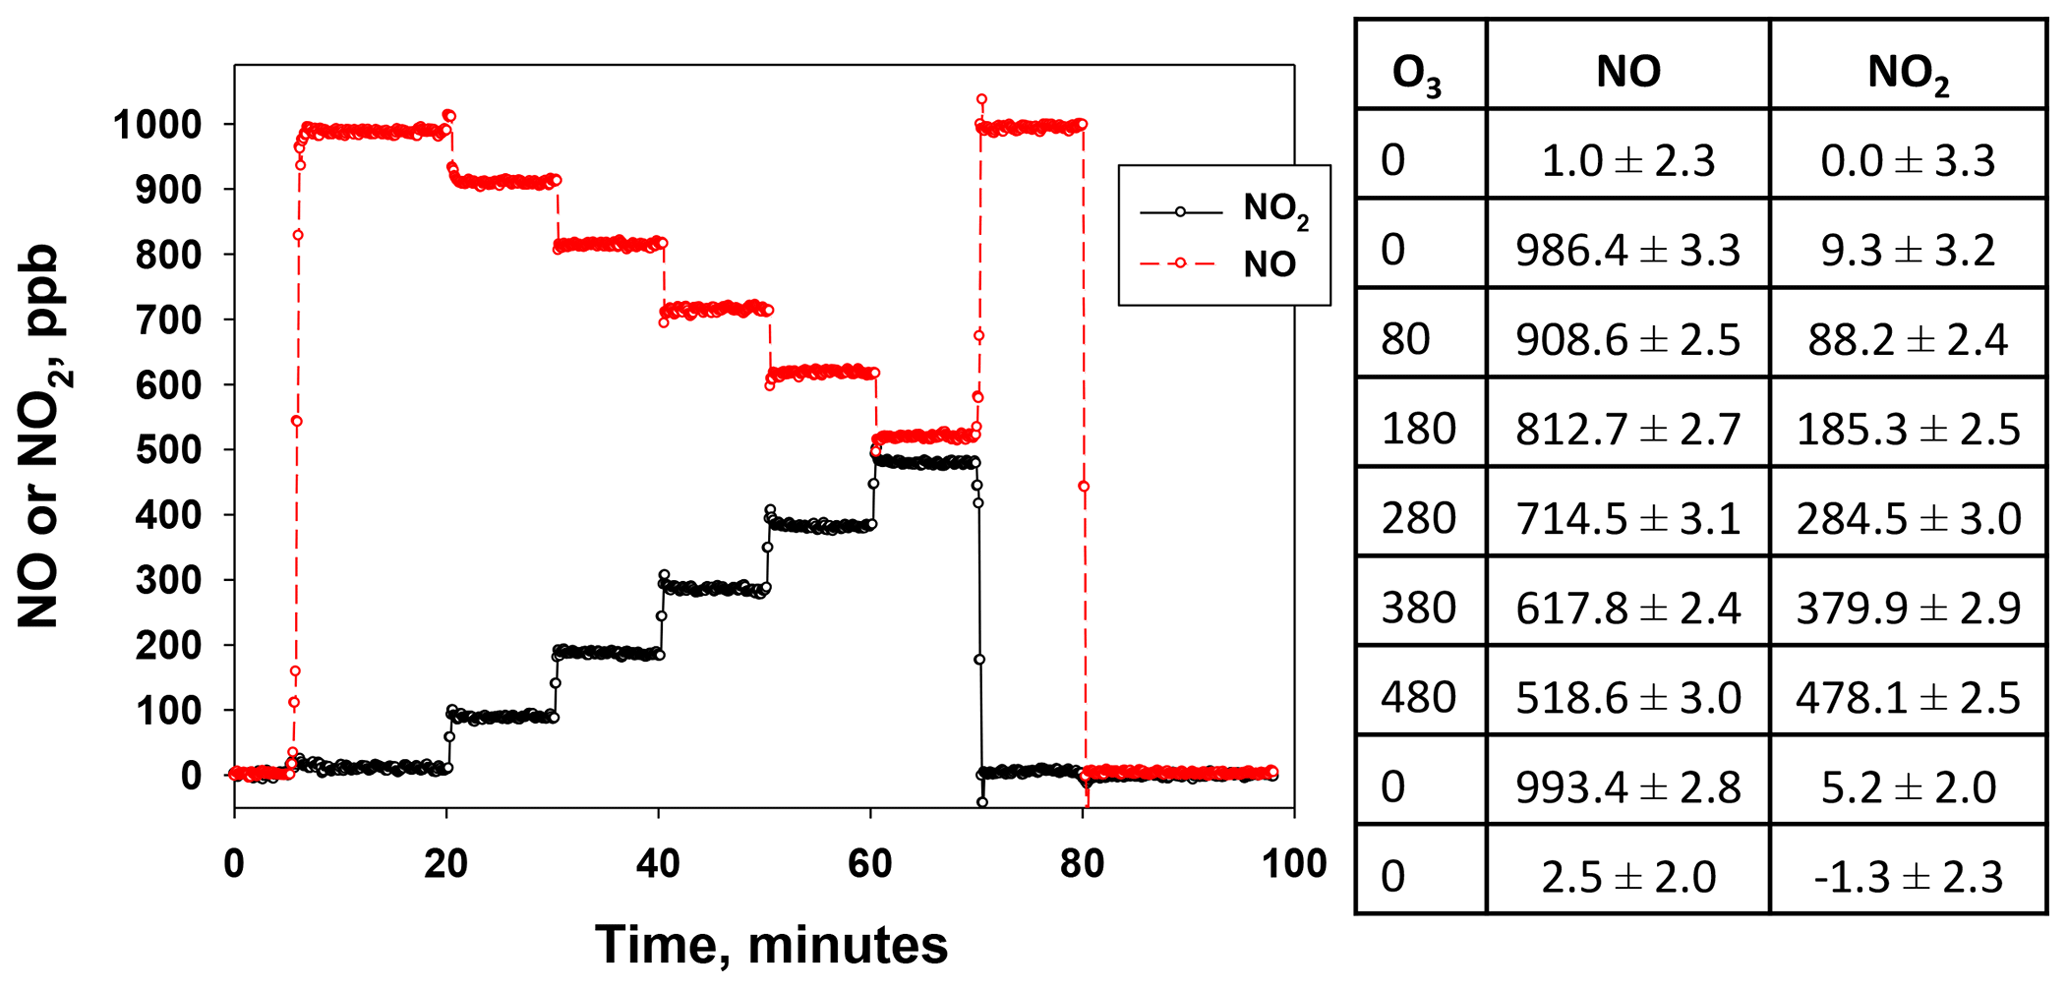
Figure 10NO and NO2 measured from the output of a Model 714 GPT calibrator. At time 5 min, NO was set to 1000 ppb. At time 20 min, ozone was added and set points were varied between 80 and 480 ppb in steps of 100 ppb (this allowed for visual clarity of both NO and NO2 at the highest [O3]). O3 was changed every 10 min. Finally, data for [O3] = 0 and [NO] = 0 were repeated for completeness. NO and NO2 were measured using a calibrated 2B Tech Model 405.
Experimental results showed that at low RH (RH = 6 %–10 %), the observed decreases in ozone output in the calibrator relative to dry air (RH<1 %) were on the order of 2 %–3 % for an output concentration of 500 ppb (i.e., 11 to 16 ppb). This is in reasonable agreement with the ∼1.5 % decrease predicted by the photochemical model. However, at a more typical relative humidity level of 25 %, observed ozone decreases were significantly greater than those predicted. As mentioned above, predicted losses suggested a 3.4 % loss at 500 ppb; however, observations ranged from 6 % to 12 % (34 to 60 ppb). Therefore, it appears there is even greater chemical loss than expected. As a result of the very nonlinear nature of the chemistry when water vapor was present, it was necessary to dry the air prior to entering the ozone photolysis chamber of the calibrator. An 80 cm3 silica gel trap (United Filtration, IACH-38-150-80-SG) was added in line to reduce the RH to <1 % in the O3-precursor airflow (see Fig. 3). A relative humidity and temperature sensor was also placed just before the ozone photolysis chamber to monitor the RH and warn the user if the humidity rose to significant levels (RH>2 %) such that ozone outputs could be impacted by more than 1 %. At the typical flow rate of 50 cm3 min−1, this trap maintained the RH below 2 % for more than 24 h of continuous operation. It should also be noted that once the air for the ozone photolysis has been dried, there is no significant amount of water vapor present in the GPT reaction zone, as the flow consists only of dry air∕O3 and dry N2O∕NO, thereby eliminating any possibility of water vapor affecting the GPT chemistry.
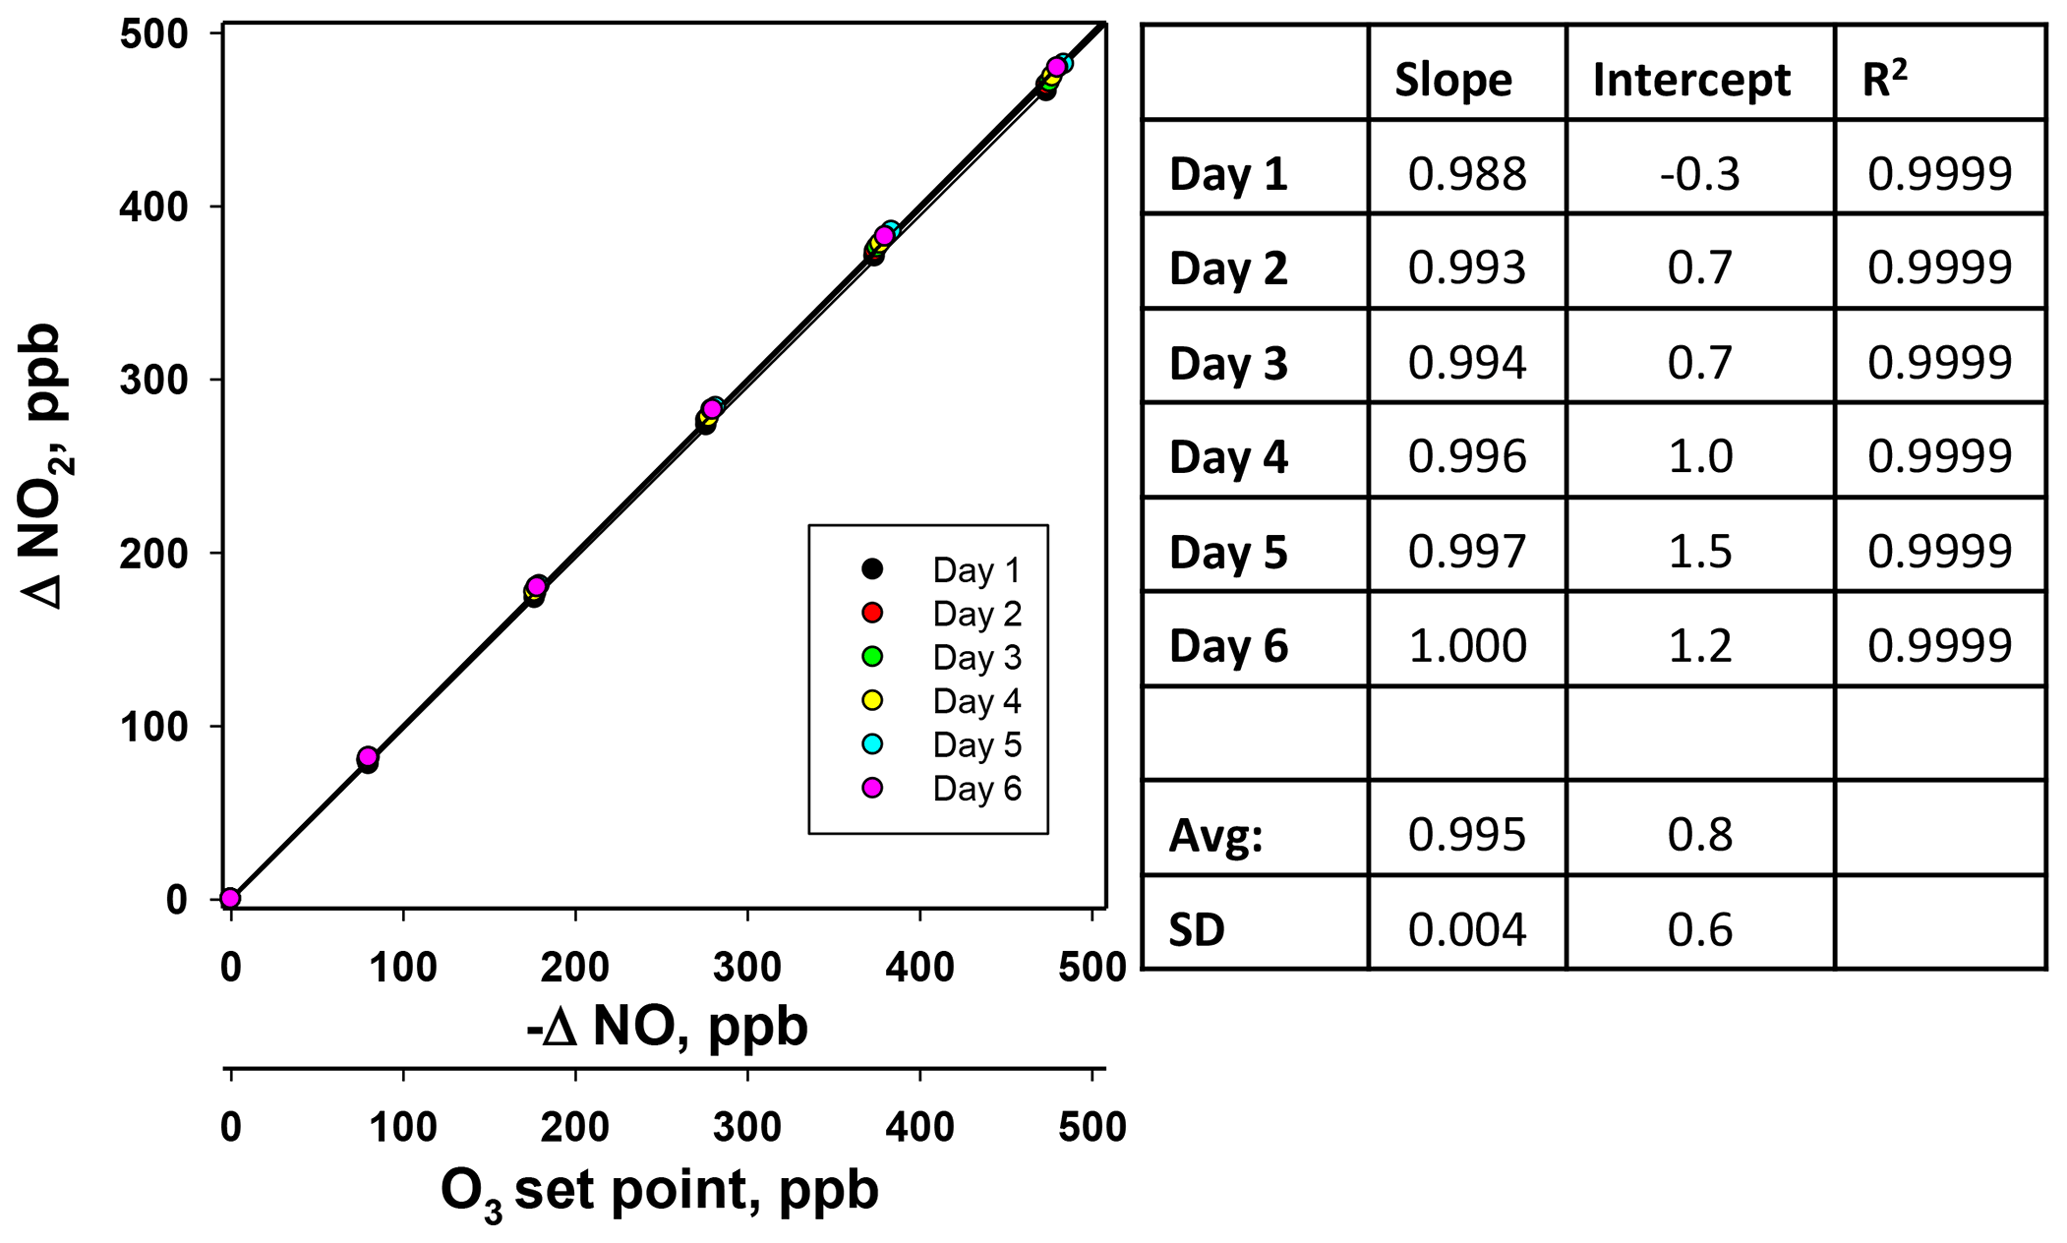
Figure 11Calibration curves for NO2 made on six consecutive days. and - – NO at each ozone set point. Slopes, intercepts, and correlation coefficients are reported in the panel to the right.
After the insertion of the dryer, a 6×6 verification was performed for this slightly modified ozone calibration source used in the calibrator. Ozone concentrations were measured with a 2B Technologies Model 205 Ozone Monitor that had been recently calibrated relative to our primary ozone standard (Sect. 3.3). Calibration plots and results of the linear regressions are shown in Fig. 9. Both the standard deviations in the slopes and intercepts are well within the U.S. EPA transfer standard requirements (σslope<3.7 %, σintercept<1.5 ppb), thereby confirming that the adaptations made in the O3 photolysis system for use in the calibrator do not adversely impact its use as an O3 transfer standard.
4.2.2 Precision, accuracy, and reproducibility of the NO2 calibration source
Figure 10 shows mixing ratios of NO and NO2 produced by a Model 714 Calibration Source (as measured by a Model 405 monitor) for an automated sequence of several NO2 concentrations. The NO set point remained constant at 1000 ppb from 5 to 80 min during the sequence. Six different ozone concentrations (i.e., equal to the target NO2 concentrations) were then generated (set points 0, 80, 180, 280, 380, 480 ppb of ozone), each lasting 10 min (note that the use of 480 ppb instead of 500 ppb allows for visual clarity in the time series graph at the highest concentration). As seen in the figure, NO2 increases as NO decreases due to its reaction with ozone. The time required to reach a new set point is typically <45 s. The measured concentrations averaged over the last 5 min of each step are shown in the panel to the right of the figure along with observed precisions (1σ). Note that the precisions for steps 2–8 are nearly the same as those in steps 1 and 9, in which no reagent gases were being produced. This suggests that the observed precisions are limited by the measuring analyzer and that the actual precisions of the output NO and NO2 concentrations from the calibrator are lower ( ppb for NO, ppb for NO2, the average precision from Fig. 10).
Also note the small amount of NO2 produced by the NO photolysis source (9.3 ppb, ∼0.9 % of the NO; see Fig. 10). As discussed in Sect. 4.2.3, this NO2 is typically small (≤ 2 % of the NO produced), and it is also constant over a given calibration with a set NO concentration. Therefore, a step in which NO is present with no accompanying O3 must be included to measure and subtract out this small amount of photolytically produced NO2.
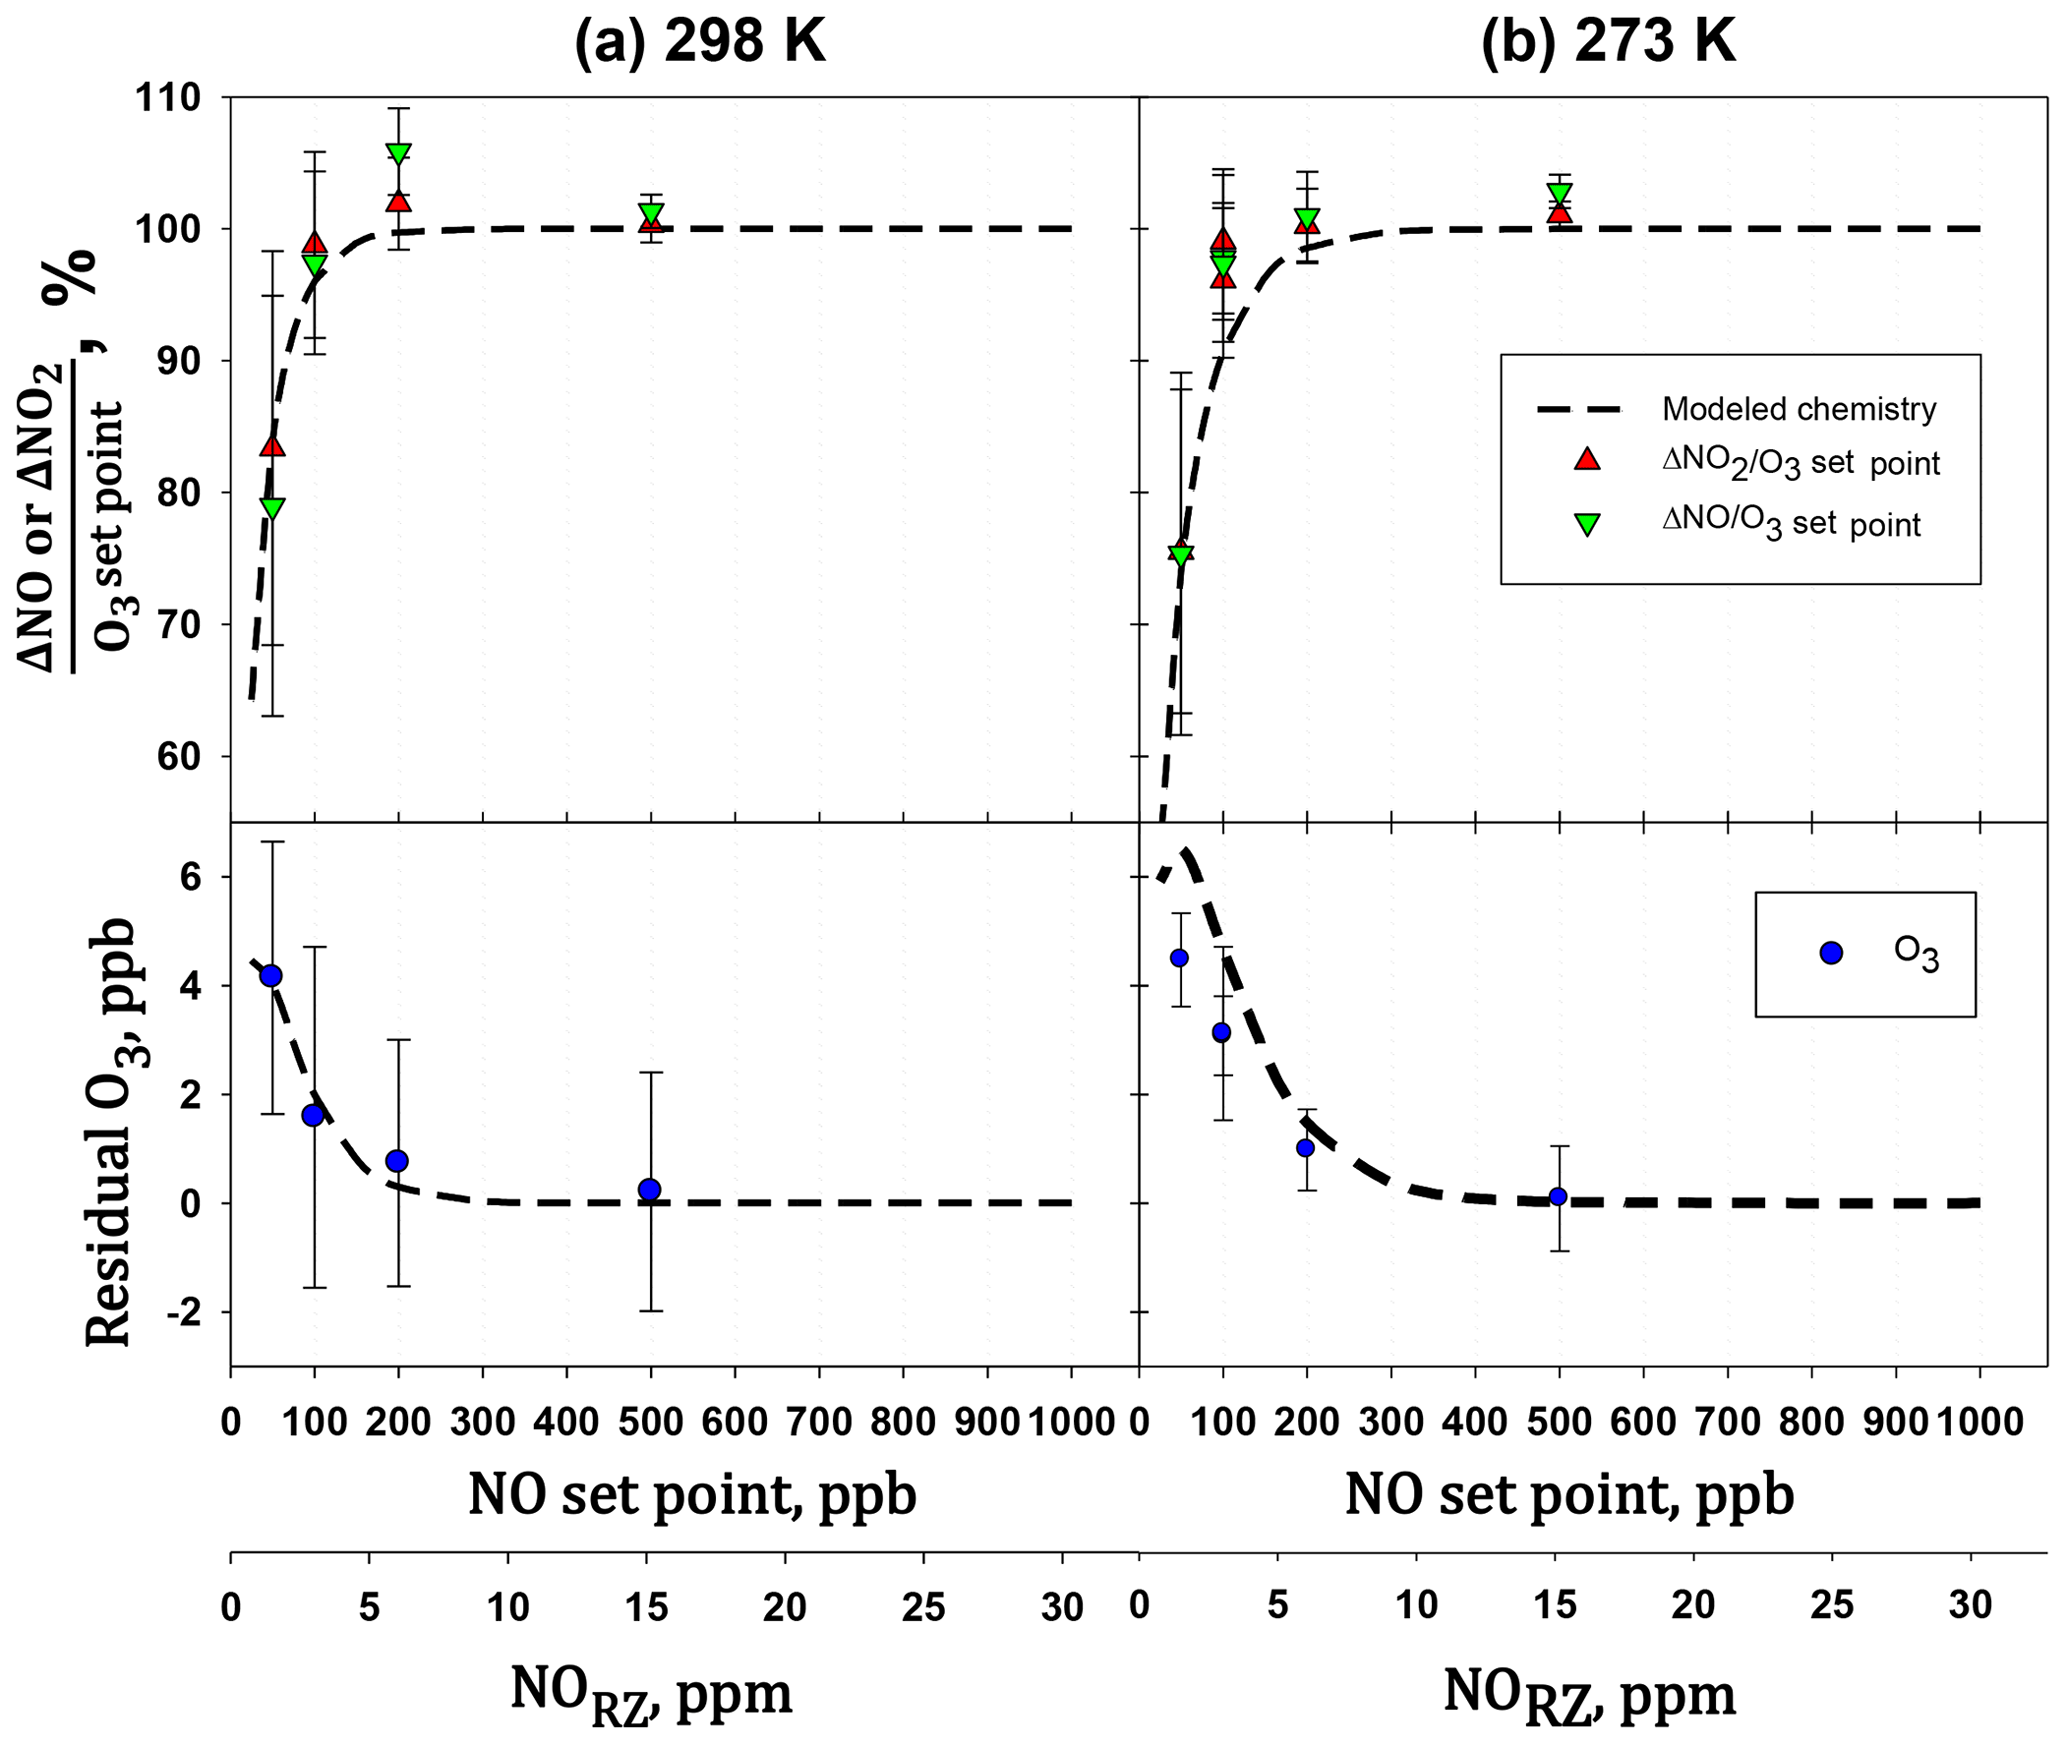
Figure 12Plots of the amount of NO consumed (ΔNO∕O3 set point) and NO2 formed (ΔNO2∕O3 set point vs. the NO set point. A second x axis of the NO concentration in the reaction zone (NORZ) is also given as a reference to Fig. 1. Measurements were made with the reaction zone at (a) 298 K and (b) 273 K.
Figure 11 shows the results of a 6×6 verification for NO2 produced by the Model 714 calibrator along with the results from the linear regressions. As seen in the figure, plots were extremely linear (high R2), with slopes near unity, and reproducible from day to day. Relative standard deviations of the slope and intercepts were 0.4 % (compared with the required <3.7 %) and 0.6 ppb (compared with the required <1.5 ppb), respectively. Thus, all three reactants (O3, NO, and NO2) produced in the Model 714 calibrator pass the statistical tests established for a Level 4 ozone transfer standard.
4.2.3 Completeness of reaction and effects of temperature and pressure
Complete conversion of ozone to NO2 is not critical if NO is measured as well (then -Δ[NO]=Δ[NO2] and the NO2 signal can be calibrated relative to NO); however, the conversion efficiency is important for cases in which the NO2 produced must be compared to the ozone generated by the calibrated photolysis source. In a general sense, complete conversion also simplifies the chemical system and reduces the chance for undesirable chemistry. It is also important to limit the amount of ozone exiting the calibrator in the case of NOx analyzers that use a photolytic NO2 converter as the conversion efficiency of these converters is known to depend upon ozone concentration (see, e.g., Pätz et al., 2000). The modeling exercise described earlier (see Fig. 1) suggests >99 % reaction of the ozone for NO output concentrations greater than about 130 ppb (or ∼4 ppm in the reactor) at 1 atm (1013 mbar), 298 K, and a reaction time of 4 s. Although the temperature and pressure do not affect the output mixing ratios from the photolytic sources of ozone and NO, these factors can impact the GPT chemistry occurring within the reaction zone. Reaction (R3) has a rather substantial activation energy ( K−1; Burkholder et al., 2015), resulting in a smaller rate coefficient with decreasing temperature. Lower pressures have the effect of reducing the overall number density of the reactants, which is key to driving Reaction (R3) to completion. Although the photolytic sources (O3 and NO) described here output constant mixing ratios with varying pressure, the number density (molec cm−3) of ozone and nitric oxide do vary with overall pressure changes.
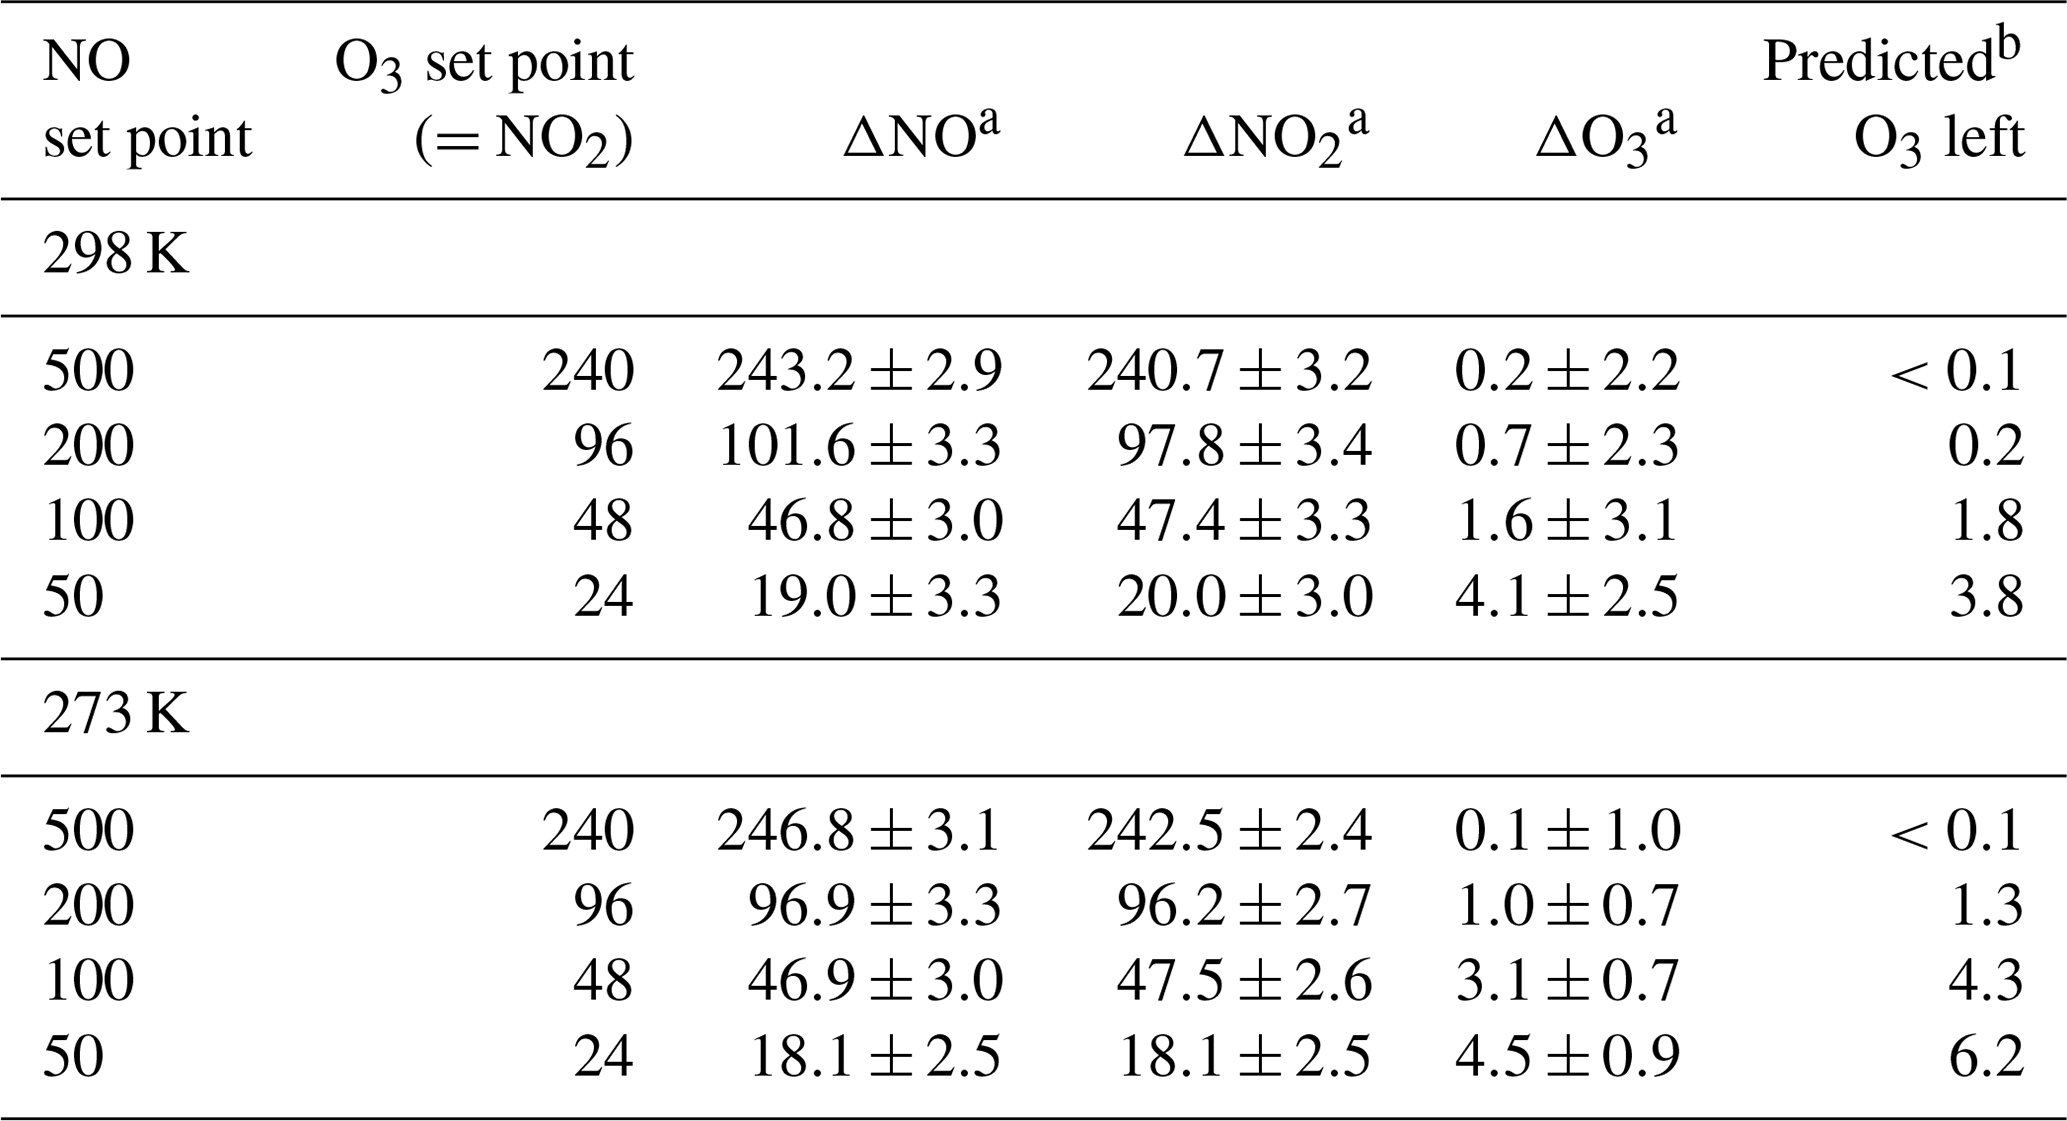
Table 4O3, NO, and NO2 measured at the output of a Model 714 for the NO and O3 set points given in columns 1 and 2. The pressure was 830 mbar. All units are in parts per billion.
a Concentration difference measured relative to when [O3] = 0 (no
ozone produced).
b From a model of second-order kinetics of the reaction chamber
chemistry at 830 mbar.
The extent of reaction was tested by measuring all three components (O3, NO, and NO2) for a variety of set point concentrations from the calibrator ([NO] varied from 50 to 500 ppb, [O3] from 24 to 240 ppb) while maintaining . Changes in O3, NO, and NO2 were measured relative to when [O3]=0 (i.e., – ). Table 4 shows the results from two experiments conducted at room temperature (25 ∘C, 298 K) and at 0 ∘C (273 K). Both experiments were conducted at a total pressure of 830 mbar (ambient pressure at our location in Boulder, Colorado, USA). Note that total pressure closer to 1 atm (as would be typical) results in larger number densities, thus driving a higher extent of reaction. The temperature of the reaction zone was maintained by wrapping the reaction zone tubing in a flexible ice pack. The temperature was measured by attaching two thermocouples to the outside of the reaction zone tubing (one on each end). The extent of the conversion of NO to NO2 can be quantified by looking at either the loss of NO (-ΔNO∕O3 generated) or the formation of NO2 (ΔNO2∕O3 generated). Here, the O3 generated is the original set point of the ozone generator on the GPT calibrator. Complete conversion results in - set point (and thus -ΔNO∕O3 set point = ΔNO2∕O3 set point = 1). Figure 12 displays the results graphically by plotting the measured ΔNO∕O3 and ΔNO2∕O3 (as percentages) vs. the initial NO set point of the GPT calibrator. A second x axis is included, indicating the initial NO mixing ratio present in the reaction zone (RZ), which can be used as a reference to Fig. 1. The only difference between the modeled profiles in Fig. 12 and those from Fig. 1 is that here the model was run under the experimentally observed temperatures and pressures. Our measured results agree quite well with modeling of the chemistry. Complete consumption (>98 %) of the ozone was observed at NO set points above 200 ppb (∼6 ppm in the RZ) at the lowest temperature (273 K). At room temperature, this level drops to near 100 ppb (∼3 ppm in RZ) within the errors of the measurements. Note that at the lowest initial NO and O3 (NO set point 50, O3 set point 25) where there is measurable residual ozone (∼4–5 ppb), ΔNO2 is still equivalent to -ΔNO as expected from the stoichiometry of Reaction (R3). However, the percent error is considerably larger (∼15 %) due to the smaller concentration changes and the measurement precision of the Model 405 analyzer. It also bears reiterating at this point that it is critical to maintain at least a factor of 2 greater NO to drive the NO∕O3 reaction to completion. Currently the operating firmware of the Model 714 does not allow . Under these conditions, a general recommendation is that an NO set point of ≥200 ppb ensures complete ozone consumption.
In the present study we have described two different portable calibration devices that can be used to calibrate air quality monitors. The first uses the photolysis of nitrous oxide to reproducibly generate known concentrations of NO (commercially available as the 2B Technologies Model 408 NO Calibration Source). The second combines this NO generator with a photolytic ozone generator (by the photolysis of air), resulting in a single instrument capable of delivering calibrated mixing ratios of either NO, NO2, or O3 (the 2B Technologies Model 714 Calibration Source). The chemistry underlying the generation of each reactant was discussed, and experimental results verified modeling predictions of the chemical systems involved.
Since only a small amount of N2O is required, an 8 or 16 g cartridge can be utilized as the source gas in either calibrator, thereby eliminating the need for larger (and more expensive) gas calibration mixtures. This makes for the high degree of portability that is often necessary for the calibration of field-based analyzers that cannot easily be removed from service. Furthermore, we have shown that both the Model 408 and 714 produce calibrated mixing ratios that are independent of environmental variables such as temperature, pressure, and humidity. This is also an advantage when operating in field situations in which these variables are not controlled.
Both the NO and calibration systems are initially compared to NIST-traceable calibration standards (either NIST SRM gas mixtures or NIST-traceable ozone generators and/or photometers) to establish the relationship between photolytic lamp intensity and output mixing ratios of NO, NO2, and O3. Once this is known, variation of the photolytic lamp intensities can reproducibly generate known concentrations of these reactants. The photolytic calibration systems were shown to deliver output mixing ratios that were well within the guidelines required by the U.S. EPA to serve as transfer calibration standards for these important pollutants both in terms of accuracy and precision. Therefore, these calibrators can facilitate the calibration of analyzers at field locations where maintaining the high degree of accuracy and precision required by air quality compliance monitoring is challenging.
Experimental data presented here are available upon request to the authors (johnb@twobtech.com).
JWB, AAT, PCA, CJW contributed design and engineering of the calibrators described here. JWB, AAT, PCA, CJW, SS and BC were involved in experimental testing and JWB, AAT and CAE were involved in the manuscript preparation.
JWB, AAT, PCA, CJW, SS, BC, and CAE are employed by 2B Technologies, the manufacturer of the Model 408 NO Calibration Source™ and the Model 714 Calibration Source™ described in this paper.
Aerocrine AB of Stockholm, Sweden, provided partial funding for the development of the Model 408 Nitric Oxide Calibration Source.
This research has been partially supported by Aerocrine AB (private company funding).
This paper was edited by Lisa Whalley and reviewed by two anonymous referees.
Abman, S. H.: Inhaled nitric oxide for the treatment of pulmonary arterial hypertension, Handbook of Experimental Pharmacology, Vol. 218, Springer, Berlin, 257–276, 2013.
Andersen, P. C., Williford, C. J., and Birks, J. W.: Method to Produce a Calibration Reagent or Therapeutic Gas by Exposing a Precursor Gas to Ultraviolet Light, U.S. Patent No. US 10,207,927 B2, 19 February 2019, U.S. Patent and Trademark Office, Washington, DC, USA, 2019.
Atkinson, R., Baulch, D. L., Cox, R. A., Crowley, J. N., Hampson, R. F., Hynes, R. G., Jenkin, M. E., Rossi, M. J., and Troe, J.: Evaluated kinetic and photochemical data for atmospheric chemistry: Volume I – gas phase reactions of Ox, HOx, NOx and SOx species, Atmos. Chem. Phys., 4, 1461–1738, https://doi.org/10.5194/acp-4-1461-2004, 2004.
Bertram, T. H., Cohen, R. C., Thorn III, W. J., and Chou, P. M.: Consistency of
ozone and nitrogen oxides standards at tropospherically relevant mixing
ratios, J. Air Waste Manage. Assoc., 55, 1473–1479,
doi10.1080/10473289.2005.10464740, 2005.
Birks, J. W. and Bollinger, M. J.: Method and Apparatus to Detect a Gas by Measuring Ozone Depletion, U.S. Patent No. 7,045,359 B2, 16 May 2006, U.S. Patent and Trademark Office, Washington, DC, USA, 2006.
Birks, J. W., Andersen, P. C., Williford, C. J., Turnipseed, A. A., Strunk, S. E., Ennis, C. A., and Mattson, E.: Folded tubular photometer for atmospheric measurements of NO2 and NO, Atmos. Meas. Tech., 11, 2821–2835, https://doi.org/10.5194/amt-11-2821-2018, 2018a.
Birks, J. W., Williford, C. J., Andersen, P. C., Turnipseed, A. A., Strunk, S., and Ennis, C. A.: Portable ozone calibration source independent of changes in temperature, pressure and humidity for research and regulatory applications, Atmos. Meas. Tech., 11, 4797–4807, https://doi.org/10.5194/amt-11-4797-2018, 2018b.
Burkholder, J. B., Sander, S. P., Abbatt, J. P. D., Barker, J. R., Huie, R. E., Kolb, C. E., Kurylo, M. J., Orkin, V. L., Wilmouth, D. M., and Wine, P. H.: Chemical Kinetics and Photochemical Data for Use in Atmospheric Studies, Evaluation Number 18, JPL Publication, NASA, 15–10, 2015.
Cantrell, C. A., Zimmer, A., and Tyndall, G. S.: Absorption cross sections for water vapor from 183 to 193 nm, Geophys. Res. Lett., 24, 2195–2198, https://doi.org/10.1029/97GL02100, 1997.
Chilton, J. E., Timko, R. J., and Chuhta, E. J.: Nitrogen Dioxide Calibration Standards for Portable Monitors, Information Circular 9482, DHHS (NIOSH) Publication No. 2006-104, 2005.
Clark, R. H., Kueser, T. J., Walker, M. W., Southgate, W. M., Huckaby, J. L., Perez, J. A., Roy, B. J., Keszler, M., and Kinsella, J. P.: Low-dose nitric oxide therapy for persistent pulmonary hypertension of the newborn, N. Engl. J. Med., 342, 469–474, 2000.
Clyne, M. A. A., Thrush, B. A., and Wayne, R. P.: Kinetics of the chemiluminescent reaction between nitric oxide and ozone, T. Faraday Soc., 60, 359–370, 1964.
Creasey, D. J., Heard, D. E., and Lee, J. D.: Absorption cross-section measurements of water vapour and oxygen at 185 nm, Implications for the calibration of field instruments to measure OH, HO2 and RO2 radicals, Geophys. Res. Lett. 27, 1651–1654, https://doi.org/10.1029/1999GL011014, 2000.
Demerjian, K. L: A review of national monitoring networks in North America, Atmos. Environ., 34, 1861–1884, 2000.
Ellis, E. C.: Technical Assistance Document for the Chemiluminescent Measurement of Nitrogen Dioxide, Environmental Monitoring Series Report #EPA-600/4-75-003, 1975.
Fontijn, A., Sabadell, A. J., and Ronco, R. J.: Homogeneous chemiluminescent measurement of nitric oxide with ozone, Implications for continuous selective monitoring of gaseous air pollutants, Anal. Chem., 42, 575–579, 1970.
Haagen-Smit, A. J.: Chemistry and physiology of Los Angeles smog, Ind. Eng. Chem., 44, 1342–1346, 1952.
Iida, Y., Carnovale, F., Daviel, S., and Brion, C. E.: Absolute oscillator-strengths for photoabsorption and the molecular and dissociative photoionization of nitric oxide, Chem. Phys., 105, 211–225, 1986.
Kebabian, P. L, Herndon, S. C., and Freedman, A.: Detection of nitrogen dioxide by cavity attenuated phase shift spectroscopy, Anal. Chem., 77, 724–728, 2005.
Kebabian, P. L., Wood, E. C., Herndon, S. C., and Freedman, A.: A practical alternative to chemiluminescence-based detection of nitrogen dioxide: Cavity attenuated phase shift spectroscopy, Environ. Sci. Technol., 42, 6040–6045, 2008.
Kley, D. and McFarland, M.: Chemiluminescence detector for NO and NO2, Atmos. Technol., 12, 63–69, 1980.
Nishida, S., Takahashi, K., Matsumi, Y., Taniguchi, N., and Hayashida, S.: Formation of O(3P) atoms in the photolysis of N2O at 193 nm and O(3P)+N2O product channel in the reaction of O(1D)+N2O, J. Phys. Chem. A, 108, 2451–2456, https://doi.org/10.1021/jp0370340, 2004.
Paldus, B. A. and Kachanov, A. A.: Spectroscopic Techniques: Cavity-Enhanced Methods, in: Handbook of Atomic, Molecular, and Optical Physics, Part C: Molecules, edited by: Drake, G. W. F., Springer, Berlin, 633–640, 2006.
Pätz, H.-W., Corsmeier, U., Glaser, K., Vogt, U., Kalthoff, N., Klemp, D., Kolahgar, B., Lerner, A., Neininger, B., Schmitz, T., Schultz, M. G., Slemr, J., and Volz-Thomas, A.: Measurements of trace gases and photolysis frequencies during SLOPE96 and coarse estimate of the local OH concentration from HNO3 formation, J. Geophys. Res., 105, 1563–1583, 2000.
Ridley, B. A. and Howlett, L. C.: An instrument for nitric oxide measurements in the stratosphere, Rev. Sci. Instrum., 45, 742–746, 1974.
Robertson, D. J., Groth, R. H., Gardner, D. G., and Glastris, G.: Stability and analyses of nitric oxide in nitrogen, J. Air Pollut. Control Assoc., 27, 779–780, https://doi.org/10.1080/00022470.1977.10470491, 1977.
Steffenson, D. M. and Stedman, D. H.: Optimization of the operating parameters of chemiluminescent nitric oxide detectors, Anal. Chem., 46, 1704–1709, 1974.
U.S. EPA: Measurement Principle and Calibration Procedure for the Measurement of Nitrogen Dioxide in the Atmosphere (Gas Phase Chemiluminescence), U.S. Environmental Protection Agency, 40 CFR, Part 50, Appendix F, as amended 20 January 1983.
U.S. EPA: Reference Method for the Determination of Nitrogen Dioxide in the Atmosphere (Chemiluminescence), Quality Assurance Guidance Document 2.3, 58 pp., 2002.
U.S. EPA: Transfer Standards for Calibration of Air Monitoring Analyzers for Ozone, Technical Assistance Document, Ozone Transfer Standard Guidance Document 10/2013, Publication No. EPA-454/B-13-004, Office of Air Quality Planning and Standards, Air Quality Assessment Division, available at: https://www3.epa.gov/ttn/amtic/files/ambient/qaqc/OzoneTransferStandardGuidance.pdf (last access: October 2019), Research Triangle Park, North Carolina, 68 pp., 2013.
U.S. EPA: NO2 cylinder guidance for state-local agencies and gas producers, available at: https://www.epa.gov/air-research/no2-cylinder-guidance-state-local-agencies-and-gas-producers, last access: 5 September 2019.
Vranckx, S., Peeters, J., and Carl, S. A.: Absolute rate constant and O(3P) yield for theO(1D)+N2O reaction in the temperature range 227 K to 719 K, Atmos. Chem. Phys., 8, 6261–6272, https://doi.org/10.5194/acp-8-6261-2008, 2008.
Yoshino, K., Esmond, J. R., Cheung, A. S. C., Freeman, D. E., and Parkinson, W. H.: High resolution absorption cross sections in the transmission window region of the Schumann-Runge bands and Herzberg continuum of O2, Planet. Space Sci., 40, 185–192, 1992.