the Creative Commons Attribution 4.0 License.
the Creative Commons Attribution 4.0 License.
 | 04 Mar 2020
Evaluation of cloud properties from reanalyses over East Asia with a radiance-based approach
Bin Yao
Chao Liu
Zhiquan Liu
Chunxiang Shi
Hironobu Iwabuchi
Fuzhong Weng
Extensive observational and numerical investigations have been performed to better characterize cloud properties. However, due to the large variations in cloud spatiotemporal distributions and physical properties, quantitative depictions of clouds in different atmospheric reanalysis datasets are still highly uncertain. A radiance-based evaluation approach is introduced and performed to evaluate the quality of cloud properties from reanalysis datasets. The China Meteorological Administration reanalysis (CRA); the ECMWF fifth-generation reanalysis (ERA5); and the Modern-Era Retrospective analysis for Applications, Version 2 (MERRA-2), i.e., those reanalyses providing sufficient cloud information, are considered. To avoid the influence of assumptions and uncertainties on satellite retrieval algorithms, forward radiative transfer simulations are used as a bridge to translate the reanalyses to corresponding radiances that are expected to be observed by satellites. The simulated reflectances and brightness temperatures (BTs) are directly compared with observations from the Advanced Himawari Imager onboard the Himawari-8 satellite in the East Asia region. We find that the simulated reflectances and BTs based on CRA and ERA5 are close to each other. CRA represents the total and midlayer cloud cover better than the other two datasets, and ERA5 depicts deep-convection structures more closely than CRA does. Comparisons of the simulated and observed BT differences suggest that water clouds are generally overestimated in ERA5 and MERRA-2, and MERRA-2 also overestimates the ice clouds over cyclone centers. Overall, clouds from CRA, ERA5, and MERRA-2 show their own advantages in different aspects. The ERA5 reanalysis has the best capability to represent the cloudy atmospheres over East Asia, and the CRA representations are close to those in ERA5.
- Article
(12018 KB) - Full-text XML
- BibTeX
- EndNote


As an important element in the Earth's atmosphere, clouds play a vital role in the global radiation budget, the water cycle, and climate change. Cloud formation is governed by the balance between dynamical, thermodynamic, and microphysical processes (Boucher et al., 2013). Although the representations of clouds and cloud evolution in regional and global models have been significantly improved in the past few decades (Cess et al., 1989; Cotton et al., 2003; Arakawa, 2004), cloud is still one of the dominant uncertainties in the atmosphere and causes difficulties in understanding the energy budget and climate change (Dufresne and Bony, 2008; Boucher et al., 2013).
Atmospheric reanalyses, datasets that combine observations and forecasting products (Dee et al., 2011), provide multivariate records of global atmospheric circulation and are widely used in studies of climate change, initialization of numerical models, and satellite retrievals. With the advances in computation capability and the improvement in global observing systems, an increasing number of observed datasets are assimilated into reanalysis by more advanced data assimilation methods and systems, and the reanalysis is closer to depicting realistic atmospheres. A series of atmospheric reanalysis datasets have been produced, for example, the National Centers for Environmental Prediction (NCEP) 40-year reanalysis project (Kalnay et al., 1996), the ECMWF 40-year reanalysis (Uppala et al., 2005), the Japanese 25-year reanalysis (Onogi et al., 2007), the Modern-Era Retrospective analysis for Research and Applications (Rienecker et al., 2011), the ECMWF ERA-Interim reanalysis (Dee et al., 2011), and the Japanese 55-year reanalysis (Kobayashi et al., 2015). Some schemes and systems that support the assimilation of cloud-affected satellite radiance have been developed (Chevallier et al., 2004; McNally, 2009). However, it is still difficult to assimilate cloud information into the reanalysis; instead, it is forecasted by numerical weather prediction models (Free et al., 2016). Thus, most atmospheric parameters in the reanalysis are increasingly confident, but the representation of clouds is still challenging. Currently, it is important yet difficult to accurately and reasonably evaluate the cloud properties in different atmospheric reanalysis datasets.
Because of large spatial and temporal coverages, satellite observation is one of the best choices for the evaluation of output fields from numerical models. Some previous studies have conducted evaluations of reanalysis or model outputs based on satellite-retrieved products. This is known as the satellite- or retrieval-based approach. Interesting results are achieved by this method (Jakob, 1999; Waliser et al., 2009; Hashino et al., 2013), especially for the long-term cloud cover in the reanalysis. However, some evaluations by the retrieval-based approach may be questionable due to the nature of retrieval products (Matsui et al., 2014). Assumptions are needed to infer unknown quantities, and this will introduce inevitable uncertainties into the retrieval results. For example, the cloud vertical profile is one of the most essential properties in most models; cloud optical and microphysical properties from the radiometer retrievals are normally based on single-layer and homogeneous assumptions (Wind et al., 2013; Yang et al., 2015). The average relative differences in ice optical depth retrieved by the Advanced Himawari Imager (AHI) onboard Himawari-8 and the collocated Moderate Resolution Imaging Spectroradiometer (MODIS) are as large as 40 % (Lai et al., 2019), and even MODIS products from different collections show significant differences (Yi et al., 2017a, b). Among various assumptions, the scattering properties of cloud particle models themselves have significant uncertainties, and they are inconsistent in different retrieval approaches. Yi et al. (2017a, b) indicate that any mismatch in cloud optical parameterizations or retrieval algorithms could induce large biases in the retrievals.
Because directly quantitative or qualitative evaluations are straightforward, retrieval-based evaluation is an indispensable but questionable approach in the evaluation of atmospheric properties from various simulations. However, to avoid uncertainties associated with satellite retrieval algorithms, an alternative radiance-based comparison for the evaluation is introduced in our study. In this approach, radiative parameters, such as brightness temperature (BT) in the infrared (IR) channels or microwave channels and reflectance in the solar channels, are first calculated by a forward radiative transfer model (RTM), and calculated radiative variables are then compared with satellite radiative observations directly; i.e., no retrieval is involved. In other words, the RTMs, not the retrievals, build a bridge between modeled atmospheric parameters (e.g., those from the reanalysis dataset) and satellite observations (Zhang et al., 2019). This will effectively avoid frustration caused by the uncertainties of satellite retrieval algorithms. The method was applied to evaluate simulated cloud fields using the thermal IR observations by Morcrette (1991) and Yu et al. (1991). With the advantages of confident radiative information and the diversity of satellite observations, the radiance-based method has been applied to evaluate different cloud microphysics schemes (Han et al., 2013; Yao et al., 2018), precipitation microphysics schemes (Hashino et al., 2013), and even aerosol properties (Chaboureau et al., 2007) and has become an important way to better understand the microphysical and radiative properties of clouds, precipitation, and other atmospheric parameters.
This study extends the application of a radiance-based approach to evaluate the cloud properties in three reanalysis datasets: the China Meteorological Administration reanalysis (CRA); the ECMWF fifth-generation reanalysis (ERA5; Hersbach and Dee, 2016); and the Modern-Era Retrospective analysis for Research and Applications, Version 2 (MERRA-2; Gelaro et al., 2017). This is a new aspect in the evaluation of cloud and atmosphere properties from different atmospheric reanalyses. The radiative observations from AHI onboard the Himawari-8 satellite (Bessho et al., 2016) are used as the truth.
This paper is organized as follows. The datasets are introduced in Sect. 2. The method for the coupling of cloud microphysical parameters in the reanalysis and radiative variables in the RTM are described in Sect. 3. A detailed radiance-based evaluation of cloud properties from the reanalysis, including a case assessment and a long-term comparison, is presented in Sect. 4. Section 5 summarizes the study.
The newly developed Chinese first-generation atmospheric reanalysis CRA uses the National Oceanic and Atmospheric Administration Global Forecast System model and the Gridpoint Statistical Interpolation three-dimensional variation analysis data assimilation system (Wu et al., 2002; Kleist et al., 2009) with a T574 spectral resolution (34 km grid spacing). The final CRA product will span the period from 1979 to 2019 and be produced and released in late 2020. An interim version of CRA (CRA-interim) for a 10-year period (between 1 January 2007 and 31 December 2016) at a 6-hourly time interval was produced in February 2018. An abundance of data from in situ observations and multiple satellite instruments, especially for the East Asian regions, have been assimilated into CRA-interim. More than 50 kinds of satellite observations (e.g., microwave radiance from TOVS, ATMS, and MWHS; IR radiance from IASI and CrIS; ocean wind data from MetOp and SSM/I; and the atmospheric-motion-vector data from GOES, MTSAT, Himawari-8, MODIS, and AVHRR) are considered (Wang et al., 2018). Meanwhile, a large number of Chinese surface and radiosonde datasets have been assimilated into CRA (Liao et al., 2018). Those improvements significantly enhance the capability of CRA to reproduce realistic atmospheres over Asia. CRA-interim has 47 pressure levels from the surface to 0.27 hPa with a horizontal resolution of .
ERA5 is one of the latest-released numerical datasets of the recent climate. It is available for the period from 1979 to the present and will be extended from 1950 to the present. Satellite-observed BTs from AMSR-E, SSM/I, SSMIS, and TMI are assimilated for the cloud liquid water, column water vapor, and humidity sensitivities analysis, and BTs from GOES IMAGER, SEVIRI, MVIRI, and AHI are used for the analysis of water vapor and surface and cloud top temperature. The spatial resolution of ERA5 is , and the atmospheric data have 37 pressure levels from the surface to 1 hPa (Hersbach and Dee, 2016).
MERRA-2 is produced by the NASA Global Modeling and Assimilation Office with the Goddard Earth Observing System atmospheric data assimilation system. It provides data from 1980 to the present and is designed to build a bridge between the first MERRA reanalysis and the long-term goal of developing an integrated Earth system analysis (Gelaro et al., 2017). Compared with MERRA reanalysis, microwave and IR radiances from ATOVS and ATMS, hyperspectral IR radiances from IASI and CrIS, and the radiances from geostationary MSG SEVIRI and GOES satellites (GOES-11, GOES-13, and GOES-15) are considered. MERRA-2 is at a spatial resolution of with 42 pressure levels from the surface to 0.1 hPa.
To evaluate the quality of the three reanalysis datasets, satellite observations from AHI onboard Himawari-8 are used. Launched on 7 October 2014 and operated by the Japan Meteorological Agency since 2015, the Himawari-8 is one of the new-generation satellites of the multifunctional transport satellites. The AHI radiometer includes 16 bands from solar to IR, and we consider observations within the region from 80∘ E to 160∘ W and between 60∘ N and 60∘ S. The spatial resolution is 0.5–2 km at nadir, and the temporal resolution is 2.5–10 min (Bessho et al., 2016; Iwabuchi et al., 2018). The full-disk data we used are at a spatial resolution of .
All reanalysis datasets used in this study are at a 6 h time interval (four time steps each day), and the spatial resolutions are regridded to that of CRA by the inverse-distance-weighted method (Guan and Wang, 2007; Holz et al., 2008). An 8 d case and a general comparison with 36 d of data spanning 1 year (total of 144 realizations) are considered. Although the size of the evaluated datasets is small, statistically credible results are presented.
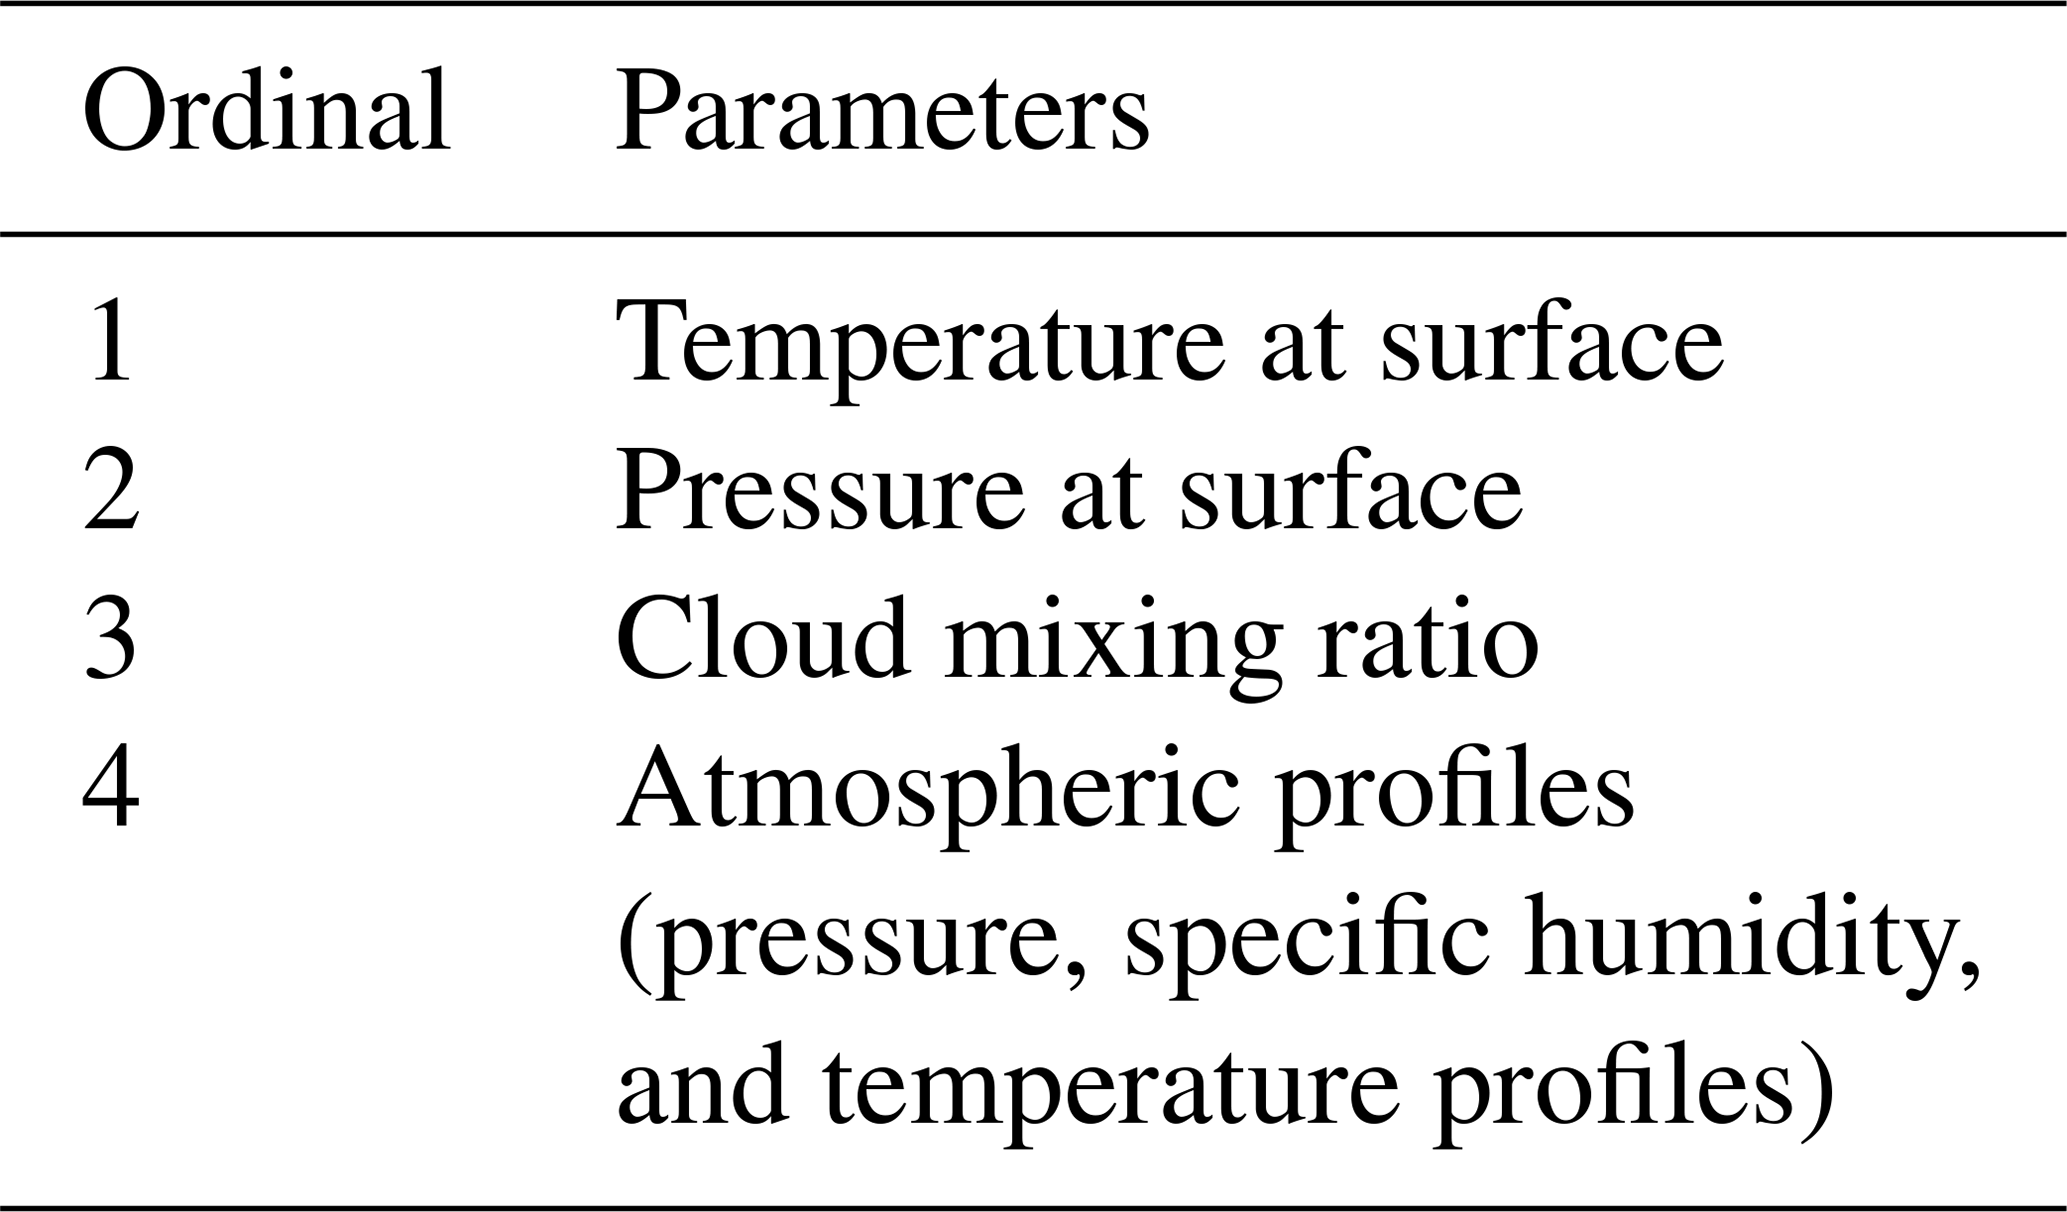
We focus on clouds in the reanalysis, so one of the most critical factors for the reliability of the evaluation is the treatments on cloud properties. Cloud effective radius (R) and optical depth (τ) are key parameters in determining the radiative properties in each atmospheric layer in the RTM. This means that the cloud mixing ratio (qc), i.e., variables from the reanalysis, cannot be directly considered by the fast RTM. A reasonable coupling method between the cloud properties provided by the reanalysis and the optical parameterizations used by the RTM has to be developed first, and we try to use a coupling approach with fewer empirical assumptions. Table 1 lists the geophysical parameters in the reanalysis that are used in our study. In each grid box, the occurrence of cloud is diagnosed with a criterion of the cloud mixing ratio being larger than 0.001 g kg−1. For cloud phase, if the temperature of cloud layer is higher than 253 K, then the grid box is defined as a water cloud layer, otherwise the grid box is regarded as an ice cloud layer (Mazin, 2004). Note that by using a single criterion of 253 K, the mixed-phase clouds within a single layer are not considered. We have verified that this would introduce little bias in the simulated BT and reflectance. Then, R and τ are approximated based on the cloud mixing ratio qc of the grid layer.
Table 1Geophysical parameters from the reanalysis datasets used in the evaluation.
If the layer is determined as a water cloud layer, the water effective radius (Rw) is approximated by qc and number concentration (Nw; Thompson et al., 2004):
where ρa is the density of air, which is determined by the pressure and temperature in the corresponding layer. The density of water cloud particles (ρw) is 1000 kg m−3. A water cloud number concentration over the continent of m−3 is assumed, and m−3 is used for water clouds over the ocean region (Miles et al., 2000).
The approximation for ice clouds is slightly different. The ice cloud effective radius (Ri) is obtained by the relationship between the mass extinction coefficient (k) in the visible wavelength and cloud effective radius. The coefficient k can be given by an empirical relationship based on in situ measurements (Heymsfield and McFarquhar, 1996; Platt, 1997; Heymsfield et al., 2003):
Once k is obtained, the corresponding Ri can be calculated because k is parameterized as a function of Ri in the framework of some RTMs.
The optical depth is the other key radiative parameter in the RTM. When the cloud effective radius (Rw or Ri) and the corresponding k are given, the cloud optical depth in the visible wavelength can be obtained by
where Δh represents the height of the cloud layer. Again, here τ is the optical depth at the reference wavelength, and that at the specific instrumental channel is converted in the RTM simulations.
The community RTM (CRTM) is used to calculate satellite-observed radiative variables based on the atmospheric variables from the reanalysis. The model is designed to simulate radiance and radiance gradients at the top of atmosphere and has been widely applied in radiance assimilation, remote sensing calibration, climate reanalysis, and so on. Procedures for solving the radiative transfer in the model are divided into various independent modules (e.g., gaseous absorption module, surface emissivity module, and cloud absorption and scattering module; Chen et al., 2008; Ding et al., 2010). To improve the computational efficiency, the advanced fast adding–doubling method is used (Liu and Weng, 2006), and it is 1.7 times faster than the vector discrete-ordinate method (Weng, 1992) and 61 times faster than the classical adding–doubling method (Twomey et al., 1966; Hansen and Hovenier, 1971). Four major surface types (i.e., water, land, ice, and snow) are included in the surface emissivity module, and the corresponding spectral library from visible to microwave wavelengths is preprepared for the emissivity calculation (Chen et al., 2008; Baldridge et al., 2009).
To minimize the numerical errors and uncertainties from radiative transfer computation, the cloud optical property lookup tables in the absorption and scattering module of the CRTM are updated before the simulation. We calculate the single-scattering optical properties of water clouds by Lorenz–Mie theory (Mie, 1908). The single-scattering optical properties of ice clouds are from the data library developed by Yang et al. (2013), and we use those based on aggregate columns with eight elements and severely roughened surface, which are found to better represent actual ice cloud properties (Järvinen et al., 2019). Gamma size distributions with an effective variance of 0.1 (Hansen and Travis, 1974) are assumed to give the bulk scattering properties. Validation of the CRTM with the new optical-property lookup tables is presented in Yao et al. (2018), and the BT differences (BTDs) between the CRTM and rigorous models in different channels are generally less than 1 K for ice clouds. For water clouds, the biases in the IR window channels may reach 2 K for optical thin clouds. BTDs in the water vapor channels are within ±1 K. Moreover, compared to the default CRTM model, the updated model can substantially improve CRTM simulations of cloudy atmospheres (Yi et al., 2016; Yao et al., 2018).
To obtain the most realistic representation of the radiance from the top of atmosphere, the full-layer atmospheric profiles (i.e., pressure, temperature, and water vapor) and cloud mixing ratio are kept and adopted by the CRTM. The surface characteristics (e.g., surface type, altitude, and surface temperature) are necessary for the CRTM to give the surface radiative property, and they are also given by the atmospheric reanalysis directly. Because the ozone absorption is insensitive in the channels of interest, the climatological ozone profiles are used in the simulation.
It should be noted that schemes for both cloud optical properties (e.g., cloud model) in the RTM and the coupling between atmospheric reanalysis and RTM (e.g., approximation of cloud effective radius) may influence simulated BT and reflectance. However, the influences are relatively minor compared to the presence of clouds (cloud amount), so evaluation of the potential numerical uncertainties due to different schemes will be detailedly performed in future studies.

Figure 1Observed and simulated reflectance in the 0.64 µm (top) and 1.6 µm (bottom) channels. The results are taken at 00:00 (UTC) on 12 September 2016.

Figure 2Pixel-to-pixel comparisons between the observed and simulated reflectance in the 0.64 µm (a, b, c) and 1.6 µm (d, e, f) channels. The histograms illustrate the occurrences of reflectance, and the results are taken at the same time as that in Fig. 1.
4.1 Case evaluation
We first present an evaluation of the cloud properties in three reanalysis datasets based on a typical case from 10 to 17 September 2016. The super typhoon Meranti, one of the most powerful tropical cyclones on record, was monitored during the period. The particular atmospheric environment, e.g., adequate water vapor, increased outflow in the upper layer, and warm sea surface temperature, intensified the structure and energy of the typhoon. Meanwhile, on 11 September 2016, another tropical depression was detected and monitored over the northwest Pacific Ocean, and it evolved into the typhoon Malakas on 13 September. The interaction between the two typhoons increased the water vapor transportation, promoted the development of deeper and thicker clouds, and enhanced them (Zhou and Gao, 2016). Note that, even for this case study, we consider a period over 8 d covering 32 time steps.
Figure 1 shows the spatial distribution patterns of the reflectance in the 0.64 and 1.6 µm channels. The observed and simulated results are taken at 00:00 UTC on 12 September 2016. Four typical regions (A to D) marked by red boxes are chosen for further discussions. In these two channels, atmospheric profiles have little effect on the simulated reflectance, and the differences are mainly caused by cloud properties. Because clouds are nonabsorbing in the 0.64 µm visible channel, the reflectance is primarily constrained by the cloud optical depth. Therefore, some cloud macro characteristics can be recognized from the result in this channel. The pixels with reflectance close to 1 (the whiter ones) indicate the region covered by optically thick clouds. Compared to the observations, CRA represents the cloud spatial distribution more reasonably than ERA5 and MERRA-2. ERA5 and MERRA-2 obviously overestimate the cloud cover, especially over the ocean regions, e.g., regions B and C. Because ice particles absorb more strongly than water droplets with the same optical depth in the 1.6 µm channel, the reflectance in this channel is usually smaller for pixels covered by ice clouds than for those covered by water clouds (Wang et al., 2018). Thus, the comparison in the 1.6 µm channels can also briefly illustrate the representation of cloud phase. Comparing the results over region B, the three reanalysis datasets all represent the cloud phase characteristics of cyclones. Larger reflectance values from ERA5 suggest that overestimated clouds are from water phase clouds, but the overestimation in MERRA-2 is mostly attributed to ice clouds. For pixels over regions C and D, ERA5 and MERRA-2 both overestimate water clouds.
To give a quantitative evaluation of the results in Fig. 1, the pixel-to-pixel comparisons of the case are shown in Fig. 2. The color contours show the occurrence of the reflectance from the corresponding observations and simulations, and the color bar is shown on a logarithmic scale. For CRA, high occurrence frequencies occur around the black 1:1 line, confirming that CRA has a better agreement with the observed reflectance than ERA5 and MERRA-2. The correlation coefficients between observations and CRA-based simulations are 0.66 and 0.62 in the 0.64 and 1.6 µm channels, respectively, revealing the best simulation in the solar channels. The ERA5-based and MERRA-2-based reflectances are clearly larger than the observed ones in a large number of pixels, and high occurrence frequencies are also noticeable near the x axis, i.e., pixels with observed reflectance of less than 0.1 but simulated up to 0.6. These higher occurrence frequencies correspond to the overestimated cloud pixels. The correlation coefficients for ERA5 and MERRA-2 are 0.65 and 0.53, respectively, in the 0.64 µm channel and become less than 0.5 in the 1.6 µm channel.
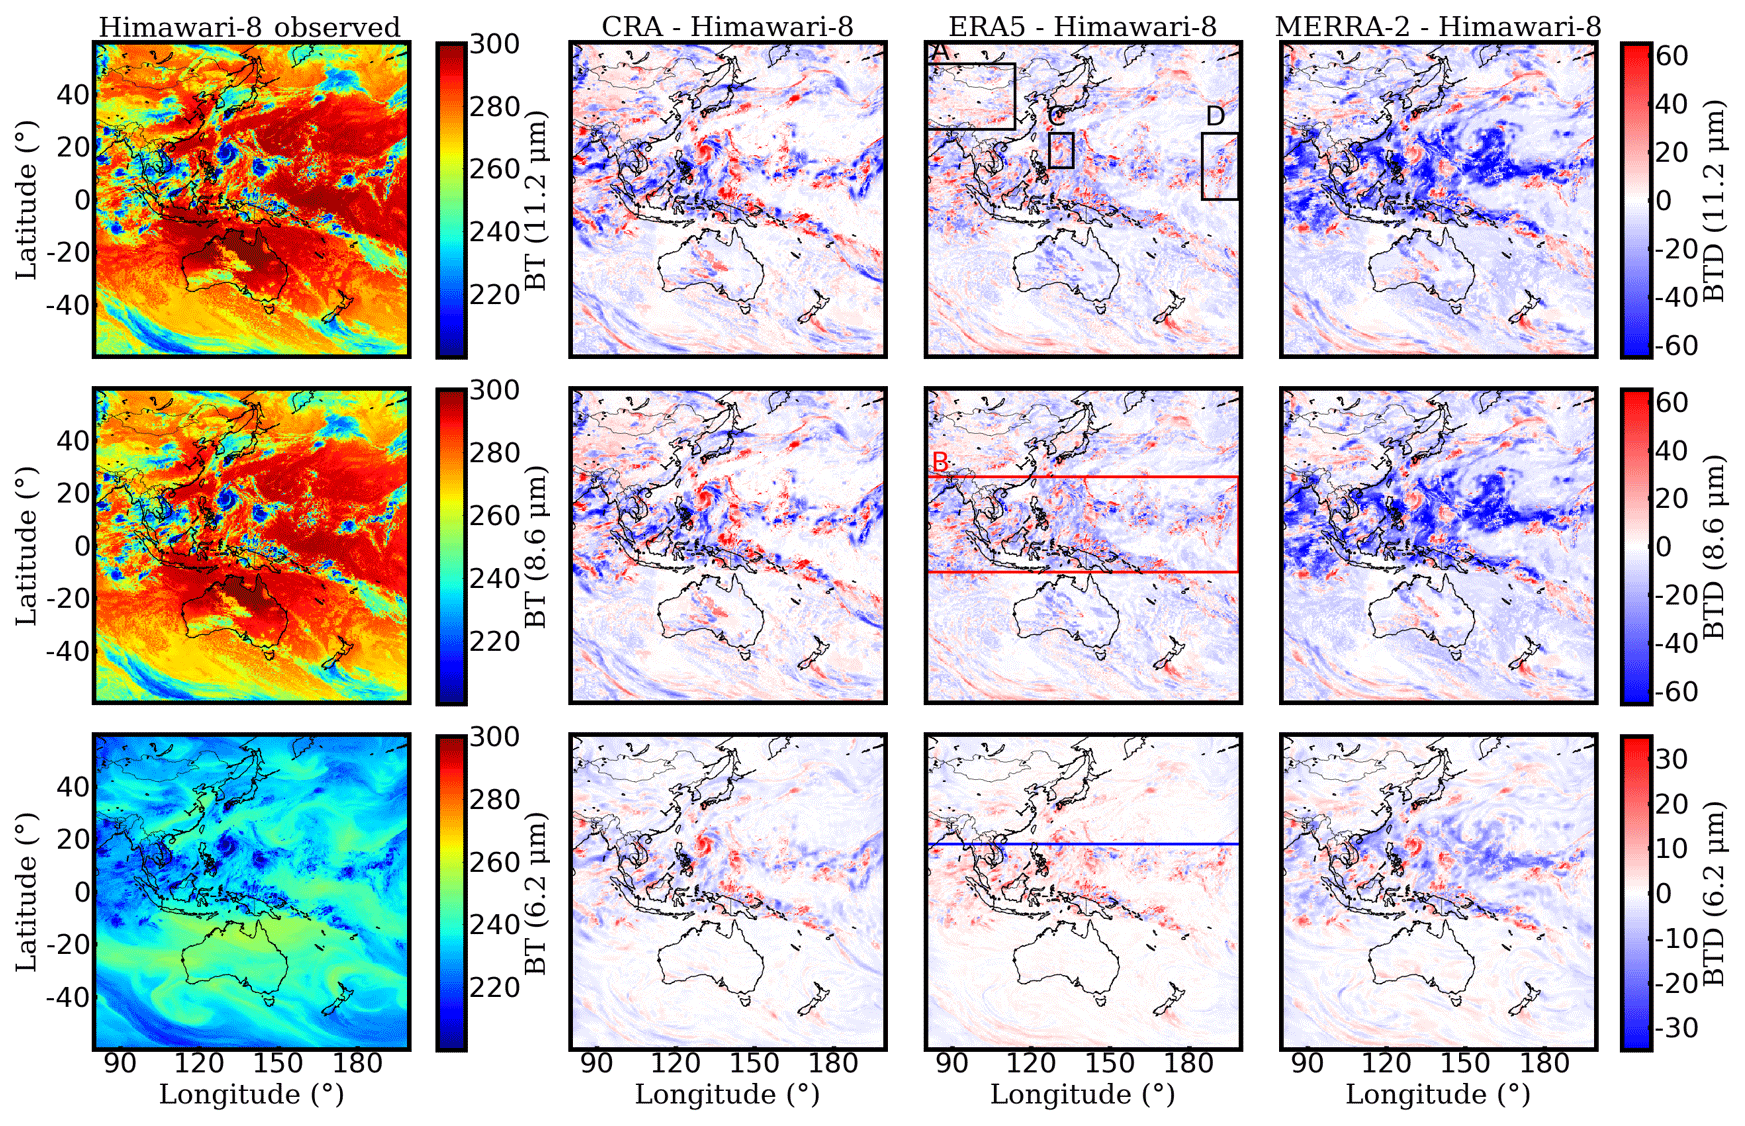
Figure 3Observed results and the brightness temperature differences between the observations and simulations in the 11.2 µm (top), 8.6 µm (middle), and 6.2 µm (bottom) channels. The results are taken at the same time as that in Fig. 1.
Different from the reflectance in the solar channels, BTs in the IR channels are available for both daytime and nighttime. For further evaluation, the discussions are mostly based on the results in three IR channels (one in the 6.2 µm water vapor channel and two in the IR window channels). Figure 3 illustrates the observed BTs in the 6.2, 8.6, and 11.2 µm channels and the BTDs between the simulations from CRA, ERA5, and MERRA-2 and the observations (here, BTD = simulated BT – observed BT). Results are taken at 00:00 UTC on 12 September 2016, the same as Fig. 1. Gas molecular absorption in the two IR window channels (8.6 to 11.2 µm) is ignorable, so the two channels are mostly sensitive to the surface temperature and cloud profiles. Therefore, the BTs in these channels are usually used to evaluate cloud properties or surface temperature (King et al., 1992; Mao et al., 2005). In the 6.2 µm channel, because of large sensitivity to broad upper-layer humidity, the BTs are used to infer the mid- to high-layer water vapor content. Similar distributions between the observations and simulations in the two IR window channels generally confirm the dependable capabilities of the three reanalysis datasets to represent the atmospheric characteristics on both cloudy and clear-sky pixels. The smallest average BTD between the simulated BT and observed BT over the entire region is −1.59 K in the 11.2 µm channel for ERA5, and the average results of CRA are close to it. However, the mean BTD between MERRA-2-based simulations and observations is as large as −9.19 K, indicating the relatively poor performance of MERRA-2 over the region. Region A (a continental region) is characterized by low-layer clouds or clear-sky conditions, and the mean BTDs over the region are 1.56 K for CRA, 1.00 K for ERA5, and −5.35 K for MERRA-2. The slight underestimation of cloud optical depth or cloud top height over this region causes the positive mean BTDs for CRA and ERA5, and the negative mean BTD for MERRA-2 indicates that clouds (optical depth or top height) are overestimated. Over region B, clouds in the reanalysis, i.e., pixels with simulated BTs between 220 and 250 K, are largely responsible for the negative BTDs. The absolute BTDs may reach as much as 80–90 K, and the mean values are almost 15–20 K more than those over region A. More series of excessive cloud pixels for MERRA-2 explain the mean BTD of −19.02 K in the 11.2 µm channel. The negative mean BTDs over region B for CRA and MERRA-2 in the 6.2 µm channel suggest the excessive integrated mid- to high-layer water vapor content. The positive mean BTD (the 6.2 µm channel) for ERA5 over region B reveals general insufficient water vapor content over the corresponding layer, and this results in the underestimation of upper-layer clouds. Meanwhile, the mean BTD of −2.35 K in the 11.2 µm channel indicates that the overestimation of clouds should be related to low- or midlayer clouds in this region. However, more water vapor content is represented in ERA5 over region C than that in CRA and MERRA-2, and it is closer to the realistic atmosphere. Compared with the observations, a similar cyclone structure is captured in the imagery of IR window channels much better than in the solar-channel results. However, other atmospheric or surface properties may also cause similar results over the arid or semiarid regions, and the limitation of the in situ observations over the Tibetan Plateau also enlarges uncertainties in the reanalysis datasets. Compared with the continental regions, larger simulation errors over ocean are associated with more complex cloud distributions as well as fewer observations assimilated.
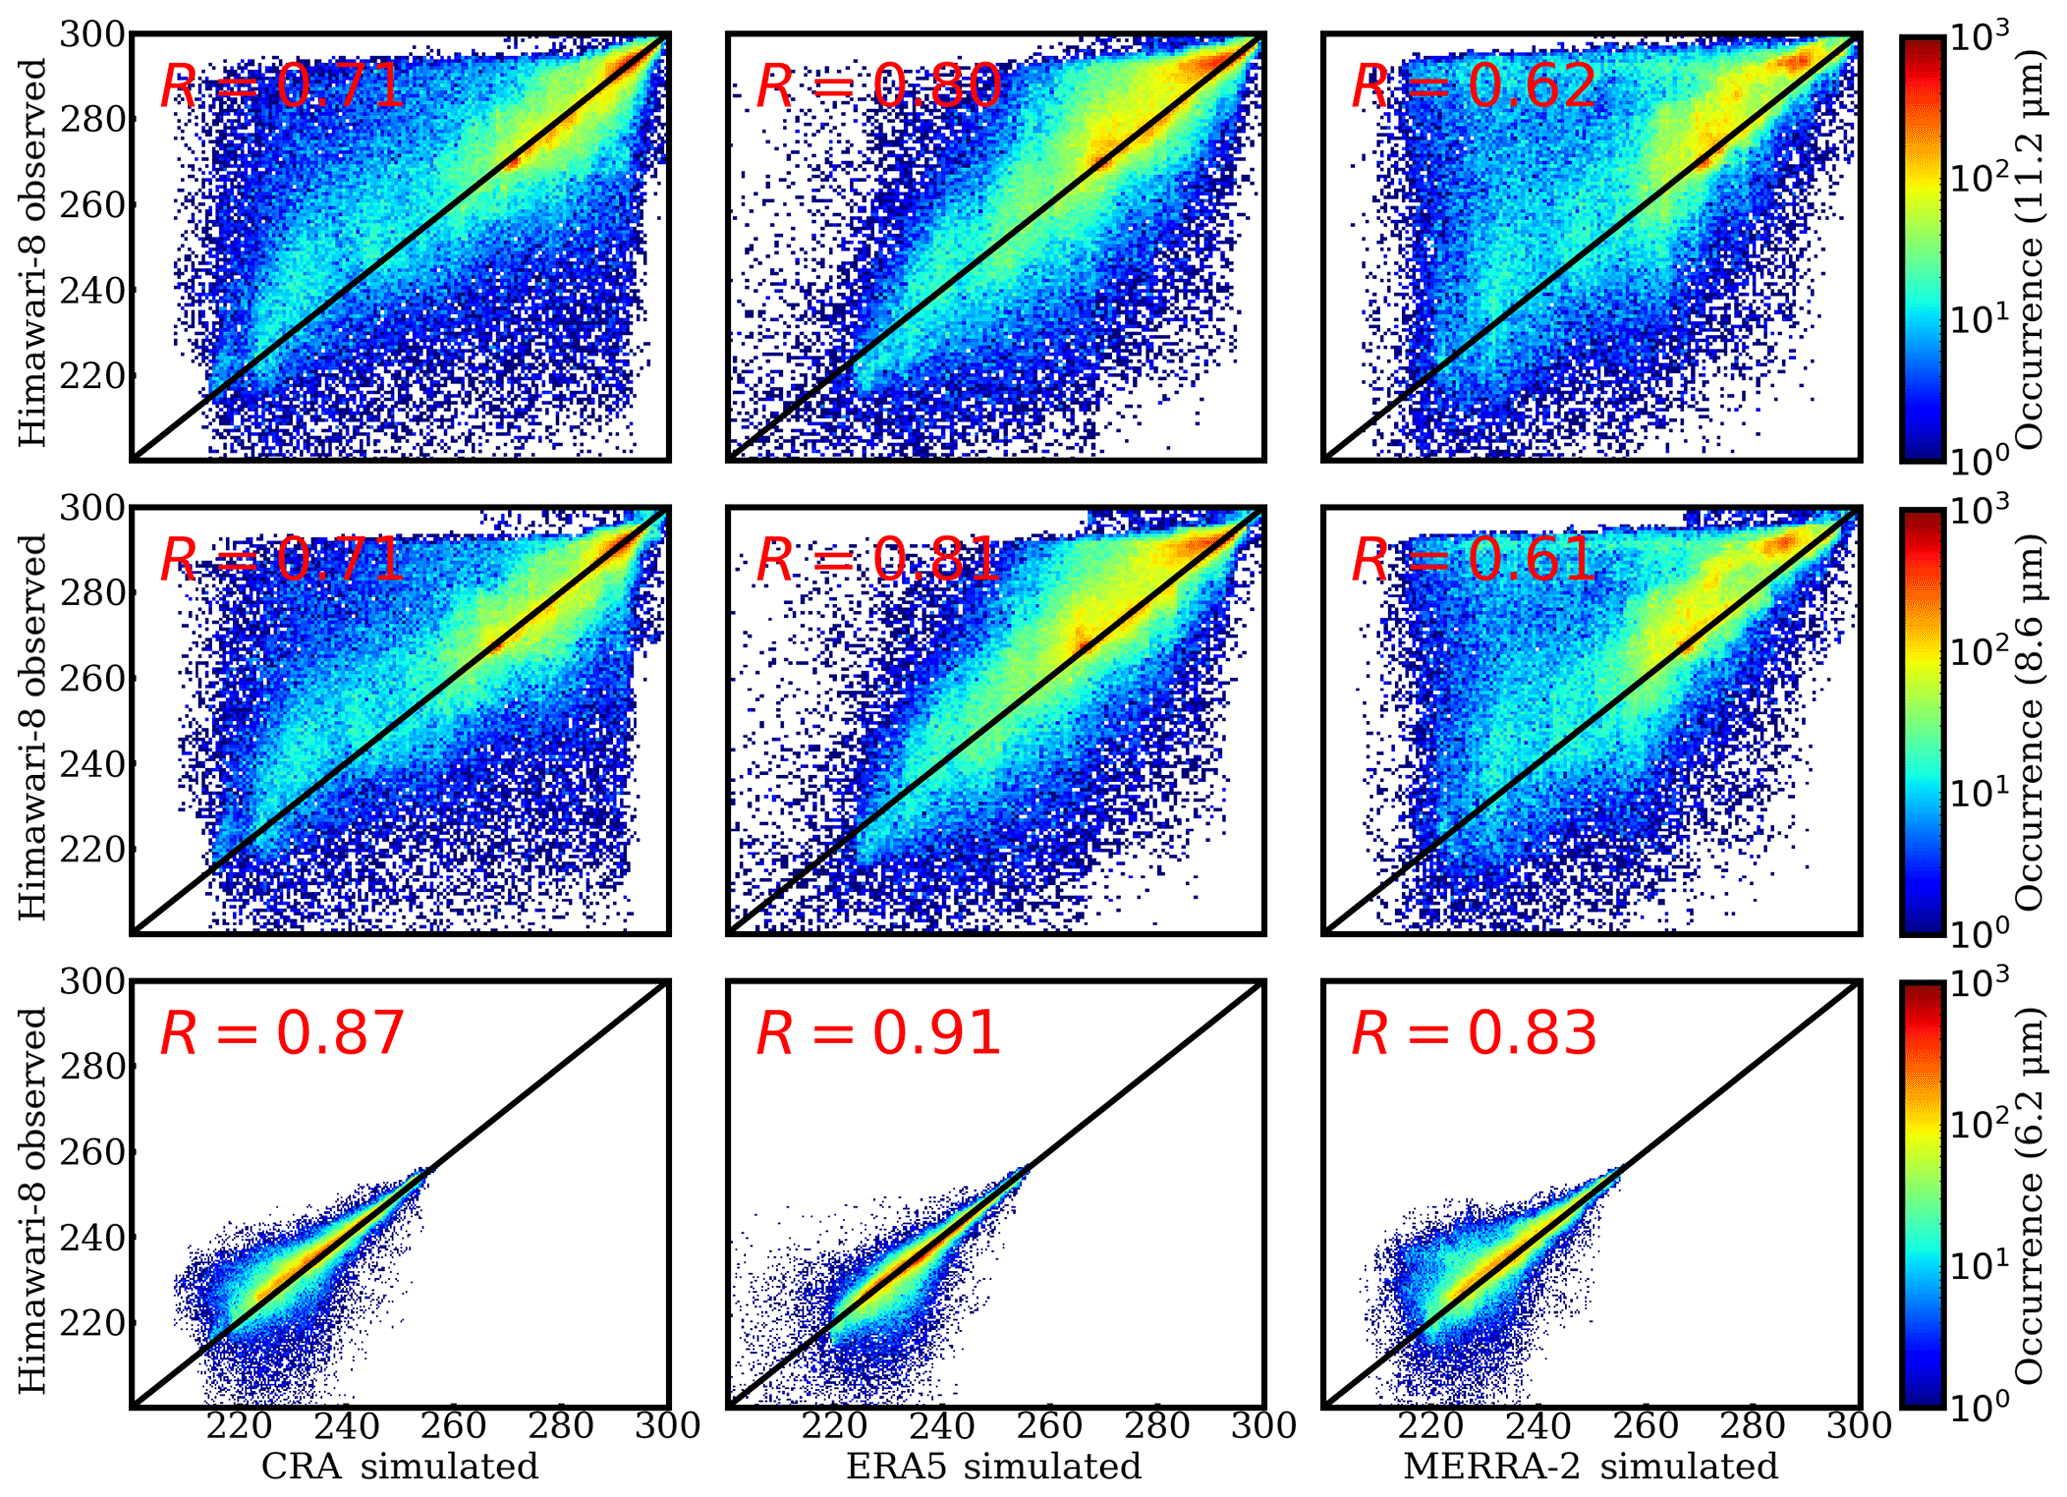
Figure 4 gives a pixel-to-pixel evaluation similar to Fig. 2 but for the results in the IR channels. The correlation coefficients between observations and simulations are all larger than 0.6, and the high occurrences are distributed around the 1:1 line, revealing good agreements between the simulated and observed BTs in the 11.2, 8.6, and 6.2 µm channels, especially for CRA and ERA5.
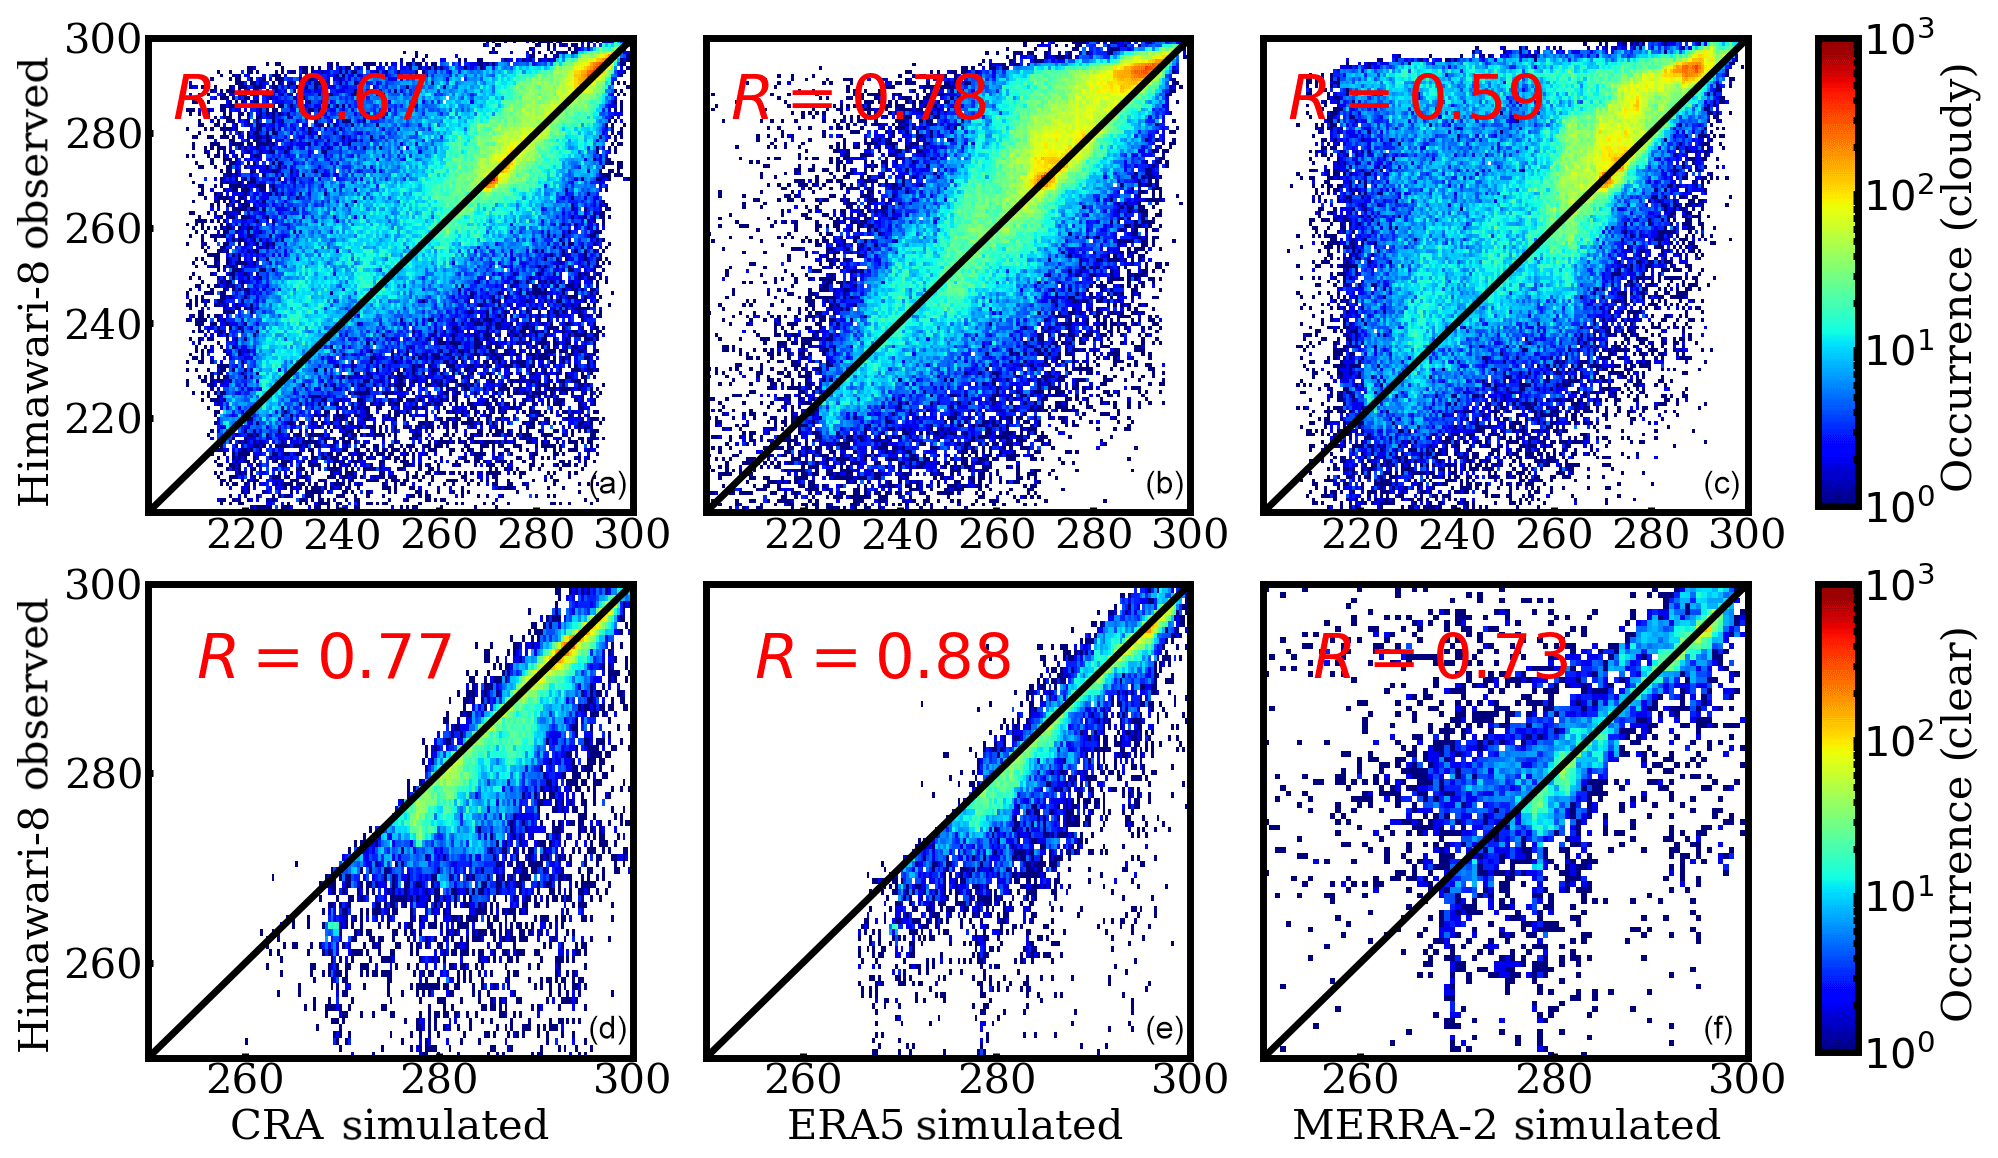
Figure 5Comparisons between the observed and simulated BTs in the 11.2 µm channel for cloudy (a, b, c) and clear-sky (d, e, f) pixels, respectively.
To better understand the representations on cloudy and clear pixels, we classify the simulated pixels based on an integrated-column cloud optical depth of 0.001 (τ>0.001 for cloudy pixels, and τ<0.001 for clear pixels), and Fig. 5a–c and Fig. 5d–f compare observed and simulated BTs in the 11.2 µm for cloudy and clear cases, respectively. Panels a–c show clearly wider distributions of the occurrence frequency and smaller correlation coefficients between observations and simulations, and this means that the cloud representation definitely introduces additional errors into the simulated BTs. Particularly for MERRA-2, much larger correlation coefficients for the clear pixels indicate that cloud property representation in MERRA-2 may significantly contribute to the differences from the observations.
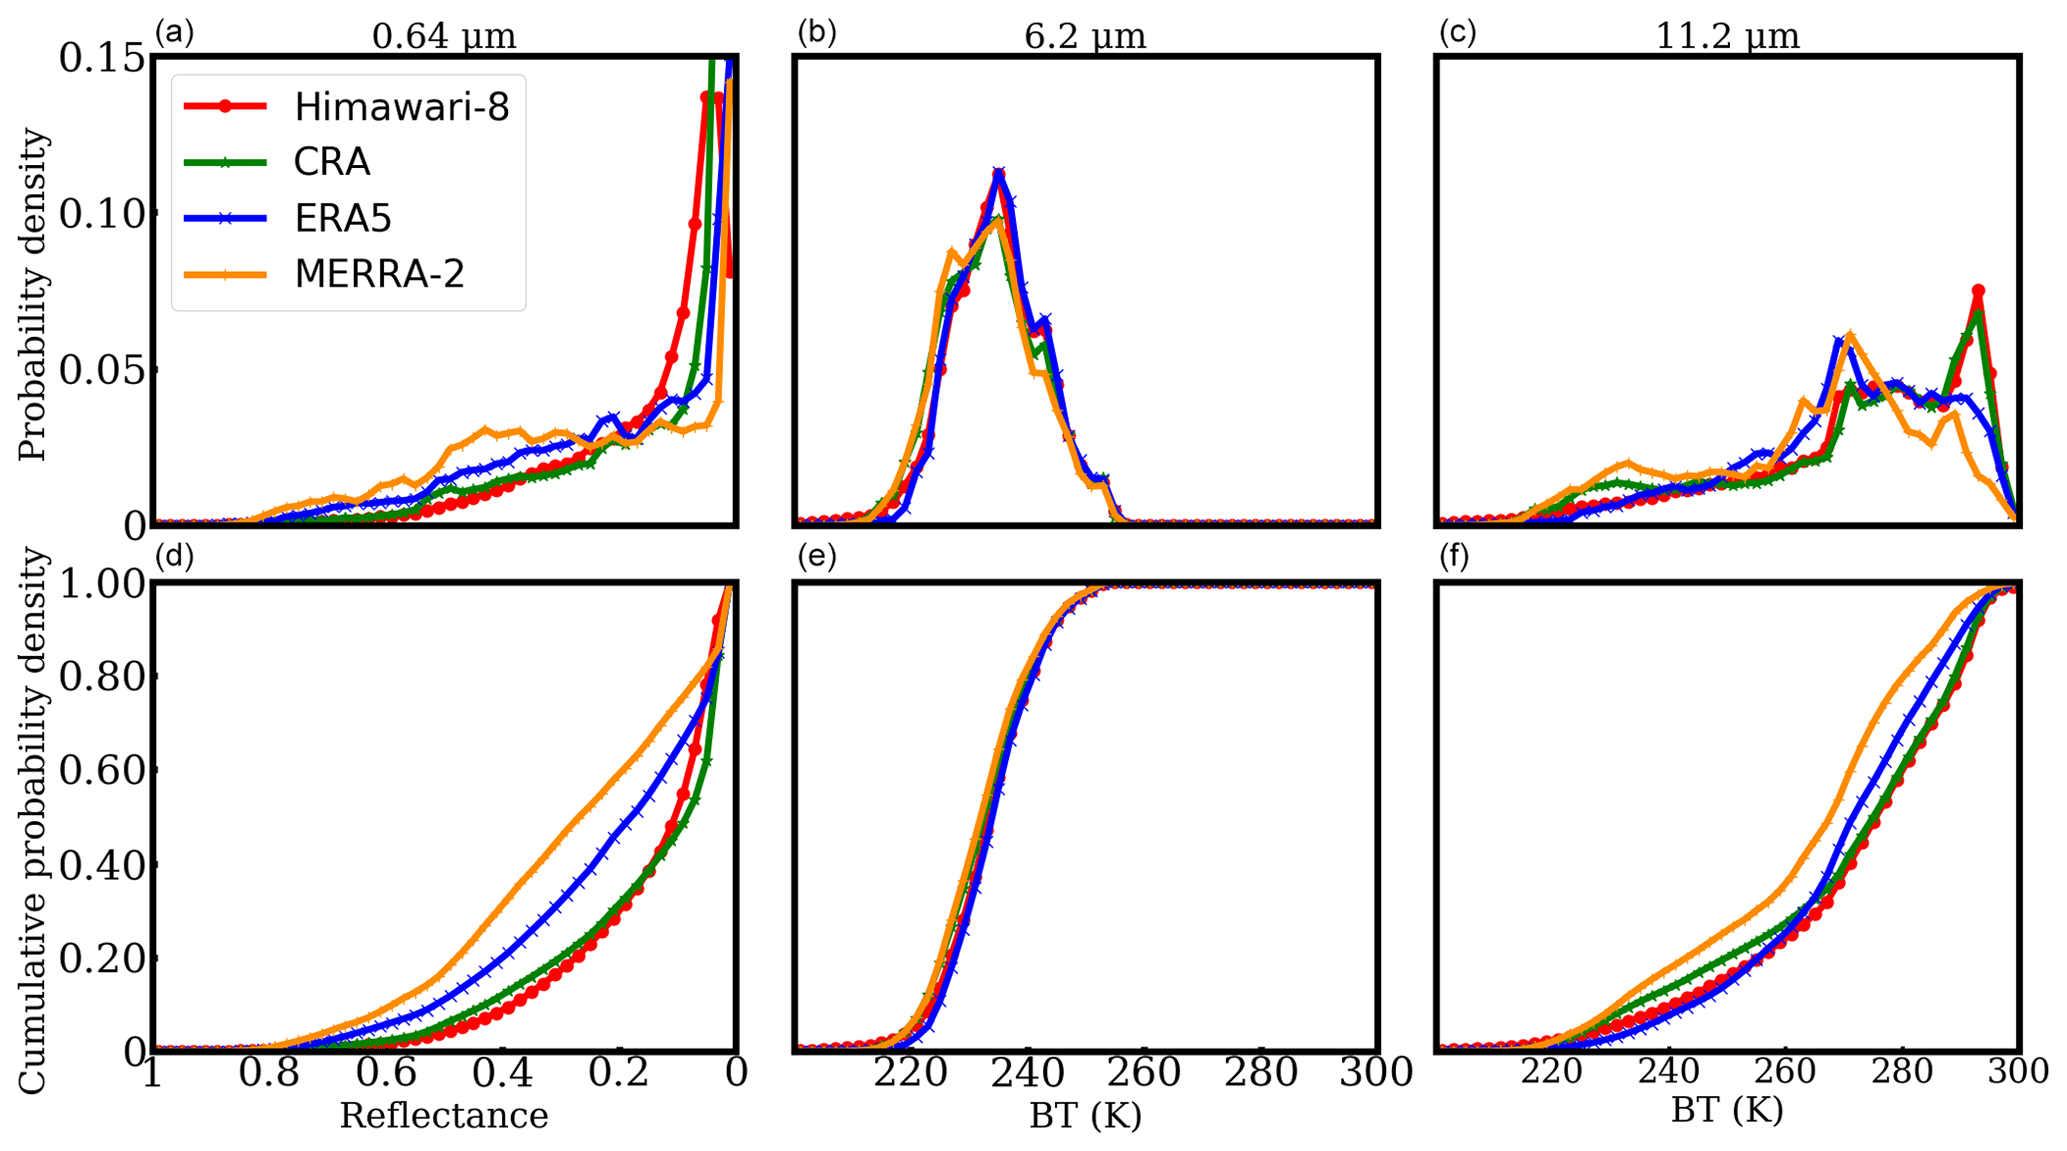
Figure 6Probability and cumulative probability density for the observed and simulated reflectances in the 0.64 µm channel (a, d) and for the BTs in the 6.2 µm (b, e) and 11.2 µm (c, f) channels.
Figure 6 shows the probability (Fig 6a–c) and cumulative probability (Fig 6d–f) of the simulated and observed reflectance and BT with particular values. Taking the IR channel BT as an example, the probability and cumulative probability are numerically calculated as
and
In the IR window channels, MERRA-2 overestimates the probability against the observation between 220 and 275 K, reflecting the overestimation of mid- and mid-to-high-layer cloud. For ERA5, the low-layer clouds are overestimated, but the high-layer clouds are underestimated, especially for clouds with a top temperature of less than 230 K. Compared to CRA and MERRA-2, similar probability density structures between the ERA5-based simulations and observations in the 6.2 µm channel reveal a more reasonable water vapor distribution over the entire region. If a threshold of a BT of ∼275 K in the 11.2 µm channel is assumed to define cloud pixels, the simulated cloud cover for CRA reanalysis achieves the best agreement with the observations. However, cumulative probability densities with BTs of ∼275 K in ERA5 and MERRA-2 are larger than the corresponding values given by the observations, indicating an overestimation of cloud cover in the two datasets.
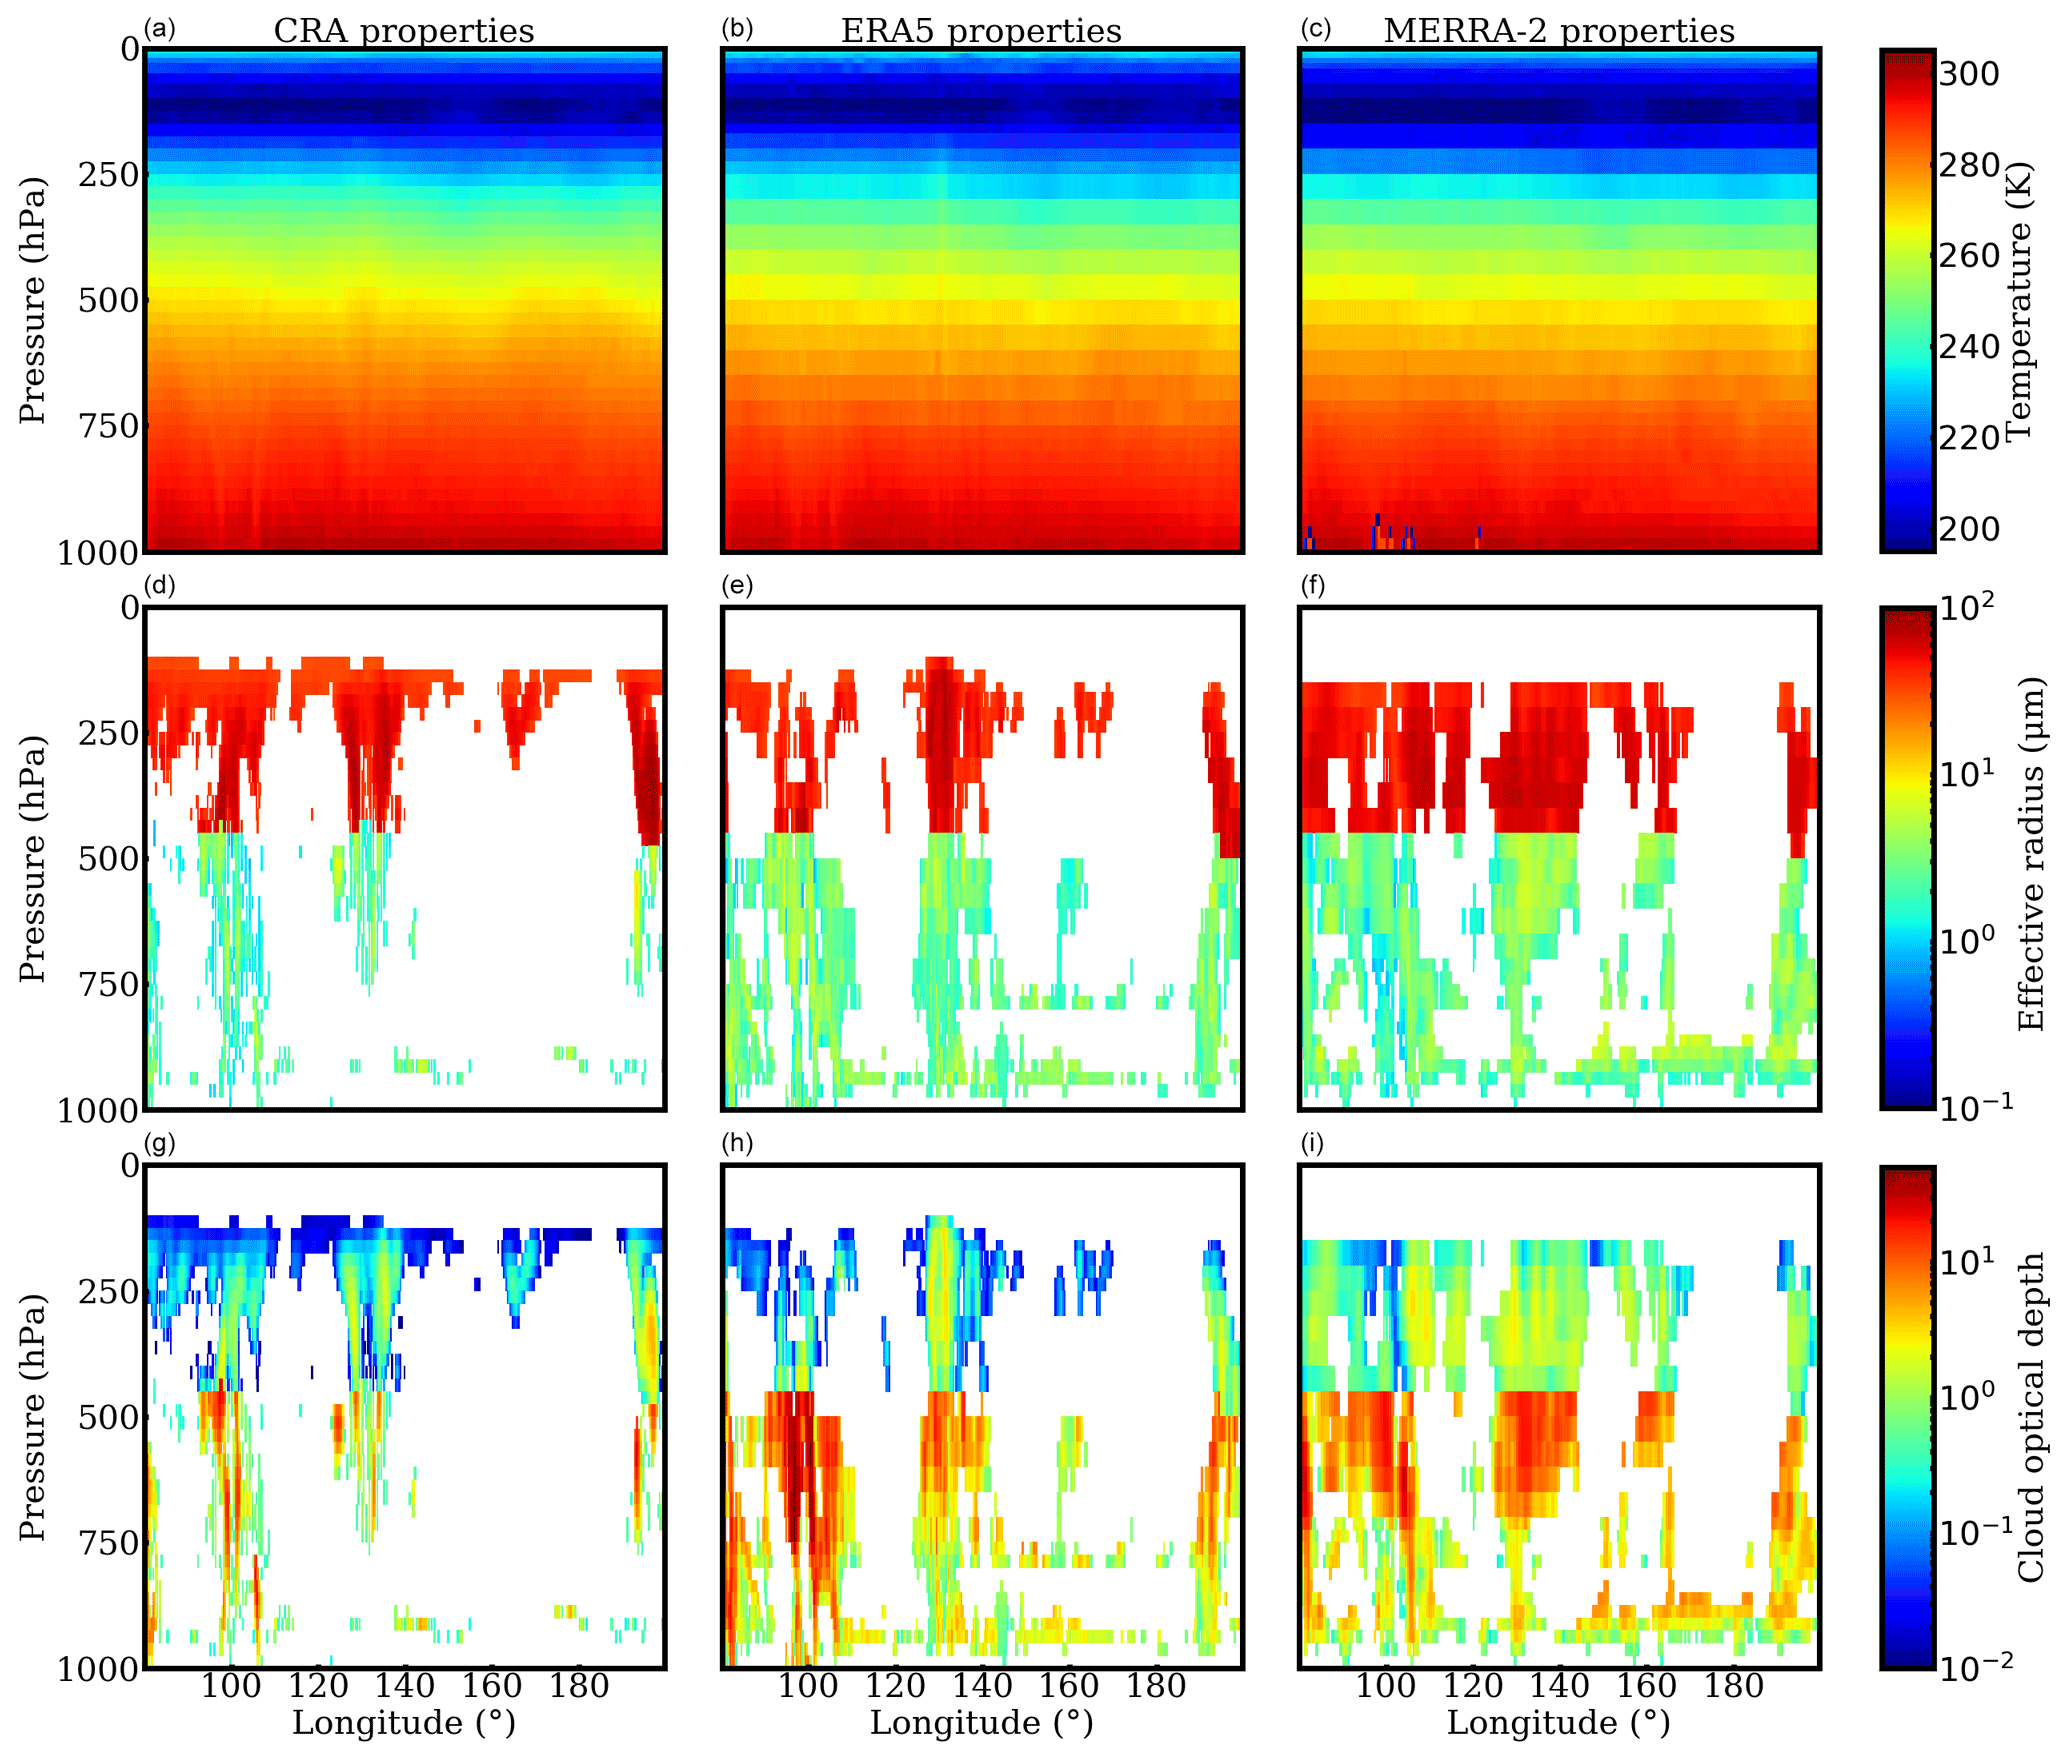
Figure 7Comparison of the profiles of temperature, cloud effective radius, and optical depth in CRA (a, d, g), ERA5 (b, e, h), and MERRA-2 (c, f, i) reanalysis datasets. The profiles are for the track marked by a solid blue line in Fig. 3.
The atmospheric and cloud profiles (i.e., temperature, cloud effective radius and optical depth) over pixels of 18∘ N (marked by a solid blue line in Fig. 3) are shown in Fig. 7. Compared with the differences in temperature profiles, the differences in the cloud effective radii and optical depths are more obvious. Clouds in the CRA are developed insufficiently over the low- to midlayer compared to the ERA5 and MERRA-2. Abnormally widespread cloud profiles or excessive integrated cloud optical depth in the middle to high layers bring in lower simulated BTs in the IR channels, and this is significant over the region D in Fig. 3.
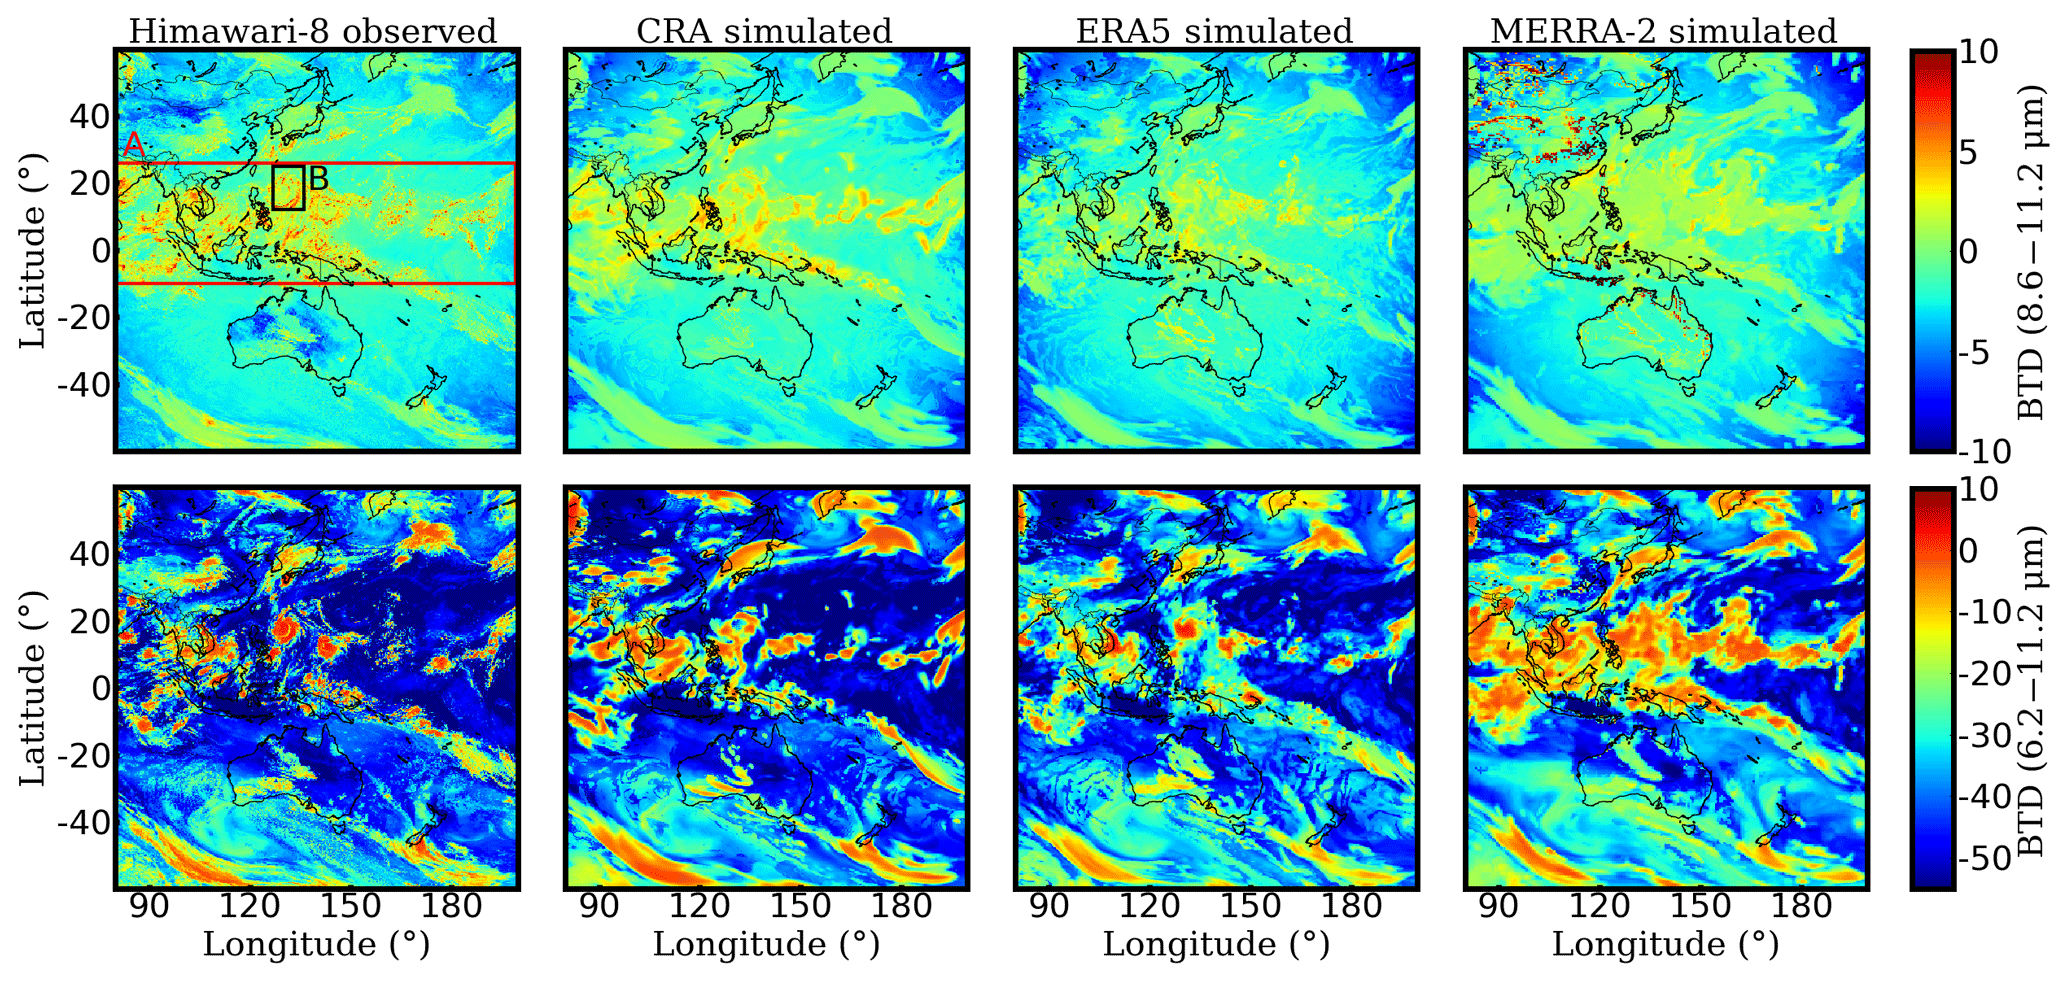
Figure 8Observed and simulated brightness temperature differences of 8.6–11.2 µm (top) and 6.2–11.2 µm (bottom). The results are taken at the same time as that in Fig. 1.
Different spectral channels have their own sensitivities to atmospheric and cloudy properties, so different cloud properties or atmospheric conditions can be detected and validated by the BTDs among different channels (Baum et al., 2000; Otkin et al., 2009). Different from previous analysis based on single-channel results, Fig. 8 shows the observed and simulated BTDs of 8.6–11.2 µm (top panels) and 6.2–11.2 µm (bottom panels). The absorptivity of different-phase clouds is similar in the 8.6 µm channel, but the absorption of ice clouds is larger than that of water clouds in the 11.2 µm channel. Thus, in typical cases, the 8.6–11.2 µm BTDs are positive for ice clouds and negative for water clouds. In region A, simulations for CRA are close to the observations, and the mean BTDs are both around 0.15 K. The negative mean BTDs in this region for ERA5 and MERRA-2 indicate an overestimation of water clouds or underestimation of ice clouds. Because of the strong water vapor in the 6.2 µm channel and the negative temperature lapse rate in the troposphere, the BTDs of 6.2–11.2 µm are usually negative, and they increase as the cloud height increases. The largest negative BTDs are often in the clear-sky region with sufficient water vapor and high surface temperature, and the positive or near-zero BTDs correspond to overshooting cloud tops. Although the simulation for ERA5 reanalysis generally underestimates the mid- to high-layer water vapor content and upper-layer cloud in the entire region and the A region, as we mentioned before, if we isolate the overshooting cloud top by BTDs of less than 0 K, the ERA5 has the closest structure and distribution to the observations of the three reanalysis datasets, corresponding to the analysis of region B.
The results discussed above are from a single time step, and the following gives a more general evaluation of the cloud cover in the 8 d case. The BTD between the 6.2 and 11.2 µm channels is used to classify pixels with clouds over different altitudes (Mecikalski and Bedka, 2006; Yao et al., 2018). Pixels with BTDs between −45 and −30 K are understood as low-layer clouds, and we define the low-layer cloud ratio as
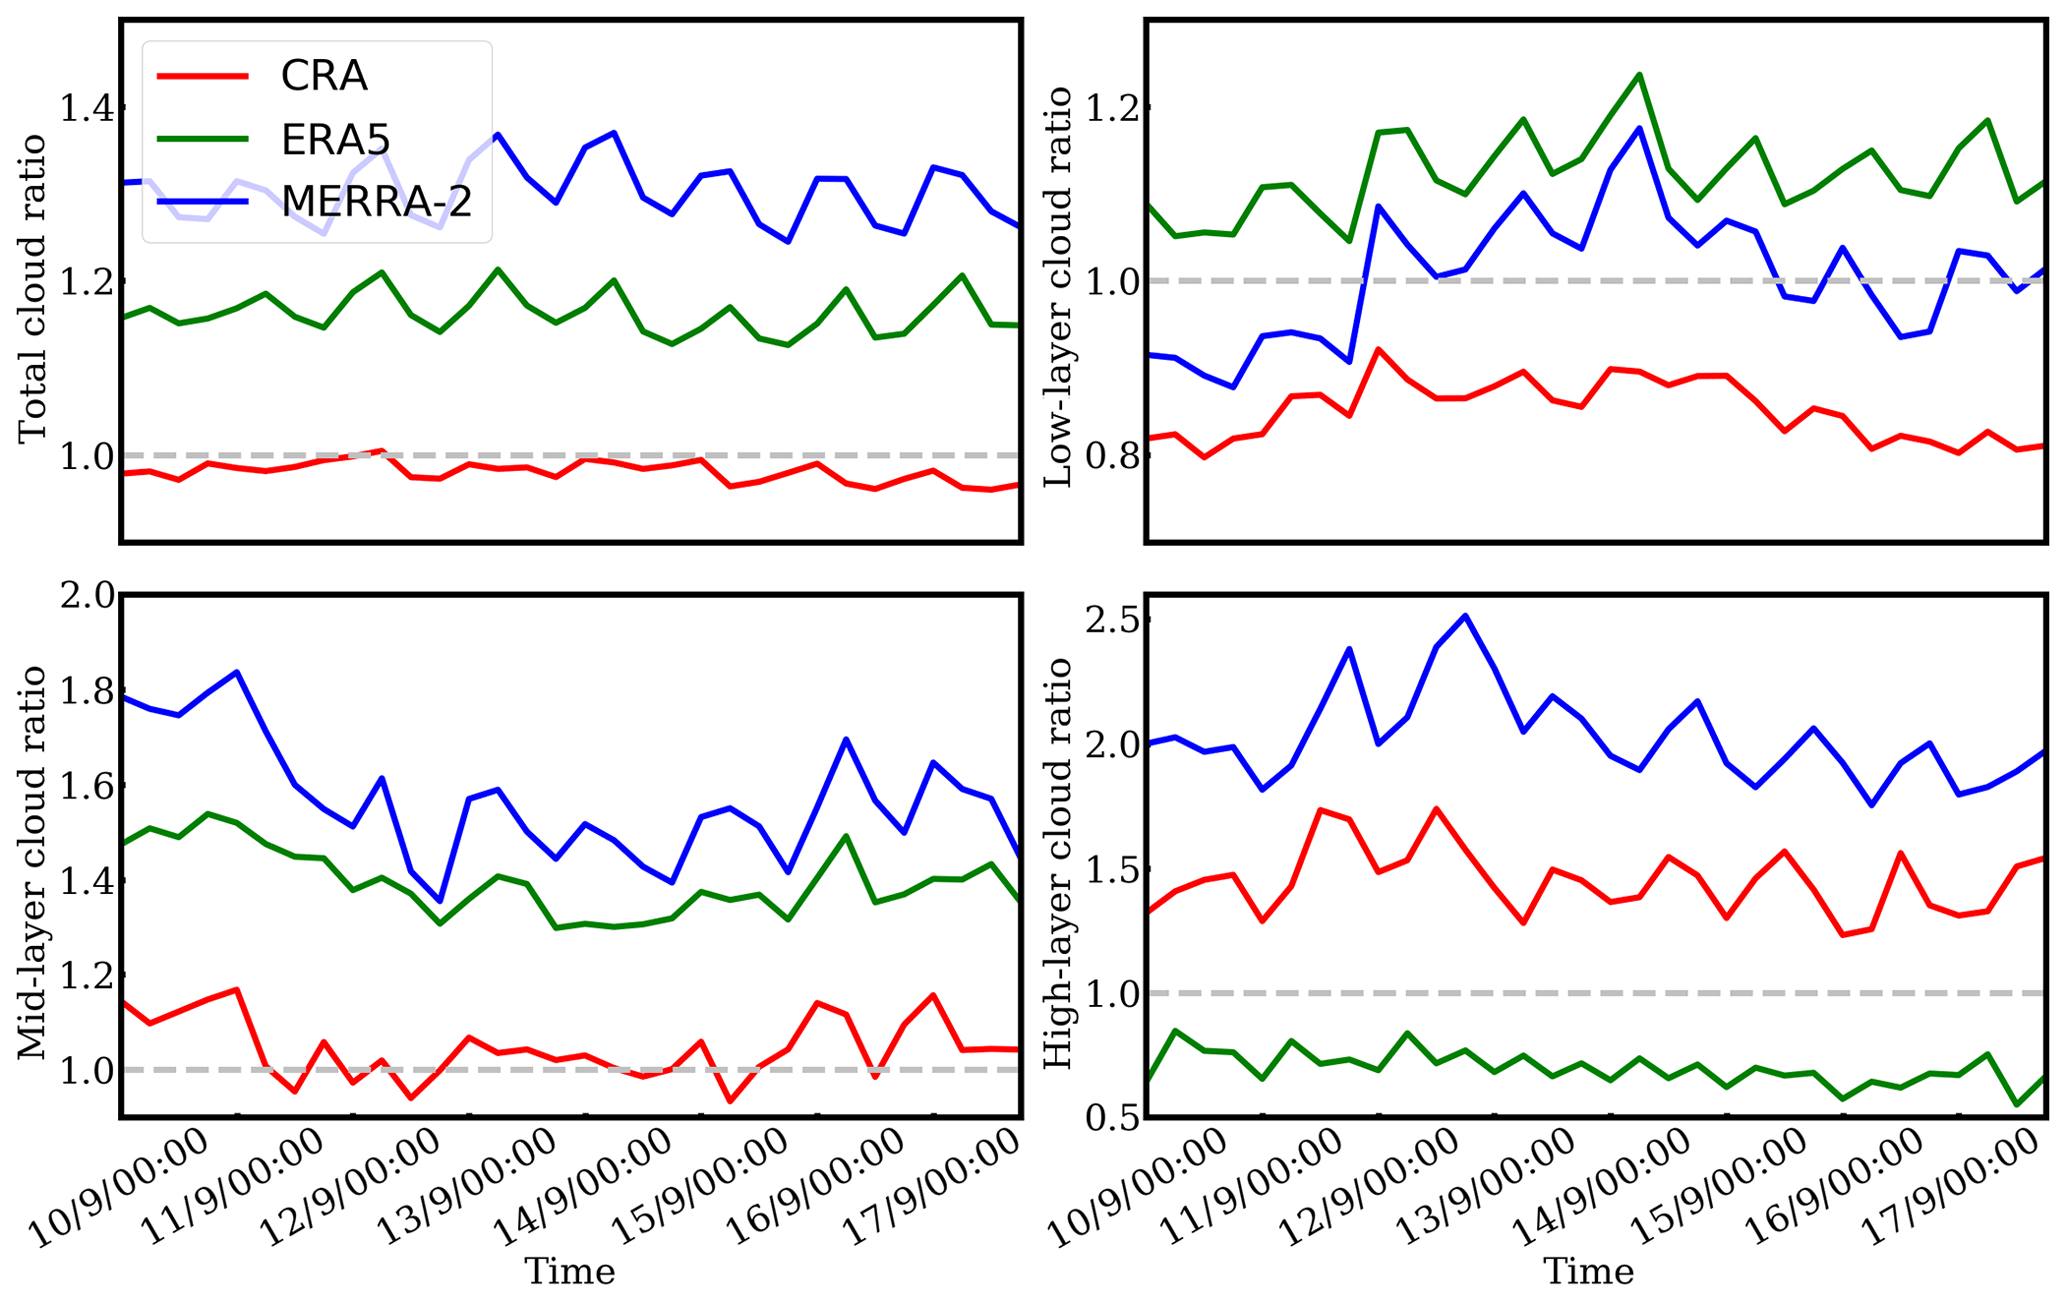
Figure 9Temporal variation in the ratios (simulation to observation) for different-layer clouds. The classification of clouds is based on the brightness temperature differences of 6.2–11.2 µm. The time is labeled as DD/M/time (UTC).
Similarly, we have the midlayer cloud ratio defined with BTDs between −30 and −10 K, and the high-layer cloud ratio is given by pixel numbers with BTDs larger than −10 K. Note that the ratios here are those of simulated pixels to observed pixels with a particular BTD, so ratios close to 1 indicate a better performance of the cloud representation. The ratios as a function of time are illustrated in Fig. 9. The CRA total cloud cover (TCC) ratio and midlayer cloud ratio are close to 1. The low-layer cloud ratio for MERRA-2 reanalysis is reasonable, but large mid- and high-layer cloud ratios (∼1.6 and ∼2) result in a substantial overestimation of TCC by ∼30 %. For ERA5, the high-layer cloud ratio is approximately 0.7, and the low- and midlayer cloud ratios are both larger than 1.
4.2 Long-term evaluation
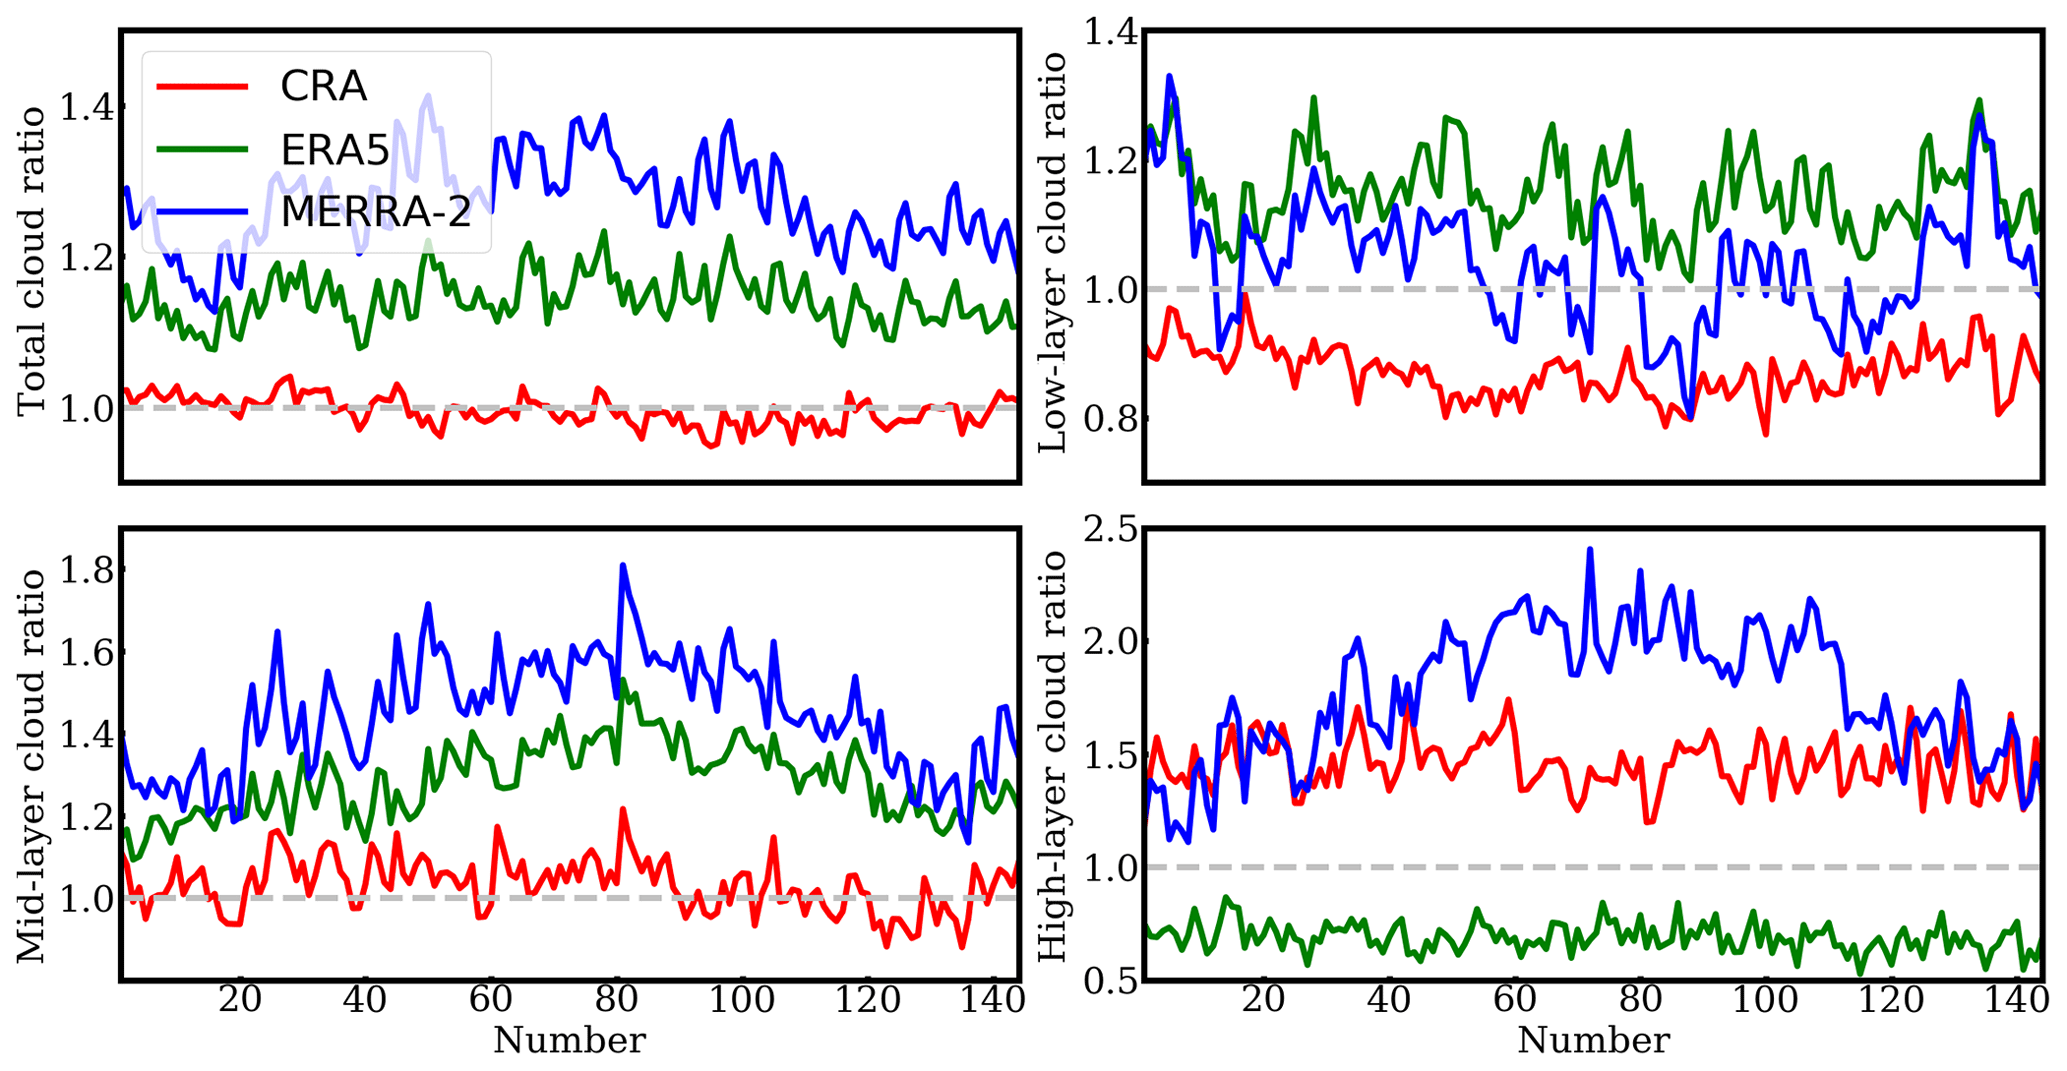
A long-term case spanning an entire year, 2016, is chosen to give a more general idea of clouds reanalysis, and we consider 144 realizations, i.e., four time steps per day (6-hourly time interval for all reanalysis), 3 d per month (5th, 15th, and 25th days of the month), and 12 months. The size of the dataset is not large enough, but the significant characteristics are presented.
Table 2Average ratios of cloud pixels for different-layer clouds in Fig. 10, and the average values of the mean BTDs (MBTDs), standard deviations of BTDs (SBTDs), and correlation coefficient (R) between the simulations and observations in Fig. 12.
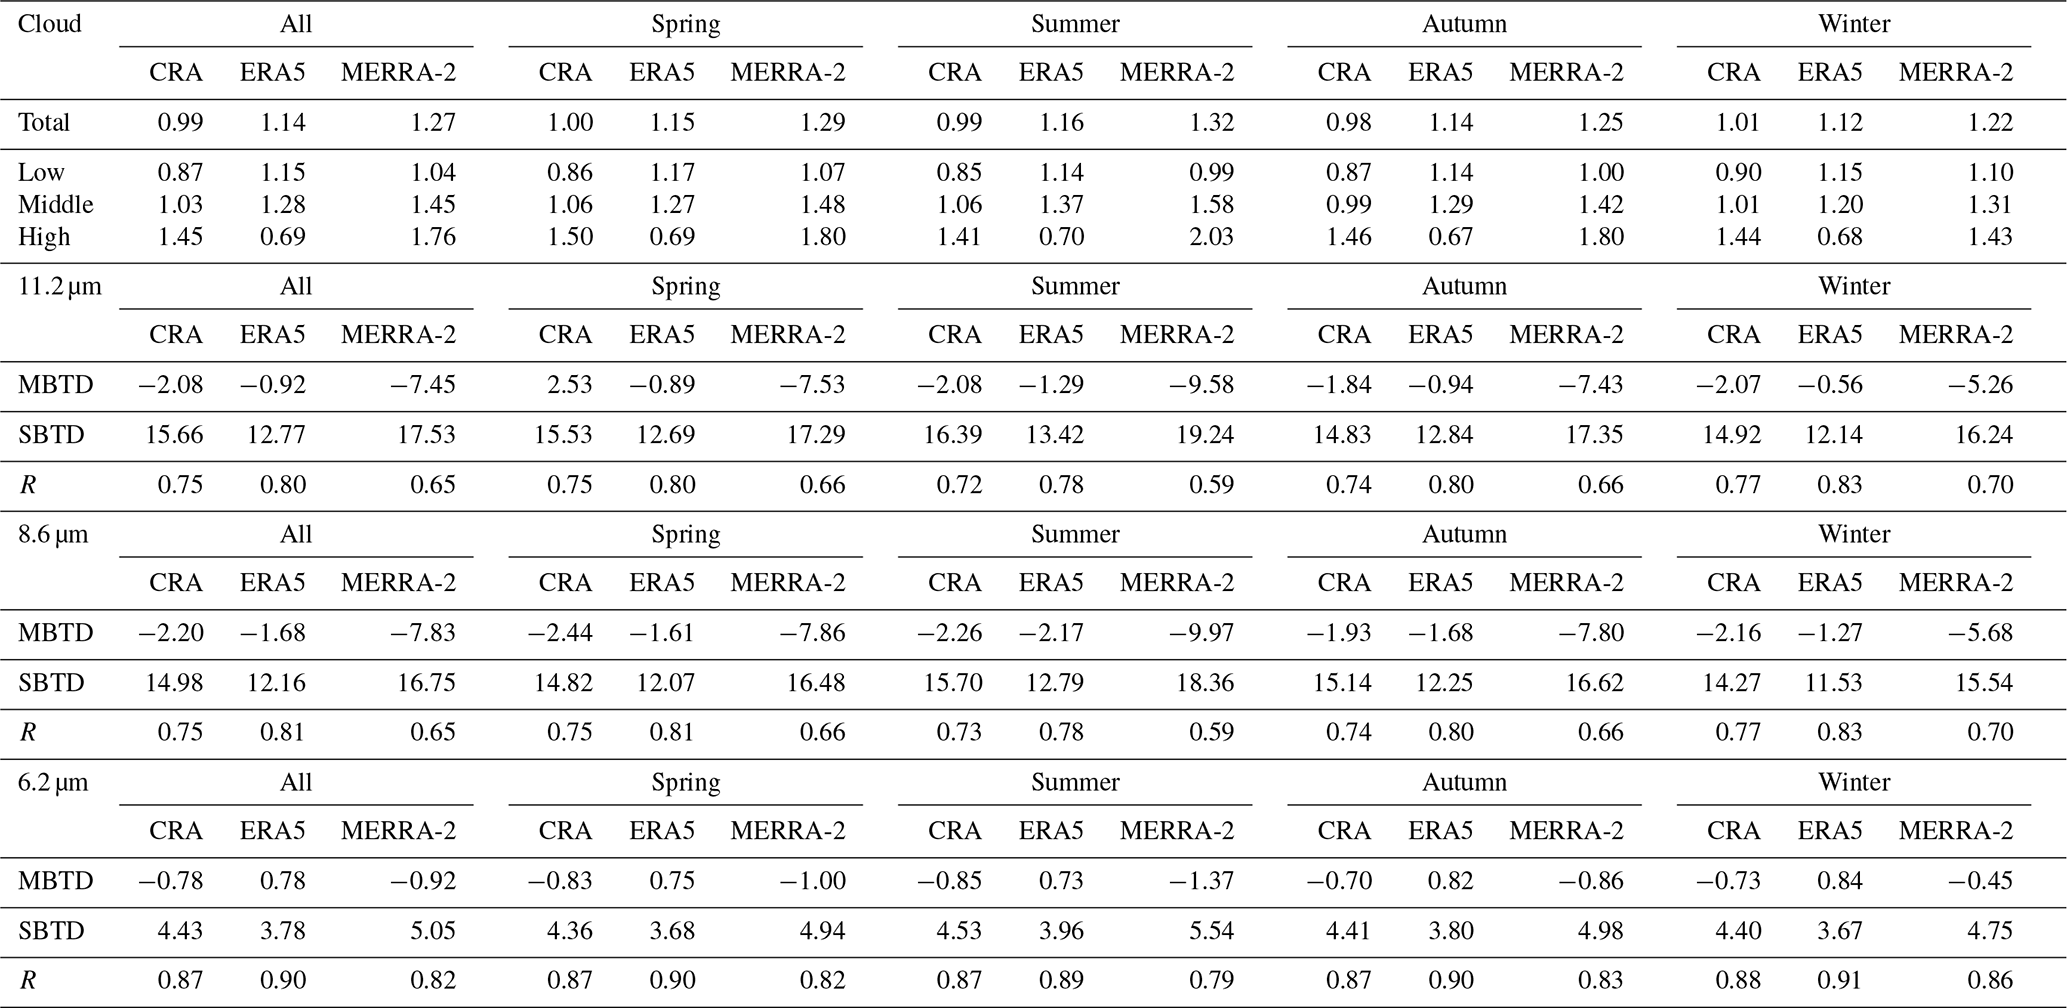
Similar to Fig. 9, Fig. 10 gives the ratio of clouds over the 144 realizations, and the average values are listed in Table 2. For CRA and ERA5, the ratios of clouds show relatively weak variation over time, and the means and variations are both similar to the results in Fig. 9. Clear seasonal variation is noticed in the bias of MERRA-2 cloud representation. Such seasonal variations are only shown for midlayer clouds of ERA5 and are not shown for CRA. The simulated mid- and high-layer cloud ratios in MERRA-2 in summer are significantly larger than those in other seasons.
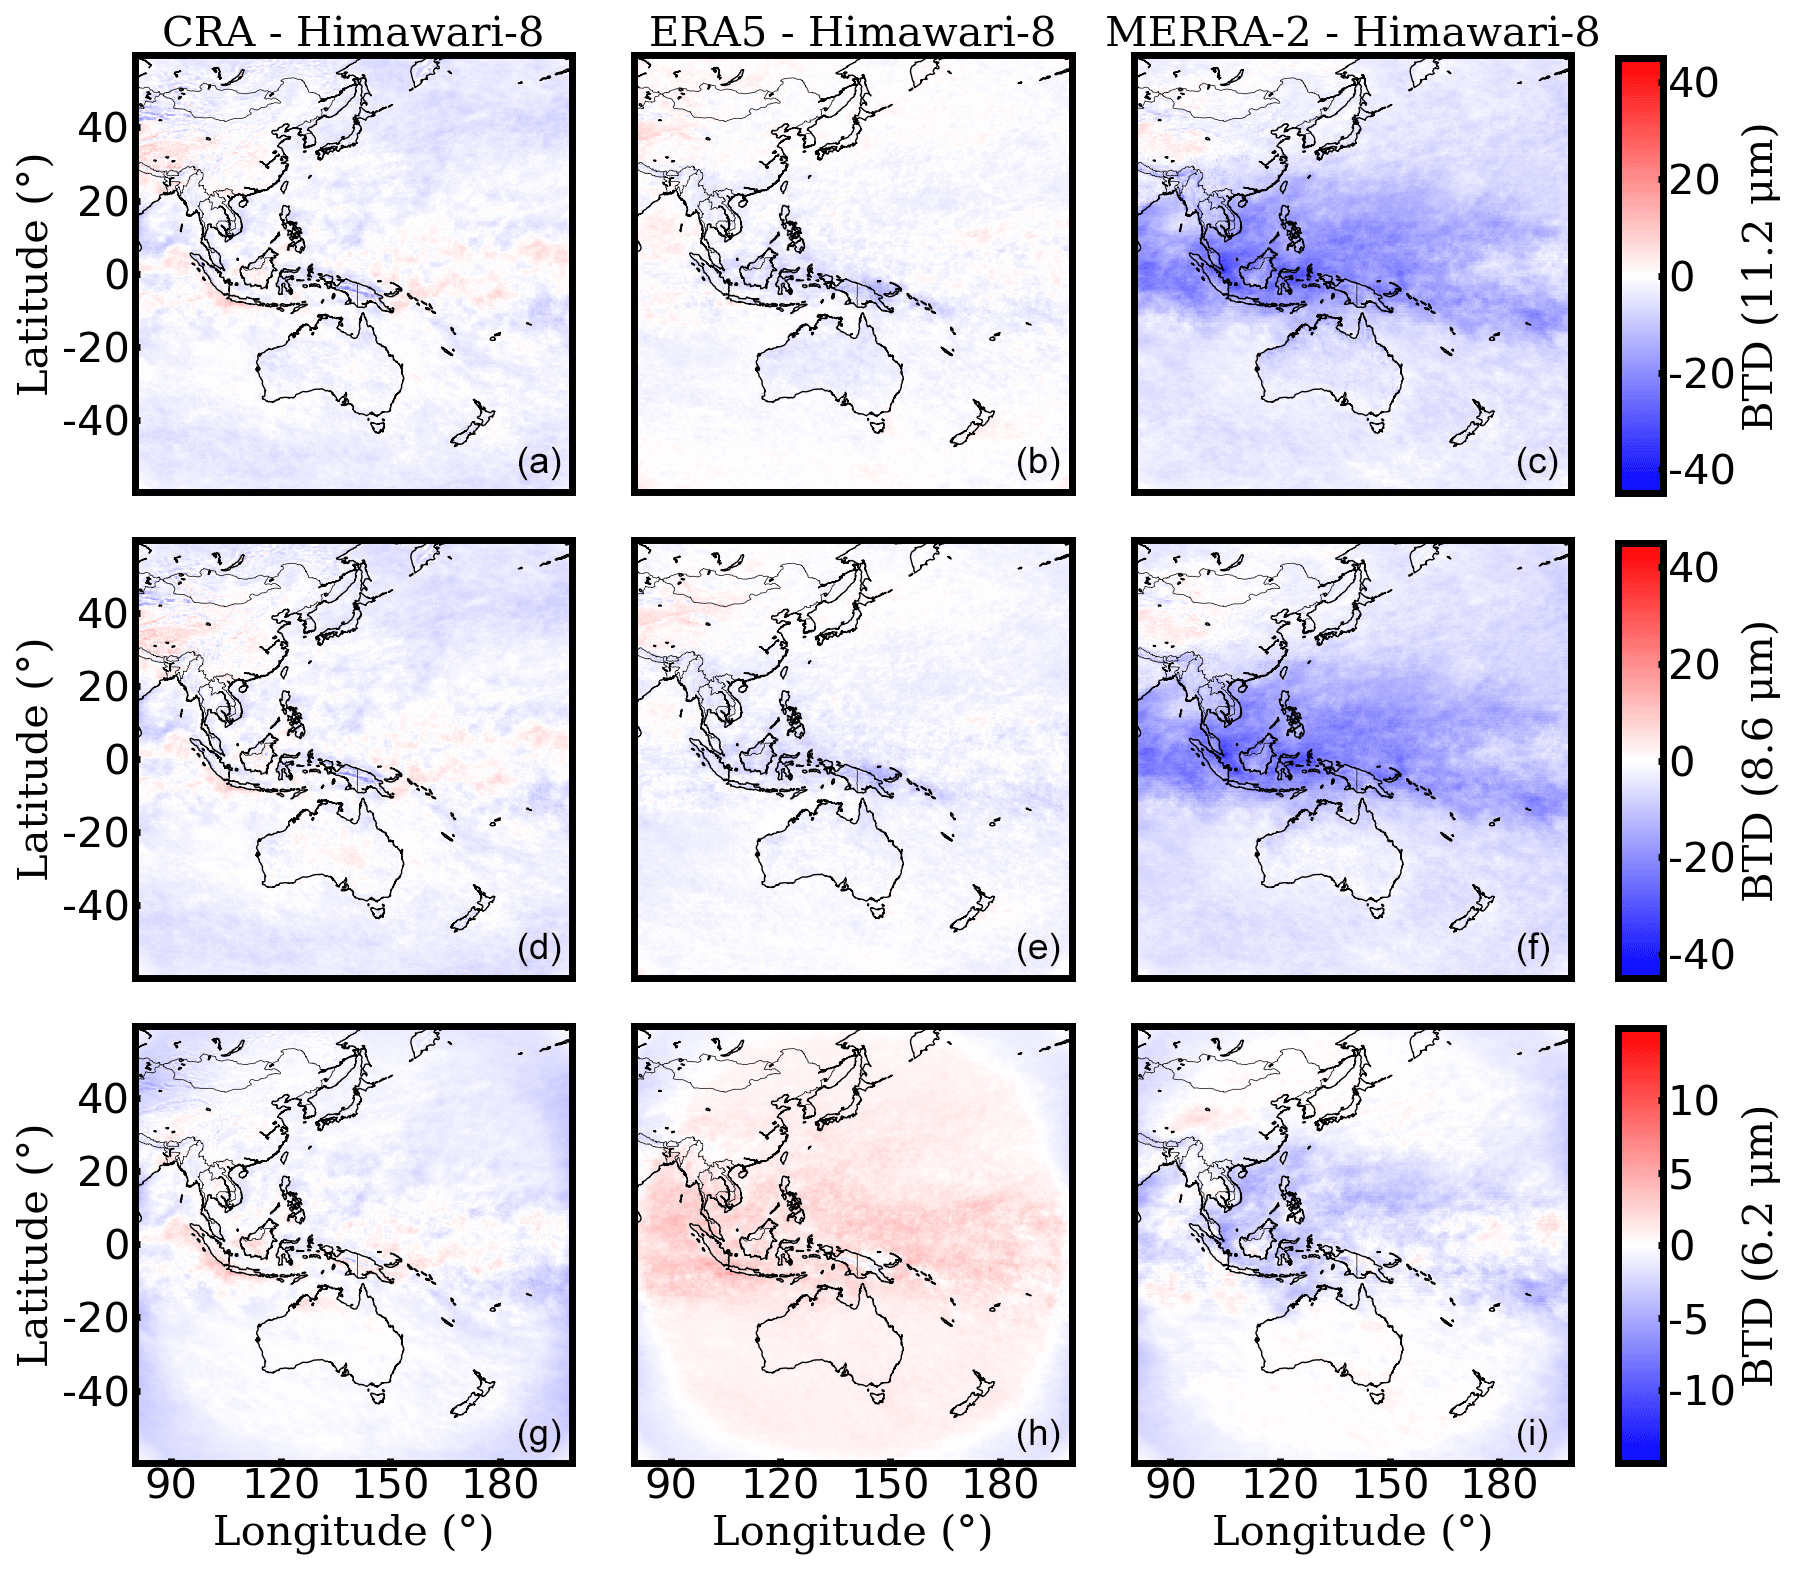
Figure 11Average result of brightness temperature differences between the observations and simulations in the 11.2 µm (a, b, c), 8.6 µm (d, e, f), and 6.2 µm (g, h, i) channels. The observations and simulations are from the 144 realizations spanning 2016.
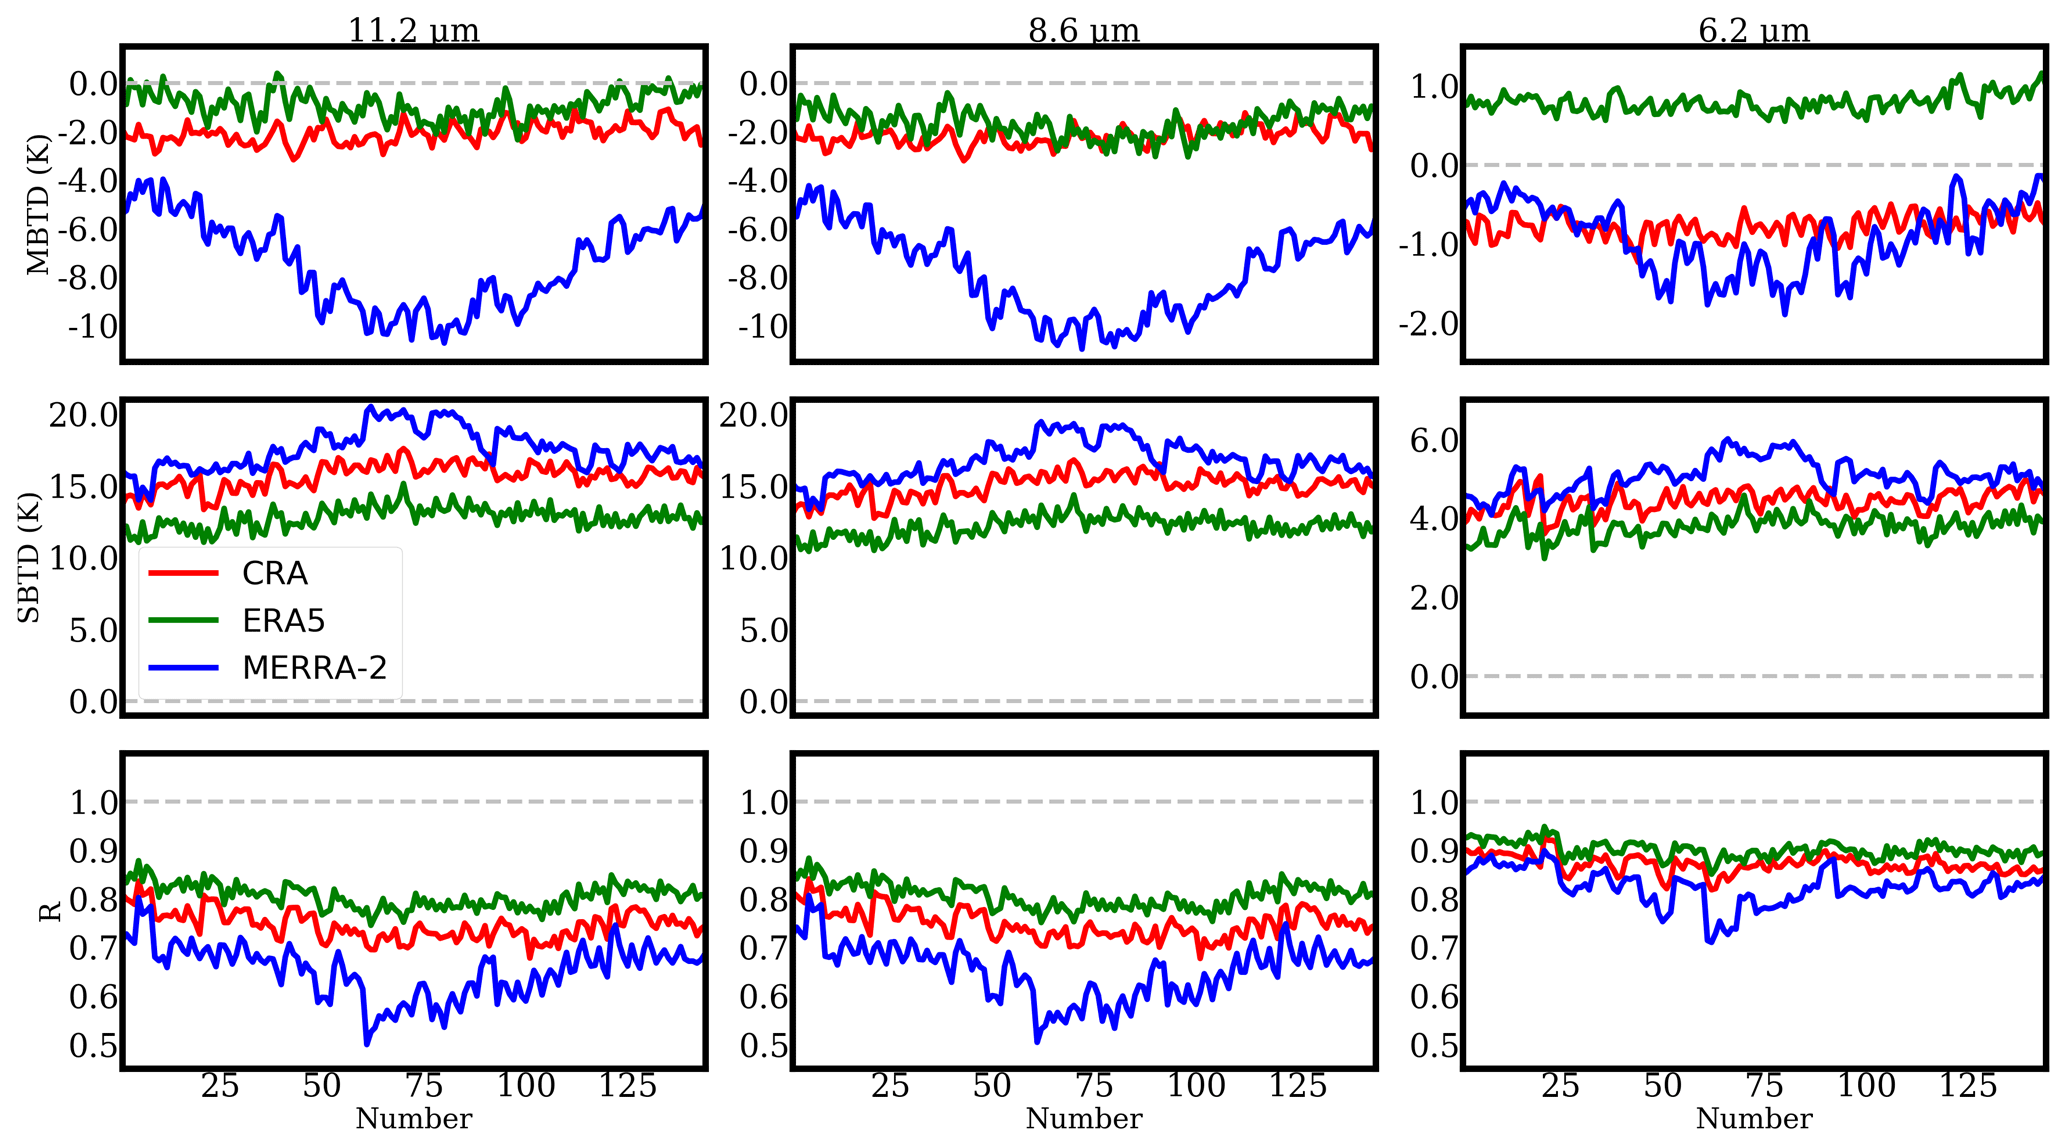
Figure 12Temporal variation in three statistical parameters: mean BTDs (MBTDs), standard deviations of BTDs (SBTDs), and correlation coefficient (R) between the simulations and observations. The results are from 144 realizations spanning 2016.
Figure 11 illustrates the BTDs between the simulations and the observations in the 11.2, 8.6, and 6.2 µm channels, averaged over the results from the 144 time steps. Over the entire region, most pixels have average BTDs of around 0 K in the IR window channels, which reveals good representations in CRA and ERA5. Regions with larger deviations are generally over the arid or semiarid areas (as marked by region A in Fig. 3) and the surrounding regions of the Equator. For MERRA-2, there are significant deviations with negative BTDs over the intertropical convergence zone, and the phenomenon extends to the region around 20∘ N. Most pixels of positive BTDs in the water vapor channel for ERA5 indicate an underestimation of water vapor, and it is more obvious over the intertropical convergence zone.
Figure 12 shows the temporal variation in the mean BTDs (MBTDs, i.e., average of the BTDs between simulations and observations over the entire region of interest), standard deviations of the BTDs (SBTDs, i.e., corresponding standard deviation of the BTDs over the whole region), and correlation coefficient (R, correlation coefficient between simulated and observed BTs) in the 11.2, 8.6, and 6.2 µm channels, and the corresponding average values are listed in Table 2 together with the results of Fig. 10. Three statistical parameters show seasonal variation characteristics over time, and the largest errors are in the Northern Hemisphere's summertime because of more complex weather systems and clouds. The mean BTDs for the three reanalysis datasets are always negative in the 11.2 and 8.6 µm channels, demonstrating the general overestimation of clouds, especially for MERRA-2 in summer. In the 6.2 µm channel, the opposite phases of mean BTDs indicate the generally underestimated mid- to high-layer water vapor for ERA5 but an overestimation for CRA, corresponding to the analysis in Fig. 11.
Overall, the spatial distributions of the average BTDs in Fig. 11 and the statistical evaluation in Fig. 12 indicate that the results of ERA5 have the best capability to represent atmospheric and cloud characteristics over the corresponding large region of the Himawari-8 observations, with the smallest absolute mean BTD of 0.92 K, the smallest standard deviation of BTDs of 12.77 K, and the largest correlation coefficient of 0.80. The CRA results are close to those in ERA5, whereas the deviations are slightly larger for MERRA-2. Large and systemic deviations for the three reanalyses are mostly over the oceanic region around the Equator and areas with complex surface features. This is because the atmospheric and cloud characteristics are complex and volatile, and the in situ observations are limited over these regions.
This study performs an evaluation of cloud properties from three reanalysis datasets (i.e., CRA, ERA5, and MERRA-2) with the Himawari-8 satellite observations by the radiance-based approach. The atmospheric and cloud variables in the reanalysis are converted into BTs or reflectance with the help of the coupling between the reanalysis and the RTM (i.e., CRTM), and the simulated radiative values are compared and analyzed with the direct satellite observations.
The atmospheric and cloud characteristics from CRA, ERA5, and MERRA-2 are mostly represented. The BTs in the IR window channels (i.e., 11.2 and 8.6 µm) and reflectance in the 0.64 µm channel reveal the excellent TCC and midlayer cloud in CRA. For MERRA-2, the low-layer clouds are more reasonable than clouds over other layers, and the widespread overestimated TCC is mostly caused by the overestimation of mid- and high-layer clouds. The reflectances in the 1.6 µm channel and the BTDs of 8.6–11.2 µm reflect the overestimated water vapor pixels over the ocean region in ERA5 and MERRA-2. However, it is slightly different over the center of the cyclone because more ice cloud pixels are depicted in MERRA-2.
Generally, CRA, ERA5, and MERRA-2 are all capable of representing the atmospheric and cloud characteristics over the Himawari-8 observed region. The larger statistical errors occur over the oceanic region around the Equator and areas with complex surface features because of the complex atmospheric and cloud structures and the limitation of in situ observations that can be assimilated into the reanalysis. The largest correlation coefficients of 0.80 and 0.90 between the observations and simulations in the IR window and water vapor channels, respectively, demonstrate that ERA5 achieves the generally best accuracy. The results of CRA also reveal reasonable simulations, and they are close to those in ERA5, whereas for MERRA-2, the deviations are slightly larger. It should be noted that both ERA5 and CRA reanalysis consider the Himawari-8 observations for assimilation (see Sect. 2), whereas the MERRA-2 does not. This may be one of the reasons why MERRA-2 gives a relatively poor performance of cloud representation over East Asia.
Compared with the evaluation by satellite-retrieved cloud products, the direct comparison of radiative parameters provides a more reasonable evaluation of the microphysical and radiative properties of the atmospheric and cloud properties from the reanalysis. It effectively avoids uncertainties associated with satellite retrieval, such as the scattering properties of cloud models, retrieval algorithms, and platforms. Meanwhile, there are also some drawbacks of the radiance-based model that should be considered in future studies. For example, differences between simulated and observed radiances can be caused by both cloud and atmospheric variables, which can hardly be separated, and these may be distinguished by considering the same atmospheric profiles in the RTM simulation. Last but not least, although the focus of this paper is on the observed region of the Himawari-8 satellite and cloudy atmospheres, this approach can be applied for more parameters (e.g., cloud, aerosol, precipitation, and so on) over any region with satellite observations available. Furthermore, the radiance-based evaluation should also be able to be used in the improvement of cloud properties in the reanalysis as well as in regional or global models and in the design of observations.
The data in this study are available at: https://github.com/carrolyb/Reanalysis_Evaluation_2019 (last access: 26 February 2020).
BY and CL designed the study, carried out the research, and performed data analysis. BY, CL, YY, ZL, CS, HI, and FW discussed the results and wrote the paper. All authors gave approval for the final version of the paper.
The authors declare that they have no conflict of interest.
The computation is supported by the National Supercomputer Center in Guangzhou (NSCC-GZ) and the blade cluster system from High Performance Computing Center of Nanjing University of Information Science and Technology.
This research has been supported by the Special Fund for Meteorological Scientific Research in the Public Interest (grant no. GYHY 201506002), the National Natural Science Foundation of China (grant nos. 41975025 and 41590873), the Young Elite Scientists Sponsorship Program of CAST (grant no. 2017QNRC001), and the Postgraduate Research and Practice Innovation Program of Jiangsu Province (grant no. KYCX18_1004).
This paper was edited by Joanna Joiner and reviewed by three anonymous referees.
Arakawa, A.: The cumulus parameterization problem: Past, present, and future, J. Climate, 17, 2493–2525, https://doi.org/10.1175/1520-0442(2004)017<2493:RATCPP>2.0.CO;2, 2004.
Baldridge, A. M., Hook, S. J., Grove, C. I., and Rivera, G.: The ASTER spectral library version 2.0, Remote Sens. Environ., 113, 711–715, https://doi.org/10.1016/j.rse.2008.11.007, 2009.
Baum, B. A., Kratz, D. P., Yang, P., Ou, S. C., Hu, H., Soulen, P. F., and Tsay, S.-C.: Remote sensing of cloud properties using MODIS airborne simulator imagery during SUCCESS.I. Data and models, J. Geophys. Res., 105, 767–780, https://doi.org/10.1029/1999JD901089, 2000.
Bessho, K., Date, K., Hayashi, M., Ikeda, A., Imai, T., Inoue, H., Kumagai, Y., Miyakawa, T., Murata, H., Ohno, T., Okuyama, A., Oyama, R., Sasaki, Y., Shimazu, Y., Shimoji, K., Sumida, Y., Suzuki, M., Taniguchi, H., Tsuchiyama, H., Uesawa, D., Yokota, H., and Yoshida, R.: An Introduction to Himawari-8/9 – Japan's New-Generation Geostationary Meteorological Satellite, J. Meteorol. Soc. Jpn., 94, 151–183, https://doi.org/10.2151/jmsj.2016-009, 2016.
Boucher, O., Randall, D., Artaxo, P., Bretherton, C., Feingold, G., Forster, P., Kerminen, V.-M., Kondo, Y., Liao, H., Lohmann, U., Rasch, P., Satheesh, S., Sherwood, S., Stevens, B., and Zhang, X.: Clouds and Aerosols, book section 7, Cambridge Univ. Press, Cambridge, UK, New York, 571–658, https://doi.org/10.1017/CBO9781107415324.016, 2013.
Cess, R. D., Potter, G. L., Blanchet, J. P., Boer, G. J., Ghan, S. J., Kiehl, J. T., Treut, H. LE., Li, Z.-X., Liang, X.-Z., Mitchell, J. F. B., Morcrette, J.-J., Randall, D. A., Riches, M. R., Roeckner, E. R., Schles, U., Slingo, A., Taylor, K. E., Washington, W. W., Wetherald, R. T., and Yagai, I.: Interpretation of cloud-climate feedbacks as produced by 14 atmospheric general circulation model, Science, 245, 513–516, https://doi.org/10.1126/science.245.4917.513, 1989.
Chaboureau, J.-P., Tulet, P., and Mari, C.: Diurnal cycle of dust and cirrus over West Africa as seen from Meteosat Second Generation satellite and a regional forecast model, Geophys. Res. Lett., 34, LO2822, https://doi.org/10.1029/2006GL027771, 2007.
Chen, Y., Weng, F., Han, Y., and Liu, Q.: Validation of the community radiative transfer model by using CloudSat data, J. Geophys. Res., 113, D00A03, https://doi.org/10.1029/2007JD009561, 2008.
Chevallier, F., Lopez, P., Tompkins, A. M., Janiskova, M., and Moreau, E.: The capability of 4D-Var systems to assimilate cloud-affected satellite infrared radiances, Q. J. Roy. Meteor. Soc., 130, 917–932, https://doi.org/10.1256/qj.03.113, 2004.
Cotton, W. R., Pielke, R. A. Sr., Walko, R. L., Liston, G. E., Tremback, C. J., Jiang, H., McAnelly, R. L., Harrington, J. Y., Nicholls, M. E., Carrio, G. G., and McFadden, J. P.: RAMS 2001: Current status and future directions, Meteorol. Atmos. Phys., 82, 5–29, https://doi.org/10.1007/s00703-001-0584-9, 2003.
Dee, D. P., Uppala, S. M., Simmons, A. J., Berrisford, P., Poli, P., Kobayashi, S., Andrae, U., Balmaseda, M. A., Balsamo, G., Bauer, P., Bechtold, P., Beljaars, A. C. M., van de Berg, L., Kållberg, P., Kållber, M., Matricardi, M., McNally, A. P., Monge-Sanz, B. M., Morcrette, J.-J., Park, B.-K., Peubey, C., de Rosnay, P., Tavolato, C., Thépaut, J.-N., and Vitart, F.: The ERA-Interim reanalysis: configuration and performance of the data assimilation system, Q. J. Roy. Meteor. Soc., 127, 553–597, https://doi.org/10.1002/qj.828, 2011.
Ding, S., Yang, P., Weng, F., Liu, Q., Han, Y., van Delst, P., Li, J., and Baum, B.: Validation of the community radiative transfer model, J. Quant. Spectrosc. Ra.., 112, 1050–1064, https://doi.org/10.1016/j.jqsrt.2010.11.009, 2010.
Dufresne, J.-L. and Bony, S.: An assessment of the primary sources of spread of global warming estimates from coupled atmosphere-ocean model, J. Climate, 21, 5135–5144, https://doi.org/10.1175/2008JCLI2239.1, 2008.
Free, M., Sun, B., and Yoo, H. L.: Comparison between Total Cloud Cover in Four Reanalysis Products and Cloud Measured by Visual Observations at US Weather Stations, J. Climate, 29, 2015–2021, https://doi.org/10.1175/JCLI-D-15-0637.1, 2016.
Gelaro, R., McCarty, W., Suárez, M. J., Todling, R., Molod, A., Takacs, L., Randles, C. A., Bosilovich, M. G., Reichle, R., Wargan, K., Copy, L., Cullather, R., Draper, C., Akella, S., Buchard, V., Conaty,, A., da Silve, A. M., Gu, W., Kim, G.-K., Koster, R., Lucchesi, R., Merkova, D., Nielsen, J. E., Partyka, G., Pawson, S., Putman, W., Rienecker, M., Schubert, S. D., Sienkiewicz, M., and Zhao, B.: The modern-era retrospective analysis for research and applications, version 2 (MERRA-2), J. Climate, 30, 5419–5454, https://doi.org/10.1175/JCLI-D-16-0758.1, 2017.
Guan, L. and Wang, Z.: Objective determination of AIRS cloud mask using co-located MODIS cloud mask, Scientia Meteorological Sincia, 27, 516–521, 2007.
Han, M., Braun, S. A., Matsui, T., and Williams, C. R.: Evaluation of cloud microphysics schemes in simulations of a winter storm using radar and radiometer measurements, J. Geophys. Res., 118, 1401–1419, https://doi.org/10.1002/jgrd.50115, 2013.
Hansen, J. E. and Hovenier, J. W.: The doubling method applied to multiple scattering of polarized light, J. Quant. Spectrosc. Ra., 11, 809–812, https://doi.org/10.1016/0022-4073(71)90057-4, 1971.
Hansen, J. E. and Travis, L. D.: Light scattering in planetary atmospheres, Space Sci. Rev., 16, 527–610, https://doi.org/10.1007/BF00168069, 1974.
Hashino, T., Satoh, M., Hagihara, Y., Kubota, T., Matsui, T., Nasuno, T., and Okamoto, H.: Evaluating cloud microphysics from NICAM against CloudSat and CALIPSO, J. Geophys. Res., 118, 7273–7292, https://doi.org/10.1002/jgrd.50564, 2013.
Hersbach, H. and Dee, D.: ERA5 reanalysis is in production, ECMWF Nesletter, 147, p. 7, 2016.
Heymsfield, A. J. and McFarquhar, G. M.: On the high albedos of anvil cirrus in the tropical Pacific warm pool: Microphysical interpretations from CEPEX and from Kwajalein, Marshall Islands, J. Atmos. Sci., 53, 2424–2451, https://doi.org/10.1175/1520-0469(1996)053<2424:HAOCIT>2.0.CO;2, 1996.
Heymsfield, A. J., Matrosov, J. S., and Baum, B.: Ice water path optical depth relationships for cirrus and deep stratiform ice cloud layers, J. Appl. Meteorol., 42, 1369–1390, https://doi.org/10.1175/1520-0450(2003)042<1369:IWPDRF>2.0.CO;2, 2003.
Holz, R. E., Ackerman, A., Nagle, F. W., Frey, R., Dutcher, S., Kuehn, R. E., Vaughan, M. A., and Baum, B.: Global Moderate Resolution Imaging Spectroradiometer (MODIS) cloud detection and height evaluation using CALIOP, J. Geophys. Res., 113, D00A19, https://doi.org/10.1029/2008JD009837, 2008.
Iwabuchi, H., Putri, N. S., Saito, M., Tokoro, Y., Sekiguchi, M., Yang, P., and Baum, B. A.: Cloud Property Retrieval from Multiband Infrared Measurements by Himawari-8, J. Meteorol. Soc. Jpn., 96, 27–42, https://doi.org/10.2151/jmsj.2018-001, 2018.
Jakob, C.: Cloud Cover in the ECMWF Reanalysis, J. Climate, 12, 947–959, https://doi.org/10.1175/1520-0442(1999)012<0947:CCITER>2.0.CO;2, 1999.
Järvinen, E., Jourdan, O., Neubauer, D., Yao, B., Liu, C., Andreae, M. O., Lohmann, U., Wendisch, M., McFarquhar, G. M., Leisner, T., and Schnaiter, M.: Additional global climate cooling by clouds due to ice crystal complexity, Atmos. Chem. Phys., 18, 15767–15781, https://doi.org/10.5194/acp-18-15767-2018, 2018.
Kalnay, E., Kanamitsu, M., Kistler, R., Collins, W., Deaven, D., Gandin, L., Iredell, M., Saha, S., White, G., Woolen, J., Zhu, Y., Chlliah, M,, Ebisuzaki, W., Higgins, W., Janowiak, J., Mo, K. C., Ropelewski, C., Wang, J., Leetmaa, A., Reynolds, R., Jenne, R., and Joseph, D.: The NCEP/NCAR 40-Year Reanalysis Project, B. Am. Meteorol. Soc., 77, 1757–1774, https://doi.org/10.1175/1520-0477(1996)077<0437:TNYRP>2.0.CO;2, 1996.
King, M. D., Kaufman, Y. J., Menzel, W. P., and Tanre, D.: Remote sensing of cloud, aerosol, and water vapor properties from the Moderate Resoluting Imaing Spectrometer (MODIS), IEEE T. Geosci. Remote, 301, 2–27, https://doi.org/10.1109/36.124212, 1992.
Kleist, D. T., Parrish, D. F., Derber, J. C., Treadon, R., Wu, W.-S., and Lord, S.: Introduction of the GSI into the NCEP Global Data Assimilation System, Weather Forecast., 24, 1691–1705, https://doi.org/10.1175/2009WAF2222201.1, 2009.
Kobayashi, S., Ota, Y., Harada, Y., Ebita, A., Moriya, M., Onoda, H., Onogi, K., Kamahori, H., Kobayashi, C., Endo, H., Miyaoka, K., and Takahashi, K.: The JRA-55 Reanalysis: General specifications and basic characteristics, J. Meteorol. Soc. Jpn., 93, 5–48, https://doi.org/10.2151/jmsj.2015-001, 2015.
Lai, R., Teng, S., Yi, B., Letu, H., Min, M., Tang, S., and Liu, C.: Comparison of Cloud Properties from Himawari-8 and Fengyun-4A Geostationary Satellite Radiometers with MODIS Cloud Retrievals, Remote Sens., 11, 1703, https://doi.org/10.3390/rs11141703, 2019.
Liao, J., Hu, K., Jiang, H., Cao, J., Jiang, L., Li, Q., Zhou, Z., Liu, Z., Zhang, T., and Wang, H.: Pre-Process and Data Selection for Assimilation of Conventional Observations in the CMA Global Atmospheric Reanalysis, Advances in Met. S&T., 8, 133–142, https://doi.org/10.2969/j.issn.2095-1973.2017.01.018, 2018.
Liu, Q. and Weng, F.: Advanced doubling-adding method for radiative transfer in planetary atmosphere, J. Atmos. Sci., 63, 3459–3465, https://doi.org/10.1175/JAS3803.1, 2006.
Mao, K., Qin, Z., Shi, J., and Gong, P.: A practical split-window algorithm for retrieving land-surface temperature from MODIS data, Int. J. Remote Sens., 26, 3181–3204, https://doi.org/10.1029/2006GL026547, 2005.
Matsui, T., Santanello, J., Shi, J. J., Tao, W.-K., Wu, D., Peters-Lidard, C., Kemp, E., Chin, M., Starr, D., Sekiguchi, M., and Aires, F.: Introducing multisensory satellite radiance-based evaluation for regional Earth System modeling, J. Geophys. Res., 119, 8450–8475, https://doi.org/10.1002/2013JD021424, 2014.
Mazin, I. P.: Cloud Phase Structure: Experimental Data Analysis and Parameterization, J. Atmos. Sci., 63, 667–681, https://doi.org/10.1175/JAS3660.1, 2004.
McNally, A. P.: The direct assimilation of cloud-affected satellite infrared radiances in the ECMWF 4D-Var, Q. J. Roy. Meteor. Soc. 135, 1214–1229, https://doi.org/10.1002/qj.426, 2009.
Mecikalski, J. R. and Bedka, K. M.: Forecasting convective initiation by monitoring the evolution of moving cumulus in daytime GOES imagery, Mon. Weather Rev., 134, 49–78, https://doi.org/10.1175/MWR3062.1, 2006.
Mie, G.: Beiträge zur optic trüber medien, speziell kolloidaler metallösungen, Ann. Phys., 330, 337–445, 1908.
Miles, N. L., Verlinde, J., and Clothiaux, E. E.: Cloud Droplet Size Distributions in Low-Level Stratiform Clouds, J. Atmos. Sci., 57, 295–311, https://doi.org/10.1175/1520-0469(2000)057<0295:CDSDIL>2.0.CO;2, 2000.
Morcrette, J.-J.: Evaluation of model-generated cloudiness: Satellite-observed and model-generated diurnal variability of brightness temperature, Mon. Weather Rev., 119, 1205–1224, 1991.
Onogi, K., Tsutsui, J., Koide, H., Sakamoto, M., Kobayashi, S., Hatsushika, H., Matsumoto, T., Yamazaki, N., Kamahori, H., Takahashi, K., Kadokura, S., WADA, K., Kato, K., Oyama, R., Ose, T., Mannoji, N., and Taira, R.: The JRA-25 Reanalysis, J. Meteorol. Soc. Jpn., 85, 369–432, https://doi.org/10.2151/jmsj.85.369, 2007.
Otkin, J. A., Greenwald, T. J., Sieglaff, J., and Huang, H.-L.: Validation of a large-scale simulated brightness temperature dataset using SEVIRI satellite observations, J. Climate, 25, 4975–4992, https://doi.org/10.1175/2009JAMC2142.1, 2009.
Platt, C. M. R.: A Parameterization of the Visible Extinction Coefficient of Ice Clouds in Terms of the Ice/Water Content, J. Atmos. Sci., 54, 2083–2098, https://doi.org/10.1175/1520-0469(1997)054<2083:APOTVE>2.0.CO;2, 1997.
Rienecker, M. M., Suarez, M. J., Gelaro, R., Todling, R., Bacmeister, J., Liu, E., Bosilovich, M. G., Schubert, S. D., Takacs, L., Kim, G.-K., Bloom, S., Chen, J., Collins, D., Conaty, A., da Silva, A., Gu, W., Joiner, J., Koster, R. D., Lucchesi, R., Molod, A., Owens, T., Pawson, S., Pegion, P., Redder, C. R., Reichle, R., Robertson, F, R., Ruddick, A. G., Sienkiewicz, M., and Woollen, J.: MERRA: NASA's Modern-Era Retrospective Analysis for Research and Applications, J. Climate, 24, 3624–3648, https://doi.org/10.1175/JCLI-D-11-00015.1, 2011.
Thompson, G., Rasmussen, R. M., and Manning, K.: Explicit forecasts of winter precipitation using an improved bulk microphysics scheme, Part II: Description and sensitivity analysis, Mon. Weather Rev., 132, 519–542, 2004.
Twomey, S., Jacobowitz, H., and Howell, H. B.: Matrix methods for multiple-scattering problems, J. Atmos. Sci., 23, 289–298, 1966.
Uppala, S. M., KÅllberg, P. W., Simmons, A. J., Andrae, U., da costa Bechtold, V., Fiorino, M., Gibson, J. K., Haseler, J., Hernandez, A., Kelly, G. A., Li, X., Onogi, K., Saarinen, S., Sokka, N., Allan, R. P., Andersson, E., Arpe, K., Balmaseda, M. A., Beljaars, A. C. M, van de Berg, L., Bidlot, J., Bormann, N., Caires, S., Chevallier, F., Dethof, A., Dragosavac, M., Fisher, M., Fuentes, M., Hagemann, S., Hólm, E., Hoskins, B. J., Isaksen, L., Janssen, P. A. E. M., Jenne, R., Mcnally, A. P., Mahfouf, J.-F., Morcrette, J.-J., Rayner, N. A., Saunders, R. W., Simon, P., Sterl, A., Trenberth, K. E., Untch, A., Vasiljevic, D., Viterbo, P., and Woollen, J.: The ERA-40 re-analysis, Q. J. Roy. Meteor. Soc., 131, 2961–3012, https://doi.org/10.1256/qj.04.176, 2005.
Waliser, D. E., Li, J.-L. F., Woods, C. P., Austin, R. T., Bacmeister, J., Chern, J., Genio, A. D., Jiang, J. H., Kuang, Z., Meng, H., Minnis, P., Platnick, S., Rossow, W. B., Stephens, G. L., Sun-Mack, S., Tao, W.-K., Tompkins, A. M., Vane, D. G., Walker, C., and Wu, D.: Cloud ice: A climate model challenge with signs and expectations of progress, J. Geophys. Res., 114, D00A21, https://doi.org/10.1029/2008JD010015, 2009.
Wang, J., Liu, C., Min, M., Hu, X., Lu, Q., and Husi, L.: Effects and Applications of Satellite Radiometer 2.25 µm Channel on Cloud Property Retrievals, IEEE T. Geosci, Remote, 56, 5207–5216, https://doi.org/10.1109/TGRS.2018.2812082, 2018.
Wang, M., Yao, S., Jiang, L., Liu, Z., Shi, C., Hu, K., Zhang, T., Zhang, Z., and Liu, J.: Collection and Pre-Processing of Satellite Remote-Sensing Data in CRA-40 (CMA's Global Atmospheric ReAnalysis), Advances in Met S&T., 8, 158–163, https://doi.org/10.3969/j.issn.2095-1973.2018.01.021, 2018.
Weng, F.: A multi-layer discrete-ordinate method for vector radiative transfer in a vertically-inhomogeneous, emitting and scattering atmosphere: Theory, J. Quant. Spectrosc. Ra., 47, 19–33, https://doi.org/10.1016/0022-4073(92)90076-G, 1992.
Wind, G., da Silva, A. M., Norris, P. M., and Platnick, S.: Multi-sensor cloud retrieval simulator and remote sensing from model parameters – Part 1: Synthetic sensor radiance formulation, Geosci. Model Dev., 6, 2049–2062, https://doi.org/10.5194/gmd-6-2049-2013, 2013.
Wu, W. S., Purser, R. J., and Parrish, D. F.: Three-dimensional variation analysis with spatially inhomogeneous covariances, Mon. Weather Rev., 130, 2905–2916, https://doi.org/10.1175/1520-0493(2002)130<2905:TDVAWS>2.0.CO;2, 2002.
Yang, P., Bi, L., Baum, B. A., Liou, K.-N., Kattawar, G. W., Mishchenko, M. I., and Cole, B.: Spectrally consistent scattering, absorption, and polarization properties of atmospheric ice crystals at wavelengths from 0.2 to 100 μm, J. Atmos. Sci., 70, 330–347, https://doi.org/10.1175/JAS-D-12-039.1, 2013.
Yang, P., Liou, K.-N., Bi, L., Liu, C., Yi, B., and Baum, B. A.: On the radiative properties of ice clouds: Light scattering, remote sensing, and radiation parameterization, Adv. Atmos. Sci., 32, 32–63, https://doi.org/10.1007/s00376-014-0011-z, 2015.
Yao, B., Liu, C., Yin, Y., Zhang, P., Min, M., and Han, W.: Radiance-based evaluation of WRF cloud properties over East Asia: Direct comparison with FY-2E observations, J. Geophys. Res., 123, 4613–4629, https://doi.org/10.1029/2017JD027600, 2018.
Yi, B., Yang, P., Liu, Q., van Delst, P., Boukabara, S.-A., and Weng, F.: Improvements on the ice cloud modeling capabilities of the Community Radiative Transfer Model, J. Geophys. Res., 121, 577–590, https://doi.org/10.1002/2016JD025207, 2016.
Yi, B., Rapp, A. D., Yang, P., Baum, B. A., and King, M. D.: A comparison of Aqua MODIS ice and liquid water cloud physical and optical properties between collection 6 and collection 5.1: Pixel-to-pixel comparisons, J. Geophys. Res., 122, 4528–4549, https://doi.org/10.1002/2016JD025586, 2017a.
Yi, B., Rapp, A. D., Yang, P., Baum, B. A., and King, M. D.: A comparison of Aqua MODIS ice and liquid water cloud physical and optical properties between collection 6 and collection 5.1: Cloud radiative effects, J. Geophys. Res., 122, 4550–4565, https://doi.org/10.1002/2016JD25654, 2017b.
Yu, W., Sèze, G., Treut, H. L., and Desbois, M.: Comparison of radiance fields observed by satellite and simulated by the LMD general circulation model, Dynam. Atmos. Oceans, 16, 147–165, https://doi.org/10.1016/0377-0265(91)90018-B, 1991.
Zhang, P., Lu, Q., Hu, X., Gu, S., Yang, L., Min, M., Chen, L., Xu, N., Sun, L., Bai, W., Ma, G., and Xian, D.: Latest progress of the Chinese Meteorological Satellite program and core data processing technologies, Adv. Atmos. Sci., 36, 1027–1045, 2019.
Zhou, G. and Gao, S.: Analysis of the September 2016 Atmospheric Circulation and Weather, Meteor. Mon., 42, 1560–1566, https://doi.org/10.7519/j.issn.1000-0526.2016.12.015, 2016.