the Creative Commons Attribution 4.0 License.
the Creative Commons Attribution 4.0 License.
 | 09 Mar 2020
An automated method for preparing and calibrating electrochemical concentration cell (ECC) ozonesondes
Francis J. Schmidlin
Bruno A. Hoegger
In contrast to the legacy manual method used to prepare, condition, and calibrate the electrochemical concentration cell (ECC) ozonesonde, an automated digital calibration bench similar to one developed by MeteoSwiss at Payerne, Switzerland, was established at NASA's Wallops Flight Facility and provides reference measurements of the same ozone partial pressure as measured by the ECC. The purpose of an automated system is to condition and calibrate ECCs before launching on a balloon. Operation of the digital calibration bench is simple and real-time graphs and summaries are available to the operator; all information is archived. The parameters of interest include ozone partial pressure, airflow, temperature, background current, response, and time (real and elapsed). ECCs, prepared with 1.0 % solution of potassium iodide (KI) and full buffer, show increasing partial pressure values when compared to the reference as partial pressures increase. Differences of approximately 5–6 % are noted at 20.0 mPa. Additional tests with different concentrations revealed the Science Pump Corp. (SPC) 6A ECC with 0.5 % KI solution and one-half buffer agreed closer to the reference than the 1.0 % cells. The information gained from the automated system allows a compilation of ECC characteristics, as well as calibrations. The digital calibration bench is recommended for ECC studies as it conserves resources.
- Article
(2777 KB) - Full-text XML
- BibTeX
- EndNote


Measurement disagreement between similar or identical instruments seems to be a historical problem. Intercomparisons are generally conducted when new instruments are introduced and when operational changes or improved procedures become available. Such comparisons should be made under the same environmental conditions and include a reference instrument as an aid for checking the accuracy and reliability of the instruments. This would be ideal as a standard procedure. Unfortunately, balloon-borne ozone reference instruments are not usually available, mostly because they are too expensive for other than occasional use or to expend on non-recoverable balloon packages. Ozonesonde preflight calibrations are conducted; however these are basically single-point calibrations made prior to its release. An automated system designed to condition and calibrate the electrochemical concentration cell (ECC) ozonesonde was fabricated at Wallops Flight Facility. The automated system can condition the ECC prior to flight and, if desired, provide calibration over a wide range of ozone partial pressures. This system, designated the digital calibration bench, enables consistent conditioning and calibration of the ECC along with measurements of a reference value. In this paper the term ECC refers only to the Science Pump Corp. (SPC) 6A ECC ozonesonde, although the automated system can accommodate the Environmental Science (EN-SCI) ozonesonde as well.
There are a variety of ground-, aircraft-, satellite-, rocket-, and balloon-borne instruments available to measure the vertical structure of atmospheric ozone and its total content. These instruments operate on different principles of measurement (Fishman et al., 2003; Kohmyr, 1969; Krueger, 1973; Holland et al., 1985; Hilsenrath et al., 1986; Sen et al., 1996). Although their spatial distribution is limited, balloon-borne electrochemical concentration cell (ECC) ozonesondes have had a key role as a source of truth for the other instruments and for establishing algorithms necessary for the retrieval of satellite observations. Manual preparation of the ECC requires hands-on contact by an operator.
Reducing subjectivity is important and was considered serious enough to engage in the fabrication of the automated system. The user is prompted throughout the calibration process while utilizing real-time graphs and summaries. The digital calibration bench provides consistent preparation procedures. ECC-measured ozone partial pressures vs. reference partial pressures are discussed and the results corroborated with dual-ECC comparisons at Wallops Island. During implementation of the digital calibration bench, beta testing provided the dual-ECC measurements used in this paper for demonstration purposes. Operational use at Wallops Island was intermittent and only provided a limited number of ECC preparation records between 2009 and 2017, when bench components began to fail.
Notwithstanding efforts to enhance ECC performance (Smit and ASOPOS panel, 2014; Smit and Sträter, 2004, Smit et al., 2007; Kerr et al., 1994; Johnson et al., 2002; Torres, 1981), there remain uncertainties. The accuracy of the ECC is estimated at 5 %–10 % and also varies with altitude (Deshler et al., 2017; Smit and ASOPOS Panel, 2014). However, standardization of ozonesonde preparation methods has improved, and better data quality control (Smit et al., 2014) and the homogenization of the ozone data (Deshler et al., 2017; Sterling et al., 2013) have raised the level of ozonesonde usefulness. Uncertainties also arise from poor compensation for the loss of pump efficiency, erroneous background current, variable motor speed, solution loss from turbulent cathode cell bubbling, airflow temperature error and whether measured at the proper location, and the use of the appropriate potassium iodide (KI) concentration. Understanding the influence these parameters have on the ozonesonde measurement capability is particularly important. The digital calibration bench is able to measure these parameters in a consistent way over a range of partial pressures.
2.1 Description
The computer-controlled preparation and calibration bench fabricated at NASA Wallops Flight Facility borrows from the design of a bench developed by MeteoSwiss scientists Bruno A. Hoegger and Gilbert Levrat at Payerne, Switzerland. The MeteoSwiss digital calibration bench was first available in 1995 and continues to be used and is updated periodically. The MeteoSwiss and Wallops digital calibration benches are functionally similar but are not identical in design. A comparable bench provided by MeteoSwiss to the meteorological station at Nairobi, Kenya, has been in use since 2018. The Wallops Island ozone site was interested in the digital bench because of its capability to provide precise and repeatable preparation of ECCs, and its automated feature requires less interaction with the ECC than the manual preparation method. The Wallops Island digital bench was undergoing development between 2005 and 2008 and used operationally only to prepare ECCs between 2009 and 2017.
Throughout the history of ECC ozonesonde performance, the concentration of the KI solution has been questioned (Thornton and Niazy, 1982; Barnes et al., 1985; Johnson et al., 2002; Sterling et al., 2018). In the late 1960s and early 1970s the recommendation to use 2.0 % solution was unchallenged. In the mid-1970s the concentration was changed to 1.5 %, and in 1995 the KI solution was changed once more to 1.0 %. Employing the Wallops digital calibration bench enables adjustment of the datasets obtained with the different concentrations to homogenize and improve the consistency of the measurements of the long-term database. The digital calibration bench allows consistent, computer-controlled preparation of ECC instruments. The calibration bench accurately measures the ozone reaching the ECCs while a Thermo Environmental, Inc. (TEI) ozone generator provides the source of ozone at partial pressures between 0.0 and 30.0 mPa. A second TEI instrument accurately measures the ozone sent to the ECC, providing a reference value. Thus, performance comparisons are possible without expending costly instruments.
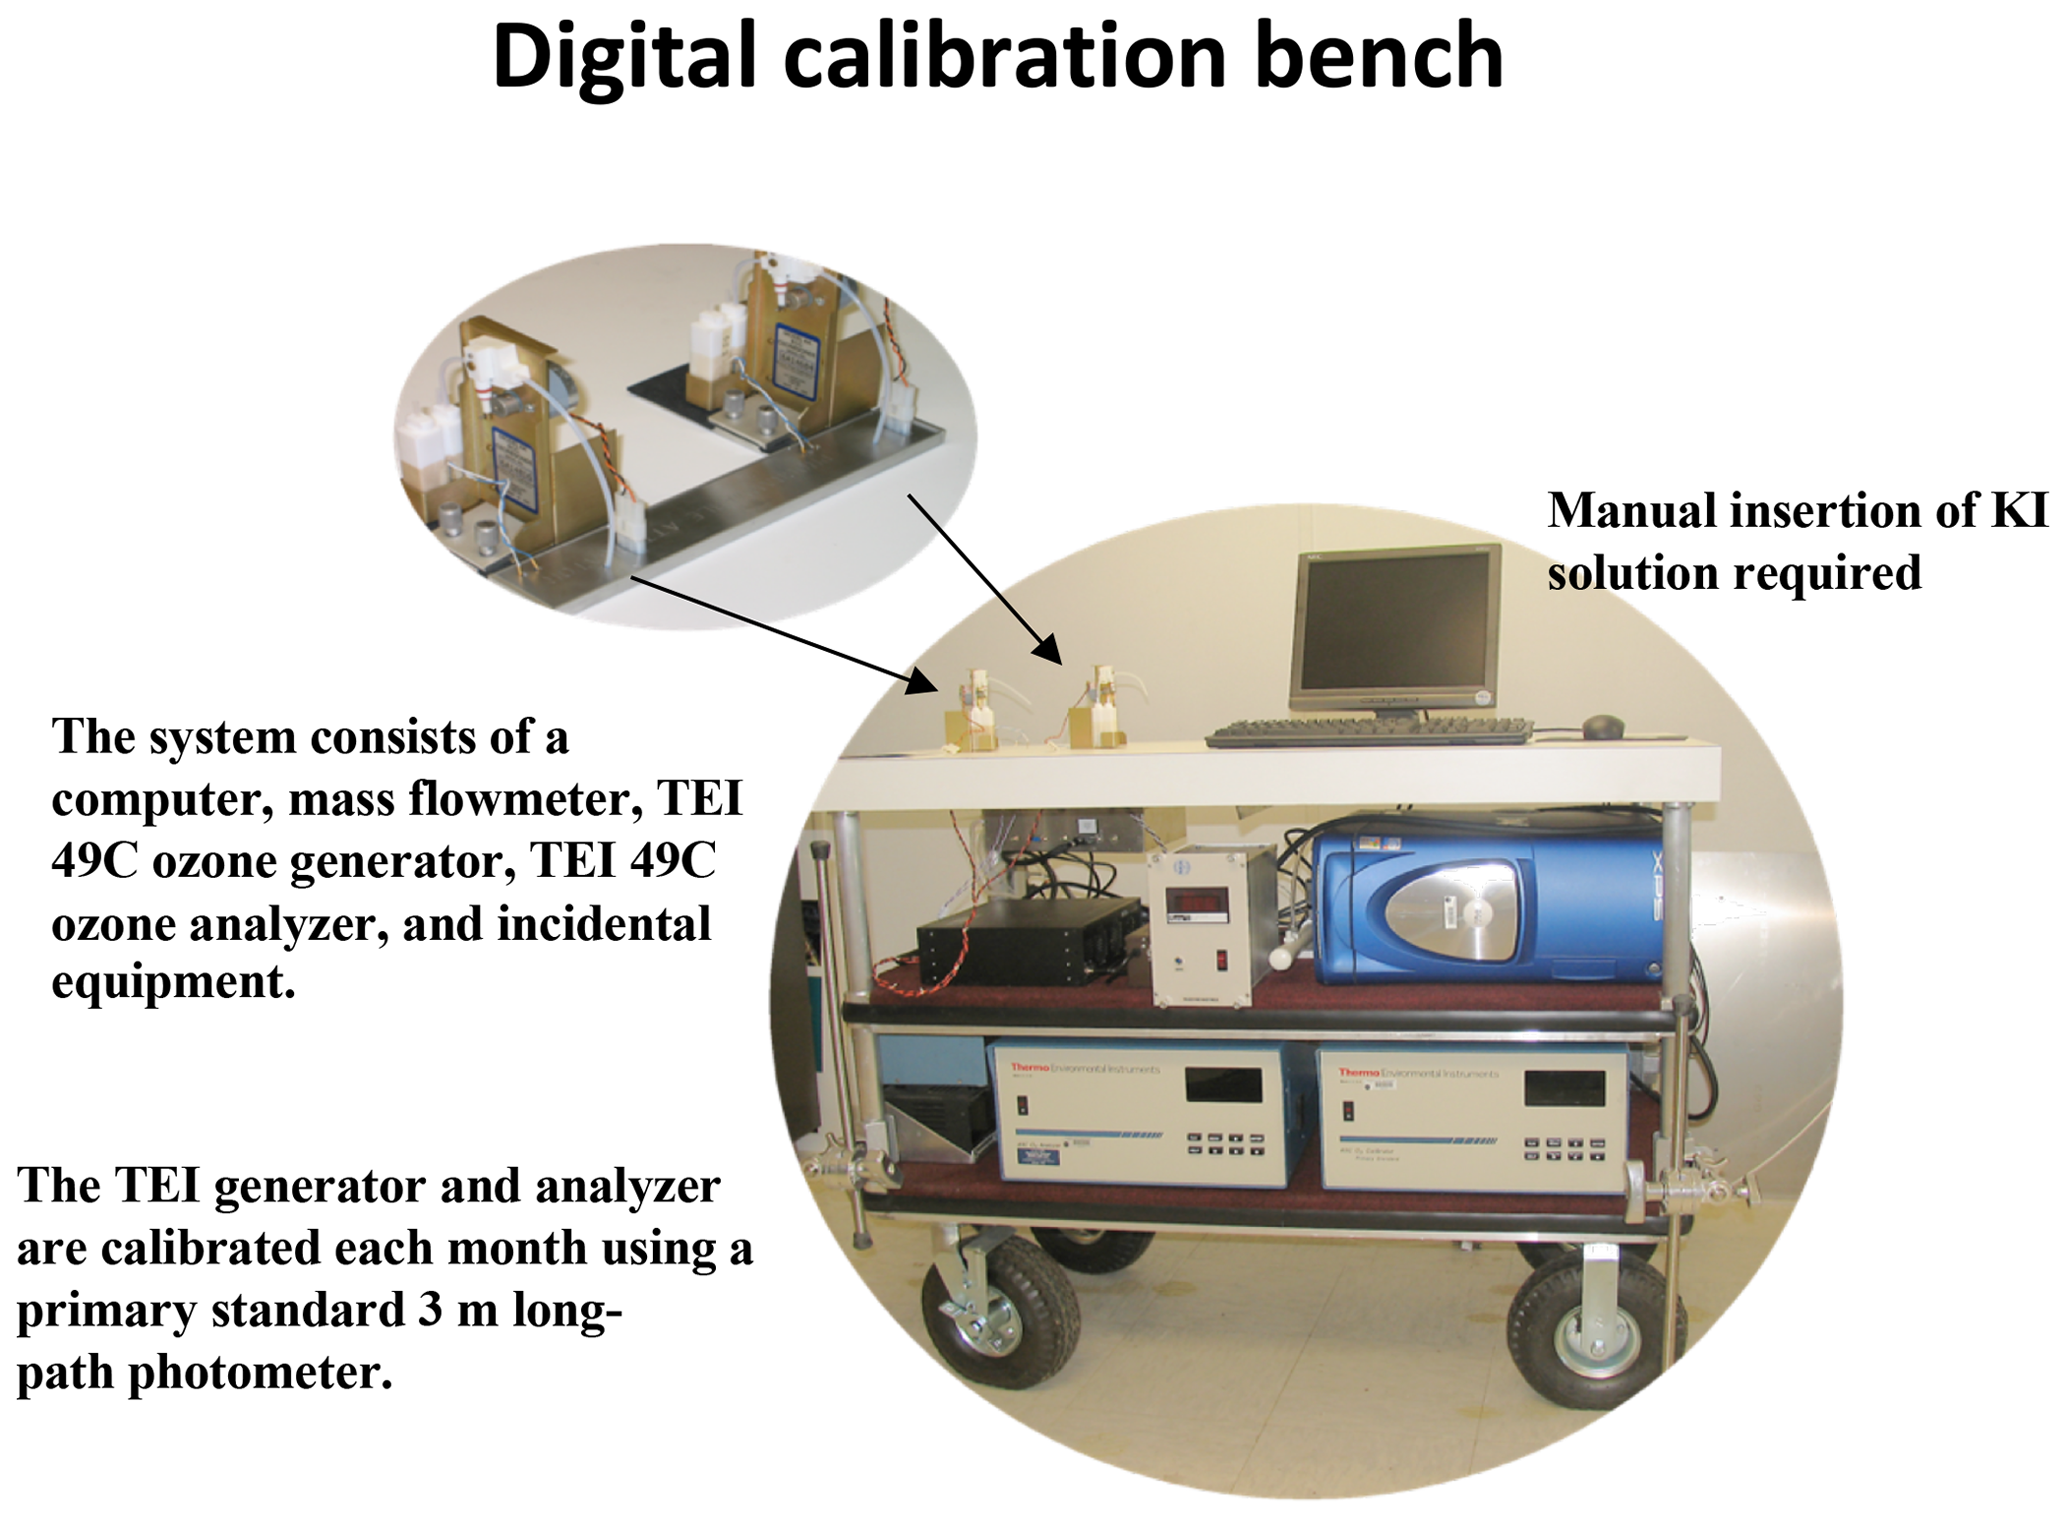
Figure 1Digital calibration bench showing operational configuration and mounting position of two ECC ozonesondes. Major components include the ozone generator and analyzer, computer, flowmeter, and glass manifold.
The Wallops digital calibration bench, shown in Fig. 1, consists of three major components: (1) a mass flowmeter to control airflow, (2) an ozone generator and analyzer (UV photometer), and (3) a computer necessary to automate the timing of the programmed functions and process the data. Another important component, the glass manifold, enables the simultaneous distribution of the airflow to the ECCs and the UV photometer. The manifold is also a buffer maintaining constant airflow and inhibiting flow fluctuation. A graphical user interface controls the various input and output functions using an interface board and communications portal enabling synchronous communication protocols. A signal conditioning box allows connections to the ECCs' analog signals that are conditioned with custom electronic components. Minor but necessary components include pressure and temperature sensors and valves and solenoids to direct the flow of laboratory-grade air. Calibration validity is accomplished by comparing the measured ECC ozone partial pressure against a reference partial pressure obtained with the UV photometer (TEI analyzer).
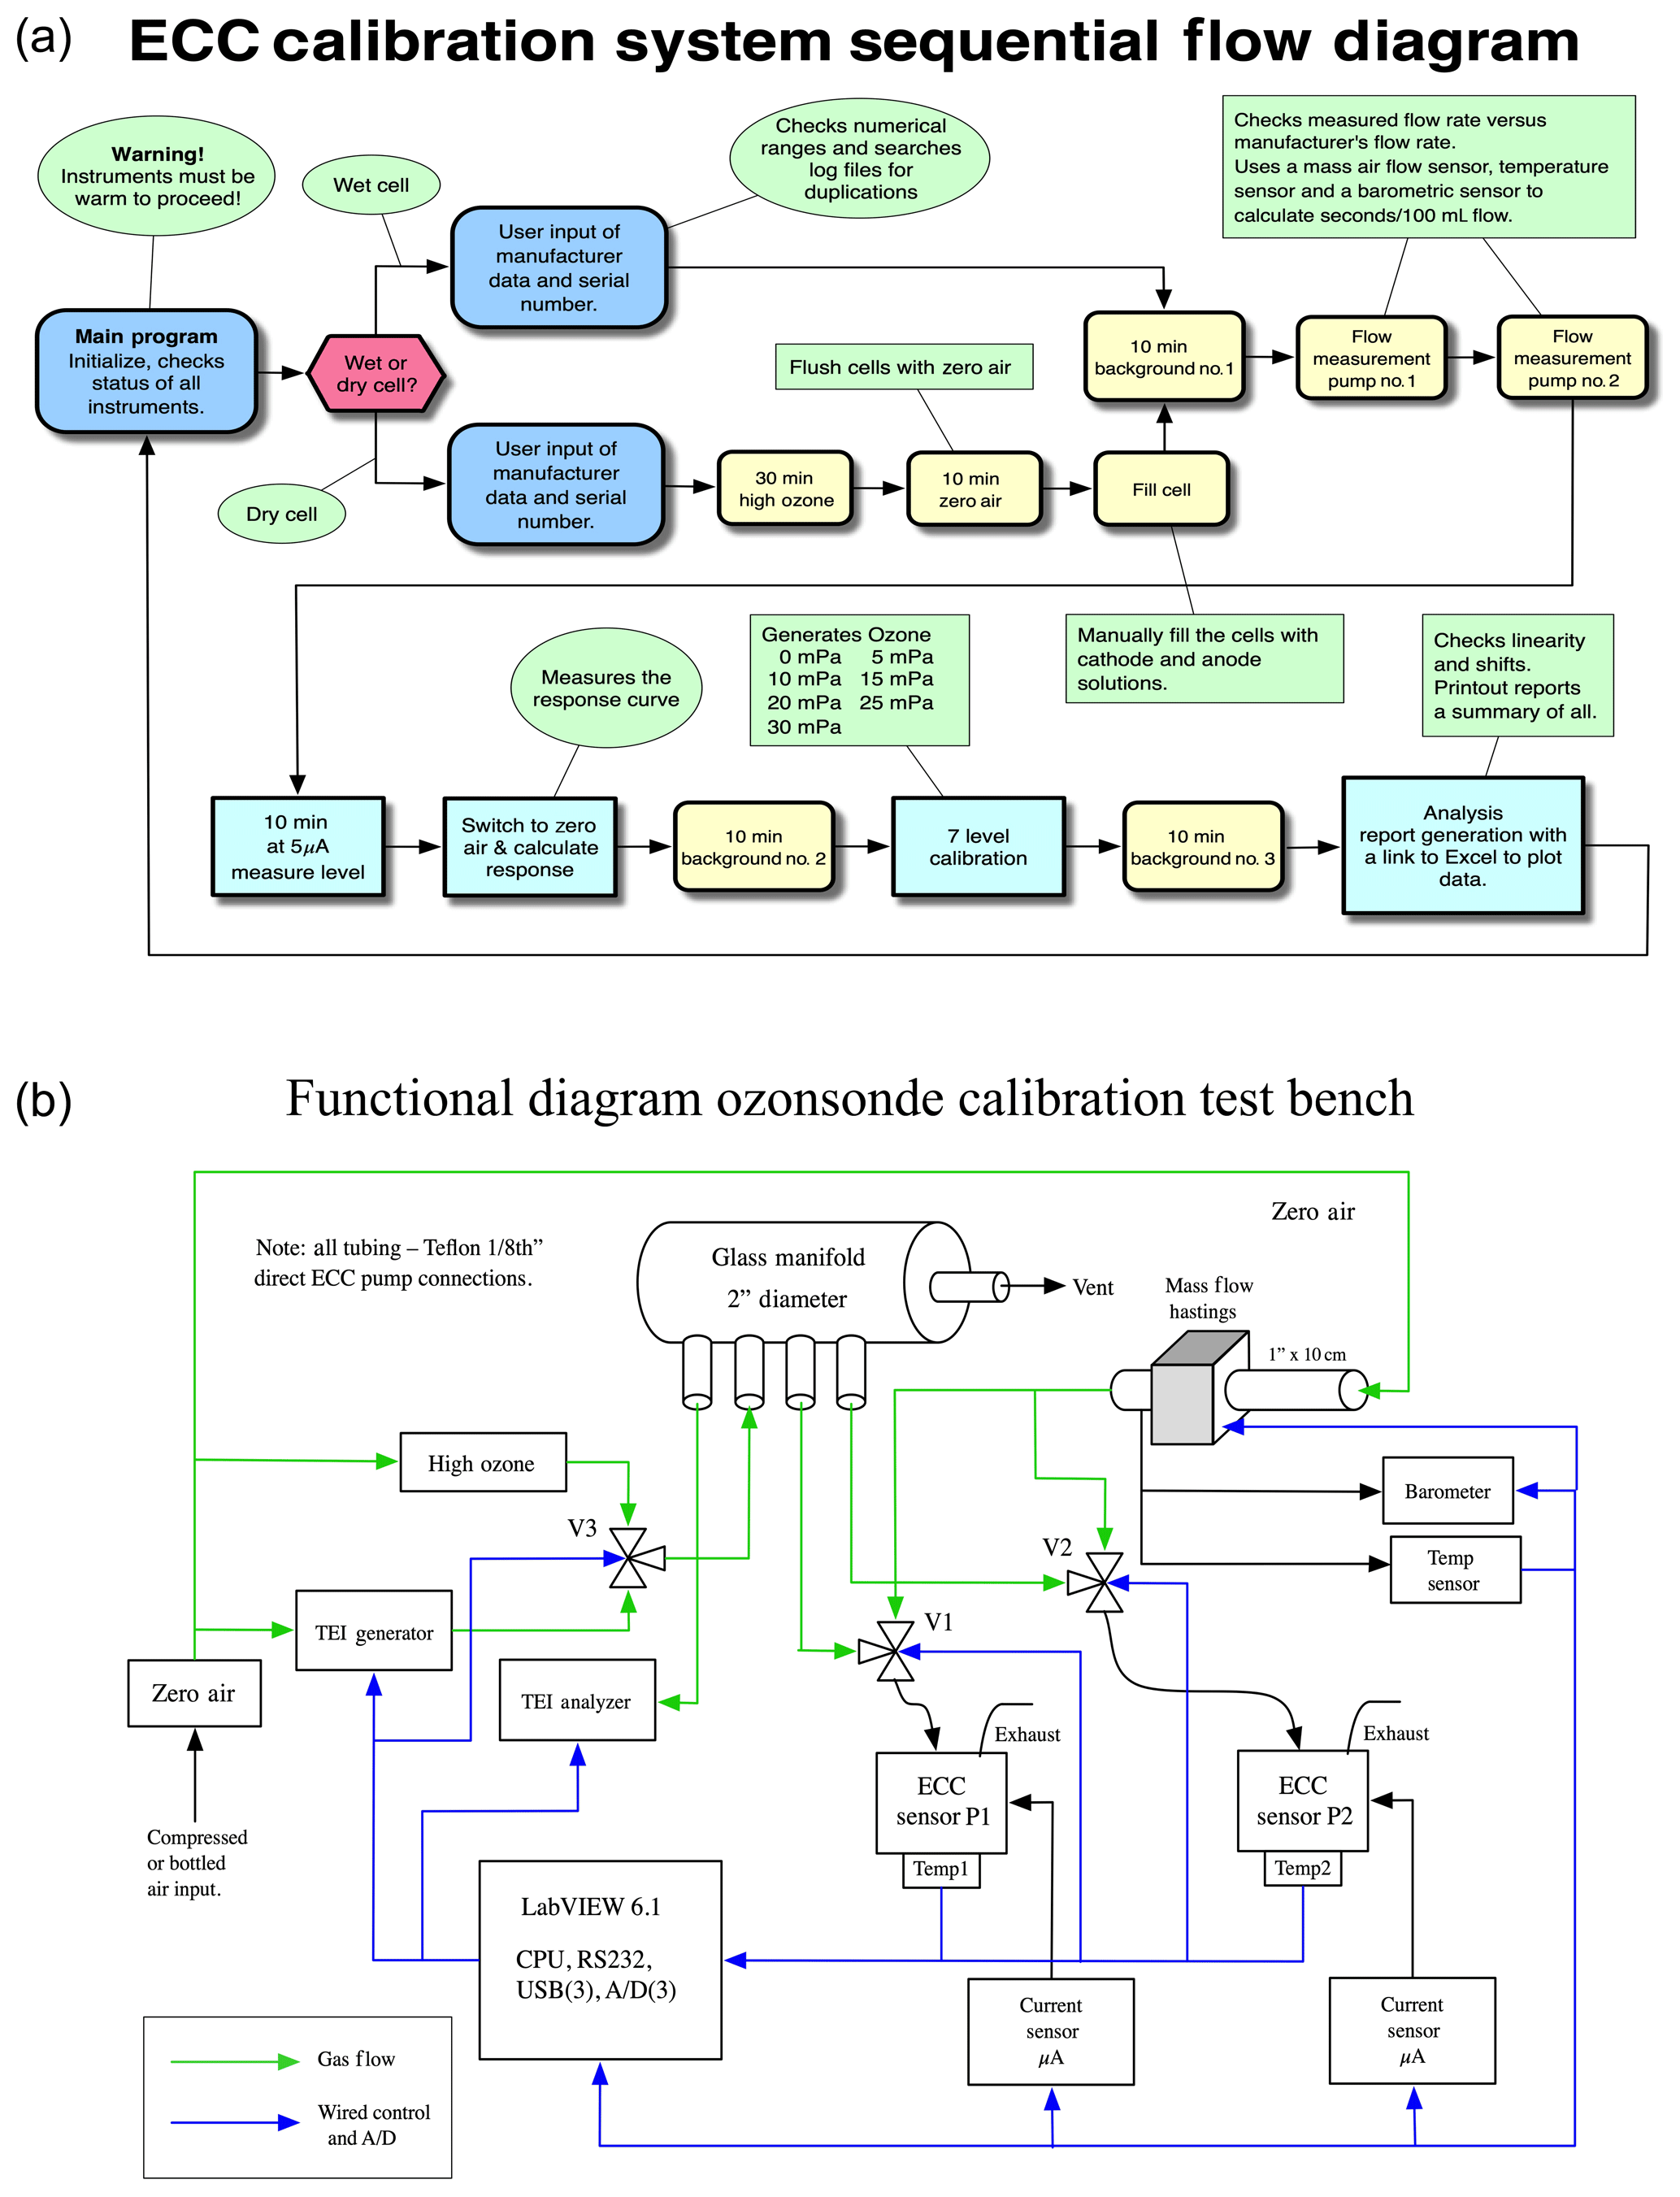
Figure 2Digital calibration bench diagrams: (a) sequential steps and (b) functional steps (source: unpublished technical note, Tony Baldwin, personal communication, 2008).
Figure 2, from an unpublished technical note (Tony Baldwin, personal communication, 2008), illustrates the steps necessary to achieve a consistent calibration. By following the sequential flow diagram shown in Fig. 2a, the operator can better understand the sequence of tests. Each shape in the diagram is associated with a graphical window displayed on the monitor, as are notices that pop up to instruct or direct the operator. The computer-controlled digital bench follows the ECC preparation procedure in place at NASA Wallops Island at the time of the system's fabrication. Each ECC is recognized by its manufacturing date and serial number and includes the manufacturer's test data. Changes to the steps are possible anytime through software reprogramming. The preparation sequence begins by verifying whether ECCs are new or were previously conditioned. A different path is followed for either condition. New cells are flushed with high ozone prior to manually adding KI solution. Cells previously having had solution added skip over the high-ozone step to determine the first background current. Following the first background check, the remaining steps are completed. Other measurements accumulated with the digital bench include motor voltage, motor current, pump temperature, and linear calibration at seven levels (0.0–30.0 mPa). Program steps are displayed on the computer monitor with real-time information. All data are archived and backup files maintained.
Figure 2b illustrates the functional diagram detailing the essential operation of the digital calibration bench. Software control is shown in blue and airflow in green. Laboratory zero-grade dry air or desiccated compressed air is introduced into the TEI ozone generator where a controlled amount of ozone is produced. The ozone flows simultaneously to the ECCs and to the TEI model 49C ozone analyzer. The analyzer contains the UV photometer that provides the reference partial pressure.
The digital bench reads the airflow from a Hastings mass flowmeter permitting a precise flow rate to be determined. The mass flow is then converted to volume flow by the conventional conversion formula. The volume flow rate measurement was found to be comparable to the flow rate determined with the volumetric bubble flowmeter. The digital calibration bench uses the Hastings mass-flowmeter model ENALU with a HS500m transducer with a maximum mass-flow range of 500 scc min−1 (scc is standard cubic centimeters). In contrast, the manual method uses a stop watch to estimate when 100 mL of air has flowed into a chamber. An experienced operator, using a volumetric bubble flowmeter, is able to measure the time to less than 1 s. Tarasick et al. (2016) point out that the operator uncertainty when reading the bubble flowmeter is about 0.1 %–0.3 %. Further, the manual method requires that the effect of moisture from the bubble flowmeter's soap solution be accounted for; flow rates determined with the digital calibration bench do not require a correction for moisture. Unfortunately, the calibration bench cannot determine the pump efficiency correction (PEC); this is taken into account differently. For a number of years, the ECC's PEC was physically measured at Wallops Island using a specially adapted pressure chamber (Torres, 1981). This system is no longer available. However, from its many years of use, an extensive number of measurements are available. A sample of 200 pressure chamber measurements were averaged to obtain a unique PEC that was adopted for use at Wallops Island.
After eliminating deficiencies and improving functionality, the automated system was tested while obtaining research data, primarily comparisons between different KI solution concentrations. Calibration from 0.0 to 30.0 mPa generally exceeds the nominal range of atmospheric ozone partial pressure. Calibration steps are made in 5.0 mPa increments, but larger or smaller increments are possible with minimal software reprogramming. Differences between ECC and reference measurements, if seriously large, provide an alarm to possibly reject the ECC, or after further study the differences between the ECC and reference calibration might be considered as a possible adjustment factor that would be applied to observational data.
2.2 Operational procedure
ECC preparation procedures at Wallops Island are carried out 5 to 7 d prior to preparing the ECC for flight. The pump, anode and cathode cells, and Teflon tubing are flushed with high amounts of ozone to passivate their surfaces and is followed by flushing with zero-grade dry air followed by filling of the cells. The cells are stored until ready to be used.
Operation of the automated system is simple, requiring only a few actions by the operator that include obtaining the first background current, airflow, 5 µA or high-ozone (17 mPa) test, response test, second background current, linear calibration between 0.0 and 30.0 mPa, and the final background current. As indicated in Fig. 2a, two cells can be conditioned nearly simultaneously; i.e., the program alternates measurements between ECCs.
The operator must first determine whether the cell being conditioned had already been filled with KI or was never filled. Whatever the status of the cell (wet or dry) the operator enters the identification information before proceeding. When a new or a dry cell is to be processed, the digital calibration bench initiates high-ozone flushing. The program alerts the operator to turn on the high-ozone lamp after which V3 of Fig. 2b is switched to high ozone. The unit checks that ozone is flowing, and after 30 min the program switches to zero air for 10 min and V3 switches back to the ozone generator. When completed, the operator is prompted by an instructional message on the monitor screen to fill the anode and cathode cells with the proper concentrations of potassium iodide (KI) solution; i.e., the cathode cell is filled first with 3 mL of 1.0 % KI solution followed, after a 10 min delay, by filling the anode cell with a saturated KI solution. The cells are stored until ready for further conditioning and calibration before being used to make an observation. Considering that the ECC had been filled earlier with solution, the digital bench instruction bypasses the high-ozone flushing. Ozonesonde identification is entered, as above. The operator, after fresh KI has been added to the cell, is prompted on the monitor screen to begin the first background current measurement. In either case, whether a dry cell for which flushing is complete or a wet cell ready for calibration, the procedure starts with clicking the OK button displayed on the monitor screen. After 10 min of dry air the background current is recorded. The background current record contains the following information: date, time in 1–2 s intervals, motor current, supplied voltage, pump temperature, and cell current. As the measurement is being made identical information is displayed graphically on the monitor. Following the background test all further steps are automatic.
Continuing to follow the steps outlined in Fig. 2b, the measurement of the airflow is accomplished on one ECC pump at a time by switching V1, shown in Fig. 2b, to the mass flowmeter, and at the same time V2 is switched to the glass manifold (ozone generator). When completed, V1 is switched back to the glass manifold and V2 is switched to the flowmeter and the flow rate of the second cell is carried out. The airflow is output in seconds per hundred milliliters. The information stored includes date, time in seconds at intervals of 7–8 s, mass flowmeter temperature, atmospheric pressure, flow rate, and supply voltage.
Measuring the response of the ECC to ozone decay requires setting the ozone generator to produce 17.0 mPa ozone partial pressure (approximately 5 uA). As ozone is produced the ozone level increases until the set level is reached. The elapsed time to reach this level is noted. The 17.0 mPa of ozone is the reference level used to initiate the response test. After recording 17.0 mPa of ozone for 10 min, the ECC response check begins. To measure the response, the cells would have to be switched to zero air more quickly than the cell responds. This is accomplished by switching both cells (assuming two cells are being calibrated) to the mass flowmeter, the source of zero air. This is more efficient than setting the generator to zero and waiting for the manifold and residual ozone in the system to reach the zero level. Thus, V1 and V2 of Fig. 2b are switched to the mass flowmeter for immediate zero air and the program triggers a timer. The decreasing ozone is measured and recorded at five points used to reflect the cell response. As the ozone decays, measurements at 3–4 s intervals provide a detailed record of the response while also being displayed in real time on the monitor. From the detailed record the program selects five points (1, 2, 3, 5, and 10 min) successively that are used to calculate the response of ozone change that should be 80 %–90 % lower than the reference of 17.0 mPa. V1 and V2 are switched back to the ozone generator and the next 10 min background current measurement begins. The response record contains the following: date, time in seconds, motor current, supply voltage, temperature, mass flow, cell current, and atmospheric pressure. Data are displayed on the monitor in real time.
The ECCs have been conditioned and are ready for the linear calibration. The 0.0 to 30.0 mPa calibration is performed. Step changes begin with 0.0 mPa, followed by measurements at 5.0, 10.0, 15.0, 20.0, 25.0, and 30.0 mPa. Each step requires approximately 2–3 min to complete, allowing time for the cell to respond to each ozone step change. The linear calibration includes the reference measurement made simultaneously with the ECC measurement. After the upward calibration reaches the 30.0 mPa level, the calibration continues downward, to 0.0 mPa. The measurements are displayed on the monitor for the operator's use and also sent to an Excel file. Generally, the downward calibration experiences small differences from the upward calibration. The available test data reveal that the downward calibrations are always higher than the upward calibrations. It is conjectured that this occurs because the ECC sensor retains the memory of experiencing the high ozone concentration measured at the 30.0 mPa calibration value. Between 5.0 and 25.0 mPa the downward calibrations of the 1.0 % KI solution are 0.8 to 1.0 mPa higher than the upward calibration. The 0.5 % solution downward calibration varies between 0.5 and 0.9 mPa for the same partial pressures. Only the upward calibrations are used. Following the linear calibration, the final background current is obtained. This requires 10 min of zero-grade dry air before making the measurement. The data are recorded in a summary file that contains the supply voltage, motor current, flow rate, pump temperature, response, and background currents.
Repetitive comparison operations can be carried out with the digital calibration bench as often as necessary. This could result in a potential cost saving as there would be no need to expend radiosondes, ECCs, and balloons. The testing with the digital calibration bench is limited to the ranges of pressures and temperatures at sea level and would be an imprecise representation in the upper altitudes.
3.1 Digital calibration bench (general)
Quasi-simultaneous testing of two ECCs is possible, enabling comparisons of different concentrations of KI solutions. Comparison of 2.0, 1.5, 1.0, and 0.5 % KI concentrations were carried out on the digital bench, demonstrating that agreement with the ozone reference value improved with lower concentrations. In an earlier paper Johnson et al. (2002), using SPC and EN-SCI ECCs, demonstrated that similar changes occurred when testing various solution concentrations that also included varying amounts of buffer. Only the SPC 6A ECCs with concentrations of 1.0 % KI solution and full buffer (1.0 %, 1.0B) and 0.5 % KI solution and one-half buffer (0.5 %, 0.5B) are discussed here.
During the checkout of the digital calibration bench, ECC sondes were calibrated in pairs and included different KI solutions. Tests indicated the pressure and vacuum measurements were nominal; some insignificant variation occurred but was not a cause for concern. Pump temperatures, controlled by the room air temperature, varied by 0.1 to 0.2 ∘C. Motor currents showed some variation, some measured over 100 mA, suggesting a tight fit between the piston and cylinder. For example, one ECC motor current was initially 100 mA, a second measurement a week later showed the reading was 110 mA, and a final reading after running the motor for a short time was 96.5 mA. Flow rates fell within the range of 27 to 31 s per 100 mL comparable to flow rates manually measured with a bubble flowmeter. Background currents were consistent. The lowest background current allowed by the digital bench is 0.0044 µA. The final background currents obtained with the digital bench often were somewhat higher than background currents experienced with manual preparation, generally about 0.04 µA. Although 0.4 µA is relatively small, it is possible the higher background current value results from the ECC's residual memory following exposure to the high ozone concentration during the previous linear calibration step. The final background currents, obtained manually immediately prior to an ECC balloon release, were in the range between 0.01 and 0.02 µA. Finally, the response of all the cells was good, falling within the required 80 % decrease within less than 1 min. Graphically checking a small sample of high-resolution responses found some variation as the ozone decayed.
3.2 Calibration and potassium iodide (KI) solution comparisons
A practical example of the usefulness of the digital calibration bench is its capability to nearly simultaneously obtain measurements from two ECCs, one prepared with (1.0 %, 1.0B) and the second with (0.5 %, 0.5B). The recommended KI solution strength to be used with the SPC 6A ECCs is 1.0 % with full buffer (Smit and ASOPOS PANEL, 2014). Conditioning of the ECCs followed the steps given in Fig. 2. In the free stratosphere, ozone partial pressures usually range from 15.0 to 20.0 mPa. Linear calibrations to 30.0 mPa are obtained, although a lower range may be reprogrammed.
Figure 3 is a graphical example of differences between the reference ozone measurement and the measurements of (1.0 %, 1.0B) and (0.5 %, 0.5B) KI concentrations. A sample of 18 digital bench measurements were averaged to provide a representative set of differences. The close proximity between the curves shown in the figure renders the standard deviation lines too small; they also overlay each other to some extent. The standard deviations have been added to the figure for greater clarity. The variations, although small, indicate greater variability with the (1.0 %, 1.0B) KI solution. Figure 3 suggests that the two concentrations measured nearly identical amounts of ozone between 0.0 and 8.0 mPa. Both curves begin to separate and diverge above 8.0 mPa. The averaged data at 10.0 mPa indicate that (1.0 %, 1.0B) is 0.36 mPa, or 3.6 % higher than the reference, and (0.5 %, 0.5B) is 0.04 mPa, or 0.4 % higher; at 15.0 mPa the difference is 0.67 mPa, or 4.3 %, and 0.17 mPa or 1.1 % higher, respectively; at 20.0 mPa the difference for (1.0 %, 1.0B) is 1.11 mPa, or 5.5 %, and (0.5 %, 0.5B) is 0.48 nb or 2.4 % higher. A check at the 30.0 mPa level indicated (1.0 %, 1.0B) was 6.8 % above the reference and (0.5 %, 0.5B) was 3.2 % above. The ECC with (0.5 %, 0.5B) KI concentration is closer to the reference than (1.0 %, 1.0B) KI. Both ECCs' partial pressure curves have a slope greater than 1 trending toward higher amounts of ozone when compared to the reference value as ozone partial pressure increases. It is clear that the (1.0 %, 1.0B) KI solution increases at a faster rate than the (0.5 %, 0.5B) solution. Johnson et al. (2002) have explained the effect of different KI solution concentrations as well as the side effects from the buffers used. Their study of the standard (1.0 %, 1.0B) solution indicated the ECC can report higher ozone amounts, up to 5 %–7 % under constant ozone conditions, and can also increase the ozone amount to higher values from the buffer reactions. Figure 3 indicates that the 1.0 % KI measurement is further from the reference than the 0.5 % KI. The percentage difference between the two KI concentrations is virtually constant at 3.2 %, or in terms of a ratio between the two solutions 0.968. Referring to the SPC ozonesondes compared during BESOS, Deshler et al. (2017, Fig. 5 and Table 2) indicate nonlinearity between the (0.5 %, 0.5B) and (1.0 %, 1.0B) KI solutions and similar ratio values, 0.970 and 0.960.
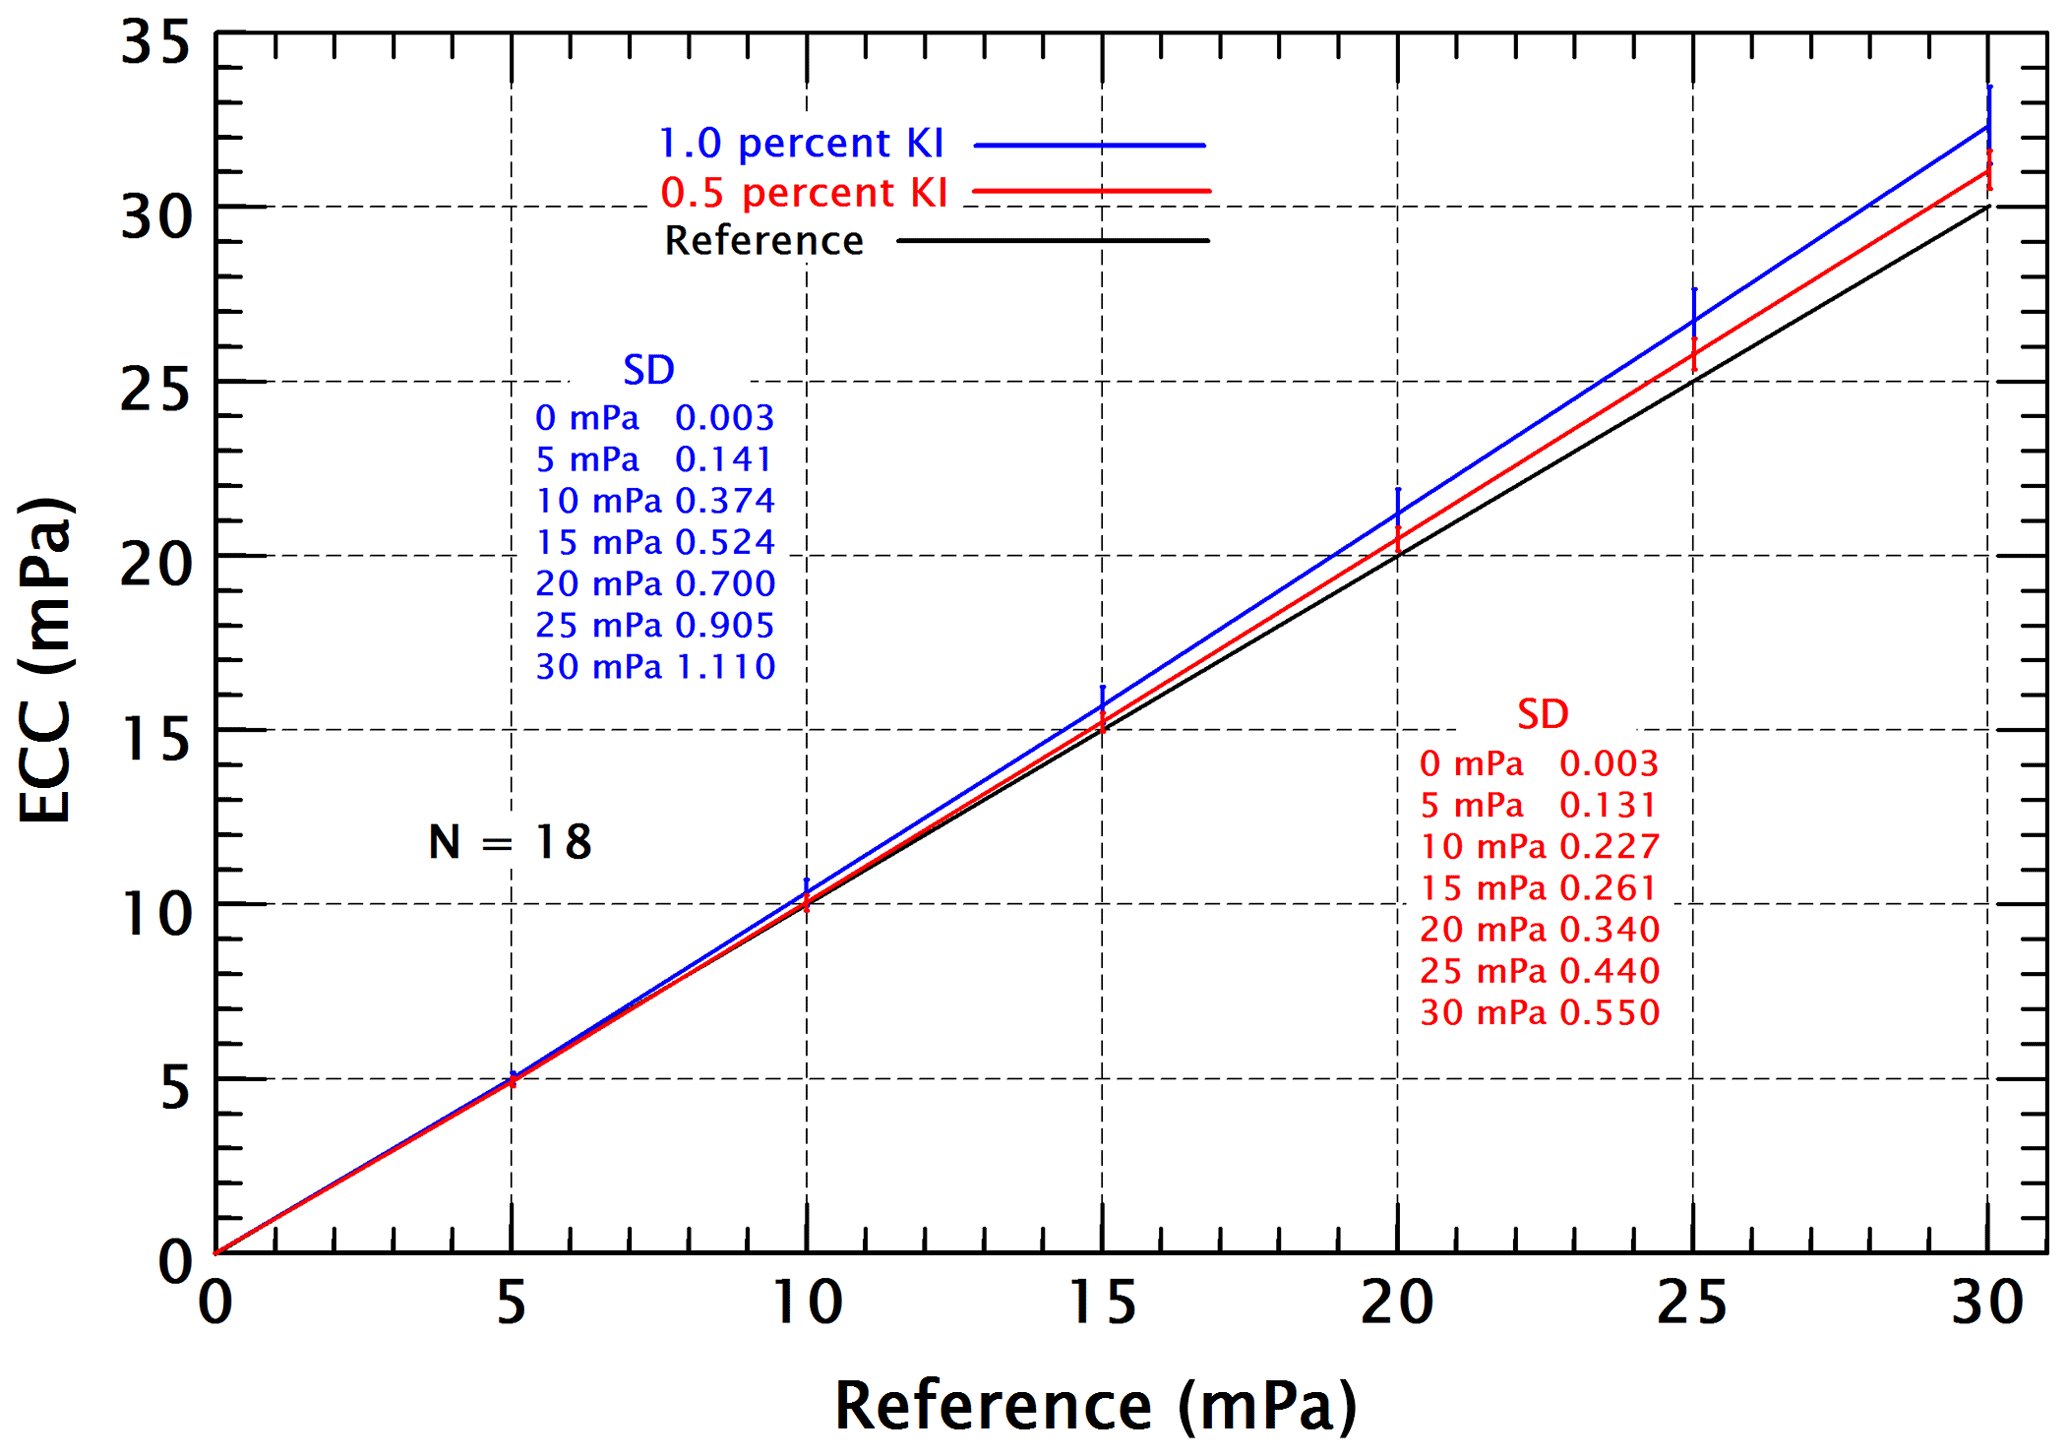
Figure 3Comparison of ECC ozonesondes prepared with (1.0 %, 1.0B) (blue) and (0.5 %, 0.5B) (red) KI solution concentrations. The reference curve is shown in black. Calibrations are made in 5.0 mPa steps from 0.0 to 30.0 mPa.
The digital calibration bench turned out to be an ideal tool to obtain repeated ECC calibrations. The digital bench can calibrate two ECCs nearly simultaneously, reducing the need to expend costly dual-ECC balloons. A negative aspect, possibly, is that calibration at sea level cannot provide knowledge of ECC behavior under upper-altitude conditions. Eleven ECC pairs were calibrated over a period of 3 weeks. Two ECCs were prepared with (1.0 %, 1.0B) and (0.5 %, 0.5B) KI solutions. A number of time-separated calibrations were conducted with the expectation that the resulting calibrations would be repeatable week to week. The cells were flushed and fresh KI solutions were used with each weekly test. Calibration over the full range, 0.0–30.0 mPa, was carried out. Changes that might be due to improper preparation and conditioning procedures were not considered since, by definition, the digital bench is consistent in how ECCs are prepared. Consideration must also be given to the fact that the ECC sensor has a memory that may have the effect of inhibiting repeatability. The individual weekly calibrations showed varying results. Some calibrations showed an increase each week while other calibrations did not. An average of the data showed small increases week to week but these were too small to be significant. In essence no particular pattern was evident, suggesting that calibrations on a week-to-week schedule would not be repeatable.
To bring the ECC measurements into correspondence with the reference suggests that downward adjustment should be applied to each curve. When a large sample of similar digital bench measurements are obtained, it should be possible to design a table of adjustments relative to ozone partial pressure that could be used to adjust ozonesonde measurements. However, since the calibrations are made at sea level, such an adjustment table would not be able to account for the influence of upper atmospheric pressure and temperature. Nevertheless, any adjustment, seemingly, would be in the right direction and would aid in obtaining more representative ozone values.
Although digital bench calibration comparisons are instructive, important comparisons have been made between ECCs and reference instruments using other methods. ECC measurement comparability has been quantified through in situ dual-instrument comparisons (Kerr et al., 1994; Stubi et al., 2008; Witte et al., 2019), laboratory tests at the World Ozone Calibration facility at Jülich, Germany (Smit et al., 2004, 2007, 2014), and occasional large-balloon tests such as BOIC (Hilsenrath et al., 1986), STOIC (Kohmyr et al., 1995), and BESOS (Deshler et al., 2008). BESOS provided important performance information about the SPC 6A ECC and the EN-SCI ozonesondes. However, these complicated large-balloon experiments that seem to occur every 10 years are expensive. The environmental chamber used in the Jülich tests (Smit et al., 2007) covers a full pressure range but is also expensive to use. The purpose here is to show a calibration method that is simple to use and provides calibrations that include useful reference values and is complementary to other methods, such as employed in the Jülich Ozone Sonde Intercomparison Experiment (Smit et al., 2004, 2007).
In the 1998–2004 period the Wallops ozone station released a number of dual-ECC balloons, with 12 pairs successfully providing measurements to 30 km and higher. The ECCs were attached about 35 m below the balloon, and each ECC separated a distance of 2 m. Each pair was composed of an ECC with (1.0 %, 1.0B) and (0.5 %, 0.5B) KI solutions. The profiles were averaged and are displayed in Fig. 4. It can be noted in the figure that the mean (0.5 %, 0.5B) solution reveals less ozone being measured than that of the (1.0 %, 1.0B) solution. Near the 65–70 hPa level the (0.5 %, 0.5B) ECC begins to report increasingly less ozone than the (1.0 %, 1.0B) ECC as the partial pressure increases. A similar feature was noted in Fig. 3 where the separation of the ECCs with different concentrations occurs with increasing partial pressure. Figure 4 shows the maximum ozone partial pressure level was about 14.0 mPa, near 22 hPa, where the (0.5 %, 0.5B) KI solution measured approximately 1.0 mPa, or 7 % less ozone than the ECC with the (1.0 %, 1.0B) KI concentration. This difference is approximately 4 % higher than the result given by the digital calibration bench results of Fig. 3, where, at 15.0 mPa, the difference between the (1.0 %, 1.0B) KI and (0.5 %, 0.5B) KI is 3.2 %. Observations obtained with the Wallops Island Dobson spectrophotometer are available since 1963 and have provided meaningful research data (Harris et al., 2003). Dobson observations also permit comparisons of total ozone with each of the ECC profiles. The average profiles shown in Fig. 4 were in excellent agreement with (0.5 %, 0.5B), e.g., the total ozone difference between the Dobson (309.5 DU) and (1.0 %, 1.0B) (330.4 DU) is 20.9 DU; between the Dobson and (0.5 %, 0.5B) (308.3 DU) the difference is 1.2 DU.
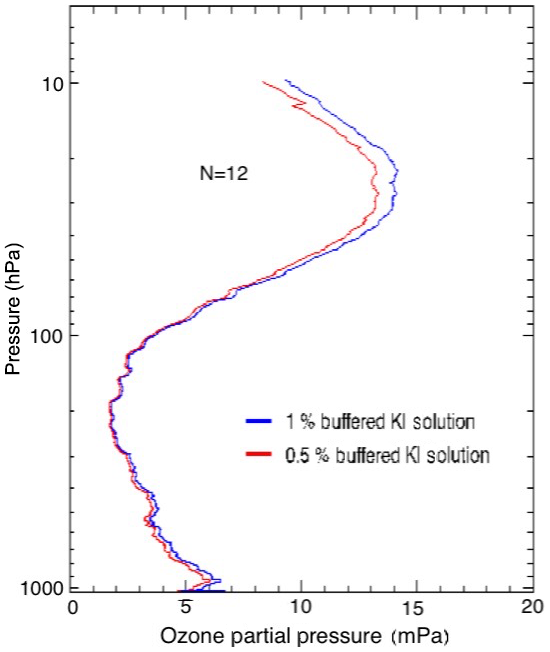
Figure 4Average ozone profiles from 12 pairs of SPC 6A ECC ozonesondes indicating at the 22 hPa pressure level that the (0.5 %, 0.5B) ECCs measured 0.7–0.8 mPa less ozone, approximately 7 % less, than the (1.0 %, 1.0B) ECCs.
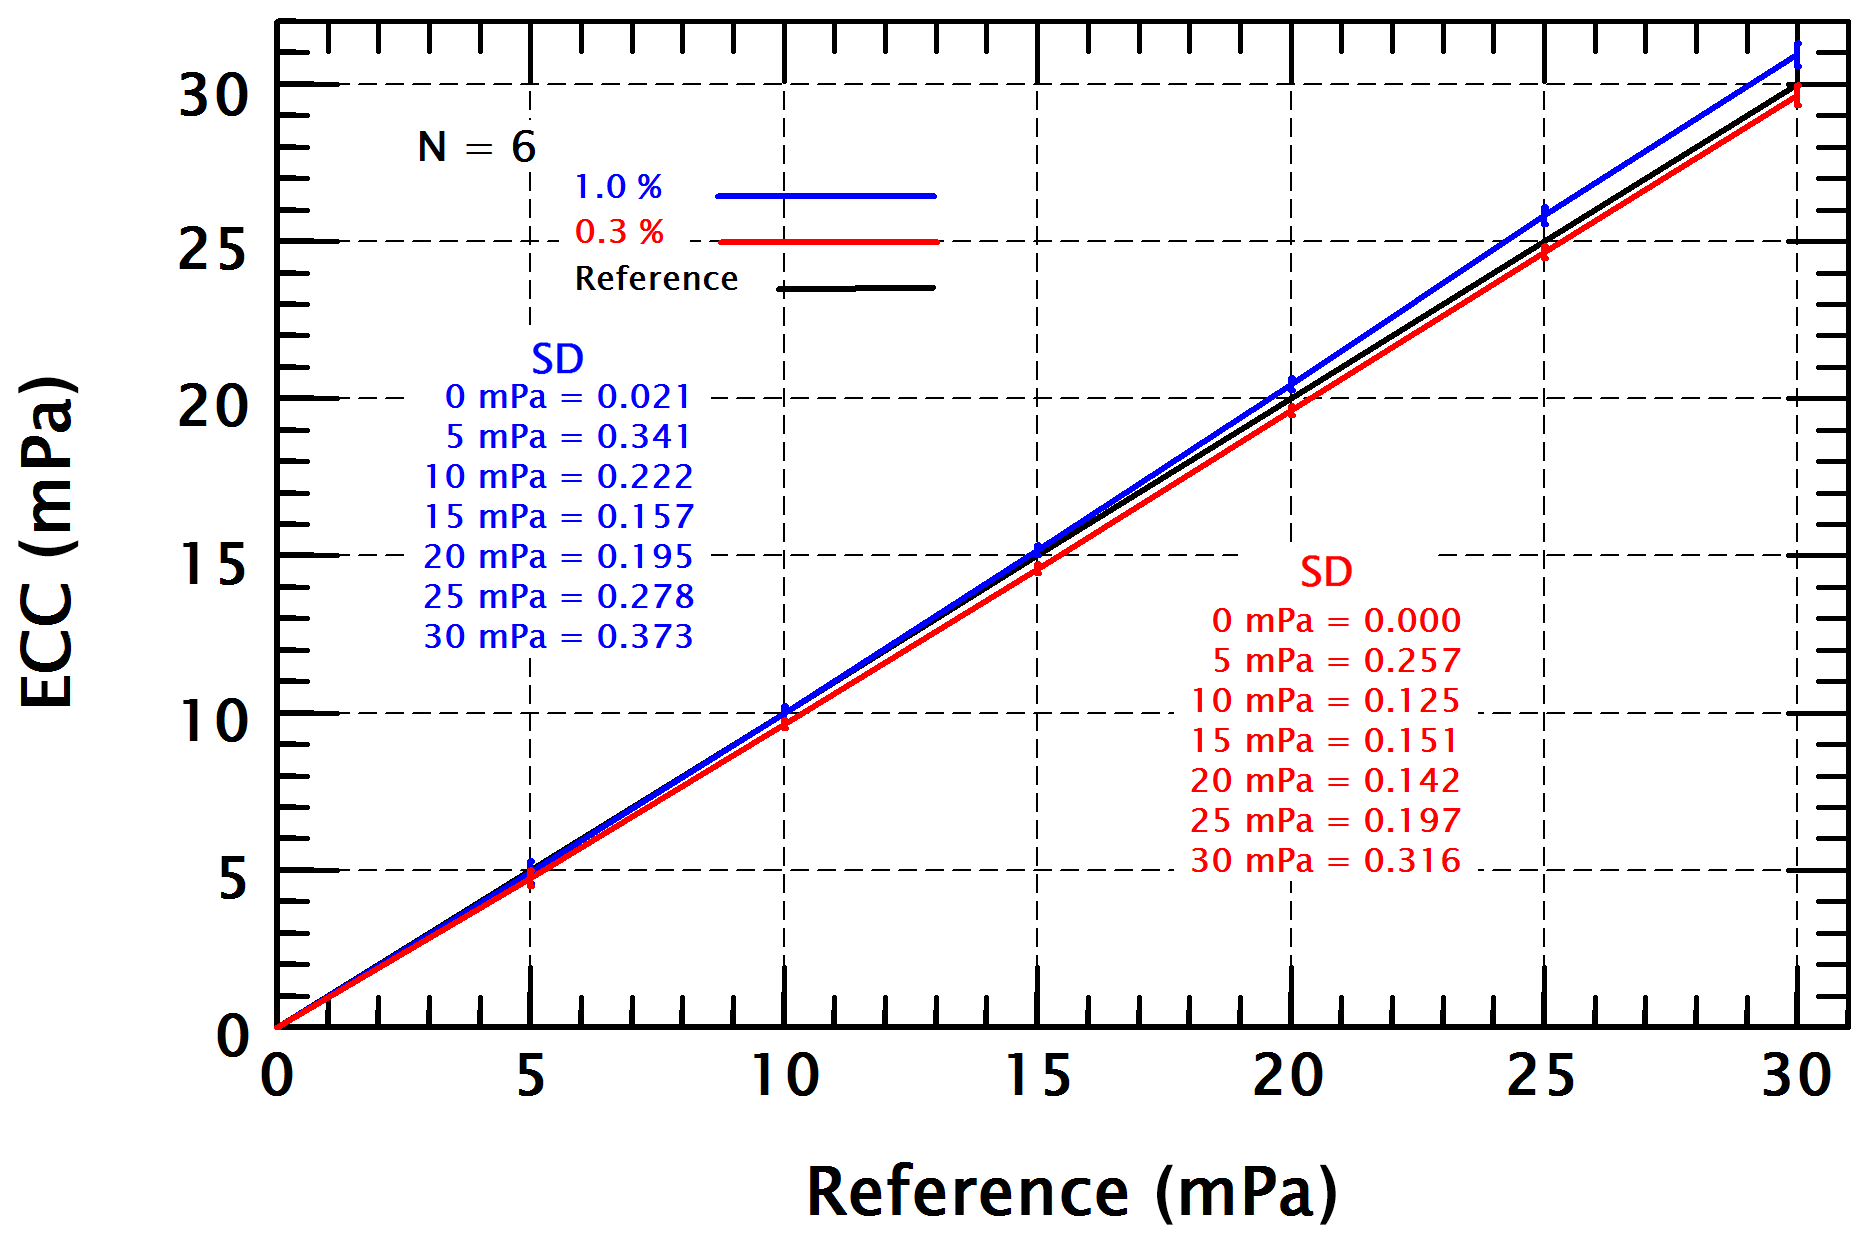
Figure 5Digital calibration bench results between the (1.0 %, 1.0B) solution, blue curve, and the (0.3 %, 0.3B) solution, red curve; the reference curve is shown in black.
Given that the digital bench tests revealed the (0.5 %, 0.5B) KI solution is in closer agreement with the reference measurement than the (1.0 %, 1.0B) solution, a KI solution with a weaker concentration may, possibly, give even better agreement. A small number of dual-ECC tests were carried out with a solution of 0.3 % with one-third buffer (03 %, 0.3B). Six sets of ECCs were prepared for calibration. Each dual-ECC test consisted of one ECC prepared with (1.0 %, 1.0B) KI solution and one with (0.3 %, 0.3B) KI solution. The digital bench comparison result disclosed that the (1.0 %, 1.0B) result replicated the earlier results discussed above. As assumed, the lower concentration was nearly equal to, or slightly less than, the reference. Average values and standard deviations derived from the six tests are shown in Fig. 5. Although the 0.3 % solution might appear to be a better choice, additional tests are necessary.
The concept of an automated method with which to preflight condition and calibrate ECC ozonesondes was originally considered by MeteoSwiss scientists over 20 years ago. Drawing on their expertise, a facility designated as the digital calibration bench was fabricated at NASA Wallops Flight Facility between 2005 and 2008. The digital bench was put to use immediately to study ECC performance, conduct comparisons of different KI concentrations, enable ECC repeatability evaluation, and calibrate the ECC over a range of partial pressures, including associated reference values. Tests conducted with the digital bench were performed under identical environmental conditions. The digital bench eliminates the expense and time associated with carrying out similar tests in the atmosphere.
Early use of the digital bench was to calibrate ECCs, prepared with (1.0 %, 1.0B) KI solution over a range of partial pressures from 0.0 mPa to 30.0 mPa. Comparison between ECCs with (0.5 %, 0.5B) and (1.0 %, 1.0B) KI solution and simultaneously obtained reference values revealed the two KI solution strengths were measuring more ozone than the reference. There was an increasing difference between the ECCs and the reference as the partial pressure increased. For example, the ECC measurements slope upward to increasingly larger differences from the reference ozone measurements, i.e., increasing from 4.3 % higher partial pressure at 15.0 mPa (Fig. 3) to about 7 % higher at 30.0 mPa.
Results from the digital bench also corroborate differences found between SPC 6A ECCs flown on dual-instrument flights at Wallops Island. The difference between ozonesondes at a pressure of 22 hPa showed the (0.5 %, 0.5B) ECC to be about 1.0 mPa lower than the (1.0 %, 1.0B) ECC. Comparison between ECC profiles of both (1.0 %, 1.0B) and (0.5 %, 0.5B) KI solutions reveals very good agreement between Wallops Island Dobson observations and the (0.5 %, 0.5B) mean ECC profile.
The digital calibration bench provides a capability to apply a variety of test functions whereby the valuable information gathered helps to better understand the ECC instrument. Evaluating SPC ECC performance using an automated method diminishes the requirement for expensive comparison flights. The tests performed, i.e., KI solution differences, calibrations over a time period, and dual-instrumented balloon flights, were consistent, giving similar results. The tests described in this paper are simply examples of the utility of the digital bench. Furthermore, the digital calibration bench preparation facility potentially could contribute to an understanding of separating ECC measurement variability from atmospheric variability. Thus, the automated conditioning and calibration system provides valuable information and as a useful tool should continue to be a valuable aid.
Data are available at: https://www.uairp.wff.nasa.gov/uairp-home-page/ (Schmidlin and Hoegger, 2020). Go to “UAIRP Instrument Data” and then click on AMT-2019-168 ECC Calibrations.
The first author acquired and prepared the data for processing, and the second author was instrumental in certifying the digital calibration bench was working properly. Both contributed equally to manuscript preparation.
The authors declare that they have no conflict of interest.
We acknowledge the successful use of the digital calibration bench by Gilbert Levrat (retired) of the MeteoSwiss site Payerne, Switzerland, and appreciate his foresight in designing the original bench and its simplicity. We are indebted to Tony Baldwin (retired) of NASA Wallops Flight Facility for his electronic skill and programming expertise and to E. Thomas Northam for assistance preparing the figures. We also appreciate the insightful suggestions given by the referees, who were instrumental in helping us make the paper better.
This paper was edited by Roeland Van Malderen and reviewed by two anonymous referees.
Barnes, R. A., Bandy, A. R., and Torres, A. L.: Electrochemical Concentration Cell ozonesonde accuracy and precision, J. Geophys. Res., 90, 7881–7887, 1985.
Deshler, T., Mercer, J. L., Smit, H. G. J., Stubi, R., Levrat, G., Johnson, B. J., Oltmans, S. J., Kivi, R., Thompson, A. M., Witte, J., Davies, J., Schmidlin, F. J., Brothers, G., and Sasaki, T.: Atmospheric comparison of electrochemical cell ozonesondes from different manufacturers, and with different cathode solution strengths: The Balloon Experiment on Standards for Ozonesondes, J. Geophys. Res., 113, D04307, https://doi.org/10.1029/2007JD008975, 2008.
Deshler, T., Stübi, R., Schmidlin, F. J., Mercer, J. L., Smit, H. G. J., Johnson, B. J., Kivi, R., and Nardi, B.: Methods to homogenize electrochemical concentration cell (ECC) ozonesonde measurements across changes in sensing solution concentration or ozonesonde manufacturer, Atmos. Meas. Tech., 10, 2021–2043, https://doi.org/10.5194/amt-10-2021-2017, 2017.
Fishman, J., Wozniak, A. E., and Creilson, J. K.: Global distribution of tropospheric ozone from satellite measurements using the empirically corrected tropospheric ozone residual technique: Identification of the regional aspects of air pollution, Atmos. Chem. Phys., 3, 893–907, https://doi.org/10.5194/acp-3-893-2003, 2003.
Harris, J. M., Oltmans, S. J., Bodeker, G. E., Stolarski, R., Evans, R. D., and Quincy, D. M.: Long-term variations in total ozone derived from Dobson and satellite data, Atmos. Environ., 37, 3167–3175, https://doi.org/10.1016/S1352-2310(03)00347-9, 2003.
Hilsenrath, E. W., Attmannspacher, W., Bass, A., Evens, W., Hagemeyer, R., Barnes, R. A., Komhyr, W., Maursberger, K., Mentall, J., Proffitt, M., Robbins, D., Taylor, S., Torres, A., and Weinstock, E.: Results from the Balloon Ozone Intercomparison Campaign (BOIC), J. Geophys. Res., 91, 13137–13152, 1986.
Holland, A. C., Barnes, R. A., and Lee, H. S.: Improved rocket ozonesonde (ROCOZ-A) 1: Demonstration of Precision, Appl. Optics, 24, 3286–3295, 1985.
Johnson, B. J., Oltmans, S. J., and Vömel, H.: Electrochemical Concentration Cell (ECC) ozonesonde pump efficiency measurements and tests on the sensitivity to ozone of buffered and unbuffered ECC sensor cathode solution, J. Geophys. Res., 107, 4393, https://doi.org/10.1029/2001JD000557, 2002.
Kerr, J. B., Fast, H., McElroy, C. T., Oltmans, S. J., Lathrop, J. A., Kyro, E., Paukkunen, A., Claude, H., Kohler, U., Sreedharan, C. R., Takao, T., and Tsukagoshi, Y.: The 1991 WMO international ozonesonde intercomparison ar Vanscoy, Canada, Atmos. Ocean, 32, 685–716, https://doi.org/10.1080/07055900.1994.9649518, 1994.
Komhyr, W. D.: Electrochemical concentration cells for gas analysis, Ann. Geophys., 25, 203–210, 1969.
Komhyr, W. D., Barnes, R. A., Brothers, G. B., Lathrop, L. A., and Opperman, D. P.: Electrochemical Concentration Cell ozonesonde performance evaluation during STOIC,1989, J. Geophys. Res., 100, 9231–9244, 1995.
Krueger, A. J.: The mean ozone distribution from several series of rocket soundings to 52 km at latitudes 58∘ S to 64∘ N, PAGEOPH, 106, 1272–1280, https://doi.org/10.1007/BF00881079, 1973.
Schmidlin, F. J. and Hoegger, B. A.: UAIRP Instrument Data, available at: https://www.uairp.wff.nasa.gov/uairp-home-page/, last access: March 2020.
Sen, B., Sheldon, W. R., and Benbrook, J. R.: Ultraviolet-absorption photometer for measurement of ozone on a rocket-boosted payload, Appl. Optics, 35, 6010–6014, 1996.
Smit, H. G. J. and ASOPOS panel: Quality assurance and quality control for ozonesonde measurements in GAW, WMO Global Atmosphere Watch report series, No. 121, 100 pp., World Meteorological Organization, GAW Report No. 201, 100 pp., Geneva, available at: https://library.wmo.int/pmb_ged/gaw_201_en.pdf, 2014.
Smit, H. G. J. and Sträter, W.: JOSIE2000, Jülich Ozone Sonde Intercomparison Experiment: The 2000 WMO international intercomparison of operating procedures for ECC ozone sondes at the environmental simulator facility at Jülich, WMO Global Atmospheric Watch, Report No. 158 (WMO TD No. 1225), 2004.
Smit, H. G. J., Straeter, W., Johnson, B., Oltmans, S., Davies, J., Tarasick, D. W., Hoegger, B., Stubi, R., Schmidlin, F. J., Northam, E. T., Thompson, A., Witte, J., Boyd, I., and Posny, F.: Assessment of the performance of ECC-ozonesondes under quasi-flight conditions in the environmental simulation chamber: Insights from the Juelich Ozone Sonde Intercomparison Experiment (JOSIE), J. Geophys Res., 112, D19306, https://doi.org/10.1029/2006JD007308, 2007.
Sterling, C. W., Johnson, B. J., Oltmans, S. J., Smit, H. G. J., Jordan, A. F., Cullis, P. D., Hall, E. G., Thompson, A. M., and Witte, J. C.: Homogenizing and estimating the uncertainty in NOAA's long-term vertical ozone profile records measured with the electrochemical concentration cell ozonesonde, Atmos. Meas. Tech., 11, 3661–3687, https://doi.org/10.5194/amt-11-3661-2018, 2018.
Stubi, R. G., Levrat, G., Hoegger, B., Viatte, P., Staehelin, J., and Schmidlin, F. J.: In-flight comparison of Brewer-Mast and electrochemical concentration cell ozonesondes, J. Geophys. Res., 113, D13302, https://doi.org/10.1029/2007JD009091, 2008.
Thornton, D. C. and Niazy, N.: Sources of background current in the ECC ozonesonde: Implication for total ozone measurements, J. Geophys. Res., 87, 8943–8950, 1982.
Torres, A. L.: ECC ozonesonde performance at high altitudes: pump efficiency, NASA Technical Memorandum 73290, 10 pp., 1981.
Witte, J. C., Thompson, A. M., Schmidlin, F. J., Northam, E. T., Wolff, K. R., and Brothers, G. B.: The NASA Wallops Flight Facility digital ozonesonde record: reprocessing, uncertainties, and dual launches, J. Geophys. Res., 124, 3565–3582, https://doi.org/10.1029/2018JD030098, 2019.