the Creative Commons Attribution 4.0 License.
the Creative Commons Attribution 4.0 License.
 | 29 Apr 2020
Validation of acetonitrile (CH3CN) measurements in the stratosphere and lower mesosphere from the SMILES instrument on the International Space Station
Tamaki Fujinawa
Tomohiro O. Sato
Takayoshi Yamada
Seidai Nara
Yuki Uchiyama
Kodai Takahashi
Naohiro Yoshida
Yasuko Kasai
Acetonitrile (CH3CN) is a volatile organic compound (VOC) and a potential tracer of biomass burning. We evaluated the capability of using observations derived from the Superconducting Submillimeter-Wave Limb-Emission Sounder (SMILES) on the International Space Station (ISS) to measure CH3CN profiles. The error in a CH3CN vertical profile from the Level-2 research (L2r) product version 3.0.0 was estimated by theoretical error analysis and also compared with other instrumental measurements. We estimated the systematic and random errors to be ∼5.8 ppt (7.8 %) and 25 ppt (60 %), respectively, for a single observation at 15.7 hPa in the tropics, where the CH3CN measurements are enhanced. The major source of systematic error was the pressure-broadening coefficient, and its contribution to the total systematic error was approximately 60 % in the middle stratosphere (15.7–4.8 hPa). The random error decreased to less than 40 % after averaging 10 profiles in the pressure range of 28.8–1.6 hPa. The total error due to uncertainties in other molecular spectroscopic parameters (2.8 ppt) was comparable to that of CH3CN spectroscopic parameters. We compared the SMILES CH3CN profiles with those of the microwave limb sounder (MLS) on the Aura satellite (version 4.2). The SMILES CH3CN values were consistent with those from MLS within the standard deviation (1σ) of the MLS observations. The difference between the SMILES and MLS CH3CN profiles increased with altitude and was within 20–35 ppt (20 %–260 %) at 15.7–1.6 hPa. We observed discrepancies of 5–10 ppt (10 %–30 %) between the SMILES CH3CN profiles observed by different spectrometers, and hence, we do not recommend merging SMILES CH3CN profiles derived from different spectrometers. We found that the SMILES CH3CN volume mixing ratio (VMR) in the upper stratosphere has a seasonal maximum in February.
- Article
(1554 KB) - Full-text XML
- BibTeX
- EndNote


Air pollution caused by biomass burning (BB) has become a serious problem with population growth (Marlon et al., 2008). BB events are important sources of various trace gases and particles in the atmosphere (Eagan et al., 1974; Crutzen et al., 1979). The study of atmospheric gas species associated with BB is significant because early estimates of pyrogenic emissions suggested that some atmospheric pollutants from BB could be comparable to those from fossil fuel burning (Crutzen and Andreae, 1990; Seiler and Crutzen, 1980). These emissions could, therefore, significantly affect the global atmosphere and its temperatures (Andreae, 1983).
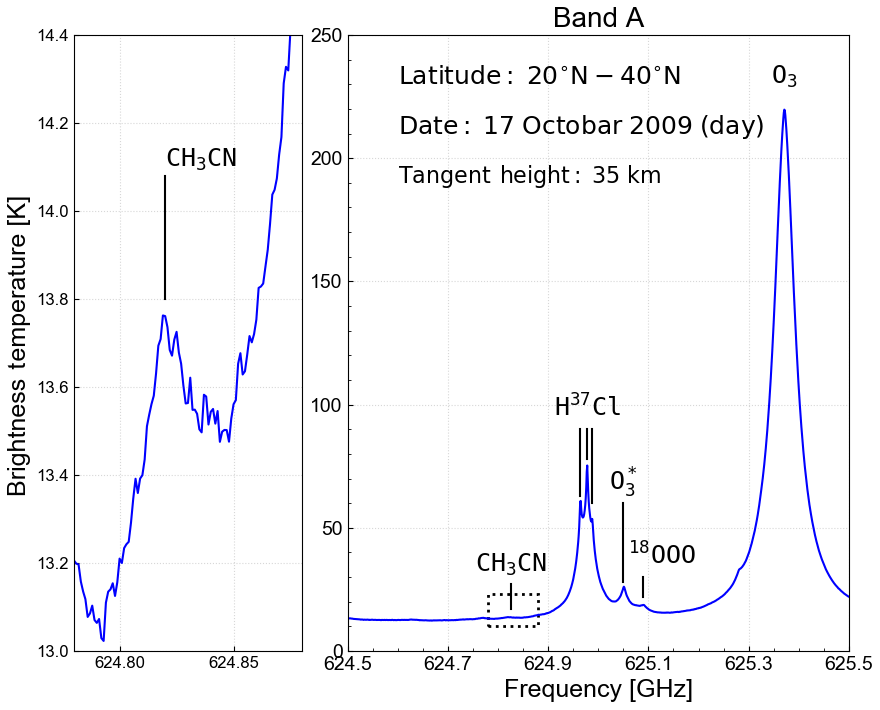
Figure 1Example of a SMILES spectrum (L1b v008) of Band A. A total of 50 scans were accumulated at a tangent height of 35±2.5 km over the daytime on 17 October 2009.
Acetonitrile (CH3CN) is a good tracer for BB as 90 %–95 % of CH3CN comes from wildfires (Li et al., 2003). The mean lifetime of CH3CN in the atmosphere is about 6.6 months, with ocean uptake and reactions with hydroxyl (OH) radicals (Singh et al., 2003; de Gouw, 2003). Chemical loss of CH3CN due to OH radicals occurs primarily in the stratosphere, whereas oceanic loss is dominant in the troposphere. Carbon monoxide (CO) is also a well-known BB tracer, but it has an atmospheric lifetime of only about 2 months in the free troposphere. CO is also emitted from some anthropogenic sources. Thus, CH3CN is not only existent for a longer period of time but also more specific to BB and is, therefore, a better tracer. Arnold et al. (1978) first measured the presence of stratospheric CH3CN from the composition of positive ions using active chemical ionization mass spectrometry. CH3CN has also been detected using balloon-borne and airborne measurements in the lower stratosphere (Knop and Arnold, 1987; Schneider et al., 1997). More recently, satellite observations of CH3CN in the lower stratosphere have been measured using several satellite instruments, such as the microwave limb sounder (MLS) onboard the UARS (Upper Atmosphere Research Satellite) (Barath et al., 1993), the Atmospheric Chemistry Experiment Fourier-transform spectrometer (ACE-FTS) onboard SCISAT-1 (Bernath, 2001), the MLS onboard Aura (Waters et al., 2006), and the Superconducting Submillimeter-Wave Limb-Emission Sounder (SMILES) onboard the JEM (Japanese Experiment Module) of the International Space Station (ISS) (Kikuchi et al., 2010). Previous research reported the volume mixing ratio (VMR) of CH3CN mainly in the upper troposphere and lower stratosphere (UTLS; Livesey et al., 2001, 2004; Harrison and Bernath, 2013). However, there are only a few reports of the CH3CN VMR in the lower stratosphere to mesosphere.
Table 1SMILES characteristics.
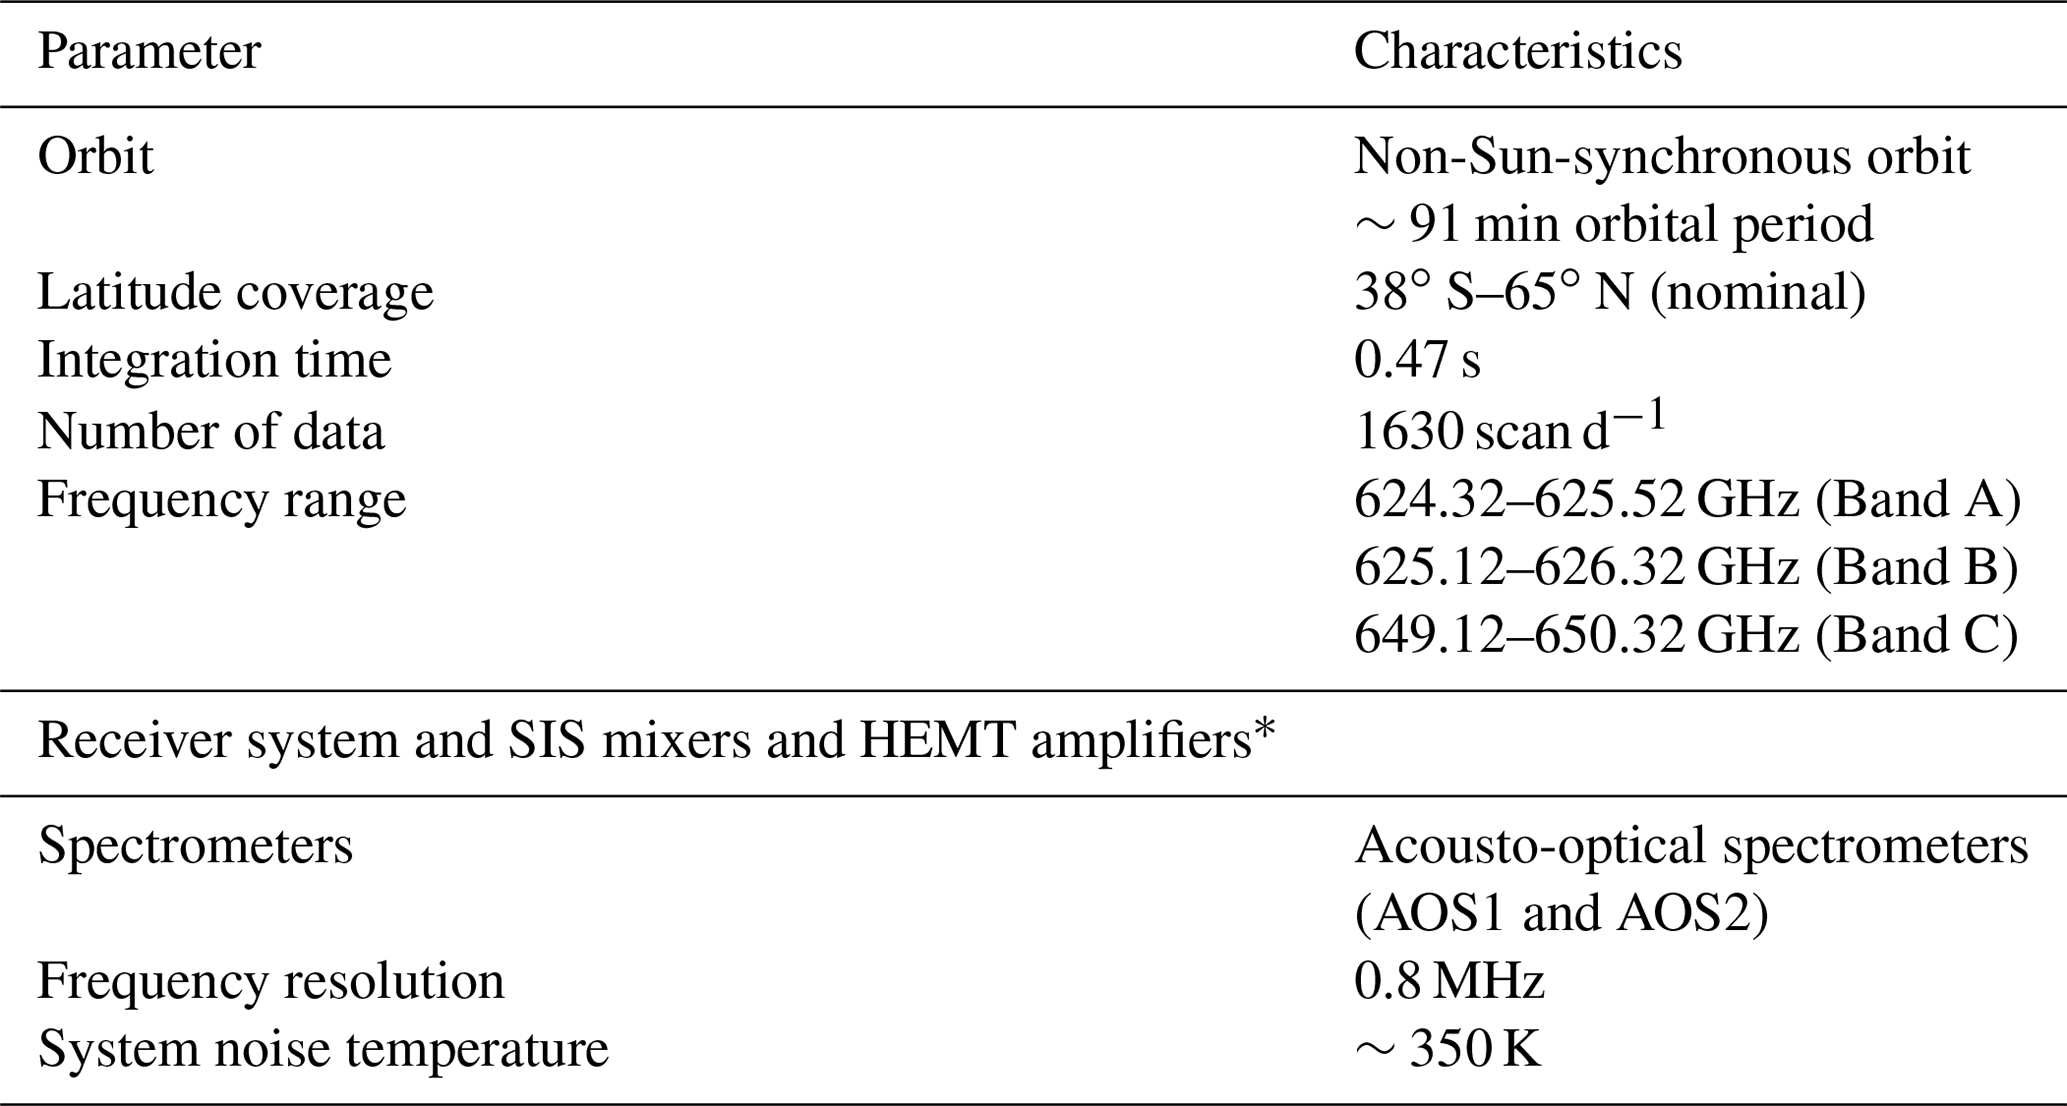
* SIS: superconductor–insulator–superconductor; HEMT: high-electron-mobility transistor.
Here, we derived vertical distribution profiles of CH3CN between the lower stratosphere and mesosphere from SMILES observations. We also performed a validation analysis comparing these results with the Aura MLS observation data.
The JEM SMILES was operated from 12 October 2009 until 21 April 2010 on the ISS (Kikuchi et al., 2010). The ISS has a non-Sun-synchronous orbit and an inclination angle of 51.6∘ to the Equator, which enables it to observe the atmosphere at various local solar times. The antenna field of view of the SMILES instrument was set to point in a 45∘ direction leftward from the ISS orbital motion. Low-temperature system noise (Tsys∼350 K) was achieved using 4 K cooled submillimeter-wave superconductive heterodyne receivers (Ochiai et al., 2011). This noise level is 10 times lower than that achieved in previous observations (Kikuchi et al., 2010). A summary of characteristics for SMILES observations is shown in Table 1.
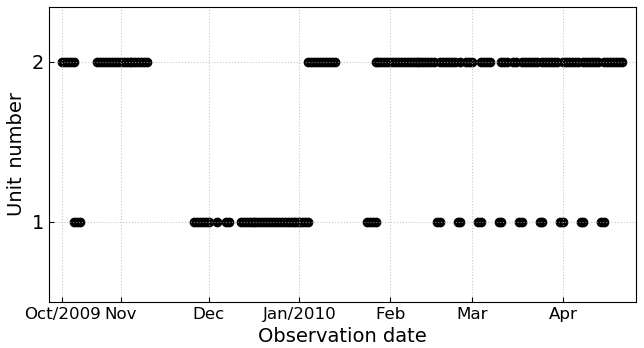
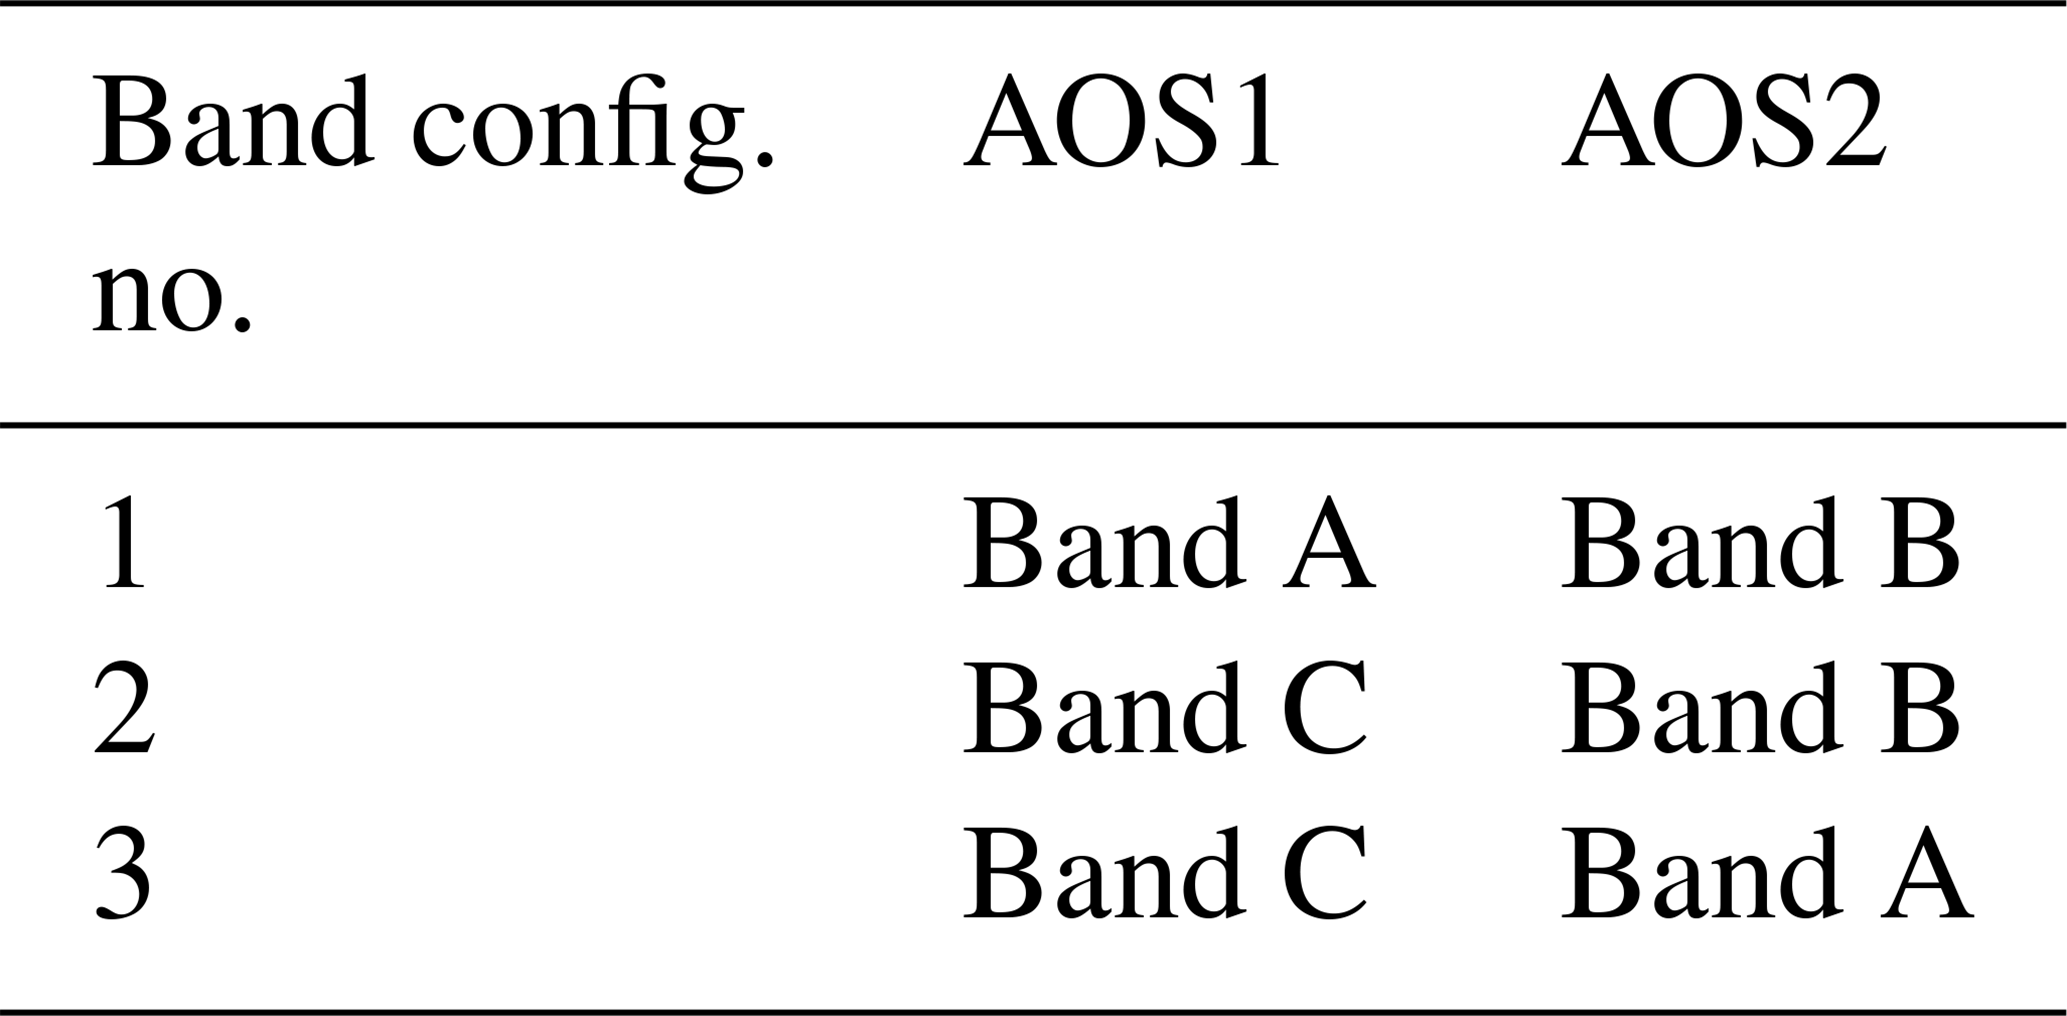
The targeted CH3CN transition at 624.82 GHz for (J, K) = (33, 3)–(33, 4) is allocated with a frequency region of Band A (624.32–625.52 GHz) as shown in Fig. 1. The SMILES employed two acousto-optical spectrometers (AOSs) with a bandwidth of 1.2 GHz, denoted as AOS1 and AOS2. The band configuration for AOS1 and AOS2 is summarized in Table 2. The dates of observations made by AOS1 and AOS2 are shown in Fig. 2. The two AOSs detect Band A, B, or C separately, enabling the SMILES to observe two of the three bands simultaneously.
The SMILES Level-2 research (L2r) version 3.0.0 (v3.0.0) product was used in this study. The CH3CN VMR profile was retrieved from the measurement spectra data of the Level-1b (L1b) version 008 (v008) product. Major improvements in v3.0.0 over the previous version 2.1.5 included the AOS response function and the a priori temperature profile. This version of the L2r product was derived from the L1b-v008-calibrated spectra, which used version 5.2 of the Goddard Earth Observing System (GEOS-5.2) model as a priori information (e.g., O3 VMR profile, temperature, and pressure profiles; Rienecker et al., 2008). The details can be found in the JEM SMILES L2r data product guidelines (see http://smiles.nict.go.jp/pub/data/index.html, last access: 20 April 2020). The optimal estimation method (OEM) was used for the retrieval processing. The OEM leads to the maximum a posteriori probability solution (Rodgers, 2000), which minimizes the value of χ2 described below.
where F(x,b) is the forward model depending on the x state vector and on the known model parameters b, the measurement covariance matrix, xa the a priori state of x, and Sa the a priori covariance matrix. The detailed retrieval algorithm of the L2r product can be found in Baron et al. (2011) and Sato et al. (2012).
The quality of the retrieval processing was quantified by the chi-squared statistics, or goodness of fit (Eq. 1), and the measurement response (m) was defined as
where is the solution of the retrieval, A the averaging kernel, D the contribution function, and K the weighting function. K was used to derive m, A, and D (Urban et al., 2004). Details on m are explained by Sato et al. (2014). The χ2 of CH3CN for v3.0.0 had a range of 0.4–0.6. In cases where the measurement response was low, the information was retrieved from the a priori state. Here, the data selection thresholds of χ2 and measurement response were set as χ2<0.6 and m>0.80, respectively.
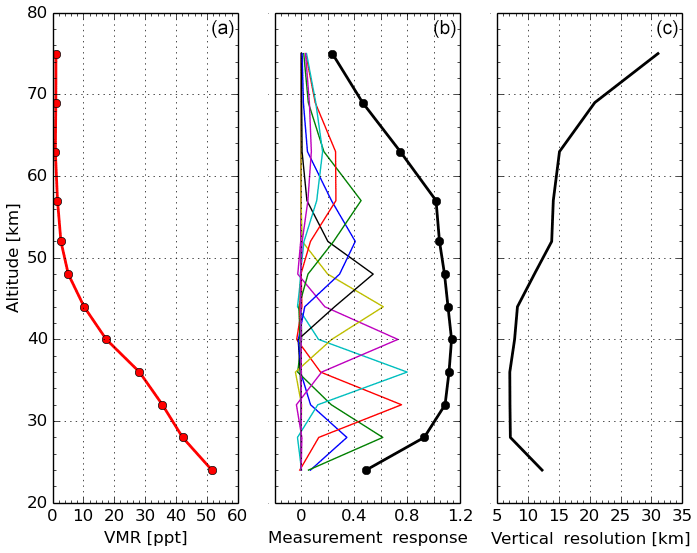
Figure 3(a) Vertical profile of CH3CN retrieved from a single spectral scan on 4 November 2009, in the tropics at a latitude of less than 20∘. (b) The averaging kernel by altitude, for each measurement (colored lines), and the measurement response (solid black line). (c) The vertical resolution of the profile, defined as the full width at half maximum (FWHM).
Figure 3 shows an example of the retrieval results from a single spectral scan on 4 November 2009 in the tropics at a latitude of less than 20∘, including the retrieved CH3CN vertical profile, averaging kernel, and vertical resolution. The vertical resolution was defined as the full width at half maximum (FWHM) for each row of the averaging-kernel matrix. The measurement response of retrieved CH3CN, shown as a black solid line in Fig. 3b, is the sum of elements from the averaging kernel on each altitude grid. The measurement response was almost 1 from 30 to 55 km, with a vertical resolution of 7–15 km, decreasing with altitude.
We theoretically estimated the error in deriving CH3CN profiles from SMILES observations by perturbing the model parameters in a forward model (Sato et al., 2012; Kasai et al., 2013; Sagawa et al., 2013). We used a typical CH3CN profile derived using observations from the tropics, where BB (a major source of CH3CN) frequently occurs. The total error (Etotal) is given by
where En is the error due to spectral noise, Es the smoothing error, and Ep the model parameter error. The error due to the spectral calibration was ignored in this study, because the L1b data were updated in this version, and the error due to the spectral calibration was not significant according to previous SMILES error analyses (e.g., Sato et al., 2012).
Errors En and Es were calculated by the following equation:
where
and
where
Here, Sn and Ss are the error covariance matrices for measurement noise and the errors from Sa, respectively. U is the unit matrix.
The model parameter error Ep includes errors caused by uncertainties in the parameters used in both the forward and inversion calculations. Error sources of the model parameters are summarized in Table 3. The error related to each of the individual model parameters was calculated using the perturbation method following Sato et al. (2012). The total error Ep for all of the parameters was calculated using the root sum square of the individual errors.
Figure 4 shows the estimated systematic errors. Figure 4a shows the uncertainties in the AOS response function (AOS), the antenna beam pattern (Antenna), the spectral line strength (Strength), the air-pressure-broadening coefficient (γ), its temperature dependence (n), and their root sum square (Total). The largest error source, ∼2 ppt (5 %), was from the air-pressure-broadening coefficient (γ) across the entire pressure range, followed by those from the line intensity (Strength) and temperature dependence of air-pressure-broadening coefficient (n; ≃1.5 ppt). The error from spectroscopic parameters was more significant than that from the instrumental functions.
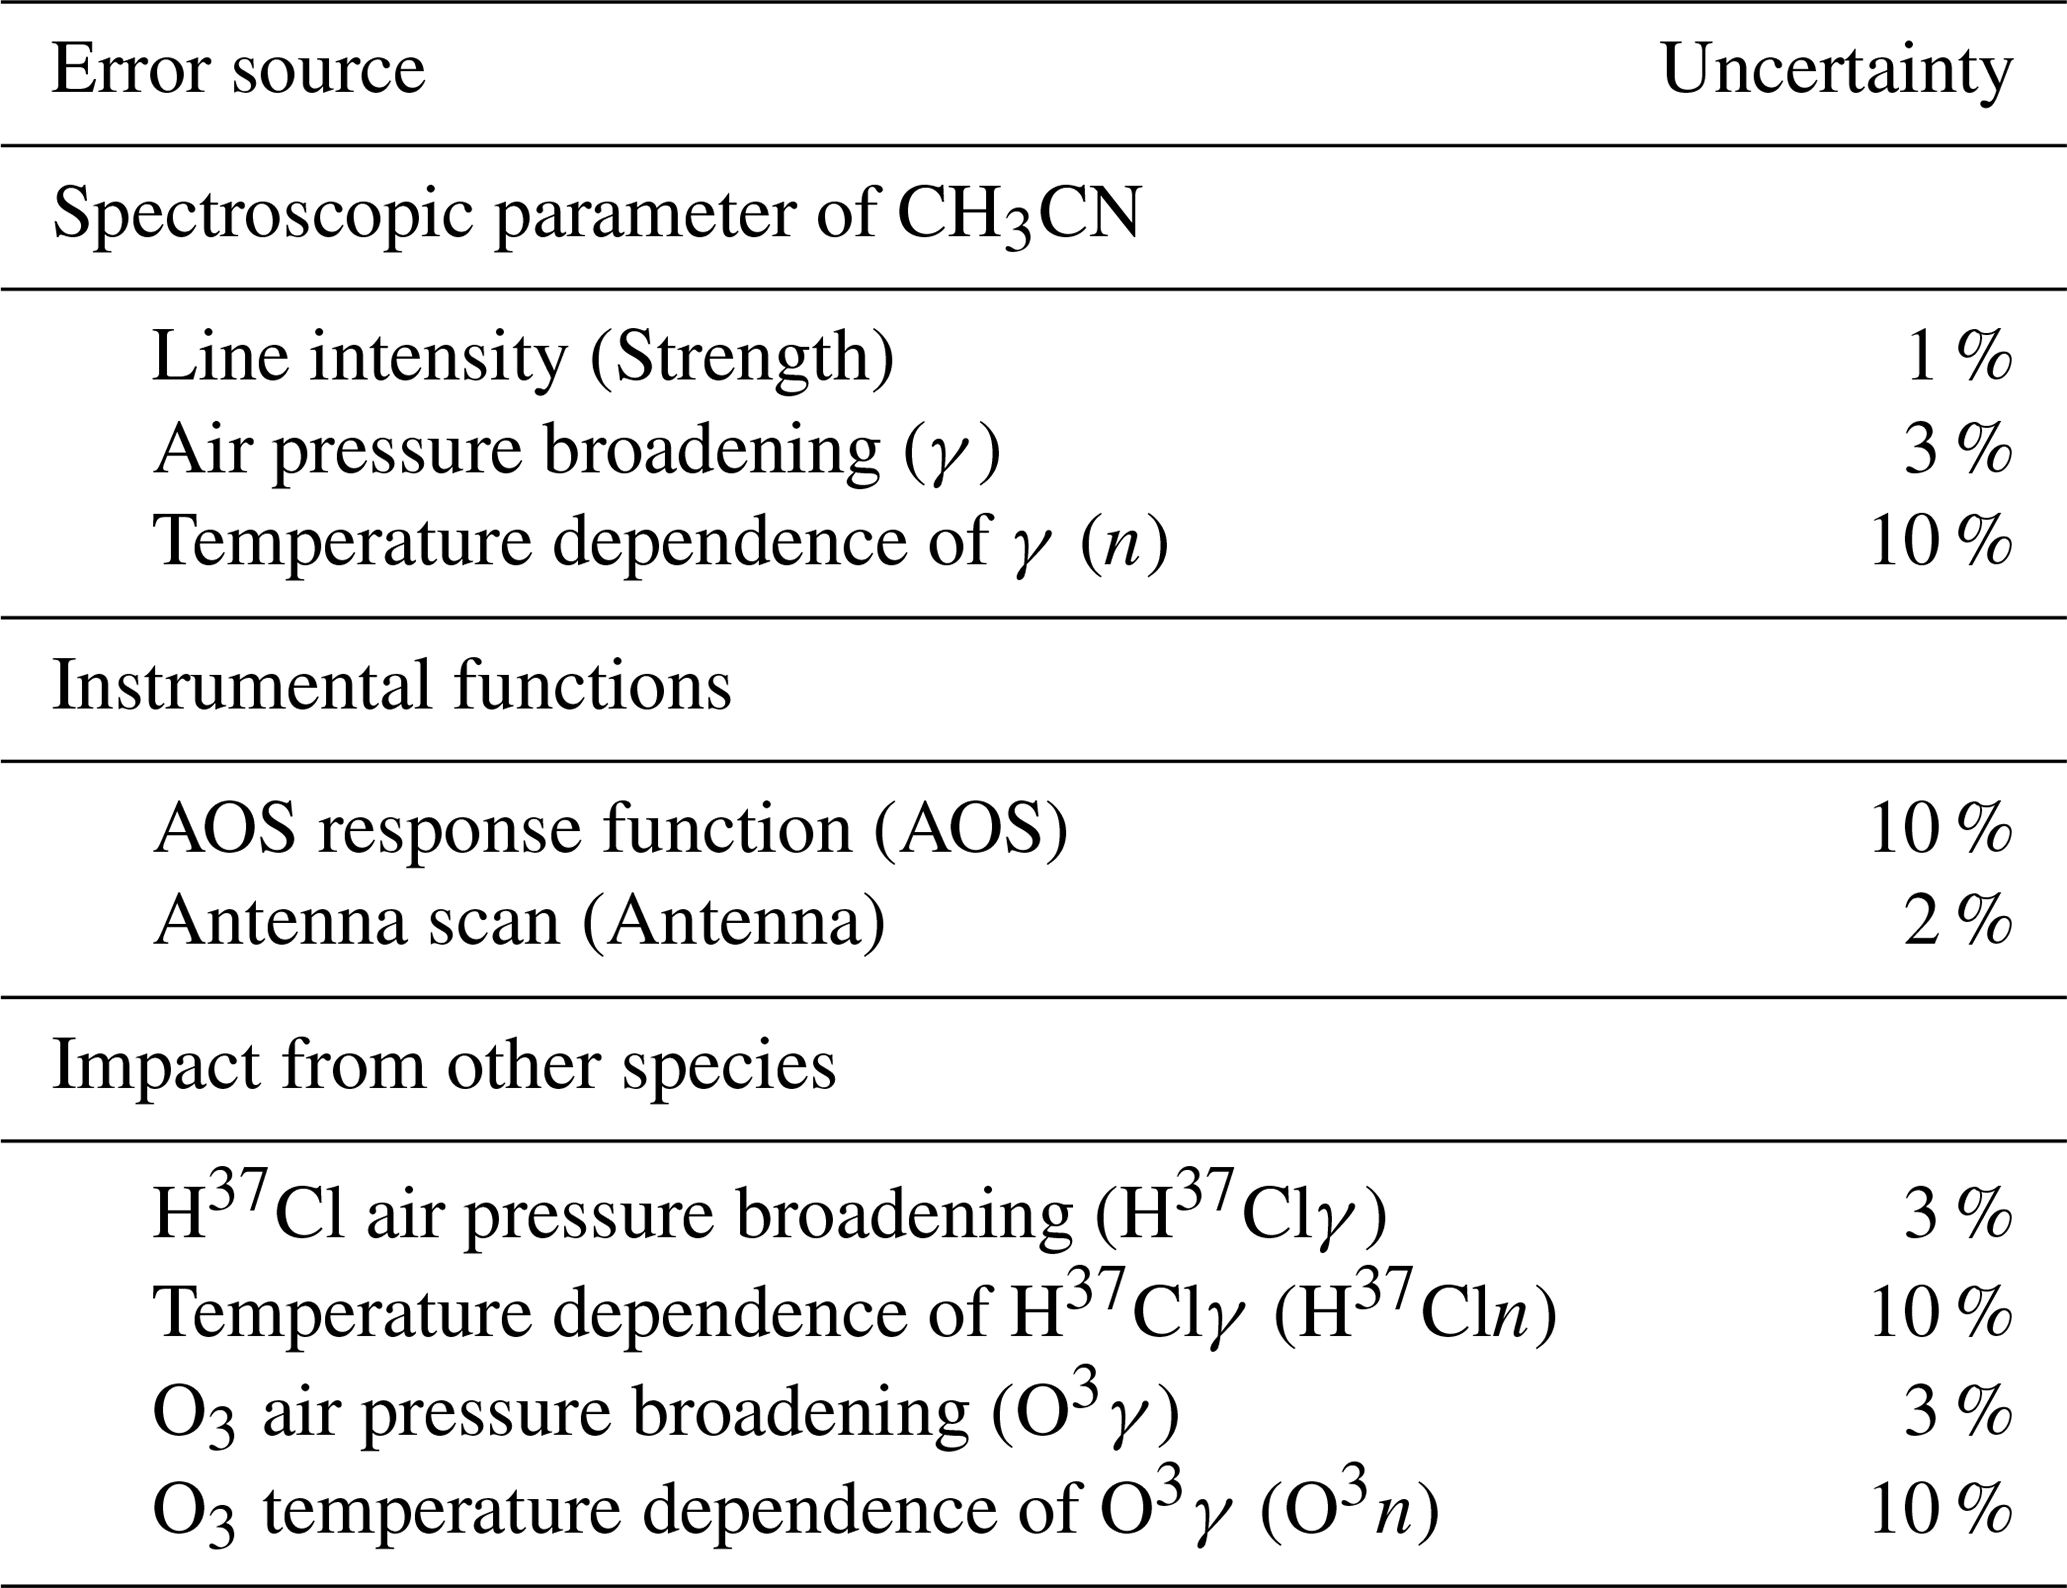
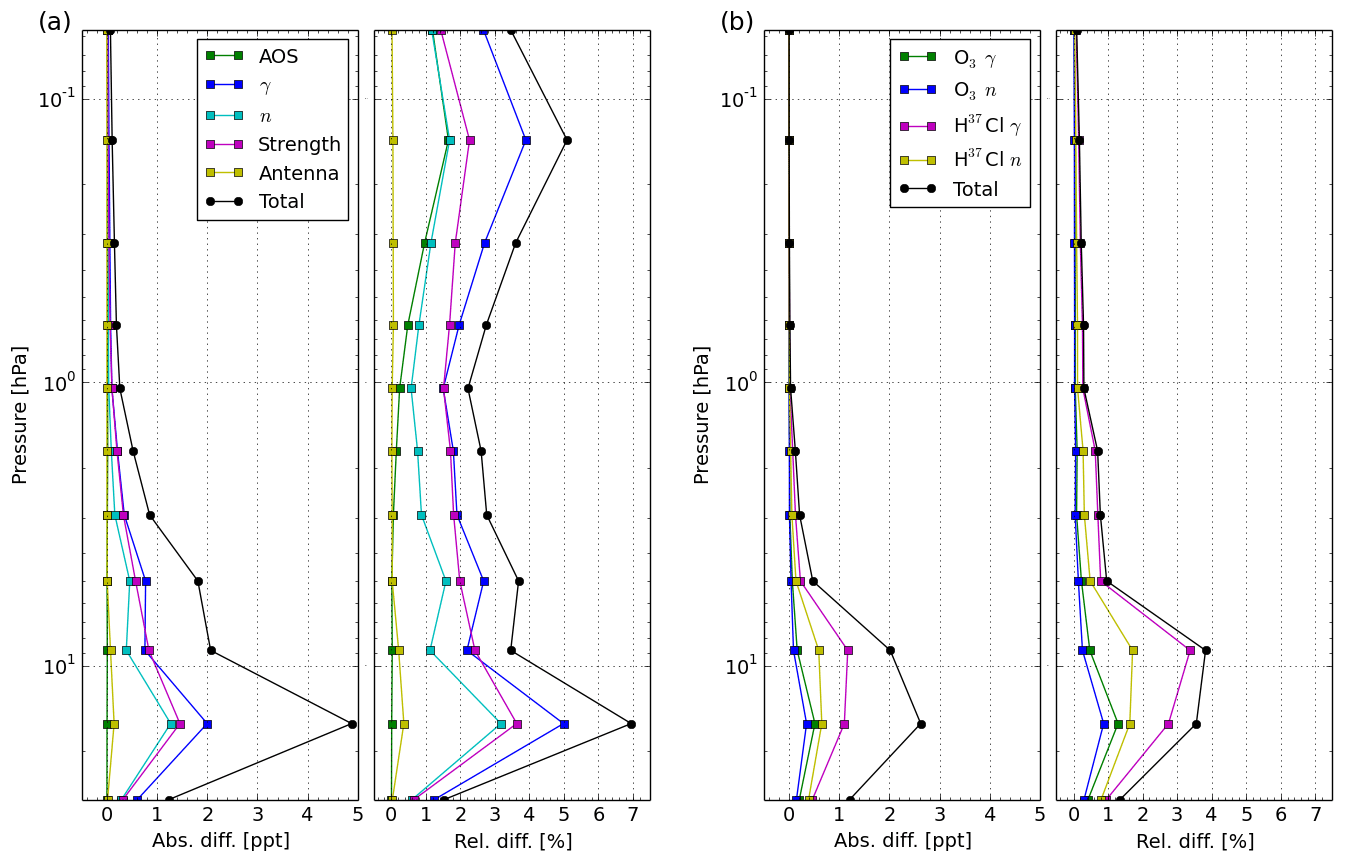
Figure 4(a) Summary of absolute and relative differences derived from systematic errors of CH3CN retrieval caused by uncertainties in the spectral parameters and (b) instrumental functions derived from a single-scan spectrum observed on 4 November 2009 in the tropics, as shown in Fig. 3. The black line indicates the total error calculated by the root sum square of all assumed error sources.
In Band A, O3 and H37Cl are observed near the CH3CN transition (see Fig. 1). The spectral shapes of O3 and H37Cl should, therefore, influence the retrieval of the CH3CN VMR profiles. To estimate the influence from the other spectral lines, the errors due to the spectroscopic parameters γ and its temperature dependence n of the O3 and H37Cl lines were also calculated. γ and temperature dependence of γ were perturbed for each species and are expressed as O3γ, O3n, H37Clγ, and H37Cln. As shown in Fig. 4b, H37Clγ is the largest error source, in which the maximum absolute difference was 1.1 ppt. Error analyses performed for O3 and ClO demonstrated that the error caused by other molecular spectral lines was negligible as they have high, isolated line strengths (Sato et al., 2012; Sagawa et al., 2013; Kasai et al., 2013). In the case of CH3CN retrieval, however, the total error caused by uncertainties in other molecular spectroscopic parameters was comparable to the error caused by CH3CN spectroscopic parameters. The error due to H37Cl was larger than that from O3 at each pressure level.
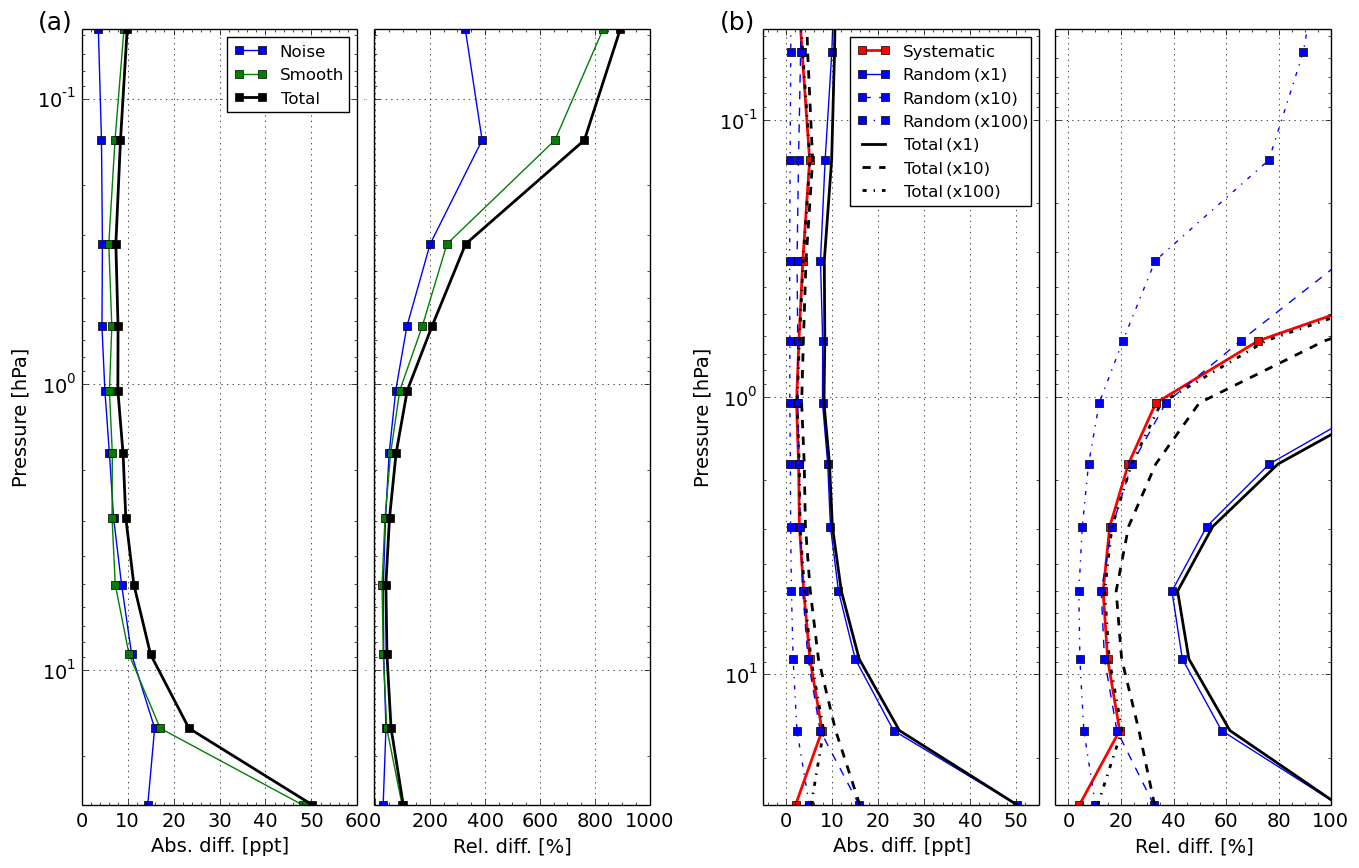
Figure 5(a) Summary of absolute and relative differences derived from random errors of CH3CN retrieved from a SMILES single-scan observation as shown in Fig. 4. (b) Summary of absolute and relative differences derived from random (blue), systematic (red), and total (black) errors in the SMILES CH3CN retrieval for the averaging of N profiles (N=1, 10, 100). The number in the legend is the accumulating profile number.
The measurement noise and smoothing error from a single scan are shown in Fig. 5a. These errors were considered as a random error for a CH3CN profile. The SMILES CH3CN total error consists of both the systematic and random errors. Figure 5b shows the total systematic error, the random error, and the total error averaged by the number of profiles (N=1, 10, and 100). For a single scan, the random error was larger than the systematic error. However, the random error averaged by 100 profiles was comparable to the systematic error, except for the highest systematic error found at a pressure level of about 1 hPa.
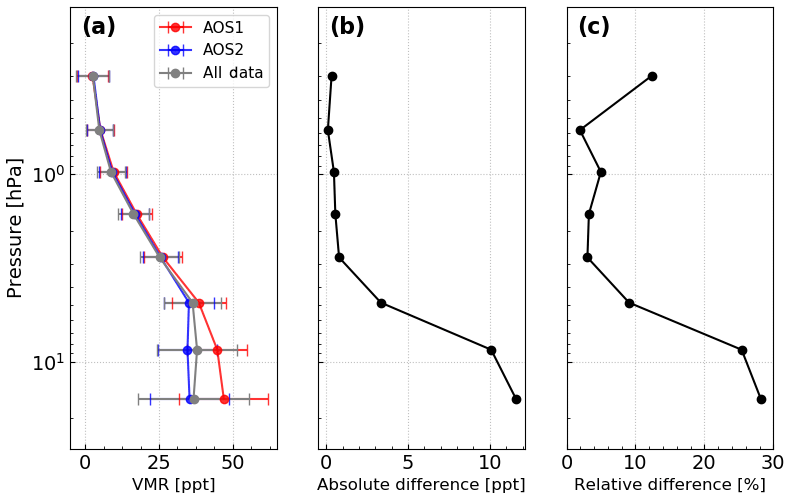
Figure 6(a) Vertical profiles of CH3CN from AOS1 and AOS2 and the sum of AOS1 and AOS2 in the equatorial region from 20∘ S to 20∘ N, from March until April 2010. Each line indicates the averaged VMR from AOS1 observations (red line), AOS2 observations (blue line), and the sum of AOS1 and AOS2 observations (gray line). (b) The absolute difference between AOS1 and AOS2 (AOS1−AOS2). (c) The relative difference between AOS1 and AOS2 ((AOS1−AOS2)∕M when M is (AOS1+AOS2)∕2).
In this section, we compare SMILES CH3CN observations with Aura MLS observations and discuss the validity of SMILES observations.
Figure 6 shows CH3CN vertical profiles observed by AOS1 and AOS2 (Fig.6a) and the absolute (Fig.6b) and relative (Fig.6c) differences between AOS1 and AOS2 observed in equatorial regions (20∘ S–20∘ N) from March until April 2010, when AOS1 and AOS2 were alternating at a ratio of 1:3. The error bars shown in Fig. 6a are standard deviations (1σ) of the CH3CN VMR observations retrieved from SMILES pressure grids for AOS1 (red) and AOS2 (blue). The relative difference between AOS1 and AOS2 is approximately 12 ppt (30 %) with the maximum at 15.7 hPa. It is likely that these discrepancies between the two AOSs result from sensitivity differences. We believe that the sensitivity differences indicate inherent sensitivity differences between the two AOSs derived from instrumental characterization determined during manufacturing. Kasai et al. (2013) also reported the discrepancies between the two different AOSs, albeit for the analysis of ozone profiles using the SMILES L2 version 2.1.5 product. As mentioned above, in this analysis, we used the SMILES L2r version 3.0.0 product that improves the AOS response function. However, there may still be disagreement between the two AOSs. The relative difference between the two AOSs decreases to less than 10 % at an upper pressure altitude of 4.8 hPa, except at 0.3 hPa, showing a good agreement of the two AOS observations from the middle stratosphere.
We also investigated seasonal variation in SMILES CH3CN observations for each altitude grid as shown in Fig. 7. This figure shows daily scatterplots and daily averages for AOS1 (shaded red area) and AOS2 (shaded blue area) observations. The red circles and bars represent the daily mean values and 1σ standard deviations, when more than 100 observation points were obtained in 1 d. As shown in Fig. 2, at lower altitudes (28 to 36 km), the difference between the two AOS observations was significantly larger, especially from December until the beginning of January. However, in the upper stratosphere, there was no difference between the two AOS observations, and the standard deviations decreased with altitude. In terms of seasonality, CH3CN levels peaked in February, seen from approximately 40 to 52 km, where the difference between the two AOSs is negligible.
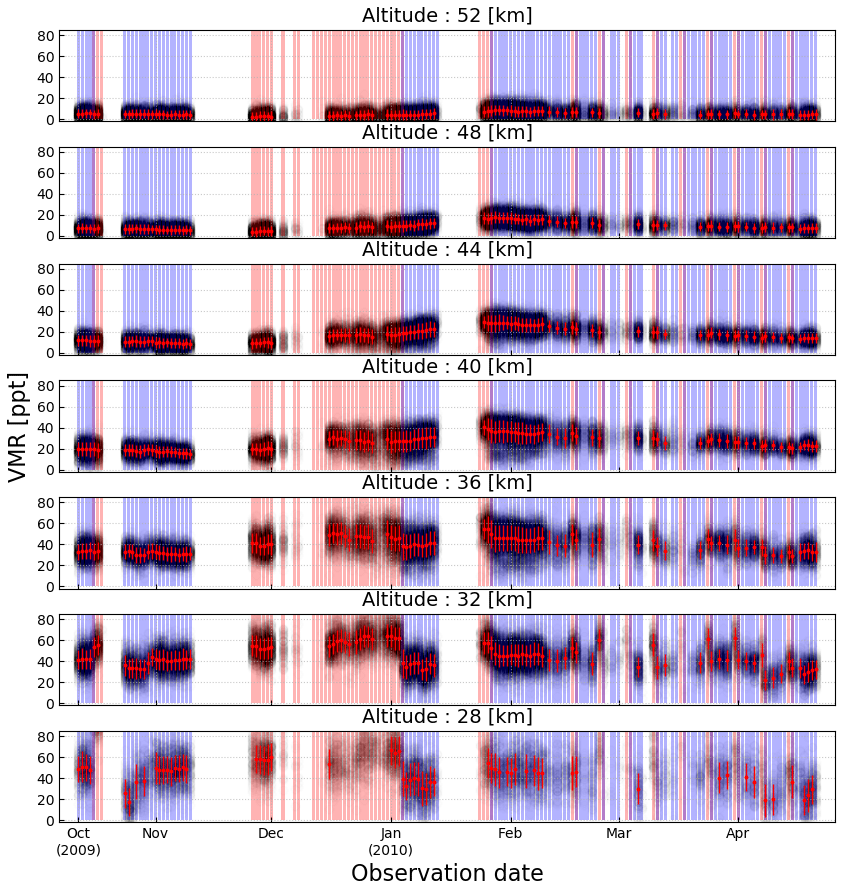
Figure 7Daily scatterplots and average plots for retrieved CH3CN observations at each altitude (28–52 km) in the equatorial region (20∘ S–20∘ N). Solid red lines indicate filtered mean values observed on each day. Error bars indicate 1σ standard deviations. Shaded red (blue) areas represent the date observed by AOS1 (AOS2).
4.1 Comparison with Aura MLS v4.2 data
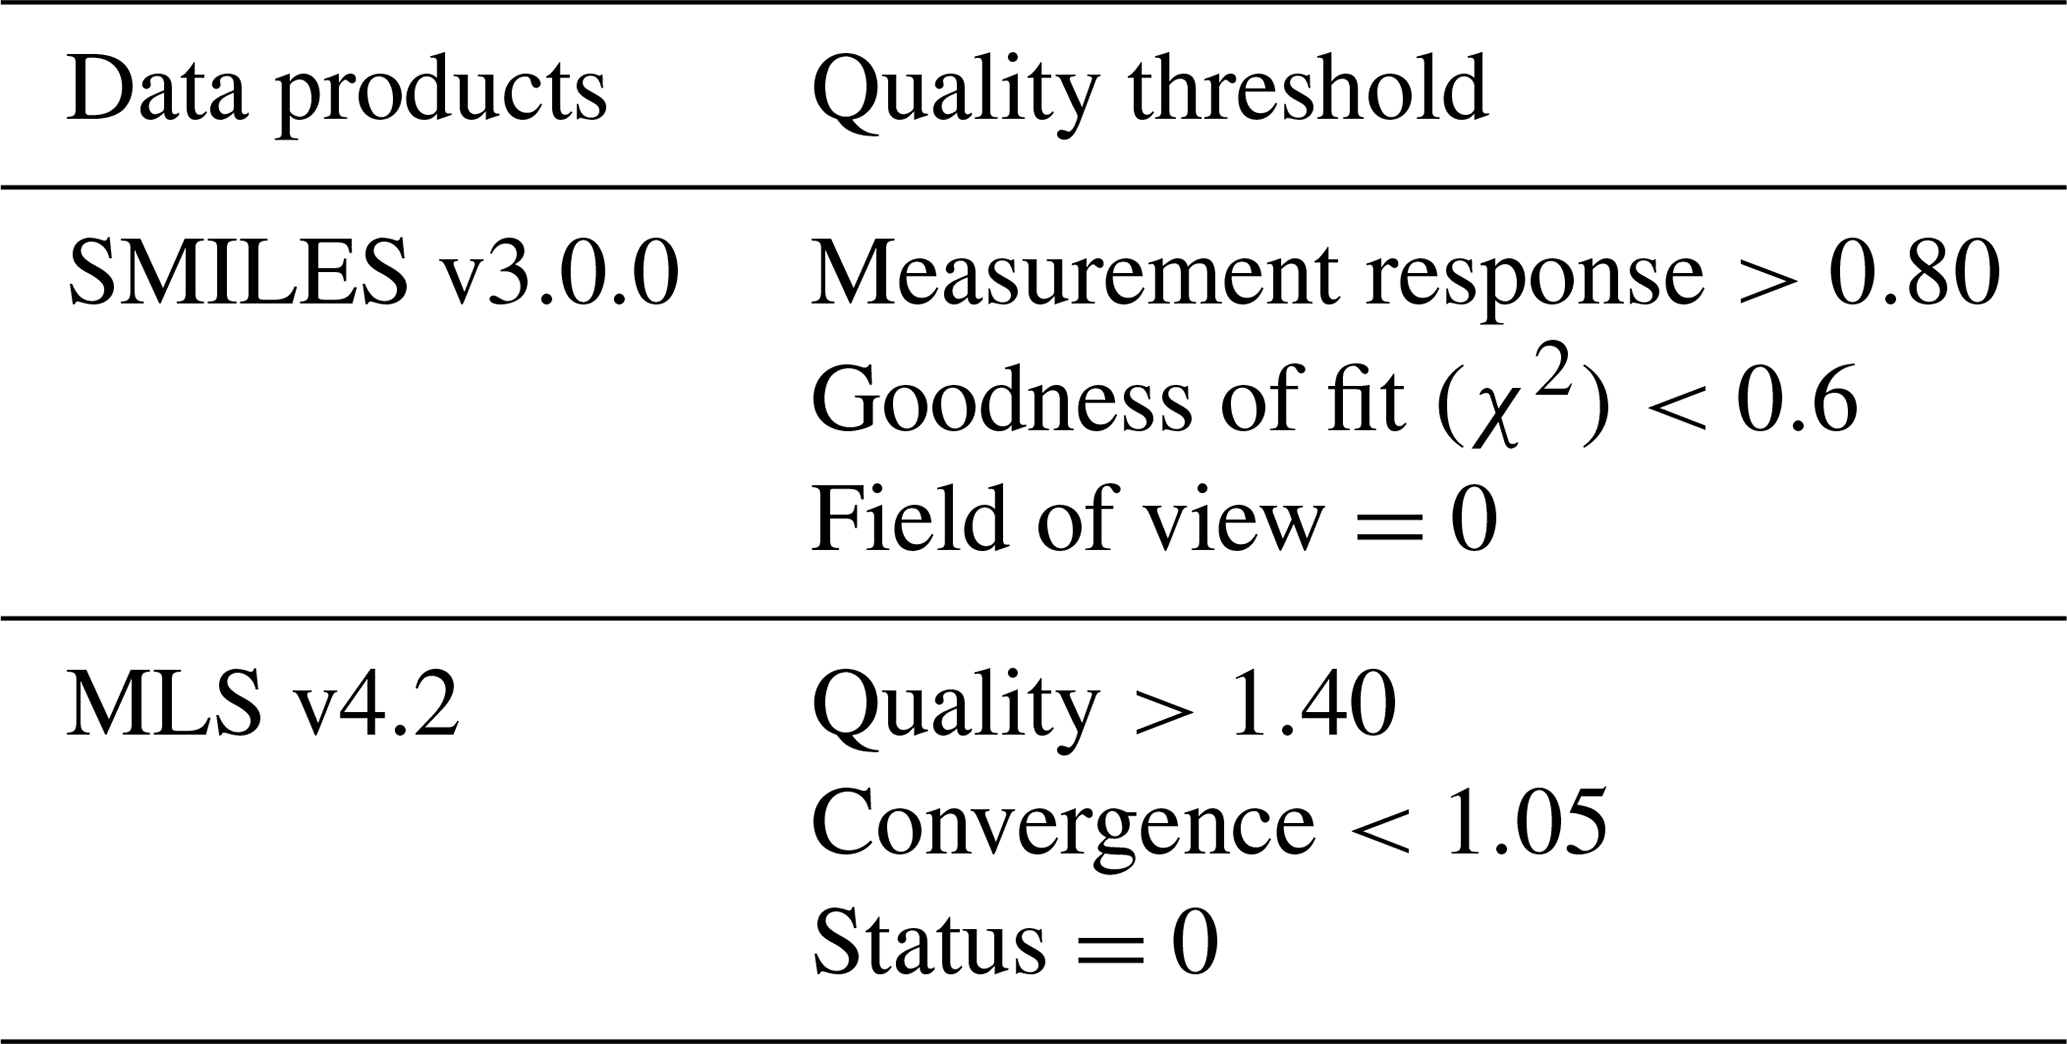
We investigated the difference between CH3CN VMRs obtained from SMILES and MLS observations. We set the data quality thresholds and the coincidence selection criteria for the SMILES and MLS observations as summarized in Table 4. The MLS data quality criteria were based on the MLS v4.2 Level-2 data quality and description document.
The geolocation and measurement time criteria were determined as follows:
-
the distance of measurement location within 300 km
-
the difference in the measurement time within 6 h.
We investigated the diurnal variation in SMILES CH3CN observations at several altitudes (32, 40, and 48 km) for AOS1 and AOS2 individual observational periods and confirmed that there is no diurnal variation in stratospheric CH3CN observations.
Figure 8 shows the distribution of coincident points satisfying these criteria at 8.6 hPa. The interpolation of VMRs was carried out using a linear interpolation with respect to the logarithmic pressure levels. There are, on average, 10 coincident points in each bin at this pressure level, and the total coincident data number was 17 910.
For comparing the SMILES and the MLS observations, the mean absolute difference, Δabs, and relative difference, Δrel, at the pressure levels, p, between coincident CH3CN profiles of the two observations were calculated as follows:
where N(p) is the number of coincidences at p, xs(p) and xm(p) are the VMRs at p for SMILES and MLS observations, and the reference () is .
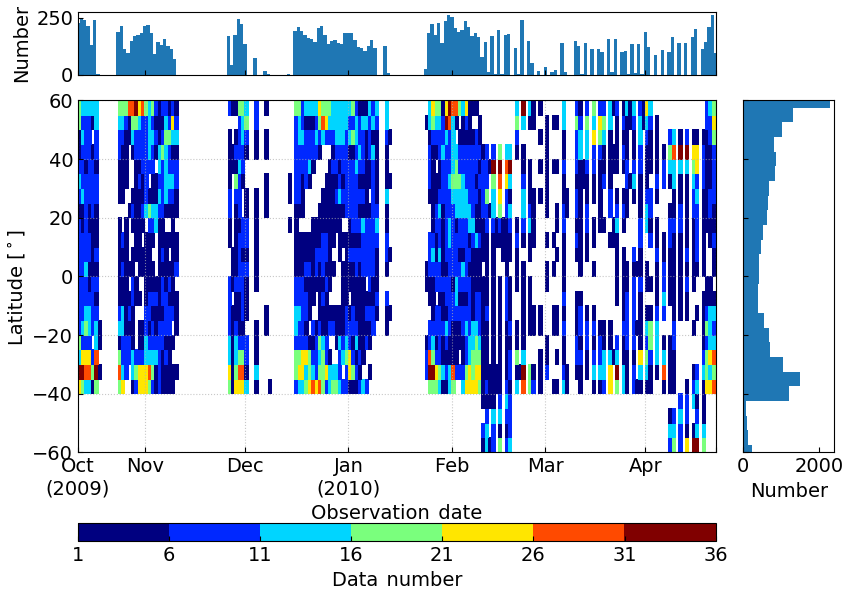
Figure 8Distribution of the data that meet the criteria between 12 October 2009 and 21 April 2010, at 8.6 hPa. Observation date and latitude bins are 1 d and 3∘.
4.1.1 Aura MLS v4.2
The MLS has been onboard the Aura satellite since 2004 and has observed CH3CN levels from the lower to upper stratosphere. This satellite was launched in the Sun-synchronous orbit with an Equator-crossing time of 13:45 LT (ascending) and 01:45 LT (descending). The daily MLS measurements give 82∘ S to 82∘ N latitude coverage. The MLS measures temperature and trace gases (O3, CO, H2O, HNO3, CH3CN, etc.) using thermal emission data from the atmosphere. The CH3CN VMR values were retrieved from the MLS observation data using the optimal estimation method. Details on the retrieval algorithm are described in Livesey et al. (2006). The MLS uses spectral bands of 118, 190, 240, and 640 GHz and 2.5 THz, observing CH3CN from 640 GHz spectral regions (Waters et al., 2006). MLS Level-2 CH3CN profiles were observed in 640 GHz spectral regions. Although the pressure range of a retrieved MLS CH3CN is 147 to 0.001 hPa, the pressure range of CH3CN version 4.2.0 is 46–1.0 hPa (Livesey et al., 2006).
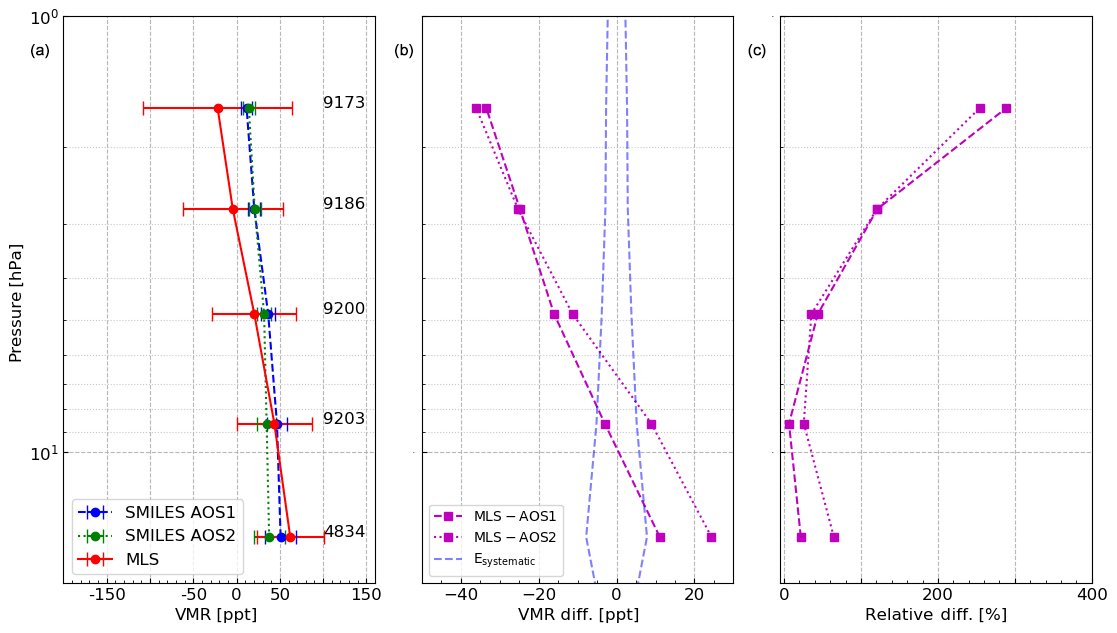
Figure 9(a) Mean CH3CN VMR values and the standard deviations for SMILES and MLS measurements. The blue and green lines represent the SMILES VMR observed by AOS1 and AOS2, respectively. The red line represents the MLS VMR. Error bars indicate 1σ standard deviation for each dataset. The number of coincident data are displayed at each point. (b) The absolute difference in the mean CH3CN VMR values between the SMILES AOS1, SMILES AOS2, and MLS observations is calculated by Eq. (11). Dashed blue lines indicate systematic errors theoretically derived in Sect. 3. (c) The relative differences between CH3CN levels observed using SMILES and MLS methods are calculated by Eq. (12).
4.1.2 Result of comparisons
Figure 9 shows the vertical profiles, the absolute differences, and the relative differences between SMILES AOS1 and AOS2 and MLS CH3CN observations. Figure 9a indicates good agreement among the three observations in the range from 15.7 to 4.8 hPa. Across the range of the pressure levels, the absolute difference and the relative difference among the three observations were −15 to 25 ppt and 20 % to 80 %, respectively. The difference between the SMILES and the MLS observations increases with altitude, from a pressure level of 8.6 hPa. It should be noted that the discrepancies between the two instruments were exaggerated at upper pressure levels from 2.8 hPa, although negative values of CH3CN VMR derived from MLS have no physical meaning. Overall, the variance in SMILES observations is less than that in MLS observations, as SMILES Tsys was more than 10 times less than that of MLS, indicating that the SMILES has an advantage in the upper stratosphere. The SMILES was also able to observe the CH3CN VMR in the upper stratosphere with a much lower uncertainty of ∼20 ppt; the uncertainty in the MLS CH3CN VMR was approximately 100 ppt at this altitude. The differences in the CH3CN VMRs observed by the two AOSs were sufficiently small in comparison with the difference between SMILES and MLS observations. The theoretical systematic error (dashed blue lines in Fig. 9b) derived in Sect. 3 was less than the differences between SMILES and MLS observations, except at 8.9 hPa.
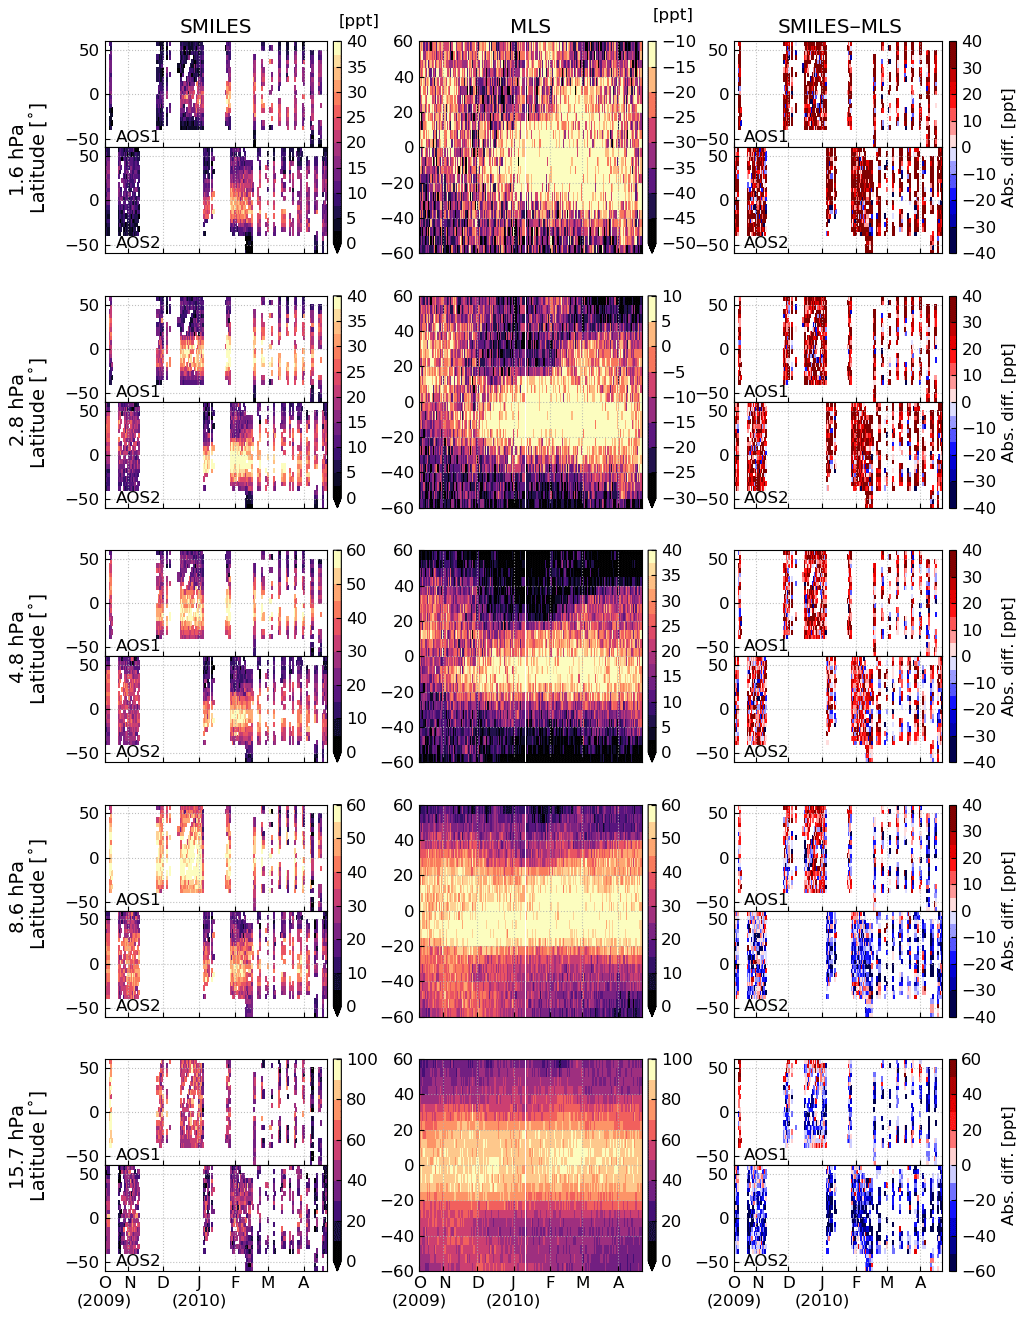
Figure 10Seasonal variation in SMILES and MLS CH3CN observations and the absolute difference for each pressure level, as a function of latitude. Observation date and latitude bins are 1 d and 5∘.
We also investigated latitudinal and seasonal variations between the two observations. Figure 10 shows the seasonal variation in SMILES and MLS CH3CN observations and the absolute differences for each pressure level at coincident points, as a function of latitude. The left column represents the SMILES CH3CN VMR in units of parts per trillion, which was separated into two AOS observations. The middle column represents the MLS CH3CN VMR, and the right column represents the absolute differences between SMILES and MLS observations. At lower altitudes of 15.7 and 8.6 hPa, SMILES observations were overestimated when compared with the MLS observations, while at upper levels (<4.8 hPa) SMILES observations were underestimated by up to 40 ppt. At every pressure level, SMILES CH3CN VMRs were higher in the tropics (20∘ S ∼ 20∘ N). However, in the case of MLS observations at higher pressure levels, MLS observations were negatively biased and the trend was not conspicuous. The MLS CH3CN levels in the tropics were ambiguous at pressure levels above 4.8 hPa, indicating that, in the upper stratosphere, it is hard to observe latitudinal and seasonal trends of CH3CN, due to the large uncertainty in MLS observations. At pressure levels above 4.8 hPa, SMILES CH3CN observations in February were greater than those in the other periods, which can also be seen in the MLS results. This result indicates that CH3CN in the upper stratosphere reaches its seasonal maximum in February.
Our analysis demonstrates the validity of using SMILES observations to measure CH3CN profiles. We were able to successfully derive vertical profiles and observe seasonal variation in CH3CN in the stratosphere, using SMILES observations. This study is the first of its kind to describe the data observed by the satellite instruments for the CH3CN VMR from the upper stratosphere to lower mesosphere with a much lower uncertainty of 20 ppt. Error analysis showed that random error was the dominant source of uncertainty (around 25 ppt at 15.7 hPa) in the measurement altitude range, resulting in a better precision by a factor of 2 or more than that of Aura MLS. The uncertainty in air pressure broadening was the dominant systematic error source, with a maximum difference of 2.0 ppt (5 %). The random error from a single-scan spectrum was more than 2 times larger than systematic error at 15.7 hPa, while the random error averaged with 100 spectra was comparable to systematic error. SMILES and Aura MLS observations were in agreement in the stratosphere from 15.7 to 4.8 hPa. At upper pressure levels, the difference between the two observations increased up to 35 ppt (260 %) because of greater uncertainty in Aura MLS observations and because CH3CN levels were at their seasonal maximum. The theoretical systematic error and the relative difference in the SMILES measurements compared to MLS measurements were, respectively, 10 and 35 ppt at altitudes between 15.7 and 1.6 hPa (28–44 km). Furthermore, the two AOSs show comparable errors (∼10 ppt) at 0.93 hPa to 0.29 hPa (approximately 48–56 km) and at lower pressure levels, implying the reliability of SMILES CH3CN observations.
The SMILES data are available at http://smiles.nict.go.jp/pub/data/index.html (Kikuchi et al., 2010). The MLS data are available at https://mls.jpl.nasa.gov/data/ (EOS MLS Science Team, 2011).
TF designed the study and performed the analysis. YK designed the study and provided the SMILES data. TOS provided the retrieval code and contributed to data analysis and interpretation. TY, SN, YU, and KT contributed to data analysis and reviewed the manuscript. NY supervised and reviewed the manuscript. TF wrote the manuscript with contributions from all coauthors.
The authors declare that they have no conflict of interest.
SMILES is a collaborative project of the National Institute of Information and Communications Technology and the Japan Aerospace Exploration Agency (JAXA). We deeply appreciate Hideo Sagawa (Kyoto Sangyo University) for developing the SMILES L2r product v3.0.0. We are grateful to Atsushi Hirakawa and Kota Kuribayashi for supporting this study. We are grateful to Nathaniel Livesey for providing the MLS version 4.2.0 product.
This research has been supported by the Ministry of Internal Affairs and Communications (grant nos. 0155-0285 and 0155-0093).
This paper was edited by Alyn Lambert and reviewed by Hugh C. Pumphrey and one anonymous referee.
Andreae, M. O.: Soot Carbon and Excess Fine Potassium: Long-Range Transport of Combustion-Derived Aerosols, Science, 220, 1148–1151, https://doi.org/10.1126/science.220.4602.1148, 1983. a
Arnold, F., Böhringer, H., and Henschen, G.: Composition measurements of stratospheric positive ions, Geophys. Res. Lett., 5, 653–656, https://doi.org/10.1029/GL005i008p00653, 1978. a
Barath, F. T., Chavez, M. C., Cofield, R. E., Flower, D. A., Frerking, M. A., Gram, M. B., Harris, W. M., Holden, J. R., Jarnot, R. F., Kloezeman, W. G., Klose, G. J., Lau, G. K., Loo, M. S., Maddison, B. J., Mattauch, R. J., McKinney, R. P., Peckham, G. E., Pickett, H. M., Siebes, G., Soltis, F. S., Suttie, R. A., Tarsala, J. A., Waters, J. W., and Wilson, W. J.: The Upper Atmosphere Research Satellite microwave limb sounder instrument, J. Geophys. Res., 98, 10751, https://doi.org/10.1029/93JD00798, 1993. a
Baron, P., Urban, J., Sagawa, H., Möller, J., Murtagh, D. P., Mendrok, J., Dupuy, E., Sato, T. O., Ochiai, S., Suzuki, K., Manabe, T., Nishibori, T., Kikuchi, K., Sato, R., Takayanagi, M., Murayama, Y., Shiotani, M., and Kasai, Y.: The Level 2 research product algorithms for the Superconducting Submillimeter-Wave Limb-Emission Sounder (SMILES), Atmos. Meas. Tech., 4, 2105–2124, https://doi.org/10.5194/amt-4-2105-2011, 2011. a
Bernath, P.: Atmospheric Chemistry Experiment (ACE): An Overview, Springer Netherlands, 147–161, https://doi.org/10.1007/978-94-010-0832-7_9, 2001. a
Crutzen, P. J. and Andreae, M. O.: Biomass Burning in the Tropics: Impact on Atmospheric Chemistry and Biogeochemical Cycles, Science, 250, 1669–1678, https://doi.org/10.1126/science.250.4988.1669, 1990. a
Crutzen, P. J., Heidt, L. E., Krasnec, J. P., Pollock, W. H., and Seiler, W.: Biomass burning as a source of atmospheric gases CO, H2, N2O, NO, CH3Cl and COS, Nature, 282, 253–256, https://doi.org/10.1038/282253a0, 1979. a
de Gouw, J. A.: Emission sources and ocean uptake of acetonitrile (CH3CN) in the atmosphere, J. Geophys. Res., 108, 4329, https://doi.org/10.1029/2002JD002897, 2003. a
Eagan, R. C., Hobbs, P. V., and Radke, L. F.: Measurements of Cloud Condensation Nuclei and Cloud Droplet Size Distributions in the Vicinity of Forest Fires, J. Appl. Meteorol., 13, 553–557, https://doi.org/10.1175/1520-0450(1974)013<0553:MOCCNA>2.0.CO;2, 1974. a
EOS MLS Science Team: MLS/Aura Level 2 Methyl Cyanide (CH3CN) Mixing Ratio V003, Greenbelt, MD, USA, Goddard Earth Sciences Data and Information Services Center (GES DISC), available at: https://mls.jpl.nasa.gov/data/ (last access: 29 June 2019), 2011. a
Harrison, J. J. and Bernath, P. F.: ACE-FTS observations of acetonitrile in the lower stratosphere, Atmos. Chem. Phys., 13, 7405–7413, https://doi.org/10.5194/acp-13-7405-2013, 2013. a
Kasai, Y., Sagawa, H., Kreyling, D., Dupuy, E., Baron, P., Mendrok, J., Suzuki, K., Sato, T. O., Nishibori, T., Mizobuchi, S., Kikuchi, K., Manabe, T., Ozeki, H., Sugita, T., Fujiwara, M., Irimajiri, Y., Walker, K. A., Bernath, P. F., Boone, C., Stiller, G., von Clarmann, T., Orphal, J., Urban, J., Murtagh, D., Llewellyn, E. J., Degenstein, D., Bourassa, A. E., Lloyd, N. D., Froidevaux, L., Birk, M., Wagner, G., Schreier, F., Xu, J., Vogt, P., Trautmann, T., and Yasui, M.: Validation of stratospheric and mesospheric ozone observed by SMILES from International Space Station, Atmos. Meas. Tech., 6, 2311–2338, https://doi.org/10.5194/amt-6-2311-2013, 2013. a, b, c
Kikuchi, K. I., Nishibori, T., Ochiai, S., Ozeki, H., Irimajiri, Y., Kasai, Y., Koike, M., Manabe, T., Mizukoshi, K., Murayama, Y., Nagahama, T., Sano, T., Sato, R., Seta, M., Takahashi, C., Takayanagi, M., Masuko, H., Inatani, J., Suzuki, M., and Shiotani, M.: Overview and early results of the Superconducting Submillimeter-Wave Limb-Emission Sounder (SMILES), J. Geophys. Res.-Atmos., 115, 1–12, https://doi.org/10.1029/2010JD014379, 2010. a, b, c, d
Knop, G. and Arnold, F.: Stratospheric trace gas detection using a new balloon-borne ACIMS method: Acetonitrile, acetone, and nitric acid, Geophys. Res. Lett., 14, 1262–1265, https://doi.org/10.1029/GL014i012p01262, 1987. a
Li, Q., Jacob, D. J., Yantosca, R. M., Heald, C. L., Singh, H. B., Koike, M., Zhao, Y., Sachse, G. W., and Streets, D. G.: A global three-dimensional model analysis of the atmospheric budgets of HCN and CH3CN: Constraints from aircraft and ground measurements, J. Geophys. Res., 108, 8827, https://doi.org/10.1029/2002JD003075, 2003. a
Livesey, N., Van Snyder, W., Read, W., and Wagner, P.: Retrieval algorithms for the EOS Microwave limb sounder (MLS), IEEE T. Geosci. Remote, 44, 1144–1155, https://doi.org/10.1109/TGRS.2006.872327, 2006. a, b
Livesey, N. J., Waters, J. W., Khosravi, R., Brasseur, G. P., Tyndall, G. S., and Read, W. G.: Stratospheric CH3CN from the UARS Microwave Limb Sounder, Geophys. Res. Lett., 28, 779–782, https://doi.org/10.1029/2000GL012144, 2001. a
Livesey, N. J., Fromm, M. D., Waters, J. W., Manney, G. L., Santee, M. L., and Read, W. G.: Enhancements in lower stratospheric CH3CN observed by the Upper Atmosphere Research Satellite Microwave Limb Sounder following boreal forest fires, J. Geophys. Res.-Atmos., 109, D06308, https://doi.org/10.1029/2003JD004055, 2004. a
Marlon, J. R., Bartlein, P. J., Carcaillet, C., Gavin, D. G., Harrison, S. P., Higuera, P. E., Joos, F., Power, M. J., and Prentice, I. C.: Climate and human influences on global biomass burning over the past two millennia, Nat. Geosci., 1, 697–702, https://doi.org/10.1038/ngeo313, 2008. a
Ochiai, S., Kikuchi, K., Nishibori, T., Manabe, T., Ozeki, H., Mizukoshi, K., Ohtsubo, F., Tsubosaka, K., Irimajiri, Y., Sato, R., and Shiotani, M.: Performance of JEM/SMILES in orbit, in: Twenty-First Int. Symp. Sp. Terahertz Technol., 179–184, 2011. a
Rienecker, M., Suarez, M., Todling, R., Bacmeister, J., Takacs, L., Liu, H.-C., Gu, W., Sienkiewicz, M., Koster, R., Gelaro, R., Stajner, I., and Nielsen, J.: The GEOS-5 Data Assimilation System – Documentation of Versions 5.0.1, 5.1.0, and 5.2.0, Tech. Rep. December, 2008. a
Rodgers, C. D.: Inverse Methods for Atmospheric Sounding: Theory and Practice, World Scientific, London, 2nd Edn., 2000. a
Sagawa, H., Sato, T. O., Baron, P., Dupuy, E., Livesey, N., Urban, J., von Clarmann, T., de Lange, A., Wetzel, G., Connor, B. J., Kagawa, A., Murtagh, D., and Kasai, Y.: Comparison of SMILES ClO profiles with satellite, balloon-borne and ground-based measurements, Atmos. Meas. Tech., 6, 3325–3347, https://doi.org/10.5194/amt-6-3325-2013, 2013. a, b
Sato, T. O., Sagawa, H., Kreyling, D., Manabe, T., Ochiai, S., Kikuchi, K., Baron, P., Mendrok, J., Urban, J., Murtagh, D., Yasui, M., and Kasai, Y.: Strato-mesospheric ClO observations by SMILES: error analysis and diurnal variation, Atmos. Meas. Tech., 5, 2809–2825, https://doi.org/10.5194/amt-5-2809-2012, 2012. a, b, c, d, e
Sato, T. O., Sagawa, H., Yoshida, N., and Kasai, Y.: Vertical profile of δ18OOO from the middle stratosphere to lower mesosphere from SMILES spectra, Atmos. Meas. Tech., 7, 941–958, https://doi.org/10.5194/amt-7-941-2014, 2014. a
Schneider, J., Bürger, V., and Arnold, F.: Methyl cyanide and hydrogen cyanide measurements in the lower stratosphere: Implications for methyl cyanide sources and sinks, J. Geophys. Res.-Atmos., 102, 25501–25506, https://doi.org/10.1029/97JD02364, 1997. a
Seiler, W. and Crutzen, P. J.: Estimates of gross and net fluxes of carbon between the biosphere and the atmosphere from biomass burning, Climatic Change, 2, 207–247, https://doi.org/10.1007/BF00137988, 1980. a
Singh, H. B., Salas, L., Herlth, D., Kolyer, R., Czech, E., Viezee, W., Li, Q., Jacob, D. J., Blake, D., Sachse, G., Harward, C. N., Fuelberg, H., Kiley, C. M., Zhao, Y., and Kondo, Y.: In situ measurements of HCN and CH3CN over the Pacific Ocean: Sources, sinks, and budgets, J. Geophys. Res., 108, 8795, https://doi.org/10.1029/2002JD003006, 2003. a
Urban, J., Baron, P., Lautié, N., Schneider, N., Dassas, K., Ricaud, P., and De La Noë, J.: Moliere (v5): A versatile forward- and inversion model for the millimeter and sub-millimeter wavelength range, J. Quant. Spectrosc. Ra.., 83, 529–554, https://doi.org/10.1016/S0022-4073(03)00104-3, 2004. a
Waters, J. W., Froidevaux, L., Harwood, R. S., Jarnot, R. F., Pickett, H. M., Read, W. G., Siegel, P. H., Cofield, R. E., Filipiak, M. J., Flower, D. A., Holden, J. R., Lau, G. K., Livesey, N. J., Manney, G. L., Pumphrey, H. C., Santee, M. L., Wu, D. L., Cuddy, D. T., Lay, R. R., Loo, M. S., Perun, V. S., Schwartz, M. J., Stek, P. C., Thurstans, R. P., Boyles, M. A., Chandra, K. M., Chavez, M. C., Chen, G. S., Chudasama, B. V., Dodge, R., Fuller, R. A., Girard, M. A., Jiang, J. H., Jiang, Y., Knosp, B. W., Labelle, R. C., Lam, J. C., Lee, K. A., Miller, D., Oswald, J. E., Patel, N. C., Pukala, D. M., Quintero, O., Scaff, D. M., Van Snyder, W., Tope, M. C., Wagner, P. A., and Walch, M. J.: The Earth Observing System Microwave Limb Sounder (EOS MLS) on the aura satellite, IEEE T. Geosci. Remote, 44, 1075–1092, https://doi.org/10.1109/TGRS.2006.873771, 2006. a, b