the Creative Commons Attribution 4.0 License.
the Creative Commons Attribution 4.0 License.
 | 19 May 2020
Measurement of ammonia, amines and iodine compounds using protonated water cluster chemical ionization mass spectrometry
Mario Simon
Martin Heinritzi
Felix Piel
Lena Weitz
Dongyu Wang
Manuel Granzin
Tatjana Müller
Steffen Bräkling
Jasper Kirkby
Joachim Curtius
Andreas Kürten
Here we describe the design and performance of a new water cluster chemical ionization–atmospheric pressure interface time-of-flight mass spectrometer (CI-APi-TOF). The instrument selectively measures trace gases with high proton affinity such as ammonia and dimethylamine, which are important for atmospheric new particle formation and growth. Following the instrument description and characterization, we demonstrate successful measurements at the CERN CLOUD (Cosmics Leaving OUtdoor Droplets) chamber where very low ammonia background levels of ∼4 pptv were achieved (at 278 K and 80 % RH). The limit of detection of the water cluster CI-APi-TOF is estimated to be ∼0.5 pptv for ammonia. Although no direct calibration was performed for dimethylamine (DMA), we estimate its detection limit is at least 3 times lower. Due to the short ion–molecule reaction time and high reagent ion concentrations, ammonia mixing ratios up to at least 10 ppbv can be measured with the instrument without significant reagent ion depletion. Besides the possibility to measure compounds like ammonia and amines (dimethylamine), we demonstrate that the ionization scheme is also suitable for the measurement of trace gases containing iodine. During CLOUD experiments to investigate the formation of new particles from I2, many different iodine-containing species were identified with the water cluster CI-APi-TOF. The compounds included iodic acid and neutral molecular clusters containing up to four iodine atoms. However, the molecular structures of the iodine-containing clusters are ambiguous due to the presence of an unknown number of water molecules. The quantification of iodic acid (HIO3) mixing ratios is performed from an intercomparison with a nitrate CI-APi-TOF. Using this method the detection limit for HIO3 can be estimated as 0.007 pptv. In addition to presenting our measurements obtained at the CLOUD chamber, we discuss the applicability of the water cluster Ci-APi-TOF for atmospheric measurements.
- Article
(933 KB) - Full-text XML
- BibTeX
- EndNote


Ammonia (NH3) is an important atmospheric trace gas that is mainly emitted by vehicles in urban environments and by agricultural activity due to animal husbandry and the use of fertilizers. It can partition to the aerosol phase and is one of the most important compounds contributing to secondary aerosol formation (Jimenez et al., 2009). Strong reductions in PM2.5 mass and the associated adverse health effects could potentially be achieved by decreasing ammonia emissions (Pozzer et al., 2017). However, ammonia not only partitions to existing particles, but is also a key vapor driving new particle formation due to its stabilization of newly formed clusters in ternary (sulfuric acid–water–ammonia) and multicomponent (sulfuric acid–water–ammonia–highly oxygenated organic molecules) systems (Kirkby et al., 2011; Kürten et al., 2016a; Lehtipalo et al., 2018). On a global scale, a large fraction of newly formed particles and cloud condensation nuclei involves ammonia (Dunne et al., 2016). The involvement of ammonia in nucleation has recently been measured in the free troposphere, in Antarctica and in the boreal forest (Bianchi et al., 2016; Jokinen et al., 2018; Yan et al., 2018). In the upper troposphere, model calculations suggest that ammonia is important for new particle formation and early growth (Dunne et al., 2016). Recent satellite measurements support this finding by the observation of up to several tens of parts per trillion by volume (pptv) of ammonia over Asia (Höpfner et al., 2016). Ammonia has a very strong effect on nucleation involving sulfuric acid and water; e.g., recent studies have shown that very low amounts of NH3 in the parts per trillion by volume range, or even below, can enhance nucleation rates by orders of magnitude compared with the pure binary system of sulfuric acid and water (Kirkby et al., 2011; Kürten et al., 2016a; Kürten, 2019). Stronger basic compounds like amines or diamines have been shown to enhance nucleation rates, despite their much lower atmospheric concentrations (Almeida et al., 2013; Kürten et al., 2014; Jen et al., 2016; Yao et al., 2016). The experimental measurements are confirmed by quantum chemical calculations that compare the stabilizing effects of ammonia, amines and diamines (Kurtén et al., 2008; Elm et al., 2017; Yu et al., 2018). For these reasons improved gas-phase measurements of these compounds are required. Sensitive real-time measurements are needed, spanning mixing ratios over a broad atmospheric range between a few parts per trillion by volume to a few parts per billion by volume of ammonia in the boundary layer, as well as around a few parts per trillion by volume of amines (Ge et al., 2011; Hanson et al., 2011; You et al., 2014; Kürten et al., 2016b; Yao et al., 2016).
In some previous studies, ammonia has been measured using optical absorption or chromatographic methods (Norman et al., 2009; von Bobrutzki et al., 2010; Verriele et al., 2012; Bianchi et al., 2012; Pollack et al., 2019; Ellis et al., 2010). These measurement techniques are often specialized for the detection of only a few selected compounds, whereas chemical ionization mass spectrometry (CIMS) can often measure a suite of atmospheric trace gases simultaneously at low concentrations and high time resolution. The use of different reagent ions has been described in the literature for ammonia and amine measurements; e.g., protonated acetone, protonated ethanol, and protonated water clusters have been successfully applied (Nowak et al., 2007; Norman et al., 2007; Benson et al., 2010; Hanson et al., 2011; You et al., 2014; Yao et al., 2016). Nowak et al. (2010) deployed their instrument on an aircraft for measurements at up to ∼5 km of altitude. The reported limit of detection (LOD) varies between 35 pptv (You et al., 2014) and 270 pptv (Norman et al., 2009) for ammonia, whereas dimethylamine (and other amines) can be detected in the sub-parts per trillion by volume range (You et al., 2014; Sipilä et al., 2015; Simon et al., 2016). In this study we introduce a newly developed chemical ionization mass spectrometer that uses protonated water clusters for the selective ionization of ammonia and dimethylamine. The instrument is a high-resolution chemical ionization–atmospheric pressure interface time-of-flight mass spectrometer (CI-APi-TOF; Aerodyne Inc. and TOFWERK AG) combined with a home-built ion source. The instrument is called a water cluster CI-APi-TOF, naming it in accordance with other established techniques using the same mass spectrometer but different reagent ions, e.g., the nitrate CI-APi-TOF for sulfuric acid, highly oxygenated organic molecules and cluster measurements (Jokinen et al., 2012; Ehn et al., 2014; Kürten et al., 2014). Here we describe and characterize the instrument during experiments performed at the CLOUD (Cosmics Leaving OUtdoor Droplets) chamber at CERN (European Organization for Nuclear Research). We show that the ammonia LOD is below 1 pptv, which is unprecedented to our knowledge. Besides the measurement of basic compounds with high proton affinity, we find that the protonated water clusters are also well-suited to measure iodine-containing species such as iodic acid (HIO3) and neutral molecular clusters containing up to four iodine atoms. The corresponding signals in the mass spectra were identified during CLOUD experiments on new particle formation from the oxidation of iodine vapor. The relevance of such compounds for nucleation in the atmosphere has recently been reported (Sipilä et al., 2016). Our findings indicate that the water cluster CI-APi-TOF can provide sensitive real-time measurements of several trace gases that are important for atmospheric new particle formation and growth: ammonia, amines (dimethylamine) and iodine species.
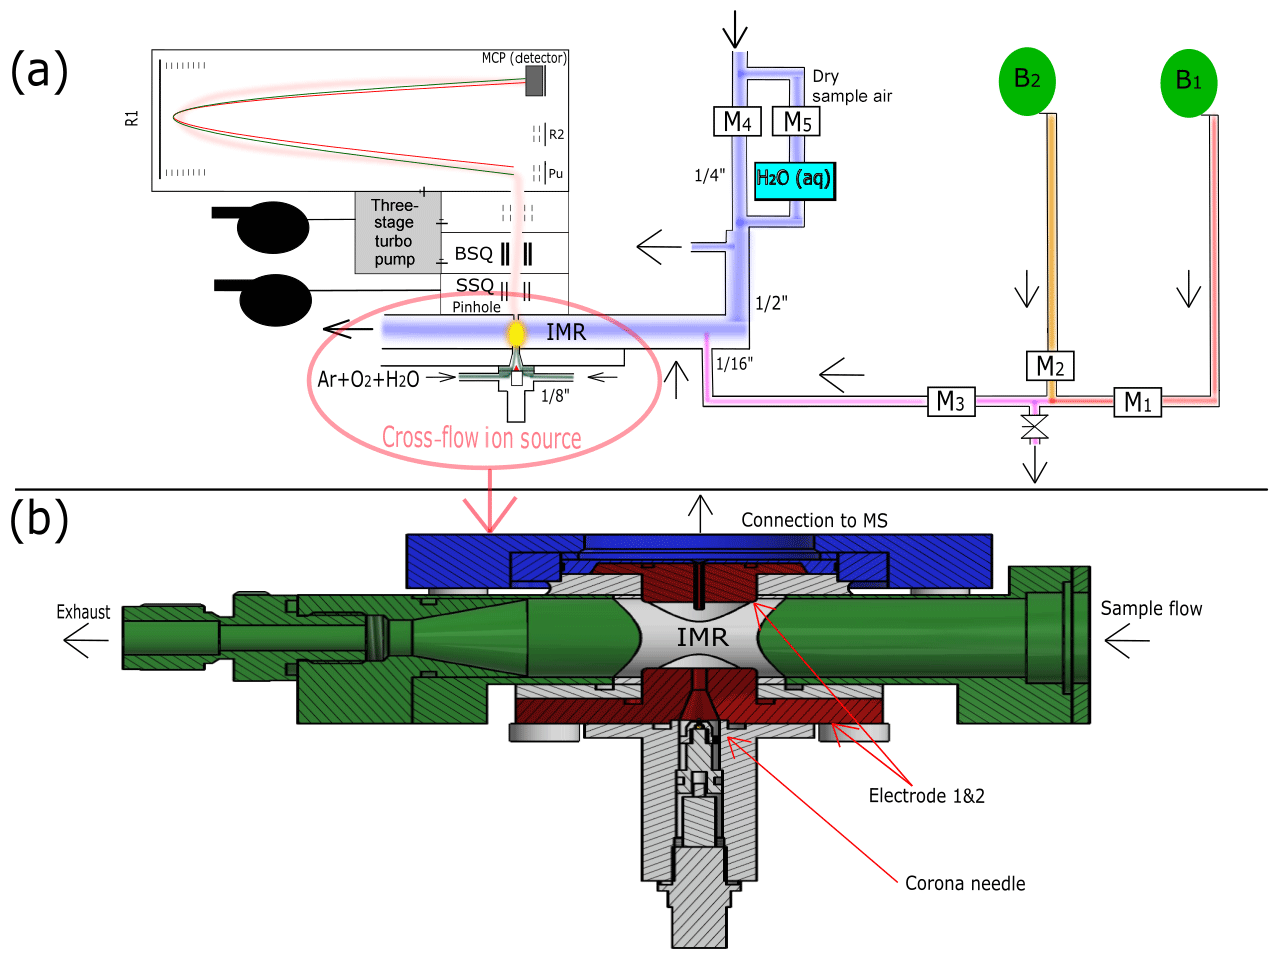
Figure 1The experimental setup of the water cluster CI-APi-TOF during ammonia calibration is shown in panel (a). Blue indicates the sample flow. It consists of a mixture of 80 % nitrogen and 20 % oxygen. A portion of the sample flow can be humidified with a water bubbler (H2Oaq) to achieve different relative humidities. B1 represents the ammonia gas bottle, while B2 represents a gas bottle containing pure nitrogen. There are five mass flow controllers (MFCs; labeled as M1–5) allowing two dilution steps. Three MFCs (M1, M2, M3) control the amount of ammonia that is added through a capillary into the center of the sample flow, where the second dilution stage occurs. The reagent ions (i.e., protonated water clusters) are produced when the ion source gas (argon, oxygen, water vapor) passes a corona needle at a positive high voltage (detailed in panel b). The calibration setup is disconnected during the measurements at the CLOUD chamber to reduce backgrounds (leakage from the capillary). Details of the ion source used during CLOUD13 are shown in panel (b). The primary ions are guided towards the sample flow using a counter electrode (Electrode 1). Additionally, a funnel is used to accelerate the primary ions towards the sample flow. A second electrode (Electrode 2) is installed directly in front of the pinhole of the mass spectrometer. The ions enter the mass spectrometer through a capillary on the top of Electrode 2.
2.1 CLOUD chamber
The measurements presented here were carried out at the CLOUD (Cosmics Leaving OUtdoor Droplets) chamber at CERN (European Organization for Nuclear Research) during fall 2017 (CLOUD12 campaign) and fall 2018 (CLOUD13). The CLOUD chamber is used to investigate new particle formation from different trace gas mixtures under controlled atmospheric conditions of temperature, relative humidity, ultraviolet (UV) light intensity and ionization (Kirkby et al., 2011; Kupc et al., 2011; Duplissy et al., 2016). The cylindrical stainless-steel chamber has a volume of 26.1 m3. It is designed to ensure that trace gas contaminants are low enough to allow for precisely controlled nucleation experiments (Kirkby et al., 2016). The chamber is continuously flushed with synthetic air generated from liquid nitrogen and oxygen. The temperature and relative humidity of the air inside the chamber can be precisely controlled. For the present study, ammonia and dimethylamine from gas bottles were injected by a two-step dilution system (Simon et al., 2016; Kürten et al., 2016a). The calibration of the water cluster CI-APi-TOF with ammonia (Fig. 1) was carried out while the instrument was disconnected from the chamber. For the calibration measurements, the two-step dilution system from the CLOUD chamber was replicated (Fig. 1 and Sect. 2.2).
Iodine is introduced into the chamber by nitrogen flowing over solid, molecular iodine (I2, 99.999 % purity; Sigma-Aldrich) placed in a stainless-steel evaporator immersed in a water bath at 303 K, with a temperature stability near 0.01 K. The generation of iodine-containing species for new particle formation is initiated by the photolysis of I2 in the CLOUD chamber in the presence of ozone and water. Measurements presented here were carried out at chamber temperatures between 223 and 298 K, with relative humidity (RH) ranging between 10 % and 90 %. A Pt100 sensor string measured the air temperature in the CLOUD chamber (Dias et al., 2017).
A chilled dew-point mirror (Edgetech Instruments) measured the dew point inside the CLOUD chamber. The relative humidity is derived from water vapor pressure formulations published by Murphy and Koop (2005). Additionally, the RH was measured by a tunable diode laser system (TDL) developed by the Karlsruhe Institute for Technology (KIT), which was installed in the midplane of the chamber (Skrotzki, 2012). The relative humidity was derived using the mean value of both instruments, with a combined measurement uncertainty of 5 %.
2.2 Water cluster CI-APi-TOF
The selective detection of ammonia and amines by atmospheric pressure chemical ionization using positively charged water clusters has been demonstrated previously (Hanson et al., 2011). The same ionization technique is used in the present study. The reagent and product ions are measured with an atmospheric pressure interface time-of-flight mass spectrometer (APi-TOF), which is coupled with a newly designed cross-flow chemical ionization (CI) source operated at ambient pressure (Fig. 1). The reagent ions, i.e., protonated water clusters ((H2O)nH3O+), are generated by positive corona discharge in the presence of argon (95 %), oxygen (5 %) and water vapor. The water vapor is added by bubbling the argon through a stainless steel humidifier (containing about 1 L of Millipore purified water) held at ambient temperature near 20 ∘C. As suggested by Hanson et al. (2011), a few droplets of sulfuric acid were added to the water in order to minimize potential contamination with ammonia from the water supply. Flow rates of 2.5 standard liters per minute (slm) for argon and 0.1 slm for oxygen were used. All flow rates were controlled by calibrated mass flow controllers (MFCs). A conversion factor for the measured argon flow (provided by the MFC manufacturer) was applied. Initially we used nitrogen instead of argon for the flow that passes the corona needle, but this resulted in much higher ammonia backgrounds. This is likely due to NH3 production in the corona plasma when nitrogen is present (Haruyama et al., 2016). Furthermore, the addition of oxygen is necessary for the generation of a stable corona discharge in positive mode when using argon as the main ion source gas (Weissler, 1943).
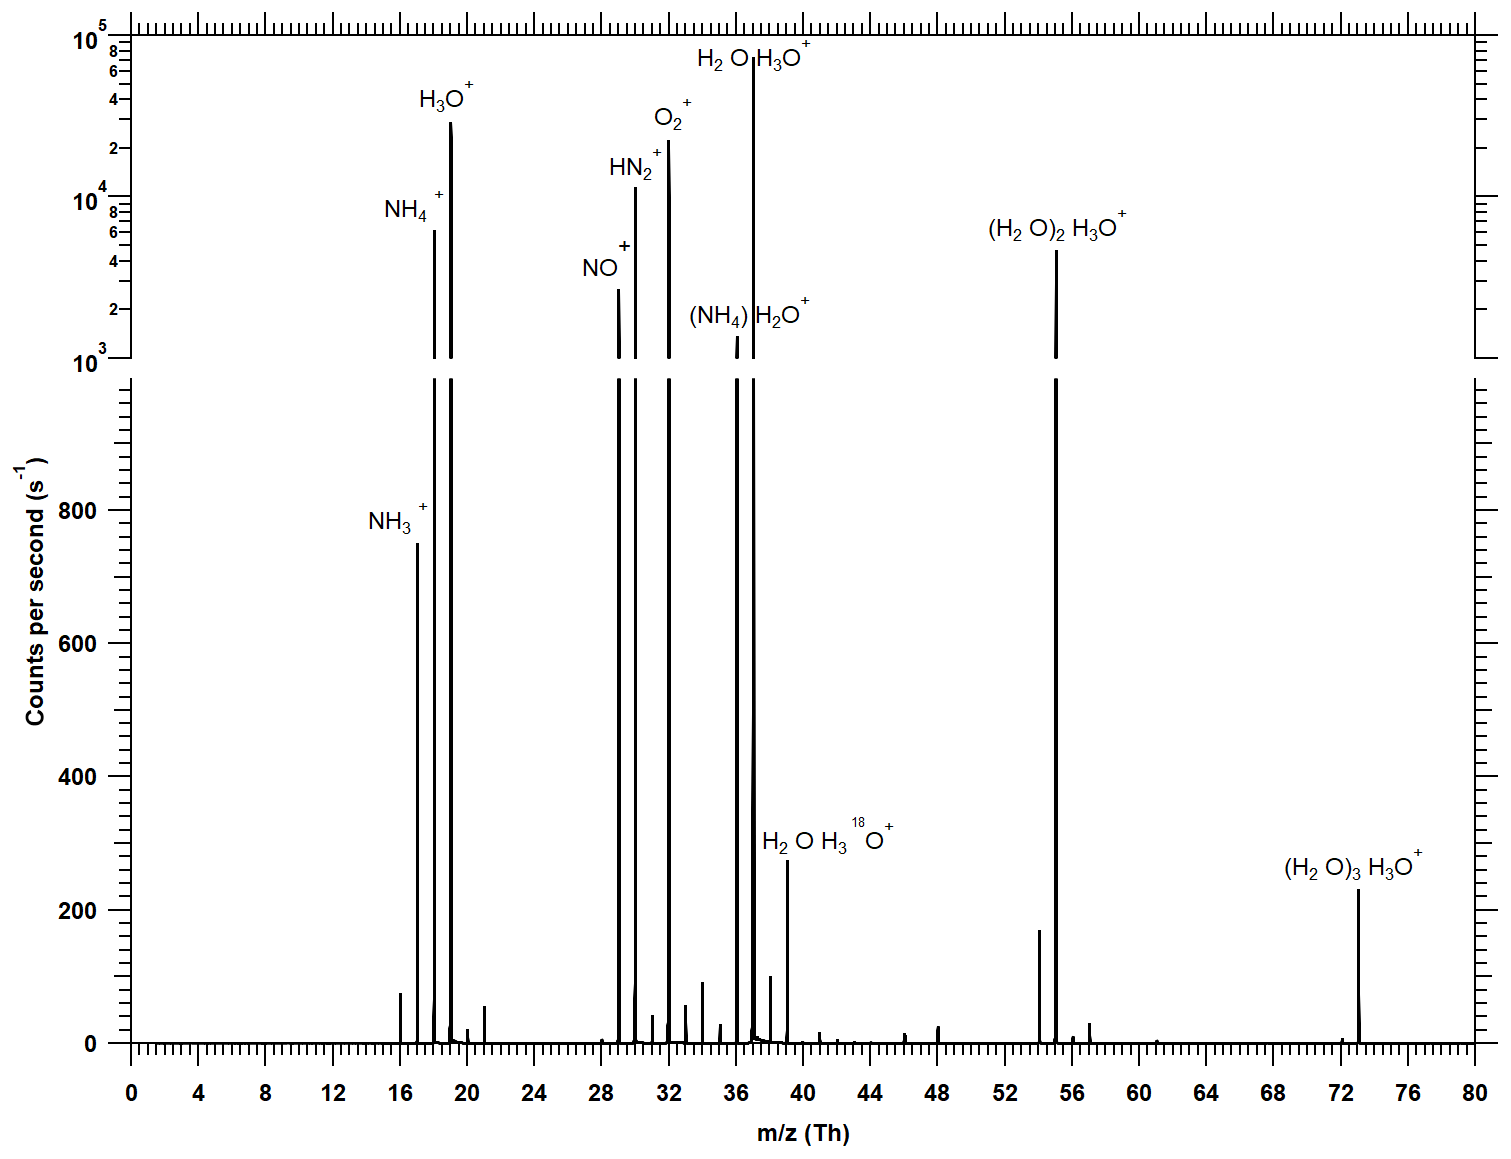
Figure 2Typical mass spectrum recorded with the water cluster CI-APi-TOF when about 10 ppbv of ammonia is added during a calibration. Signals below 1000 counts per second are shown on a linear scale, while the dominant signals (> 1000 cps) are shown on a logarithmic scale. To calculate the ammonia mixing ratio, the product ion signals ( and (H2O)) are normalized against the most prominent reagent ion signals (H3O+, (H2O)H3O+, (H2O)2H3O+, (H2O)3H3O+). Larger water clusters are probably also present in the ion–molecule reaction zone, but a significant fraction of water evaporates upon crossing the pinhole at the atmospheric pressure interface of the instrument. Background peaks from N2H+, NO+ and are always present but are neglected in the data evaluation. Due to the short reaction time (< 1 ms) in the ion–molecule reaction zone, the count rates of the reagent ions dominate the spectrum even at high ammonia mixing ratios near 10 ppbv.
Protonated water is also used in proton-transfer-reaction mass spectrometry (PTR-MS), which has been described in numerous publications (Good et al., 1970; Kebarle, 1972; Zhao and Zhang, 2004; Hansel et al., 2018). A simplified reaction scheme leading to the formation of protonated water clusters is shown as follows (Sunner et al., 1988).
The PTR-MS operates its ion–molecule reaction (IMR) zone typically at low pressure (∼10 hPa) and uses an electric field (∼100 V mm−1) to break up water clusters so that mainly non-hydrated H3O+ ions remain. The use of charged water clusters ((H2O)n≥1H3O+ instead of H3O+) can increase the selectivity as water clusters have a much higher proton affinity compared to the water monomer (Aljawhary et al., 2013). However, due to their high proton affinity, ammonia and amines can still be detected according to the following reaction scheme:
where X represents the target substance that is ionized in the ion–molecule reaction zone (see below) and detected in the mass spectrometer. Since water molecules can evaporate in the atmospheric pressure interface of the mass spectrometer, some of the product ions are detected without water; e.g., ammonia is mainly detected as (see Fig. 2).
A schematic drawing of the calibration setup and the ion source is shown in Fig. 1. The gas mixture for the ion source is composed of argon, oxygen and water vapor. It is introduced from two lines placed in the opposite direction to each other at an overall flow rate of ∼2.6 slm (Fig. 1a). The electrodes of the ion source are displayed in red in Fig. 1b. The connection to the mass spectrometer is shown using blue. The 1′′ sampling line and the inlet (22 mm inner diameter) consist of stainless steel and are shown in green. Components used for insulation are shown in white. A total sample flow rate of ∼19.5 slm is maintained by a vacuum pump and a mass flow controller. The overall length of the sampling line connecting the CLOUD chamber and the ion molecule reaction zone is 1.3 m. A voltage of 3600 V is applied to the corona needle, while 500 V is applied to the conically shaped counter electrode (Electrode 1 in Fig. 1b) made of stainless steel. The housing of the ion source is made of polyether ether ketone (PEEK). The ion source gas and the generated reagent ions flow through a funnel (smallest inner diameter 2.5 mm) before they mix with the sample flow. A small capillary (inner diameter of 0.8 mm) is located opposite the funnel (Electrode 2 in Fig. 1b). The electric field between the counter electrode and the capillary (at ground potential) accelerates the ions towards the entrance of the mass spectrometer. The pinhole plate (pinhole inner diameter of 350 µm) and the capillary are in electric contact, and ∼0.8 slm flows through the capillary and the pinhole into the mass spectrometer. The measured product ions are generated in the ion–molecule reaction zone (IMR, yellow area in Fig. 1a) at atmospheric pressure. The dimension of the IMR is defined by the distance between the counter electrode and the capillary (∼16.4 mm). After passing the pinhole, the ions are transported through two quadrupoles (small segmented quadrupole – SSQ, big segmented quadrupole – BSQ) towards the detection region of the mass spectrometer (micro-channel plate – MCP; pressure is approx. hPa). The estimated reaction time is < 1 ms. This short reaction time allows for the measurement of high ammonia mixing ratios (up to ∼10 ppbv) without significant depletion of the reagent ions; this would be the case when using an ion source design for the measurement of sulfuric acid (Eisele and Tanner, 1993; Kürten et al., 2011), which is typically present at much lower concentrations than ammonia. The principle of a cross-flow ion source was introduced by Eisele and Hanson (2000), who used this technique to detect molecular sulfuric acid clusters. In more recent studies, this technique was used for the measurement of ammonia (Nowak et al., 2002, 2006; Hanson et al., 2011).
The measured volume mixing ratio (VMR; pptv) of detected compounds is derived from a calibration factor (C) and the sum of the product ion counts per second (pcs) normalized against the sum of the reagent ion counts per second (rcs) (Kürten et al., 2016b; Simon et al., 2016):
Equation (1) yields the VMR measured by the water cluster CI-APi-TOF as a function of the normalized counts per second (ncps). A calibration factor, C, which includes factors like the reaction rate and the effective reaction time, is required to convert the normalized counts per second to a mixing ratio. This factor can be derived from the inverse slope of a calibration curve (see Sect. 3.2). While Hanson et al. (2011) report a maximum for the water cluster distribution at the pentamer, the evaporation of water seems to be stronger in our instrument. The maximum signal in clean spectra is usually found for the water dimer ((H2O)H3O+; see Fig. 2), and a strong drop in the reagent ion signals is found beyond the tetramer ((H2O)3H3O+). Therefore, the sample quantification includes, using ammonia as an example, the product ions (H2O)n with n=0 and n=1 as well as the reagent ions (H2O)mH3O+ with m=0–3. Possible losses in the sampling line are not taken into account by the calibration factor (see Sect. 3.8 for a discussion of sampling line losses). The only compound for which a direct calibration is performed in the present study is ammonia (Sect. 2.3). When mixing ratios for dimethylamine are presented, the same calibration factor is used. This approach can introduce uncertainty, as the proton affinity and transmission efficiency differ for dimethylamine compared to ammonia. However, previous studies showed that the ionization efficiency from protonated water clusters is collision-limited for both ammonia and dimethylamine (Sunner et al., 1988; Hanson et al., 2011). The applicability of this approach is discussed in Sect. 3.9; it is estimated that the mixing ratios for dimethylamine are correct within a factor of ∼3.5.
2.3 Calibrations
2.3.1 Ammonia
During calibrations, ammonia was drawn from a gas bottle containing an NH3 mixing ratio, B, of 100 ppmv diluted in pure nitrogen (Air Liquide, ±5 % uncertainty for the certified NH3 mixing ratio). It was diluted in two steps, whereby MFCs (shown as Mn in Fig. 1a) are used to obtain different set points for the volume mixing ratio (Fig. 1a). During the second dilution step the mixture from the first dilution is injected into the center of the main sample flow (flow rate, Qsample). The theoretical VMRtheor is given by (Simon et al., 2016):
The flow of ammonia from the gas bottle is set by M1 (0.01 slm max.), whereas M2 (2 slm range) controls the flow of nitrogen for the first dilution step. The flow of diluted ammonia that is introduced into the sample flow is controlled by M3 (0.1 slm range). The calibration flow consists of the same synthetic air as used for the CLOUD chamber. The flow is provided by two MFCs that control a dry portion (M4) and a wet portion of the flow that has passed a stainless-steel water bubbler (M5, see Fig. 1). By adjusting M4 and M5 (both 50 slm range) the RH of the sample flow can be controlled in order to test whether a humidity dependence exists for Reaction (R4). Care is taken that the sum of M4 and M5 is always somewhat larger than Qsample. To avoid overpressure in the sampling line, the excess flow is vented through an exhaust before the sampling line.
Accordingly, the measured sample air consists of synthetic air (80 % nitrogen, 20 % oxygen) with an adjustable RH and ammonia mixing ratio. Results of the calibrations are discussed in Sect. 3.2.
Table 1Estimated limit of detection (LOD) for some compounds with high proton affinity and for iodic acid measured with the water cluster CI-APi-TOF. The LOD is derived by background measurements at the CLOUD chamber, where LOD (You et al., 2014). σ is defined as the standard deviation of the background signal. The detection limits are based on a measurement at 278 K and 80 % RH (1 min averaging time). The measured instrumental background mixing ratios (mean values) during this time period are also indicated.
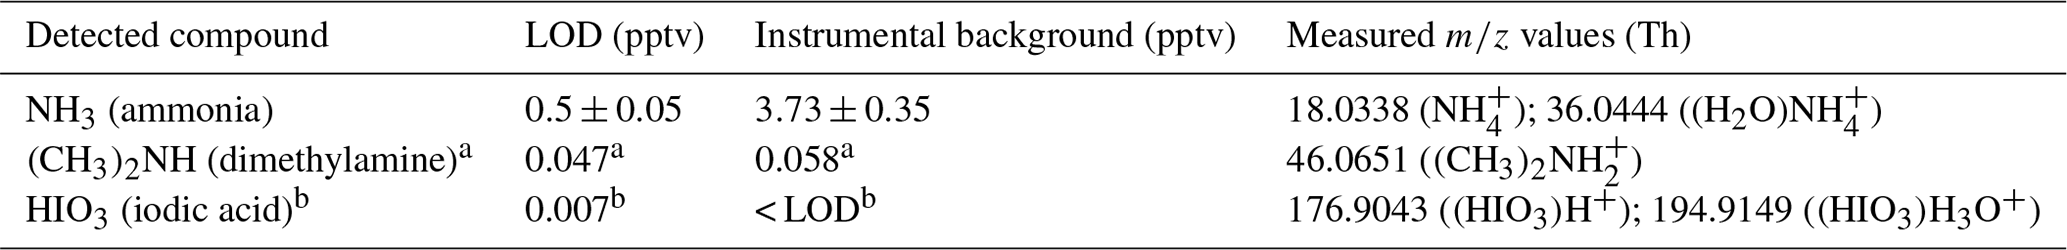
a Amine mixing ratios are estimated using the same calibration factor derived for ammonia. This can cause uncertainties. The applicability of this assumption is discussed in Sect. 3.9. b Iodic acid mixing ratios are derived from an intercomparison with a nitrate CI-APi-TOF, which evaluates HIO3 based on a calibration factor derived for sulfuric acid. This assumption can lead to uncertainties but is necessary because no direct calibration method exists for such low gas-phase HIO3 concentrations.
2.3.2 Iodine oxides
The water cluster chemical ionizer is also effective for iodine-containing species, which were detected in new particle formation experiments from I2 photolysis during CLOUD13. Prominent signals of iodic acid ( and ) were observed among many iodine compounds (Sect. 3.6 and Table 2). These species can be unambiguously identified due to the large negative mass defect of the iodine atom and the high resolution (> 3000 Th Th−1) of the mass spectrometer. No direct calibration for HIO3 was performed; however, a second chemical ionization mass spectrometer at CLOUD, using nitrate reagent ions (nitrate CI-APi-TOF), was also measuring HIO3 simultaneously. Therefore, a calibration factor for HIO3 has been derived by scaling concentrations measured by the nitrate CI-APi-TOF, which itself had been calibrated for sulfuric acid (Kürten et al., 2012). We further assume that both sulfuric and iodic acid are detected with the same efficiency by the nitrate CI-APi-TOF. This assumption introduces uncertainty when estimating the detection limit of HIO3. However, as the reaction of sulfuric acid with nitrate ions is at the kinetic limit (Viggiano et al., 1997), the detection limits shown here based on this assumption can be seen as lower limits. Unfortunately, there is currently no direct calibration technique established for iodic acid in the gas phase. The assumption we use in the present study was also applied in a previous study for deriving gas-phase concentrations of iodic acid (Sipilä et al., 2016).
For the instrument intercomparison (and the indirect calibration of the water cluster CI-APi-TOF), 18 different CLOUD experimental runs were selected and mean values were calculated for different steady-state concentrations. We took six steady-state concentrations each at temperatures of 263 K (80 % RH) and 283 K (40 % RH and 80 % RH).
Table 2Iodine-containing compounds (atomic composition), together with their m∕z values, identified in the water cluster CI-APi-TOF spectra during the CLOUD13 campaign.

2.4 PICARRO
A PICARRO G1103-t NH3 analyzer (PICARRO Inc., USA) measuring ammonia mixing ratios based on cavity ring-down spectroscopy was also connected to the CLOUD chamber during CLOUD12 and CLOUD13. The instrument is suitable for real-time monitoring of ammonia in ambient air and has been presented in previous studies (Bell et al., 2009). The G1103-t was installed at the CLOUD chamber with its own sampling line coated with Sulfinert (Restek GmbH, Germany), and the coating reduced the losses of ammonia to the sampling line walls considerably. Since the PICARRO has a rather small sample flow rate (< 1 slm), an additional pump was used to enhance the flow rate to 5 slm just before the instrument inlet. This was done in order to minimize line losses and to shorten the response times. How much these measures helped with the measurements was, however, not quantitatively tested (Sulfinert and increased flow rate). The PICARRO was also independently calibrated with an NH3 permeation tube (Fine Metrology, Italy) using a multigas calibrator (SONIMIX 6000 C1, LNI Swissgas, Switzerland). The time interval for one measurement of the PICARRO is 5 s for which a lower detection limit of 200 pptv is specified (PICARRO Inc., USA; Martin et al., 2016). By using the same method (at the same time period) as for the water cluster CI-APi-TOF (see Sect. 3.5), we derive a detection limit of 366.2 pptv for the PICARRO unit used in our study during CLOUD13. The detection limit derived for the PICARRO used during the CLOUD12 experiments is 170.1 pptv.
3.1 Main peaks in spectrum
Figure 2 shows a typical spectrum during calibrations, whereby 10 ppbv of ammonia is injected (40 % RH, ∼293 K). The most prominent primary ions are H3O+, (H2O)H3O+ and (H2O)2H3O+. The dominant primary ion is (H2O)H3O+. The water tetramer ((H2O)3H3O+) is usually the largest water cluster that can be detected. The addition of ammonia generates and (H2O); a small signal from is also visible. At low ammonia concentrations the signal from has a similar magnitude as H2O+ (which may arise from reactions of and H2O). Since these ions have the same integer mass, high mass-resolving power is essential to reach low detection limits for ammonia as otherwise the differentiation between the two signals is not possible. At low mass, the APi-TOF used in the present study has a resolving power of ∼2000 Th Th−1, which is sufficient to separate the two peaks. For the analysis of the spectra, the software TOFWARE is used that allows for analyzing high-resolution spectra (Stark et al., 2015; Cubison and Jimenez, 2015; Timonen et al., 2016). Prominent peaks from N2H+, NO+ and are also seen (Fig. 2). It is not clear how these ions are formed and why they survive the relatively long reaction time of ∼1 ms since Good et al. (1970) report that reacts rapidly away in moist air. For the analysis the presence of these background peaks is currently ignored and they are not counted as reagent ions (in Eq. 1) as we have no indication that they interact with the target species relevant for the present study. An exception could be (possibly from the reaction of and NH3); however, is not considered and is only a small fraction of .
In contrast to the spectrum shown in Fig. 2 with relatively small water clusters, Hanson et al. (2011) observe the highest signal in the water cluster distribution for the pentamer. We explain this difference with the more pronounced fragmentation and evaporation of ion clusters in the atmospheric pressure interface of our mass spectrometer.
For estimating an ammonia mixing ratio (Eq. 1), the product ion count rates are normalized to the dominating reagent ion count rates. Figure 2 shows that even at 10 ppbv ammonia the reagent ion signals are an order of magnitude higher than the product ion count rates. This indicates that very little reagent ion depletion occurs, and thus the normalized counts per second are linear with the ammonia VMR at least up to 10 ppbv (see Sect. 3.2).
3.2 Ammonia and iodic acid calibration
Figure 3 shows the calibration curves obtained for NH3 and HIO3 during the CLOUD13 campaign. Each dot represents the mean value of a steady-state measurement of at least 20 min. The normalized counts per second are based on the two highest signals assigned to the analyzed compound ( and (H2O) for ammonia and HIO3H+ and HIO3H3O+ for iodic acid). The total error of the mixing ratios (x axis) is calculated by Gaussian error propagation, taking into account the standard deviation of the flow rates from the mass flow controllers and the uncertainty of the ammonia gas bottle concentration. Since we obtained the mixing ratio shown in Fig. 3b by scaling the concentrations measured by a nitrate CI-APi-TOF calibrated for sulfuric acid, the error on the x axis equals the uncertainty of these measurements (estimated as a factor of 2 for the iodic acid concentration). The error on the y axis is given by the standard deviation of the normalized counts per second. We derive a calibration curve from a linear regression model using the Wilkinson–Rogers notation (Wilkinson and Rogers, 1973). The fit is forced through the origin; however, even when the fit is not constrained, the resulting slope is essentially the same (the results for the slopes and sensitivities differ by 1.35 %). The derived slopes represent the inverse of the calibration factor, C ( pptv at 40 % RH), in Eq. (2). Figure 3 shows that all measured mixing ratios lie in the area of the confidence intervals (95 % confidence intervals), and thus the linear model describes the dependency very well. The calibration was performed in September 2018, before the CLOUD13 campaign and also during and after the end of the campaign in December at relative humidities between ∼3 % and 82 % and at ambient temperatures of the experimental hall near 293 K. The calibrations for ammonia were performed by introducing the highest mixing ratio first. However, it took almost a day to reach stable signals as the tubing and the two MFCs through which the ammonia flowed (M1 and M3) needed to equilibrate. The further calibration points were then recorded by reducing the flow rate of M3. In this way, no change in the ammonia mixing ratio inside the capillary before the main sampling line and in the MFCs was necessary. This allowed for a relatively fast stepping through the calibration set points. However, even when the ammonia flow was shut off there was still significant diffusion of ammonia from the capillary into the sampling line, which resulted in relatively high background values (with nominally zero NH3). We therefore derived the limit of detection by measuring the ammonia background in the CLOUD chamber with the calibration lines disconnected from our instrument (Sect. 3.5). During the calibrations, the relative humidity was calculated by assuming that the sample flow passing the water reservoir is 100 % saturated (Fig. 1a). For the calibrations carried out after the campaign, the temperature of the total sample flow was measured to derive the absolute humidity. The calibration points in Fig. 3 were taken at measured gas flow temperatures of 288 to 290 K. The relative humidity was set to 40 % RH by adjusting the dry and wet flow rates for the sample flow; these conditions correspond to an absolute humidity of ∼0.0057 kg m−3. The calibration factor derived for CLOUD12 (for ammonia) differs from the calibration factor shown here. This is due to a different ion source (designed for a 0.5′′ sampling line in CLOUD12 compared with a 1′′ line in CLOUD13), a different sample flow rate and different tuning of the CI-APi-TOF.
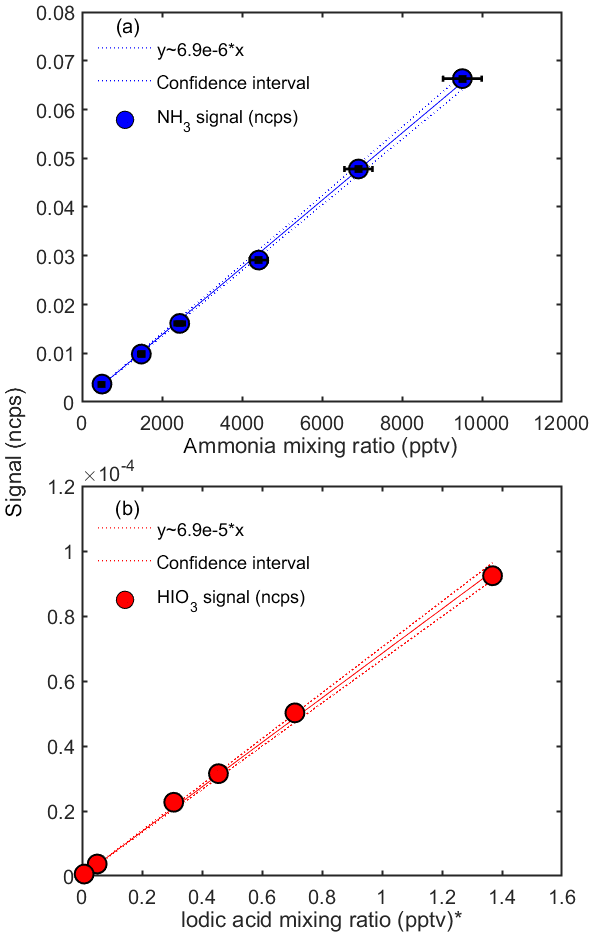
Figure 3Calibration curves for ammonia (a) and iodic acid (b) at 40 % relative humidity. The y axes show the normalized counts per second (ncps) measured with the water cluster CI-APi-TOF. The ammonia mixing ratios are determined from the calibration setup, and the iodic acid mixing ratios are taken from simultaneous measurements with a nitrate CI-APi-TOF at the CLOUD chamber. The systematic uncertainty of the iodic acid mixing ratios is estimated as (Sipilä et al., 2016). The inverse slopes from the linear fits yield the calibration factors (see Eqs. 1 and 2). * Note that the iodic acid mixing ratio is derived by applying a calibration factor for sulfuric acid to the nitrate CI-APi-TOF data.
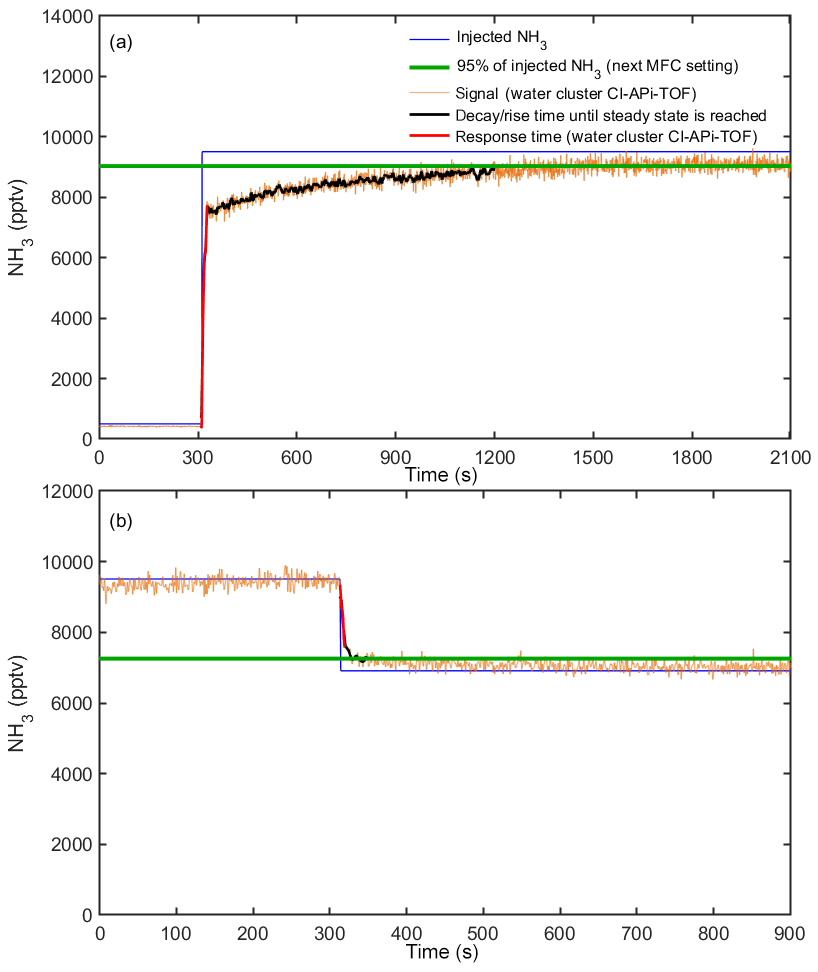
Figure 4Response time of the water cluster CI-APi-TOF during calibrations at 60 % RH. The injected ammonia mixing ratio from MFC settings is shown by the blue line. The signal of the water cluster CI-APi-TOF is shown by the orange line (here the data are shown with a 1 s time resolution; i.e., no time averaging is applied). The green line represents 95 % of the mixing ratio being applied with the next MFC setting. The black line shows the response time until a steady state (a) or 95 % of the final measured concentration is reached (b). The response time is the sum of the response time of the water cluster CI-APi-TOF (red line) and the (slower) response time for the lines to reach a steady state at which the walls are conditioned.
3.3 Response times
The response time of the water cluster CI-APi-TOF is defined as the characteristic time needed for the instrument to react to changes in the ammonia mixing ratio. We define the response time as the time required for the instrument to reach 95 % of the new mixing ratio being injected. The response time takes into account two processes. It includes both the response time of the instrument (“instrumental response time”) and the time for the lines to reach a steady state for ammonia delivery (“line response time”). Figure 4 indicates the typical response times of the water cluster CI-APi-TOF during calibrations (here at 60 % relative humidity). It shows a decay between two calibration steps when the injected ammonia is reduced from 9509 to 6911 pptv and a rise in the signal when the ammonia mixing ratio is increased from 500 to 9509 pptv. Panel (a) indicates a clear difference between the fast instrumental response time (red line) and slower line response time (black line). While we expect a similar behavior in instrumental response time for a decay from 9509 to 500 pptv, a longer line response time is expected due to reevaporation of ammonia from the sampling lines. Thus, the mixing ratios were gradually reduced during calibrations. The instrumental response time shown in Fig. 4 is 6 s for a decay in mixing ratio (9509 to 6911 pptv) and 18 s for a rise (500 to 9509 pptv). The line response time is 37 s (decay) and 890 s (rise). The experiments were repeated several times at varying relative humidities. The instrumental response time only varied by a few seconds during our experiments (between 6 and 10 s for decay and 18 to 25 s for a rise). While the variation in instrumental response time is small, the line response time can vary strongly depending on precursor conditions and relative humidity. During our experiments, the line response time varied between 37 and 54 s (decay) and between 535 and 890 s (rise). Interactions of ammonia with the sampling line are discussed in Sect. 3.8.
3.4 Influence of the humidity on the sensitivity
Figure 5 shows the sensitivity of the ammonia measurements to relative humidity. These data are derived from calibration curves similar to that in Fig. 3a. During the calibrations the humidity was changed by adjusting the dry and wet sample flow rates. For all conditions has the highest product ion count rate. However, the ratio of the signals for (H2O) and increases with humidity and sensitivity. A possible explanation for the observed sensitivity dependence could be increased collision rates at high humidity at which larger water clusters are present. In addition, the detection efficiency as a function of the ion mass can vary depending on the voltages applied to the ion source and the APi section, as well as the time-of-flight region of the mass spectrometer. Thus, the mass spectrometer does not have a constant detection efficiency over the full mass range (Heinritzi et al., 2016). A higher detection efficiency at m∕z 36 ((H2O)) compared with m∕z 18 (), together with the higher fraction of (H2O) compared with , at high humidity could explain some of the observed effect. However, the observed increase in sensitivity is modest (increase by a factor of ∼2.5 when the humidity increases by a factor of 10). Nevertheless, the effect is taken into account by using the measured relative humidity inside the CLOUD chamber (see Sect. 2.1) to correct the derived ammonia mixing ratio. The effect of temperature on the sensitivity could not be tested during a dedicated calibration experiment as our calibration setup was not temperature-controlled. However, during a transition from 298 to 248 K in the CLOUD chamber and constant ammonia injection, no significant change in the measured ammonia was observed, which indicates a weak influence of temperature.
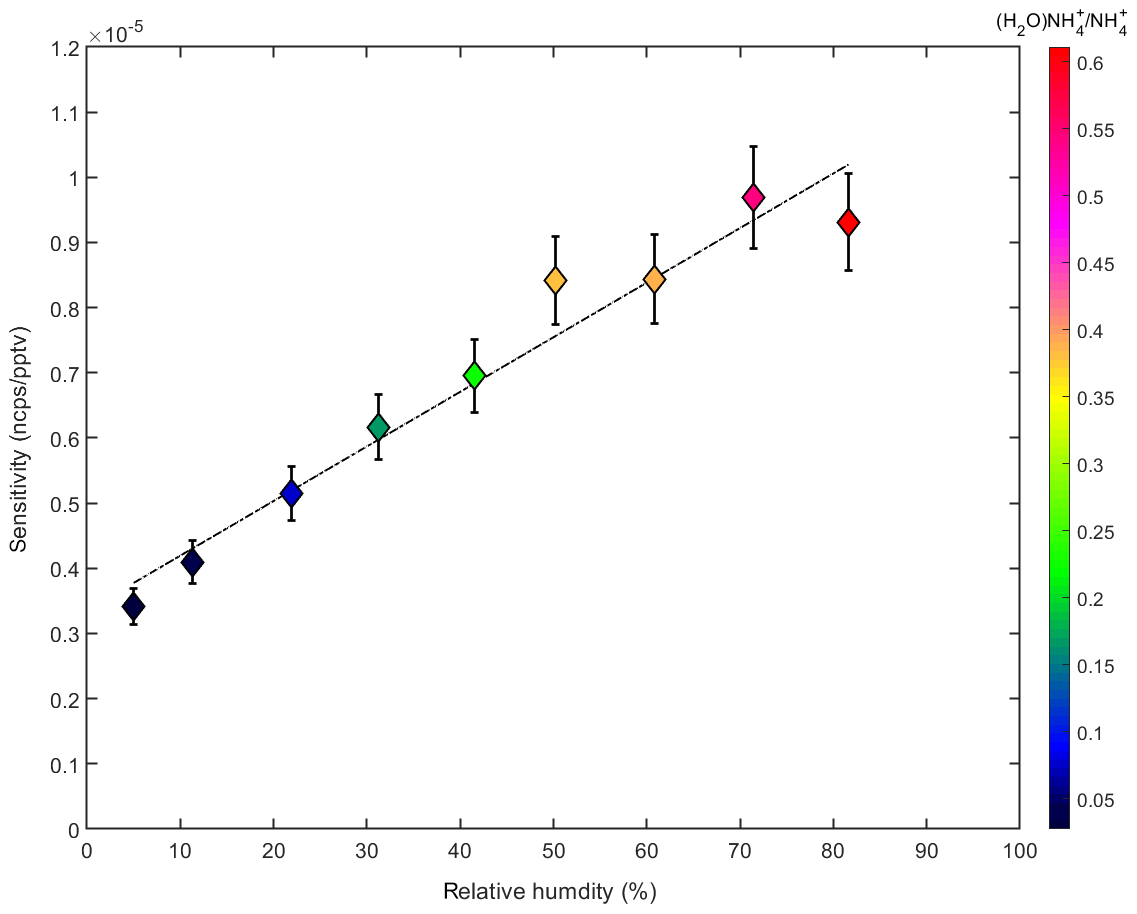
Figure 5Dependency of the ammonia sensitivity as a function of the relative humidity (%). A linear increase with relative humidity is observed, which tracks an increase in the ratio of the (H2O) and ion signals (indicated by the color code).
For iodic acid measurements, the sensitivity to relative humidity and temperature is different (Fig. 6). While , without any water molecule, is the dominant signal for ammonia, the highest iodic acid signal is , which is or . We observed an increasing sensitivity at lower temperatures, while the humidity dependency appears to be smaller compared to the ammonia measurements (Fig. 5). The higher counting rate of compared to indicates that iodic acid requires additional water in order to be associated with a positively charged ion. However, during the transition from ambient pressure to the vacuum of the mass spectrometer, water molecules can evaporate and leave in a nonequilibrium state. Besides the observation of iodic acid, additional signals from iodine-containing species can be found in the spectra. These compounds are listed in Table 2. Elucidating the exact formation pathways of these ions and the corresponding neutral species is a subject for future work.
3.5 Detection limits and instrumental backgrounds
Determining the limit of detection (LOD) for ammonia is complicated by changes in the observed background signal. During the calibrations a relatively high background was measured, which decreased slowly after the ammonia flow through the capillary was shut off. A typical value reached a couple of minutes after the ammonia flow was turned off is ∼30–60 pptv. When the water cluster CI-APi-TOF was connected to the CLOUD chamber the NH3 signals usually fell more rapidly when no ammonia was actively added. However, even under these conditions the ammonia was not zero and the measured signal changed when the RH or temperature of the chamber was adjusted, indicating the release of ammonia from the chamber walls. The ammonia contaminant level of the CLOUD chamber was previously determined to be several parts per trillion by volume at 278 K and 38 % RH (Kürten et al., 2016a). During CLOUD13 the measured ammonia background was 3.7 pptv at 278 K and 80 % RH, which confirms the previous estimate made with less sensitive ammonia instrumentation. The measured background also includes any contamination in the sampling line of the instrument. Another source of background ammonia could be the ion source. During the early stages of our development we used nitrogen instead of argon as the main ion source gas. This led to ammonia backgrounds of several hundred parts per trillion by volume since ammonia can be generated by the nitrogen plasma from the corona tip when it mixes with the humid sample flow (Haruyama et al., 2016). Replacing nitrogen with argon sharply decreased the background ammonia signals. Nevertheless, traces of nitrogen-containing gases in the ion source could potentially contribute to the ammonia background. However, the ammonia background is reduced at lower chamber temperatures, which argues against the ion source being a significant source of ammonia, since it is always at ambient temperature.
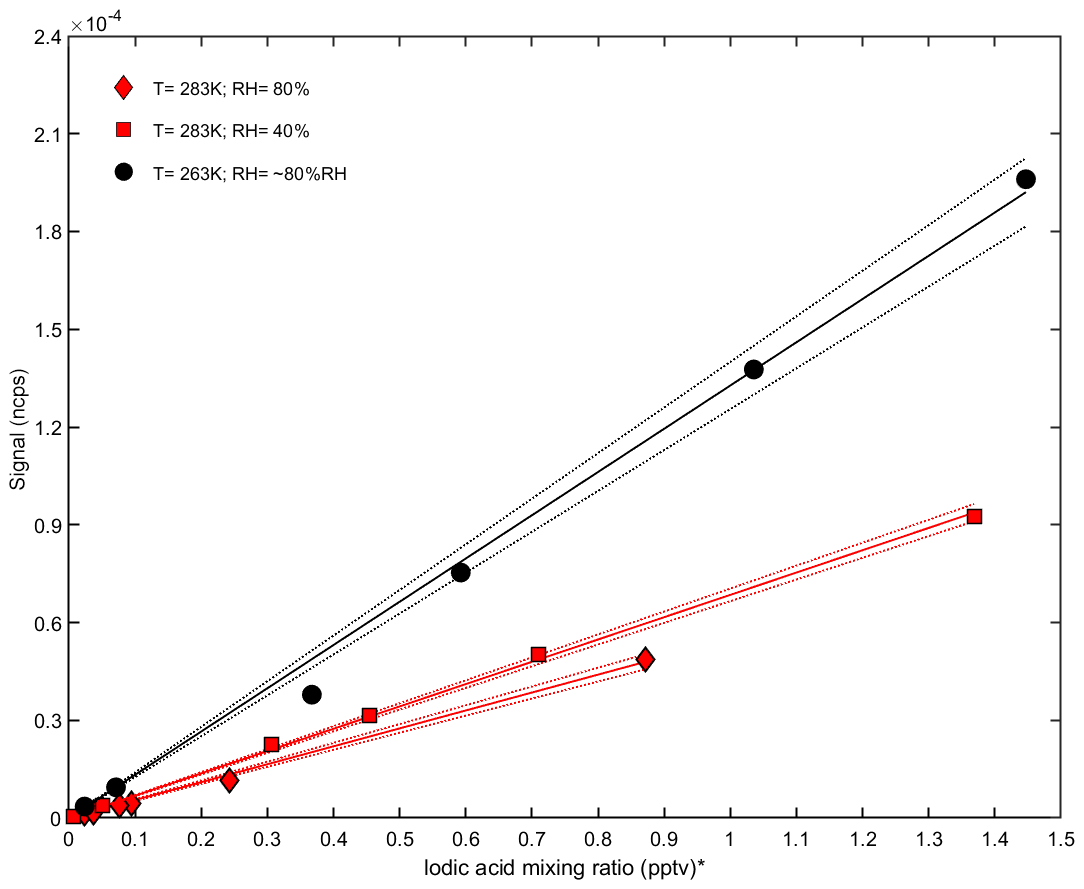
Figure 6Calibration curves for iodic acid at different relative humidities and temperatures in the CLOUD chamber. The normalized counts per second (y axis) are shown against the iodic acid mixing ratio measured with a nitrate CI-APi-TOF (x axis). The sensitivity increases at lower temperatures (black line), while no strong dependency on relative humidity is found at 283 K (red line). * Note that the iodic acid mixing ratio is derived by applying a calibration factor for sulfuric acid to the nitrate CI-APi-TOF data.
The LOD is defined as the additional ammonia mixing ratio that is necessary to exceed 3 standard deviations of the background fluctuations (You et al., 2014). This value corresponds to 0.5 pptv for an averaging time of 1 min. Assuming the same sensitivity as for ammonia and taking into account the background signals for the exact masses, we can estimate LODs for other compounds. Besides the calculated values for ammonia, Table 1 lists the estimated backgrounds and LODs for dimethylamine and iodic acid. High-resolution data are necessary to reach the LODs shown in Table 1 since several species may share the same integer mass. For example, for dimethylamine (exact mass of protonated compound at 46.0651 Th) other species like (45.9924 Th) or CH4NO+ (46.0287 Th) can interfere. For dimethylamine only the peak with the highest count rate is taken into account, since (C2H7N)H3O+ interferes with other compounds measured during the experiments, even with high-resolution data. In principle, the omission of the larger product ions (with one additional water molecule) should lead to a different calibration constant. However, the effect is small since for the measured bases, the ion signals with associated water are smaller than the products without the water molecule. The goodness of the assumption of using the same calibration constant for dimethylamine as that derived for ammonia is discussed in Sect. 3.9.
The instrumental background for NH3 is higher than the estimated backgrounds for the other compounds shown in Table 1. Ammonia is ubiquitous and hard to remove completely by water purification systems, so it can be introduced into the CLOUD chamber via the air humidification system. Nevertheless, the detection limit derived for ammonia is well below the LOD reported for other measurement techniques and instruments (von Bobrutzki et al., 2010; You et al., 2014; Wang et al., 2015). However, the performance of the water cluster CI-APi-TOF during atmospheric measurements remains to be tested. The dimethylamine level in the CLOUD chamber is mostly below the estimated LOD.
The estimated LOD of iodic acid is well below that of ammonia and dimethylamine (Table 1). We might explain this when looking at signals that could possibly interfere with the measured compounds. All compounds shown in Table 1 have an integer mass at which other signals are also detected, e.g., H2O+ at the nominal mass of ammonia or at the nominal mass of dimethylamine. For the high masses of the iodine-containing species, with their strong negative mass defects, these isobaric compounds are much less crucial. Additionally, iodic acid has a much lower vapor pressure compared with ammonia and is not emitted efficiently from surfaces at temperatures relevant for the present study. Therefore, much lower backgrounds can be expected even if the sampling line and the instrument were exposed to high concentrations before.
3.6 Iodine identified species during CLOUD13
The CI-APi-TOF measurements of HIO3 with positive water cluster ionization show excellent correlation with negative nitrate ionization (Fig. 3b). Furthermore, we were able to detect iodine-containing species at higher mass-to-charge ratios (e.g., iodine pentoxides) during several experiments. Figure 7 shows the detected iodine species when a high I2 concentration (∼50–100 pptv) was injected into the chamber (mean values over a duration of 120 min). The derived mean iodic acid mixing ratio is ∼0.98 pptv according to the measurements of the water cluster CI-APi-TOF. During this experiment, we observed compounds containing up to four iodine atoms. The size of the circles in Fig. 7 corresponds to the mean count rate of the signals on a logarithmic scale. For comparison, the intensities of the reagent ions are also shown. Table 2 lists the sum formulas of some identified iodine species.
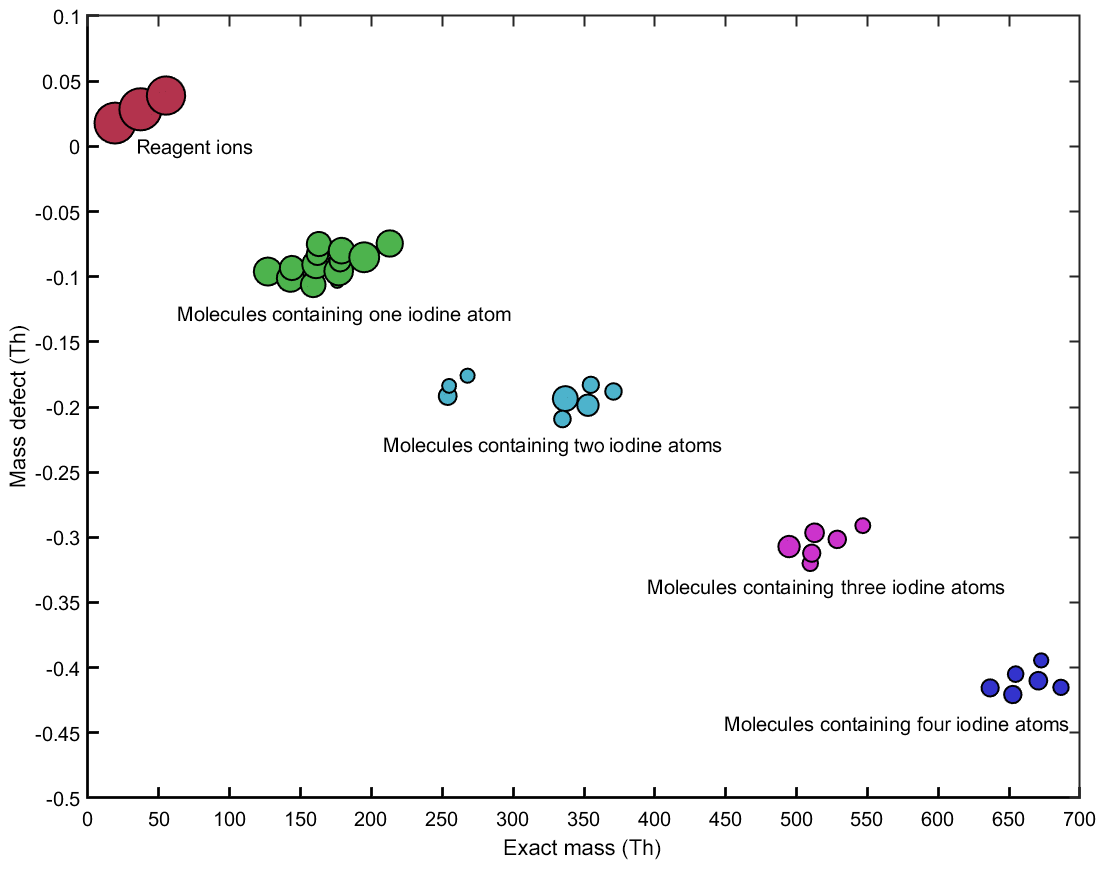
Figure 7Mass defect plot for the iodine compounds, as well as the most prominent reagent ions, during a CLOUD experiment on new particle formation from iodine. The estimated iodic acid mixing ratio is ∼0.98 pptv. The y axis shows the mass defects of the compounds (see Table 2 and the text for details), while the x axis shows the absolute masses. The size of the symbols is proportional to the measured signal intensities on a logarithmic scale (from to 14.04 ions s−1).
During some experiments, an electric field of about 20 kV m−1 was applied to the chamber to remove ions and study purely neutral (i.e., uncharged) nucleation. Even during these experiments the same signals as shown in Fig. 7 were present. This indicates that the water cluster CI-APi-TOF measures neutral compounds after ionizing them in the ion–molecule reaction zone. The present study only gives a short overview of the iodine signals measured with the water cluster CI-APi-TOF. Further CLOUD publications will focus on the chemistry of the iodine-containing species and on their role in new particle formation processes.

Figure 8Intercomparison between calculated (shaded blue area) and measured ammonia mixing ratios (PICARRO: solid green line; water cluster CI-APi-TOF: solid red line) at CLOUD. The PICARRO background (∼200 pptv) has been subtracted, while no background was subtracted from the water cluster CI-APi-TOF. The temperature inside the chamber is indicated by the dashed black line. The speed (percent of maximum, 397 revolutions per minute) of the two fans that mix the air inside the chamber is shown by the dashed blue line. The calculated ammonia mixing ratios (based on the calculated injection of ammonia into the chamber from the MFC settings) have a wide range due to uncertainties of the ammonia loss rate in the chamber. We display the maximum calculated range assuming, for the lower limit, that the chamber walls act as a perfect sink (wall loss dominated; 25 and 100 s lifetime for fan speeds of 100 % and 12 %, respectively) and, for the upper limit, no net uptake of NH3 on the walls and a loss rate determined by dilution (6000 s lifetime). For higher fan speeds, the lifetime decreases due to increased turbulence and, in turn, increased wall loss rate. Relative humidity is indicated by the orange line. The water cluster CI-APi-TOF reacts rapidly to changing conditions, such as the ammonia flow into the chamber, relative humidity, temperature or fan speed. At low concentrations, the ammonia lifetime is determined by the wall loss rate (panel b and initial stages of panel a). However, at high ammonia concentrations, the walls of the CLOUD chamber progressively become conditioned as a source of ammonia, with corresponding increases in the ammonia lifetime and the time to reach new equilibria at lower ammonia flow rates (later stages of panel a).
3.7 CLOUD chamber characterization
The performance of the water cluster CI-APi-TOF during CLOUD12 experiments with ammonia is shown in Fig. 8. We compare the derived mixing ratios with the measurements of the PICARRO. In addition, both can be compared with the range of ammonia mixing ratios expected from the MFC settings for ammonia injected into the CLOUD chamber, the chamber volume and the ammonia lifetime (see, e.g., Simon et al., 2016, and Kürten et al., 2016a, for the equations linking these quantities to the estimated CLOUD mixing ratios). While the injected ammonia can be determined to better than 20 % from the MFC settings, the ammonia lifetime in the chamber can span a wide range. For a very clean chamber or at very low temperatures the chamber walls represent a perfect sink and the ammonia has a short lifetime. A wall loss lifetime of 100 s at 12 % fan speed was previously reported by Kürten et al. (2016a). Measurements with sulfuric acid indicate a factor of 4 increase in the wall loss rate when the fan speed is changed from the nominal setting of 12 % to 100 %. Scaling these measurements to the ammonia measurements yields a wall loss lifetime of 25 s at 100 % fan speed. On the other hand, once the walls have been exposed for sufficient time with ammonia they reach an equilibrium at which condensation and evaporation rates are equal. Under these conditions, the ammonia lifetime is determined by the chamber dilution lifetime alone (6000 s), so the NH3 increases to higher equilibrium concentrations. Furthermore, the walls can act as a source of ammonia due to the reevaporation of ammonia molecules attached to the surface. This effect can be significant when the concentrations previously injected into the chamber were higher than the current concentrations. Thus, the estimated range can vary by a factor of ∼200 based on the chamber conditions. This wide range is indicated by the shaded areas in Fig. 8 (light blue).
Figure 8a shows the measurements of the water cluster CI-APi-TOF, the PICARRO and the calculated values for ammonia. The PICARRO trace is shown for the time when the detection limit (170.1 pptv during CLOUD12) is exceeded. The signal measured by the water cluster CI-APi-TOF follows the injected ammonia almost instantaneously (the first injection is on 23 October). The slower response time of the PICARRO can be explained by a combination of the longer sampling line (∼1.8 m compared to 1.3 m for the water cluster CI-APi-TOF) and the lower flow rate (∼1 slm with a core sampling of 5 slm compared with ∼20 slm for the water cluster CI-APi-TOF). After the flow of ammonia is shut off, both the mass spectrometer and the PICARRO show almost identical values as the chamber progressively releases ammonia from the walls. Before the first ammonia injection it can also be seen that the water cluster CI-APi-TOF shows progressively lower background ammonia values. Whether this is due to a gradual cleaning of the chamber, the instrument or the sampling line is unclear. Figure 8a also indicates the influence of temperature on the level of contaminant after ammonia had been injected into the chamber. When the chamber temperature falls from 298 to 278 K (shortly before 31 October) the contaminant NH3 decreases by around a factor of 5 due to the lower evaporation rate of ammonia from the chamber walls.
The influence of changing relative humidity can be seen in Fig. 8 between 29 and 30 October. Part of the change is due to the response of the water cluster CI-APi-TOF (Sect. 3.4). A second contribution arises since water molecules can displace adsorbed ammonia on surfaces (Vaittinen et al., 2014). This effect can be pronounced when the chamber walls have been conditioned with high ammonia concentrations. It is important to note that the instrument was characterized for humidity dependency during the following CLOUD13 campaign. While changes in sensitivity with relative humidity were taken into account during CLOUD13, this was not the case during CLOUD12. The observed increase in mixing ratios at this time is a combination of a change in sensitivity of the instrument and an increase in the gas-phase concentration of ammonia due to reevaporation from the walls of the CLOUD chamber. Here, the PICARRO trace can provide insight into the magnitude of both effects, indicating that the reevaporation from the chamber walls dominates over the change in sensitivity. In Fig. 8 during the early part of 25 October the PICARRO shows a steep increase in ammonia, while the water cluster CI-APi-TOF saturates near 20 ppbv due to depletion of the primary ions. It is important to note that other vapor concentrations were also high at this time, which contributed to the depletion of the primary ions. During CLOUD13, wherein an improved version of the ion source was used (Sect. 3.2), significant depletion of primary ions was only observed above 40 ppbv of ammonia.
Figure 8b shows how the ammonia mixing ratios vary with the mixing fan speed in the CLOUD chamber. The fan speed was varied between 12 % (default value) and 100 %. Since the temperature during these experiments was low (248 K), the chamber walls act as a fairly efficient sink for ammonia. Therefore, the measured mixing ratios respond promptly to the changing fan speed, indicating a change of almost a factor of 4 in ammonia. Moreover, the measurements coincide with the values calculated from the MFC settings, assuming wall loss lifetimes of 100 and 25 s at 12 % and 100 % fan speed, respectively. Due to its higher detection limit, the PICARRO is insensitive at these low mixing ratios (green line in Fig. 8b).
3.8 Ammonia wall loss rates in the sampling line
The largest uncertainty in the ammonia measurement is related to the sampling line losses. At CLOUD, the stainless-steel sampling lines have an inner diameter of 0.5′′ or 1′′ and 0.75 m total length (a 1′′ sampling probe was used for the water cluster CI-APi-TOF, and the instrument has a sampling line of 0.55 m total length). The tips are located 0.35 m from the chamber walls to avoid sampling air from the boundary layer. Thus, after connecting to the CLOUD chamber, the total length of the sampling line of our instrument is 1.3 m. For an ammonia diffusivity of 0.1978 cm2 s−1 (Massman, 1998) and a sample flow rate of 20 slm, the sample line penetration efficiency is estimated to be 33.7 % for a laminar flow (Dunlop and Bignell, 1997; Baron and Willeke, 2001; Yokelson, 2003). This means that if the walls of the sampling line act as a perfect sink, then the measured NH3 mixing ratios would need to be corrected with a factor of ∼3. However, it is quite likely that the sampling line does not always act as a perfect sink for ammonia due to partial reevaporation. Furthermore, interactions of ammonia with the inner walls of the sampling line depend on the humidity of the sampled air. Water on surfaces can affect the uptake or release of ammonia. Vaittinen et al. (2014) showed that increased humidity can displace ammonia from surfaces. Additionally, water on surfaces can allow weak acids and bases to dissociate into their conjugate compounds on the surface, thereby affecting the partitioning to the surface (Coluccia et al., 1987). Vaittinen et al. (2014) studied the adsorption of ammonia on various surfaces and found a value of 1.38×10¹⁴ molecule cm−2 for the surface coverage on stainless steel. For humid conditions this value is, however, significantly smaller and decreases to cm−2 for a water vapor mixing ratio of 3500 ppmv at 278 K. Eventually an equilibrium is reached between the condensation on and evaporation from the walls, depending on the ammonia mixing ratio, RH and temperature. At equilibrium, ammonia losses from the chamber are due to dilution alone, and ammonia losses in the sampling line are negligible. Furthermore, ammonia may reevaporate from the inlet line walls if saturation happened previously at higher concentrations. At CLOUD, the sampling lines are attached to the chamber and cannot easily be removed during the experiments. Thus, it is not possible to quantitatively distinguish between interactions with the surface of the sampling line and the surface of the CLOUD chamber. This complicates the evaluation of the influence of the sampling line regarding the measured ammonia. One practical solution would be to report averages of the values considering the wall loss correction factor and neglecting the factor.
Sampling line losses introduce up to a factor of 3 uncertainty in the ammonia measurement, corresponding to transmission efficiencies between 33.7 % and 100 % for walls that are a perfect sink and zero sink, respectively. Variable sampling efficiency is a general problem encountered for most ammonia measurements (e.g., Leifer et al., 2017). The uncertainty is smaller for larger molecules; e.g., the sampling efficiency for triethylamine (diffusivity of 0.067 cm2 s−1; Tang et al., 2015) is 61 %. For atmospheric measurements, we suggest using an inlet system in which a short piece of the 1′′ sampling line only takes the core sample flow from a large-diameter inlet. A blower can generate a fast flow in the large inlet to essentially reduce the losses for the core flow to zero before it enters the actual sampling line (Berresheim et al., 2000).
3.9 Measurement of dimethylamine
The same calibration factor as derived for ammonia was used to determine the mixing ratio of dimethylamine (Sect. 3.5 and Table 1). This assumption can lead to uncertainties as the sensitivity of the instrument is expected to depend on the proton affinity of the measured substance (Hanson et al., 2011). To estimate the validity of this assumption, we compared the mixing ratios measured by the water cluster CI-APi-TOF with the calculated mixing ratios for a period when dimethylamine was actively injected into the CLOUD chamber. A chamber characterization for dimethylamine was already conducted by Simon et al. (2016), wherein the wall loss lifetime was determined as 432 s for conditions in which the chamber walls acted as a perfect sink (12 % fan speed). Additionally, as discussed in Sect. 3.7, we use a lifetime of 108 s at 100 % fan speed (change of a factor of 4 when the fan speed is changed from 12 % to 100 %). The chamber dilution lifetime represents the maximum possible lifetime when wall loss would be negligible (Sect. 3.7). Thus, the wall loss lifetime used in this study gives a lower limit for dimethylamine mixing ratios in the CLOUD chamber. Figure 9a shows a period when dimethylamine was added to the chamber. Since it takes a certain time until the stainless-steel pipes of the gas dilution system are saturated with dimethylamine there is a short time delay between the switching of a valve that allows dimethylamine to enter the chamber and the rise in the measured dimethylamine mixing ratio. Once the lines are conditioned and the dimethylamine is homogenously mixed into the chamber, the measured and estimated mixing ratios are generally in good agreement with each other. The response to changes in fan speed is initially sharp but gradually weakens as the walls progressively adsorb more dimethylamine. To estimate the consistency of the approach of scaling the calibration factor derived for ammonia to estimate dimethylamine mixing ratios, we use the ratio between the mixing ratio calculated for the water cluster CI-APi-TOF and the calculated mixing ratios based on the wall loss lifetime for the CLOUD chamber. For these measurements, we estimated a wall loss rate in the sampling lines of ∼1.96 for dimethylamine, and a diffusivity of 0.1 cm2 s−1 was used (Freshour et al., 2014; Simon et al., 2016). The mean deviation between the estimated dimethylamine mixing ratio and the calculated mixing ratio is 3.48, indicating that the approach of scaling the calibration factor derived for ammonia introduces uncertainties within a factor of ∼3.5. The deviations at the end of the time series shown in Fig. 9a are caused by nucleation experiments in which high concentrations of other vapors are used. During these stages a significant uptake of dimethylamine on particles can explain the discrepancy between measured and expected dimethylamine. Figure 9b shows a measurement of the background dimethylamine in the chamber, measured over 5 d during CLOUD13. The mean background is ∼0.14 pptv at 50 % RH to 60 % RH and temperatures of 278 to 290 K. These are similar to the backgrounds measured at 80 % RH and 278 K (Table 1). The observed variations are in a range of ∼0.1 to 0.3 pptv provided that the measurement is not interrupted, e.g., due to the replenishment of the water source that humidifies the flow for generating the reagent ions (which explains the first drop of the background measurement in Fig. 9b). The estimated detection limits shown here are below or at similar levels compared to those reported in previous publications (You et al., 2014; Simon et al., 2016).

Figure 9Dimethylamine mixing ratios (magenta line) during the CLOUD13 experiment. The dashed black line shows the temperature inside the CLOUD chamber. The dashed blue line shows the fan speed. Panel (a) shows the dimethylamine signal during active injection into the chamber. The grey line indicates the dimethylamine mixing ratio in the chamber calculated from the MFC settings and the wall loss lifetime. The upper limit for the uncertainty in the dimethylamine mixing ratio is a factor of ∼3.5 (see the text for details). Panel (b) shows a measurement of background dimethylamine in the chamber over a period of 5 d, when there was zero dimethylamine flow. We consider this to be due to instrumental background and not to an actual dimethylamine background in the chamber. The thin red lines show the possible range of dimethylamine based on the scaled calibration factor (factor of 3.48, 95 % CI). The thick magenta line indicates a moving average of the dimethylamine background measurement. The water source was replenished during the period shown (green line). The mean instrumental background of dimethylamine over this period is ∼0.14 pptv. * Note that the dimethylamine mixing ratio is determined with the calibration factor for ammonia.
The present study demonstrates the successful application of a water cluster CI-APi-TOF during controlled chamber experiments to measure ammonia, dimethylamine and iodic acid. During experiments involving iodide, neutral clusters containing up to four iodine atoms were detected. The instrument has demonstrated unrivalled low detection limits for ammonia, as well as a fast time response and time resolution. We believe this instrument can readily be applied to atmospheric measurements. The amount of clean gas required for the corona tip (2 slm of argon and some oxygen) is rather small and can easily be supplied with gas bottles (one argon gas bottle of 50 L at 200 bar should last about 3 d). At CLOUD there is a restriction regarding the maximum sample flow that can be drawn from the chamber. During atmospheric measurements much higher flow rates can easily be realized. Therefore, the suggested design of the inlet system using a blower and a core sample inlet should be used (Sect. 3.8). Furthermore, the use of an internal calibration standard would be beneficial. We have tried to add a defined mixing ratio of ND3 to the sample flow. However, besides the expected signal at (ND3H+, m∕z 21) further signals corresponding to , NDH3+ and were also present due to deuterium–hydrogen exchange, which makes this method unsuitable. The use of 15NH3 for calibration is also unsuitable since the signal is hard to distinguish from the comparatively high H3O+ signal at the same integer mass even for a high-resolution mass spectrometer.
Roscioli et al. (2016) demonstrated that the addition of 1H,1H-perfluorooctylamine to the sample flow can be used to passivate an inlet, which reduces sampling line losses and sharpens the time response for ammonia measurements. Recently, Pollack et al. (2019) implemented this passivation technique for ambient measurements on an aircraft. For these measurements, a tunable infrared laser was used (TILDAS-CS, Aerodyne Inc.). We tested this passivation technique but found it unsuitable for our instrument; the high mixing ratio of 1H,1H-perfluorooctylamine (∼100 ppm to 0.1 % injection into the sample flow) that is required led to excessive consumption of the reagent ions since 1H,1H-perfluorooctylamine has a high proton affinity and is therefore also efficiently ionized by the protonated water clusters. For this reason, the passivation technique for the measurement of ammonia can in our opinion only be used with spectroscopic techniques as was the case in the studies by Rosciolli et al. (2016) and Pollack et al. (2019).
We have described the design and performance of a novel water cluster chemical ionization–atmospheric pressure interface time-of-flight mass spectrometer (CI-APi-TOF) for measurements of ammonia, amines (dimethylamine) and iodine compounds. The instrument includes a new home-built cross-flow ion source operated at atmospheric pressure. The protonated water clusters ((H2O)n≥1H3O+) selectively ionize compounds of high proton affinity at short reaction times. The instrument's response is linear up to a mixing ratio of at least 10 ppbv for ammonia when the derived calibration factor is applied to the normalized counts per second. The water cluster CI-APi-TOF was operated at the CLOUD chamber where very low background ammonia mixing ratios were measured (ca. 4 pptv at 278 K). The limit of detection (LOD) was estimated as 0.5 pptv for NH3. To our knowledge, such a low detection limit for ammonia measurements is unprecedented. We attribute the low LOD mainly to the use of ultraclean argon (5.0 purity) as the main ion source gas for the reagent ion generation. Much higher background NH3 was observed when nitrogen was used instead of argon. The instrument shows some sensitivity to the relative humidity of the sample flow (factor of 3 increase in the signal from 5 % to 80 % RH). However, this can readily be measured and corrected. We did not explicitly demonstrate the quantitative measurement of diamines (and amines other than dimethylamine) in the present study but the instrument should also be well-suited for such measurements.
During experiments involving iodine, it was observed that the protonated water clusters can also be used to detect various iodine compounds. A total of 29 different iodine-containing compounds were identified, including iodic acid (HIO3) and neutral clusters containing up to four iodine atoms. The water cluster CI-APi-TOF was cross-calibrated against a nitrate CI-APi-TOF measuring iodic acid. The two instruments showed exactly the same time-dependent trends. As there is no established calibration method for iodic acid, detection limits have been derived under the assumption that HIO3 is measured with the same efficiency as sulfuric acid, for which the nitrate CI-APi-TOF was calibrated. In this way, we estimated the LOD for iodic acid in the water cluster CI-APi-TOF to be 0.007 pptv.
Future studies will focus on the evaluation of the iodine signals and also on further signal identification in the mass spectra. Laboratory and ambient measurements indicate the increased importance of ammonia for new particle formation and growth in both pristine and polluted environments. Due to the instrument characteristics, we plan to apply the method to ambient atmospheric measurements to study the influence of ammonia, amines, diamines and iodic acid on new particle formation.
The water cluster CI-APi-TOF technique is also well-suited for airborne measurements in the upper troposphere, where fast response times and low detection limits are vital (Höpfner et al., 2016).
Data for Figs. 2–9 and for Table 1 are available at https://doi.org/10.5281/zenodo.3831469 (Pfeifer et al., 2020). Further data are available upon request.
All authors contributed to the scientific discussion and interpretation of the results. JP, AK, LW and FP contributed to the design of the ion source presented in this study. JP, AK, MS, MH, MG, TM and SB collected the data at the CLOUD chamber. DW installed and operated the PICARRO unit used at the CLOUD chamber. AK and JC led the composition of the paper. JK contributed to the scientific discussion and interpretation of the results.
The authors declare that they have no conflict of interest.
This article is part of the special issue “The CERN CLOUD experiment (ACP/AMT inter-journal SI)”. It is not associated with a conference.
We would like to thank CERN for the support of CLOUD with financial and technical resources. We thank the PS/SPS team from CERN for providing the CLOUD experiment with a particle beam from the proton synchroton. We also want to thank Louis-Philippe De Menezes for providing us with a mass flow controller used during the calibrations. In addition to this, we would like to thank Robert Sitals, Timo Keber, Serge Mathot, Hanna Elina Manninen, Antti Onnela, Stefan Karl Weber and Robert Kristic for their contributions to the experiment. The discussion with Xucheng He during the creation of the paper is gratefully acknowledged. We thank Christoph Hüglin for providing us with the PIARRCO and its calibration unit. This work was funded by the German Federal Ministry of Education and Research under CLOUD-16 (no. 01LK1601A), EC Horizon 2020 MSCA-ITN under CLOUD-MOTION (no. 764991), and the EC Seventh Framework Programme MC-ITN under CLOUD-TRAIN (no. 316662).
This research has been supported by CLOUD-MOTION (grant no. 764991), CLOUD-16 (grant no. 01LK1601A), and CLOUD-TRAIN (grant no. 316662).
This paper was edited by Jonathan Abbatt and reviewed by two anonymous referees.
Aljawhary, D., Lee, A. K. Y., and Abbatt, J. P. D.: High-resolution chemical ionization mass spectrometry (ToF-CIMS): application to study SOA composition and processing, Atmos. Meas. Tech., 6, 3211–3224, https://doi.org/10.5194/amt-6-3211-2013, 2013.
Almeida, J., Schobesberger, S., Kürten, A., Ortega, I. K., Kupiainen-Määttä, O., Praplan, A. P., Adamov, A., Amorim, A., Bianchi, F., Breitenlechner, M., David, A., Dommen, J., Donahue, N. M., Downard, A., Dunne, E., Duplissy, J., Ehrhart, S., Flagan, R. C., Franchin, A., Guida, R., Hakala, J., Hansel, A., Heinritzi, M., Henschel, H., Jokinen, T., Junninen, H., Kajos, M., Kangasluoma, J., Keskinen, H., Kupc, A., Kurtén, T., Kvashin, A. N., Laaksonen, A., Lehtipalo, K., Leiminger, M., Leppä, J., Loukonen, V., Makhmutov, V., Mathot, S., McGrath, M. J., Nieminen, T., Olenius, T., Onnela, A., Petäjä, T., Riccobono, F., Riipinen, I., Rissanen, M., Rondo, L., Ruuskanen, T., Santos, F. D., Sarnela, N., Schallhart, S., Schnitzhofer, R., Seinfeld, J. H., Simon, M., Sipilä, M., Stozhkov, Y., Stratmann, F., Tomé, A., Tröstl, J., Tsagkogeorgas, G., Vaattovaara, P., Viisanen, Y., Virtanen, A., Vrtala, A., Wagner, P. E., Weingartner, E., Wex, H., Williamson, C., Wimmer, D., Ye, P., Yli-Juuti, T., Carslaw, K. S., Kulmala, M., Curtius, J., Baltensperger, U., Worsnop, D. R., Vehkamäki, H., and Kirkby, J.: Molecular understanding of sulphuric acid-amine particle nucleation in the atmosphere, Nature, 502, 359–363, https://doi.org/10.1038/nature12663, 2013.
Baron, P. A. and Willeke, K.: Aerosol measurement: Principles, techniques, and applications, 2nd ed., Wiley, New York, xxiii, 1131, 2001.
Bell, C. L., Dhib, M., Hancock, G., Ritchie, G. A. D., van Helden, J. H., and van Leeuwen, N. J.: Cavity enhanced absorption spectroscopy measurements of pressure-induced broadening and shift coefficients in the υ 1+υ 3 combination band of ammonia, Appl. Phys. B, 94, 327–336, https://doi.org/10.1007/s00340-008-3238-5, 2009.
Benson, D. R., Markovich, A., Al-Refai, M., and Lee, S.-H.: A Chemical Ionization Mass Spectrometer for ambient measurements of Ammonia, Atmos. Meas. Tech., 3, 1075–1087, https://doi.org/10.5194/amt-3-1075-2010, 2010.
Berresheim, H., Elste, T., Plass-Dülmer, C., Eiseleb, F. L., and Tannerb, D. J.: Chemical ionization mass spectrometer for long-term measurements of atmospheric OH and H2SO4, Int. J. Mass Spectrom., 202, 91–109, https://doi.org/10.1016/S1387-3806(00)00233-5, 2000.
Bianchi, F., Dommen, J., Mathot, S., and Baltensperger, U.: On-line determination of ammonia at low pptv mixing ratios in the CLOUD chamber, Atmos. Meas. Tech., 5, 1719–1725, https://doi.org/10.5194/amt-5-1719-2012, 2012.
Bianchi, F., Tröstl, J., Junninen, H., Frege, C., Henne, S., Hoyle, C. R., Molteni, U., Herrmann, E., Adamov, A., Bukowiecki, N., Chen, X., Duplissy, J., Gysel, M., Hutterli, M., Kangasluoma, J., Kontkanen, J., Kürten, A., Manninen, H. E., Münch, S., Peräkylä, O., Petäjä, T., Rondo, L., Williamson, C., Weingartner, E., Curtius, J., Worsnop, D. R., Kulmala, M., Dommen, J., and Baltensperger, U.: New particle formation in the free troposphere: A question of chemistry and timing, Science, 352, 1109–1112, https://doi.org/10.1126/science.aad5456, 2016.
Coluccia, S., Lavagnino, S., and Marchese, L.: Adsorption and dissociation of Ammonia on the hydroxylated surface of magnesium oxide powders, J. Chem. Soc., Faraday Trans. 1, 83, 477–486, https://doi.org/10.1039/F19878300477, 1987.
Cubison, M. J. and Jimenez, J. L.: Statistical precision of the intensities retrieved from constrained fitting of overlapping peaks in high-resolution mass spectra, Atmos. Meas. Tech., 8, 2333–2345, https://doi.org/10.5194/amt-8-2333-2015, 2015.
Dias, A., Ehrhart, S., Vogel, A., Williamson, C., Almeida, J., Kirkby, J., Mathot, S., Mumford, S., and Onnela, A.: Temperature uniformity in the CERN CLOUD chamber, Atmos. Meas. Tech., 10, 5075–5088, https://doi.org/10.5194/amt-10-5075-2017, 2017.
Dunlop, P. J. and Bignell, C. M.: Prediction of the temperature dependence of binary diffusion coefficients of gaseous systems from thermal diffusion factors and diffusion coefficients at 300 K, Int. J. Thermophys., 18, 939–945, https://doi.org/10.1007/BF02575239, 1997.
Dunne, E. M., Gordon, H., Kürten, A., Almeida, J., Duplissy, J., Williamson, C., Ortega, I. K., Pringle, K. J., Adamov, A., Baltensperger, U., Barmet, P., Benduhn, F., Bianchi, F., Breitenlechner, M., Clarke, A., Curtius, J., Dommen, J., Donahue, N. M., Ehrhart, S., Flagan, R. C., Franchin, A., Guida, R., Hakala, J., Hansel, A., Heinritzi, M., Jokinen, T., Kangasluoma, J., Kirkby, J., Kulmala, M., Kupc, A., Lawler, M. J., Lehtipalo, K., Makhmutov, V., Mann, G., Mathot, S., Merikanto, J., Miettinen, P., Nenes, A., Onnela, A., Rap, A., Reddington, C. L. S., Riccobono, F., Richards, N. A. D., Rissanen, M. P., Rondo, L., Sarnela, N., Schobesberger, S., Sengupta, K., Simon, M., Sipilä, M., Smith, J. N., Stozkhov, Y., Tomé, A., Tröstl, J., Wagner, P. E., Wimmer, D., Winkler, P. M., Worsnop, D. R., and Carslaw, K. S.: Global atmospheric particle formation from CERN CLOUD measurements, Science, 354, 1119–1124, https://doi.org/10.1126/science.aaf2649, 2016.
Duplissy, J., Merikanto, J., Franchin, A., Tsagkogeorgas, G., Kangasluoma, J., Wimmer, D., Vuollekoski, H.,Schobesberger, S., Lehtipalo, K., Flagan, R. C., Brus, D., Donahue, N. M., Vehkamäki, H., Almeida, J., Amorim, A., Barmet, P., Bianchi, F., Breitenlechner, M., Dunne, E. M., Guida, R., Henschel, H., Junninen, H., Kirkby, J., Kürten, A., Kupc, A., Määttänen, A., Makhmutov, V., Mathot, S., Nieminen, T., Onnela, A., Praplan, A. P., Riccobono, F., Rondo, L., Steiner, G., Tome, A., Walther, H., Baltensperger, U., Carslaw, K. S., Dommen, J., Hansel, A., Petäjä, T., Sipilä, M., Stratmann, F., Vrtala, A., Wagner, P. E., Worsnop, D. R, Curtius, J., and Kulmala, M.: Effect of ions on sulfuric acid-water binary particle formation: 2. Experimental data and comparison with QC-normalized classical nucleation theory, J. Geophys. Res.-Atmos., 121, 1752–1775, https://doi.org/10.1002/2015JD023539, 2016.
Ehn, M., Thornton, J. A., Kleist, E., Sipilä, M., Junninen, H., Pullinen, I., Springer, M., Rubach, F., Tillmann, R., Lee, B., Lopez-Hilfiker, F., Andres, S., Acir, I.-H., Rissanen, M., Jokinen, T., Schobesberger, S., Kangasluoma, J., Kontkanen, J., Nieminen, T., Kurtén, T., Nielsen, L. B., Jørgensen, S., Kjaergaard, H. G., Canagaratna, M., Maso, M. D., Berndt, T., Petäjä, T., Wahner, A., Kerminen, V.-M., Kulmala, M., Worsnop, D. R., Wildt, J., and Mentel, T. F.: A large source of low-volatility secondary organic aerosol, Nature, 506, 476–479, https://doi.org/10.1038/nature13032, 2014.
Eisele, F. L. and Hanson, D. R.: First Measurement of Prenucleation Molecular Clusters, J. Phys. Chem. A, 104, 830–836, https://doi.org/10.1021/jp9930651, 2000.
Eisele, F. L. and Tanner, D. J.: Measurement of the gas phase concentration of H2SO4 and methane sulfonic acid and estimates of H2SO4 production and loss in the atmosphere, J. Geophys. Res.-Atmos., 98, 9001–9010, https://doi.org/10.1029/93JD00031, 1993.
Ellis, R. A., Murphy, J. G., Pattey, E., van Haarlem, R., O'Brien, J. M., and Herndon, S. C.: Characterizing a Quantum Cascade Tunable Infrared Laser Differential Absorption Spectrometer (QC-TILDAS) for measurements of atmospheric ammonia, Atmos. Meas. Tech., 3, 397–406, https://doi.org/10.5194/amt-3-397-2010, 2010.
Elm, J., Passananti, M., Kurtén, T., and Vehkamäki, H.: Diamines Can Initiate New Particle Formation in the Atmosphere, J. Phys. Chem. A, 121, 6155–6164, https://doi.org/10.1021/acs.jpca.7b05658, 2017.
Freshour, N. A., Carlson, K. K., Melka, Y. A., Hinz, S., Panta, B., and Hanson, D. R.: Amine permeation sources characterized with acid neutralization and sensitivities of an amine mass spectrometer, Atmos. Meas. Tech., 7, 3611–3621, https://doi.org/10.5194/amt-7-3611-2014, 2014.
Ge, X., Wexler, S., and Clegg, S. L.: Atmospheric amines- Part I. A review, Atmos. Environ., 45, 524–546, https://doi.org/10.1016/j.atmosenv.2010.10.012, 2011.
Good, A., Durden, D. A., and Kebarle, P.: Mechanism and Rate Constants of Ion–Molecule Reactions Leading to Formation of H + (H2O) n in Moist Oxygen and Air, J. Chem. Phys., 52, 222–229, https://doi.org/10.1063/1.1672668, 1970.
Hansel, A., Scholz, W., Mentler, B., Fischer, L., and Berndt, T.: Detection of RO2 radicals and other products from cyclohexene ozonolysis with and acetate chemical ionization mass spectrometry, Atmos. Environ., 186, 248–255, https://doi.org/10.1016/j.atmosenv.2018.04.023, 2018.
Hanson, D. R., McMurry, P. H., Jiang, J., Tanner, D., and Huey, L. G.: Ambient pressure proton transfer mass spectrometry: detection of amines and ammonia, Environ. Sci. Technol., 45, 8881–8888, https://doi.org/10.1021/es201819a, 2011.
Haruyama, T., Namise, T., Shimoshimizu, N., Uemura, S., Takatsuji, Y., Hino, M., Yamasaki, R., Kamachi, T., and Kohno, M.: Non-catalyzed one-step synthesis of ammonia from atmospheric air and water, Green Chem., 18, 4536–4541, https://doi.org/10.1039/C6GC01560C, 2016.
Heinritzi, M., Simon, M., Steiner, G., Wagner, A. C., Kürten, A., Hansel, A., and Curtius, J.: Characterization of the mass-dependent transmission efficiency of a CIMS, Atmos. Meas. Tech., 9, 1449–1460, https://doi.org/10.5194/amt-9-1449-2016, 2016.
Höpfner, M., Volkamer, R., Grabowski, U., Grutter, M., Orphal, J., Stiller, G., von Clarmann, T., and Wetzel, G.: First detection of ammonia (NH3) in the Asian summer monsoon upper troposphere, Atmos. Chem. Phys., 16, 14357–14369, https://doi.org/10.5194/acp-16-14357-2016, 2016.
Jen, C. N., Bachman, R., Zhao, J., McMurry, P. H., and Hanson, D. R.: Diamine-sulfuric acid reactions are a potent source of new particle formation, Geophys. Res. Lett., 43, 867–873, https://doi.org/10.1002/2015GL066958, 2016.
Jimenez, J. L., Canagaratna, M. R., Donahue, N. M., Prevot, A. S. H., Zhang, Q., Kroll, J. H., DeCarlo, P. F., Allan, J. D., Coe, H., Ng, N. L., Aiken, A. C., Docherty, K. S., Ulbrich, I. M., Grieshop, A. P., Robinson, A. L., Duplissy, J., Smith, J. D., Wilson, K. R., Lanz, V. A., Hueglin, C., Sun, Y. L., Tian, J., Laaksonen, A., Raatikainen, T., Rautiainen, J., Vaattovaara, P., Ehn, M., Kulmala, M., Tomlinson, J. M., Collins, D. R., Cubison, M. J., Dunlea, J., Huffman, J. A., Onasch, T. B., Alfarra, M. R., Williams, P. I., Bower, K., Kondo, Y., Schneider, J., Drewnick, F., Borrmann, S., Weimer, S., Demerjian, K., Salcedo, D., Cottrell, L., Griffin, R., Takami, A., Miyoshi, T., Hatakeyama, S., Shimono, A., Sun, J. Y., Zhang, Y. M., Dzepina, K., Kimmel, J. R., Sueper, D., Jayne, J. T., Herndon, S. C., Trimborn, A. M., Williams, L. R., Wood, E. C., Middlebrook, A. M., Kolb, C. E., Baltensperger, U., and Worsnop, D. R.: Evolution of Organic Aerosols in the Atmosphere, Science, 326, 1525–1529, https://doi.org/10.1126/science.1180353, 2009.
Jokinen, T., Sipilä, M., Junninen, H., Ehn, M., Lönn, G., Hakala, J., Petäjä, T., Mauldin III, R. L., Kulmala, M., and Worsnop, D. R.: Atmospheric sulphuric acid and neutral cluster measurements using CI-APi-TOF, Atmos. Chem. Phys., 12, 4117–4125, https://doi.org/10.5194/acp-12-4117-2012, 2012.
Jokinen, T., Sipilä, M., Kontkanen, J., Vakkari, V., Tisler, P., Duplissy, E.-M., Junninen, H., Kangasluoma, J., Manninen, H. E., Petäjä, T., Kulmala, M., Worsnop, D. R., Kirkby, J., Virkkula, A., and Kerminen, V.-M.: Ion-induced sulfuric acid–ammonia nucleation drives particle formation in coastal Antarctica, Sci. Adv., 4, eaat 9744, https://doi.org/10.1126/sciadv.aat9744, 2018.
Kebarle, P.: Higher-Order Reactions–Ion Clusters and Ion Solvation, in: Ion-Molecule Reactions: Volume 1, edited by: Franklin, J. L., Springer US, Boston, MA, 315–362, 1972.
Kirkby, J., Curtius, J., Almeida, J., Dunne, E., Duplissy, J., Ehrhart, S., Franchin, A., Gagné, S., Ickes, L., Kürten, A., Kupc, A., Metzger, A., Riccobono, F., Rondo, L., Schobesberger, S., Tsagkogeorgas, G., Wimmer, D., Amorim, A., Bianchi, F., Breitenlechner, M., David, A., Dommen, J., Downard, A., Ehn, M., Flagan, R. C., Haider, S., Hansel, A., Hauser, D., Jud, W., Junninen, H., Kreissl, F., Kvashin, A., Laaksonen, A., Lehtipalo, K., Lima, J., Lovejoy, E. R., Makhmutov, V., Mathot, S., Mikkilä, J., Minginette, P., Mogo, S., Nieminen, T., Onnela, A., Pereira, P., Petäjä, T., Schnitzhofer, R., Seinfeld, J. H., Sipilä, M., Stozhkov, Y., Stratmann, F., Tomé, A., Vanhanen, J., Viisanen, Y., Vrtala, A., Wagner, P. E., Walther, H., Weingartner, E., Wex, H., Winkler, P. M., Carslaw, K. S., Worsnop, D. R., Baltensperger, U., and Kulmala, M.: Role of sulphuric acid, ammonia and galactic cosmic rays in atmospheric aerosol nucleation, Nature, 476, 429–433, https://doi.org/10.1038/nature10343, 2011.
Kirkby, J., Duplissy, J., Sengupta, K., Frege, C., Gordon, H., Williamson, C., Heinritzi, M., Simon, M., Yan, C., Almeida, J., Tröstl, J., Nieminen, T., Ortega, I. K., Wagner, R., Adamov, A., Amorim, A., Bernhammer, A.-K., Bianchi, F., Breitenlechner, M., Brilke, S., Chen, X., Craven, J., Dias, A., Ehrhart, S., Flagan, R. C., Franchin, A., Fuchs, C., Guida, R., Hakala, J., Hoyle, C. R., Jokinen, T., Junninen, H., Kangasluoma, J., Kim, J., Krapf, M., Kürten, A., Laaksonen, A., Lehtipalo, K., Makhmutov, V., Mathot, S., Molteni, U., Onnela, A., Peräkylä, O., Piel, F., Petäjä, T., Praplan, A. P., Pringle, K., Rap, A., Richards, N. A. D., Riipinen, I., Rissanen, M. P., Rondo, L., Sarnela, N., Schobesberger, S., Scott, C. E., Seinfeld, J. H., Sipilä, M., Steiner, G., Stozhkov, Y., Stratmann, F., Tomé, A., Virtanen, A., Vogel, A. L., Wagner, A. C., Wagner, P. E., Weingartner, E., Wimmer, D., Winkler, P. M., Ye, P., Zhang, X., Hansel, A., Dommen, J., Donahue, N. M., Worsnop, D. R., Baltensperger, U., Kulmala, M., Carslaw, K. S., and Curtius, J.: Ion-induced nucleation of pure biogenic particles, Nature, 533, 521–526, https://doi.org/10.1038/nature17953, 2016.
Kupc, A., Amorim, A., Curtius, J., Danielczok, A., Duplissy, J., Ehrhart, S., Walther, H., Ickes, L., Kirkby, J., Kürten, A., Lima, J. M., Mathot, S., Minginette, P., Onnela, A., Rondo, and Rondo, L.: A fibre-optic UV system for H2SO4 production in aerosol chambers causing minimal thermal effects, J. Aerosol Sci., 42, 532–543, https://doi.org/10.1016/j.jaerosci.2011.05.001, 2011.
Kurtén, T., Loukonen, V., Vehkamäki, H., and Kulmala, M.: Amines are likely to enhance neutral and ion-induced sulfuric acid-water nucleation in the atmosphere more effectively than ammonia, Atmos. Chem. Phys., 8, 4095–4103, https://doi.org/10.5194/acp-8-4095-2008, 2008.
Kürten, A., Rondo, L., Ehrhart, S., and Curtius, J.: Performance of a corona ion source for measurement of sulfuric acid by chemical ionization mass spectrometry, Atmos. Meas. Tech., 4, 437–443, https://doi.org/10.5194/amt-4-437-2011, 2011.
Kürten, A., Rondo, L., Ehrhart, S., and Curtius, J.: Calibration of a Chemical Ionization Mass Spectrometer for the Measurement of Gaseous Sulfuric Acid, J. Phys. Chem. A, 116, 6375–6386, https://doi.org/10.1021/jp212123n, 2012.
Kürten, A., Jokinen, T., Simon, M., Sipilä, M., Sarnela, N., Junninen, H., Adamov, A., Almeida, J., Amorim, A., Bianchi, F., Breitenlechner, M., Dommen, J., Donahue, N. M., Duplissy, J., Ehrhart, S., Flagan, R. C., Franchin, A., Hakala, J., Hansel, A., Heinritzi, M., Hutterli, M., Kangasluoma, J., Kirkby, J., Laaksonen, A., Lehtipalo, K., Leiminger, M., Makhmutov, V., Mathot, S., Onnela, A., Petäjä, T., Praplan, A. P., Riccobono, F., Rissanen, M. P., Rondo, L., Schobesberger, S., Seinfeld, J. H., Steiner, G., Tomé, A., Tröstl, J., Winkler, P. M., Williamson, C., Wimmer, D., Ye, P., Baltensperger, U., Carslaw, K. S., Kulmala, M., Worsnop, D. R., and Curtius, J.: Neutral molecular cluster formation of sulfuric acid-dimethylamine observed in real time under atmospheric conditions, P. Natl. Acad. Sci. USA, 111, 15019–15024, https://doi.org/10.1073/pnas.1404853111, 2014.
Kürten, A., Bianchi, F., Almeida, J., Kupiainen-Määttä, O., Dunne, E. M., Duplissy, J., Williamson, C., Barmet, P., Breitenlechner, M., Dommen, J., Donahue, N. M., Flagan, R. C., Franchin, A., Gordon, H., Hakala, J., Hansel, A., Heinritzi, M., Ickes, L., Jokinen, T., Kangasluoma, J., Kim, J., Kirkby, J., Kupc, A., Lehtipalo, K., Leiminger, M., Makhmutov, V., Onnela, A., Ortega, I. K., Petäjä, T., Praplan, A. P., Riccobono, F., Rissanen, M. P., Rondo, L., Schnitzhofer, R., Schobesberger, S., Smith, J. N., Steiner, G., Stozhkov, Y., Tomé, A., Tröstl, J., Tsagkogeorgas, G., Wagner, P. E., Wimmer, D., Ye, P., Baltensperger, U., Carslaw, K., Kulmala, M., and Curtius, J.: Experimental particle formation rates spanning tropospheric sulfuric acid and ammonia abundances, ion production rates, and temperatures, J. Geophys. Res.-Atmos., 121, 12377–12400, https://doi.org/10.1002/2015JD023908, 2016a.
Kürten, A., Bergen, A., Heinritzi, M., Leiminger, M., Lorenz, V., Piel, F., Simon, M., Sitals, R., Wagner, A. C., and Curtius, J.: Observation of new particle formation and measurement of sulfuric acid, ammonia, amines and highly oxidized organic molecules at a rural site in central Germany, Atmos. Chem. Phys., 16, 12793–12813, https://doi.org/10.5194/acp-16-12793-2016, 2016b.
Kürten, A.: New particle formation from sulfuric acid and ammonia: nucleation and growth model based on thermodynamics derived from CLOUD measurements for a wide range of conditions, Atmos. Chem. Phys., 19, 5033–5050, https://doi.org/10.5194/acp-19-5033-2019, 2019.
Lehtipalo, K., Yan, C., Dada, L., Bianchi, F., Xiao, M., Wagner, R., Stolzenburg, D., Ahonen, L. R., Amorim, A., Baccarini, A., Bauer, P. S., Baumgartner, B., Bergen, A., Bernhammer, A.-K., Breitenlechner, M., Brilke, S., Buchholz, A., Mazon, S. B., Chen, D., Chen, X., Dias, A., Dommen, J., Draper, D. C., Duplissy, J., Ehn, M., Finkenzeller, H., Fischer, L., Frege, C., Fuchs, C., Garmash, O., Gordon, H., Hakala, J., He, X., Heikkinen, L., Heinritzi, M., Helm, J. C., Hofbauer, V., Hoyle, C. R., Jokinen, T., Kangasluoma, J., Kerminen, V.-M., Kim, C., Kirkby, J., Kontkanen, J., Kürten, A., Lawler, M. J., Mai, H., Mathot, S., Mauldin, R. L., Molteni, U., Nichman, L., Nie, W., Nieminen, T., Ojdanic, A., Onnela, A., Passananti, M., Petäjä, T., Piel, F., Pospisilova, V., Quéléver, L. L. J., Rissanen, M. P., Rose, C., Sarnela, N., Schallhart, S., Schuchmann, S., Sengupta, K., Simon, M., Sipilä, M., Tauber, C., Tomé, A., Tröstl, J., Väisänen, O., Vogel, A. L., Volkamer, R., Wagner, A. C., Wang, M., Weitz, L., Wimmer, D., Ye, P., Ylisirniö, A., Zha, Q., Carslaw, K. S., Curtius, J., Donahue, N. M., Flagan, R. C., Hansel, A., Riipinen, I., Virtanen, A., Winkler, P. M., Baltensperger, U., Kulmala, M., and Worsnop, D. R.: Multicomponent new particle formation from sulfuric acid, ammonia, and biogenic vapors, Sci. Adv., 4, eaau5363, https://doi.org/10.1126/sciadv.aau5363, 2018.
Leifer, I., Melton, C., Tratt, D. M., Buckland, K. N., Clarisse, L., Coheur, P., Frash, J., Gupta, M., Johnson, P. D., Leen, J. B., van Damme, M., Whitburn, S., and Yurganov, L.: Remote sensing and in situ measurements of methane and ammonia emissions from a megacity dairy complex: Chino, CA, Environ. Pollut., 221, 37–51, https://doi.org/10.1016/j.envpol.2016.09.083, 2017.
Martin, N. A., Ferracci, V., Cassidy, N., and Hoffnagle, J. A.: The application of a cavity ring-down spectrometer to measurements of ambient ammonia using traceable primary standard gas mixtures, Appl. Phys. B, 122, 219, https://doi.org/10.1007/s00340-016-6486-9, 2016.
Massman, W. J.: A review of the molecular diffusivities of H2O, CO2, CH4, CO, O3, SO2, NH3, N2O, NO, and NO2 in air, O2 and N2 near STP, Atmos. Environ., 32, 1111–1127, https://doi.org/10.1016/S1352-2310(97)00391-9, 1998.
Murphy, D. M. and Koop, T.: Review of the vapour pressures of ice and supercooled water for atmospheric applications, Q. J. Roy. Meteor. Soc., 131, 1539–1565, https://doi.org/10.1256/qj.04.94, 2005.
Norman, M., Hansel, A., and Wisthaler, A.: O2+ as reagent ion in the PTR-MS instrument: Detection of gas-phase ammonia, Int. J. Mass Spectrom., 265, 382–387, https://doi.org/10.1016/j.ijms.2007.06.010, 2007.
Norman, M., Spirig, C., Wolff, V., Trebs, I., Flechard, C., Wisthaler, A., Schnitzhofer, R., Hansel, A., and Neftel, A.: Intercomparison of ammonia measurement techniques at an intensively managed grassland site (Oensingen, Switzerland), Atmos. Chem. Phys., 9, 2635–2645, https://doi.org/10.5194/acp-9-2635-2009, 2009.
Nowak, J. B., Huey, L. G., Eisele, F. L., Tanner, D. J., Mauldin, R. L., Cantrell, C., Kosciuch, E., and Davis, D.: Chemical ionization mass spectrometry technique for the detection of dimethylsulfoxide and ammonia, J. Geophys. Res., 107, 4363, https://doi.org/10.1029/2001JD001058, 2002.
Nowak, J. B., Huey, L. G., Russel, A. G., Tian D., Neuman, J. A., Orsini, D., Sjostedt, S. J., Sullivan, A. P., Tanner, D. J., Weber, R. J., Nenes, A.,Edgerton, E., and Fehsenfeld, F. C.: Analysis of urban gas phase ammonia measurements from the 2002 Atlanta Aerosol Nucleation and Real-Time Characterization Experiment (ANARChE), J. Geophys. Res., 111, D17308, https://doi.org/10.1029/2006JD007113, 2006.
Nowak, J., Neuman, J., Kozai, K., G. Huey, L., Tanner, D., Holloway, J., B. Ryerson, T., Frost, G., McKeen, S., and Fehsenfeld, F.: A chemical ionization mass spectrometry technique for airborne measurements of ammonia, J. Geophys. Res., 112, D10S02, https://doi.org/10.1029/2006JD007589, 2007.
Nowak, J., Neuman, J., Bahreini, R., A. Brock, C., M. Middlebrook, A., G. Wollny, A., Holloway, J., Peischl, J., Ryerson, T. B., and Fehsenfeld, F.: Airborne observations of ammonia and ammonium nitrate formation over Houston, Texas, J. Geophys. Res., 115, D22304, https://doi.org/10.1029/2010JD014195, 2010.
Pfeifer, J., Simon, M., Kürten, A., Kirkby, J., Curtius, J., Heinritzi, M., and Bräkling, S.: Measurement of ammonia, amines and iodine compounds using protonated water cluster chemical ionization mass spectrometry (Version Published data), Zenodo, https://doi.org/10.5281/zenodo.3831469, 2020.
Pollack, I. B., Lindaas, J., Roscioli, J. R., Agnese, M., Permar, W., Hu, L., and Fischer, E. V.: Evaluation of ambient ammonia measurements from a research aircraft using a closed-path QC-TILDAS operated with active continuous passivation, Atmos. Meas. Tech., 12, 3717–3742, https://doi.org/10.5194/amt-12-3717-2019, 2019.
Pozzer, A., Tsimpidi, A. P., Karydis, V. A., de Meij, A., and Lelieveld, J.: Impact of agricultural emission reductions on fine-particulate matter and public health, Atmos. Chem. Phys., 17, 12813–12826, https://doi.org/10.5194/acp-17-12813-2017, 2017.
Roscioli, J. R., Zahniser, M. S., Nelson, D. D., Herndon, S. C., and Kolb, C. E.: New Approaches to Measuring Sticky Molecules: Improvement of Instrumental Response Times Using Active Passivation, J. Phys. Chem. A, 120, 1347–1357, https://doi.org/10.1021/acs.jpca.5b04395, 2016.
Simon, M., Heinritzi, M., Herzog, S., Leiminger, M., Bianchi, F., Praplan, A., Dommen, J., Curtius, J., and Kürten, A.: Detection of dimethylamine in the low pptv range using nitrate chemical ionization atmospheric pressure interface time-of-flight (CI-APi-TOF) mass spectrometry, Atmos. Meas. Tech., 9, 2135–2145, https://doi.org/10.5194/amt-9-2135-2016, 2016.
Sipilä, M., Sarnela, N., Jokinen, T., Junninen, H., Hakala, J., Rissanen, M. P., Praplan, A., Simon, M., Kürten, A., Bianchi, F., Dommen, J., Curtius, J., Petäjä, T., and Worsnop, D. R.: Bisulfate – cluster based atmospheric pressure chemical ionization mass spectrometer for high-sensitivity (<100 ppqV) detection of atmospheric dimethyl amine: proof-of-concept and first ambient data from boreal forest, Atmos. Meas. Tech., 8, 4001–4011, https://doi.org/10.5194/amt-8-4001-2015, 2015.
Sipilä, M., Sarnela, N., Jokinen, T., Henschel, H., Junninen, H., Kontkanen, J., Richters, S., Kangasluoma, J., Franchin, A., Peräkylä, O., Rissanen, M. P., Ehn, M., Vehkamäki, H., Kurten, T., Berndt, T., Petäjä, T., Worsnop, D., Ceburnis, D., Kerminen, V.-M., Kulmala, M., and O'Dowd, C.: Molecular-scale evidence of aerosol particle formation via sequential addition of HIO3, Nature, 537, 532–534, https://doi.org/10.1038/nature19314, 2016.
Skrotzki, J.: High-accuracy multiphase humidity measurements using TDLAS: application to the investigation of ice growth in simulated cirrus clouds, Ruperto-Carola University of Heidelberg, Heidelberg, 2012.
Stark, H., Yatavelli, R. L. N., Thompson, S. L., Kimmel, J. R., Cubison, M. J., Chhabra, P. S., Canagaratna, M. R., Jayne, J. T., Worsnop, D. R., and Jimenez, J. L.: Methods to extract molecular and bulk chemical information from series of complex mass spectra with limited mass resolution, Int. J. Mass Spectrom., 389, 26–38, https://doi.org/10.1016/j.ijms.2015.08.011, 2015.
Sunner, J., Nicol, G., and Kebarle, P.: Factors determining relative sensitivity of analytes in positive mode atmospheric pressure ionization mass spectrometry, Anal. Chem., 60, 1300–1307, https://doi.org/10.1021/ac00164a012, 1988.
Tang, M. J., Shiraiwa, M., Pöschl, U., Cox, R. A., and Kalberer, M.: Compilation and evaluation of gas phase diffusion coefficients of reactive trace gases in the atmosphere: Volume 2. Diffusivities of organic compounds, pressure-normalised mean free paths, and average Knudsen numbers for gas uptake calculations, Atmos. Chem. Phys., 15, 5585–5598, https://doi.org/10.5194/acp-15-5585-2015, 2015.
Timonen, H., Cubison, M., Aurela, M., Brus, D., Lihavainen, H., Hillamo, R., Canagaratna, M., Nekat, B., Weller, R., Worsnop, D., and Saarikoski, S.: Applications and limitations of constrained high-resolution peak fitting on low resolving power mass spectra from the ToF-ACSM, Atmos. Meas. Tech., 9, 3263–3281, https://doi.org/10.5194/amt-9-3263-2016, 2016.
Vaittinen, O., Metsälä, M., Persijn, S., Vainio, M., and Halonen, L.: Adsorption of ammonia on treated stainless steel and polymer surfaces, Appl. Phys. B, 115, 185–196, https://doi.org/10.1007/s00340-013-5590-3, 2014.
Verriele, M., Plaisance, H., Depelchin, L., Benchabane, S., Locoge, N., and Meunier, G.: Determination of 14 amines in air samples using midget impingers sampling followed by analysis with ion chromatography in tandem with mass spectrometry, J. Environ. Monitor., 14, 402–408, https://doi.org/10.1039/c2em10636a, 2012.
Viggiano, A. A., Seeley, J. V., Mundis, P. L., Williamson, J. S., and Morris, R. A.: Rate constants for the reactions of (H2O)n (X = C, HC, and N) and (H3O)n with H2SO4: implications for atmospheric detection of H2SO4, J. Chem. Phys. A, 101, 8275–8278, https://doi.org/10.1021/jp971768h, 1997.
von Bobrutzki, K., Braban, C. F., Famulari, D., Jones, S. K., Blackall, T., Smith, T. E. L., Blom, M., Coe, H., Gallagher, M., Ghalaieny, M., McGillen, M. R., Percival, C. J., Whitehead, J. D., Ellis, R., Murphy, J., Mohacsi, A., Pogany, A., Junninen, H., Rantanen, S., Sutton, M. A., and Nemitz, E.: Field inter-comparison of eleven atmospheric ammonia measurement techniques, Atmos. Meas. Tech., 3, 91–112, https://doi.org/10.5194/amt-3-91-2010, 2010.
Wang, S., Nan, J., Shi, C., Fu, Q., Gao, S., Wang, D., Cui, H., Saiz-Lopez, A., and Zhou, B.: Atmospheric ammonia and its impacts on regional air quality over the megacity of Shanghai, China, Sci. Rep.-UK, 5, 15842, https://doi.org/10.1038/srep15842, 2015.
Weissler, G. L.: Positive and Negative Point-to-Plane Corona in Pure and Impure Hydrogen, Nitrogen, and Argon, Phys. Rev., 63, 96–107, https://doi.org/10.1103/PhysRev.63.96, 1943.
Wilkinson, G. N. and Rogers, C. E.: Symbolic Description of Factorial Models for Analysis of Variance, J. R. Stat. Soc. C-Appl., 22, 392–399, https://doi.org/10.2307/2346786, 1973.
Yan, C., Dada, L., Rose, C., Jokinen, T., Nie, W., Schobesberger, S., Junninen, H., Lehtipalo, K., Sarnela, N., Makkonen, U., Garmash, O., Wang, Y., Zha, Q., Paasonen, P., Bianchi, F., Sipilä, M., Ehn, M., Petäjä, T., Kerminen, V.-M., Worsnop, D. R., and Kulmala, M.: The role of H2SO4-NH3 anion clusters in ion-induced aerosol nucleation mechanisms in the boreal forest, Atmos. Chem. Phys., 18, 13231–13243, https://doi.org/10.5194/acp-18-13231-2018, 2018.
Yao, L., Wang, M.-Y., Wang, X.-K., Liu, Y.-J., Chen, H.-F., Zheng, J., Nie, W., Ding, A.-J., Geng, F.-H., Wang, D.-F., Chen, J.-M., Worsnop, D. R., and Wang, L.: Detection of atmospheric gaseous amines and amides by a high-resolution time-of-flight chemical ionization mass spectrometer with protonated ethanol reagent ions, Atmos. Chem. Phys., 16, 14527–14543, https://doi.org/10.5194/acp-16-14527-2016, 2016.
Yokelson, R. J.: Evaluation of adsorption effects on measurements of ammonia, acetic acid, and methanol, J. Geophys. Res., 108, 4649, https://doi.org/10.1029/2003JD003549, 2003.
You, Y., Kanawade, V. P., de Gouw, J. A., Guenther, A. B., Madronich, S., Sierra-Hernández, M. R., Lawler, M., Smith, J. N., Takahama, S., Ruggeri, G., Koss, A., Olson, K., Baumann, K., Weber, R. J., Nenes, A., Guo, H., Edgerton, E. S., Porcelli, L., Brune, W. H., Goldstein, A. H., and Lee, S.-H.: Atmospheric amines and ammonia measured with a chemical ionization mass spectrometer (CIMS), Atmos. Chem. Phys., 14, 12181–12194, https://doi.org/10.5194/acp-14-12181-2014, 2014.
Yu, F., Nadykto, A. B., Herb, J., Luo, G., Nazarenko, K. M., and Uvarova, L. A.: ternary ion-mediated nucleation (TIMN): kinetic-based model and comparison with CLOUD measurements, Atmos. Chem. Phys., 18, 17451–17474, https://doi.org/10.5194/acp-18-17451-2018, 2018.
Zhao, J. and Zhang, R.: Proton transfer reaction rate constants between hydronium ion (H3O+) and volatile organic compounds, Atmos. Environ., 38, 2177–2185, https://doi.org/10.1016/j.atmosenv.2004.01.019, 2004.